COASTAL BEND MITIGATION ACTION PLANmitigationguide.org/wp-content/uploads/2013/05/TXCBCOG.pdf ·...
246
i COASTAL BEND MITIGATION ACTION PLAN Aransas County Bee County Jim Wells County Kleberg County Live Oak County Nueces County San Patricio County
-
Upload
phamkhuong -
Category
Documents
-
view
217 -
download
0
Transcript of COASTAL BEND MITIGATION ACTION PLANmitigationguide.org/wp-content/uploads/2013/05/TXCBCOG.pdf ·...

i
COASTAL BEND MITIGATION ACTION PLAN
Aransas County Bee County
Jim Wells County Kleberg County Live Oak County Nueces County
San Patricio County

ii
Executive Summary The intent of mitigation planning is to maintain a process that leads to hazard mitigation actions. Mitigation plans identify the natural hazards that impact communities, identify actions to reduce losses from those hazards, and establish a coordinated process to implement the plan. (44 CFR§201.1(b)) Representatives from communities in a seven-county area located in South Texas have coordinated efforts to develop the Coastal Bend Mitigation Action Plan. Efforts include research on how to reduce losses from future disasters, primarily hurricanes and their effects, including extreme winds, coastal surge, spawned tornadoes, heavy rain, and flooding in the South Texas area. The mitigation strategy in this plan is a continuation of ongoing efforts in communities, both large and small. As progress is made towards implementing the strategy, and achieving goals and objectives, it is also the intent to educate and encourage residents regarding mitigation activities to reduce losses before a serious event occurs. This document begins with an introduction to the concept of mitigation, a description of the planning process, and a brief description of the characteristics of the study area that pertain to the analysis. The second part includes a summary of previous significant disaster events, and a risk assessment which characterizes natural hazards by intensity, extent, probability, and hazard zone. Vulnerability, the other side of the risk equation, is characterized by exposure, (the people and property at risk), and for selected hazard scenarios, by loss estimate, prepared with a loss estimation tool, HAZUS-MH, developed by the Federal Emergency Management Agency. The third part develops a mitigation strategy, through the articulation of long-term goals and objectives, under four broad categories of 1) reducing loss of life and injury, 2) reducing disruptions to essential public services and infrastructure, 3) reducing economic impacts to residents, and 4) reducing losses to civic, cultural, and environmental resources. The third part also summarizes a range of mitigation activities – some in process, some planned for the near future, and some planned for the longer term, as funding sources become available. Appreciation is expressed to the Federal Emergency Management Agency, in particular FEMA Region 6 and the Governors Division of Emergency Management for providing a planning grant to make this project possible. Participating Jurisdictions The jurisdictions represented in this plan and their respective Hazard Mitigation Coordinators are: City of Alice, Texas: Dean Van Nest, Fire Chief, Emergency Management Coordinator City of Aransas Pass, Texas: Bill Haines, Emergency Management Coordinator Bee County, Texas, City of Beeville, Texas: David Morgan, Emergency Management, Safety, and Homeland Security Coordinator City of Bishop, Texas: Joseph Carr, Emergency Management Coordinator City of Corpus Christi, Texas: Billy Delgado, Interim Emergency Management Coordinator

iii
Aransas County, Texas, Town of Fulton, Texas, City of Rockport, Texas: Rick McLester, Emergency Management Coordinator Live Oak County, Texas, City of George West, Texas, City of Three Rivers, Texas: Gene Chapline, Emergency Management Coordinator City of Ingleside, Texas: Shanna Herzer, Assistant Emergency Management Coordinator, assisted by R. J. Thomas, Volunteer Fire Chief City of Kingsville, Texas: John Garcia, Risk Management/Emergency Management Coordinator Jim Wells County, Texas, City of Orange Grove, Texas, City of Premont, Texas: Israel Lopez, Assistant Emergency Management Coordinator City of Port Aransas, Texas: John Speights, Building Official, Floodplain Manager assisted by Pam Hatzenbuehler, Assistant Emergency Management Coordinator City of Portland, Texas: Timothy Vanlandingham, Fire Chief, Emergency Management Coordinator City of Robstown, Texas: Ricardo Gonzales, Fire Chief, Emergency Management Coordinator Kleberg County, Texas: Tomas Sanchez, Emergency Management Coordinator, Risk Manager, Safety Coordinator, Floodplain Administrator Nueces County, Texas, City of Agua Dulce, City of Driscoll: Danielle Hale, Emergency Management Coordinator San Patricio County, Texas, City of Sinton, Texas, City of Odem, Texas, City of Ingleside on the Bay, Texas, City of Mathis, Texas, City of Lakeside, Texas, City of Lake City, Texas, City of San Patricio, Texas, City of Taft, Texas, City of Gregory, Texas,: William Zagorski, Emergency Manager, Floodplain Administrator, Safety Director, 911 Director, Parks and Recreation Director

iv
TABLE OF CONTENTS PAGE Chapter 1: INTRODUCTION ..................................................................................................... 1
Section 1. The Pre-Disaster Mitigation Program ........................................................... 1 A. History………………………………………………………………………………….…. 1 B. Purpose and Scope ............................................................................................... 2
Section 2. Regional Planning Process ........................................................................... 3
A. Project Participation .............................................................................................. 3 B. Project Process ..................................................................................................... 7
Section 3. Profile of the Coastal Bend Region ............................................................ 11
A. Location and Characteristics ............................................................................... 11 B. Climate 12 C. Surface Water ..................................................................................................... 12 D. Population ........................................................................................................... 13 E. Land Use ............................................................................................................. 14 F. Economy ............................................................................................................. 15 G. Future Trends ..................................................................................................... 16
Chapter 2: RISK ASSESSMENT ............................................................................................ 21
Section 1. Introduction .................................................................................................. 21 A. Summary of Disaster Events ............................................................................... 21 B. Disaster Assistance 1991-2011 ........................................................................... 38 C. NFIP Claims History ............................................................................................ 40
Section 2. Risk Assessment ......................................................................................... 41
A. Introduction ......................................................................................................... 41 B. Hazards of Concern ............................................................................................ 43 C. Methodologies ..................................................................................................... 45 D. Risk Profiles ........................................................................................................ 49
Chapter 3: Mitigation Strategy .............................................................................................. 89
Section 1. Goals and Objectives .................................................................................. 89 A. Introduction ......................................................................................................... 89 B. Goals….. ............................................................................................................. 89
Section 2. Mitigation Actions Identification and Evaluation ....................................... 91
A. Identification Process .......................................................................................... 91 B. Evaluation/Prioritization ....................................................................................... 91 C. Mitigation Projects ............................................................................................... 92 D. Ongoing Activities ............................................................................................... 92
Section 3. Plan Implementation and Maintenance .................................................... 121
A. Implementation and Integration ......................................................................... 121 B. Plan Monitoring and Review .............................................................................. 121 C. Plan Maintenance ............................................................................................. 121

v
APPENDICES Appendix A. Inter-local Agreement Appendix B. Meetings Appendix C. Evaluation/Prioritization Worksheet Appendix D. Mitigation Project Descriptions Appendix E. Coastal Bend Council of Governments Resolution Appendix F. Mitigation Strategy Evaluation Form Appendix G. Press Releases and Public Notices Appendix H. Adoption Documentation LIST OF ILLUSTRATIONS PAGE FIGURES Figure 1: Fundamental Principles of the National Mitigation Strategy .......................................... 2 Figure 2: Normal Monthly Rainfall ............................................................................................... 9 Figure 3: Per Cent of Total Region Population .......................................................................... 10 Figure 4: Relative Area of Land Cover Type by County ............................................................. 11 Figure 5: Estimated Projected Population Growth ..................................................................... 12 Figure 6: Regional Drought History ........................................................................................... 37 Figure 7: Paid Flood Insurance Claims and Repetitive Losses .................................................. 39 Figure 8: Risk Matrix ................................................................................................................. 40 Figure 9: Saffir-Simpson Hurricane Scale ................................................................................. 47 Figure 10: Seasonal Distribution of Hurricanes/Tropical Storms ................................................ 48 Figure 11: Hurricane Wind Loss Estimation Summary .............................................................. 59 Figure 12: Fujita Tornado Scale ................................................................................................ 69 MAPS PAGE Map 1: Project Location .............................................................................................................. 4 Map 2: Study Area ...................................................................................................................... 4 Map 3: Approximate Distance Inland ........................................................................................... 9 Map 4: Natural Regions .............................................................................................................. 9 Map 5: Regional River Basins ................................................................................................... 10 Map 6: Land Use/Land Cover ................................................................................................... 11 Map 7: Park Land ...................................................................................................................... 13 Map 8: Areas Designated under CBRA ..................................................................................... 13 Map 9: Map 10: Historical Hurricane Tracks .............................................................................. 14 Map 10: USGS Stream Gauge Locations .................................................................................. 26 Map 11: Hurricane Wind Hazard Zones (MEOWs) .................................................................... 50 Map 12: User Defined Scenario, Category 2 Hurricane ............................................................. 51 Map 13: User Defined Scenario, Category 3 Hurricane ............................................................. 52 Map 14: User Defined Scenario, Category 5 Hurricane ............................................................. 53 Map 15: Historical Scenario, Hurricane Celia ............................................................................ 54 Map 16: Probabilistic Scenario, 100 year Loss .......................................................................... 55 Map 17: Probabilistic Scenario, 200 year Loss .......................................................................... 56 Map 18: Probabilistic Scenario, 500 year Loss .......................................................................... 57 Map 19: Probabilistic Scenario, 1000 year Loss ........................................................................ 58 Map 20: Hurricane Inundation Hazard Zones ............................................................................ 61

vi
Map 21: Coastal Flood, 100 year flood event ............................................................................ 63 Map 22: Coastal Flood, 500 year flood event ............................................................................ 64 Map 23: Average Coastal Erosion Rates .................................................................................. 65 Map 24: Coastal Texas 2020 Region IV Map of Critical Areas .................................................. 67 Map 25: Reported Tornadoes, 1950 - 2011 ............................................................................... 70 Map 26: Mobile Homes and RV’s as a percent of total housing units ....................................... 70 Map 27: Flood Hazard Zones .................................................................................................... 72 Map 28: Wildfire Hazard Zones ................................................................................................. 78 Map 29: Designated Catastrophe Areas, Texas Department of Insurance ................................ 85

COASTAL BEND MITIGATION ACTION PLAN 1
Chapter 1: INTRODUCTION Section 1. The Pre-Disaster Mitigation Program A. History The U.S. Department of Homeland Security (DHS) Federal Emergency Management Agency (FEMA) Hazard Mitigation Assistance (HMA) programs present a critical opportunity to reduce the risk to individuals and property from natural hazards while simultaneously reducing reliance on Federal disaster funds. The Hazard Mitigation Grant Program (HMGP) is authorized by Section 404 of the Robert T. Stafford Disaster Relief and Emergency Assistance Act, as amended (the Stafford Act), Title 42, United States Code (U.S.C.) 5170c. The key purpose of HMGP is to ensure that the opportunity to take critical mitigation measures to reduce the risk of loss of life and property from future disasters is not lost during the reconstruction process following a disaster. HMGP is available, when authorized under a Presidential major disaster declaration, in the areas of the State requested by the Governor. The amount of HMGP funding available to the Applicant is based upon the estimated total Federal assistance to be provided by FEMA for disaster recovery under the Presidential major disaster declaration. The Pre-Disaster Mitigation (PDM) program is authorized by Section 203 of the Stafford Act, 42 U.S.C. 5133. The PDM program is designed to assist States, Territories, Indian Tribal governments, and local communities to implement a sustained pre-disaster natural hazard mitigation program to reduce overall risk to the population and structures from future hazard events, while also reducing reliance on Federal funding from future disasters.
State, Indian Tribal, and local governments are required to develop a hazard mitigation plan as a condition for receiving certain types of non-emergency disaster assistance, including funding for mitigation projects. The Robert T. Stafford Disaster Relief and Emergency Assistance Act (Public Law 93-288), as amended by the Disaster Mitigation Act of 2000, provides the legal basis for State, local, and Indian Tribal governments to undertake a risk-based approach to reducing risks from natural hazards through mitigation planning.
The intent of mitigation planning, therefore, is to maintain a process that leads to hazard mitigation actions. Mitigation plans identify the natural hazards that impact communities, identify actions to reduce losses from those hazards, and establish a coordinated process to implement the plan. (44 CFR §201.1(b)) In May of 2002, the City of Corpus Christi submitted an application for a mitigation planning grant on behalf of itself, Kleberg, Nueces, and San Patricio counties. The grant was subsequently awarded and the planning process began. Effective July 2003, Aransas, Bee, Jim Wells, and Live Oak Counties were added to the project. The initial version of the plan was prepared and received final FEMA approval during October 2006. The original plan was developed within the framework of an Interlocal Agreement between the participating jurisdictions. The agreement only covered the initial plan development and submission. To provide for continuing Technical Assistance, a resolution was adopted by the Coastal Bend Council of Governments (COG). A copy of the resolution is included as Appendix E. During 2009, the COG applied for, and was awarded a grant for the purpose of

COASTAL BEND MITIGATION ACTION PLAN 2
updating the plan, which is required every five years. This Coastal Bend Mitigation Action Plan (CBMAP), is an update of the original plan. Although this document is the culmination of the formal planning process, it marks neither the beginning nor the end of local mitigation efforts.
Fundamental Principles of the National Mitigation Strategy
1. Risk reduction measures ensure long-term economic success for the community as a whole rather than short-term benefits for special interests.
2. Risk reduction measures for one natural hazard must be compatible with risk reduction measures for other natural hazards.
3. Risk reduction measures must be evaluated to achieve the best mix for a given location.
4. Risk reduction measures for natural hazards must be compatible with risk reduction measures for technological hazards and vice versa.
5. All mitigation is local.
6. Disaster costs and the impacts of natural hazards can be reduced by emphasizing pro- active mitigation before emergency response; both pre-disaster (preventive) and post- disaster (corrective) mitigation is needed.
7. Hazard identification and risk assessment are the cornerstones of mitigation.
8. Building new Federal-State-Local partnerships and public-private partnerships is the most effective means of implementing measures to reduce the impacts of natural hazards.
9. Those who knowingly choose to assume greater risk must accept responsibility for that choice.
10. Risk reduction measures for natural hazards must be compatible with the protection of natural and cultural resources.
Figure 1: Fundamental Principles of the National Mitigation Strategy B. Purpose and Scope First it is necessary to define what is meant by mitigation in the context of emergency Management: Mitigation means sustained action taken to reduce or eliminate long-term risk to people and property from hazards and their effects. Mitigation distinguishes actions that have a long-term impact from those that are more closely associated with preparedness for, immediate response to, and short-term recovery from a specific event. The main purpose to the planning project is to reduce future losses in the Coastal Bend region of Texas by identifying mitigation strategies based on an analysis of risk, including both an assessment of regional hazards and vulnerability. The mitigation strategies seek to identify potential loss-reduction opportunities; however, implementation of the strategies will be constrained to some extent by the future availability of funding in the context of other community priorities. It is unrealistic to expect that all future losses are able to be eliminated

COASTAL BEND MITIGATION ACTION PLAN 3
entirely. It is realistic to strive over coming decades to build more disaster-resistant and resilient communities in the Coastal Bend, as part of an overall “sustainable development” approach. The scope of the hazards considered herein are those associated with natural hazards. Acts of terrorism or other hazards resulting from man-made causes are not directly addressed. Other planning frameworks exist in the region for the hazards not addressed here, including security concerns, critical infrastructure protection, hazardous materials response, medical and public health response to terrorism. Agencies and organizations who may be contacted for further information on these topics include local emergency management agencies, Local Emergency Planning Committees (LEPCs), law enforcement agencies and fire departments, state and public health departments, the Port of Corpus Christi and Port Industries of Corpus Christi, local drinking water suppliers, local offices of the Texas Commission on Environmental Quality and the U.S. Coast Guard, the Metropolitan Planning Organization, and the Coastal Bend Council of Governments. Section 2. Regional Planning Process A. Project Participation
As an initial step, letters were mailed to the Chief Elected Official of each municipality within the original tri-county area, inviting formal participation in the planning project. The next step was to formalize the relationship between the participants; therefore, an Inter-local Agreement was developed under the applicable provisions of the Texas State law. Under this agreement, each jurisdiction executed a Notice of Participation and appointed a Hazard Mitigation Coordinator (HMC). The Agreement was later extended to the four additional counties and their municipalities. A complete copy of the Agreement and copies of participation Notices are provided in Appendix A. B. Project Process
The roles and responsibilities of the participating jurisdiction and HMCs are enumerated in the Interlocal Agreement. In general, each HMC provided project briefings to appropriate individuals in their own jurisdiction, and collected input for the hazard mitigation strategy, either from a formally-designated jurisdiction level Hazard Mitigation Team, an informal equivalent, or from appropriate individuals within the jurisdiction. The following summarizes project participation by each jurisdiction.

COASTAL BEND MITIGATION ACTION PLAN 4

COASTAL BEND MITIGATION ACTION PLAN 5
City of Alice: The City of Alice has a population of 19,104. The jurisdiction appointed the City’s Emergency Management Coordinator, who is also the City’s Fire Chief, as the HMC. The HMC met with local officials and staff to update the mitigation activities listed in the first edition of the CBMAP, and also to discuss and collect data to include in the updated plan. The Alice HMC coordinated with the Jim Wells County HMC to discuss and evaluate issues with flooding and drainage. Aransas County, Town of Fulton, City of Rockport: These three jurisdictions opted to appoint the same HMC for all three jurisdictions, an individual who is experienced with administering hazard mitigation projects and is well acquainted with local hazard areas. The total population for all three jurisdictions is less than 33,500 and county-wide coordination is preferred, particularly in the areas of public warning and efforts to improve drainage. The HMC met with local officials and staff from each jurisdiction to update mitigation activities listed in the first edition of the CBMAP, and collect data for development of new projects. City of Aransas Pass: The City of Aransas Pass chose to participate in the development of the updated CBMAP and incorporate the jurisdiction’s mitigation activities in the plan. The population of the City of Aransas Pass is 8,204. The city appointed the Emergency Management Coordinator as the HMC. The HMC met with local officials, and city staff to discuss hazard mitigation activities, and collect data needed to include these activities in the CBMAP. The HMC also met with contractors for input on cost for equipment use for projects. Bee County, City of Beeville: The two jurisdictions appointed their Emergency Management, Safety, and Homeland Security Coordinator as the HMC. The population of Bee County is under 32,000. The City of Beeville has a population of 12,863 and is the only incorporated municipality within the county. The HMC met individually with local elected officials and staff to provide project briefing and collect input. City of Bishop, Texas: The City of Bishop is located approximately 38 miles northwest of the City of Corpus Christi. Total population for Bishop is 3,134. The Emergency Management Coordinator is the designated HMC. The HMC met with local officials to discuss hazard mitigation projects. Recommendations were incorporated into the CBMAP. City of Corpus Christi, Texas: The City of Corpus Christi is the largest metropolitan area represented in the CBMAP. The population is 305,215. The Emergency Management Coordinator is the designated HMC. The HMC met with individuals from city departments and compiled data for projects to include in the updated CBMAP. City of Ingleside, Texas: The City of Ingleside is located on the south-east tip of San Patricio County, situated on the Corpus Christi Bay. The population is 9,387. The designated HMC is the assistant Emergency Management Coordinator. The HMC was assisted by the Chief of the Ingleside Volunteer Fire Department. The HMC and the assistant met with local officials and city staff to receive input for hazard mitigation projects. Jim Wells County, Texas, City of Orange Grove, Texas, City of Premont, Texas: These jurisdictions chose to appoint the same HMC. Population for Jim Wells County is 40, 838. Population for the City of Orange Grove is 1,318 and City of Premont is 2,653. The HMC met with officials and staff. Projects listed in the current CBMAP were reviewed. Input on current projects and projects for the revised plan were provided.

COASTAL BEND MITIGATION ACTION PLAN 6
City of Kingsville, Texas: The HMC for Kingsville is the Risk Management/Emergency Management Coordinator. The City of Kingsville has a population of 26,213. The HMC met with city officials and city staff to review projects listed in the current CBMAP. New projects were also discussed and information compiled for the updated plan. Kleberg County, Texas: Kleberg County appointed the Emergency Management Coordinator as the HMC. The HMC serves the position of Risk Manager, Safety Coordinator, and Floodplain Administrator. Kleberg County has a population of 32,061. The HMC met with local officials and individuals familiar with areas in the rural county area which are in need of hazard mitigation projects. Live Oak County, Texas, City of George West, Texas, City of Three Rivers, Texas: The HMC for the three jurisdictions is the Live Oak County Emergency Management Coordinator. Population for Live Oak County is 11,531, George West is 2,445, and Three Rivers is 1,848. The HMC met with local officials from all jurisdictions. Projects listed in the current plan were reviewed. Information for new projects was compiled and submitted for the updated plan. Nueces County, Texas City of Agua Dulce, City of Driscoll: The Emergency Management Coordinator is the designated HMC. The population of Nueces County is 340,223. The HMC reviewed the projects listed in the first edition of the CBMAP and met with county staff to discuss and collect input for implementation of other projects in the updated CBMAP. City of Port Aransas, Texas: The designated HMC is the cities Building Official and Floodplain Manager. The HMC met with local officials and city staff for input and data listed in the CBMAP. City of Portland, Texas: The City of Portland has a population of 15,099. The appointed HMC is the Cities’ Fire Chief who also serves as the Emergency Management Coordinator. The HMC met with local officials and city staff for input and data listed in the CBMAP. City of Robstown, Texas: Population for the City of Robstown is 11,487. The designated HMC for the City is Fire Chief who also serves as the Emergency Management Coordinator. The HMC met with local officials, city staff, and local residents for input on hazard mitigation projects. San Patricio County, Texas, City of Sinton, Texas, City of Odem, Texas, City of Ingleside on the Bay, Texas, City of Mathis, Texas, City of Lakeside, Texas, City of Lake City, Texas, City of San Patricio, Texas, City of Taft, Texas, City of Gregory, Texas: The population for San Patricio County is 64,804. The designated HMC for these jurisdictions and the rural area of San Patricio County is the County’s Emergency Manager. The HMC also serves as Floodplain Administrator, Safety Director, 911 Director, and Parks and Recreation Director for the County. The HMC met with local officials and staff. Input was collected and projects to be incorporated in the updated plan were submitted to the CBCOG.

COASTAL BEND MITIGATION ACTION PLAN 7
(1) WEB SITE
Due to the large geographical area of the project, a website has been established to provide convenient access the CBMAP. The website is located at: http://www.cbcog98.org/cbmap/CBMAPFROMWEB.htm Other hazard mitigation information may also be found at the website. (2) PROJECT MEETINGS
Area stakeholders were invited to attend the initial meeting held February 25, 2010 held at the Coastal Bend Council of Governments. The COG staff provided a summary of the purpose and status of the first edition of the CBMAP. The planning process for the updated edition was discussed. Information provided included: project schedule, project cost share requirements, goals and objectives. Meetings were held to provide updates, and technical assistance from the COG staff. A list of meetings held is provided in Appendix B.
Hazard Mitigation Coordinators (HMC) held individual meetings in their jurisdictions. The HMCs met with local elected officials, county/city staff, and individuals who assisted the HMC with the following:
Review/approval of proposed methodology for the risk assessment
Participation in collection of critical facilities/infrastructure data
Development of hazard mitigation goals and objectives
Collection and submissions of comprehensive range of potential mitigation activities
Development of activities evaluation criteria
Development of mitigation prioritization criteria
Final review and approval of the risk assessment and hazard mitigation strategy
(3) PUBLIC INPUT
Members of the public at large had an opportunity to review and comment on the draft of the updated plan. Each HMC requested public input from their jurisdiction. HMCs forwarded all public input to the Coastal Bend Council of Governments. This information was then posted on the CBMAP website.
(4) PLAN DEVELOPMENT
Development and coordination for the updated plan was conducted by the Coastal Bend Council of Governments (CBCOG) Emergency Management /Homeland Security staff. Documents reviewed and unitized in this updated plan included those listed below. Additional data sources are noted throughout this plan.
Federal Emergency Management Agency. 1997. Multi Hazard Identification and Risk Assessment: A Cornerstone of the National Mitigation Strategy.
Federal Emergency Management Agency. Flood insurance Studies and Flood Insurance Rate Maps for all participating jurisdictions.
Governor’s Division of Emergency Management. September 2011. State of Texas Hazards Analysis.

COASTAL BEND MITIGATION ACTION PLAN 8
Governor’s Division of Emergency Management/Texas A&M University Hazard Reduction and Recovery Center. 2002. Costal Bend Area Hurricane Evacuation Study.
U.S. Army Corps of Engineers. Dec. 2002. Nueces River Basin Reconnaissance Study.
U.S. Bureau of Reclamation. August 1999. Choke Canyon Dam and Reservoir Emergency Action Plan.
City of Corpus Christi. November 1998. Breach Analysis Report: Wesley Seale Dam.
Section 3. Profile of the Coastal Bend Region A. Location and Characteristics Aransas, San Patricio, Nueces, and Kleberg Counties are located directly adjacent to the Gulf of Mexico on the lower Texas coast, and lie within a distance of approximately 50 miles inland. The three other participating counties, Bee, Live Oak, and Jim Wells, lie roughly within the area between 50 to 100 miles from the coast. All seven counties comprise approximately 5400 square miles.
The principal urban area within the region is the City of Corpus Christi bordering on the Gulf of Mexico, Corpus Christi and Nueces Bays. The nearest other large cities are San Antonio, approximately 150 miles to the northwest, and Brownsville, approximately 150 miles to the south. Almost all of Aransas, San Patricio, and Nueces counties, and significant portions of Kleberg and Jim Wells counties lie within the natural area of Texas(2) designated as the Gulf Coast Prairies and Marshes. The region is a nearly level, slowly drained plain less than 150 feet in elevation, dissected by streams and rivers flowing into the Gulf of Mexico. A distinguishing feature of the study area is the presence of steep bluffs along area bays.
Map 3: Approximate Distance Inland

COASTAL BEND MITIGATION ACTION PLAN 9
The Prairie and Marsh region is comprised of the three sub-regions: - the dune and barrier islands, including Padre Island, Mustang Island, and St. Joseph Island; - the coastal bays and estuaries, including Aransas, Copano, Corpus Christi, Nueces, Alazan, and Baffin Bays, the Laguna Madre and the Cayo del Grullo; and - the upland prairies and woods, a mixture of woodlands developing along alluvial valleys, and prairies on coarse sandy soils. All of Bee and Live Oak counties, and portions of Jim Wells county lies within the area designated as the South Texas Brush Country where the topography is level to rolling. Thorny brush is the predominant vegetation type in the region, including mesquite, acacia, prickly pear, and mimosa, among others. Map 4: Natural Regions The southeastern portion of Kleberg County lies within the Coastal Sand Plain where the topography is fairly level. Surf and windblown sands and dunes characterize this region's soils. B. Climate The Coastal Bend counties are located in the subtropical humid region of Texas and are characterized by mild winters and hot summers; humidity is high year-round. Annual rainfall extremes range from under 6 inches to over 48 inches, and multi-year droughts are not uncommon. The average wind direction is from the southeast and strong winds frequently occur due to convergence of high pressure over the Gulf of Mexico with generally lower pressure in West Texas. Specific weather hazards are discussed further in the Risk Assessment section of this document.
30 Year Normal Precipitation by Month - Corpus Christi, TX
6.00
5.00
4.00
3.00
2.00
1.00 Jan Feb Mar Apr May Jun Jul Aug Sep Oct Nov Dec
Figure 2: Normal Monthly Rainfall

COASTAL BEND MITIGATION ACTION PLAN 10
Live Oak 11,531
Aransas 23,158
Kleberg 32,061
Bee 31,861
Jim Wells 40,838
San Patricio 64,804
Nueces 340,223
TOTAL: 544,476
C. Surface Water
In addition to the coastal water features, the study area is divided roughly in thirds by three natural river basins, the Nueces-Rio Grande in the southern third, the Nueces in the central third, and the San Antonio-Nueces in the northern third. Two major reservoirs – Choke Canyon and Lake Corpus Christi – are located in the Nueces Basin. When full, the Lake Corpus Christi level is 94' above sea level and stores 241,241 acre-feet of water. The bottom of the reservoir is 55' above sea level. It has a surface area of 19,251 acres. When full, the Choke Canyon Reservoir level is 220.5' above sea level and stores 695,271 acre-feet of water. The bottom of the reservoir is 132' above sea level. It has a surface area of 25,989 acres.
Map 5: Regional River Basins D. Population
Total population of the participating counties is based on Census 2010 data.
Figure 3: Per Cent of Total Region Population The largest city in the region is Corpus Christi with 305,215 people, or 56.1% of the total regional population. The city of Kingsville located in Kleberg County is the second largest.
2% 4% 6%
6%
8%
12% 62%
Live Oak
Aransas
Kleberg
Bee
Jim Wells
San Patricio
Nueces

COASTAL BEND MITIGATION ACTION PLAN 11
E. Land Use
Gulf
Map 6: Land Use/Land Cover
Figure 4: Relative Area of Land Cover Type by County

COASTAL BEND MITIGATION ACTION PLAN 12
Map 6 provides a snapshot of land use/land cover for the entire study region during the early 1990's based on satellite imagery. Although it does not reflect growth in developed areas since that time, it is included here to provide a general understanding of the relatively small area of development in the seven-county region, and to highlight the relatively large area of agricultural-related land use. Figure 4 gives the relative breakdown by county. (Note: Open water and wetlands are understated in the graph, due to the land boundaries used to define the counties.) Since the early 1990's, development within the region has added density within the previously developed areas, with additional growth on the perimeters, such as the south side of Corpus Christi, North Padre Island, Ingleside and the Rockport/Fulton area. F. Economy
Significant economic sectors in the region include agriculture/fishing, oil/gas extraction, chemical manufacturing, gasoline refining, transportation, tourism, education, health care, construction and fabrication, and the military. More than two thirds of the regional economy is centered in Nueces County, primarily in the City of Corpus Christi.
G. Future Trends (1) POPULATION TRENDS
The Texas Population Projections and Estimates Program in the Texas State Data Center and The Office of the State Demographer published revised estimated population projections during June, 2004. Four migration scenarios were used to calculate growth by county through the year 2040. The scenario recommended for long-term planning purposes assumed a migration rate of one-half of the actual 1990-2000 rate. Using the recommended scenario, the seven-county total population is projected to reach 752,000 by the year 2040, an overall 45% increase over the 2000 census (+233,184). Ranking the counties by per cent of growth in order from fastest to slowest growing: San Patricio (+57,801 - 86.1%), Kleberg (+15,078 - 47.8%), Nueces (+137,136 - 43.7%), Jim Wells (+9,989 - 25.4%), Aransas (+4,889 - 21.7%), Bee (+6,740 - 20.8%), and Live Oak (+1,551 - 12.6%).
800,000
700,000
600,000
500,000
400,000
300,000
200,000
100,000
0
2000 2005 2010 2015 2020 2025 2030 2035 2040
Live Oak
Aransas
Kleberg
Bee
Jim Wells
San Patricio
Nueces

COASTAL BEND MITIGATION ACTION PLAN 13
Figure 5: Estimated Projected Population Growth (2) DEVELOPMENT TRENDS
It is anticipated that additional development will occur on the barrier islands of Mustang and Padre Islands in the years ahead, areas among the most vulnerable in the study region to the effects of tropical storms and hurricanes. Land available for development is limited by existing local, state and federal parks (Map 7). In addition, designated areas in the Coastal Barriers Resource System, under the provisions of the Coastal Barrier Resources Act, P.L. 97-348, are ineligible for direct or indirect Federal financial assistance that might support development, including flood insurance (Map 8).
Map 7: Park Land Map 8: Areas Designated under CBRA

COASTAL BEND MITIGATION ACTION PLAN 14
Chapter 2: RISK ASSESSMENT Section 1. Introduction A. Summary of Disaster Events
(1) DISASTER HISTORY Over the past forty years, there have been 19 presidentially declared disasters involving one or more jurisdictions from the region. Approximately half of these resulted from hurricanes or tropical storms, while the remainders were for severe storms and flooding. Only one was directly related to a tornado. However, the damages associated with major hurricanes during the past 100 years far exceed any other single cause. Beyond major disasters, losses and disruptions are associated with more frequently occurring episodes of riverine and urban flooding. Agricultural disaster declarations have also been made for excessive rain, drought, and hail.
Map 9: Historical Hurricane Tracks
South Texas Ice Storm February 3-4, 2011
South Texas experienced frigid temperatures and prolonged hard freezes between Tuesday morning February 1st and Saturday morning February 5th, 2011. A large dome of arctic air plunged southward across South Texas on Tuesday morning February 1st behind a strong cold front. Temperatures plummeted from the 60s and 70s early Tuesday morning into the upper 20s

COASTAL BEND MITIGATION ACTION PLAN 15
to lowers 30s by Tuesday evening. Arctic High Pressure continued to push further south across South Texas between Wednesday February 2nd and Friday February 4th. As a result, widespread record low temperatures occurred between Feb 2 and Feb 5. Most areas averaged between the middle 20s to middle 30s during this entire period. The duration of freezing temperatures for this event was quite remarkable.
These very cold temperatures set the stage for one of the more significant ice storms to affect South Texas in recent history. A strong upper level disturbance approached South Texas on Thursday February 3rd. This disturbance along with increasing Gulf moisture above the cold arctic air helped to produce freezing drizzle by early Thursday evening. Since the air at the surface was below freezing, the drizzle instantly froze upon contact. Trees, roads, grassy surfaces, vehicles and rooftops quickly became ice-covered. Freezing drizzle and light freezing rain then continued through all of Thursday night before ending Friday morning. A brief mix of sleet and snow did occur at times during this event across the Brush Country and northern Coastal Bend. However, little to no sleet or snow accumulation was observed during this event. Ice accumulations on the other hand were significant across much of South Texas. Generally 1/4" to 3/8" of ice accumulations occurred across the Coastal Bend and eastern Brush Country with up to 1/10" ice accumulation across the remainder of South Texas. This amount of ice produced very dangerous driving conditions. As a result, state and local officials closed many of the main roads, highways and bridges across South Texas. Numerous accidents along with multiple injuries were reported. Falling ice from bridges and high-tension wires still posed a continuing threat throughout the day on Friday.
Regional response included: 166 Texas Department of Transportation Employees 125 Additional Law Enforcement Officers 1,005 Cubic yards of ice rock laid 377 Bridges/overpasses treated 90 Vehicles accidents in the first 3 hours. (Normally 100 in 24 hours)

COASTAL BEND MITIGATION ACTION PLAN 16
Coastal Bend Rain Event September 17-21, 2010
On Friday September 17th, 2010 at noon, Hurricane Karl made landfall over central Mexico near Veracruz nearly 600 miles south of Corpus Christi Texas. However, well to the north of Karl, a very moist tropical air mass resided and became the focus for a significant multi-day rainfall event. This rain event resulted in record flooding on Oso Creek in Corpus Christi, one flash flood fatality, and the flooding of numerous streets, homes, and vehicles along the immediate Texas coastline.
Showers and thunderstorms developed over the South Texas region Friday and Saturday, with rainfall amounts ranging between 1 and 4 inches. However on Sunday September 19th, a low pressure trough developed along the mid Texas coast and interacted with an upper level disturbance which focused the heaviest rainfall over Corpus Christi, Sinton, and Rockport. The heaviest rains occurred between 900 AM and 300 PM Sunday in which up to 7 inches of rain was recorded. These heavy rains caused widespread street flooding and road closures in Aransas, San Patricio, Nueces, and Kleberg Counties. Many homes in Corpus Christi were flooded, especially in the neighborhoods near the intersection of Holly and Greenwood. On Monday September 20th, the 4th day of this event, another 1 to 2 inches of rainfall were recorded bringing storm totals up to nearly a foot.
Runoff from these heavy rains flowed into Oso Creek, which runs along the southwest edge of Corpus Christi. The only gauging site on Oso Creek, located on FM 763 about 2 miles west of town, recorded a rapid rise up to 28 feet on Sunday, before it stopped working. A post storm survey conducted by the National Weather Service and United States Geological Survey

COASTAL BEND MITIGATION ACTION PLAN 17
confirmed the creek crested at 30.62 feet around 805 AM Monday morning which beat the previous record of 29.37 feet set back on August 10th, 1980 during Hurricane Allen.
Tropical Depression Hermine September 6, 2010
Tropical Depression Hermine was a unique storm in that it formed as a result of the remnants of Tropical Depression number eleven in the Pacific crossing into the Southwest Gulf of Mexico on Sunday September 5, 2010. Hermine quickly gained strength becoming a strong tropical storm with winds of 60 mph in just 15 hours, and made landfall in northeast Mexico exactly 24 hours after it formed on Monday evening, September 6. The tropical storm then turned northward and moved quickly across south Texas into the Texas Hill Country on Tuesday September 7, bringing torrential rainfall, damaging winds and high tides.
The corridor of strongest winds spanned an area along the South Texas coast from near Brownsville to San Antonio. Wind gusts between 50 and 70 mph were reported along the track. Damage was confined primarily to trees, signs, and metal buildings. Hardest hit areas were the cities of Bishop and Orange Grove where the eye wall tracked directly overhead. The storm knocked out power to approximately 20,000 customers in the Coastal Bend.
The heaviest rains fell across the northeast Coastal Bend near Victoria and Seadrift where 4 to 8 inches were reported. Approximately 2 to 3 inches fell across the central Coastal Bend generally east of Highway 281.
Land Location Peak Wind (mph)
Marine Location Peak Wind (mph)
Kingsville NAS 63 Mustang Oil Platform 68
Corpus Christi Intl Airport 55 Port Aransas 60
Alice 54 Baffin Bay 55
Orange Grove 54 South Bird Island 55
Rockport 52 Port OConnor 55
Robstown 52 Bob Hall Pier 54
Corpus Christi NAS 52 Buoy 42020 49
Beeville 49 Rockport NOS 48
Waldron Field 47 Seadrift 47
Cabinass Field 47 Nueces Delta Watershed 46
Matagorda Island RAWS 47
Ingleside 46
Victoria 45
George West RAWS 45
Aransas National Wildlife Refuge RAWS
44
Port Lavaca 38
Victoria RAWS 36
McMullen Target Range 30

COASTAL BEND MITIGATION ACTION PLAN 18
Although a few tornado warnings were issued based on radar signatures, there were no confirmed tornadoes.
The strong winds and high surf caused tide levels to peak around 3.5 feet mean sea level along the barrier islands and near 3 feet mean sea level over the inland bays. This was about 2 feet above normal. The higher than normal tides resulted in minor flooding of area beaches, beach access roads and low areas around the inland bays.
Storm Total Rainfall for Hermine
Location Inches Location Inches
Austwell 6 SSE 7.51 Refugio 5 N 3.94
Victoria 4 ENE 7.34 4 WNW CC NAS 3.88
Victoria 2 W 7.30 Aransas Pass 2 NW 3.74
Bloomington 2 NNW 7.21 Orange Grove 8 WNW 3.53
Victoria 1 E 6.92 Rockport 3.52
Telferner 3 N 6.84 San Diego 1 SW 3.50
Victoria 4 NNW 6.80 Flour Bluff 4 WNW 3.39
Austwell 6.74 Sandia 2 NNE 3.38
Placedo 4 N 6.71 Corpus Christi 6 E 3.38
Victoria Airport 6.68 Ricardo 2 ENE 3.30
Fannin 6 ESE 6.56 Corpus Christi NAS 3.24
Seadrift 3 NNW 6.25 Kingsville 1 E 3.24
Victoria 2 NNW 6.21 Corpus Christi 3 NE 3.18
Seadrift 4 ENE 6.08 Corpus Christi 7 ESE 3.11
Rockport 1 N 6.07 Corpus Christi 5 ESE 3.07
Nursery 5 W 6.00 Ben Bolt 5 NNW 3.06
Victoria 2 S 5.99 Kingsville 3 NNW 3.04
Fulton 2 W 5.98 Flour Bluff 2 WNW 2.97
Fannin 6 WNW 5.98 7 W CC NAS 2.89
Telferner 4 S 5.88 George West 2 S 2.69
Fannin 3 ENE 5.75 Odem 3 ESE 2.68
Schroeder 1 NE 5.57 Normanna 6 S 2.60
Goliad 5.51 Ricardo 5 E 2.58
Victoria 3 NW 5.50 Beeville 7 ESE 2.48
Rockport 2 S 5.36 Portland 1 NW 2.39
Fulton 2 WNW 5.21 George West 3 NNW 2.35
Port Lavaca 2 WSW 4.93 Corus Christi Intl Airport 2.35
Weesatche 5 NNE 4.84 Corpus Christi 1 NNW 2.29
Goliad 4 NW 4.82 Flour Bluff 1 N 2.26
Port Aransas 1 ENE 4.64 Robstown 1 SSW 2.21
Weesatche 1 ENE 4.52 Flour Bluff 14 S 2.10
Flour Bluff 5 ESE 4.46 Three Rivers 8 NNE 2.08
Port Aransas 3 SSE 4.46 Bishop 2 NW 1.98
Flour Bluff 5 ESE 4.45 Loma Alta 5 N 1.80

COASTAL BEND MITIGATION ACTION PLAN 19
Goliad 1 WSW 4.43 Calliham 3 NW 1.76
Goliad 2 SE 4.28 Three Rivers 5 W 1.26
Orange Grove 3 NNW 4.15 Cross 1.21
St. Paul 3 S 4.00 Cotulla 0.98
Rainfall Totals from 700 PM CDT 9/5/10 through 700 AM CDT 9/8/10
2010 FEMA-DR-1931 Hurricane Alex June 30
Alex made its final landfall at 9pm, Wednesday June 30th, along the northern Mexican coast around 110 miles south of Brownsville as a Category 2 storm with maximum sustained winds of 105 mph. Alex was the first Hurricane in June for the Altantic Basin since 1995, and the strongest in the month of June since Hurricane Alma in 1966. Alex was a very large hurricane with tropical storm force winds extending over 200 miles from the center. Although Alex passed over 200 miles south of Corpus Christi, tropical storm force wind gusts were measured as far north as Port O'Connor, George West, and Cotulla. The strongest winds were observed on the barrier island from Port Aransas to Baffin Bay where peak wind gusts exceeded 60 mph.
Overall, the impacts to the Middle Texas coast were minimal. Storm tides peaked just below 4 feet mean sea level at tide stations along the coast producing flooding along area beaches. About a half dozen tornadoes occurred within the outer rain bands from Alex. These tornadoes caused mostly minor tree damage. Radar indicated the possibility of several more tornadoes, however NWS survey teams were unable to locate any additional damage. Heavy rainfall and flooding proved to be the biggest impact. Rainfall totals of 3 to 6 inches with isolated amounts near 10 inches were observed across South Texas. This resulted in flooding of many roads and farm fields from Alice to Sinton.
Rainfall Location
Inches Wind Location Peak Wind (mph)
Orange Grove 9.79 Baffin Bay 64
Sea Drift 8.61 Port Aransas 61
Bishop 8.28 S Bird Island 56
Alice Airport 8.19 Packery Ch 56
Odem 7.43 Bob Hall Pier 54
Concepcion 7.34 Corpus Naval 52
Encinal 6.83 Cotulla 49
Ingleside 6.76 Port O'Connor 48
Woodsboro 6.73 Rockport 46
Rockport 6.64 Cabinass Filed 46
Port Lavaca 6.54 Corpus Christi 44
Corpus Christi Arpt 6.22 Nueces Bay 42
Calallen 6.09 Laredo 39
Bloomington 6.05 Alice 37
Rainfall Totals from June 29 through July 2 morning and the Peak Wind Gusts during Alex
Tornadoes South Texas June 2, 2010
During the late evening on June 2nd 2010, 4 separate tornadoes developed along a severe squall line that was rapidly moving through South Texas and the adjacent waters. These tornadoes

COASTAL BEND MITIGATION ACTION PLAN 20
tracked through Bee, San Patricio, Refugio, Aransas and Nueces counties. An EF-2 rating was given to the tornado that tracked through Aransas County, just west of Rockport. An EF-1 rating was given to the tornado that tracked through extreme southern Bee and northwestern San Patricio counties, southeast of Tynan. An EF-0 rating was given to the other two short track tornadoes that affected areas just north of Chapman Ranch in Nueces county and just southeast of Woodsboro in Refugio County.
2010 FEMA-FM-2803 Holiday Beach Fire April 5, 2010 April 5-7, 2010
FEMA 2803-FM-TX was approved April 5 for the Holiday Beach Fire in Aransas County, TX. This fire encompasses 70 acres of private land, with zero percent containment. The fire is threatening 100 homes and other buildings, infrastructure, utilities and businesses causing an economic threat. Four homes and six other buildings have been lost in the fire. Fifty people have been evacuated. (FEMA HQ)
2010 FEMA-FM-2801 Lagarto Fire April 5, 2010 April 2-5, 2010
FMAG-2801-TX was requested and issued April 3, 2009 for the Lagarto Fire, near Lagarto, Live Oak County, TX. The 175 acre fire was caused by a down power line. There were 22 homes and 10 vehicles destroyed with an additional 22 homes damaged. There were six residents and one fire fighter injured. (FEMA HQ)
2008 FEMA-EM-3294 HURRICANE IKE September 10
All CBMAP Counties were included in Category B. Ike approached Texas as a very large hurricane with tropical storm force winds spanning a distance of 425 miles in diameter from northwest to southeast across the storm. Ike was actually larger in size than hurricane Katrina which was 380 miles in diameter. Hurricane Ike made landfall as a Category 2 hurricane with maximum sustained winds of 110 mph. Hurricane force wind gusts spread well inland across southeast Texas.
2008-FEMA-DR-1791 SEPTEMBER 13
The Coastal counties of Aransas, Kenedy, Kleberg, Nueces, and San Patricio were included in the Public Assistance Category A – G. Ike approached Texas as a very large hurricane with tropical storm force winds spanning a distance of 425 miles in diameter from northwest to southeast across the storm. Ike was actually larger in size than hurricane Katrina which was 380 miles in diameter. Hurricane Ike made landfall as a Category 2 hurricane with maximum sustained winds of 110 mph. Hurricane force wind gusts spread well inland across southeast Texas.
This funding is used only for necessary expenses related to disaster relief, long-term recovery, and restoration of infrastructure, housing, and economic revitalization in the areas affected by the consequences of natural disasters that occurred in 2008. Damage assessment reports provided by FEMA indicate that there was widespread unmet need in primarily non-housing activities. To date the total for Nueces County alone is $925,597.62.

COASTAL BEND MITIGATION ACTION PLAN 21
The anticipated accomplishments will include repairs and improvements to public infrastructure; assistance with reversing the negative economic impact caused by the disasters; and long term recovery and restoration in the affected areas.
2008 FEMA-DR-1780 Hurricane Dolly July 24
Although the center of Dolly passed well to our south, her slow forward motion before landfall caused water levels to rise along the Mid Texas Coast. A storm surge of 2-3 feet MLLW was observed along the mid Coast and total storm tides approached 4 feet MLLW on North Padre Island shortly after the time of landfall Wednesday Evening. It is also interesting to note that total storm tides peaked at 3-3.5 Ft above MLLW in the back Bays including Nueces Bay and Lavaca Bay. At the time of this writing surge data was not available for Baffin Bay
Tornadoes are common in Hurricanes and are generated in two areas: the eye wall region, and in the northeast quadrant of the hurricane, up to 250 miles northeast of the center. The National Weather Service in Corpus Christi issued 6 tornado warnings on the day of landfall. Warnings were issued for San Patricio, Nueces, Kleberg and Jim Wells Counties. Isolated tornadoes occurred in the northeast quadrant including one waterspout and three tornadoes. Only minor damage was observed. The tornadoes were all rated EF-0. A Tornado Watch was posted from Tuesday Evening through Thursday Evening as strong wind shear, with helicity values, in excess of 200 m2/s2, persisted.
Dolly's slow movement produced torrential rainfall over the mid coast region and Rio Grande Plains. Rainfall totals of 1-2″ were observed over northern portions of the region from Victoria to Laredo. Totals of 3-6″ were observed generally south of a line from Rockport to Zapata. These heavy rains resulted in flooding of rural low lying roadways including FM 70 near Chapman Ranch in southern Nueces County, FM 628 and 1118 in Kleberg County. Minor street flooding was observed in Jim Wells and Duval Counties. The city of Laredo also experienced street flooding as the center of the circulation passed over the city. The heavy rains will have a negative impact on the farmer's ability to harvest the cotton crop. However the rains did end a severe drought which plagued the south Texas region for much of this year.
Bentonville Tornado August 27, 2007
A weak mid level trough of low pressure was situated over South Central Texas on Monday August 27, 2007 with a surface ridge to the east. Deep tropical moisture with perceptible water values in excess of 2.00 inches was already in position over the Coastal Bend. Daytime heating, enhanced by forcing from the mid level trough and difluence aloft, resulted in scattered showers and thunderstorms over the Texas Coastal Plains on August 27. Showers developed along the coast during the morning hours, and moved slowly northwest through midday. These showers moved over the Corpus Christi International Airport and produced 0.80 inches of precipitation.
At 1656Z (1156 am CDT), radar indicated a narrow band of precipitation from just east of Kingsville to Agua Dulce. The storm cell on the northern end of this line produced the tornado as it crossed the Nueces and Jim Wells county line. Radar indicated a developing thunderstorm at this location with very weak rotation at the 3.3 and 4.2 elevation scans (8 to 10,000 feet above the ground).
The tornado briefly touched down on the property of a local homeowner along County Road 336, located 2.5 miles south of Bentonville, causing damage to trees, a storage shed, and a

COASTAL BEND MITIGATION ACTION PLAN 22
trampoline. The tornado crossed the roadway and flattened the stalks of a grain field that was already cut. Sheet metal from a storage shed was blown in a westerly direction about 100 yards into the field. Based on the damage to grain field and photos of the tornado from a local photographer, the tornado was estimated to be 25 yards wide, and was on the ground for approximately 100 yards.
FEMA-EM-3277 Hurricane Dean August 18, 2007
On 20 August Dean moved away from Jamaica over the deep warm waters of the northwestern Caribbean. The convective structure that day was dominated by a single eyewall, and under light shear Dean began to strengthen as it approached the Yucatan Peninsula. As the eyewall contracted, Dean regained Category 5 status near 0000 UTC 21 August, and was still deepening when the center made landfall near the town of Majahual in the Costa Maya tourist region of the Yucatan near 0830 UTC that day. At the time of landfall, Dean is estimated to have had a minimum central pressure of 905 mb and maximum sustained winds of 150 kt, making it the first land-falling Category 5 hurricane in the Atlantic basin since Andrew of 1992.
Dean weakened as it moved across the Yucatan Peninsula, emerging into the Bay of
Campeche around 1900 UTC. Although Dean maintained hurricane strength throughout its 10-h passage over land, its inner core convective structure was largely disrupted. Aircraft reconnaissance data in the Bay of Campeche showed that the cyclone’s radius of maximum wind had expanded to roughly 55 n mi, and Dean was only able to recapture a small fraction of its former strength. Deep-layer high pressure along the northern coast of the Gulf of Mexico kept Dean on its west-northwestward track until 1200 UTC 22 August, when the cyclone turned to the west. Dean made landfall at 1630 UTC that day near the town of Tecolutla, Mexico, about 90 n mi northeast of Veracruz, as a Category 2 hurricane with winds of 85 kt.
Dean weakened rapidly after landfall, becoming a depression by 0000 UTC 23 August, and dissipating over the mountains of central Mexico shortly thereafter.
Emergency Protective Measures are actions taken by local jurisdictions before landfall to save lives, protect public health and safety, and prevent damage to improved public and private property.
2006 FEMA-DR-1624 Texas Extreme Wildfire Threat January 11, 2006 November 27, 2005 – May 14, 2006
On January 11, 2006 the President declared a major disaster for Texas (FEMA-1624-DR-TX) for Severe Wildfire Threat for the period December 1, 2005, and continuing.
Designations and types of assistance:
Public Assistance: All 254 counties in the State of Texas for Category B emergency protective measures implemented on or after December 27, 2005. Emergency protective measures will include eligible costs as determined by FEMA to be resulting from wildfires that pose a significant threat to life and property in any county, or portion thereof, to be designated by FEMA, in consultation with the State, for as long as such areas are threatened by an urgent danger of such wildfires. This assistance will be provided at 75 percent Federal funding.
Additional designations may be made at a later date after further evaluation. ( FEMA HQ)

COASTAL BEND MITIGATION ACTION PLAN 23
Acres burned and response cost by county during this period.
County Acres Response Cost Aransas County 42 $3,789 Bee County 652 $5,935 Jim Wells County 52 $721 Kleberg County 386 $1,809 Live Oak County 3,862 $354,654 Nueces County 404 $6,117 San Patricio County 763 $23,988 Totals 6,161 $397,013 (TFS Fire Reporting Tool)
2005 FEMA-EM-3261 Hurricane Rita September 21, 2005
Hurricane Rita was the seventeenth name tropical storm, ninth hurricane, fifth major hurricane, and second Category 5 hurricane of the 2005 Atlantic hurricane season. Hurricane Rita was one of the strongest storms to impact the coast of the United States during the last 100 years. While over open water, it was rated as being the strongest to enter the Gulf of Mexico. The National Oceanic and Atmospheric Administration (NOAA) reported Rita’s record-setting Category 5 strength as a result of achieving a minimum central pressure of 897 millibars (mb) (26.49 inches of mercury) on the afternoon of September 21, 2005. This record strength steadily diminished prior to landfall after Rita moved over cooler waters in the northern Gulf of Mexico. Hurricane Rita made landfall at 2:38 am local time on September 24, 2005, between Sabine Pass, Texas and Johnson’s Bayou, Louisiana. At landfall, the storm was Category 3 with sustained winds of 120 mph and barometric pressure of 937 mb. Emergency Protective Measures are actions taken by local jurisdictions before landfall to save lives, protect public health and safety, and prevent damage to improved public and private property. Mandatory evacuation was ordered in all coastal counties.
2005 FEMA-EM-3216 Hurricane Katrina August 29, 2005
Katrina made its second landfall at 1110 UTC (6:10 a.m. CDT) on Monday, August 29 as a Category 3 hurricane with sustained winds of 125 mph (205 km/h) near Buras-Triumph Louisiana. At landfall, hurricane-force winds extended outward 120 miles (190 km) from the center and the storm's central pressure was 920 mbar (27 inHg). After moving over southeastern Louisiana and Breton Sound, it made its third landfall near the Louisiana/Mississippi border with 120 mph (195 km/h) sustained winds, still at Category 3 intensity. Katrina maintained strength well into Mississippi, finally losing hurricane strength more than 150 miles (240 km) inland near Meridian Mississippi. It was downgraded to a tropical depression near Clarksville Tennessee, but its remnants were last distinguishable in the eastern Great Lakes region on August 31, when it was absorbed by a frontal boundary. The resulting extra tropical storm moved rapidly to the northeast and affected eastern Canada.
Emergency Protective Measures are actions taken by local jurisdictions before landfall to save lives, protect public health and safety, and prevent damage to improved public and private property.
Our area did receive over 1,600 evacuees after landfall. About 1,200 were sheltered, by local governments and NGOs, in four locations, Corpus Christi, Portland, Port Aransas and Kingsville.
Hurricane Emily__July 20 2005_______________________________

COASTAL BEND MITIGATION ACTION PLAN 24
Emily made landfall during peak high tide. Water levels rose to 2.0 to 2.5 feet above normal resulting in storm tides of 3.5 feet mean sea level along the barrier island from Bob Hall Pier southward. These higher than normal tides caused flooding of area beaches and beach access roads up to several feet deep. The Padre Island National Sea Shore closed down the beach several days before Emily made landfall. Beaches farther north eventually closed as well as the strong surf flooded beach access roads. Some vehicles were stranded in water several feet deep.
On the day of landfall, showers and thunderstorms, in the outer rain bands, became more intense and fanned a region from deep south Texas northward to the mid coast region. Strong low level wind shear combined with an increasingly unstable air mass resulted in an outbreak of tornadoes across the western Coastal Bend and Rio Grande Plains.
Five tornadoes were confirmed to have touchdown with several other unconfirmed tornadoes reported throughout the day. The strongest tornado, rated F1 (winds 73 to 112 mph) on the Fujita Scale, demolished a mobile home and tore the roof off a residence in north central Jim Wells County near the community of Tecolote. Trees were stripped of their limbs or uprooted along a 12 mile path from this tornado as it crossed into northern Duval County. Another tornado touched down in southern Jim Wells County near the town of Premont. This tornado ripped the roof off one home and damaged trees and electrical poles along a seven mile path into southern Duval County. The storm that produced this tornado eventually produced another tornado near the town of Bruni in southern Webb County about an hour later. In all, five tornadoes were confirmed. Fortunately, there were no injuries or fatalities.
Christmas Snow Storm December 24, 2004
Total snowfall accumulations of 4 inches or more occurred over many areas of South Texas during this period.
Officially, 4.4 inches of snow were reported at the Corpus Christi International Airport. This broke the previous 24-hour snowfall record of 4.3 inches set back on February 14, 1895. The 1895 record still stands as the record daily snowfall amount since this recent event started on the 24th

COASTAL BEND MITIGATION ACTION PLAN 25
(2.3 inches) and ended on the 25th (2.1 inches). This was the second white Christmas ever recorded in Corpus Christi. The other white Christmas occurred back in 1918 when 0.1 inch was reported.
2003 - FEMA-1479-DR: Aransas, Bee, Live Oak, San Patricio Counties: Hurricane Claudette July 15, 2003 Hurricane Claudette made landfall as a high Category 1 hurricane to the north of the study area near Port O’Connor, Texas on July 15, 2003. The storm then moved quickly westward across Calhoun, southern Victoria, and Goliad counties through the afternoon and early evening hours, limiting rainfall totals. The highest storm-total rainfall was 6.5 inches four miles south-southeast of Tilden, Texas, and there were other reports of 3-6 inch amounts along the storm track. Those communities who experienced the eye of the storm were impacted by hurricane force winds for up to 6 hours, with Claudette maintaining tropical storm status for 24 hours. Two tornadoes were reported during Claudette. One was an F1 that damaged several buildings in Palacios. The other touched down in Port Lavaca, causing damage to some homes. One direct death resulted from the storm when a 13-year old boy was crushed by a falling tree in Jourdanton, a city located inland from Live Oak County. The American Insurance Services Group reported that Claudette caused $90 million in damage to insured property in the United States. The total damage estimate was twice that amount, or $180 million. Eighteen counties were declared federal disaster areas, and state and federal disaster assistance in these counties totaled $34.8 million by October 30, 2003. This storm vividly demonstrated that areas far inland are vulnerable to tropical cyclone winds associated with even a Category 1 hurricane event. 2002 - FEMA-1439-DR: Aransas, Jim Wells, Kleberg, Nueces, and San Patricio Counties: Severe Storms, Tornadoes and Floods, October 24 - November 15, 2002. 2002 was an active year with an unprecedented total of three Presidential Major Disaster Declarations. On October 24, 2002, in an extremely rare event for South Texas, three tornadoes were formed by the same severe storm cell, two of which struck populated areas of Corpus Christi. The first formed in an unpopulated area, was rated an F0 on the Fujita Scale, and was estimated at less than 50 yards wide. The second tornado, rated an F2, struck the Del Mar College West Campus, where the most extensive damage occurred. This second tornado had a path length of 2.5 miles, and was 100 to 200 yards wide. The third tornado developed just as the second was dissipating and increased to F2 intensity on the Fujita Scale in the vicinity of the H.E.B. grocery store and the U.S. Post Office. This third tornado had a path length of 5 miles, and was the widest, with a measured path width of 400 yards. One death, an instructor at the Del Mar Campus, and injuries to at least 26 persons, resulted directly from the tornadoes. Initial damage estimates were a minimum of $75 million. At least 60 businesses were immediately impacted, with 15 incurring major damage. At least 77 single family homes and 36 multi-family units suffered major damage or complete destruction. A major disaster was declared by the President for Nueces County on November 5, Aransas and San Patricio counties were added on November 8, Jim Wells County was added November 20,

COASTAL BEND MITIGATION ACTION PLAN 26
and Kleberg County on November 26. A total of 18 Texas counties were ultimately included in this declaration, and by December 20, 2003, $32 million in state and federal disaster assistance had been approved. This was the third period of wet weather and flooding for the year (see below); however, this disaster demonstrated that populated areas in the Coastal Bend are not immune from tornadoes, and that even F2 tornadoes can cause significant losses.
Map 10: USGS Stream Gauge Locations
FEMA-1434-DR: Jim Wells, Live Oak, Nueces and San Patricio Counties: Tropical Storm Fay - September 6-30, 2002 While Fay was only a moderate tropical storm, a combination of the long duration of tropical storm force winds and isolated tornadoes resulted in significant damage for the Upper Texas Coast. After moving inland and dissipating as a tropical cyclone, the remnant low generated widespread showers and thunderstorms which produced torrential rainfall and widespread flooding. Storm rainfall totals for the period September 6-10 reached 6-9 inches within the study area, and 9-12 inches in the western portions of the Nueces River Watershed. On September 26, a major disaster was declared for Live Oak, Nueces and San Patricio counties, and Jim Wells County was added on October 4, for flooding of areas which had previously been hard hit during June-July.

COASTAL BEND MITIGATION ACTION PLAN 27
Key
Stream
Location
Flood Stage
Crest Stage
Crest Date
AR1 Aransas near Skidmore
13 ft 18.50 ft 9/16/2002
AT1 Atascosa at Whitsett
20 ft 30.26 ft 9/11/2002
NU1 Nueces at Bluntzer
18 ft 32.22 ft 9/16/2002
NU2 Nueces at Calallen
7 ft 12.97 ft 9/15/2002
NU5 Nueces near Mathis
25 ft 39.03 ft 9/16/2002
NU6 Nueces near Three Rivers 25 ft 44.44 ft 9/12/2002
FEMA-1425-DR: Bee, Jim Wells, Live Oak, Nueces and San Patricio Counties: Severe Storms, Floods, June 29-July 31, 2002 A slow-moving tropical wave moved west across the northern Gulf of Mexico and into south Texas during the week of June 30th to July 7th, carrying an abundance of tropical moisture. The tropical wave moved inland over central Texas and became a stationary low pressure system, remaining for a week and bringing disastrous flooding to parts of the Texas Hill Country and South Texas. Total rainfall amounts of 25 to 35 inches were reported across the Texas Hill Country with 10 to 15 inch amounts noted over the Coastal Bend. On July 14-16, another heavy rainfall event occurred, and the Guadalupe River, San Antonio River, Atascosa River, Frio River, and Nueces River all reached major flood levels. Statewide, the floods caused at least nine deaths and damage to about 48,000 homes. Nearly 250 flood rescue calls were reported, more than 130 roads were closed, and thousands of homes and businesses lost electrical power and telephone service. Ultimately, 39 counties would be included in the major disaster declaration. By August 19, state and federal disaster assistance had reached $65.5 million.
Key
Stream
Location
Flood Stage
Crest Stage
Crest Date
AR1 Aransas near Skidmore 13 ft 18.26 ft 07/16/2002
AT1 Atascosa at Whitsett 20 ft 28.23 ft 07/03/2002
NU1 Nueces at Bluntzer 18 ft 31.78 ft 07/17/2002
NU2 Nueces at Calallen 7 ft 12.24 ft 07/18/2002
NU5 Nueces near Mathis 25 ft 38.12 ft 07/17/2002
NU6 Nueces near Three Rivers 25 ft 43.19 ft 07/17/2002
OS1 Oso Creek at Corpus Christi 20 ft 25.55 ft 07/17/2002
SF1 S. Fernando near Alice 12 ft 14.35 ft 07/05/2002
2001 - Bee and Jim Wells Counties, South Texas Floods of 2001, August 28-September 5, 2001

COASTAL BEND MITIGATION ACTION PLAN 28
During the week of August 28 through September 5, 2001, South Texas experienced a significant rainfall event in which 10 to 20 inches of rain fell across the area, providing much needed rainfall, but causing widespread flooding. This rainfall event took place during the peak of hurricane season. Abundant tropical moisture from the remains of tropical storm Chantal moved up the western Gulf of Mexico into South Texas. The moisture collided with a stationary upper level low pressure system, which allowed for the formation of showers and thunderstorms for several days. The heavy rains caused significant flooding of area streams, creeks and rivers in the Coastal Bend, cutting off many roads, some major highways and stranding families in their homes. The hardest hit area in South Texas was just east of Skidmore in Bee County. Unofficial rainfall reports ranged from 17 inches to 22.5 inches during a 6 day period between August 27th and September 1st. Total damage estimates for the Skidmore area was over 2 million dollars. Several livestock were lost, but no persons lost their lives. Most of the damage in Jim Wells County occurred in the creek bed of Lattas Creek, in the Rancho Alegre area, on the southwest side of Alice. Doppler radar estimates, on Thursday, August 30th and Friday, August 31st ranged from 6 to 10 inches. Red Cross officials reported that at least 29 homes received major damage during the flood event and 50 suffered minor damage. This event did not receive a major disaster declaration, although Small Business Administration low cost loans were made available.
Key
Stream
Location
Flood Stage
Crest Stage
Crest Date
AR1 Aransas near Skidmore 13 ft 21.10 ft 08/31/2001
SF1 S. Fernando near Alice 12 ft 14.68 ft 08/31/2001
1999 - FEMA-1287-DR: Aransas, Jim Wells, Kleberg, Nueces, and San Patricio Counties: Hurricane Bret - August 22, 1999 Bret was a small hurricane that made landfall along a sparsely-populated section of the South Texas coast, over Kenedy County south of the study area. It had weakened to a Category 3 hurricane with 100 knot winds by the time of landfall. After moving inland, Bret's movement became more westward with a slow forward speed. Bret continued to weaken as it moved across South Texas and into the high terrain of north central Mexico where it dissipated on the 25th. Aransas Pass, north of the area of peak rainfall, reported a storm total of 12.60 inches. The Aransas River near Skidmore and Oso Creek crested slightly above flood stage, causing local flooding in these respective areas. In Aransas County, a tornado reportedly destroyed a recreational vehicle, along with a barn and a shed, and uprooted trees. Other reports indicate that a tornado touched down in Kingsville, and a tornado was reported in Alice, time unknown. Little damage was reported with the latter two. Property insurance damage claims total $30 million was reported by the Property Claims Services Division of the Insurance Services Office. Multiplying by a factor of 2.0 gives an estimated damage total of $60 million. A major disaster was declared August 22, ultimately including 13 South Texas counties.

COASTAL BEND MITIGATION ACTION PLAN 29
As many as 12 new channel cuts were revealed by aerial photography and visible satellite images where the center of Bret crossed Padre Island National Seashore. Existing sand dunes were reduced in height by half and new dunes formed from the strong winds and rise of water. Several weak tornadoes were reported across Nueces and Kleberg counties, but little additional damage occurred. 1998 - FEMA-1257-DR: Jim Wells, Nueces and San Patricio Counties: October Floods, October 17 – November 15, 1998 Severe flooding in parts of South Central Texas resulted from a major storm during October 17-18, 1998, centered to the north of the study area. The meteorological conditions that produced the storm rainfall were dominated by Hurricane Madeline in the Eastern Pacific near the tip of Baja California, and Hurricane Lester in the Eastern Pacific near Acapulco, Mexico. The hurricanes, coupled with an atmospheric trough of low pressure over the western United States, forced a very deep layer of air with high water-vapor content across Mexico and into Texas. According to the Texas Department of Public Safety, 31 people drowned statewide during the floods, and total property damage was estimated to be about $750 million. A major disaster was declared on October 21, and 43 counties were ultimately included. At least $188 million in disaster assistance was provided.
Key
Stream
Location
Flood Stage
Crest Stage
Crest Date
AR1 Aransas near Skidmore 13 ft 20.23 ft 10/19/1998
AT1 Atascosa at Whitsett 20 ft 16.92 ft 10/21/1998
NU5 Nueces near Mathis 25 ft 24.56 ft 10/19/1998
OS1 Oso Creek at Corpus Christi 20 ft 25.22 ft 10/19/1998
1991 - FEMA-930-DR: Aransas County: Flood - December 26, 1991 Also known as the “Christmas Floods,” an infusion of moisture from the North Pacific and the Gulf of Mexico during December 18-23 translated into some of the heaviest rains ever witnessed in wintertime in Texas. An unusually intense El Nino sent a succession of storms, which produced historic flooding in much of South Central and Southeast Texas. Aransas County was on the extreme southern end of the disaster area. A major disaster was declared on December 26, 1991, and ultimately 64 counties were included. Statewide, 12 deaths and 79 injuries were attributed to the storms, and over $30 million in state and federal disaster assistance provided. In Aransas County, $186,298 was provided under the Public Assistance program, and $67,265 under the Individual and Family Grant program. 1984 - FEMA-727-DR: Nueces and San Patricio Counties: Flood - October 30, 1984 A cool front moved slowly through the Coastal Plains on Friday, October 19, 1984 and set off heavy thunderstorms and record rainfalls. The front became stationary just north of Corpus Christ and spawned massive thunderstorms over San Patricio County. Most of the rainfall was localized and intensive for a 6-hour period during the evening. One observer in Odem received 24.0 inches and another observer a block and a half down the street received 25.5 inches during the same time 4-hour time period. Major flooding occurred in Odem where U.S. Highway 77 and

COASTAL BEND MITIGATION ACTION PLAN 30
the Missouri Pacific railroad acted as a levee to impede the runoff from Peter’s Swale. The Swale was overtopped and overland sheetflow flooded rural areas and parts of Sinton. A major disaster was declared on October 30, 1984 and was later amended to include Harris County and Precinct One of Nueces County. One person was killed and several persons injured. Rising water and high winds destroyed 6 mobile homes and damaged 45 more. Major damage was incurred by 284 homes. Statewide, federal and state assistance totaled approximately $4 million. 1980 - FEMA-627-DR: Aransas, Jim Wells, Kleberg, Nueces, and San Patricio Counties: Hurricane Allen - August 11, 1980 Hurricane Allen made landfall as a Category 3 hurricane near Port Mansfield on August 10, 1980. Ten to fifteen inch rains produced widespread flooding, the most critical being in the Kingsville area. At the Corpus Christi Airport, the highest sustained wind was 55 mph and the highest wind gust 92 mph, both occurring on August 10. Peak wind gusts at Port Aransas and Aransas Pass were between 105 and 110 mph. Storm surges reached 12 feet at Port Mansfield, and between 7 and 9 feet in the Coastal Bend. The Naval Air Station in Corpus Christi estimated a surge of 9 feet. A total of 34 tornadoes were known to have touched down across South Texas. Tornadoes reported to the National Weather Service in Corpus Christi included the communities of Norias in Kenedy County, Orangedale in Bee County, Mathis in San Patricio County, and Port Aransas, Corpus Christi and Bishop in Nueces County. A major disaster was declared on August 11, 1980 for 12 counties of South Texas. Statewide, seven died; two were reported dead in Corpus Christi, having decided to ride the storm out at North Beach. Damages were estimated at $1 billion. 1979 - #603-DR: Aransas, San Patricio County: Flood, September 18-20, 1979 As a chilly continental air mass pushed through Texas, the leading edge stalled in the western Gulf, and on September 19 a very intense surface storm formed on the front and pushed northward across the upper Texas coast. This system brought rainfall measuring from 8 inches in the western sections of the counties, to 11 inches in the coastal sections. Federal assistance provided over $200,000 to Aransas Pass and Ingleside for disaster recovery under the Presidential Disaster Declaration. 1971 - #313-DR: Aransas, Bee, Jim Wells, Live Oak, Nueces, and San Patricio Counties: Hurricane Fern, September 10-11, 1971 The track of Hurricane Fern was most unusual in that it abruptly changed direction by 90 degrees three times or more during its life. Downgraded to a tropical storm before landfall, Fern drifted slowly onto the coast between Matagorda and Freeport on the morning of September 10, 1971. During the night of September 10-11, Fern passed over Corpus Christi, and then turned to the west-southwest. Because of its nearly stationary position, torrential rains fell over the same areas for a period of three days. Accumulations ranging from 15-26 inches were reported in Bee and San Patricio counties, and 10-15 inches over Aransas County. Five tornadoes were reported in connection with Fern. Most of the damage resulted from destructive floods, with major flooding on the lower Nueces, Frio, and Aransas Rivers. Total losses were estimated at over $30 million. 1970 - #292-DR: Aransas, Bee, Jim Wells, Live Oak, Nueces, and San Patricio Counties: Hurricane Celia - August 3, 1970 Hurricane Celia made a direct hit on the Coastal Bend region as a Category 3 hurricane during the afternoon of August 3, 1970 passing between Corpus Christi and Aransas Pass, with sustained winds of 130 mph and unusually high peak gusts of up to 180 mph. Hurricane Celia moved west-northwest across southern Texas with the storm center passing near Mathis, and by

COASTAL BEND MITIGATION ACTION PLAN 31
9:00 P.M., with the storm center over the southwest portion of Live Oak County, sustained winds had dropped below hurricane force, although peak gusts were estimated at 100 mph at George West. The highest tides generated by Hurricane Celia were 9.2 feet at Port Aransas Beach. Hurricane Celia did not produce torrential rains and massive flooding; the intense destruction was the result of the storm’s extreme winds. Major damage in Corpus Christi was spread throughout the city. In Aransas Pass, about one-half of the structures in the city suffered severe damage. All structures at Port Aransas suffered damage, 55 percent of which was severe. The final estimate of damage was placed at $453 million. In terms of today's dollars, the estimate would be closer to $1.83 billion. Total crop damage in the Coastal Bend was estimated at $60 million. Celia killed 9 people and caused 466 injuries. 1969 - San Patricio County: Flood - February 13-14, 1969 Hurricane-force winds, 11 inch rains and high seas, the worst since Hurricane Carla, battered the middle and upper Texas coast. Torrential rains of more than 11 inches in the Odem-Edroy areas, and up to 6 inches in other parts of San Patricio County caused major flooding in Odem on the morning of February 14, 1969, and along Chiltipin Creek at Sinton through the afternoon and night. Flood water entered an estimated 75 homes in Odem and 300 homes in Sinton. Water rose to 3 feet in hangars at the Sinton airport. The Small Business Administration declared San Patricio County a disaster area. Damage was estimated at $500,000. 1968 - #246-DR: Aransas, San Patricio County - Flood, May 7-13, 1968 Heavy rain from 11 to 12 inches across much of San Patricio County produced widespread flooding. A high intensity rain of 6 inches in 45 minutes fell at Papalote, producing heavy runoff in the Aransas River. Eight to nine inches of rain was recorded at Portland and extensive street flooding was common throughout the area. Federal assistance provided over $200,000 to Aransas Pass and Ingleside for disaster recovery under the Presidential Disaster Declaration. 1967 - #232-DR: Aransas, Bee, Jim Wells, Kleberg, Live Oak, Nueces, and San Patricio Counties: Hurricane Beulah - September 20, 1967 Although Hurricane Beulah struck the extreme lower Texas Coast near the mouth of the Rio Grande on September 20, 1967, the remaining storm was very persistent moving northward, carrying hurricane winds to south of Alice, and stalling there before it moving off to the west-southwest. It produced massive flooding, setting stream gauge records which stand to this day, far exceeding any levels experienced in recent years. The cities of Three Rivers, Odem, and Sinton were severely flooded. Tornadoes were extremely numerous with Beulah, with indications of approximately 40 in the Coastal Bend region. The Fulton Tornado of Sept. 20 destroyed or badly damaged 20 to 25 buildings and caused three minor injuries. Damage from winds and tides was heavy on North Beach and in the Aransas Pass and Rockport-Fulton areas. The damage directly attributable to the storm in the Coastal Bend, not counting the subsequent flooding, was of the order of $20 million. The total dollar damage from the floods was estimated at more than $100 million. The cities of Three Rivers and Sinton were severely flooded. There were no fatalities in the Coastal Bend area.

COASTAL BEND MITIGATION ACTION PLAN 32
Key
Stream
Location
Flood Stage
Crest Stage
Crest Date
AT1 Atascosa at Whitsett 20 ft 41.40 ft 09/23/1967
NU2 Nueces at Calallen 7 ft 16.00 ft 09/24/1967
NU5 Nueces near Mathis 25 ft 48.70 ft 09/24/1967
NU6 Nueces near Three Rivers 25 ft 49.21 ft 09/23/1967
SF1 S. Fernando near Alice 12 ft 15.86 ft 09/23/1967
1961 - #118-DR: Aransas, Nueces, and San Patricio Counties: Hurricane Carla - September 11, 1961 Hurricane Carla is among the storms ranked seventh on a scale of most intense hurricanes to strike the United States, along with the Galveston hurricane of 1900. This Category 4 hurricane struck north of the study area near Port Lavaca on September 11, 1961. The eye of the storm came within 65 miles to the east of Corpus Christi. Peak wind gusts were estimated at 150 mph in Victoria and 170 mph at Port Lavaca. Average wind gusts of 80 to 90 mph were reported across Corpus Christi. Tides of 10 feet or more were estimated along the coast from Port Aransas to Sabine Pass; the highest tide reported was 18.5 feet at Port Lavaca. Total losses were estimated at $408 million, with $12 million in property damage and crop losses estimated for Nueces County alone. Deaths in Texas totaled 31, five of which were from a tornado in Galveston.
(2) HISTORICAL STORMS (a) 1945 Hurricane - 1945 Hurricane, August 26-27, 1945 An intense hurricane struck Matagorda, but two-thirds of the Texas coast saw winds of hurricane force. Winds were in excess of 100 mph from Port Aransas to Port O'Connor. Tides were as high as 15.0 feet at Port Lavaca. Rainfall amounts of 30 inches were seen along sections of the coast. Heavy damage was seen across Nueces, San Patricio, Aransas, Calhoun, Matagorda, and Wharton counties; damage estimates were near $20.1 million. Severe crop and livestock losses were suffered along nearly all middle and upper Texas coast. Three persons were killed.
(b) 1919 Hurricane - 1919 Hurricane, September 14, 1919 The 1919 Hurricane ranks as the fourth most intense hurricane to strike the United States, and the third deadliest with an estimated 600-900 killed. On September 14, this Category 4 hurricane moved inland 25 miles south of Corpus Christi, putting the city in the dreaded right-front quadrant of the storm, where the highest winds and storm surges normally occur. Storm surge at Corpus Christi was 16 feet resulting from a seiche, (a build up of water that moves back and forth to find equilibrium), which developed along the Bayfront from the northeast wind. Damage along the coast was both catastrophic and deadly. After the storm, the beaches were littered with bodies; many were quickly buried in mass graves near White Point. In Rockport, only two houses along the coastline received relatively little damage. In the North Beach area of Corpus Christi, only two buildings survived, and both took severe damage. Debris piled up to 15.5 feet in the downtown area of Corpus Christi. Total damage estimates at the time were $20 million. As a direct response to this catastrophe, a breakwater was constructed in 1925 to

COASTAL BEND MITIGATION ACTION PLAN 33
protect the downtown Corpus Christi area, and ultimately the seawall by 1940. Flooding associated with this storm was the second highest record event, according to information provided by the Texas and New Orleans Railroad Co.
Key
Stream
Location
Flood Stage
Crest Stage
Crest Date
AT1 Atascosa at Whitsett 20 ft 41.00 ft 09/01/1919
NU5 Nueces near Mathis 25 ft 41.00 ft 09/20/1919
NU6 Nueces near Three Rivers 25 ft 46.00 ft 09/18/1919
(3) OTHER EVENTS In addition to Presidential and Small Business Administration disaster declarations, there have been numerous disaster declarations made by the Secretary of Agriculture for drought, flooding, hail, and an unusual freeze that occurred in 1983. Other events have occurred that have not produced damages sufficient to qualify for disaster declarations: Flooding Urban and rural flooding to lesser magnitudes than those cited above is common in the region due to poor drainage in the Coastal Plains. Periods of intense rainfall frequently result in road closures and flooded vehicles. Street flooding in the downtown Corpus Christi area has resulted in business losses. Flooding events along the Nueces River, in addition to those cited above, have resulted in forced evacuations. The following summarizes events occurring from 1993 to 2003, based on National Weather Service records: 1993 March - Slow moving thunderstorms caused flooding of low water crossings and county roads in northern Jim Wells and western San Patricio counties. 1994 September - A violent thunderstorm struck Mathis in San Patricio county, producing four- to five-inch rainfall as well as lightning that caused power outages. Brief flooding of local homes was reported. October - Roads were closed across Bee and Jim Wells counties. 1995 October - A record-breaking heavy rain event occurred across much of South Texas (Nueces, San Patricio, Kleberg and Aransas counties) during the final days of October 1995. A cold front pushed through the Corpus Christi area during the early morning hours on the 28th and became nearly stationary across the region on the 29th-30th. The National Weather Service office in Corpus Christi recorded 7.92 inches of rain which was the greatest one-day rainfall total for the month of October. Additional reports across the area ranged from 8.76 inches at Padre Island to 12.20 inches in Aransas Pass.

COASTAL BEND MITIGATION ACTION PLAN 34
1996 August - Four to six inches of rain reported in southern portion of Bee County with street and highway flooding. September - Street flooding and stalled cars in Kingsville and Corpus Christi. October - Tides three to four feet above normal at times of high tide, due to a prolonged tight pressure gradient between what would become Tropical Storm Josephine and a high pressure area to the north, resulted in extensive minor to moderate coastal flooding across the Nueces county coastline. Flooding resulted in the closure of the JFK causeway, and Laguna Shores Road. Portions of Shoreline Drive were under water, as well as some of the T-Heads. Flooding was reported in Port Aransas with water levels one foot over the docks. Minor flooding was reported along the coastal highways. Minor flooding occurred along the coastal highways of Aransas County. 1997 April - Abundant subtropical moisture prevailed across South Texas during the start of April. A vigorous upper-level disturbance propagated across the region during the afternoon on the 2nd and the effects continued into the early morning hours on the 3rd. The disturbance forced the development of numerous showers and strong thunderstorms. Mid and upper level winds were relatively light resulting in slow moving and nearly stationary thunderstorms that produced flooding rains. Numerous reports of widespread flooding prevailed across the area with as much as 8-12 inches of rain reported across the greater Corpus Christi metropolitan area. Communities in Aransas, Jim Wells, Kleberg, Nueces, and San Patricio counties were affected. May - Street flooding in portions of Kleberg County occurred during the beginning of the month. Widespread street flooding occurred in Corpus Christi and portions of San Patricio County near the end of the month. June - Street flooding occurred in Corpus Christi during the beginning of the month, streets were flooded in Orange Grove during mid-month, and Robstown and portions of Live Oak county experienced street flooding near the end of the month. October - Record setting rains producing extensive flooding occurred from October 9-13, 1997 across portions of the South Texas Coastal Bend. The Storm Total estimates from the WSR-88D at Corpus Christi, TX, as well as reports from observers, indicated rainfall totals ranging from 8 to 22 inches. The greatest flooding occurred in the Corpus Christi area of Nueces County with an estimated $5 million in flood damages. Unfortunately, two teenage brothers (ages 14 and 13) drowned after being swept away by flood waters while playing near a drainage basin in Annaville, TX (near Corpus Christi) in Nueces county. There were literally hundreds of automobiles stranded during the flood event. All counties in the study area were impacted on a county-wide basis. 1998 February - Street flooding reported in Premont, Kingsville, and portions of Bee and Kleberg counties during the month. August - Highway reported from northwestern Live Oak County. September - Tropical Storm Frances made landfall along the Texas Coastal Bend between Port Aransas and Rockport during the early morning of September 11 1998. Widespread coastal flooding occurred from Padre Island and Corpus Christi northward to Port O’Connor. Heavy

COASTAL BEND MITIGATION ACTION PLAN 35
rainfall from Frances caused the rapid rises on areal rivers and creeks. Significant flash flooding was reported in Bee County. Numerous roadways, including a portion of U.S. Highway 59 west of Beeville, were closed due to flooding in Bee County. October - Jim Wells, Nueces, and San Patricio counties received disaster declarations (see 1257-DR above). In addition, communities in Aransas, Bee, and Kleberg counties were impacted to lesser degrees. 1999 Street and highway flooding was reported from Kingsville and Beeville during March and April. The highest rainfall activity from Hurricane Bret occurred during September across Jim Wells, Kleberg, Nueces and extreme southern Aransas counties (see 1287-DR above). 2000 March - Most of San Patricio County received at least 3 inches of rain with isolated amounts greater than 6 inches, closing SR-188 from Sinton to IH-37 for several hours. In Corpus Christi, 6.55 inches of rainfall was recorded at the downtown storm water pump station. The city storm drainage pumps were unable to remove the excess runoff caused by heavy rainfall. Several streets were flooded, with some water damage to downtown businesses. Emergency crews rescued several people from cars stalled in the flood waters. One man was injured when he was pinned in a storm drain by flowing water. Nearly seven inches of rain fell on Rockport. Water covered many city streets for several hours. Excessive runoff from heavy rainfall closed roads within Alice city limits. Port Aransas and portions of Kleberg County were also impacted. May - Heavy rain forced road closures in and around Premont and Kleberg County. November - Several low lying roadways in Aransas County were barricaded from three hours of heavy rainfall. 5.71 inches was reported by a cooperative observer in Rockport, and 3.59 inches of rain was recorded at the Aransas County Airport, six miles north of Rockport. Numerous streets in Robstown were flooded. 6.65 inches of rain in four hours was reported by a cooperative observer in Robstown. San Patricio Sheriff's Office reported County Road 37 at FM 234 was barricaded due to heavy rainfall. 2001 September - (See description of South Texas floods above). In Bee County, Corrigan Poole Rd was closed due to water covering the bridge. Area residents were evacuated by DPS helicopter and several homes were destroyed near the Aransas River. In Jim Wells county, many parts of Alice flooded. Boats were being used to evacuate homes in the Rancho Alegre division west of Alice. Roads were closed due to flooding throughout the study area. Businesses in downtown Corpus Christi were flooded once again. November - Heavy rains caused numerous road closures throughout Bee, Live Oak, Jim Wells, Kleberg and San Patricio counties during November 14-16. 2002 (See 1434-DR and 1439-DR above.) 2003 March - State highways closed in Bee, Kleberg, and Live Oak counties. June - Thunderstorms occurred over portions of Kleberg, central and eastern Nueces, and southern San Patricio Counties. The Corpus Christi Police Department reported flooding of the

COASTAL BEND MITIGATION ACTION PLAN 36
access roads along South Padre Island Drive around Everhart. Additional widespread flooding was reported on various roads through the central and southern sections of the city. Four inches of rain was reported to have fallen by the public near Airline and Alameda in Corpus Christi. July - (See 1479-DR above.) September - Heavy rainfall over South Texas on the 17th through the 19th led to river flooding. The Nueces River at Bluntzer crested at 24.19 feet on the 23rd (flood stage 18 feet). In Live Oak county the Atascosa River near Whitsett crested at 26.40 feet on the 21st (flood stage 20 feet). Very heavy rainfall fell in southern Nueces County in the city of Bishop where 4 to 5 inches of rainfall were reported. Heavy rainfall fell across central Bee county producing flash flooding along Hwy 59, 888 and 202 near Beeville. Heavy rainfall produced widespread street flooding in Aransas Pass. Flooding occurred In Kleberg County along FM 772 and East CR 1040. October - Very heavy rainfall began falling across western portions of South Texas late in the evening on the 11th of October and continued into the early morning hours of the 12th. The heavy rain occurred over the Nueces River basin and led to major river flooding downstream for days after the rainfall event which exceeded the flood stages of the month before. (b) Tornadoes From the major disaster declaration history above, tornadoes most often occur in the study area in connection with hurricanes, although not always, as evidenced by the most damaging tornado experienced in Corpus Christi in October 2002 (see 1439-DR). Fifty years of National Weather Service tornado records were reviewed and summary information and a map of locations is included below in the Risk Assessment section. The following is a summary of estimated impacts by county, excluding the October 2002 Corpus Christi event, and events for which no losses were reported: Aransas County - Three events for total estimated property damage of $256,000 and 3 minor injuries. The Fulton Tornado, spawned by Hurricane Beulah, was associated with $250,000 in property damage and the injuries. Bee County - Fourteen events for total estimated property damage of $1,681,000 and 6 injuries. Of these, $500,000 and five injuries were associated with a tornado that touched down just southwest of the Beeville airport during 1994, destroying a large hangar and five mobile homes near the airport. Jim Wells County - Eight events for total estimated property damage of $584,000 and 1 injury. Kleberg County - Three events for total estimated property damage of $528,000. One event accounts for $500,000 when a tornado struck in the northeast part of Kingsville during 1993. A travel-trailer was destroyed and some buildings sustained structural damage. Live Oak County - Seven events for total estimated property damage of $356,000 and 4 injuries. Nueces County - Thirty-three events for total estimated property damage of $6,444,000 and 22 injuries. San Patricio County - Eighteen events for total estimated property damage of $3,260,000 and 40 injuries.

COASTAL BEND MITIGATION ACTION PLAN 37
(c) Dam Failure
The National Performance of Dams Program maintains a database for reported dam failures. Within the study region, the only incident of dam failure found occurred Nov. 23, 1930 when the La Fruta earthen dam on the Nueces River near Mathis failed due to seepage at the north end. There were no losses reported since the floodplain was unsettled at the time. The dam was subsequently replaced by the Wesley Seale Dam. (d) Drought Periods of drought occur on a frequent basis throughout the study area. Economic impacts from direct and indirect agricultural losses are a major concern, as are the adequacy of municipal water supplies. Statewide, estimates of agricultural losses exceeded $1 billion for 2000 and $2 billion for 1996 and 1998. The Palmer Drought Severity Index (PDSI) is commonly used measure of drought based on precipitation and temperature data, as well as the local Available Water Content (AWC) of the soil. The figure on the following page plots monthly average PDSI values for a 100 year period for the South Central Texas climate division, which encompasses five of the seven counties in this study. The remaining two counties border the division and reflect similar drought history. Values in the range of -3.0 to -4.0 are classified as representing severe drought, and values less than -4.0 are classified as extreme drought. Multi-year droughts in even the moderate range of -2.0 to -3.0 can have a significant impact on available water supplies, as the entire region is heavily dependent on surface water. The data reveal that since 1900, every decade has experienced one or more droughts with the exception of the 40's and the 70's.
Figure 6: Regional Drought History (derived from National Climatic Data Center data) (e) Wildfire

COASTAL BEND MITIGATION ACTION PLAN 38
Brush and grass fires are the most common type of wildfire to impact the Coastal Bend area. Records are limited and no data is available for Bee, Jim Wells, and Live Oak counties. The State Fire Marshall has published fire data for the years 2006-2010, which summarizes the total number of “outdoor and other” fire events. Total number of events for this period are as follows:
Aransas County: 302 Bee County: 268 Kleberg County: 387 Jim Wells County: 1097 Nueces County: 4,105 Live Oak County: 05 San Patricio County: 651
Online archives of the Corpus Christi Caller Times were searched for the period mid-1998 through 2004 for events of sufficient magnitude to warrant news coverage. (Archived information from November 2001 through 2010 was either incomplete or missing.) The following events are summarized and presented as a representative sample.
July 1998 Corpus Christi, I-37 & Up River Rd. 4 Furniture store threatened
July 1998 Kleberg Co., 4 mi. south of Kingsville 300
July 1998 Corpus Christi, Carbon Plant Rd. 60 Near RTFC fire training station
July 1998 Corpus Christi, Saratoga & Rodd Field 8
July 1998 Corpus Christi, 14000 block SPID 2 Souvenir shop threatened
July 1998 Corpus Christi, near Sharpsburg Rd. 1
Dec 1999 Padre Island National Seashore 4000
May 2000 Corpus Christi, 3000 block Yorktown 80
May 2000 Corpus Christi, Flour Bluff Dr. 100 Neared a home and a business
June 2000 Corpus Christi, 400 block Sun Belt Dr. 150 Neared two businesses
July 2000 Corpus Christi, Waldron Rd. 100 Near homes and businesses
July 2000 Ingleside 130 Two homes threatened
Aug 2000 Corpus Christi, 6000 block Leopard St. 2
Sept 2000 Nueces Co, FM 665 & FM 763 10 Church threatened; 6 hospitalized for smoke inhalation
Nov 2000 San Patricio Co., salt flats near Odem <100
Feb 2001 Corpus Christi, Saratoga Rd Mobile home park threatened
Mar 2001 Padre Island National Seashore 100
July 2001 San Patricio Co, northern Aransas Pass 70
Aug 2001 Bishop, CR 61 & CR 12 15
Aug 2001 Padre Island National Seashore 500 Learning Center threatened
July 2003 Padre Island 15
Aug 2003 Nueces Co., Fiesta Ranch 5 Homes threatened
Jan 2004 Aransas Co., near Rockport 1500 Homes threatened
July 2004 Padre Island National Seashore 200

COASTAL BEND MITIGATION ACTION PLAN 39
B. NFIP Claims History
The National Flood Insurance Program (NFIP) is administered by the Federal Emergency Management Agency to provide flood insurance coverage to the nation. For the seven-county study area, during the period January 1, 1978 – December 2011, the number of paid flood insurance claims was 5,736 totaling $53,005,808.64. Reported through December 2003 were 1,105 repetitive loss claims totaling $14,254,589.88, or nearly 40% of all claims by value. No repetitive loss claims were available from 2004 through December 2011. The following figure shows the breakdown in the number of paid claims by county.
Figure 7: Paid Flood Insurance Claims
Section 2. Risk Assessment A. Introduction We begin by defining some of the terms used in this section: Hazard means an event or physical condition that has the potential to cause harm or loss. Therefore, the term hazard is referring to the event or condition itself, irrespective of its actual observed impacts. A hurricane is an example of an event, whereas a drought is an example of a condition that may arise from non-events, i.e., the absence of rainfall events. Various schema have been used to attempt to classify hazards by type. As we have seen with our preceding summary of historical events in the region, an initiating event, such as a tropical
2,733
1,290 1,328
187 94 56 48
0
500
1,000
1,500
2,000
2,500
3,000
Nueces San Patricio Aransas Kleberg Jim Wells Bee Live Oak
Number of NFIP Paid Claims
Aug 2004 Corpus Christi, 7200 block SPID 5 Apartment complex threatened
Aug 2004 Corpus Christi, 7711 Weber Rd. 10
Nov 2004 Kleberg Co., Padre Island 5

COASTAL BEND MITIGATION ACTION PLAN 40
High
Probability
Low
Impact
High
Probability
Medium
Impact
High
Probability
High Impact
Medium
Probability
Low
Impact
Medium
Probability
Medium
Impact
Medium
Probability
High Impact
Low
Probability
Low
Impact
Low
Probability
Medium
Impact
Low
Probability
High Impact
PR
OB
AB
ILIT
Y
cyclone, can give rise to a variety of other events such as tornadoes, floods, and coastal erosion. A drought, (or lack of precipitation), may give rise to conditions under which a wildfire hazard becomes present. Probably the most useful classification of type would be weather-related hazards and non-weather-related. The non-weather class would include phenomena such as volcanoes and earthquakes, neither of which are a serious hazard in our region. Therefore, the following discussion will concern primarily weather related hazards. Risk assessment means a process or method for evaluating risk associated with a specific hazard, defined in terms of probability and frequency of occurrence, magnitude and severity, exposure and consequences. In the general literature of risk analysis, risk is often portrayed as a function of probability/frequency and consequences/impacts, and plotted on corresponding axes:
3
2
1
0
0 1 2 3 IMPACT
Figure 8: Risk Matrix In our analysis, we will take this approach to characterize the hazards; however, the impacts will be considered as potential impacts, which are then further considered in light of vulnerability factors. For example, a tropical cyclone of a given intensity at landfall may be ranked as a medium probability, medium potential impact. However, if it makes landfall in a relatively unpopulated area, as in the case of Bret, the actual consequences would not be as severe as if it had made landfall nearer to a densely populated area.
(1) HAZARD IDENTIFICATION
Hazard identification means the process of defining and describing a hazard, including its physical characteristics, magnitude and severity, probability and frequency, causative factors, and locations/areas affected. For our mitigation planning purposes, we have not examined physical characteristics and causative factors in detail, but have generally characterized:
• Description
• Severity (intensity)

COASTAL BEND MITIGATION ACTION PLAN 41
• Magnitude (potential size of impact area)
• Probability/frequency
• Hazard Zone (location/extent of impact area)
(2) EXPOSURE
Exposure means the number, types, qualities, and monetary values of various types of property or infrastructure and life that may be subject to an undesirable or injurious hazard event.
Exposure is merely a quantification of what is at risk in the identified hazard zone. In our analysis we quantify:
• Population
• Number of critical facilities (Emergency communications, Fire, Law Enforcement facilities,
EOCs)
• Number of special facilities (Government, Health, Major Industry, Incarceration, Military,
Nursing, Potential Shelters, Cultural facilities)
• Number of infrastructure facilities (Electrical, Sewer, Transportation, Water - major facilities)
• Number of hazardous materials facilities
• Number of residential buildings
• Value of residential buildings
• Number of non-residential buildings
• Value of non-residential buildings
(3) CONSEQUENCES
Consequences mean the damages (full or partial), injuries, and losses of life, property, environment, and business that can be quantified by some unit of measure, often in economic or financial terms.
A loss estimation attempts to quantify the consequences of hazard events. Our analysis includes loss estimations for hurricanes due to wind impacts and coastal flooding.
C. Hazards of Concern
(1) REGIONAL HAZARDS
From the summary of disaster history presented earlier, it becomes apparent as to which hazards are of the FEMA state and local mitigation planning ‘how-to’ guide, Understanding Your Risks: Identifying Hazards and Estimating Losses, the initial step in the analysis that is recommended is to: Task A) list the hazards that can occur, and; Task B) focus on hazards that pose a significant threat. The hazards were discussed in Steering Committee meetings, and between project staff and individual team members. An adapted FEMA Worksheet #1 below summarizes the consensus:

COASTAL BEND MITIGATION ACTION PLAN 42
Hazard
Avalanche
Task A. Task B. Comments
N/A
Coastal Erosion √ √ Mostly associated in the study region with hurricanes.
Dam Failure √ √ Two major dams are located in the region.
Drought √ √ Water supply issues are significant.
Earthquake √ Minor risk in upper parts of study area, but below project guidance.
Expansive Soils √ This hazard is a fact of life in coastal communities, and the principle effects are cracked foundations, and water main breakage causing disruptions to supply.
Extreme Heat √ Typical for South Texas during summer months.
Flood √ √ Several Presidential disaster declarations.
Hailstorm √ There are recorded events, but they are not frequent or widespread.
Hurricane √ √ Several Presidential disaster declarations.
Land Subsidence √ This hazard has been reviewed and is not widespread.
Landslide Topography is not conducive to landslides.
Tornado √ √ Mostly associated with hurricanes, although the most damaging occurrence was not associated.
Tsunami No recorded occurrence.
Volcano N/A
Wildfire √ √ Grass and brush fires are principal concerns.
Wind (other) √ Winds from storms other than hurricanes and tornadoes are not known to have caused severe or widespread damage.
Winter Storm N/A
(2) JURISDICTION-SPECIFIC HAZARDS
Most of the hazards under consideration are common to all the participating jurisdictions, although the degree of risk posed may vary. These variations are discussed further below in connection with defined hazard zones, exposure, and loss estimates. Here we make note of those hazards which are not of significant concern to participating counties and their municipalities: Aransas County – is not downstream from a dam structure and therefore is not subject to dam failure. Bee County – does not border the coast and therefore is not subject to coastal inundation or coastal erosion from hurricanes and is not downstream from a significant dam structure. Jim Wells County – does not border the coast and therefore is not subject to coastal inundation or coastal erosion from hurricanes.

COASTAL BEND MITIGATION ACTION PLAN 43
Kleberg – is not downstream from a significant dam structure and therefore is not subject to dam failure. Live Oak County – does not border the coast and therefore is not subject to coastal inundation or coastal erosion from hurricanes. The following matrix summarizes hazards by jurisdiction:
Erosion
Aransas Co.* √
Dam Fail Drought
√
Flood
√
Hurricane
√
Tornado
√
Wildfire
√
Fulton √ √ √ √ √ √
Rockport √ √ √ √ √ √
Bee Co.* √ √ √ √ √
Beeville √ √ √ √ √
Jim Wells Co.* √ √ √ √W √ √
Alice √ √ √W √ √
Orange Grove √ √ √W √ √
Premont √ √ √W √ √
Kleberg Co.* √ √ √ √W √ √
Kingsville √ √ √W √ √
Live Oak Co.* √ √ √ √W √ √
George West √ √ √ √W √ √
Three Rivers √ √ √ √W √ √
Nueces Co.* √ √ √ √ √ √ √
Bishop √ √ √W √ √
Corpus Christi √ √ √ √ √ √ √
Port Aransas √ √ √ √ √ √
Robstown √ √ √W √ √
San Pat. Co.* √ √ √ √ √ √
Ingleside √ √ √ √ √ √
Portland √ √ √ √ √
* denotes unincorporated areas; W denotes hurricane hazard does not include coastal inundation
D. Methodologies
The following is an introduction to the methodologies used to evaluate risk. It should be noted that the purpose of the risk assessment is to support mitigation planning activities and therefore

COASTAL BEND MITIGATION ACTION PLAN 44
does not attempt to be a definitive scientific investigation. It should also be noted that data sources, such as the 2002 United States Census Data or HAZUS-MH® (see below) default data set, were used to provide a common risk picture across the region. If a more highly refined analysis is needed or desired by a community, then locally collected data may be utilized in the future to the extent available. Finally, the hazard identification was calculated on a region-wide basis. Relative risk may vary by specific jurisdiction, and of course, losses actually incurred will depend on the specific locations of future events. (1) HAZARD IDENTIFICATION
(a) Description Definitions and brief descriptions are provided using authoritative sources. (b) Intensity Intensity can be thought of as the amount of force a hazard event has. Depending on the hazard, this may reflect measurement parameters such as hurricane wind speeds or flood stages. Planning team members assigned a ranking of High, Medium, or Low to various hazard events, based on their knowledge and experience, considering existing intensity scales where available (such as Saffir-Simpson or Fujita, provided below). (c) Extent Extent refers to the size of the potential impact area associated with a given hazard. For those events with a well-defined hazard zone, the total area in square miles was calculated on a region-wide basis, and a ranking assigned as follows:
High: greater than 1,000 square miles Medium: between 100 and 1,000 square miles Low: less than 100 square miles
For those hazards without a well-defined risk zone, an estimate of impact area was used, based on planning team member input. (d) Probability Estimates of the probability of future events are statistically derived from the known history of previous occurrences. They are commonly expressed in terms of per cent annual chance of exceedance. For example, if there is a 1 in 100 chance that an event larger than a specified magnitude will occur in a given year, then there is a 1% annual chance of exceedance. Unfortunately, probability is also expressed in terms of return periods, such as the “100-year flood.” The reason that this terminology is unfortunate is because it leaves the incorrect impression that a 100-year flood can only occur once in 100 years. Although the statistical probability of having more than one great flood event per year may be small, of course it can and does happen. One must also have a clear understanding of the difference between event probabilities and effect probabilities. Where this has bearing in our study is on the stated return periods in our loss estimation for hurricane wind, which are based on the consequences, and not directly on the causes. When published probabilities for hazard types were available (hurricanes and floods), they were used to assign a probability rank. Where they were unknown, project team members assigned a rank based on review of available data and experience with local events and conditions.
High: 1 per 10 years or greater (10% annual chance)

COASTAL BEND MITIGATION ACTION PLAN 45
Medium: between 1 per 100 years (1% annual chance) and 1 per 10 years Low: between 1 per 500 years (.02% annual chance) and 1 per 100 years Very Low: less than 1 per 500 years
(e) Hazard Zones A Geographic Information System was used to define hazard zones by importing existing digital spatial data, or to derive zones from other available data. With the exception of the dam breach hazard zone, which is considered sensitive in the context of Homeland Security, the zones are available for download from the coastalbendmap.org Web site in a commonly used, albeit proprietary, spatial format. Jurisdictional boundaries and streets are also available, as well as a free GIS viewer. Spatial data sources were as follows:
i. Hurricane Wind Three hurricane wind hazard zones were derived from data obtained from Texas A&M University, calculated from an Inland Wind Decay Model.
ii. Coastal Flood Three hazard zones were selected from data provided by Texas A&M University, derived from the NOAA/National Weather Service’s Sea, Lake and Overland Surges from Hurricanes (SLOSH) model.
iii. Coastal Erosion No specific hazard zone per se was defined for this hazard, although a map is provided to show where high rates of erosion have historically occurred, based on spatial data from the Bureau of Economic Geology’s Texas Coastal Hazards Atlas.
iv. Tornadoes No specific hazard zone per se was defined for this hazard, although a map is provided to show where tornadoes have previously been reported, based on data from the National Climatic Data Center’s Storm Event database.
v. Floods For Aransas, San Patricio, Nueces, and Kleberg County, FEMA Q3 Flood Data was used. For Live Oak County, only the 100-year Special Flood Hazard Area for the Atascosa/Frio/Nueces River areas was recently mapped and available in digital format. No spatial data was available for Bee or Jim Wells County.
vi. Dam Failure For the lower Nueces River (below Lake Corpus Christi) a hazard zone of probable maximum flood with dam breach was available in digital format in connection with a previous Wesley Seale Dam study. For the upper Nueces River, (below Choke Canyon Dam and above Lake Corpus Christi) a paper copy map from a study by the Bureau of Reclamation was scanned and converted to spatial format using image analysis tools. vii. Drought No specific hazard zone was created for drought in general, although a potential agricultural impact zone could be inferred from the regional land use/land cover map referenced above.
viii. Wildfire Three hazard zones were derived from the National Fire Danger Rating fuels map (1999). (3) EXPOSURE
i. Census Data

COASTAL BEND MITIGATION ACTION PLAN 46
The general method used to calculate exposure within defined hazard zones for Census 2000-based data was to select and summarize data associated with census blocks that were spatially contained by, or were intersected by, boundaries of the hazard zone. For partial blocks, an estimate was calculated based on per cent of land area. While this approach is reasonably accurate for densely populated areas, it should be noted that it is less accurate for sparsely populated rural areas, and results may be significantly under or over-stated.
ii. Facilities/Infrastructure Data previously existed for critical facilities that had been collected for coastal counties in connection with the Hurricane Evacuation Study program; however no data existed for the inland counties. A contractor was retained to visit the inland counties, and under the direction of the Hazard Mitigation Coordinator, identified and geo-located critical, special, and infrastructure facilities. In addition, the contractor coordinated with the coastal counties to update their facility data. This data was then imported into the GIS system as points, and the number of points falling within a defined hazard zone were totaled.
iii. Hazardous Material Facilities The hazardous materials facilities data was extracted from the Land View 5 database, provided by the Environmental Protection Agency.
iv. HAZUS-MH® National Dataset A default national dataset is provided with the HAZUS-MH® Loss Estimation Methodology software. For residential and non-residential counts and values, data was extracted from the HAZUS-MH census block level inventories (included with the Flood Module), and utilized in the same manner as described for the Census 2000 data above. (4) LOSS ESTIMATION
HAZUS-MH®, is a nationally applicable standardized methodology and software program that contains models for estimating potential losses from earthquakes, floods, and hurricane winds. HAZUS-MH® was developed by the Federal Emergency Management Agency (FEMA) under contract with the National Institute of Building Sciences (NIBS). Various levels of analysis are available, depending on the availability of detailed local data and engineering expertise applied to adjust default parameter values. Although we had planned to use this methodology from the beginning of the project, the software only became available during the end of the first quarter 2004; therefore, only basic analyses using default data and parameters were performed.
Hurricane Wind Model – Loss estimates were run for three user-defined scenarios, an historic scenario (Hurricane Celia), and the probabilistic 10-, 20-, 50-, 100-, 200-, 500-, and 1,000- year loss scenarios. In addition, the facilities data was imported as User Defined facilities, and loss estimates run for the user defined and probabilistic scenarios. Coastal Flood Model – Loss estimates were run for the probabilistic 10-, 50-, 100-, and 500-year coastal flood events.
Further explanation of the components of the risk assessment methodology are described in each of the resulting risk profiles below.
E. Risk Profiles
(1) HURRICANE WIND
Hurricanes are complex phenomena, and as yet, not fully understood. As discussed above, their effects include damaging winds, sustained winds and peak gusts, coastal flooding, coastal

COASTAL BEND MITIGATION ACTION PLAN 47
erosion, inland flooding and spawned tornadoes. Different storm events are characterized by different effects, so it is difficult to generalize the entire range of storm parameters. Therefore, we have taken a closer look by selecting three hurricane scenarios classified by intensity, and assessing the wind and coastal flooding effects separately. Although the event probabilities may actually vary for these two effects, we will assume they are roughly the same.
Tropical Storm — winds 39-73 mph Category 1 Hurricane — winds 74-95 mph (64-82 kt)
No real damage to buildings. Damage to unanchored mobile homes. Some damage to poorly constructed signs. Also, some coastal flooding and minor pier damage. Examples: Irene 1999 and Allison 1995 Category 2 Hurricane — winds 96-110 mph (83-95 kt) Some damage to building roofs, doors and windows. Considerable damage to mobile homes. Flooding damages piers and small craft in unprotected moorings may break their moorings. Some trees blown down. Bonnie 1998, Georges (FL & LA) 1998 and Gloria 1985 Category 3 Hurricane — winds 111-130 mph (96-113 kt) Some structural damage to small residences and utility buildings. Large trees Blown down. Mobile homes and poorly built signs destroyed. Flooding near the coast destroys smaller structures with larger structures damaged by floating debris. Terrain may be flooded well inland. Examples: Keith 2000, Fran 1996, Opal 1995, Alicia 1983 and Betsy 1965 Category 4 Hurricane — winds 131-155 mph (114-135 kt) More extensive curtain wall failures with some complete roof structure failure on small residences. Major erosion of beach areas. Terrain may be flooded well inland. Examples: Hugo 1989 and Donna 1960 Category 5 Hurricane — winds 156 mph and up (135+ kt) Complete roof failure on many residences and industrial buildings. Some complete building failures with small utility buildings blown over or away. Flooding causes major damage to lower floors of all structures near the shoreline. Massive evacuation of residential areas may be required. Examples: Andrew (FL) 1992, Camille 1969 and Labor Day 1935
Figure 9: Saffir-Simpson Hurricane Scale
(a) Hazard Identification
i. Description According to the National Hurricane Center Glossary of Terms, a tropical cyclone is “a warm-core ... cyclone, originating over tropical or subtropical waters, with organized deep convection and a closed surface wind circulation about a well-defined center.” A hurricane is “a tropical cyclone in which the maximum sustained surface wind (using the U.S. 1-minute average) is 64 kt (74 mph or 119 km/hr) or more.” The official hurricane season for the Atlantic Basin (the Atlantic Ocean, the Caribbean Sea, and the Gulf of Mexico) is from 1 June to 30 November. As seen in the graph below, the peak of the season is from mid-August to late October; however, deadly hurricanes can occur anytime in the hurricane season.

COASTAL BEND MITIGATION ACTION PLAN 48
Figure 10: Seasonal Distribution of Hurricanes/Tropical Storms ii. Intensity Referring to the Saffir-Simpson Hurricane Scale, three intensities of hurricane were considered: Category 1-2, Category 3, and Category 4-5, and ranked as follows: • Category 1-2: Low • Category 3: Medium • Category 4-5: High iii. Extent Area of potential maximum sustained winds of hurricane force or greater: • Category 1-2: High • Category 3: High • Category 4-5: High iv. Probability Probability estimates for the study region were obtained from consulting the National Hurricane Center Web site at: http://www.nhc.noaa.gov/HAW2/english/basics/return.shtml, and reflect the

COASTAL BEND MITIGATION ACTION PLAN 49
return period for the five categories of storms passing within 75 miles of the study area. The return periods were converted to annual probability of exceedance. Return Period Annual Probability (years) (percent)
Category 1: 15 6.667
Category 2: 29 3.448
Category 3: 44 2.273
Category 4: 78 1.282
Category 5: 170 0.588
Therefore based on our previous criteria, the rank is as follows:
• Category 1-4: Medium
• Category 5: Low
v. Zone Three hazard zones were defined as the areas potentially affected by hurricane force winds or greater, under three scenarios. Based on an Inland Wind Decay Model provided by Texas A&M, the distance of the expected penetration of hurricane force winds from the coast was calculated. All three scenarios assumed a forward motion of 10mph and maximum sustained wind radius of 25 miles. It should be noted that the resulting zones do not reflect the effects of any single storm; they should be considered composite hazard areas.
The results of the inland wind decay calculations are as follows:
Category Initial Wind Approximate Distance Inland >= 74 mph
High Category 2 110 mph 35 miles
High Category 3 130 mph 62 miles
High Category 5 175 mph 112 miles
Although the following map overlays all three zones, it should be remembered that each hazard zone actually contains the entire area between its western boundary and the coast. It should also be kept in mind that the area closest to the cost may experience much higher winds, which are not shown on this map. Actual wind speeds that may be expected under the three scenarios are indicated as the loss estimate maps on the following pages.

COASTAL BEND MITIGATION ACTION PLAN 50
Map 11: Hurricane Wind Hazard Zones (MEOWs)
(b) Consequences
i. User Defined Scenarios
Three scenarios were modeled based on the parameters described above, with a track selected through the heart of the region. The resulting summaries of loss data for the region are included on the maps on the following pages; detailed county breakdowns of the data are available for download from the coastalbendmap.org Web site, but are only as useful as the scenario selected for modeling. ii. Historical Storm Scenario, Celia The historical storm scenario of Hurricane Celia was modeled for purposes of comparison. The results should be understood in terms of losses expected were the same storm to strike today. In our opinion, these results are understated in that the exceptionally high peak gusts of the actual historical storm are not considered in the model.
iii. Probabilistic Loss Scenarios The return periods of the probabilistic scenarios are not directly associated with a storm event; rather, they are return periods for the expected consequences. That is, storms with different characteristics can produce similar damages. The scenario storm parameters, e.g. the storm track and peak gusts selected by the model, is only one of many combinations that might occur to produce the same level of loss. For this reason, data is not summarized to the county level. Maps for the 100-, 200-, 500, and 1000-year return periods are provided; additional data, including the 10-, 20-, and 50-year return periods, is available from the Web site, broken down by residential and non-residential occupancy class.

COASTAL BEND MITIGATION ACTION PLAN 51
Loss estimate data is summarized on the following pages.
Map 12: User Defined Scenario, Category 2 Hurricane

COASTAL BEND MITIGATION ACTION PLAN 52
Map 13: User Defined Scenario, Category 3 Hurricane

COASTAL BEND MITIGATION ACTION PLAN 53
Map 14: User Defined Scenario, Category 5 Hurricane

COASTAL BEND MITIGATION ACTION PLAN 54
Map 15: Historical Scenario, Hurricane Celia

COASTAL BEND MITIGATION ACTION PLAN 55
Map 16: Probabilistic Scenario, 100 year Loss

COASTAL BEND MITIGATION ACTION PLAN 56
Map 17: Probabilistic Scenario, 200 year Loss

COASTAL BEND MITIGATION ACTION PLAN 57
Map 18: Probabilistic Scenario, 500 year Loss

COASTAL BEND MITIGATION ACTION PLAN 58
Map 19: Probabilistic Scenario, 1000 year Loss
The following graph arranges the modeled scenarios in order of magnitude of total estimated losses to provide a summary view. Our Category 5 Hurricane scenario would be truly catastrophic for the region.

COASTAL BEND MITIGATION ACTION PLAN 59
40,000.0
35,000.0
30,000.0
25,000.0
20,000.0
15,000.0
10,000.0
5,000.0
0.0
10 yr 20 yr Celia* Cat 2 50 yr 100 yr Cat 3 200 yr 500 yr 1000 yr Cat 5
Figure 11: Hurricane Wind Loss Estimation Summary *Celia estimate is most likely understated since the model does not use the actual, recorded peak wind gusts. (2) COASTAL FLOOD
(a) Hazard Identification i. Description Water that is pushed toward the shore by the force of hurricane winds combines with the normal tides to create the hurricane storm tide, which can cause severe flooding in coastal areas. Factors which affect the degree of flooding experienced are the magnitude of the hurricane, the point of landfall, the shape of the continental shelf, the presence of barrier islands, bays and rivers, and the timing relative to astronomical high tide. ii. Intensity Referring to the Saffir-Simpson Hurricane Scale, three intensities of hurricane were considered: Category 1-2, Category 3, and Category 4-5, and ranked as follows: • Category 1-2: Low
• Category 3: Medium
• Category 4-5: High
iii. Extent
Area of potential maximum coastal flooding:
Indirect ($M) Direct ($M)

COASTAL BEND MITIGATION ACTION PLAN 60
• Category 1-2: Medium
• Category 3: Medium
• Category 4-5: Medium
iv. Probability For the purpose of this study, we assume that the probability of flooding is roughly equal to the probability of hurricane event. Based on our probability criteria, the rank is as follows: • Category 1-4: Medium
• Category 5: Low
v. Zone Texas A&M University, as part of the Coastal Bend Hurricane Evacuation Study program, has modeled a Maximum Envelope of Water (MEOW) for each storm category based on data generated by the SLOSH model. Three of these hazard zones were selected representing areas potentially affected by coastal inundation from a Category 2, Category 3, and Category 5 hurricane. Again, each zone does not depict the effects of a particular storm, but is a composite of many possible storms. And again, the map layers the three zones, so the hazard zone is the entire area between the western boundary and the coastline. Using SLOSH data, we also generated depth-of-water-over-land grids for each of the five MEOWs, and then generated contour lines at 3 foot intervals. These are not published but are available to local emergency managers for future use in evaluating risk to critical facilities. No claims to accuracy are made for these estimates. The SLOSH model is represented as being accurate to +/- 20% and the elevation model used was the 30 meter resolution DEM from the U.S. Geological Survey’s National Map Seamless Data Distribution System, for which the accuracy of the elevation is unknown. Regardless, the grid can be useful for highlighting problem areas for further investigation. A sample follows.

COASTAL BEND MITIGATION ACTION PLAN 61
MAP 20: HURRICANE INUNDATION HAZARD ZONES, OSO Waste Water Treatment
Plant with CAT 5 MEOW Contour Lines
(b) Exposure Category 2 Category 3 Category 5
Hurricane Inundation Value % of Total Value % of Total Value % of Total

COASTAL BEND MITIGATION ACTION PLAN 62
Region Population 21,824 4 68,365 13 173,042 33 critical facilities 10 7 20 14 28 20 special facilities 41 8 75 14 140 26 infrastructure 13 6 22 10 45 20 hazmat 25 13 30 15 50 26 #all residential bldgs 10,193 6 26,976 15 61,528 35 #all non-residential bldgs 108 5 254 12 846 39 $all residential bldgs (mil) 1684.64 6 4,176.81 16 9,908.83 38 $all non-res bldgs (mil) 216.82 4 529.21 11 1,807.95 37 Aransas County Population 6,059 27 14,964 67 21,569 96 #critical facilities 6 67 8 89 8 89 #special facilities 31 60 45 87 51 98 #infrastructure 1 8 5 42 11 92 #hazmat 1 20 3 60 3 60 #all residential bldgs 3,653 33 7,713 69 10,703 95 #all non-residential bldgs 9 13 40 57 49 70 $all residential bldgs (mil) 501.18 36 970.81 71 1,310.75 95 $all non-res bldgs (mil) 28.92 16 107.71 61 135.95 77 Kleberg County Population 64 0 100 1 724 6 #critical facilities 0 0 0 0 0 0 #special facilities 0 0 0 0 0 0 #infrastructure 0 0 0 0 0 0 #hazmat 0 0 0 0 0 0 #all residential bldgs 35 1 62 1 421 7 #all non-residential bldgs 0 0 0 0 0 0 $all residential bldgs (mil) 3.93 1 6.97 1 47.32 7 $all non-res bldgs (mil) 0.00 0 0.00 0 0.00 0 Nueces County Population 13,585 4 45246 14 131602 42 #critical facilities 4 7 9 17 13 24 #special facilities 9 4 23 10 63 27 #infrastructure 9 12 12 16 18 23 #hazmat 16 16 19 19 30 30 #all residential bldgs 5,666 6 16,331 16 43,730 43 #all non-residential bldgs 70 5 172 11 721 46 $all residential bldgs (mil) 1,051.61 7 2,784.37 17 7,615.70 47 $all non-res bldgs (mil) 126.02 4 332.88 10 1,511.73 45 San Patricio County Population 2,116 3 8,055 12 19,147 29 #critical facilities 0 0 3 13 7 30 #special facilities 1 1 7 7 26 27 #infrastructure 3 6 5 10 16 31 #hazmat 8 19 8 19 17 40 #all residential bldgs 839 4 2,870 13 6,674 29 #all non-residential bldgs 29 16 42 24 76 43 $all residential bldgs (mil) 127.91 4 414.66 13 935.06 29 $all non-res bldgs (mil) 61.87 15 88.63 21 160.28 38
(c) Consequences
The Coastal Flood Module of HAZUS-MH® bases return periods on flooding events, not directly associated with particular storm events. Losses were calculated for the 10-, 50-, 100-, and 500-year return periods. Maps and data for the 100- and 500-year coastal floods are included below.

COASTAL BEND MITIGATION ACTION PLAN 63
Complete data, broken down by residential and non-residential occupancy classes are available from the Web site.
Map 21: Coastal Flood, 100 year flood event

COASTAL BEND MITIGATION ACTION PLAN 64
Map 22: Coastal Flood, 500 year flood event
(2) COASTAL EROSION
In Texas, coastal erosion is defined in Sec. 33.601, Natural Resources Code, which states: “Coastal erosion means the loss of land, marshes, wetlands, beaches, or other coastal features within the coastal zone because of the actions of wind, waves, tides, storm surges, subsidence, or other forces.” Coastal erosion rates have been calculated by the Bureau of Economic Geology at the University of Texas at Austin. Data for the Mustang Island and Padre Island Gulf of Mexico is based on

COASTAL BEND MITIGATION ACTION PLAN 65
maps from 1937 - 2000; Baffin Bay is based on maps from 1941 - 1995; Aransas, Copano, and Corpus Christi Bay are based on maps from 1930 - 1982. The data depict the average long-term shoreline change, or average annual erosion rate. An average number – 5-10 feet/year, for example – does not mean necessarily that each year 5-10 feet of beach is eroded. Depending on storms and tides, the beach may remain relatively stable for several years, then suffer a 30-40 foot loss in a single storm. In general, a 5-10 foot erosion rate indicates that, over time, the shoreline is moving landward at a fairly high rate.
MAP 23: Average Coastal Erosion Rates
The Texas General Land Office administers the statewide Coastal Erosion Planning and Response Act (CEPRA) adopted by the 76 Texas Legislature. Under this program, the Coastal Texas 2020 (CT 2020) is a long-term, statewide initiative, begun in June of 2003, created to unite local, state and federal efforts to promote the economic and environmental health of the Texas coast. The 18 coastal counties are divided into regions, and the four coastal counties included in the Coastal Bend MAP study area are located in Region IV. A Regional Advisory committee was established and meetings held to determine issues of local concern.

COASTAL BEND MITIGATION ACTION PLAN 66
Bay shoreline erosion was identified as a significant concern area during this process and results from both natural and human-caused effects such as navigational traffic. Thirty locations within our study area were identified as needing attention, with almost one-quarter dealing with erosion, specifically erosion along bayfront areas. Of these identified projects, those representing areas with significant erosion and high priority for their communities are also included in this mitigation plan (see Section 3). From the Coastal Texas 2020 Region IV Executive Summary: Region IV is home to seven bays, and many of the area’s cities and towns rest along bay shoreline. The GIWW also runs through this area, and erosion results from the wakes of ships and barges using the waterway. San Patricio County Judge Terry Simpson said rising sea levels will make the problem worse in the future. Coastal erosion has not only economic impacts for the region, but also environmental impacts. As further stated in the Executive Summary for Region IV: While the region’s erosion problems impact tourism because of the toll it takes on beaches, erosion also plays a significant role in the habitat and wetlands issues facing Region IV. The wakes of passing ships and barges cause erosion along nearby shorelines and wetlands. The Regional Advisory Committee identified 14 critical areas in need of habitat and wetlands projects – many of these projects would address bay shoreline erosion. Erosion and habitat/wetlands projects were issues affecting many of the critical areas identified by the committee.

COASTAL BEND MITIGATION ACTION PLAN 67
Map 24: Coastal Texas 2020 Region IV Map of Critical Areas
(3) TORNADOES

COASTAL BEND MITIGATION ACTION PLAN 68
(a) Hazard Identification
i. Description According to the Glossary of Meteorology (AMS 2000), a tornado is "a violently rotating column of air, pendant from a cumuliform cloud or underneath a cumuliform cloud, and often (but not always) visible as a funnel cloud." The most destructive and deadly tornadoes occur from supercells -- which are rotating thunderstorms with a well-defined radar circulation called a mesocyclone. Some landfalling hurricanes cause major outbreaks; Hurricane Beulah, caused the second biggest tornado outbreak on record in numbers, with 115. Many of the tornadoes that have occurred in the region have been associated with hurricanes. They have tended to be at the lower end of the Fujita scale (see Figure 12)on the following page), with a total over a 50-year period(11) of 180 events in the F0-F1 class, 27 events in the F2 class, and 6 events in the F3 class (18 events were unknown as to class). ii. Intensity • Low to Medium iii. Extent • Low (in comparison to total region area) iv. Probability • High (based on number of events during the 50-year period of record) v. Zone Tornadoes appear to be uniformly distributed across the region; therefore, the entire area is at a similar risk, and no specific zone is designated. The most vulnerable structures are mobile homes, and a map showing mobile homes/recreational vehicles as a percent of all housing units is provided to give an indication of especially vulnerable areas. (b) Exposure Exposure values have not been calculated since the entire study area (100%) would be at risk. (c) Consequences No loss estimates have been calculated. Only 2 deaths and 103 injuries are attributed to tornadoes for the 50-year period. At total of $98 million in property damages is estimated, with $85 million of that from the October 2002 Corpus Christi tornadoes.
Late evening on June 2nd 2010, 4 separate tornadoes developed along a severe squall line that was rapidly moving through South Texas and the adjacent waters. These tornadoes tracked through Bee, San Patricio, Refugio, Aransas and Nueces counties. Tornadoes are typically rated by the amount of damage that they produce. The scale that is used is called the Enhanced F-Scale. An EF-2 rating was given to the tornado that tracked through Aransas County, just west of Rockport. An EF-1 rating was given to the tornado that tracked through extreme southern Bee and northwestern San Patricio counties, southeast of Tynan. An EF-0 rating was given to the other two short track tornadoes that affected areas just north of Chapman Ranch in Nueces County and just southeast of Woodsboro in Refugio County.

COASTAL BEND MITIGATION ACTION PLAN 69
F-Scale Intensity Phrase Wind Type of Damage Done
Number Speed
F0 Gale tornado 40-72 Some damage to chimneys; breaks
mph branches off trees; pushes over shallow- rooted trees; damages sign boards.
F1 Moderate tornado 73-112 The lower l imi t is the beginning of
mph hurricane wind speed; peels surface off
roofs ; mob i le homes pushed of f
foundations or overturned; moving autos
pushed off the roads; attached garages
may be destroyed.
F2 Significant tornado 113-157 Considerable damage. Roofs torn off
mph frame houses; mobile homes demolished;
boxcars pushed over; large trees snapped
or uprooted; l ight object missi les
generated.
F3 Severe tornado 158-206 Roof and some wal ls torn of f wel l
mph constructed houses; trains overturned; most trees in forest uprooted.
F4 Devastating 207-260 Wel l -constructed houses leve led;
to rnado mph st ruc tures wi th weak foundat ions b lown of f
some distance; cars thrown and large
missiles generated.
F5 Incredible tornado 261-318 Strong frame houses lifted off foundations
mph and carried considerable distances to
disintegrate; automobile sized missiles fly
through the air in excess of 100 meters;
trees debarked; steel re-inforced concrete
structures badly damaged.
Figure 12: Fujita Tornado Scale

COASTAL BEND MITIGATION ACTION PLAN 70
(5) FLOODS

COASTAL BEND MITIGATION ACTION PLAN 71
Many of the historical non-coastal floods in the region have also been associated with hurricanes, with the two floods of record on the Nueces River associated with Hurricane Beulah and the 1919 Hurricane. However, an abundance of moisture in the right weather system can create flooding conditions throughout the region, and throughout the year. (a) Hazard Identification
i. Description The National Weather Service glossary definition of flood is “the inundation of a normally dry area caused by an increased water level in an established watercourse, such as a river, stream, or drainage ditch, or ponding of water at or near the point where the rain fell.” As seen from the disaster history, floods are associated not only with hurricanes and tropical storms, but also weather systems that can produce extraordinary amounts of rainfall in relatively short periods of time. ii. Intensity • Medium The magnitude of a flooding event is often designated by its return period. Our primary focus for analysis purposes is on the 100-year flood, since that is the standard on which the National Flood Insurance Program is based. iii. Extent • Low (in comparison to total region area) iv. Probability • Medium v. Zone No digital spatial data was available for Jim Wells or Bee County. Only the 100-year flood boundary was available for Live Oak County. A map which shows the 100-year (FIRM Zone A) and 500-year (FIRM Zone B) boundaries is provided to the stated limits of the available data. There are few areas where there is any significant difference between the 100- and 500-year boundaries. It should be noted that coastal flooding, previously discussed, is also included again on this map. For the actual calculation of exposure, the coastal flooding areas were removed from the calculation, based on a review of Flood Insurance Study data. This is most obvious for Aransas County which is primarily subject to coastal flooding, and thereby removed from the exposure calculation in its entirety. (The Federal Emergency Management Agency is undertaking a Multi-hazard Map Modernization Program which will not only update the Flood Insurance Rate Maps, but also make them available in digital form, the new “DFIRM.” Ultimately, this will be of tremendous benefit for mitigation planning. For further information see: http://www.fema.gov/fhm/mm_main.shtm.)

COASTAL BEND MITIGATION ACTION PLAN 72
Map 27: Flood Hazard Zones
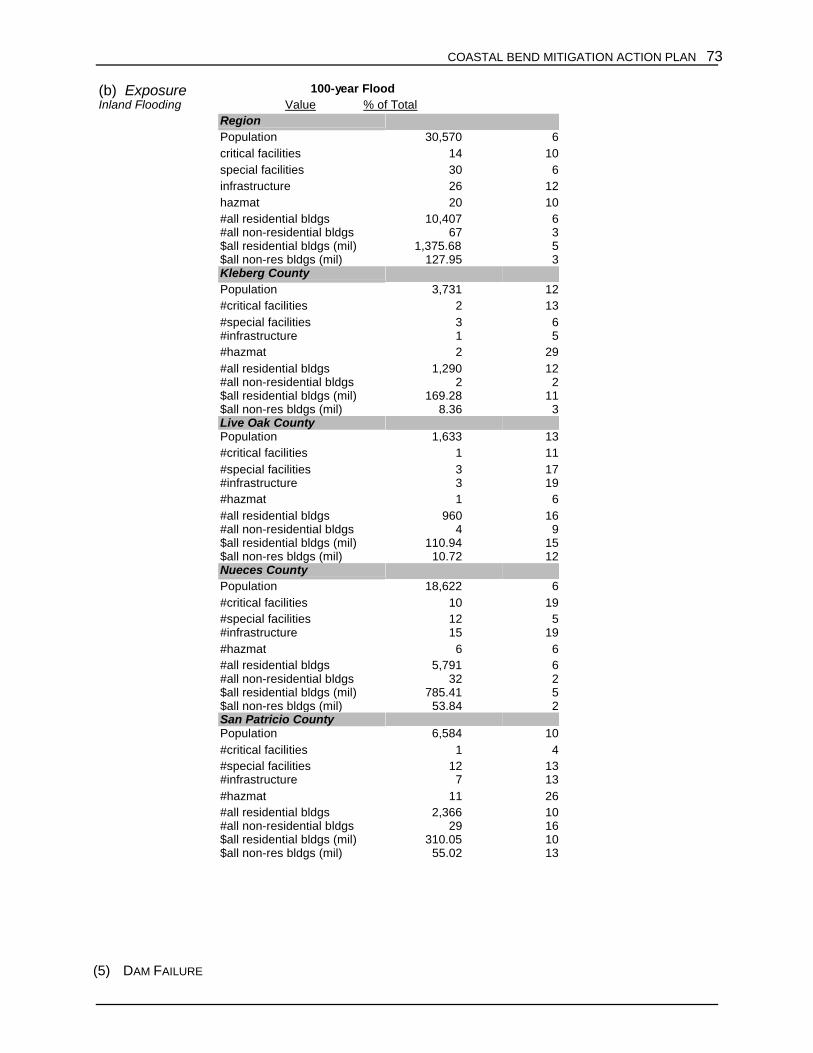
COASTAL BEND MITIGATION ACTION PLAN 73
(b) Exposure 100-year Flood
Inland Flooding Value % of Total
Region Population 30,570 6 critical facilities 14 10 special facilities 30 6 infrastructure 26 12 hazmat 20 10 #all residential bldgs 10,407 6 #all non-residential bldgs 67 3 $all residential bldgs (mil) 1,375.68 5 $all non-res bldgs (mil) 127.95 3 Kleberg County Population 3,731 12 #critical facilities 2 13 #special facilities 3 6 #infrastructure 1 5 #hazmat 2 29 #all residential bldgs 1,290 12 #all non-residential bldgs 2 2 $all residential bldgs (mil) 169.28 11 $all non-res bldgs (mil) 8.36 3 Live Oak County Population 1,633 13 #critical facilities 1 11 #special facilities 3 17 #infrastructure 3 19 #hazmat 1 6 #all residential bldgs 960 16 #all non-residential bldgs 4 9 $all residential bldgs (mil) 110.94 15 $all non-res bldgs (mil) 10.72 12 Nueces County Population 18,622 6 #critical facilities 10 19 #special facilities 12 5 #infrastructure 15 19 #hazmat 6 6 #all residential bldgs 5,791 6 #all non-residential bldgs 32 2 $all residential bldgs (mil) 785.41 5 $all non-res bldgs (mil) 53.84 2 San Patricio County Population 6,584 10 #critical facilities 1 4 #special facilities 12 13 #infrastructure 7 13 #hazmat 11 26 #all residential bldgs 2,366 10 #all non-residential bldgs 29 16 $all residential bldgs (mil) 310.05 10 $all non-res bldgs (mil) 55.02 13
(5) DAM FAILURE

COASTAL BEND MITIGATION ACTION PLAN 74
(a) Hazard Identification
i. Description The principal dams in the region are the Choke Canyon Dam, located in north Live Oak County just above Three Rivers, and the Wesley Seale Dam at the southern end of Lake Corpus Christi near Mathis in San Patricio County. To comply with state and federal requirements, studies have been performed of the potential impact of dam failure under conditions of “Probable Maximum Flood.” Probable Maximum Precipitation (PMP) is the greatest depth (amount) of precipitation, for a given storm duration, that is theoretically possible for a particular area and geographic location. (For the Wesley Seale Dam analysis, 30 inches of rain in 6 hours and 50 inches of rain in 48 hours were used.) Probable Maximum Flood (PMF) is the flood that may be expected from the most severe combination of critical meteorological and hydrologic conditions that are reasonably possible in a particular drainage area. These studies are theoretical analyses, and do not reflect on dam integrity. ii. Intensity • High (For immediately downstream of Choke Canyon Dam, the estimate of peak discharge is up to a maximum of 550,000 cubic feet/second (cfs) and a peak flood stage of 57 feet. This compares to the flood of record, resulting from Hurricane Beulah, with a recorded maximum discharge of 141,000 cfs, and a peak stage of 49 feet. That is, the dam breach scenario results in a discharge of approximately four times greater than that experienced in association with Beulah. For the Wesley Seale Dam analysis, the maximum discharge rate calculated immediately below the dam is 1,950,637 cfs, with a stage increase of approximately 3.5 feet. Comparing to the flood of record data at Mathis, the peak discharge under this scenario is approximately 14 times greater, and the peak stage would reach over 52 feet.) iii. Extent • Medium (The extent of the impact area was calculated at roughly 220 square miles.) iv. Probability • Very Low (While the return period associated with the PMP used in the analyses is not available, the 100-year return period for this region is associated with 12 inches in 24 hours and 7-8 inches in 6 hours, much lower than the PMP used in the Wesley Seale analysis for example. Secondly, precisely because catastrophic failure represents an unacceptable hazard, the dams are maintained to the highest standards. See City of Corpus mitigation action related to maintenance.) v. Zone The hazard zone encompasses areas along the rivers below Choke Canyon, all the way to Nueces Bay.
(b) Exposure Probable Max Flood with Breach

COASTAL BEND MITIGATION ACTION PLAN 75
Dam Breach Value % of Total Region Population 6,541 1 critical facilities 0 0 special facilities 0 0 infrastructure 3 1 hazmat 3 2 #all residential bldgs 3,451 2 #all non-residential bldgs 14 1 $all residential bldgs (mil) 395.50 2 $all non-res bldgs (mil) 24.74 1 Jim Wells County Population 405 1 #critical facilities 0 0 #special facilities 0 0 #infrastructure 0 0 #hazmat 0 0 #all residential bldgs 204 1 #all non-residential bldgs 0 0 $all residential bldgs (mil) 21.08 1 $all non-res bldgs (mil) 0.00 0 Live Oak County Population 1,438 12 #critical facilities 0 0 #special facilities 0 0 #infrastructure 2 13 #hazmat 1 6 #all residential bldgs 1,079 18 #all non-residential bldgs 2 5 $all residential bldgs (mil) 112.48 15 $all non-res bldgs (mil) 4.39 5 Nueces County Population 3,075 1 #critical facilities 0 0 #special facilities 0 0 #infrastructure 1 1 #hazmat 1 1 #all residential bldgs 1,310 1 #all non-residential bldgs 2 <1 $all residential bldgs (mil) 173.44 1 $all non-res bldgs (mil) 2.97 <1 San Patricio County Population 1,623 2 #critical facilities 0 0 #special facilities 0 0 #infrastructure 0 0 #hazmat 1 2 #all residential bldgs 858 4 #all non-residential bldgs 10 6 $all residential bldgs (mil) 88.49 3 $all non-res bldgs (mil) 17.39 4
(b) Consequences
A loss estimate was not calculated for this scenario.

COASTAL BEND MITIGATION ACTION PLAN 76
(6) DROUGHT
(a) Hazard Identification
i. Description Although drought has scores of definitions, it originates from a deficiency of precipitation over an extended period of time, usually a season or more. Its impacts on society result from the interplay between the natural event and the demand people place on water supply. Two of the principal effects in the region are shortfalls in regional water supply, and agricultural losses. Efforts in Texas since the passage of Senate Bill 1, enacted by the 75th Session of the Texas Legislature in 1997, have focused on the development of drought contingency plans and long-term, regional water planning. A Coastal Bend Regional Water Planning Group was appointed to address long-term supply issues for an 11 county region, and their report is available from the Texas Water Development Board Web site. The Coastal Bend Region depends mostly on surface water sources for municipal and industrial water supply use. The three major surface water resources include the Choke Canyon Reservoir/Lake Corpus Christi System in the Nueces River Basin, and Lake Texana on the Navidad River in Jackson County. There are three regional water providers: the City of Corpus Christi, the largest of the three, sells water to the South Texas Water Authority and the San Patricio Municipal Water District, and is the source of 94% of surface water. There are some areas in the region that are dependent on groundwater primarily from the Gulf Coast and Carrizo-Wilcox aquifers. ii. Intensity • Low iii. Extent • High iv. Probability • High (See Figure 11: Regional Drought History) v. Zone No defined hazard zone is identified, although agricultural areas would be especially vulnerable. (b) Exposure Not calculated for this hazard. (c) Consequences No loss estimates were calculated for this hazard. (7) WILDFIRE
The risk of wildfire is heavily dependent on current weather conditions and the characteristics of available fuels. In our analysis, we extracted fuels data from the U.S. Department of Agriculture Forest Service’s Fuel Model Map, and the local fuel types consisted primarily of: • Land under cultivation, not identified as a fuel • Fuel Model L, grasslands and sparse brush • Fuel Model F, oaks and denser brush

COASTAL BEND MITIGATION ACTION PLAN 77
(a) Hazard Identification
i. Description The definition of wildfire according to the federal, interagency National Wildfire Coordinating Group is “An unplanned, unwanted wildland fire including unauthorized human-caused fires, escaped wildland fire use events, escaped prescribed fire projects, and all other wildland fires where the objective is to put the fire out.” ii. Intensity • Cultivated and grasslands: Low • Oaks and denser brush: Medium iii. Extent • Low (relative to total study area) iv. Probability • High (see disaster history) v. Zone

COASTAL BEND MITIGATION ACTION PLAN 78
Map 28: Wildfire Hazard Zones

COASTAL BEND MITIGATION ACTION PLAN 79
(b) Exposure WF Ag WF Mod L WF Mod F
Wildfire Value % of Total Value % of Total Value % of Total
Region Population 203,583 39 251,248 48 80,527 16 #critical facilities 45 33 39 28 36 26 #special facilities 164 30 159 29 136 25 #infrastructure 115 51 38 17 55 24 #hazmat 66 34 46 24 38 20 #all residential bldgs 67,364 38 83,037 47 28,324 16 #all non-residential bldgs 731 34 1,309 60 198 9 $all residential bldgs (mil) 10,102.22 39 12,798.69 49 3,854.03 15 $all non-residential bldgs (mil) 2,557.07 53 2,714.03 56 542.33 11 Aransas County Population 14,026 62 2,195 10 821 4 #critical facilities 1 11 0 0 0 0 #special facilities 15 29 1 2 0 0 #infrastructure 10 83 1 8 0 0 #hazmat 2 40 2 40 0 0 #all residential bldgs 6,641 59 1,474 13 323 3 #all non-residential bldgs 18 26 45 64 0 0 $all residential bldgs (mil) 798.23 58 180.55 13 25.90 2 $all non-res bldgs (mil) 54.06 31 94.08 53 4.21 2 Bee County Population 820 3 9,114 28 22,747 70 #critical facilities 1 8 2 17 9 75 #special facilities 2 4 4 7 49 89 #infrastructure 2 13 0 0 14 88 #hazmat 0 0 4 44 5 56 #all residential bldgs 337 3 2,260 23 7,438 75 #all non-residential bldgs 0 0 61 64 34 36 $all residential bldgs (mil) 36.73 3 311.50 22 1,053.12 76 $all non-res bldgs (mil) 2.21 1 85.54 37 142.47 62 Jim Wells County Population 3,923 10 12,567 32 23,605 60 #critical facilities 2 13 4 27 9 60 #special facilities 8 17 10 22 28 61 #infrastructure 13 38 10 29 11 32 #hazmat 2 15 1 8 10 77 #all residential bldgs 1,481 11 4,364 31 8,492 60 #all non-residential bldgs 8 7 15 13 98 82 $all residential bldgs (mil) 185.05 10 579.92 32 1,054.44 59 $all non-res bldgs (mil) 27.76 10 49.37 18 202.88 74 Kleberg County Population 4,648 15 17,270 55 11,292 36 #critical facilities 0 0 11 69 5 31 #special facilities 3 6 28 60 16 34 #infrastructure 4 21 7 37 8 42 #hazmat 1 14 3 43 3 43 #all residential bldgs 1,294 12 6,203 58 3,696 34 #all non-residential bldgs 77 65 87 73 13 11 $all residential bldgs (mil) 231.13 15 849.99 54 580.57 37 $all non-res bldgs (mil) 157.99 55 169.43 59 60.89 21

COASTAL BEND MITIGATION ACTION PLAN 80
(b) Exposure WF Ag WF Mod L WF Mod F
Wildfire Value % of Total Value % of Total Value % of Total
(c) Consequences No loss estimates were calculated for this hazard.
Chapter References 1. Map 9 Data Source: NOAA Coastal Services Center. “Historical Hurricane Tracks.” 2. Map 10 Data Source: U. S. Geological Survey. 3. Peak flood stage data from National Weather Service based on U.S. Geological Survey records. 4. Summaries of historical disasters were compiled from state and federal reports including National Hurricane Center, U. S. Geological Survey, Texas Mitigation Plans, National Weather Service. 5. Table 3 Data Source: Compiled by the Governor’s Division of Emergency Management. 6. Figure 7, NFIP Claims Data Source: Federal Emergency Management Agency, Flood Insurance Administration. “Claim Information by State, 1978 through December 2011.” 7. Definitions of risk assessment terminology: Federal Emergency Management Agency. 1997. Multi Hazard Identification and Risk Assessment: A Cornerstone of the National Mitigation Strategy. 8. Figures 9 and 10 Data Source: National Hurricane Center.
Live Oak County Population 169 1 2,346 19 9,756 79 #critical facilities 0 0 1 11 8 89 #special facilities 0 0 0 0 18 100 #infrastructure 0 0 2 13 14 88 #hazmat 0 0 0 0 16 100 #all residential bldgs 102 2 1,875 31 4,087 67 #all non-residential bldgs 0 0 0 0 43 100 $all residential bldgs (mil) 10.75 1 196.22 27 515.53 71 $all non-res bldgs (mil) 0.00 0 0.63 1 89.49 99 Nueces County Population 128,559 41 195,586 62 4,399 1 #critical facilities 25 46 20 37 0 0 #special facilities 76 33 108 47 2 1 #infrastructure 47 61 14 18 1 1 #hazmat 37 37 29 29 0 0 #all residential bldgs 40,610 40 62,500 62 1,676 2 #all non-residential bldgs 525 34 1,014 65 2 0 $all residential bldgs (mil) 6,421.96 40 10,040.13 62 269.36 2 $all non-res bldgs (mil) 1,157.52 34 2,154.30 64 5.25 0 San Patricio County Population 51,438 77 12,170 18 7,907 12 #critical facilities 16 70 1 4 5 22 #special facilities 60 63 8 8 23 24 #infrastructure 39 75 4 8 7 13 #hazmat 24 56 7 16 4 9 #all residential bldgs 16,899 74 4,361 19 2,612 11 #all non-residential bldgs 103 58 87 49 8 5 $all residential bldgs (mil) 2,418.38 76 640.39 20 355.10 11 $all non-res bldgs (mil) 115.75 28 160.69 39 37.14 9

COASTAL BEND MITIGATION ACTION PLAN 81
10. Map 23 Data Source: Bureau of Economic Geology, University of Texas at Austin. Texas Coastal Hazards Atlas Vol. 2 (2001), Vol. 3 (2003) . 11. Map 24 Source: Texas General Land Office. Coastal Texas 2020 Region IV Map of Critical Areas. February 2005. 12. NFIP Policies in Force Data Source: Federal Emergency Management Agency, Flood Insurance Administration. 2004. Community Status Book. 13. Dam Breach Analyses Data Sources: U.S. Bureau of Reclamation. August 1999. Choke Canyon Dam and Reservoir Emergency Action Plan, and City of Corpus Christi. November 1998. Breach Analysis Report: Wesley Seale Dam. 14. Map 29 Data Source: U.S. Department of Agriculture, Forest Service. July 1999. “National Fire Danger Rating System Fuel Model Map.”
Chapter 3: Mitigation Strategy Section 1. Goals and Objectives A. Introduction Three principles guided the Planning Team during the development of mitigation goals and objectives: (1) MULTI-HAZARDS APPROACH As demonstrated by the foregoing analysis, the Coastal Bend region is at risk from a variety of natural hazards. The following goals and objectives reflect a multi-hazards approach, that is, they are not stated as specific to a particular hazard, although the mitigation activities identified may relate directly to one or more hazard. For example, the objective to reduce obstacles to evacuation pertains to hurricane and flood risk areas. In addition, many of the objectives also relate to other types of hazards not discussed in this plan, such as terrorism, and other human-caused disasters. (2) LONG TERM VISION The Planning Team also attempted to develop a set of goals and objectives that are comprehensive enough to serve the Coastal Bend communities over the long term. Potential mitigation activities are not currently identified for all the stated objectives. It is hoped that by taking the long view, a framework has been provided on which to build in the future. (4) PROTECT NEW AND EXISTING BUILDINGS
Objectives 3.5 and 3.6 below pertain to new and existing development, as well as the mitigation actions associated with those objectives. In addition, all jurisdictions enforce City Ordinances or Commissioner Court Orders with respect to floodplain management, and where not specified as a particular mitigation strategy, will monitor repetitive loss data and participate in opportunities to either buy out or flood proof (elevate) homes, when feasible. In addition, coastal jurisdictions enforce dune protection related Ordinances/Orders, which serve to protect existing structures from the full brunt of hurricane surge. Mitigation actions have also been identified to adopt the 2003 International Building Codes; however, many of the participating cities have already adopted the 2003 IBC codes, which will serve to not only ensure that future construction is more disaster-resistant, but will also affect existing buildings that are substantially damaged in the future and will be rebuilt to meet the

COASTAL BEND MITIGATION ACTION PLAN 82
stricter codes. Finally, a number of other mitigation strategies identified associated with reducing economic losses from natural hazards (Objective 3.4) pertain to protecting existing buildings. C. Goals
(1) GOAL: TO REDUCE LOSS OF LIFE AND INJURY TO PERSONS.
Objective 1.1 Improve the delivery and effectiveness of warning messages. Objective 1.2 Preserve public and private emergency response capability (9-1-1, law enforcement, fire services, emergency medical services, hospitals). Objective 1.3 Utilize available mitigation measures to prevent or reduce life-threatening impacts of natural hazards. Objective 1.4 Reduce obstacles to timely and safe evacuation of hazard areas. Objective 1.5 Reduce vulnerability of individuals living in mobile homes/manufactured housing. Objective 1.6 Reduce life- or health-threatening impacts on individuals with special physical care requirements. Objective 1.7 Reduce secondary impacts to health and safety from cascading effects. (2) GOAL: TO REDUCE DISRUPTIONS TO ESSENTIAL PUBLIC SERVICES AND
INFRASTRUCTURE.
Objective 2.1 Minimize disruption to and enhance rapid restoration of utilities. Objective 2.2 Minimize disruption to and enhance rapid restoration of essential transportation infrastructure. Objective 2.3 Minimize disruption to governmental, educational, and other institutions providing services to the public. (3) GOAL: TO REDUCE ECONOMIC IMPACTS TO INDIVIDUALS, BUSINESSES, AND AREA
INSTITUTIONS.
Objective 3.1 Increase home- and business-owner investment in available mitigation measures for private property. Objective 3.2 Increase home- and business-owner participation in available insurance protection options. Objective 3.3 Increase public and private sector development and use of operations continuity strategies. Objective 3.4 Utilize available mitigation measures to prevent or reduce economic losses from natural hazards. Objective 3.5 Reduce vulnerability of existing development by participating in buy-out or flood-proofing opportunities

COASTAL BEND MITIGATION ACTION PLAN 83
Objective 3.6 Reduce vulnerability of future development by utilizing available planning and structural standards. (4) GOAL: TO REDUCE LOSSES TO CIVIC, CULTURAL, AND ENVIRONMENTAL
RESOURCES.
Objective 4.1 Protect public investment in community-owned facilities and infrastructure through appropriate structural, non-structural, and financial methods. Objective 4.2 Reduce future losses to the non-profit sector through participation in available mitigation opportunities. Objective 4.3 Reduce vulnerability of historically or culturally significant structures. Objective 4.4 Minimize environmental impacts from cascading effects.
Section 2. Mitigation Actions Identification and Evaluation A. Identification Process
Working from the goals and objectives list, the Planning Team spent three meetings considering the full range of mitigation activities associated with each objective. Part of the initial planning meeting was devoted to the attendees reviewing the projects listed in the original CBMAP and discussing projects to be identified in the updated plan. As a result of these brainstorming sessions, a list of potential mitigation projects was compiled to serve as the basis of further discussion and evaluation. Additional discussions were held in subsequent Planning Team meetings to identify a set of regional mitigation projects, in which many or all of the jurisdictions could participate. These were subsequently evaluated and prioritized using the procedure outlined below. In addition, local meetings were held in many of the participating jurisdictions, to which other government staff and local stakeholders were invited. Using the potential projects list as a basis for discussion, a set of jurisdiction-specific mitigation alternatives was initially developed, facilitated by project staff. Ideas generated in the local meetings often went beyond those of the original potential projects list, although the list did serve to stimulate discussion and active participation by those attending. Finally, information was solicited from the regional office of the Texas Department of Transportation pertaining to ongoing and future projects that related to mitigation in some aspect. These latter projects did not undergo a formal evaluation/prioritization process, but do reflect the level of state and local commitment to natural hazard mitigation in the region. B. Evaluation/Prioritization
During the Planning Team and local meetings described above, the first level of evaluation was occurring, as options were identified as feasible or not feasible, whether due to political, economic, or technical reasons. One of the strategies used with some success was to attempt to focus on realistic, achievable results. In some cases this consisted of at least identifying a tangible first step toward a longer term, larger effort. Many of the communities involved in the planning project are quite small, with very limited resources.

COASTAL BEND MITIGATION ACTION PLAN 84
A second level of evaluation occurred in the communities, as the Hazard Mitigation Coordinators consulted with local government officials, departmental staff, and other local agencies to further refine project selection and scope. Finally, the evaluation prioritization instrument was used, to assist in subjectively weighing the benefits and costs of potential mitigation actions. A copy of the form is provided in Appendix C. Points assigned to associated benefits are divided by the points assigned to associated costs. The theoretically maximum possible score is a 4.0. The intent was to highlight the top and bottom ranges, and therefore a score of 1.0 or below was ranked as Low Priority; a score of 2.0 or above was ranked as High Priority; a score between 1.0 and 2.0 was ranked as Medium Priority. Participants were asked to score the criteria in light of their own jurisdiction’s resources; therefore, no specific definitions are provided for the criteria. For example, dollar cost was one of the factors considered in the ranking that would vary in interpretation from jurisdiction to jurisdiction. C. Mitigation Projects
The identification, evaluation, and prioritization process resulted in a set of identified projects. Some of these are already in process, some are in the planning phase, and some do not have funding secured. In the case of the latter, they are included as an incentive to further identification and pursuit of funding opportunities. Project descriptions are included in Appendix D. An Index by Project Number, a Cross-reference by Participating Jurisdiction, and a Cross-reference by Hazard are provided in the beginning of Appendix D. At least one project is identified per jurisdiction seeking approval under this regional mitigation action plan. Summary tables, arranged by objective, are found on the following pages. The tables include project number, participating jurisdiction(s), brief project description, responsible lead agency, and project priority. Further information as to cost and time frame may be found in the full project descriptions found in Appendix D. Note that actions indicated with an asterisk (*) below are multi-objective actions, which are repeated for each relevant objective. D. Ongoing Activities
In addition to specific mitigation projects, ongoing participant activities and programs implement mitigation measures on a routine basis. Under the provisions of Texas state law, the authorities granted to cities for regulation and enforcement are generally more extensive than those granted to counties; however, in some cases, specific authorizations for enforcement are granted to counties. Some jurisdictions have also identified mitigation projects which relate directly to these activities. See Section 3, Plan Implementation and Maintenance below for a matrix of available mechanisms and specific projects by participating jurisdiction. The following is a brief synopsis of these mechanisms and their relation to mitigation: (1) CAPITAL IMPROVEMENTS PROGRAMS/BUDGETS
Capital improvements budgets reflect investment in infrastructure and represent a mechanism available to both municipalities and counties. Funding may be provided through issuance of bonds or certificates of obligation. Specific projects may relate directly to mitigation (such as seawall repairs, storm water system improvements) or indirectly (such as road and bridge enhancements which mitigate flooding and/or enhance evacuation).

COASTAL BEND MITIGATION ACTION PLAN 85
(2) COMPREHENSIVE PLANS
Comprehensive land use planning is a mechanism available to cities which is implemented through subsequent zoning and permitting processes. Although ideally, future land use plans would exclude residential development in areas of high hazard, in reality land use planning must balance mitigation with other community goals, within state and federal regulatory frameworks. (3) ZONING
Zoning is an instrument granted by the State of Texas which allows cities to develop in a comprehensive and coordinated manner. Zoning ordinances aid rational land utilization and economic provision of public facilities and services. Zoning decisions should take hazard areas into consideration when applicable. (4) BUILDING CODES
Building codes are construction standards which are adopted by cities and implemented through permitting and inspection processes. There is no statewide uniform building code in the State of Texas. As has been repeatedly demonstrated in national hurricane post-storm assessments, building codes and code enforcement have a direct impact on the level of structural damages sustained from extreme winds and hurricane surge. Although older homes may have been built under less stringent codes in the past, ordinance provisions may require that substantially damaged homes be brought up to the current code during repair. Although building codes are not a mechanism available to counties, two other state programs
serve to mitigate structural damage in unincorporated areas of counties. If a homeowner located in the coastal counties (Aransas, San Patricio, Nueces, Kleberg) wishes to purchase wind and hail insurance coverage through the Texas Windstorm Insurance Association (TWIA), then newly

COASTAL BEND MITIGATION ACTION PLAN 86
built, remodeled, repaired or reroofed structures must be inspected and certified to meet the TWIA Building Code for Windstorm Resistant Construction. Map 30: Designated Catastrophe Areas, Texas Department of Insurance A second program is conducted by the Texas Residential Construction Commission for the purpose of “providing Texas homeowners and the residential construction industry an opportunity to resolve differences through a neutral dispute resolution process.” To administer this program, the Commission has adopted standards, including the International Residential Code (IRC) for: “residential construction located in an unincorporated area not in the extraterritorial
jurisdiction of a municipality, the version of the IRC applicable to non-electrical aspects of residential construction in the municipality that is the county seat of the county in which the construction is located and which is effective on the date of commencement of construction of the home.”
This latter program is relatively recent, and its future impact is unknown. (5) SUBDIVISION/SITE DEVELOPMENT REGULATIONS In addition to building codes and zoning, cities may adopt ordinances relating to development of subdivisions which may also have direct or indirect mitigating effects. For example, they may specify set asides for parks or green spaces which may serve to reduce storm water runoff and reduce flooding, or require buried electrical utilities which may serve to reduce injuries. Counties have limited powers for such regulation, and as a result, Texas has seen an influx of sub-standard developments known as “colonias” where, in addition to sub-standard housing construction and inadequate water and sewer services, inadequate drainage commonly results in flooding and related health hazards. These conditions can only be exacerbated by natural disasters. (5) FLOODPLAIN REGULATIONS
All project jurisdictions are participating in the National Flood Insurance Program and therefore have ordinances or Commissioners Court orders in effect to regulate development in floodplains for the purpose of reducing future losses from flooding. Currently, only the City of Corpus Christi is participating in the Community Rating System, which provides participants with not only the opportunity to enhance floodplain management, but also to receive credit for doing so in the form of reduced flood insurance premiums for homeowners. (6) MASTER DRAINAGE/STORM WATER PLANS
As demonstrated by the summary of disaster events, economic losses can result from both catastrophic flooding events and more frequently occurring and less severe rainfall events. These impacts can be reduced to some extent through improved drainage and/or enhanced capacity of the storm water system. Master drainage plans, where they exist in the study area, range from identification of priority drainage projects to sophisticated engineering analyses to guide future development. Texas law provides for the establishment of drainage districts with responsibility for flood control; within the study area there are two such active drainage districts in Nueces County, in the areas of Bishop and Robstown, and one in San Patricio County.

COASTAL BEND MITIGATION ACTION PLAN 87
(7) FIRE PREVENTION MEASURES
Cities may enact ordinances prohibiting outdoor burning and use of fireworks, as well as other measures such as brush clearance. Counties are authorized to enact outdoor burning and fireworks bans for all or portions of unincorporated areas by action of their Commissioners Courts when conditions warrant. There is no statewide Fire Code in Texas, but cities may adopt local Fire Codes for the purposes of fire prevention. (8) DROUGHT CONTINGENCY MEASURES
By Act of the Texas Legislature during 1997, formal regional water supply planning is conducted by the Coastal Bend Regional Water Planning Group. The same legislation, since amended, requires preparation of Drought Contingency Plans by public water supply retailers and wholesalers. The plans must establish triggers for drought emergencies and corresponding response actions, including either voluntary or mandatory water use restrictions. The City of Corpus Christi Water Department supplies water for municipal and industrial use in a seven county service that corresponds to our study area. Major raw water customers include Alice, Beeville, and the San Patricio Municipal Water District. Treated water customers include Nueces County Water Improvement District No. 4 (Port Aransas), San Patricio Municipal Water District, South Texas Water Authority and the Violet Water Supply District. All cities within the study region obtain their water either directly or indirectly from Corpus Christi with the exception of George West, Orange Grove, and Premont. In addition to mandatory drought management measures required by City of Corpus Christi Ordinance for its own residents, under terms of contracts with its wholesale customers, the customers are required to issue a public notice advising its retail customers of required drought management measures when combined reservoir system storage levels fall below 40%. With respect to water supplies, water is drawn from the Lake Corpus Christi and Choke Canyon Reservoir System, both within the Nueces River Basin, and from Lake Texana via the Mary Rhodes Pipeline. Additional water rights have been purchased by the City of Corpus Christi in the Colorado River from the Garwood Irrigation Company. This water will be transported to Corpus Christi via a pipeline that will be constructed in the future from the Colorado River to the Mary Rhodes Pipeline at Lake Texana. Other water supplies in the region are from groundwater wells, and other municipal public water suppliers are also subject to the drought contingency requirements. (10) COASTAL DEVELOPMENT REGULATIONS State legislation passed in the early 1990's requires local governments within the coastal zone to adopt dune protection and beach access programs for management of the beach/dune system in their jurisdiction. Statewide, the Beach Access and Dune Protection Program is administered by the Texas General Land Office and is designed to:
1. Help beachfront property owners and local governments maintain a healthy beach/dune system
2. Assist local governments in managing the Texas coast so that the interests of both the public and private landowners are protected
3. Reduce the erosion of public beaches and discourage erosion-response methods such as rigid shorefront structures that can have a harmful impact on the environment and public and private property
4. Reduce flood losses and minimize loss of life and property 5. Protect the public's right of access to, use of, and enjoyment of the public beach

COASTAL BEND MITIGATION ACTION PLAN 88
6. Ensure timely and predictable governmental decision-making and permitting processes 7. Educate the public about coastal issues
In addition, the Texas General Land Office administers the Texas Coastal Management Program, designed to meet requirements for participation in the federal coastal zone management program. Several grants have been awarded in the past under this program to Coastal Bend communities for erosion control and beach nourishment projects.
Section 3. Plan Implementation and Maintenance A. Implementation and Integration
Each project has a designated lead agency that is assigned responsibility for implementation, as indicated on the preceding matrices and in the full project descriptions found in Appendix D. The County Judge or Mayor/City Manager, as appropriate, is assigned responsibility by the Adoption Resolution for ensuring integration with other planning mechanisms, under their state-assigned role of Emergency Management Director for their jurisdiction. Participating jurisdictions will integrate implementation of their mitigation action plans with other, existing planning mechanisms such as capital improvement plans, long range growth plans, master stormwater and drainage plans, and regional planning efforts. Jurisdictions will ensure that the actions contained in the mitigation action plans are reflected in these other planning efforts. These other planning efforts will be used to advance the mitigation strategies of the jurisdictions. The Hazard Mitigation Coordinator for the jurisdiction shall monitor the review cycle of the jurisdiction’s planning documents and ensure that the County Judge, Mayor, or City Manager is notified of relevant pending mitigation projects. The County Judge, Mayor, or City Manager shall direct the responsible County or City department or agency to review the relevant project and prepare a recommendation as to including the project in the related planning document (if not already included). The County Judge, Mayor, or City Manager shall consider the recommendation in light of the community's overall priorities and availability of resources, and shall direct department staff to incorporate the requirements of the mitigation plan when appropriate. The matrix at the end of this section identifies planning mechanisms available by jurisdiction, and indicates not only specifically identified mitigation projects, but also refers to ongoing, routine activities summarized in the previous section. B. Plan Monitoring and Review
The Coastal Bend Council of Governments (CBCOG) has adopted a resolution to provide for ongoing administrative support of the Coastal Bend Mitigation Action Plan, and a copy of the resolution is included in Appendix E. Among the provisions, the COG will host an annual meeting of project participants, not later than September 30th of each year following final adoption of this plan. In preparation for the regional meeting, each jurisdiction’s Hazard Mitigation Coordinator will conduct an independent review of the status of its mitigation projects, provide input for mitigation strategy evaluation, and identify any new mitigation opportunities. A Mitigation Action Evaluation form has been developed for this purpose, and a copy is included in Appendix F. For those completed projects with a measurable benefit in terms of future loss reduction, participants will quantify effectiveness based on benefit/cost. For those completed projects less easily quantified, participants will provide a qualitative assessment of the benefit in relation to the cost, to include any post-disaster observations.

COASTAL BEND MITIGATION ACTION PLAN 89
C. Plan Maintenance
The mitigation plan is required to be reviewed, evaluated, and updated on a five-year cycle. At the annual regional meeting described above, data will be collected and maintained by CBCOG from the participating jurisdictions. A Mitigation Strategy Evaluation form has been developed for this purpose, and a copy is included in Appendix F. Information to be provided annually includes: 1. Disaster event related information, if any occurred
2. Events, physical changes or additional studies affecting the hazard analysis
3. Additional mitigation projects identified
4. Additional goals or objectives identified
5. Integration with other planning mechanisms
6. Updated repetitive flood loss claims
7. Enhancements to GIS capabilities
8. Changes to critical facilities
9. Newly available relevant data
10. Newly available relevant studies
11. Changes to regulations
12. Changes to NFIP status
13. Overview of implementation efforts
14. Mitigation projects started/completed
15. Overview of implementation plans for the coming year
16. Recommendations for changes to the planning process
The CBCOG will maintain records of the annual plan reviews, and coordinate the preparation and submission of the updated plan on a five-year cycle. During this process, the CBCOG will provide for ongoing opportunities for public involvement, and the local jurisdictions will incorporate an opportunity for local public review and comment during its adoption process.

COASTAL BEND MITIGATION ACTION PLAN 90
Appendix A
Inter-local Agreement
COASTAL BEND MITIGATION ACTION PLAN INTERLOCAL COOPERATION AGREEMENT
WHEREAS, the Coastal Bend Council of Governments, on behalf of the Corpus Christi Bay Coalition, applied for a Pre-Disaster Mitigation Program grant from the State of Texas Division of Emergency Management to prepare the Coastal Bend Mitigation Action Plan; and
WHEREAS, an approved Mitigation Action Plan is needed to make a local jurisdiction eligible for the Post-Disaster Hazard Mitigation Grant Program (HMGP) funding; and
WHEREAS, an approved Mitigation Action Plan may makes local jurisdictions eligible for the Pre-Disaster Mitigation (PDM) Program, if funding becomes available in the future; and
WHEREAS, a Mitigation Action Plan will provide guidance to Participating Jurisdictions, but does not require a specific financial commitment by the Participating Jurisdictions.
This Coastal Bend Mitigation Action Plan Inter-local Cooperation Agreement (“Agreement”) is made and entered into by the Coastal Bend Council of Governments and the counties and municipalities listed on Exhibit A, which is attached to and incorporated into this Agreement.
1. Purpose of Agreement.
a. The purpose of this Agreement is develop the Coastal Bend Mitigation Action Plan ("Plan") that will be used by the Participating Jurisdictions.
(1) The Plan will be developed under the project requirements and guidelines issued by the State of Texas Division of Emergency Management (DEM), and the Federal Emergency Management Agency (FEMA).
(2) Once completed the Plan will be presented to the State Hazard Mitigation Officer for review, and to FEMA for approval under the provisions of the Disaster Mitigation Act of 2000 (DMA 2000).
b. This Agreement outlines the responsibilities and commitments of the Participating Jurisdictions, which are needed to create the Plan.

COASTAL BEND MITIGATION ACTION PLAN 91
c. This Agreement structures the coordination between the representatives of the Participating Jurisdictions who will develop the Plan.
d. This Agreement pertains solely to the development of the Plan.
2. Period of Agreement
a. This Agreement becomes effective as to each Participating Jurisdiction when approved and executed by that Participating Jurisdiction.
b. This Agreement remains in effect for one year for each Participating Jurisdiction, but the Agreement is automatically renewed and will continue in full force and effect and will remain binding on each Participating Jurisdiction unless the governing body of the Participating Jurisdiction withdraws from this Agreement under Section 6 of this Agreement.
c. Withdrawal from this Agreement by any Participating Jurisdiction does not affect the continued operation of this Agreement between and among the remaining Participating Jurisdictions and this Agreement shall continue in force and remain binding on the remaining Participating Jurisdictions.
d. Under the provisions of DMA 2000, a Plan, which has been approved by FEMA, must be reviewed, revised, if appropriate, and resubmitted for a new approval within five years in order for a Participating Jurisdiction to remain eligible for post-disaster HMGP funding.
e. It is the intent of the Participating Jurisdictions to review, revise, and resubmit the Plan as needed to remain eligible for post-disaster HMGP funding.
3. General Provisions
a. The Participating Jurisdictions, individually and collectively, agree to provide the necessary resources to meet its obligations, performance requirements, and to accomplish the following tasks:
(1) Joint Responsibilities.
(a) Each Participating Jurisdiction shall designate a Hazard Mitigation Coordinator to serve as the jurisdiction’s point of contact for this project.
(b) Each Participating Jurisdiction shall make personnel available to the project for data collection activities, reviewing and evaluating results of analyses, developing and evaluating mitigation strategies, accepting public comment, reviewing plan documents, attending planning meetings, and other tasks that may arise.

COASTAL BEND MITIGATION ACTION PLAN 92
(c) Each Participating Jurisdiction must ensure that they have provided their share of the 25% match, required for the Pre-Disaster Mitigation Program grant, through in-kind contributions.
(2) Responsibilities of the individual participating jurisdictions. In order to obtain Federal plan approval their Mitigation Action Plan includes:
(a) Each Participating Jurisdiction must document that the individual jurisdiction has actively participated in the planning process that created the Mitigation Action Plan.
(b) Each Participating Jurisdiction must document that the individual jurisdiction formally adopted the Mitigation Action Plan.
b. Responsibilities of the Coastal Bend Council of Governments.
(1) Coastal Bend Council of Governments shall manage the Pre-Disaster Mitigation Program grant and designate the Local Project Officer.
(2) Coastal Bend Council of Governments shall provide fiscal oversight of the grant funds, including submitting timely financial reports, remitting accounts payable, providing quarterly financial reports, and quarterly progress reports to the DEM Project Officer.
(3) Coastal Bend Council of Governments shall coordinate meetings of the Project Steering Committee, other general and subcommittee meetings, and public meetings
(4) Coastal Bend Council of Governments shall maintain a Website to share information and project status with Participating Jurisdictions and the general public.
(5) Coastal Bend Council of Governments shall provide training and technical assistance to Participating Jurisdictions, as needed.
(6) Coastal Bend Council of Governments shall provide staff support to maintain project documentation, prepare informational materials, and draft the Plan.
(7) Coastal Bend Council of Governments shall obtain technical support, in consultation with the other Steering Committee.
(8) Coastal Bend Council of Governments is not responsible for preparation and submittal of individual “Annex P” to the Emergency Operations Plans for other Participating Jurisdictions.

COASTAL BEND MITIGATION ACTION PLAN 93
(9) Coastal Bend Council of Governments is not responsible for formulation of jurisdiction-specific mitigation action strategies for other Participating Jurisdictions.
(10) Coastal Bend Council of Governments is not responsible for final acceptance or rejection of the Plan, with respect to an individual Participating Jurisdiction, if the Participating Jurisdiction fails to provide the required information or meets its obligations under subsections a and c of this section.
c. Responsibilities of Hazard Mitigation Coordinators:
(1) The Hazard Mitigation Coordinators shall document the match provided by their jurisdiction in a format that is consistent with FEMA requirements and submit the required documentation in a timely manner to the Local Project Officer.
(2) The Hazard Mitigation Coordinators shall serve as the point of contact for their jurisdiction.
(3) The Hazard Mitigation Coordinators shall serve on the Steering Committee and participating in Steering Committee meetings.
(4) The Hazard Mitigation Coordinators shall coordinate the implementation of the Plan within their jurisdiction.
d. Outcome Measures of Success. The success of this initiative will be measured by the ability of the Participating Jurisdictions to:
(1) Establish a coordinated and effective effort for disaster mitigation planning and implementation in the tri-county region
(2) Implement a comprehensive Coastal Bend Mitigation Action Plan to reduce the losses from disasters for the residents of the tri-county region over the long term.
(3) Obtain Federal approval of plan and qualify for HMGP funding for disasters declared after November 1, 2010, and any Pre-Disaster Mitigation Grant Program funding, which may become available in the future.
4. Allocation of Costs.
a. Each Participating Jurisdiction is responsible for covering expenses it incurs and their share of costs associated with the performance of the terms and responsibilities, except for those direct project expenses provided for in the Pre-Disaster Mitigation Program grant.

COASTAL BEND MITIGATION ACTION PLAN 94
b. All expenses incurred by a Participating Jurisdiction must be documented as in-kind contributions to the project and submitted to the Local Project Officer, and will be used to meet the 25% match required for the grant.
c. A Participating Jurisdiction is not obligated to pay or reimburse any expense incurred by any other Participating Jurisdiction under this Agreement.
5. Amendment of Agreement.
a. This Agreement may be amended at any time.
b. Any amendment to this Agreement must be in writing and agreed to by the governing bodies of all Participating Jurisdictions.
c. No officer or employee of any of the Participating Jurisdictions has authority to waive or otherwise modify the limitations in this Agreement, without the express action of the governing body of the Participating Jurisdiction.
6. Withdrawal.
a. A Participating Jurisdiction may withdraw from this Agreement upon thirty (30) days written notice to the Local Project Officer, transmitting a copy of the action of the Participating Jurisdiction’s governing body.
b. If the withdrawal is due to material or significant breach of any of the provisions of this Agreement, a Participating Jurisdiction may withdraw immediately upon delivery of written notice to the Local Project Officer.
7. Damages. It is expressly understood and agreed that nonperformance of this Agreement may not give rise to any claim for costs or damages by any Participating Jurisdiction.
8. Participation Notice. Each Participating Jurisdiction shall notify the Local Project Officer of its participation in this Agreement by furnishing an executed original of the attached Participation Notice.
9. Administrative Services. The Coastal Bend Council of Governments agrees to provide administrative services necessary to coordinate this Agreement, including timely notifying Participating Jurisdictions of new participants and withdrawals, and providing Participating Jurisdictions with a current list of contact information for each Participating Jurisdiction.
10. Federal and State Participation. Federal and state entities may participate in this Agreement, to the extent of any limitations of their authority, by furnishing an executed original of the attached Participation Notice to the Local Project Officer.

COASTAL BEND MITIGATION ACTION PLAN 95
11. Not for Benefit of Third Parties. This Agreement and all activities under this Agreement are solely for the benefit of the Participating Jurisdictions and not the benefit of any third Parties.
12. Exercise of Police Power. This Agreement and all activities under this Agreement are undertaken solely as an exercise of the police power of the Participating Jurisdictions, exercised for the health, safety, and welfare of the public generally, and not for the benefit of any particular person or persons, and the Participating Jurisdictions do not have nor be deemed to have any duty to any particular person or persons.
13. Immunity Not Waived. Nothing in this Agreement is intended, nor may it be deemed, to waive any governmental, official, or other immunity or defense of any of the Participating Jurisdictions or their officers, employees, representatives, and agents as a result of the execution of this Agreement and the performance of the covenants contained in this Agreement.
14. No Liability of Participating Jurisdictions to Other Participating Jurisdictions. One Participating Jurisdiction may not be responsible and may not be civilly liable to another Participating Jurisdiction for any act or omission under this agreement. Each Participating Jurisdiction to waives all claims against the other Participating Jurisdictions to for compensation for any loss, damage, personal injury, or death occurring as a consequence of the performance of this Agreement.
15. Captions. Captions to provisions of this Agreement are for convenience and shall not be considered in the interpretation of the provisions.
16. Expending Funds.
a. Each Participating Jurisdiction which performs services or furnishes aid under this Agreement must do so with funds available from current revenues of the Participating Jurisdiction.
b. No Participating Jurisdiction shall have any liability for the failure to expend funds to provide aid under this Agreement.
17. Inter-local Cooperation Act. The Participating Jurisdictions agree that activities under this Agreement are “governmental functions and services” and that the Participating Jurisdictions are “local governments” as that term is defined in this Agreement and in the Inter-local Cooperation Act.
18. Entirety. This Agreement contains all commitments and Agreements of the Participating Jurisdictions with respect to the mutual aid to be rendered under this Agreement during or in connection with a disaster. No other oral or written commitments of the Participating Jurisdictions with respect to mutual aid under this Agreement shall have any force or effect if not contained in this Agreement, except as provided in Section 6 above.

COASTAL BEND MITIGATION ACTION PLAN 96
19. Severability. If a provision contained in this Agreement is held invalid for any reason, the invalidity does not affect other provisions of the Agreement that can be given effect without the invalid provision, and to this end the provisions of this Agreement are severable.
20. Validity and Enforceability. If any current or future legal limitations affect the validity or enforceability of a provision of this Agreement, then the legal limitations are made a part of this Agreement and shall operate to amend this Agreement to the minimum extent necessary to bring this Agreement into conformity with the requirements of the limitations, and so modified, this Agreement shall continue in frill force and effect.
21. Warranty. The Agreement has been officially authorized by the governing body of each Participating Jurisdiction to and each signatory to this Agreement guarantees and warrants that the signatory has full authority to execute this Agreement and to legally bind the respective Participating Jurisdiction to this Agreement.
22. Governing Law and Venue.
a. This Agreement shall be governed by the laws of the State of Texas.
b. Venue for an action arising under this Agreement shall be in accordance with the Texas Rules of Civil Procedure.

COASTAL BEND MITIGATION ACTION PLAN 97
EXHIBIT A
LIST OF PARTICIPATING JURISDICTIONS
City of Agua Dulce City of Alice City of Aransas Pass City of Beeville City of Bishop City of Corpus Christi City of Driscoll City of Fulton City of George West City of Gregory City of Ingleside City of Ingleside On The Bay City of Kingsville City of Lake City City of Lakeside City of Mathis City of Odem City of Orange Grove City of Port Aransas City of Portland City of Premont City of Robstown City of Rockport City of Sinton City of Taft City of Three Rivers Aransas County Bee County Jim Wells County Kleberg County Live Oak County Nueces County San Patricio County

COASTAL BEND MITIGATION ACTION PLAN 98
Appendix B. Project Meetings List of Project Meetings
Appendix B.
List of Project Meetings
Date Location Meeting Type
Feb 25, 2010 Corpus Christi Initial Planning Meeting
May 25, 2010 Corpus Christi Second Planning Meeting
Aug 5, 2010 Corpus Christi Third Planning Meeting
Sept 30, 2010 Corpus Christi Fourth Planning Meeting
Jan 25, 2011 Corpus Christ Project Update Meeting
Oct 26, 2011 Corpus Christi Project Timeline Realignment
Meeting
Coastal Bend Mitigation Action Plan
Initial Planning Meeting
Feb 25, 2010
Meeting Summary
An initial planning meeting was held with participating jurisdictions to collect hazards and
vulnerability data. A review and evaluation of mitigation projects, including those previously
identified, those not previously identified and future projects was discussed. Went over project
schedule, project cost share requirements, reviewed goals and objectives. Complete first quarter
timesheets.
Coastal Bend Mitigation Action Plan
Second Planning Meeting
May 25, 2010
Meeting Summary
During the second planning meeting, updates to projects were discussed along with discussion of
number of future projects to be added to CBMAP revision. Jurisdictions requiring any help were
asked to contact the Coastal Bend COG POC. Complete time sheets for second quarter.
Coastal Bend Mitigation Action Plan

COASTAL BEND MITIGATION ACTION PLAN 99
Third Planning Meeting
Aug 5, 2010
Meeting Summary
During the third planning meeting, continued to receive a few new projects from participating
jurisdictions. Conducted hands on workshops with numerous jurisdictions working on new
projects for CBMAP revision. Give out status of Mitigation Evaluation Assignments and
Timesheets.
Coastal Bend Mitigation Action Plan
Fourth Planning Meeting
Sept 30, 2010
Meeting Summary
During the fourth planning meeting, conducted in house training to those who had not been able
to attend all of the meetings on how to complete time sheets and reviewed projects that had been
submitted by some of the jurisdictions and returned for more information. Complete third quarter
time sheets.
Coastal Bend Mitigation Action Plan
Project Update Meeting
Jan 25, 2011
Meeting Summary
During project update meeting, it was discussed that an extension of plan was required to
complete the revision of the current CBMAP. Request sent to the state and request granted on
Mar 10, 2011 to extend to Dec 9, 2011.
Coastal Bend Mitigation Action Plan
Project Timeline Realignment Meeting
Oct 26, 2011
Meeting Summary
Meeting was conducted to discuss realignment of project timeline. Second extension was
requested and approved with timeline of August 8, 2012.

COASTAL BEND MITIGATION ACTION PLAN 100
( THIS PAGE INTENTIALLY LEFT BLANK)

COASTAL BEND MITIGATION ACTION PLAN 101
Appendix C.
Evaluation/Prioritization Criteria
Mitigation Action Prioritization Criteria
Project Name:
SCORE
Jurisdiction:
BENEFITS
1.
Rank the severity of potential losses this project is intended to prevent or
reduce.
Low Severity=1 Somewhat Low=2 Medium=3 Somewhat High=4
High=5
2.
Rank the urgency of this project (how likely there are to be losses in near
future).
Low Urgency=1 Medium Urgency=2 High Urgency=3
3.
Rank the % of population in hazard area this project will benefit.
Very Few=0 Some=1 Many=2 Most=3
4.
Rank the completeness of this solution in terms of its anticipated effect:
Marginal Impact=1 Significant Impact=2 Total Solution=3
5.
Rank the life expectancy of this solution:
Short term=1 Medium Term=2 Long term=3 Very Long Term=4
6.
How many mitigation objectives does this project address?
None=0 One=1 Two or more=2
7.
Does this project protect an essential emergency facility?
Yes=1 No=0
8.
Does this project address a 'special need'?
Yes=1 No=0
9.
Does this project protect an economic, cultural, or environmental resource?
Yes=1 No=0
10.

COASTAL BEND MITIGATION ACTION PLAN 102
Does this solution reflect state and federal priorities?
Yes=1 No=0
11.
TOTAL BENEFIT POINTS:
COSTS
12.
Will this solution be supported by the community?
Active Support=1 No objections=2 Minor objections=3 Major
objections=4
13.
Will this solution be politically acceptable?
Active Support=1 Acceptable=2 Mild resistance=3 Strong resistance=4
14.
What is the degree of regulatory review of this project?
None=1 Low=2 Medium=3 High=4
15.
Rank the overall complexity of the project:
Straightforward=1 Somewhat involved=2 Highly Complex=3
16.
How long will this project take to complete?
<1 year (1) 1-2 years (2) >2 years (3) Perpetual (4)
17.
Rank the cost of the project:
Very Low=1 Low=2 Medium=3 High=4 Very High=5
18.
TOTAL COST POINTS:
19.
BENEFIT/COST: (Line 11/Line 18; valid range is >0 to <=4.0)
20.
PRIORITY:
Benefit/cost: <=1.0:Low >1.0<2.0:Medium >=2.0:High

COASTAL BEND MITIGATION ACTION PLAN 103
Appendix D.
Mitigation Project Descriptions
Index by Project Number
INDEX BY PROJECT NUMBER
Regional Projects
RG-01 COMPLETE RG-02 IMPLEMENT HAZCOLLECT SYSYTEM RG-03 HOST COOP WORKSHOP RG-04 OUTREACH FOR NWR AWARENESS RG-05 COMPLETE
Aransas County AR-01 COMPLETE AR-02 ARANSAS COUNTY DRAINAGE MASTER PLAN AR-03 LIVE OAK PENINSULA MASTER DRAINAGE PLAN AR-04 LIVE OAK PENINSULA SHORELINE STABILIZATION STRATEGIC
PLAN AR-05 INTERGRATED STORMWATER MANAGEMENT PLAN AR-06 GENERATOR for FULTON HARBOR SEWER LIFT STATION AR-07 GENERATOR for FULTON TOWN HALL AR-08 GENERATOR for FULTON ELEMENTARY AR-09 GENERATOR for COUNTY ROAD and BRIDGE FUELING FACILITY AR-10 GENERATOR for ARANSAS COUNTY COURTHOUSE AR-11 ARANSAS COUNTY EOC BUNKER AR-12 GENERATOR for CHAPARRAL SEWER LIFT STATION AR-13 GENERATOR for AUSTIN STREET SEWER LIFT STATION AR-14 GENERATOR for GAGON STREET SEWER LIFT STATION
Bee County BE-01 COMPLETE BE-02 COMPLETE BE-03 SILVER CREEK BRIDGE BE-04 C.R. 628 BOX CULVERT BE-05 EMERGENCY WARNING SYSTEM BE-06 POESTA and MEDIO CREEK DRAINAGE PROJECT
Jim Wells County JW-01 JOINT ADVISORY COMMITTEE FOR DRAINAGE JW-02 PORTABLE ELECTRONIC ROAD SIGNS JW-03 FLOOD CONTROL SYSTEM MAINTENANCE JW-04 ROADSIDE TRAVELER’S ASSISTANCE JW-05 DRAINAGE STUDIES FOR C.R. 303, BARBON ESTATES JW-06 PORTABLE ELECTRONIC ROAD SIGNS JW-07 COMPLETE JW-08 REVERSE 911 JW-09 EMERGENCY GENERATOR for PUBLIC WATER SUPPLY JW-10 EMERGENCY GENERATOR for PUBLIC WATER SUPPLY

COASTAL BEND MITIGATION ACTION PLAN 104
JW-11 SAN DIEGO CREEK LEVEE CERTIFICATION SURVEY, LEVEE IMPROVEMENTS, O&M PLAN
JW-12 LAKE FINDLEY DAM MAINTENANCE, O&M PLAN JW-13 REPLACE and UPGRADE CITY WATER LINES JW-14 LAKE CORPUS CHRISTI PIPELINE MAINTENANCE JW-15 EMERGENCY GENERATOR for ALICE CITY HALL / EOC JW-16 OUTDOOR WARNING SYSTEM JW-17 OUTDOOR WARNING SYSTEM for CITY of ORANGE GROVE JW-18 REVERSE 911 SYSTEM
Kleberg County KL-01 INTERLOCAL AGREEMENT for 911 SERVICES KL-02 SURVEY PUBLIC FACILITIES for RETROFIT KL-03 ROADSIDE TRAVELER’S ASSISTANCE KL-04 JOINT ADVISORY COMMITTEE for DRAINAGE KL-05 DISASTER RESISTANT UNIVERSITY WORKSHOP KL-06 COMPLETE KL-07 OUTDOOR WARNING SYSTEM KL-08 COMPLETE KL-09 INFILTRATION and INFLOW STUDY for WASTE WATER TREATMENT KL-10 EMERGENCY GENERATOR for PUBLIC WATER SUPPLY KL-11 SHORELINE STABILIZATION at RIVIERA PARK KL-12 SAND BAGGING MACHINE KL-13 IMPROVE WATER DRAINAGE TO COUNTY ROADS, PCT 1and 3 KL-14 TRANSFER SWITCH for PORTABLE GENERATOR at KINGSVILLE
CITY HALL / EOC
Live Oak County LO-01 COMPLETE LO-02 COMPLETE LO-03 COMPLETE LO-04 COMPLETE LO-05 COMPLETE LO-06 DRAINAGE STUDY for LIVE OAK COUNTY AIRPORT AREA LO-07 COMPLETE LO-08 COMPLETE LO-09 COMPLETE LO-10 OUTDOOR WARNING SIRENS LO-11 COMPLETE LO-12 ENHANCE OUTDOOR WARNING SYSTEM LO-13 COMPLETE LO-14 COMPLETE
Nueces County NU-01 COMPLETE NU-02 COMPLETE NU-03 COMPLETE NU-04 COMPLETE NU-05 COMPLETE NU-06 COMPLETE NU-07 PROCEDURES for ACCESSING EMERGENCY NOTIFICATION
SYSTEM

COASTAL BEND MITIGATION ACTION PLAN 105
NU-08 OUTDOOR WARNING SIRENS NU-09 EMERGENCY GENERATORS for WASTE WATER LIFT STATIONS NU-10 DELETED NU-11 COORDINATE WITH DRAINAGE DISTRICT #3 to ADDRESS FLOODING NU-12 USACE FEASIBILITY STUDY, COTULLA DIVERSION NU-13 USACE FEASIBILITY STUDY, TWO-WAY PIPELINE NU-14 LARGE SCALE DESALINATION STUDY NU-15 COMPLETE NU-16 COMPLETE NU-17 STORM WATER MASTER PLAN NU-18 MAJOR OUTFALL REPAIRS PHASE 1 NU-19 MAJOR OUTFALL REPAIRS PHASE 2 NU-20 MAJOR DRAINAGE CHANNEL IMPROVEMENTS NU-21 OBTAIN DRAINAGE RIGHT of WAYS NU-22 REPLACE FLOOD CONTROL PUMPS at POWER ST. PUMP STATION NU-23 FLOOD MAP MODERNIZATION PROGRAM / CTP COMMUNITY NU-24 ENHANCE COMMUNITY RATING SYSTEM (CRS) RATING NU-25 ENHANCE BCEG RATING NU-26 EMERGENCY GENERATORS for OSO WASTE WATER TREATMENT
FACILITY NU-27 FLOOD PROOF LIFT STATIONS at OSO WASTE WATER TREATMENT
FACILITY NU-28 FLOOD PROOF ELECTRICAL SYSTEMS at GREENWOOD WASTE
WATER NU-29 INSPECTION and MAINTENANCE at WESLEY SEALE DAM NU-30 COMPLETE NU-31 COMPLETE NU-32 COMPLETE NU-33 ELEVATE POWER TRANSFER SWITCH at POLICE DEPARTMENT
HEAD QUARTERS NU-34 UNITERRUPTIBLE POER SUPPLY SYSTEM for EOC NU-35 EVALUATE PARTICIPATION in the NFIP COMMUNITY RATING SYSTEM NU-36 REPLACE TRAFFIC SIGNALS NU-37 PURCHASE SATELLITE TELEPHONES NU-38 DELETED NU-39 DELETED NU-40 INCORPORATED MITIGATION into PUBLIC OUTREACH NU-41 ONGOING BULKHEAD MAINTENANCE and REPAIR NU-42 DELETED NU-43 STORM SHUTTER FOR EOC NU-44 ADOPT 2003 INTERNATIONAL BUILDING CODES NU-45 STUDY FEASIBILITY of SECOND ELECTRICAL SUB-STATION NU-46 STUDY FEASIBILITY of SECOND NATURAL GAS GATE NU-47 DELETED NU-48 COMPLETE NU-49 PREVENT EROSION of SUNFISH ISLAND NU-50 PREVENT EROSION of COLE PARK NU-51 COMMUNITY WILDFIRE RISK ASSESSMENT NU-52 COMMUNITY WILDFIRE PROTECTION PLAN NU-53 MASTER DRAINAGE IMPLEMENTATION PLAN NU-54 HURRICANE SHUTTERS for COUNTY FACILITIES NU-55 REPETITIVE FLOOD BUYOUT on NUECES RIVER NU-56 EMERGENCY GENERATOR for COUNTY COURTHOUSE

COASTAL BEND MITIGATION ACTION PLAN 106
NU-57 EMERGENCY GENERATOR for COUNTY EOC NU-58 EMERGENCY GENERATOR for COUNTY PUBLIC WORKS YARD NU-59 GASOLINE TANK for COUNTY PUBLIC WORKS YARD NU-60 GEOGRAPHICAL INFORMATION SYSTEM (GIS) ENHANCEMENT NU-61 SOCIAL VULNERABILITY STUDY NU-62 SPECIAL NEEDS PUBLIC EDUCATION and OUTREACH NU-63 ENERGENCY GENERATORS for LIFT STATIONS NU-64 LOCAL DRAINAGE PRIORITIZATION PLAN NU-65 ROAD ELEVATION and REPAIR NU-66 DEBRIS REMOVAL and DRAINAGE ENHANCEMENTS
San Patricio County SP-01 COMPLETE SP-02 FLOOD PROOF REPETITIVE LOSS HOMES SP-03 COMPLETE BUYOUT PROGRAM in PEACEFUL VALLEY,
SAN PATRICIO RIVER SP-04 OUTDOOR WARNING SIRENS SP-05 OBTAIN DRAINAGE RIGHT of WAYS on AVENUE A SP-06 OBTAIN DRAINAGE RIGHT of WAYS on CALIFORNIA STREET SP-07 COMPLETE SP-08 COMPLETE SP-09 COMPLETE SP-10 COMPLETE SP-11 COMPLETE SP-12 COMPLETE SP-13 DEVELOP DRAINAGE MASTER PLAN SP-14 COMPLETE SP-15 GENERATOR for TAFT FIRE DEPARTMENT SP-16 GENERATOR for TAFT CITY HALL / POLICE STATION SP-17 GENERATOR for MATHIS POLICE STATION SP-18 10,000 GALLON WATER TANK for LAKE CITY FIRE PROTECTION SP-19 GENERATOR for SINTON POLICE DEPARTMENT SP-20 GENERATOR for MATHIS CITY HALL SP-21 GENERATOR for GREGORY FIRE DEPARTMENT SP-22 GENERATOR for SINTON CITY HALL / FIRE DEPARTMENT /
EMS BUILDING SP-23 INSTALL DRY HYDRANT for LAKESIDE into LAKE CORPUS CHRISTI SP-24 GENERATOR for GREGORY CITY HALL / POLICE DEPARTMENT SP-25 GEMERATOR for ODEM FIRE DEPARTMENT SP-26 ELEVATE ROAD / CONSTRUCT BRIDGE in CITY of SAN PATRICIO
at NOPAL STREET and C.R. 60A SP-27 GENERATOR for ODEM CITY HALL SP-28 INSTALL DRY HYDRANT for LAKE CITY into LAKE CORPUS CHRISTI SP-29 ELEVATE ROAD / CONSTRUCT BRIDGE in CITY of SAN PATRICIO
at NOPAL STREET and C.R. 60B SP-30 INSTALL SEA GATES / RAIL GATES / MAINTENANCE PLAN SP-31 BACK-UP GENERATOR for CITY of ARANSAS PASS PUBLIC WORKS
DEPARTMENT SP-32 PUBLIC INFORMATION OUTREACH for CITY of ARANSAS PASS SP-33 EMERGENCY POWER GENERATION SP-34 COMMUNICATIONS/FIBER OPTIC LINE

COASTAL BEND MITIGATION ACTION PLAN 107
Cross-Reference by Hazard
Jurisdiction
Coastal Erosion
Dam Failure
Drought
(Water Supply)
Flood
Hurricane
Tornado
WILDFIRE
Aransas Co.
(unincorporated)
AR-04
AR-02,05, 09,10,11
AR-09,10,11
AR-09
10,11
13,14
Town of Fulton
AR-04
AR-03,06,07,08
AR-06,07,08
AR-06,07,08
City of Rockport
AR-04
AR-03,12,13,14
AR-12,13,14
AR-12,13,14
Bee Co.
(unincorporated)
BE-03,04,06
BE-05
City of Beeville
LO-03
Jim Wells Co.
(unincorporated)
JW-12
JW-14
JW-01, JW-03,
JW-05, JW-11
JW-04,JW-06,JW-08,
JW-16
City of Alice
JW-13
JW-01,JW-11
JW-12
City of Orange
Grove
JW-09
JW-17
City of Premont
JW-10
Kleberg Co.
(unincorporated)
KL-11
KL-13
KL-04,12
KL-02, KL-03
City of
Kingsville
KL-10
KL-04,KL-11,KL-12,KL-13
KL-09, KL-10
KL-07
Live Oak Co.
(unincorporated)
LO-06
LO-10

COASTAL BEND MITIGATION ACTION PLAN 108
City of George
West
City of Three
Rivers
LO-12
Nueces Co.
Agua Dulce,
Driscoll
NU-60,61,65
NU-60,61
NU-60,61
NU-53,55,60,61,
62,65,66
NU-54,56,57,58,59,60,
61,62,64,66
NU-54,58,60,
61,62,66
NU-51,52,
60,61,62
City of Bishop
NU-11
NU-09
NU-08 N
U-07
City of Corpus
Christi
NU-49, NU-50
NU-29
NU-12, NU-13, NU-14
NU-12, NU-13, NU-17,
18, 19, 20, 21 22,
23, 24
NU-15, NU-25, 26, 27, 28,
33,34,54
City of Port
Aransas
NU-41
NU-35,40
NU-36,37
City of
Robstown
NU-44,45
NU-45
San Patricio Co.
Gregory, IOB,
Lake City,
Lakeside,
Mathis, Odem,
San Patricio,
Sinton, Taft
SP-26,29,SP,30
SP-02, 03,26,29
SP-01,23,28
City of Aransas
Pass
SP-30
City of Ingleside
SP-05, SP-06
SP-04
SP-18
City of Portland
SP-13,33
SP-33,34
SP-33,34

COASTAL BEND MITIGATION ACTION PLAN 109
Project Number: RG-02 Project Name: Implement Hazcollect System Participating Jurisdiction(s): All Objective(s): Objective 1.1 related to improving the delivery and effectiveness of warnings. Priority: Medium Description/Background: Implement ‘All Hazards’ NOAA Weather Radio (NWR) procedures for dissemination of emergency messages originating with local jurisdictions. The National Weather Service (NWS) will implement a new, centralized point of collection for non-weather related emergency messages broadcast over NWS systems. NWS expects to deploy the All-Hazards Emergency Message Collection System, HazCollect, in the summer and fall of 2005. HazCollect will provide an information technology interface between state and local systems, and the NWS Advanced Weather Interactive Processing System (AWIPS). HazCollect will provide a fast, reliable way to inject messages into the Emergency Alert System (EAS) and NOAA Weather Radio. Lead/Participating Agencies: Corpus Christi Weather Forecast Office with Emergency Management and Public Safety agencies of participating jurisdictions. Cost/Funding: This is expected to be a no- to low-cost activity, limited to planning meetings and/or training funded from current budgets. Schedule: Autumn 2013

COASTAL BEND MITIGATION ACTION PLAN 110
Project Number: RG-03 Project Name: Host/participate in COOP Workshop Participating Jurisdiction(s): All Objective(s): Objective 2.3 related to minimizing disruption of government services; Objective 3.3 related to development and use of operations continuity strategies by the public and private sector. Priority: Medium Description/Background: Host a training workshop on Continuity of Operations (COOP) for local government representatives. Course description: G250.11 Workshop: Continuity of Operations (COOP) This 1-day module is designed to increase awareness and understanding of the need for continuity of operations plans for state and local government offices. Recent events have demonstrated that government buildings and offices can be closed for extended periods of time due to natural or manmade events. These closures negatively affect service delivery to the general public. The workshop focuses on identifying state and local government tasks that must continue should an incident affect the staff or location where the tasks are performed. The workshop introduces the benefits of public-private cooperation in COOP planning. This introduction to COOP planning also will help participants determine appropriate backup measures so that essential service delivery can continue. Lead/Participating Agencies: Regional Disaster District, with local government officials from all participating jurisdictions. Cost/Funding: Low cost may be associated with providing an instructor and printed materials, funded from state or federal training budgets. Schedule: The actual workshop is a one-day event. Follow on implementation activities may take 12 to 24 months.

COASTAL BEND MITIGATION ACTION PLAN 111
Project Number: RG-04 Project Name: Outreach for NWR Awareness Participating Jurisdiction(s): All Objective(s): Objective 1.1 related to improving delivery of warnings. Priority: Medium Description/Background: Promote public awareness and use of NOAA Weather Radio (NWR) to receive ‘All Hazards’ warnings by distributing NWR literature, posting information on jurisdiction Web sites, hosting special events, and taking advantage of other opportunities as they arise. The National Weather Service provides weather-related hazards warnings to citizens, both through feeds to commercial media via the Emergency Alert System (EAS), and directly into homes, businesses, schools and other locations through NOAA Weather Radio (NWR). Through the efforts of the Emergency Management programs in both Kleberg and Live Oak counties, broadcast coverage has recently been completed for the Coastal Bend region through installation of transmitters near the communities of Riviera and Three Rivers. These transmitters will also enhance reception of the NWR signals in Jim Wells and Bee counties. Lead/Participating Agencies: Corpus Christi Weather Forecast Office, in coordination with local Emergency Management Agencies. Cost/Funding: This activity is expected to be no- to low-cost, funded from current budgets. Schedule: Ongoing.

COASTAL BEND MITIGATION ACTION PLAN 112
Project Number: AR-02 Project Name: Aransas County Drainage Master Plan Participating Jurisdiction(s): Aransas County Objective(s): Objective 3.4 related to reducing economic losses. Priority: Medium Description/Background: Proceed with acquisition of easements to permit implementation of Drainage Master Plan. Six priority drainage projects have been identified in the Drainage Master Plan to reduce repeated flooding in poorly drained areas of the county. Lead/Participating Agencies: Aransas County Public Works Dept. Cost/Funding: Unknown at this time. Voluntary donations of 90% of the needed easements are being pursued. Schedule: Two - three years, depending on level of private, voluntary participation.

COASTAL BEND MITIGATION ACTION PLAN 113
Project Number: AR-03 Project Name: Live Oak Peninsula Master Drainage Plan Participating Jurisdiction(s): Town of Fulton, City of Rockport Objective(s): Objective 3.4 related to reducing economic losses. Priority: In Progress Description/Background: The City of Rockport recently completed a Master Drainage Plan for the Live Oak Peninsula, which has also been adopted by the Town of Fulton. The City of Rockport has also recently completed a $2.7 million drainage improvement project in south Rockport. As new street projects arise in the future, they will be built in accordance with the requirements of the Master Plan, to ensure that flooding is minimized. Lead/Participating Agencies: Rockport Public Works Dept. Cost/Funding: Costs would be those associated with future street improvement projects. Schedule: Ongoing

COASTAL BEND MITIGATION ACTION PLAN 114
Project Number: AR-04 Project Name: Live Oak Peninsula Shoreline Stabilization Strategic Plan Participating Jurisdiction(s): Aransas County, Town of Fulton, City of Rockport Objective(s): Objective 4.1 related to protecting public investment in community-owned facilities and infrastructure; Objective 4.4 related to minimizing environmental impacts. Priority: Medium Description/Background: Coastal erosion along the shoreline of Aransas Bay is threatening to undermine local roadways and recreational areas. A strategic plan to address this issue has been developed and adopted by the participating jurisdictions. The success of this project is only limited by availability of funding. There is a need to raise the grade of the roads in some areas. There are miles of public bay access and the potential to develop this area in a very nice fashion is quite great. The affected shoreline has been divided into 6 critical areas and prioritized. Priority 1: Broadway along Little Bay (City of Rockport) Priority 2: Fulton Beach Road, south of Fulton Harbor (City of Rockport) Priority 3: Fulton Beach Road, north of Fulton Harbor (Town of Fulton, Aransas County) Priority 4: Water Street (City of Rockport) Priority 5: Bayshore Drive on Key Allegro Island (City of Rockport) Priority 6: Shell Ridge Road (Aransas County) Lead/Participating Agencies: Aransas County, Fulton and Rockport Public Works Departments. Cost/Funding: Project estimate is in the range of $5 million to $25 million. Schedule: Completion of all 6 segments is expected to take several years.

COASTAL BEND MITIGATION ACTION PLAN 115
Project Number: AR-05 Project Name: Aransas County Intergrated Stormwater Management Plan Participating Jurisdiction(s): Aransas County, Town of Fulton, City of Rockport Objective(s): 1.4, Reduce obstacles to timely and safely evacuate hazard areas 2.2, Minimize disruption to and enhance rapid restoration of essential transportation infrastructure. Priority: Medium Description/Background: Aransas County is in the process of developing the Intergrated Stormwater Management Plan (ISWMP). Aransas County has historically experienced flooding problems due to its coastal location and topography. The ISWMP will identify problem areas and recommend improvement projects. Lead/Participating Agencies: Aransas County Road and Bridge Cost/Funding: $900,000.00, County Flood Control Fund. Coastal Impact Assistance Program Grant. Schedule: JANUARY 2013

COASTAL BEND MITIGATION ACTION PLAN 116
Project number: AR-06
Project name: Generator for Fulton Harbor Sewer Lift Station
Participating Jurisdiction(s): Town of Fulton
Objectives(s): To minimize disruption to and enhance rapid restoration of utilities
Priority: High
Description/Background: Town has lost power numerous times due to brownouts and high winds causing disruption of vital services. Install 30 KW generator to maintain continuity of public health services in case of loss of power due to brown outs or disaster related loss of power.
Lead Participating Agency: Town of Fulton
Cost Funding: $15,000 / Municipal Public Works Grants
Schedule: 6 months after procurement of Grant Funding

COASTAL BEND MITIGATION ACTION PLAN 117
Project number: AR-07
Project name: Generator for Fulton Town Hall
Participating Jurisdiction(s): Town of Fulton
Objectives(s): To minimize disruption to and enhance rapid restoration of continuity of Government
Priority: High
Description/Background: Town has lost power numerous times due to brownouts and high winds causing disruption of vital services. Install 100 KW generator to maintain continuity of Government services in case of loss of power due to brown outs or disaster related loss of power.
Lead Participating Agency: Town of Fulton
Cost Funding: $30,000 / Municipal or Homeland Security Grants
Schedule: 6 months after procurement of Grant Funding

COASTAL BEND MITIGATION ACTION PLAN 118
Project number: AR-08
Project name: Generator for Fulton Elementary
Participating Jurisdiction(s): Town of Fulton
Objectives(s): To minimize disruption to and enhance rapid restoration of continuity of Government as the Fulton Elementary serves as a Shelter of Last Resort in a Community Disaster
Priority: High
Description/Background: Town has lost power numerous times due to brownouts and high winds causing disruption of vital services. Install 100 KW generator to maintain continuity of Government services and Public Shelter in case of loss of power due to brown outs or disaster related loss of power.
Lead Participating Agency: Town of Fulton
Cost Funding: $30,000 / Municipal or Homeland Security Grants
Schedule: 6 months after procurement of Grant Funding

COASTAL BEND MITIGATION ACTION PLAN 119
Project number: AR-09
Project name: Generator for County Road and Bridge Fueling facility
Participating Jurisdiction(s): Aransas County
Objectives(s): To minimize disruption to and enhance rapid restoration of all Emergency Response and Public Services
Priority: High
Description/Background: Facility has lost power numerous times due to brownouts and high winds causing disruption of vital services. Install 100 KW generator to maintain continuity of Government services and enhance rapid restoration of all Emergency Response and Public Services in case of loss of power due to brown outs or disaster related loss of power.
Lead Participating Agency: Aransas County
Cost Funding: $30,000 / Homeland Security Grants
Schedule: 6 months after procurement of Grant Funding

COASTAL BEND MITIGATION ACTION PLAN 120
Project number: AR-10
Project name: Generator for Aransas County Courthouse
Participating Jurisdiction(s): Aransas County
Objectives(s): To minimize disruption to and enhance rapid restoration of Continuity of Government and all Emergency Response and Public Services
Priority: High
Description/Background: Facility has lost power numerous times due to brownouts and high winds causing disruption of vital services. Install 200 KW generator to maintain continuity of Government services and enhance rapid restoration of all Emergency Response and Public Services in case of loss of power due to brown outs or disaster related loss of power.
Lead Participating Agency: Aransas County
Cost Funding: $60,000 / Homeland Security Grants
Schedule: 6 months after procurement of Grant Funding

COASTAL BEND MITIGATION ACTION PLAN 121
Project number: AR-11
Project name: Aransas County EOC Bunker
Participating Jurisdiction(s): Aransas County
Objectives(s): To minimize disruption to and enhance rapid restoration of Continuity of Government and all Emergency Response and Public Services
Priority: High
Description/Background: Due to low ELEVATION there are only a few locations within Aransas County That provide a high enough elevation to construct a harden EOC facility to retreat to during a Natural Disaster. Purchase land, Design and Construct a Harden EOC facility to maintain Continuity of Government services and enhance rapid restoration of all Emergency Response and Public Services.
Lead Participating Agency: Aransas County
Cost Funding: $1.2 Million Dollars / Homeland Security or other available Grants
Schedule: 1 year after procurement of Grant Funding

COASTAL BEND MITIGATION ACTION PLAN 122
Project number: AR-12
Project name: Generator for Chaparral Sewer Lift Station
Participating Jurisdiction(s): City of Rockport
Objectives(s): To minimize disruption to and enhance rapid restoration of utilities
Priority: High
Description/Background: Rockport has lost power numerous times due to brownouts and high winds causing disruption of vital services. Install 30 KW generator to maintain continuity of public health services in case of loss of power due to brown outs or disaster related loss of power.
Lead Participating Agency: City of Rockport
Cost Funding: $15,000 / Municipal Public Works Grants
Schedule: 6 months after procurement of Grant Funding

COASTAL BEND MITIGATION ACTION PLAN 123
Project number: AR-13
Project name: Generator for Austin Street Sewer Lift Station
Participating Jurisdiction(s): City of Rockport
Objectives(s): To minimize disruption to and enhance rapid restoration of utilities
Priority: High
Description/Background: Rockport has lost power numerous times due to brownouts and high winds causing disruption of vital services. Install 30 KW generator to maintain continuity of public health services in case of loss of power due to brown outs or disaster related loss of power.
Lead Participating Agency: City of Rockport
Cost Funding: $15,000 / Municipal Public Works Grants
Schedule: 6 months after procurement of Grant Funding

COASTAL BEND MITIGATION ACTION PLAN 124
Project number: AR-14
Project name: Generator for Gagon Street Sewer Lift Station
Participating Jurisdiction(s): City of Rockport
Objectives(s): To minimize disruption to and enhance rapid restoration of utilities
Priority: High
Description/Background: Rockport has lost power numerous times due to brownouts and high winds causing disruption of vital services. Install 30 KW generator to maintain continuity of public health services in case of loss of power due to brown outs or disaster related loss of power.
Lead Participating Agency: City of Rockport
Cost Funding: $15,000 / Municipal Public Works Grants
Schedule: 6 months after procurement of Grant Funding

COASTAL BEND MITIGATION ACTION PLAN 125
Project Number: BE-03 Project Name: Silver Creek Bridge Participating Jurisdiction(s): Bee County Objective(s): 2.2 Minimize disruption to and enhance rapid restoration of essential transportation infrastructure. Priority: Medium Description/Background: Silver Creek road. Build a 100 foot bridge, 26 feet wide with a 45 degree skew. The low water crossing at Silver Creek road, across silver creek, floods during and after heavy rains, trapping approximately 30 people in the residences. Lead/Participating Agencies: Bee County Road and Bridge, Bee County OEM Cost/Funding: $250,000.00, Texas DOT or Federal Mitigation Grant Schedule: 2 TO 3 YEARS

COASTAL BEND MITIGATION ACTION PLAN 126
Project Number: BE-04 Project Name: C.R.628 Box Culvert Participating Jurisdiction(s): Bee County Objective(s): 2.2 Minimize disruption to and enhance rapid restoration of essential transportation infrastructure. Priority: Medium Description/Background: Build a box culvert with parallel wings on C.R. 628, Low water crossing washes out during heavy rains, causing erosion to road surface. Lead/Participating Agencies: Bee County Road and Bridge, Bee County OEM Cost/Funding: $70,200.00, Local budget, Texas DOT or Federal Mitigation Grant Schedule: 2 TO 3 YEARS

COASTAL BEND MITIGATION ACTION PLAN 127
Project Number: BE-05 Project Name: Emergency Warning System Participating Jurisdiction(s): Bee County / City of Beeville Objective(s): 1.1 Improve the delivery and effectiveness of warning system. 1.4 Reduce obstacles to timely and safe evacuation of hazard areas. Priority: Medium Description/Background: Emergency Warning and Public Information System, Bee County and the City of Beeville have no capability, other than a siren in the city limits of Beeville, to communicate warnings and emergency information to residents. Lead/Participating Agencies: Bee County Office Of Emergency Management Cost/Funding: $20,000.00, Local budget, EMPG, Texas Dept. of Rural Affairs Schedule: 6 months

COASTAL BEND MITIGATION ACTION PLAN 128
Project Number: BE-06 Project Name: Poesta and Medio creek drainage project. Participating Jurisdiction(s): City of Beeville Objective(s): 2.2 Minimize disruption to and enhance rapid restoration of essential transportation infrastructure. Priority: Medium Description/Background: Poesta and Medio creek drainage project. Complete concrete drainage ditch from east city limits to west city limits. A portion of the project has been completed from Adams street to South Jackson. Lead/Participating Agencies: Beeville Street Dept Cost/Funding: $900,000.00, Local budget, bond issue possible, Federal grants Schedule: 5 YEARS

COASTAL BEND MITIGATION ACTION PLAN 129
Project Number: JW-01 Project Name: Joint Advisory Committee for Drainage Participating Jurisdiction(s): Jim Wells County, City of Alice Objective(s): Objective 1.7 related to reducing secondary impacts to health and safety; Objective 3.4 related to reducing economic losses. Priority: Medium Description/Background: Areas of Jim Wells County and the City of Alice are subject to persistent flooding including: the south quadrant of the City of Alice (Lattas Creek/South Relief Creek watershed), the northwest quadrant of the Ben Bolt areas, and the southwest quadrant of the city of Alice (Lattas Creek/Rancho Alegre area). There is currently no officially recognized district or advisory group addressing drainage issues in a comprehensive manner. A Joint Advisory group may provide an organizational framework for establishing priorities, determining what studies are needed, and developing a Drainage Master Plan to guide future efforts to reduce flooding. Lead/Participating Agencies: Jim Wells County Commissioners Court and City of Alice City Council. Cost/Funding: Establishing an advisory group is anticipated to be a low cost activity, funded from current budgets for staff and volunteer time. Costs of hydrological studies is presently unknown, whereas implementation of drainage projects for the areas identified above is estimated at approximately $8 million. Schedule: It is estimated that this activity could be completed in 48 months.

COASTAL BEND MITIGATION ACTION PLAN 130
Project Number: JW-02 Project Name: Portable Electronic Road Signs Participating Jurisdiction(s): Jim Wells County Objective(s): Objective 1.4 related to safe evacuation. Priority: Low Description/Background: Purchase two portable electronic roadside signs for State Highway 44, U.S. Highway 281 and other highway locations as needed. Jim Wells County is bisected east to west by State Highway 44 and south to north by U.S. Highway 281. Both of these routes are either primary or alternate evacuation routes from coastal areas of Texas. Portable electronic signs can provide traveler instructions for evacuees. Portable signs can also be used to provide alerting and instructions for other hazardous conditions. Lead/Participating Agencies: Jim Wells County Emergency Management and Public Works Dept. Cost/Funding: Estimated at $25,000, with funding source presently unidentified. Potential partial funding opportunities may be available from state or federal grants. Schedule: Estimated 6 months or less completion from project start, contingent upon secured funding.
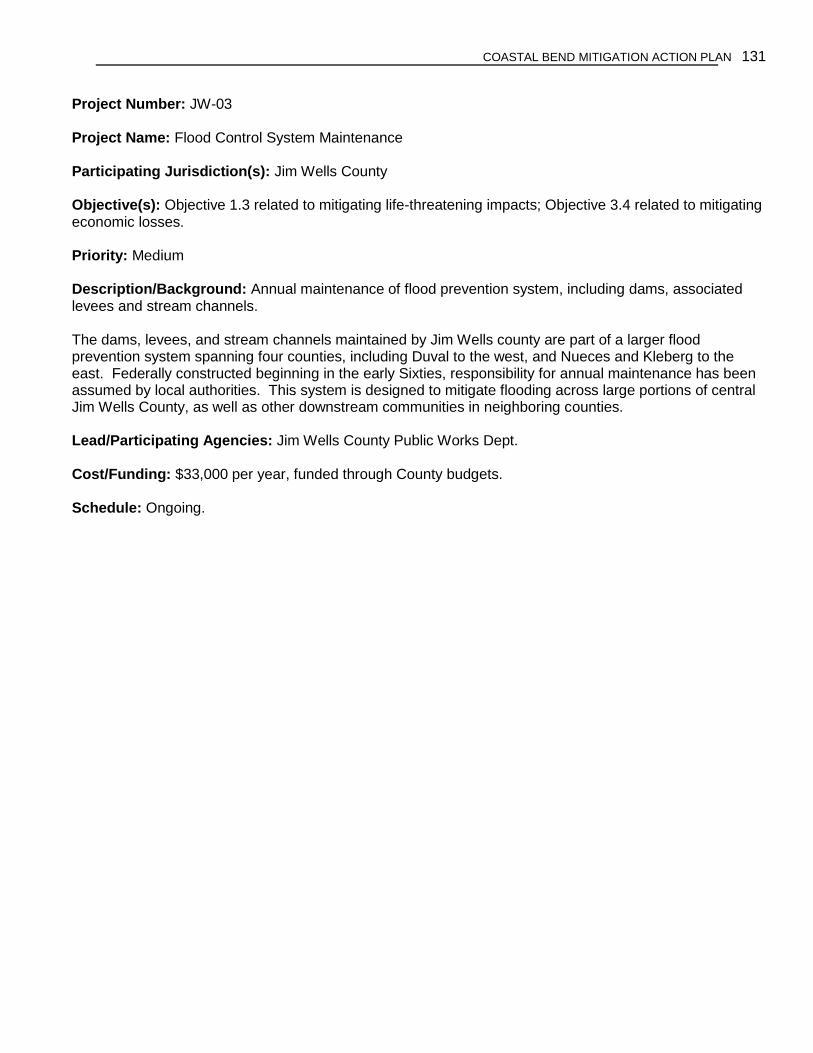
COASTAL BEND MITIGATION ACTION PLAN 131
Project Number: JW-03 Project Name: Flood Control System Maintenance Participating Jurisdiction(s): Jim Wells County Objective(s): Objective 1.3 related to mitigating life-threatening impacts; Objective 3.4 related to mitigating economic losses. Priority: Medium Description/Background: Annual maintenance of flood prevention system, including dams, associated levees and stream channels. The dams, levees, and stream channels maintained by Jim Wells county are part of a larger flood prevention system spanning four counties, including Duval to the west, and Nueces and Kleberg to the east. Federally constructed beginning in the early Sixties, responsibility for annual maintenance has been assumed by local authorities. This system is designed to mitigate flooding across large portions of central Jim Wells County, as well as other downstream communities in neighboring counties. Lead/Participating Agencies: Jim Wells County Public Works Dept. Cost/Funding: $33,000 per year, funded through County budgets. Schedule: Ongoing.
COASTAL BEND MITIGATION ACTION PLAN 132
Project Number: JW-04 Project Name: Roadside Traveler’s Assistance Participating Jurisdiction(s): Jim Wells County Objective(s): Objective 1.4 related to timely and safe evacuations. Priority: Medium Description/Background: Establish a public/private partnership to operate one or more roadside traveler assistance centers for the purpose of providing information and assistance to hurricane evacuees. Jim Wells County is bisected east to west by State Highway 44 and north to south by U.S. Highway 281. Both of these routes are either primary or alternate evacuation routes from coastal areas of Texas. In the past, evacuees have arrived in Jim Wells County with little or no information as to their final destination or inland routes. This project is envisioned as a roadside rest area and information center, possibly including travelers’ amenities such as coffee, comfort stations, maps, and staff to answer questions. Lead/Participating Agencies: Jim Wells County Emergency Management, Sheriff’s Office and as yet unidentified private sector participants, such as local civic organizations and businesses. Cost/Funding: This is anticipated to be a relatively low cost activity, costing $1500 or less, funded by private sector donation of materials and equipment. Schedule: It is estimated that determining feasibility and planning activities can be completed in six months or less, in time for the 2013 hurricane season.

COASTAL BEND MITIGATION ACTION PLAN 133
Project Number: JW-05 Project Name: Drainage Studies for C.R. 303 and Barbon Estates Participating Jurisdiction(s): Jim Wells County Objective(s): Objective 2.2 related to minimizing disruption to essential transportation infrastructure. Priority: Medium Description/Background: Study options for preventing inundation of County Road 303 and the Barbon Estates Subdivision. In heavy rainfall events, County Road 303 becomes inundated, preventing egress from the Barbon Estates subdivision and access to emergency response vehicles. In the past, residents have been stranded for a period of two to three days. Lead/Participating Agencies: Jim Wells County Public Works Dept. Cost/Funding: Study cost is estimated at $20,000 with funding source presently unidentified. Potential partial funding opportunities may be available from state or federal grants and/or FY 2005 County budget. Schedule: Estimated 12 months or less completion from project start, contingent upon secured funding.

COASTAL BEND MITIGATION ACTION PLAN 134
Project Number: JW-06 Project Name: Portable Electronic Road Signs Participating Jurisdiction(s): City of Alice Objective(s): Objective 1.4 related to safe evacuation. Priority: [pending] Description/Background: Purchase two portable electronic roadside signs for State Highway 44, U.S. Highway 281 and other highway locations as needed. The City of Alice is bisected east to west by State Highway 44 and south to north by U.S. Highway 281. Both of these routes are either primary or alternate evacuation routes from coastal areas of Texas. Portable electronic signs can provide traveler instructions for evacuees. Portable signs can also be used to provide alerting and instructions for other hazardous conditions. Lead/Participating Agencies: City of Alice Emergency Management and Streets Dept. Cost/Funding: Estimated at $25,000, with funding source presently unidentified. Potential partial funding opportunities may be available from state or federal grants. Schedule: Estimated 6 months or less completion from project start, contingent upon secured funding.

COASTAL BEND MITIGATION ACTION PLAN 135
Project Number: JW-08 Project Name: Reverse 911 System Participating Jurisdiction(s): City of Alice Objective(s): Objective 1.1 related to improving delivery and effectiveness of warnings. Priority: [pending] Description/Background: Purchase or lease emergency warning call down system (Reverse 911). A call down warning system can alert residents directly by calling their homes or places of business. This capability is especially useful during daylight business hours when individuals may not have access to warnings broadcast via television or radio. Although telephonic messages must be concise, they can provide additional instructions as to recommended response actions for all hazardous situations. Lead/Participating Agencies: City of Alice Emergency Management. Cost/Funding: [pending] Schedule: [pending]

COASTAL BEND MITIGATION ACTION PLAN 136
Project Number: JW-09 Project Name: Emergency Generators for Public Water Supply Participating Jurisdiction(s): City of Orange Grove Objective(s): Objective 2.1 related to minimizing disruption of utilities. Priority: High Description/Background: Water for the City of Orange Grove is supplied totally by wells. No source of emergency power is currently available. In the event of an extended loss of power, the City’s water supply would be disrupted. Lead/Participating Agencies: City of Orange Grove Public Water System Cost/Funding: Estimated $150,000 for one 150KW generator and one 75KW generator, with funding source presently unidentified. Potential partial funding opportunities may be available from state or federal grants. Schedule: Estimated 12 months or less completion from project start, contingent upon secured funding.

COASTAL BEND MITIGATION ACTION PLAN 137
Project Number: JW-10 Project Name: Emergency Generator for Public Water Supply Participating Jurisdiction(s): City of Premont Objective(s): Objective 2.1 related to minimizing disruption of utilities. Priority: Medium Description/Background: Water for the City of Premont is supplied totally by wells. No source of emergency power is currently available. In the event of an extended loss of power, the City’s water supply would be disrupted. Lead/Participating Agencies: City of Premont Public Water System Cost/Funding: Estimated $42,800 for one 230KW generator, transfer switch and instrumentation, with funding source presently unidentified. Potential partial funding opportunities may be available from state or federal grants. Schedule: Estimated 18-24 months or less completion from project start, contingent upon secured funding.

COASTAL BEND MITIGATION ACTION PLAN 138
Project Number: JW-11 Project Name: San Diego Creek Levee Certification Survey, Levee Improvements, O&M Plan Participating Jurisdiction(s): City of Alice and Jim Wells County Objective(s): 1.3 Utilize available mitigation measures to prevent or reduce life-threatening impacts of natural hazards. 3.4 Utilize available mitigation measures to prevent or reduce economic losses from natural hazards. Priority: high Description/Background: The City of Alice and Jim Wells County were notified in July 2008 that the San Diego Creek Levee was an unacceptable flood control structure. Since that time the City and County have been moving forward to bring the levee back into compliance by conducting the San Diego Creek Levee Certification study, survey work and clearing. A total of $93,500.00 has been spent to date from local funds. This project will involve raising the height of the levee to meet the required freeboard for a 100 year flood. Lead/Participating Agencies: City of Alice Engineering Dept and the Jim Wells County Public Works Dept. Cost/Funding: $850,000.00, Potential funding sources will be funds provided by the city and county, a loan from the USDA, or a bond project. Schedule: November 2012

COASTAL BEND MITIGATION ACTION PLAN 139
Project Number: JW-12 Project Name: Lake Findley Dam Maintenance, O&M Plan Participating Jurisdiction(s): City of Alice Objective(s): 1.3 Utilize available mitigation measures to prevent or reduce life-threatening impacts of natural hazards. 2.1 Minimize disruption to and enhance rapid restoration of utilities. 4.1 Protect public investment in community-owned facilities and infrastructure through appropriate structural, and financial methods. Priority: medium Description/Background: Lake Findley is the primary source of water for the city of Alice. The dam requires routine maintenance to ensure it stays in compliance with TCEQ standards for such structures to prevent dam failure and resulting downstream flooding. This project also includes an Operations and Maintenance Manual that is in development. Lead/Participating Agencies: City of Alice Engineering and Alice water authority Cost/Funding: $25,000.00 estimated annual expense Schedule: O&M scheduled to be completed late 2011, Annual Maintenance is ongoing.

COASTAL BEND MITIGATION ACTION PLAN 140
Project Number: JW-13 Project Name: Replace and upgrade City Water Lines Participating Jurisdiction(s): City of Alice Objective(s): 2.1 Minimize disruption to and enhance rapid restoration of utilities. Priority: high Description/Background: The city of Alice has not had a major water line replacement project since the 1960’s. During 2007, the city passed a $9.2 million bond issue to support water and sewer line replacement throughout the city. Lead/Participating Agencies: City of Alice Engineering, Public Works/Water Cost/Funding: $9,600,000.00 Schedule: There are several phases to this project. All phases are expected to be completed by 2013.

COASTAL BEND MITIGATION ACTION PLAN 141
Project Number: JW-14 Project Name: Lake Corpus Christi Pipeline Maintenance Participating Jurisdiction(s): City of Alice Objective(s): 2.1 Minimize disruption to and enhance rapid restoration of utilities. Priority: Low Description/Background: Perform routine maintenance on the Lake Corpus Christi pipeline. The Lake Corpus Christi pipeline serves to previde water to the City of Alice from Lake Corpus Christi. This pipeline is used to replenish Lake Findley during periods of little or no rainfall. Lead/Participating Agencies: City of Alice Engineering, Public Works/Water Cost/Funding: $25,000.00 annual estimated expense Schedule: ongoing annual activity

COASTAL BEND MITIGATION ACTION PLAN 142
Project Number: JW-15 Project Name: Emergency Generator for Alice City Hall/EOC Participating Jurisdiction(s): City of Alice Objective(s): 2.1 Minimize disruption to and enhance rapid restoration of utilities. Priority: HIGH Description/Background:. CITY HAAS LOST POWER NUMEROUS TIMES DUE TO BROWNOUTS AND HIGH WINDS CAUSING DISRUPTION OF VIDAL SERVICES. INSTALL 30 KW GENERATOR TO MAINTAIN CONTINUITY OF GOVERNMENTS IN CASE OF LOSS OF POWER DUE TO BROWNOUTS OR DISASTER RELATED LOSS OF POWER. Lead/Participating Agencies: CITY OF ALICE Cost/Funding: FUNDING CURRENTLY UNIDENTIFIED. POTENTIAL PARTIAL FUNDING OPPORTUNITIES MAY BE AVAILABLE FROM STATE OR FEDERAL GRANTS. Schedule: 6 TO 12 MONTHS AFTER FUNDING IDENTIFIED.

COASTAL BEND MITIGATION ACTION PLAN 143
Project Number: JW-16 Project Name: Outdoor Warning System Participating Jurisdiction(s): Jim Wells County, Tecolote Subdivision Objective(s): 1.1 Improve the delivery and effectiveness of warning messages. Priority: HIGH Description/Background:. Acquire and install outdoor warning system for the Tecolote Subdivision, residents in this subdivision do not have a means of being warned of imminent hazards. Lead/Participating Agencies: Jim Wells County OEM Cost/Funding: $85,000.00, grants, funding from Jim Wells county Schedule: December 2012

COASTAL BEND MITIGATION ACTION PLAN 144
Project Number: JW-17 Project Name: Outdoor Warning System for the City of Orange Grove Participating Jurisdiction(s): Jim Wells County and City of Orange Grove Objective(s): 1.1 Improve the delivery and effectiveness of warning messages. Priority: HIGH Description/Background:. Acquire and install outdoor warning system for the City of Orange Grove, residents of this city do not have a means of being warned of imminent hazards. Lead/Participating Agencies: Jim Wells County OEM and City of Orange Grove Public Works Cost/Funding: $85,000.00, grants, funding from Jim Wells county Schedule: December 2012

COASTAL BEND MITIGATION ACTION PLAN 145
Project Number: JW-18 Project Name: Reverse 911 system Participating Jurisdiction(s): Jim Wells County Objective(s): 1.1 Improve the delivery and effectiveness of warning messages. Priority: high Description/Background: .Purchase or lease emergency warning call down system (reverse 911), a call down warning system can alert residents directly by calling their homes or places of business. This capability is especially useful during daylight business hours when individuals may not have access to warning broadcast via television or radio. Although telephonic messages must be concise, they can provide additional instructions as to recommended response actions for all hazardous situations. Lead/Participating Agencies: Jim Wells County OEM Cost/Funding: Estimated $30,000.00 per year Schedule: Estimated 6 months or less completion from project start, contingent upon secured funding.

COASTAL BEND MITIGATION ACTION PLAN 146
Project Number: KL-01 Project Name: Inter-local Agreement for 9-1-1 Services Participating Jurisdiction(s): Kleberg County and City of Kingsville Objective(s): Objective 1.2 related to preserving emergency response capability. Priority: High Description/Background: Both the City of Kingsville and Kleberg County currently operate independent emergency call-taking/dispatch services, known as Public Safety Answering Points (PSAPs). In the event of disruption in service to one of the PSAPs, it would be desirable to have the other PSAP provide emergency backup to prevent a disruption to emergency response services. Lead/Participating Agencies: Kleberg County Sheriff’s Office and Kingsville Police Department. Cost/Funding: This is anticipated to be a relatively low cost project related primarily to staff time for planning, funded from current budgets. Schedule: It is estimated this activity could be completed in 3 months or less from project start.

COASTAL BEND MITIGATION ACTION PLAN 147
Project Number: KL-02 Project Name: Survey Public Facilities for Retrofit Participating Jurisdiction(s): Kleberg County Objective(s): Objective 1.1 related to preserving emergency response capability, Objective 2.3 related to minimizing disruption to government services. Priority: Medium Description/Background: Survey public facilities for vulnerability to hurricane force winds, make recommendations for shuttering or other protective measures, and implement. Kleberg County is vulnerable to hurricane force winds. Older buildings in particular need to be evaluated for potential retrofits to minimize not only structural damage, but also damage to contents. Measures such as strengthening or protecting windows, doors, and roofs can either prevent or minimize loss of essential public services. Lead/Participating Agencies: Kleberg County Emergency Management Cost/Funding: A survey is anticipated to be a relatively low cost project related primarily to staff time for planning, funded from current budgets. Actual retrofitting costs would depend on survey findings. Schedule: It is estimated this activity could be completed in 3 months or less from project start.

COASTAL BEND MITIGATION ACTION PLAN 148
Project Number: KL-03 Project Name: Roadside Traveler’s Assistance Participating Jurisdiction(s): Kleberg County Objective(s): Objective 1.4 related to timely and safe evacuation. Priority: Medium Description/Background: Establish a public/private partnership to operate one or more roadside traveler assistance centers for the purpose of providing information and assistance to hurricane evacuees. Primary and alternate hurricane evacuation routes cross Kleberg County. In the past, evacuees have arrived in Kleberg County with little or no information as to their final destination or inland routes. This project is envisioned as a roadside rest area and information center, possibly including travelers’ amenities such as free coffee, comfort stations, maps, and staff to answer questions. Lead/Participating Agencies: Kleberg County Emergency Management, Sheriffs Office, and as yet unidentified private sector participants, such as local civic organizations and businesses. Cost/Funding: This project is anticipated to be a low cost activity, funded through private sector donation of materials and equipment. Schedule: Determining feasibility and planning activities can be completed in six months or less, in time for 2013 Hurricane Season.

COASTAL BEND MITIGATION ACTION PLAN 149
Project Number: KL-04 Project Name: Joint Advisory Committee for Drainage Participating Jurisdiction(s): Kleberg County and City of Kingsville Objective(s): Objective 3.4 related to reducing economic losses from flooding. Priority: Low Description/Background: Establish a City/County Drainage Task Force to investigate alternatives for addressing drainage issues on a countywide basis, evaluate recommendations, and implement. There are no independent drainage districts currently existing within the county addressing drainage issues in a comprehensive manner. A county-wide approach can facilitate coordination for the development of a Drainage Master Plan. A specially appointed Task Force could be charged with examining alternative frameworks and reporting their recommendations to the participating governing bodies for evaluation and action to reduce losses from flooding. Lead/Participating Agencies: Kleberg County Commissioners Court and Kingsville City Council. Cost/Funding: Establishing a task force is anticipated to be a relatively low cost activity associated with volunteer and staff time, funded with current budgets. Additional professional staff support may be required and is estimated at $20,000, with funding source currently unidentified. This activity may be eligible in part for state or federal grant funding. Schedule: It is estimated that initial activities could be completed with 12 months.

COASTAL BEND MITIGATION ACTION PLAN 150
Project Number: KL-05 Project Name: Disaster Resistant University Workshop Participating Jurisdiction(s): City of Kingsville Objective(s): Objective 2.3 related to minimizing disruption to educational institutions. Priority: Low Description/Background: Coordinate with Texas A&M University - Kingsville to promote campus mitigation activities, and to enhance awareness of the Disaster Resistant University Program. This activity may potentially include hosting a workshop based on the FEMA report, Building a Disaster-Resistant University. The Texas A&M University-Kingsville campus is located within a predominately residential area on the northwest edge of Kingsville. The university has approximately 6000 students with nearly 1,000 faculty and staff. The main campus encompasses 257 acres and has 82 primary buildings including five occupied residence halls and 13 occupied student family apartments. FEMA’s Disaster Resistant University Program is specifically designed to provide assistance for mitigation in the university setting and in the past, has set aside monies from the Pre Disaster Mitigation Competitive grant program for this purpose. Lead/Participating Agencies: City of Kingsville Emergency Management and Texas A&M University - Kingsville officials. Cost/Funding: This is anticipated to be a low cost activity, with costs associated primarily with staff time and reproducing materials, funded from current budgets and participation by the University. Schedule: FY 2013.

COASTAL BEND MITIGATION ACTION PLAN 151
Project Number: KL-07 Project Name: Outdoor Warning Sirens Participating Jurisdiction(s): City of Kingsville Objective(s): Objective 1.1. Related to improving delivery and effectiveness of warnings. Priority: High Description/Background: Purchase and install two outdoor warning sirens. There is currently no outdoor warning siren to alert the public to rapid onset hazards, such as tornadoes or hazardous materials. Lead/Participating Agencies: City of Kingsville Emergency Management. Cost/Funding: Estimated total cost is $40,000 with funding source presently unidentified. Potential partial funding opportunities may be available from state or federal grants. Schedule: Estimated 6 months or less completion from project start, contingent upon secured funding.

COASTAL BEND MITIGATION ACTION PLAN 152
Project Number: KL-09 Project Name: Infiltration and Inflow Study for Waste Water Treatment Participating Jurisdiction(s): City of Kingsville Objective(s): Objective 2.1 related to minimizing disruption to utilities. Priority: Medium Description/Background: This study will determine how to minimize potential untreated rain water overflow during heavy rainfall events. Lead/Participating Agencies: City of Kingsville Public Utilities Dept. Cost/Funding: Estimated study cost is $200,000, funded through issuance of certificates of obligation. Schedule: Estimated 18-24 months to complete from project start, contingent upon secured funding.

COASTAL BEND MITIGATION ACTION PLAN 153
Project Number: KL-10 Project Name: Emergency Generators for Public Water Supply Participating Jurisdiction(s): City of Kingsville Objective(s): Objective 2.1 related to minimizing disruption to utilities. Priority: High Description/Background: Purchase six emergency generators for City of Kingsville drinking water supply system, including wells and water storage facilities. No source of emergency power is currently available. In the event of an extended loss of power the City’s water supply would be disrupted. Lead/Participating Agencies: City of Kingsville Water Production Department. Cost/Funding: Estimated cost is $120,000, funded through issuance of certificates of obligation. Schedule: Estimated 6 months or less for completion from project start, contingent upon secured funding.

COASTAL BEND MITIGATION ACTION PLAN 154
Project Number: KL-11 Project Name: Shoreline stabilization at Riviera Park Participating Jurisdiction(s): Kleberg County Objective(s): Objective 4.1 related to protecting public investment in community-owned facilities and infrastructure; Objective 4.4 related to minimizing environmental impacts. Priority: Low Description/Background: Coastal erosion at Riviera Park on Baffin Bay is threatening to undermine recreational facilities. This is a fairly well-used winter Texan recreation area. The scope would include an offshore breakwater to protect the beach and a fishing pier extension. Lead/Participating Agencies: Kleberg County Public Works Department. Cost/Funding: Estimated cost is $500,000 to $1,000,000. Potential funding sources include the Coastal Erosion Planning and Response Program (CEPRA), Texas Parks and Wildlife Outdoor Recreation Grant Program, Texas Parks and Wildlife Small Community Grant Program. Schedule: Estimated completion in 24 months or less, contingent upon secured funding.

COASTAL BEND MITIGATION ACTION PLAN 155
Project Number: KL-12 Project Name: SAND BAGGING MACHINE Participating Jurisdiction(s): City of KINGSVILLE Objective(s): REDUCE ECONOMIC LOSSES FROM FLOODING Priority: medium Description/Background: This project will allow public works employees to provide more sandbags to the community faster and with less employees. Lead/Participating Agencies: City of Kingsville Public Works Cost/Funding: Estimated $13,000.00, funding source presently unidentified. Potential partial funding opportunities may be available from state or federal grants. Schedule: Estimated 6-12 months or less completion from project start, contingent upon secured funding.

COASTAL BEND MITIGATION ACTION PLAN 156
Project Number: KL-13 Project Name: Improve water drainage to county roads, Pcts 1 and 3 Participating Jurisdiction(s): Kleberg County unincorporated area Objective(s): 1.4 Reduce obstacles to timely and safe evacuation of hazard areas. Priority: medium Description/Background: Improve water drainage to county roads, Pcts 1 and 3, historically heavy rains will produce county road flooding and standing water to ditches. The overflow of storm and rain water has also produced some flooding to residential homes and properties. Lead/Participating Agencies: Kleberg County Commissioners Pct 1&3, and County Flood plain Administrator. Cost/Funding: Estimated $260,000.00, Kleberg County Road and Bridge Budget funds and state or federal grants. Schedule: Estimated 6-12 months or less completion from project start, contingent upon secured funding.

COASTAL BEND MITIGATION ACTION PLAN 157
Project Number: KL-14 Project Name: Transfer switch for portable emergency generator at Kingsville city hall/EOC Participating Jurisdiction(s): City of Kingsville Objective(s): 1.2 Preserve public and private emergency response capability. Priority: high Description/Background: Transfer switch for portable emergency generator at Kingsville city hall/EOC. EOC is located at city hall and building has no emergency back-up power. This project will allow quick connection of an emergency generator for the city of Kingsville EOC. Lead/Participating Agencies: City of Kingsville Cost/Funding: funding source presently unidentified, potential partial funding opportunities may be available from state or federal grants. Schedule: Estimated 1 to 2 weeks after funding is secured.

COASTAL BEND MITIGATION ACTION PLAN 158
Project Number: LO-06 Project Name: Drainage Study for Live Oak County Airport Area Participating Jurisdiction(s): Live Oak County Objective(s): Objective 2.2. Related to reducing vulnerability of transportation infrastructure. Priority: Low Description/Background: Improved drainage to reduce disruptions due to flooding in the vicinity of the Live Oak County Airport. The area surrounding the airport is subject to flood inundation, thereby cutting off access to the airport and also on the future runway extension. Lead/Participating Agencies: Live Oak County Emergency Management and Live Oak County Airport Board. Cost/Funding: Estimated at $10,000 for study, funding presently unidentified. This activity may be eligible for a grant from the Texas Department of Transportation, or other state/federal grant programs. Schedule: It is anticipated this study could be completed in 12 months, contingent upon secured funding.

COASTAL BEND MITIGATION ACTION PLAN 159
Project Number: LO-10 Project Name: Outdoor Warning Sirens Participating Jurisdiction(s): City of George West Objective(s): Objective 1.1 related to improving the delivery and effectiveness of warnings. Priority: Medium Description/Background: Augment the outdoor warning system for the City of George West with the purchase and installation of two additional sirens. The City of George West has one 10 hp siren located at the fire station, which is not adequate. The city needs at least two more sirens to warn most of the city. A study by Texas A&M during the late 1970’s indicated that at least three-sirens were needed within the City to warn at least 95% of the public. Lead/Participating Agencies: Live Oak County Emergency Management and City of George West public safety agencies. Cost/Funding: Estimated at $16,000 with funding presently unidentified. Potential partial funding opportunities may be available from state or federal grants. Schedule: Estimated 3 months or less completion from project start, contingent upon secured funding.

COASTAL BEND MITIGATION ACTION PLAN 160
Project Number: LO-12 Project Name: Enhanced Outdoor Warning System Participating Jurisdiction(s): City of Three Rivers Objective(s): Objective 1.1 related to improving the delivery and effectiveness of warnings. Priority: Medium Description/Background: Enhance the City of Three Rivers outdoor warning system to include voice capability. A large refinery, currently owned and operated by Valero, is situated within the City of Three Rivers, where a multi-purpose, outdoor warning siren system is currently implemented. Enhancing the system to include voice capability would permit broadcasting of specific messages, such as public protective actions. Lead/Participating Agencies: City of Three Rivers Police Dept. and the Valero Refinery. Cost/Funding: Project cost is estimated at $10,000 or less with funding currently unidentified. Potential funding sources include shared cost between Valero and the City of Three Rivers. Schedule: Estimated 6 months or less completion from project start, contingent upon secured funding.

COASTAL BEND MITIGATION ACTION PLAN 161
Project Number: NU-07 Project Name: Procedures for Accessing Emergency Notification System Participating Jurisdiction(s): City of Bishop Objective(s): Objective 1.1 related to improving delivery of warning messages. Priority: [pending] Description/Background: Formalize procedures to gain authorized access to an existing regional Call Down system through City of Kingsville/Kleberg. The City of Bishop is located close to the border of Nueces and Kleberg Counties, near the City of Kingsville. Natural and other hazards impacting Bishop are likely to impact Kingsville, and vice versa. Kleberg County has recently entered into an Inter-local Cooperation Agreement with the City of Corpus Christi and Nueces County, operators of the METROCOM center, to obtain authorized access to various warning tools, including a Call Down system. Some expense is involved with maintenance and activation of the system, including long distance telephone charges. The parties have agreed in principle to provide access to the City of Bishop through the Kingsville/Kleberg County agreement. Formal agreement as to who is authorized to activate the system on behalf of Bishop, the specific procedures to be used, and what costs will be incurred remains to be finalized. Lead/Participating Agencies: City of Bishop Mayor/Emergency Management Director in coordination with Kleberg County/Kingsville Emergency Management. Cost/Funding: Costs associated with formalizing an agreement are anticipated to be minimal. There is expected to be some cost associated with activating the system for long distance charges. Schedule: This activity is anticipated to take 3 months or less to complete.

COASTAL BEND MITIGATION ACTION PLAN 162
Project Number: NU-08 Project Name: Outdoor Warning Sirens Participating Jurisdiction(s): City of Bishop Objective(s): Objective 1.1. Related to improving delivery of warnings. Priority: HIGH Description/Background: Evaluate cost/benefit of implementing an outdoor warning siren system and present recommendations to local officials. No outdoor warning siren system is currently available within the City of Bishop to alert residents to rapid onset natural hazards such as tornadoes, or other hazardous situation. Lead/Participating Agencies: City of Bishop Emergency Management. Cost/Funding: Cost associated with evaluating and making a recommendation are anticipated to be minimal, consisting of staff or volunteer time. The cost of implementing a siren system is estimated at $51,113, and funding is currently unidentified. Schedule: It is anticipated this activity would take 3-6 months to complete once funding was secured to receive and install an outdoor warning system.

COASTAL BEND MITIGATION ACTION PLAN 163
Project Number: NU-09 Project Name: Emergency Generators for Waste Water Lift Stations Participating Jurisdiction(s): City of Bishop Objective(s): Objective 1.7 related to secondary impacts to health and safety, Objective 2.1 related to minimizing disruption of utilities. Priority: MEDUIM Description/Background: Purchase emergency generators for seven wastewater lift stations. There is currently no emergency power supply for wastewater lift stations. During an extended loss of power, waste water treatment services would be disrupted with potential health impacts. Lead/Participating Agencies: City of Bishop Public Works Dept. Cost/Funding: Cost of this project is estimated at $65,000 with funding currently unidentified. Potential partial funding opportunities may be available from state or federal grants. Schedule: Estimated 12 months or less completion from project start, contingent upon secured funding. Schedule:

COASTAL BEND MITIGATION ACTION PLAN 164
Project Number: NU-011 Project Name: Coordinate with Nueces County Drainage District #3 to Address Flooding Participating Jurisdiction(s): City of Bishop Objective(s): Objective 3.4 related to reducing economic losses from natural hazards. Priority: HIGH Description/Background: The City of Bishop is subject to frequent episodes of inland flooding during heavy rainfall events. Nueces County Drainage District #3 is responsible for addressing drainage issues which may have impacts for the City of Bishop; however, there has been a lack of coordinated effort in the past. Additional flood control projects of interest to the City of Bishop include clearing of stream blockage on King Ranch property and the Carreto Creek project, including removal of silt and connection with the flood control project on King Ranch. Lead/Participating Agencies: City of Bishop in coordination with officials of Nueces County Drainage District #3. Cost/Funding: Coordination efforts are anticipated to be a low cost activity associated with volunteer/staff time. Costs associated with the flood control projects are estimated at $350,000, with funding currently unidentified. Potential partial funding opportunities may be available from state or federal grants. Schedule: Coordination efforts are anticipated to be an ongoing activity.

COASTAL BEND MITIGATION ACTION PLAN 165
Project Number: NU-12 Project Name: USACE Feasibility Study, Cotulla Diversion Participating Jurisdiction(s): City of Corpus Christi, Nueces River Authority Objective(s): Objective 1.3 related to mitigating life-threatening effects of natural hazards; Objective 2.1 related to minimizing disruption to essential utilities (water supply); Objective 3.4 related to mitigating economic losses. Priority: High Description/Background: The Corps of Engineers studied the Cotulla Reservoir site, located in the upper Nueces Basin, in the 1960’s. The recent Nueces River Basin Reconnaissance Study identified a potentially down-sized version of this project, including a pipeline to divert water directly into Choke Canyon Reservoir. In addition to the flood damage reduction potential for Lake Corpus Christi and the lower river basin, this project would enhance the regional water supply by increasing water storage capacity, and reducing losses associated with downstream evaporation across an 81 mile braided reach. During Phase 1 of the Feasibility Study, existing data will be reviewed to estimate the flood damage reduction potential of the project:: a. A preliminary hydrologic analysis to determine the portion of the volume of historical lower-basin floods that originate upstream of Cotulla will be performed. b. A review of existing map information of the Nueces River for a 25-mile reach downstream of the proposed reservoir to identify areas that could benefit from the potential flood damage reduction potential of the reservoir will be performed. c. Data from FEMA and other agencies on historical flood damages will be summarized. (Phase 2) Depending on the findings of the flood damage analyses, a daily flow flood model may need to be developed to evaluate the downstream flood damage reduction potential in terms of magnitude and frequency for the Cotulla Diversion Project. Lead/Participating Agencies: US Army Corps of Engineers-Fort Worth and Galveston Districts/City of Corpus Christi/ Nueces River Authority/ Edwards Aquifer Authority/ Guadalupe Blanco River Authority/ San Antonio River Authority/ City of San Antonio Cost/Funding: Estimated study cost is $269,000; estimated construction cost is $176,000,000. US Army Corps of Engineers (Flood Control Act 1936) 50% of Study costs and up to 60% of construction costs. Non-Federal Sponsors will share the remaining 50% of the Study costs and 40% of construction costs. Schedule: It is anticipated that the project studies will be complete by December, 2012 and construction by 2016 to 2018.

COASTAL BEND MITIGATION ACTION PLAN 166
Project Number: NU-13 Project Name: USACE Feasibility Study, Two-way Pipeline between Choke Canyon Reservoir and Lake Corpus Christi Participating Jurisdiction(s): City of Corpus Christi, Nueces River Authority Objective(s): Objective 1.3 related to mitigating life-threatening effects of natural hazards; Objective 2.1 related to minimizing disruption to essential utilities (water supply); Objective 3.4 related to mitigating economic losses. Priority: High Description/Background: The Nueces River Basin Reconnaissance Study identified a two-way pipeline project between Choke Canyon and Lake Corpus Christi, coupled with the off-channel storage and a high capacity pump station, for the dual purpose of flood control and increased water supply, through reduced channel losses. During the Feasibility Study, analyses will be performed to determine the potential flood damage reduction benefits of this project: a. A review of existing map information of the area along the Lower Nueces River below LCC will be performed to identify areas that could benefit from the potential flood damage reduction potential of the diversion facilities. Records of flood damages associated with historical events will be obtained. b. (Phase 2) A daily flood model to evaluate the downstream flood damage reduction potential in terms of magnitude and frequency for this project will be developed. c. (Phase 2) Analysis will be performed to determine the potential effects of coupling the pipeline with the off-channel storage and a high capacity pump station in order to manage Lake Corpus Christi storage to better control incoming flood flows. Lead/Participating Agencies: US Army Corps of Engineers-Fort Worth and Galveston Districts/City of Corpus Christi/ Nueces River Authority/ Edwards Aquifer Authority/ Guadalupe Blanco River Authority/ San Antonio River Authority/ City of San Antonio Cost/Funding: Estimated study cost is $279,000; estimated construction cost is $88,725,000. US Army Corps of Engineers (Flood Control Act 1936) 50% of Study costs and up to 60% of construction costs. Non-Federal Sponsors will share the remaining 50% of the Study costs and 40% of construction costs. Schedule: It is anticipated that the project studies will be complete by December, 2008 and construction by 2016 to 2018.

COASTAL BEND MITIGATION ACTION PLAN 167
Project Number: NU-14 Project Name: Large Scale Desalination Feasibility Study Participating Jurisdiction(s): City of Corpus Christi Objective(s): Objective 2.1 related to minimizing disruption to essential utilities (water supply). Priority: High Description/Background: The study envisions a 25-million gallon per day desalination facility, and will include an analysis of possible plant locations. The purpose of such a facility would be to enhance the regional water supply, which would serve to mitigate the effects of drought. The City was one of three sites awarded a $500,000 state grant in 2003 to conduct the studies as part of Governor Perry's initiative to assess the potential desalination of seawater to help meet the state's regional water needs. Lead/Participating Agencies: City of Corpus Christi Cost/Funding: Cost of study is $500,000 funded through a grant from the Texas Water Development Board. Schedule: The draft report detailing the analyses performed will be available at the end of August 2004, and a meeting will be held to solicit further public input after the draft report is available for review. The final report will be delivered to the Texas Water Development Board on November 1, 2004.

COASTAL BEND MITIGATION ACTION PLAN 168
Project Number: NU-17 Project Name: Storm Water Master Plan Participating Jurisdiction(s): City of Corpus Christi and its extra-territorial jurisdiction (ETJ) Objective(s): Objective 3.4 related to mitigating economic losses from natural hazards (flooding). Priority: High Description/Background: The Corpus Christi City Council approved the Storm Water Capital Improvement Program (CIP) for FY99-00 on July 20, 1999 (Ordinance No. 023703). Included were separate projects for drainage studies in specific areas of the City. The need to integrate these individual drainage studies into a consistent, uniform analysis became evident and was approved in Storm Water CIP for FY00-01, (Ordinance No. 024130). The City's use of master plans that date back to 1946, 1961, 1970, 1982, and 1988 resulted in the use of inconsistent criteria without an adopted level of protection policy. The separate projects are integrated into the FY00-01 Storm Water CIP as a Storm Water Master Plan Project. The Development of a comprehensive, updated, consistent Storm Water Master Plan based on an adopted Storm Water Criteria and Design Manual is necessary to respond to development, environmental issues and to better define and prioritize on going and future drainage capital improvement projects. The purposes of this project are as follows: a. Establish drainage criteria that reflects input from the different segments of the community (elected officials, developers, engineers, citizens, planning and zoning) and in the consensus process identify a "level of protection" for the City to be adopted as a standard for the City b. Adopt a drainage criteria and design procedure for designers to use in capital improvement projects and in the subdivision platting process of residential and commercial development c. Establish policy statements or guidelines that are responsive to storm water quality, storm water pollution prevention requirements, development issues for use in future street and drainage project design d. Develop a master plan to implement the drainage criteria established to include updates of the existing areas and production of new master plan for other areas. The master plan will include the inventory of all outfalls and data necessary for the design process and will utilize criteria and reflects the characteristics of each master plan Lead/Participating Agencies: City of Corpus Christi Storm Water Dept. Cost/Funding: Estimated cost of the study is $2,000,000 with funding from the Capital Improvement Program. Schedule: The project is scheduled for completion during Spring 2005.

COASTAL BEND MITIGATION ACTION PLAN 169
Project Number: NU-18 Project Name: Major Outfall Repairs Phase I Participating Jurisdiction(s): City of Corpus Christi Objective(s): Objective 3.4 related to mitigating economic losses from natural hazards (flooding). Priority: High Description/Background: A periodic inspection of over 71,400 linear feet (13.5 miles) of storm water runoff conveyance lines during mid-2003 indicated that some sections of the lines needed repairs. The structural integrity and functionality of these outfall lines are critical in preventing flooding and in improving water quality. There are eight major storm water outfalls that convey storm water runoff into Corpus Christi Bay. The purpose of this project is to perform needed repairs along sections of the major outfalls. Typical repairs will include: headwalls, wing walls, isolated structural repairs, damaged lateral lines that penetrate outfall, holes, joints, and spalls. Lead/Participating Agencies: City of Corpus Christi Storm Water Dept. Cost/Funding: Estimated project cost is $2,000,000 to be funded from the City of Corpus Christi Capital Improvement Program. Schedule: This project is scheduled to be completed October 2005.
COASTAL BEND MITIGATION ACTION PLAN 170
Project Number: NU-19 Project Name: Major Outfall Repairs Phase II Participating Jurisdiction(s): City of Corpus Christi Objective(s): Objective 3.4 related to mitigating economic losses from natural hazards (flooding). Priority: High Description/Background: A periodic inspection of over 71,400 linear feet (13.5 miles) of storm water runoff conveyance lines during mid-2003 indicated that that two of the eight major outfalls needed replacement. The structural integrity and functionality of these outfall lines are critical in preventing flooding and in improving water quality. The purpose of this project is to replace the two outfalls: Brawner Proctor, and Gollihar. Lead/Participating Agencies: City of Corpus Christi Storm Water Dept. Cost/Funding: Estimated project cost is $5,000,000 with funding from the City of Corpus Christi Capital Improvement Program. Schedule: This portion of the project is scheduled to be completed October 2008.

COASTAL BEND MITIGATION ACTION PLAN 171
Project Number: NU-20 Project Name: Major Drainage Channel Improvements Participating Jurisdiction(s): City of Corpus Christi Objective(s): Objective 3.4 related to mitigating economic losses from natural hazards (flooding). Priority: High Description/Background: The purpose of this project is to repair erosion and other damages to major drainage channels as a result of a heavy rain or other severe weather. A number of earthen ditches throughout the City have steep side slope (2:1) which makes them more prone to erosion of stream beds and slopes during a prolong and intense rain event. In order to make improvements which will stabilize the slopes and stream beds of major channels, an allocation of funds is earmarked for this project to be utilized on a priority basis on those ditches where erosion and slope failures becomes a serious and critical problem. The project will generally includes shaping, grading, flattening side slopes, seeding, adding concrete flumes or lined channels, adding storm water appurtenances such as inlets, pipes, and some minor right-of-way acquisitions as necessary. Lead/Participating Agencies: City of Corpus Christi Storm Water Dept. Cost/Funding: This project is estimated to cost $3,000,000 with funding from the City of Corpus Christi Capital Improvement Program, and current/future Operating and Maintenance budgets. Schedule: This project is ongoing.

COASTAL BEND MITIGATION ACTION PLAN 172
Project Number: NU-21 Project Name: Obtain Drainage Rights of Way Participating Jurisdiction(s): City of Corpus Christi Objective(s): Objective 3.4 related to mitigating economic losses from natural hazards (flooding). Priority: High Description/Background: Having adequate and available drainage ROW is critical to developing drainage infrastructure to meet the demand for orderly growth and development within the City. Adequate ROW helps to prevent/minimize flooding, helps to facilitate maintenance, and allows potential for improving quality of storm water runoff. The purpose of this project is to provide funding for acquiring right-of-way (ROW) where needed in order to implement drainage problem solutions, such as ditch widening, erosion control, extending storm sewers, providing easements, etc. During design, it is often required that additional ROW be provided for implementation of the project. Lead/Participating Agencies: City of Corpus Christi Storm Water Dept. Cost/Funding: Cost of this project is estimated at $2,000,000, with funding from the City of Corpus Christi Capital Improvement Program. Schedule: This activity is ongoing.

COASTAL BEND MITIGATION ACTION PLAN 173
Project Number: NU-22 Project Name: Replace Flood Control Pumps at Power St. Pump Station Participating Jurisdiction(s): City of Corpus Christi Objective(s): Objective 3.4 related to reducing economic losses from natural hazards (flooding). Priority: High Description/Background: Flooding in the downtown area is a frequently recurring event, and a major concern for both citizens and businesses. In addition to a variety of private businesses, several local and federal public facilities are located within this area. The existing pumps date from 1948 and are potentially subject to failure. Replacing the pumps will minimize the probability of a future catastrophic failure. Lead/Participating Agencies: City of Corpus Christi Storm Water Dept. Cost/Funding: This project is estimated to cost $800,000 with funding currently unidentified. Potential funding sources include state/federal grant programs, the City Utility Enterprise Fund, or City of Corpus Christi Capital Improvements Program. Schedule: Estimated 18-24 months to complete from project start, contingent upon secured funding.

COASTAL BEND MITIGATION ACTION PLAN 174
Project Number: NU-23 Project Name: Flood Map Modernization Program/CTP Community Participating Jurisdiction(s): City of Corpus Christi Objective(s): Objective 3.2 related to increasing participation in available insurance options. Priority: High Description/Background: The Federal Emergency Management Agency's Multi-Hazard Flood Map Modernization Program will update and digitize flood hazard maps across the nation. The majority of the City of Corpus Christi's FIRMs are nearly 20 years old. It is in the interest of the City and its residents for the maps, which determine flood insurance premiums, to be accurate and up-to-date. Other planning and hazard mitigation benefits are expected to accrue as well. FEMA has notified the City by letter dated July 15, 2004, that its contractor will be contacting the City within the next few months regarding the flood mapping effort. A key FEMA strategy is to form local partnerships for this purpose under the Cooperating Technical Partners program to leverage local resources. In addition to preparation for the contractor visit, the City will evaluate the feasibility of becoming a CTP partner. Lead/Participating Agencies: Corpus Christi Floodplain Administrator with Development Services, Engineering, Storm Water, and MIS/GIS Departments Cost/Funding: The preparation and evaluation process is expected to be a low cost activity, associated primarily with staff time, funded from current budgets. Schedule: This initial activity is expected to be completed within 6 months.

COASTAL BEND MITIGATION ACTION PLAN 175
Project Number: NU-24 Project Name: Enhance Community Rating System (CRS) Rating Participating Jurisdiction(s): City of Corpus Christi Objective(s): Multiple mitigation objectives as well as Objective 3.2 related to increasing participation in available insurance options. Priority: High Description/Background: The Federal Emergency Management Agency (FEMA) Mitigation Division administers the National Flood Insurance Program (NFIP). To encourage participating communities to go beyond the minimum requirements for flood plain management, the Community Rating System (CRS) program classifies communities by awarding points for related activities. Corpus Christi has participated in the CRS program since 1991 and is currently rated as a Class 9 community, entitling its residents to a 5% discount on flood insurance premiums. This project is intended to improve its rating to a Class 8, thereby increasing the premium discount to 10% for Special Flood Hazard Areas (SFHAs). The CRS classes for local communities are based on 18 creditable activities, organized under four categories: (i) Public Information, (ii) Mapping and Regulations, (iii) Flood Damage Reduction, and (iv) Flood Preparedness. Other actions identified in this Mitigation Plan will have a direct bearing on fulfilling CRS requirements to qualify for the higher classification. This activity includes a comprehensive review of eligible activity requirements, identification of additional potential actions, monitoring completion of previously identified actions, and completing the application process. Lead/Participating Agencies: Corpus Christi Floodplain Administrator with Water and Storm Water Departments and the Office of Emergency Management Cost/Funding: The review and application process is expected to be a relatively low cost activity, associated primarily with staff time, funded from current budgets. Schedule: This activity is expected to be completed by Summer 2005.

COASTAL BEND MITIGATION ACTION PLAN 176
Project Number: NU-25 Project Name: Enhance Building Code Effectiveness Grade (BCEG) Rating Participating Jurisdiction(s): City of Corpus Christi Objective(s): Code adoption and ongoing code enforcement are directly related to Objective 3.6, reducing vulnerability of future development and 3.5 related to existing development when falling under substantial damage provisions. Objective 3.2 related to increasing participation in available insurance options. Priority: High Description/Background: Insurance Services Office, Inc. (ISO) is an independent organization that administers the Building Code Effectiveness Grading Schedule (BECGS) to assess "the building codes in effect in a particular community and how the community enforces its building codes, with special emphasis on mitigation of losses from natural hazards." The grading can have an effect on the cost of insurance coverage in the community. Since its last assessment, the City of Corpus Christi has adopted the 2003 International Building Code and the 2003 International Residential Code for One and Two Family Dwellings, among others, and should be eligible for an improved grade. This activity includes scheduling a re-assessment and compiling the necessary documentation. Lead/Participating Agencies: City of Corpus Christi Department of Development Services Cost/Funding: The scheduling and preparation for an ISO assessment is expected to be a relatively low cost activity, associated primarily with staff time, funded from current budgets. Schedule: This activity is expected to be completed by December 2004.

COASTAL BEND MITIGATION ACTION PLAN 177
Project Number: NU-26 Project Name: Emergency Generators for Oso Waste Water Treatment Facility Participating Jurisdiction(s): City of Corpus Christi Objective(s): Objective 1.7 related to reducing secondary impacts to health and safety from cascading effects; Objective 2.1 related to minimizing disruption to utilities. Priority: Medium Description/Background: The existing Oso Wastewater Treatment Plant facility depends entirely on outside utility power sources. In the event of power outages, wastewater treatment is not possible. Emergency power generating systems on site would help to ensure that the facility remains in operation during power outages, and protect public health and welfare. Design of the emergency power systems is currently underway. Lead/Participating Agencies: City of Corpus Christi Wastewater and Engineering Services Departments Cost/Funding: Project cost is estimated at $1,850,000 with potential funding from the sale of City utility revenue bonds. Schedule: Estimated time to complete project construction is 24-30 months, contingent upon secured funding.

COASTAL BEND MITIGATION ACTION PLAN 178
Project Number: NU-27 Project Name: Flood Proof 4 Lift Stations at Oso Waste Water Treatment Facility Participating Jurisdiction(s): City of Corpus Christi Objective(s): Objective 1.7 related to reducing secondary impacts to health and safety from cascading effects; Objective 2.1 related to minimizing disruption to utilities. Priority: Medium Description/Background: The Oso Treatment Plant is situated in a location subject to flooding from coastal inundation. The wastewater lift stations are also vulnerable to flooding. The proposed improvements could include structural elevation and/or the installation of dikes, berms or other flood control devices. Lead/Participating Agencies: City of Corpus Christi Wastewater and Engineering Services Depts. Cost/Funding: Project cost is estimated at $160,000, with funding currently unidentified. Potential partial funding opportunities may be available from state or federal grants, and/or the City Utility Enterprise Fund. Schedule: Estimated 18-24 months to complete from project start, contingent upon secured funding.

COASTAL BEND MITIGATION ACTION PLAN 179
Project Number: NU-28 Project Name: Flood Proof Electrical Systems at Greenwood Waste Water Treatment Facility Participating Jurisdiction(s): City of Corpus Christi Objective(s): Objective 1.7 related to reducing secondary impacts to health and safety from cascading effects; Objective 2.1 related to minimizing disruption to utilities. Priority: Medium Description/Background: Portions of the Greenwood wastewater treatment plant are located immediately adjacent to the La Volla Creek floodplain. Recent flood events have inundated various process units at the plant. Flood waters have come very close to damaging equipment in the electrical building which is critical to plant operations. This project would provide flood protection for the electrical building and would help to ensure that the plant remains in operation during flood events, and protect public health and welfare. Lead/Participating Agencies: City of Corpus Christi Department of Engineering Services and Wastewater Depts. Cost/Funding: Estimated cost of this project is $90,000, with funding from City Utility Revenue Bonds. Schedule: This project is scheduled to be completed by the end of October 2004.

COASTAL BEND MITIGATION ACTION PLAN 180
Project Number: NU-29 Project Name: Inspection and Maintenance at Wesley Seale Dam Participating Jurisdiction(s): City of Corpus Christi Objective(s): Objective 1.3 related to reducing life-threatening impacts of natural hazards (flood). Priority: High Description/Background: Lake Corpus Christi, which stores 242,241 acre-feet of water, was dedicated April 26, 1958 with the construction of Wesley Seale Dam. The Lower Nueces River Water Supply District built and owned the reservoir until the bonds were paid off in 1986 and the City of Corpus Christi assumed ownership. Wesley Seale Dam is located approximately 35 miles from Corpus Christi, Texas. This facility is used to store raw water that flows down the Nueces River from the northern part of the watershed. During March 2001, the Wesley Seale Dam north and south spillway stabilization project was completed. This $22 million project included the installation of special equipment to monitor the stability of the dam structure. This equipment is presently being utilized as part of the City's overall dam monitoring plan. Information included in the program is obtained from equipment and flow measurements from piezometers, extensometers, relief wells, and sand drains. Inspections are conducted on a daily and monthly basis by Water Department staff, with extra inspections occurring during crest gate operation. In addition, formal inspections are conducted annually by an independent engineering firm, and a highly detailed inspection is scheduled for every three years. Lead/Participating Agencies: City of Corpus Christi Water Dept. Cost/Funding: Annual cost is estimated at $200,000-300,000, funded from current and future operating budgets. Schedule: This is an ongoing activity.

COASTAL BEND MITIGATION ACTION PLAN 181
Project Number: NU-33 Project Name: Elevate Power Transfer Switch at Police Dept. HQ Participating Jurisdiction(s): City of Corpus Christi Objective(s): Objective 1.2 related to preserving emergency response capability. Priority: High Description/Background: The Police Headquarters building is located in an area of downtown Corpus Christi that is vulnerable to street flooding. The automatic generator transfer switch is presently located in a control room on the ground floor of the building. If the switch is damaged due to flooding, the Police Headquarters building, the 9-1-1 call taking/dispatch function, and the Metro-Com emergency alert and notification systems would be without electrical power, even if the auxiliary generator was undamaged. Lead/Participating Agencies: City of Corpus Christi Police Dept. Cost/Funding: Project cost is estimated at $36,000, with funding currently unidentified. Potential funding sources include state/federal grant programs or City General Fund. Schedule: Estimated 6 months or less to complete, contingent upon secured funding.

COASTAL BEND MITIGATION ACTION PLAN 182
Project Number: NU-34 Project Name: Uninterruptible Power Supply System for Emergency Operations Center (EOC) Participating Jurisdiction(s): City of Corpus Christi Objective(s): Objective 1.2 related to preserving emergency response capability. Priority: High Description/Background: Install an Uninterruptible Power Supply (UPS) system compatible with the existing auxiliary generator which provides emergency power to the Emergency Operations Center (EOC) and alternate 9-1-1 call center/dispatch function. A UPS system designed to work with the auxiliary generator, would ensure that computers in the EOC and alternate 9-1-1 center would not lose functionality during the transition to backup power. Lead/Participating Agencies: City of Corpus Christi Office of Emergency Management Cost/Funding: Estimated cost of this project is $35,000, with funding currently unidentified. Potential funding sources include state/federal grant programs and/or the City General Fund. Schedule: Estimated time to complete this project is 6 months or less, contingent upon secured funding.

COASTAL BEND MITIGATION ACTION PLAN 183
Project Number: NU-35 Project Name: Evaluate Participation in the NFIP Community Rating System Program Participating Jurisdiction(s): City of Port Aransas Objective(s): Multiple mitigation objectives as well as Objective 3.2 related to increasing participation in available insurance protection. Priority: Medium Description/Background: Evaluate eligibility for participation in National Flood Insurance Program (NFIP) Community Rating System (CRS) for the purpose of improving CRS rating to qualify policyholders for premium discounts. The City of Port Aransas currently has a rating of 10, which is automatically assigned to all communities participating in the NFIP. In order to qualify for a rating of 9, and entry into the CRS program, sufficient points must be scored in a variety of program areas. This activity is to investigate whether Port Aransas currently can achieve the required score, or can do so with improvement in its program areas. Lead/Participating Agencies: City of Port Aransas Floodplain Administrator Cost/Funding: This activity is expected to be low cost, associated primarily with staff time, funded from current budgets. Schedule: It is estimated that this activity could be completed in 6 months or less.

COASTAL BEND MITIGATION ACTION PLAN 184
Project Number: NU-36 Project Name: Replace Wire-suspended Traffic Signals Participating Jurisdiction(s): City of Port Aransas and Texas Dept. of Transportation Objective(s): Objective 2.2 related to minimizing disruption of transportation infrastructure. Priority: Low Description/Background: Replace two wire-suspended traffic control signals with post-mounted signals at Cotter and Allister Streets to prevent the loss of the equipment due to high winds associated with hurricanes, to prevent secondary damage from wind-born debris, and to enhance recovery of transportation systems. Lead/Participating Agencies: City of Port Aransas Public Works Dept. and Texas Dept. of Transportation. Cost/Funding: Project cost is estimated at $2,000, with potential funding from future City operating budget. Schedule: This project could be completed during FY 2013, pending secured project funding.

COASTAL BEND MITIGATION ACTION PLAN 185
Project Number: NU-37 Project Name: Purchase Three Satellite Telephones Participating Jurisdiction(s): City of Port Aransas Objective(s): Objective 1.2 related to preserving emergency response capability. Priority: High Description/Background: In the event of disruption to regular telephone or cellular service, an alternate means of communication is required as backup to request emergency assistance and to maintain direction and control of response activities, especially in the situation where the EOC has been relocated inland to Seguin, in accordance with the Emergency Management Plan. Lead/Participating Agencies: City of Port Aransas Police Dept. Cost/Funding: Project cost is estimated to be $6,000, with funding from the Homeland Security equipment grant program. Schedule: This project is expected to be completed during FY 2012, pending secured funding.

COASTAL BEND MITIGATION ACTION PLAN 186
Project Number: NU-40 Project Name: Incorporate Mitigation into Public Awareness Outreach Participating Jurisdiction(s): City of Port Aransas Objective(s): Objective 3.1 related to increasing private investment in mitigation. Priority: High Description/Background: Identify opportunities to increase home and business owner awareness of hazards and use of mitigation for private property such as the City Web site and distribution of printed literature. The City of Port Aransas has a City Web site that can be updated to promote mitigation activities by residents and businesses; mitigation literature can be added to other emergency preparedness literature currently distributed annually. Lead/Participating Agencies: City of Port Aransas Emergency Management Cost/Funding: This activity is estimated to cost $1,000 or less, with funding currently unidentified. Potential funding sources include current City budget and/or state/federal grant programs. Schedule: Initial activity could be completed during FY 2013, with follow up activities ongoing.

COASTAL BEND MITIGATION ACTION PLAN 187
Project Number: NU-41 Project Name: Ongoing Bulkhead Maintenance and Repair Participating Jurisdiction(s): City of Port Aransas Objective(s): Objective 4.1 related to protecting public investment in community-owned facilities and infrastructure. Priority: Medium Description/Background: This project pertains to coastal erosion of the bulkheading along the Corpus Christi Ship Channel, and the Municipal Marina. Ship traffic in the channel has consistently eroded the west side of the island. Existing bulk-heading in the Municipal Harbor has been undermined by the tides. Lead/Participating Agencies: City of Port Aransas Public Works Dept. Cost/Funding: Total cost of these projects is estimated at $785,000, with funding from the City of Port Aransas and the Texas General Land Office. Schedule: This is an ongoing activity.

COASTAL BEND MITIGATION ACTION PLAN 188
Project Number: NU-43 Project Name: Storm Shutters for Emergency Operations Center Participating Jurisdiction(s): City of Robstown
Objective(s): Objective 1.2 related to preserving emergency response capability. Priority: Medium Description/Background: Install hurricane shutters at Police Department headquarters, which serves as the primary Emergency Operations Center (EOC). The building has a large glass plate front window measuring 18 ft by 18 ft, and two 6 ft by 10 ft glass plates in the rear, which would be vulnerable to wind-born debris under hurricane conditions. Lead/Participating Agencies: City of Robstown Emergency Management and Police Dept. Cost/Funding: This project is estimated to cost $18,000 with funding currently unidentified. Potential partial funding opportunities may be available from state or federal grants. Schedule: Estimated 1 month or less to complete from project start, contingent upon secured funding.

COASTAL BEND MITIGATION ACTION PLAN 189
Project Number: NU-44 Project Name: Adopt 2003 International Building Codes Participating Jurisdiction(s): City of Robstown Objective(s): Objective 3.6 related to reducing vulnerability of future development. Priority: High Description/Background: Adoption and enforcement of the International Building Code will result in improved disaster resistance of future development. Lead/Participating Agencies: City of Robstown Building Inspector Cost/Funding: Cost associated with adoption of the building code are expected to be minimal, $1,000 or less, funding through current budgets. Schedule: Estimated 3 month or less to complete from project start.

COASTAL BEND MITIGATION ACTION PLAN 190
Project Number: NU-45 Project Name: Study Feasibility of Second Electrical Substation Participating Jurisdiction(s): City of Robstown Utility Systems Objective(s): Objective 2.1 related to minimizing disruption to utilities. Priority: Medium Description/Background: Evaluate alternative options for a second electrical sub-station, make recommendations and implement. The electrical utility serving Robstown is owned and operated by City of Robstown Utility Systems, established as a public entity in accordance with Texas Law. There is presently only one electrical sub-station serving the community. In the event of disruption by a natural or other disaster, the entire community could be significantly impacted by an extended loss of service. Lead/Participating Agencies: City of Robstown Utility Systems Cost/Funding: Cost associated with a second substation is estimated at $1,000,000, with funding currently unidentified. Potential funding sources include state/federal grants, operating revenues, bonds. Schedule: Estimated project completion is 12 months, contingent upon secured funding.

COASTAL BEND MITIGATION ACTION PLAN 191
Project Number: NU-46 Project Name: Study Feasibility of Second Natural Gas Gate Participating Jurisdiction(s): City of Robstown Utility Systems Objective(s): Objective 2.1 related to minimizing disruption to utilities. Priority: Medium Description/Background: Evaluate alternative options for a second natural gas gate, make recommendations and implement. The natural gas utility serving Robstown is owned and operated by City of Robstown Utility Systems, established as a public entity in accordance with Texas Law. There is presently only one natural gas gate serving the community. In the event of disruption by a natural or other disaster, the entire community could be significantly impacted by an extended loss of service. Lead/Participating Agencies: City of Robstown Utility Systems Cost/Funding: Estimated cost of this project is $350,000, with funding presently unidentified. Potential funding sources include state/federal grants, operating revenues, bonds. Schedule: Estimated 6 months to complete from project start, contingent upon secured funding.

COASTAL BEND MITIGATION ACTION PLAN 192
Project Number: NU-49 Project Name: Prevent Erosion of Sunfish Island Participating Jurisdiction(s): City of Corpus Christi Objective(s): Objective 4.4 related to minimizing environmental impacts. Priority: Medium Description/Background: Project is permitted and ready to go – just needs funding. Coastal erosion in Corpus Christi Bay is very high and if the project is not done soon, the entire island may erode away and would have to be rebuilt (or abandoned). Sunfish Island is an important bird sanctuary in the Corpus Christi area. An alternatives analysis and engineering design were conducted for Sunfish Island during CEPRA Cycle 2. Construction could not be done due to restrictions during bird nesting season. Lead/Participating Agencies: City of Corpus Christi Engineering Department Cost/Funding: Estimated cost is $500,000 to $1,000,000 with potential funding from the Coastal Erosion Planning and Response Program (CEPRA), Coastal Bend Bays and Estuaries Program, U.S. Fish and Wildlife Service Schedule: Estimated 18 to 24 months to complete from project start, contingent upon secured funding.

COASTAL BEND MITIGATION ACTION PLAN 193
Project Number: NU-50 Project Name: Prevent Erosion at Cole Park Participating Jurisdiction(s): City of Corpus Christi Objective(s): Objective 4.1 related to protecting public investment in community-owned facilities and infrastructure; Objective 4.4 related to minimizing environmental impacts. Priority: Medium Description/Background: Prevention of further erosion of shoreline at Cole Park on Corpus Christi Bay through installation of groins and/or breakwaters. Cole Park is a high use park in Corpus Christi. The area behind the bulkhead is eroding and needs to be retrofitted. Lead/Participating Agencies: City of Corpus Christi Parks Department Cost/Funding: Estimated cost is $500,000 to $1,000,000 with potential funding from the Coastal Erosion Planning and Response Program (CEPRA), Texas Parks and Wildlife Outdoor Recreation Grant Program. Schedule: Estimated 24 months to 30 months to complete from project start, contingent upon secured funding.

COASTAL BEND MITIGATION ACTION PLAN 194
Project Number: NU-51 Project Name: Community Wildfire Risk Assessment Participating Jurisdiction(s): Nueces County Objective(s): 1.3 Utilize available mitigation measures to prevent or reduce life-threating impacts of natural hazards. Priority: High Description/Background: Conduct a Community Wildfire Risk Assessment for Nueces County. The County is geographically diverse and has a substantial urban/rural interface with heavy fuel loads making portions of the county highly susceptible to potentially catastrophic wildfires. Additionally, the County experiences drought or near drought conditions almost annually and is placed under numerous red flag condition warnings by the National Weather Service. The assessment will evaluate fuels and population vulnerabilities as well as examine current fire response capabilities. This assessment will be used by the local fire departments to develop a Community Wildfire Protection Plan. The 2008 wildfire season was very challenging for fire departments throughout the region. There were numerous very large wildfires in Nueces County with the potential to cause millions of dollars in property loses and had a great potential for loss of life. The Laureles Fire in the Laureles Division of the King Ranch threatened thousands of homes on the south side of Corpus Christi and required Texas Military Forces support with UH-60 helicopters conducting water drops under the direction of the Texas Forest Services and the then Governor’s Division of Emergency Management. Several additional large fires threatened residents living on North Padre Island near the National Seashore. The light dry fuels and high winds created extremely dangerous firefighting conditions. Lead/Participating Agencies: Nueces County OEM and all local fire departments. Cost/Funding: $ 5,000 / Texas Forest Service Hurricane Ike County-Wide Protection Plan Grant. Schedule: 2012

COASTAL BEND MITIGATION ACTION PLAN 195
Project Number: NU-52 Project Name: Community Wildfire Protection Plan Participating Jurisdiction(s): Nueces County Objective(s): 1.3 Utilize available mitigation measures to prevent or reduce life-threating impacts of natural hazards. Priority: High Description/Background: Develop a Community Wildfire Protection Plan in cooperation with the local fire departments. This process will take into consideration the information identified within the Community Wildfire Risk Assessment to serve as an aid in developing a protection plan that critically assesses existing capabilities and potentially identifies areas needed for improvement. The County is geographically diverse and has a substantial urban/rural interface with heavy fuel loads making portions of the county highly susceptible to potentially catastrophic wildfires. Additionally, the County experiences drought or near drought conditions almost annually and is placed under numerous red flag condition warnings by the National Weather Service. The County has numerous fire departments including five Emergency Services Districts (ESD). All but one ESD is completely volunteer. Additionally, there is a volunteer city department in the City of Port Aransas and paid departments in the City of Robstown and Corpus Christi. There is also one fully paid private fire company serving the Port Industries of Corpus Christi. The 2008 wildfire season was very challenging for fire departments throughout the region. There were numerous very large wildfires in Nueces County with the potential to cause millions of dollars in property loses and had a great potential for loss of life. The Laureles Fire in the Laureles Division of the King Ranch threatened thousands of homes on the south side of Corpus Christi and required Texas Military Forces support with UH-60 helicopters conducting water drops under the direction of the Texas Forest Services and the then Governor’s Division of Emergency Management. Several additional large fires threatened residents living on North Padre Island near the National Seashore. The light dry fuels and high winds created extremely dangerous firefighting conditions. Lead/Participating Agencies: Nueces County OEM and all local fire departments. Cost/Funding: $ 5,000 / Texas Forest Service Hurricane Ike County-Wide Protection Plan Grant. Schedule: 2012

COASTAL BEND MITIGATION ACTION PLAN 196
Project Number: NU-53 Project Name: Master Drainage Plan Implementation Participating Jurisdiction(s): Nueces County, Robstown, Driscoll, Agua Dulce Objective(s): 3.4 Utilize available mitigation measures to prevent or reduce economic losses from natural hazards. Priority: Medium Description/Background: Nueces County finished a countywide Master Drainage Plan Study and developed the Master Drainage Implementation Plan as a guide for prioritizing and implementing the improvements identified as part of the study. The priorities outlined in the implementation plan are items which will have an immediate impact on storm water management for areas experiencing flooding problems. Nueces County is susceptible to flooding because some of its defined drainage ways and creeks are constricted by inadequate channel capacities, man-made barriers such as road and railroad embankments, irrigation canals, and because its flat topography and low soil permeability create poor drainage and pounding. Implementation Plan for Master Drainage Plan Nueces County, Texas December 2009 identifies major improvements which will be required throughout the county once future development occurs. The recommendations in the study provide a guide for the county in implementing a plan which will reduce flood damages through both structural and non-structural measures. Structural measures include enlarging existing channels, constructing new channels, enlarging bridge openings and constructing flood protection levees. Non structural measures include floodplain regulation, flood proofing, flood forecasting, on-site detention of storm water, clearing existing streams, and buyout and/or relocate structures in existing floodplains. Lead/Participating Agencies: Nueces County Commissioners Court Cost/Funding: $ 258,587,835 / In order to implement the recommended Master Plan Improvements, Nueces County will need to develop a mechanism for funding the improvements and the annual maintenance cost for the facilities. Common funding options include the issuance of bonds, however the County must have a means for paying back the bonds. Common means include taxes, utility fees and storm water impact fees. Additionally, the County could pursue state of federal funding through direct appropriations in a bill or through grants. In addition, the County could have other entities share in the burden of some of the costs, including the local communities, drainage districts and the Texas Department of Transportation. A countywide drainage district has been proposed as a means of funding the improvements through property taxes, to replace the two currently existing drainage districts. This would require action in the state legislature. Schedule: 2020

COASTAL BEND MITIGATION ACTION PLAN 197
Project Number: NU-54 Project Name: Nueces County Hurricane Shutters Participating Jurisdiction(s): Nueces County Objective(s): 4.1 Protect public investment in community-owned facilities and infrastructure through appropriate structural, non-structural, and financial methods. Priority: High Description/Background: Purchase and install storm shutters for county-owned buildings as identified and maintained by the public works department. Many of these buildings have large glass windows making the facilities vulnerable to wind-born debris under hurricane conditions. The buildings have a diverse glass windows, which would be vulnerable to wind-borne debris under hurricane conditions. Lead/Participating Agencies: Nueces County Public Works Department Cost/Funding: $375,000 / Hazard Mitigation Grant Program Schedule: Once funding is secure, this project is expected to take approximately 6 months to complete.

COASTAL BEND MITIGATION ACTION PLAN 198
Project Number: NU-55 Project Name: Repetitive Flood Buyouts Participating Jurisdiction(s): Nueces County, Precinct 1 Objective(s): 3.5, Reduce vulnerability of existing development by participating in buy-out or flood-proofing opportunities. Priority: Medium
Description/Background: Residential flood buyout along Nueces River to reduce repetitive losses and potential loss of life attributed to a major flood event or dam failure. Residential development along the river in the unincorporated areas is a patchwork of substandard homes and development well below recommended base elevation for the 100 year floodplain. Most of the property owners are not insured and have had numerous repetitive loses. Additionally, this project will leverage existing partnerships with an interest in maintaining a clean, safe and reliable water supply for the City of Corpus Christi as part of the Nueces River Watershed Protection Plan. The Nueces River Authority, City of Corpus Christi, Texas Commission on Environmental Quality and Coastal Bend Bays and Estuaries Foundation support continued buyouts along the river to maintain open green space and to aid in removing environmentally undesirable structures responsible for runoff pollutants and raw sewage discharges. This program will be multi year and will leverage multiple funding sources and partners. There are currently 66 eligible properties in Nueces County for the Repetitive Flood Claims Grant. Approximately 15 residential properties are located within the unincorporated areas of the county and would be the first targeted for participation. Additional properties will be targeted as part of the less restrictive Hazard Mitigation Grant Program. The City of Corpus Christi failed to meet state water quality standards in November 2009 attributed to high levels of pollutants caused by runoff from heavy rain. As part of the necessary corrective actions, the City partnered to develop the Nueces River Watershed Protection Plan. This project will support the established mission and goals set forth in the plan to create environmentally friendly open space. Lead/Participating Agencies: Nueces County Emergency Management, Grants Department, and Precinct 1 Cost/Funding: $ 1,000,000.00
Schedule: 2015

COASTAL BEND MITIGATION ACTION PLAN 199
Project Number: NU-56 Project Name: Emergency Generators for Courthouse Participating Jurisdiction(s): Nueces County Objective(s): 2.3 Minimize disruptions to governmental, educational, and other institutions providing services to the public. Priority: High
Description/Background: Generator to power entire courthouse including HVAC system. The Nueces County Courthouse needs to operate during and after a disaster to ensure continuity of government. Nueces County Courthouse has limited emergency generation power for emergency lighting, one elevator and some limited information technology systems. The Emergency Operations Center and other valuable resources needed to maintain continuity of government are located in the Courthouse including the entire information technology system maintaining critical records and email. Lead/Participating Agencies: Nueces County Public Works Cost/Funding: $1,500,000 / Hazard Mitigation Grant Funding Schedule: 2015

COASTAL BEND MITIGATION ACTION PLAN 200
Project Number: NU-57 Project Name: Acquire emergency generator and switch for Nueces County Emergency Operations Center (EOC). Participating Jurisdiction(s): Nueces County Objective(s): 2.3 Minimize disruptions to governmental, educational, and other institutions providing services to the public. Priority: High Description/Background: Acquire emergency generator and switch for Nueces County Emergency Operations Center (EOC). Nueces County operates an EOC during emergencies. The emergency generator and a switch allow for continuous operations in the event of a loss of power to the courthouse. The switch gear allows for the center to disconnect from the building’s main power system and switch to this emergency generator. The Nueces County is relocating the EOC from the sheriff office location to the county court house building. This will provide the county with a sustainable EOC for all-hazards response. Currently the county does not have a sustainable EOC, if an incident is to occur the sheriff conference room is turned into an EOC. The design is poor with limited space and phones must be installed each activation for operation. Lead/Participating Agencies: Nueces County Office of Emergency Management Cost/Funding: $ 75,000 / Grants Schedule: 2015

COASTAL BEND MITIGATION ACTION PLAN 201
Project Number: NU-58 Project Name: Emergency Generators for Public Works Yards Participating Jurisdiction(s): Nueces County Objective(s): 2.3 Minimize disruptions to governmental, educational, and other institutions providing services to the public. Priority: HIGH Description/Background: Acquire a generator to power Public work yards for the Nueces County. Public Works needs to operate during and after a disaster to ensure continuity of government. Central Yard, 4 Yard, Robstown Yard, and the County Airport are outlying satellite support facilities for Public Works. All county operations are dependent on the full operation of these facilities strategically located throughout the county Lead/Participating Agencies: Nueces County Public Works Cost/Funding: $ 240,000.00 / Grant Schedule: 2015

COASTAL BEND MITIGATION ACTION PLAN 202
Project Number: NU-59 Project Name: Gasoline Tank for Public Works Yards Participating Jurisdiction(s): Nueces County Objective(s): 2.3 Minimize disruptions to governmental, educational, and other institutions providing services. Priority: High
Description/Background: Install 8,000 gallon unleaded fuel tanks at each of the Public Works Yards (3). Currently, all unleaded fuel operated county vehicles, including Sheriff’s Office and Constables, fully rely upon the availability of commercial fuel stations. During emergencies, fuel availability may be limited due to lack of fuel or inability to pump due to loss of power. Control and accessibility to fuel is of critical importance to maintain public safety and restore critical infrastructure. Each of the public works yards currently have in-ground diesel tanks with emergency power back up and an established mechanism to distribute to county vehicles. The addition of the unleaded tanks would augment the current distribution mechanisms already in place and keep the county from being dependent on commercial vendors and expensive emergency fuel contracts during emergencies. Lead/Participating Agencies: Nueces County Public Works Department
Cost/Funding: $225,000.00
Schedule: 2016

COASTAL BEND MITIGATION ACTION PLAN 203
Project Number: NU-60 Project Name: Geographical Information System (GIS) Enhancement Participating Jurisdiction(s): Nueces County Objective(s): 2.2 Minimize disruption to and enhance rapid restoration of essential transportation infrastructure. Priority: MEDIUM
Description/Background: Upgrade geographical information system strategies and technology to provide accurate and timely information to internal and external stakeholders during emergencies. This will aid in response and recovery efforts by providing enhanced situational awareness and critical data necessary for damage assessments and cost recovery estimates. Enhancements should include a comprehensive data management strategy, standardized software tools and an enterprise geo-database. In Nueces County, GIS is a relatively new technology that several Departments have begun using in recent years. For example, the County Clerk’s Department uses a product called MapInfo to produce jurisdictional boundary maps. The Public Works Department is developing a roadway and facility infrastructure asset management system using ESRI Arc-GIS products and the 911 Coordinator uses MapInfo to track rural address locations. Additionally, the Office Emergency Management is also collecting disparate data sources for purposes of planning for special needs evacuation and damage assessment but does not have the required software to alter or properly manipulate data without outside assistance. In order to centralize enterprise data, the County will need to perform a comprehensive study to determine where data is currently located and who maintains the data. Then the data would be cataloged and implemented into a single enterprise location and made available as appropriate to GIS applications targeted for internal and external stakeholders. This study and implementation would be performed by subject matter experts via a professional services contract. Estimated cost is $100,000 The GIS platform would include 20 additional copies of ESRI Arc-GIS software; 10 copies of ESRI map publisher extension; and a web server running Arc-IMS to render GIS maps, analytical tools and dash board rollup reports via an internet browser. Estimated initial software cost is $50,000. Ideally, the shared platform would provide a single location to store the production geo-database along with metadata to help end users to qualify the data. This multi-user geo-database is essential in that internal users would know where to get the correct information and avoid the need to create duplicate data to generate a graphic or report. In times of emergency, the data would be available in a more timely fashion without the need to bring in an expert to spend time researching and collecting data. This increased collaboration and information sharing is essential during an emergency and is more efficient during day-to-day operations. The geo-database requires an enterprise server running an RDBMS (relational database management system) along with ESRI Arc-SDE technology. Estimated initial hardware and software cost is $40,000. Lead/Participating Agencies: Nueces County Public Works Department Cost/Funding: $ 190,000 / Hazard Mitigation Grant Program Schedule: 2013

COASTAL BEND MITIGATION ACTION PLAN 204
Project Number: NU-61 Project Name: Social Vulnerability Study Participating Jurisdiction(s): Nueces County Objective(s): 1.6 Reduce life- or health-threatening impacts on individuals with special physical care requirements Priority: High
Description/Background: Conduct a comprehensive social vulnerability study for Nueces County to identify at-risk/special needs populations for use in emergency management planning for special needs. Special emphasis will be given for individuals living in rural subdivision and colonias including the undocumented. This study is to be conducted in cooperation with Texas A&M University Corpus Christi. All hazards planning is difficult to achieve when there is incomplete demographic information available for the targeted population. Similar studies have been conducted in other geographically vulnerable areas such as the Lower Rio Grande Valley with great success. Having a clear understanding of the population will allow for better coordination and planning for hurricane evacuations to include proper request of outside resources.
Lead/Participating Agencies: Nueces County Office of Emergency Management
Cost/Funding: No Cost (TAMU FUNDED)/ NOAA: Assessing Community Resilience within the Coastal Bend Region of Texas grant project (TAMU Administered)
Schedule: 2012

COASTAL BEND MITIGATION ACTION PLAN 205
Project Number: NU-62 Project Name: Special Needs Public Education and Outreach Participating Jurisdiction(s): Nueces County Objective(s): 1.4 Reduce obstacles to timely and safe evacuation of hazard areas. Priority: Medium
Description/Background: Create and provide public education and outreach to special needs populations within Nueces County based on data collected from the social vulnerability study. With a clearer understanding of the target population, a much more focused public education program can be developed to reach the individual needs of specific vulnerable populations. Materials are to be produced in a minimum of both English and Spanish. Nueces County is at risk of being directly impacted by a tropical storm or hurricane every year. Recent studies have shown that South Texas is the most socially vulnerable population to natural disasters in the entire country due to risk factors such as obesity and diabetes. The preparedness campaign should reflect this information and be focused based on the specific needs of population that actually resides within Nueces County.
Lead/Participating Agencies: Nueces County Office of Emergency Management Cost/Funding: $ 10,000 / County Budget and NOAA: Assessing Community Resilience within the Coastal Bend Region of Texas grant project (TAMU Administered) Schedule: 2012

COASTAL BEND MITIGATION ACTION PLAN 206
Project Number: NU-63 Project Name: Emergency Generators for Lift Stations Participating Jurisdiction(s): City of Aransas Pass Objective(s): 2.3 Minimize disruption to governmental, educational, and other institutions providing services to the public. Priority: High
Description/Background: Acquire emergency generators for each of the City owned/ operated lift stations. City of Agua Dulce has three lift stations that should have uninterrupted power at all times to maintain continuity of government and to protect public health. All citizens and business owners remain concerned about their health and public safety due to continuous flooding and severe weather events often causing widespread power outages. Over the past several years, there have been numerous hazardous weather events that have directly affected the city. The Coastal Bend will continue to be susceptible to very heavy rainfall and tropical weather events putting the city in a continuous battle to stay accessible and safe for its citizens. Agua Dulce is geographically situated in a manner that makes it highly susceptible to flooding. Runoff to the west directly flows into the city and has almost no ability to continue to drain out, backing up into the streets and private property throughout the community. One of the city’s most critical facilities, the waste water lift stations on both the east and west side has continually been affected and the city has a great amount of trouble keeping these facilities operable during flooding.
Lead/Participating Agencies: City of Agua Dulce Cost/Funding: $ 60,000/ State or Federal Grants Schedule: 2014

COASTAL BEND MITIGATION ACTION PLAN 207
Project Number: NU-64 Project Name: Local Drainage Prioritization Plan Participating Jurisdiction(s): City of Agua Dulce Public Works Objective(s): 1.3 Utilize available mitigation measures to prevent or reduce life-threating impacts of natural hazards. Priority: High
Description/Background: The City does not currently have a clearly defined drainage plan and is only marginally affected by the county master plan. To improve drainage throughout the City of Agua Dulce, it is necessary to properly assess the community drainage needs and establish a local prioritization plan to serve as a guide to successful flood mitigation. All citizens and business owners remain concerned about their health and public safety due to continuous flooding. Over the past several years, there have been numerous flood events that have directly affected the City. The Coastal Bend will continue to be susceptible to very heavy rainfall and tropical weather events putting the City in a continuous battle to stay accessible and safe for its citizens. Agua Dulce is geographically situated in a manner that makes it highly susceptible to flooding. Runoff to the west directly flows into the City and has almost no ability to continue to drain out, backing up into the streets and private property throughout the community. One of the City’s most critical facilities, the waste-water lift stations on both the east and west side has continually been affected and the City has a great amount of trouble keeping these facilities operable during flooding. In addition to the already mentioned issues, travel near and through the community is limited on a regular basis including a very heavily highway that is also a critical hurricane evacuation route.
Lead/Participating Agencies: City of Agua Dulce Cost/Funding: $ 200,000.00/ State or Federal Grants Schedule: 2014

COASTAL BEND MITIGATION ACTION PLAN 208
Project Number: NU-65
Project Name: Road Elevation and Repair Participating Jurisdiction(s): City of Driscoll Objective(s): 3.5 Reduce vulnerability of existing development by participating in buy-out or flood-proofing opportunities. Priority: High
Description/Background: Elevate and re-grade dilapidated roads. Many of the City’s roads have sunk significantly and are a contributing factor to many of flood issues throughout the community. Repetitive flood damages have caused maintenance costs to be burdensome on the City. Upgrades from caliche to a more standard road surface would greatly enhance the ability of the road system to tolerate nuisance and reoccurring flooding. The City of Driscoll was first formed as a community in 1904 and was later incorporated as a Class C City in 1951. The City’s infrastructure and buildings are very old and is located in an area that is very flat, causing it to be prone to flash floods. Aggressive debris control and flood-proofing is essential to mitigate against flooding and hurricane winds. All citizens and business owners remain concerned about their health and public safety due to continuous flooding. Over the past several years, there have been numerous flood events that have directly affected the City. The Coastal Bend will continue to be susceptible to very heavy rainfall and tropical weather events putting the City in a continuous battle to stay accessible and safe for its citizens. In addition to the already mentioned issues, travel near and through the community is limited on a regular basis including a very heavily highway that is also a critical hurricane evacuation route.
Lead/Participating Agencies: City of Driscoll Public Works Cost/Funding: $ $8.75 million / State or Federal Grants Schedule: Upcoming year

COASTAL BEND MITIGATION ACTION PLAN 209
Project Number: NU-66
Project Name: Debris Removal and Drainage Enhancements
Participating Jurisdiction(s): City of Driscoll Objective(s): 3.5 Reduce vulnerability of existing development by participating in buy-out or flood-proofing opportunities. Priority: High
Description/Background: Conduct debris removal operations and incorporate drainage enhancements that will reduce the incidence of flooding. This will include upgrades to culverts and leveraging City and private maintenance of construction projects. This project will further be enhanced by the road elevation and re-grade project. The City of Driscoll was first formed as a community in 1904 and was later incorporated as a Class C City in 1951. The City’s infrastructure and buildings are very old and is located in an area that is very flat, causing it to be prone to flash floods. Aggressive debris control and flood-proofing is essential to mitigate against flooding and hurricane winds. All citizens and business owners remain concerned about their health and public safety due to continuous flooding. Over the past several years, there have been numerous flood events that have directly affected the City. The Coastal Bend will continue to be susceptible to very heavy rainfall and tropical weather events putting the City in a continuous battle to stay accessible and safe for its citizens. In addition to the already mentioned issues, travel near and through the community is limited on a regular basis including a very heavily highway that is also a critical hurricane evacuation route. Lead/Participating Agencies: City of Driscoll Public Works Cost/Funding: $325,500 / State or Federal Grants
Schedule: Upcoming year

COASTAL BEND MITIGATION ACTION PLAN 210
Project Number: SP-02
Project Name: Flood Proof Repetitive Loss Homes Participating Jurisdiction(s): San Patricio County Objective(s): Objective 3.5 related to reducing vulnerability of existing development. Priority: Low Description/Background: Re-Furbish, Flood proof Repetitive Loss Homes damaged by Declared Disasters. San Patricio County obtained monies to complete 40 home rebuilds and has approximately 60 homes which are qualified but has no funding at this time. Many residential structures were damaged by storms in 2002. Insurance was non-existent, or coverage was not provided for by the homeowner, who were either elderly, low-income, or unaware that coverage on normal homeowner’s insurance does not provide for flood or wind storm damage. Lead/Participating Agencies: San Patricio County Emergency Management with participation by the Texas state Office of Community and Rural Affairs (ORCA). Cost/Funding: Estimated cost of flood proofing/refurbishing remaining 60 homes is estimated at $4,500,000, with funding currently unidentified. Potential funding sources includes ORCA. Schedule: This activity could be completed by 2013, contingent upon secured funding.

COASTAL BEND MITIGATION ACTION PLAN 211
Project Number: SP-03 Project Name: Flood Buyout in Peaceful Valley, San Patricio River Estates, La Fruita Subdivisions Participating Jurisdiction(s): San Patricio County Objective(s): Objective 3.5 related to reducing vulnerability of existing development. Priority: Low Description/Background: The Nueces River has had three major flood events, two Presidential declarations in 2002, and a non-declared event in 2003. The property is located in the 100 year floodplain, with portions in the floodway. San Patricio County has procured nine properties in the area, 6 in River Estates and 3 in Peaceful Valley through FEMA & ORCA Grants. We are in the process of purchasing one 600 acre parcel through the Coastal Bays and Estuary Program, and 13 tracts through a Texas General Land Office Grant (GLO) in the La Fruita Subdivision on the Nueces River. Lead/Participating Agencies: San Patricio County Emergency Management with participation by the Texas state Office of Rural and Community Affairs (ORCA), State of Texas Division of Emergency Management, and FEMA Cost/Funding: Cost of purchasing additional properties is estimated at $20,000,000, with funding presently unidentified. Potential funding sources include FEMA, ORCA, and GLO. Schedule: This activity could be completed by 2020, contingent upon secured funding.

COASTAL BEND MITIGATION ACTION PLAN 212
Project Number: SP-04 Project Name: Outdoor Warning Sirens Participating Jurisdiction(s): City of Ingleside Objective(s): Objective 1.1 related to improving the delivery of warnings. Priority: High Description/Background: The City of Ingleside currently has a warning siren that is out of service. This project is to replace that equipment for the purpose of alerting residents to impending natural and manmade hazards. Lead/Participating Agencies: City of Ingleside Fire Service Cost/Funding: Estimated at $75,000 with funding presently unidentified. Potential partial funding opportunities may be available from state or federal grants. Schedule: Estimated 3 months or less completion from project start, contingent upon secured funding.

COASTAL BEND MITIGATION ACTION PLAN 213
Project Number: SP-05 Project Name: Obtain Drainage Right of Ways on Avenue A Participating Jurisdiction(s): City of Ingleside Objective(s): Objective 3.4 related to mitigating economic losses from natural hazards (flooding). Priority: Medium Description/Background: Secure drainage right of ways along Avenue A in the area near 4th to 8th Street. This section of Avenue A has historically been inundated by heavy rain events due to poor drainage, cutting off access to area residences. Lead/Participating Agencies: City of Ingleside Public Works Dept. Cost/Funding: Presently unknown. Survey costs, staff time, and legal fees associated with lengthy condemnation proceedings may comprise the major portion of costs, depending on the degree to which property owners will grant easements for no to low cost. Potential funding sources include current and future City budget. Schedule: This activity is expected to take two to three years to complete.

COASTAL BEND MITIGATION ACTION PLAN 214
Project Number: SP-06 Project Name: Obtain Drainage Right of Ways on California St. Participating Jurisdiction(s): City of Ingleside Objective(s): Objective 3.4 related to mitigating economic losses from natural hazards (flooding). Priority: Medium Description/Background: Conduct Engineering drainage study along California Street from West Main to the Kenney Bayou. Secure drainage right of ways to include possible property acquisition and utility relocation. This section of town has historically been inundated by heavy rain events due to poor drainage, cutting off access to area residences. Lead/Participating Agencies: City of Ingleside Public Works Dept. Cost/Funding: Presently unknown. Survey costs, staff time, and legal fees associated with lengthy condemnation proceedings may comprise the major portion of costs, depending on the degree to which property owners will grant easements for no to low cost. Potential funding sources include current and future City budget. Schedule: This activity is expected to take two to three years to complete.
COASTAL BEND MITIGATION ACTION PLAN 215
Project Number: SP-13 Project Name: Develop Drainage Master Plan Participating Jurisdiction(s): City of Portland Objective(s): Objective 3.4 related to reducing economic losses. Priority: Medium Description/Background: The City of Portland has no Master Drainage Plan that would guide future development, and prevent new developments from compounding existing drainage problems. This project would develop a Master Drainage Plan for the City of Portland. Lead/Participating Agencies: City of Portland Public Works Dept. Cost/Funding: The cost of this activity is estimated at $40,000, with funding currently unidentified. Potential funding sources include the City of Portland General Fund, City of Portland drainage fees, and the San Patricio County Drainage District. Schedule: It is estimated that this project could be completed in approximately 36 months, contingent upon secured funding.

COASTAL BEND MITIGATION ACTION PLAN 216
Project Number: SP-15 Project Name: Backup Generator for Taft Fire Dept Participating Jurisdiction(s): City Of Taft/San Patricio County Objective(s): 2.1 Minimize disruption to and enhance rapid restoration of utilities. Priority: High Description/Background: City has lost power numerous times due to brownouts and high winds causing disruption of vidal services. Install 30 kw generator to maintain continuity of government in case of loss of power due to brown outs or disaster related loss of power. Lead/Participating Agencies: San Patricio County Emergency Management Cost/Funding: $10,000 / Fire Grants/Homeland Security Grants Schedule: 2 months after procurement of grant funding.

COASTAL BEND MITIGATION ACTION PLAN 217
Project Number: SP-16 Project Name: Generator For Taft City Hall/Police Station Participating Jurisdiction(s): City Of Taft/San Patricio County Objective(s): 2.1 Minimize disruption to and enhance rapid restoration of utilities. Priority: High Description/Background: City has lost power numerous times due to brownouts and high winds causing disruption of vidal services. Install 30 kw generator to maintain continuity of government in case of loss of power due to brown outs or disaster related loss of power. Lead/Participating Agencies: San Patricio County Emergency Management Cost/Funding: $10,000 / Fire Grants/Homeland Security Grants Schedule: 2 months after procurement of grant funding.

COASTAL BEND MITIGATION ACTION PLAN 218
Project Number: SP-17 Project Name: Generator For Mathis Police Station Participating Jurisdiction(s): City Of Mathis / San Patricio County Objective(s): 2.1 Minimize disruption to and enhance rapid restoration of utilities. Priority: High Description/Background: City has lost power numerous times due to brownouts and high winds causing disruption of vidal services. Install 30 kw generator to maintain continuity of government in case of loss of power due to brown outs or disaster related loss of power. Lead/Participating Agencies: San Patricio County Emergency Management Cost/Funding: $10,000 / Fire Grants/Homeland Security Grants Schedule: 2 months after procurement of grant funding.

COASTAL BEND MITIGATION ACTION PLAN 219
Project Number: SP-18 Project Name: 10,000 Gallon Water Tank for City of Lake City Fire Protection Participating Jurisdiction(s): City of Lake City / San Patricio County Objective(s): 3.4 Utilize available mitigation measures to prevent or reduce economic losses from natural hazards. Priority: High Description/Background: City has had multiple fires and in drought years cannot draft from Lake Corpus Christi to refill fire trucks. Install a 10,000 gallon water tank to provide water to responding fire department’s to alleviate the need for fire trucks to leave the city and drive 10 miles to replenish water. Lead/Participating Agencies: San Patricio County Emergency Management Cost/Funding: $10,000 / Fire Grants Schedule: 1 week after receiving grant funding.

COASTAL BEND MITIGATION ACTION PLAN 220
Project Number: SP-19 Project Name: Generator for Sinton Police Station Participating Jurisdiction(s): City of Sinton and San Patricio County Objective(s): 2.1 Minimize disruption to and enhance rapid restoration of utilities. Priority: High Description/Background: City has lost power numerous times due to brownouts and high winds causing disruption of vidal services. Install 30 kw generator to maintain continuity of government in case of loss of power due to brown outs or disaster related loss of power. Lead/Participating Agencies: San Patricio County Emergency Management Cost/Funding: $ 10,000 / Fire and Homeland Security Grants Schedule: 2 months after receiving grant funding.

COASTAL BEND MITIGATION ACTION PLAN 221
Project Number: SP-20 Project Name: Generator for Mathis City Hall Participating Jurisdiction(s): City of Mathis / San Patricio County Objective(s): 2.1 Minimize disruption to and enhance rapid restoration of utilities. Priority: Medium Description/Background: City has lost power numerous times due to brownouts and high winds causing disruption of vidal services. Install 30 kw generator to maintain continuity of government in case of loss of power due to brown outs or disaster related loss of power. Lead/Participating Agencies: San Patricio County Emergency Management Cost/Funding: $10,000 / Fire Grants/Homeland Security Grants Schedule: 2 months after procurement of grant funding.

COASTAL BEND MITIGATION ACTION PLAN 222
Project Number: SP-21 Project Name: Generator for Gregory Fire Department Participating Jurisdiction(s): City of Gregory and San Patricio County Objective(s): 2.1 Minimize disruption to and enhance rapid restoration of utilities. Priority: High Description/Background: City has lost power numerous times due to brownouts and high winds causing disruption of vidal services. Install 30 kw generator to maintain continuity of government in case of loss of power due to brown outs or disaster related loss of power. Lead/Participating Agencies: San Patricio County Emergency Management Cost/Funding: $10,000 / Fire and Homeland Security Grants Schedule: 2 months after procurement of grant funding.

COASTAL BEND MITIGATION ACTION PLAN 223
Project Number: SP-22 Project Name: Generator for Sinton City Hall/Fire Department/EMS Building Participating Jurisdiction(s): Objective(s): 2.1 Minimize disruption to and enhance rapid restoration of utilities. Priority: High Description/Background: City has lost power numerous times due to brownouts and high winds causing disruption of vidal services. Install 30 kw generator to maintain continuity of government in case of loss of power due to brown outs or disaster related loss of power. Lead/Participating Agencies: San Patricio County Emergency Management Cost/Funding: $ 10,000 / Fire and Homeland Security Grants Schedule: 2 months after procurement of grant funding.

COASTAL BEND MITIGATION ACTION PLAN 224
Project Number: SP-23 Project Name: Install Dry Hydrant at City of Lakeside into Lake Corpus Christi Participating Jurisdiction(s): City of Lakeside / San Patricio County Objective(s): 3.4 Utilize available mitigation measures to prevent or reduce economic losses from natural hazards. Priority: High Description/Background: City has had multiple fires and in drought years cannot draft from Lake Corpus Christi to refill fire trucks. Install rigid pipe dry hydrant into lake to provide water to responding fire departments to alleviate the need for fire trucks to leave the City and drive 10 miles to replenish water. Lead/Participating Agencies: San Patricio County Emergency Management Cost/Funding: $ 2,000 / Fire and USDA Grants Schedule: 2 months after receiving grant funding

COASTAL BEND MITIGATION ACTION PLAN 225
Project Number: SP-24 Project Name: Generator for Gregory City Hall/Police Department Participating Jurisdiction(s): Objective(s): 2.1 Minimize disruption to and enhance rapid restoration of utilities. Priority: High Description/Background: City has lost power numerous times due to brownouts and high winds causing disruption of vidal services. Install 30 kw generator to maintain continuity of government in case of loss of power due to brown outs or disaster related loss of power. Lead/Participating Agencies: San Patricio County Emergency Management Cost/Funding: $10,000 / Fire and Homeland Security Grants Schedule: 2 months after procurement of grant funding.

COASTAL BEND MITIGATION ACTION PLAN 226
Project Number: SP-25 Project Name: Generator for Odem Fire Department Participating Jurisdiction(s): Objective(s): 2.1 Minimize disruption to and enhance rapid restoration of utilities. Priority: High Description/Background: City has lost power numerous times due to brownouts and high winds causing disruption of vidal services. Install 30 kw generator to maintain continuity of government in case of loss of power due to brown outs or disaster related loss of power. Lead/Participating Agencies: San Patricio County Emergency Management Cost/Funding: $ 10,000 / Fire and Homeland Security Grants Schedule: 2 months after procurement of grant funding.

COASTAL BEND MITIGATION ACTION PLAN 227
Project Number: SP-26 Project Name: Elevate Roadway/Construct Bridge in City of San Patricio on Nopal Street and County Road 60A Participating Jurisdiction(s): City of San Patricio and San Patricio County Objective(s): 1.4 Reduce obstacles to timely and safe evacuation of hazard areas. Priority: High Description/Background: Elevate roadway/construct bridge in city of San Patricio on Nopal street and county road 60A. City has had multiple floods from the Nueces river due to releases from choke canyon and Lake Corpus Christi dams due to tropical storms and heavy rain events. Lead/Participating Agencies: City of San Patricio and San Patricio County Emergency Management Cost/Funding: $1,000,000 / Hurricane Ike Grant Funding Round Two Schedule: Installation to be completed two weeks after receiving grant funding.

COASTAL BEND MITIGATION ACTION PLAN 228
Project Number: SP-27 Project Name: Generator for Odem City Hall Participating Jurisdiction(s): Objective(s): 2.1 Minimize disruption to and enhance rapid restoration of utilities. Priority: High Description/Background: City has lost power numerous times due to brownouts and high winds causing disruption of vidal services. Install 30 kw generator to maintain continuity of government in case of loss of power due to brown outs or disaster related loss of power. Lead/Participating Agencies: San Patricio County Emergency Management Cost/Funding: $10,000 / Fire and Homeland Security Grants Schedule: 2 months after procurement of grant funding.

COASTAL BEND MITIGATION ACTION PLAN 229
Project Number: SP-28 Project Name: Install Dry Hydrant at City of Lake City into Lake Corpus Christi Participating Jurisdiction(s): City of Lake City/San Patricio County Objective(s): 3.4 Utilize available mitigation measures to prevent or reduce economic losses from natural hazards. Priority: High Description/Background: City has had multiple fires and in drought years cannot draft from Lake Corpus Christi to refill fire trucks. Install rigid pipe dry hydrant into lake to provide water to responding fire departments to alleviate the need for fire trucks to leave the City and drive 10 miles to replenish water. Lead/Participating Agencies: San Patricio County Emergency Management Cost/Funding: $2,000 / Fire Grants and USDA Grants Schedule: 2 months from receipt of grant

COASTAL BEND MITIGATION ACTION PLAN 230
Project Number: SP-29 Project Name: Elevate Roadway/Construct Bridge in City of San Patricio on Nopal Street and County Road 60B Participating Jurisdiction(s): City of Lake City/San Patricio County Objective(s): 1.4 Reduce obstacles to timely and safe evacuation of hazard areas. Priority: High Description/Background: elevate roadway/construct bridge in city of San Patricio on Nopal street and county road 60B. City has had multiple floods from the Nueces river due to releases from choke canyon and Lake Corpus Christi dams due to tropical storms and heavy rain events. Lead/Participating Agencies: City of Lake City/San Patricio County Emergency Management Cost/Funding: 1,000,000 / Hurricane Ike Grant Funding Round Two Schedule: Installation to be completed two weeks after receiving grant funding.

COASTAL BEND MITIGATION ACTION PLAN 231
Project Number: SP-30 Project Name: Install Sea Gates/Rail Gates and Continuous Maintenance Contract in Aransas Pass Participating Jurisdiction(s): City of Aransas Pass Objective(s): 4.4 Minimize environmental impacts from cascading effects Priority: Medium Description/Background: To prevent flood surge (sea gates) at pelican cove by lowering huge metal gates into concrete frames with a 10 ton crane. To prevent rising water into city, sea gates will be placed into these frames at two railroad track openings. Lead/Participating Agencies: City of Aransas Pass Cost/Funding: $250,000 / None Known Schedule: One year after receiving funding.

COASTAL BEND MITIGATION ACTION PLAN 232
Project Number: SP-31 Project Name: Back-up Generator for Aransas Pass Public Works Participating Jurisdiction(s): City of Aransas Pass Objective(s): 2.1 Minimize disruption to and enhance rapid restoration of utilities. Priority: High Description/Background: The city of Aransas Pass is in need of a back-up generator for utilities, lift stations and water tanks/towers due to no back-up power. Lead/Participating Agencies: City of Aransas Pass Public Works Department Cost/Funding: $75,000 / No Known Funding Schedule: 1 year after receiving funding.

COASTAL BEND MITIGATION ACTION PLAN 233
Project Number: SP-32
Project Name: Aransas Pass Public Information Outreach Program Participating Jurisdiction(s): City of Aransas Pass Objective(s): 1.1 Improve the delivery and effectiveness of warning messages Priority: Low Description/Background: Public needs to know what to expect during a disaster. The city of Aransas Pass will need to promote public awareness by distributing literature, posting information on jurisdiction websites, hosting events and taking advantage of other opportunities as they arise to keep the community informed to save lives. Lead/Participating Agencies: City of Aransas Pass Office of Emergency Management Cost/Funding: $ 2,000 /No Know Funding Source Schedule: 1 year to complete after receiving funding.

COASTAL BEND MITIGATION ACTION PLAN 234
Project Number: SP-33 Project Name: Emergency Power Generation Participating Jurisdiction(s): City of Portland Objective(s): 2.1 related to minimizing disruption of utilities. Priority: Medium Description/Background: This project provides emergency power capabilities to support the City of Portland’s wastewater facilities lift stations. Power failure of any appreciable duration compromises the Cities ability to provide basic services to the community. Wastewater treatment activities will be compromised. Wastewater treatment will be interrupted resulting in public health issues within a very short time as well. Power outages of any type interrupt critical infrastructure capabilities halting wastewater services. These facilities are vulnerable to windstorm damage effecting overhead power distribution systems.
Lead/Participating Agencies: City of Portland Public Works Department
Cost/Funding: $200,000, City of Portland - General Fund, Utilities Funds Funding currently unidentified.
Schedule: Estimated time for completion 36 months.

COASTAL BEND MITIGATION ACTION PLAN 235
Project Number: SP-34
Project Name: Communications/Fiber Optic Line
Participating Jurisdiction(s): City of Portland
Objective(s): Objective 2.1 related to minimizing disruption to utilities; Objective 1.2 related to preserving emergency response capability. Priority: High
Description/Background: The City of Portland has suffered disruption in services in the following areas periodically: telephone communications with the Public Works Department, monitoring of the SCADA (systems control and data acquisition) system for control of the water pressure for residential and emergency usage, emergency alerting for the Fire Department. All due to weather related incidents such as lightning strikes, power surges and power outages. These occurrences have placed critical infrastructure at risk along with residential and fire services during times of need. Installation of a fiber optic communications line interconnecting the Portland Police Department, Fire Department, Public Works, water storage tanks and monitoring systems would prevent and/or minimize such disruption. Lead/Participating Agencies: City of Portland Public Works Dept.
Cost/Funding: The cost of this activity is estimated at $1 million, with funding currently unidentified. Potential funding sources include the City of Portland General Fund and City of Portland utility fees. Schedule: It is estimated that this project could be completed in approximately 36 months, contingent upon secured funding.

COASTAL BEND MITIGATION ACTION PLAN 236
Appendix E.
Coastal Bend Council of Governments Resolution
[Draft note: The resolution is currently pending before the COG.]
COASTAL BEND COUNCIL OF GOVERNMENTS
RESOLUTION NO. XXXX
A RESOLUTION TO FACILITATE THE MAINTENANCE AND COORDINATION OF
COASTAL BEND REGIONAL MITIGATION ACTION PLAN PURSUANT TO FEMA APPROVAL OF THE PLAN.
WHEREAS, regional coordination for the goal of long-term reduction of losses from natural
disasters (mitigation) is consistent with the purposes of the Coastal Bend Council of Governments, and
WHEREAS, under the Disaster Mitigation Act of 2000 and the published rules of the Federal
Emergency Management Agency (FEMA), local governments will be required in the future to have a FEMA-approved mitigation plan as a condition of competing for mitigation project grants, and
WHEREAS, the City of Corpus Christi, Aransas, Bee, Jim Wells, Kleberg, Live Oak, Nueces,
and San Patricio Counties, and municipalities therein have previously entered into an Inter-local Cooperation Agreement for the purpose of developing the Coastal Bend Mitigation Action Plan (MAP), to be submitted by March 1, 2012 to FEMA for review and approval, and
WHEREAS, the MAP must include provisions as to future maintenance of the plan, and
must be updated and re-submitted for approval in five (5) years, and WHEREAS, other jurisdictions not yet participating in the CBMAP planning project may wish
to participate in the future, NOW, THEREFORE BE IT RESOLVED, that the Coastal Bend Council of Governments
agrees to provide certain technical and administrative support services in the future, beginning from the date that the Coastal Bend Mitigation Action Plan receives final approval from FEMA, including, but not limited to, the following tasks:
1. Serve as a repository for plan-related documents and data to ensure that original
materials are available for updating when due in five (5) years. 2. Maintain materials currently on the CBMAP Web site (http://www.coastalbendmap.org),
on the Coastal Bend COG Web site, updating as needed. 3. Host an annual meeting to coordinate review and evaluation of the mitigation strategy,
including any new disaster experience or changes which may materially affect the risk analysis, document completed mitigation actions, evaluate results of any regional efforts,

COASTAL BEND MITIGATION ACTION PLAN 237
and identify any new mitigation opportunities. 4. Coordinate the 5-year revision and re-certification process, including provisions for
ongoing public involvement. 5. Provide technical and administrative assistance to additional jurisdictions within the
Coastal Bend in the development of mitigation action plans not currently included. 6. Provide assistance to all participants in the utilization of technical assistance for disaster
mitigation planning. 7. Serve as a regional Point of Contact for state and federal mitigation officers/programs. 8. Maintain awareness of mitigation funding opportunities, such as grant programs, and
advise participants of availability.

COASTAL BEND MITIGATION ACTION PLAN 238
Appendix F.
Mitigation Strategy Evaluation Form

COASTAL BEND MITIGATION ACTION PLAN 239
Appendix G.
Press Releases and Public Notices

COASTAL BEND MITIGATION ACTION PLAN 240
Appendix H.
Adoption Documentation
Aransas County
Town of Fulton City of Rockport
Aransas County, Unincorporated Areas
Bee County City of Beeville
Bee County, Unincorporated Areas
Jim Wells County City of Alice
City of Orange Grove City of Premont
Jim Wells County, Unincorporated Areas
Kleberg County
City of Kingsville Kleberg County, Unincorporated Areas
Live Oak County City of George West City of Three Rivers
Live Oak County, Unincorporated Areas
Nueces County City of Bishop
City of Corpus Christi City of Port Aransas
City of Robstown Nueces County, Unincorporated Areas
San Patricio County City of Aransas Pass
City of Ingleside City of Portland
San Patricio County, Unincorporated Areas