Coal in the Seven EAS Countries
18
Chapter 2 Coal in the Seven EAS Countries July 2021 This chapter should be cited as ERIA (2021), ‘Coal in the Seven EAS Countries’, in Morikawa, T., S. Kimura, and H. Phoumin (eds.), A Study on the Impact of Financing Restrictions on New Coal-Fired Power Plants in the Asian Region. ERIA Research Project Report FY2021 No. 10, Jakarta: ERIA, pp.8-24.
Transcript of Coal in the Seven EAS Countries

Chapter 2
Coal in the Seven EAS Countries
July 2021
This chapter should be cited as
ERIA (2021), ‘Coal in the Seven EAS Countries’, in Morikawa, T., S. Kimura, and H. Phoumin
(eds.), A Study on the Impact of Financing Restrictions on New Coal-Fired Power Plants in
the Asian Region. ERIA Research Project Report FY2021 No. 10, Jakarta: ERIA, pp.8-24.

8
Chapter 2
Coal in the Seven EAS Countries
While coal divestment is gaining momentum, especially in Europe, many EAS countries
rely on coal-fired generation to meet rapidly growing power demand. This chapter looks
at coal in the power mix and coal-fired power development in the seven EAS countries:
India, Indonesia, Malaysia, Myanmar, the Philippines, Thailand, and Viet Nam.
1. India
1.1. Coal in the power mix
India’s power generation has almost tripled since 2000 with an annual growth of 5.9% and
reached 1,583 TWh in 2018. With abundant domestic coal, coal has been the largest
source of power generation in India. Coal-fired power generation has tripled since 2000
with an annual growth of 6.3%.
Figure 2.1: Power Mix in India
CAGR = compound annual growth rate.
Source: IEEJ, based on IEA’s ‘World Energy Statistics and Balances 2020’, July 2020.
9
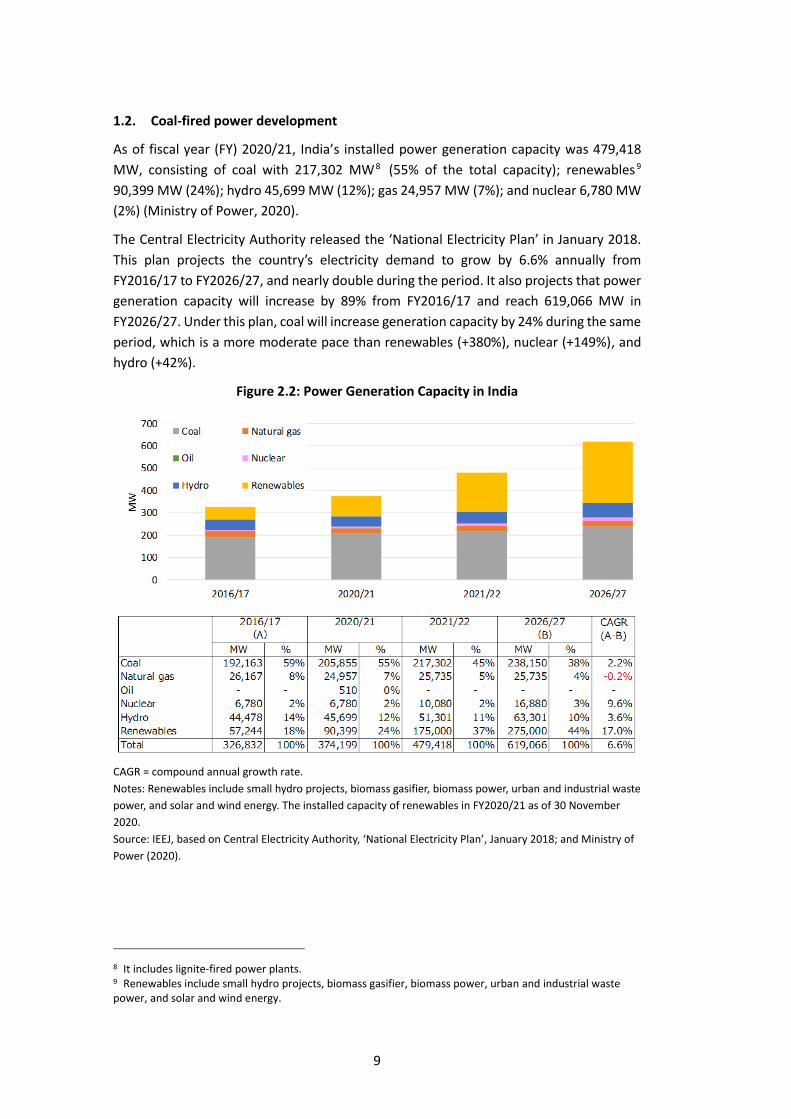
1.2. Coal-fired power development
As of fiscal year (FY) 2020/21, India’s installed power generation capacity was 479,418
MW, consisting of coal with 217,302 MW8 (55% of the total capacity); renewables9
90,399 MW (24%); hydro 45,699 MW (12%); gas 24,957 MW (7%); and nuclear 6,780 MW
(2%) (Ministry of Power, 2020).
The Central Electricity Authority released the ‘National Electricity Plan’ in January 2018.
This plan projects the country’s electricity demand to grow by 6.6% annually from
FY2016/17 to FY2026/27, and nearly double during the period. It also projects that power
generation capacity will increase by 89% from FY2016/17 and reach 619,066 MW in
FY2026/27. Under this plan, coal will increase generation capacity by 24% during the same
period, which is a more moderate pace than renewables (+380%), nuclear (+149%), and
hydro (+42%).
Figure 2.2: Power Generation Capacity in India
CAGR = compound annual growth rate.
Notes: Renewables include small hydro projects, biomass gasifier, biomass power, urban and industrial waste
power, and solar and wind energy. The installed capacity of renewables in FY2020/21 as of 30 November
2020.
Source: IEEJ, based on Central Electricity Authority, ‘National Electricity Plan’, January 2018; and Ministry of
Power (2020).
8 It includes lignite-fired power plants. 9 Renewables include small hydro projects, biomass gasifier, biomass power, urban and industrial waste power, and solar and wind energy.

10
There have not been outstanding opposition campaigns against CFPPs so far in India. As
far as the latest developments are concerned, the National Thermal Power Corporation
Ltd (NTPC), India’s largest energy conglomerate, commissioned the country’s first USC-
based units (660 MW x 2) of Khargone Super Thermal Power Station in Madhya Pradesh
state (NTPC, 2020) in 2019 and 2020.
2. Indonesia
2.1 Coal in the power mix
Indonesia’s power generation has tripled since 2000 with an annual growth of 6.4% and
reached nearly 284 TWh in 2018. Coal has been the largest power source, followed by
natural gas. Coal-fired power generation has increased nearly fivefold since 2000 with an
annual growth of 9%.
Figure 2.3: Power Mix in Indonesia
CAGR = compound annual growth rate.
Source: IEEJ, based on IEA’s ‘World Energy Statistics and Balances 2020’, July 2020.
2000 2005 2010 2011 2012 2013 2014 2015 2016 2017 2018 Share CAGR B/A
(A) (B) (2018) (’00-’18)
% %
Coal 34,002 51,793 68,445 81,090 102,166 111,252 119,532 130,508 135,358 147,875 160,021 56.4 9.0 4.7
Oil 18,342 39,299 34,150 42,178 29,919 26,752 26,152 19,650 15,704 19,413 14,879 5.2 -1.2 0.8
Gas 26,090 19,086 40,247 38,137 45,453 51,490 56,025 58,894 65,699 55,320 59,421 20.9 4.7 2.3
Nuclear 0 0 0 0 0 0 0 0 0 0 0 0.0 n.a. n.a.
Hydro 10,016 10,725 17,456 12,419 12,799 16,923 15,162 13,741 18,677 18,632 21,636 7.6 4.4 2.2
Solar 0 0 1 1 3 5 7 5 21 29 91 0.0 n.a. n.a.
Wind 0 0 4 5 5 0 0 4 6 6 190 0.1 n.a. n.a.
Other Renewables 4,875 6,626 9,452 9,572 9,670 9,578 10,980 11,172 12,452 13,299 27,221 9.6 10.0 5.6
Other 0 0 0 15 15 20 18 10 3 295 311 0.1 n.a. n.a.
Total 93,325 127,529 169,755 183,417 200,030 216,020 227,876 233,984 247,920 254,869 283,771 100.0 6.4 3.0
GWh
0
50
100
150
200
250
300
2000 2002 2004 2006 2008 2010 2012 2014 2016 2018
Coal Oil Gas Nuclear Hydro Solar Wind Other Renewables Other
(TWh)

11
2.2. Coal-fired power development
As of 2018, Indonesia’s installed power generation capacity was 56,510 MW, consisting
of coal 26,411 MW (47% of the total capacity); gas 16,424 MW10 (29%); oil 6,658 MW
(12%); hydro 4,939 MW (9%); and renewables 2,078 MW (4%).11
The Ministry of Energy and Mineral Resources released ’Rencana Umum
Ketenagalistrikan Nasional (RUKN) 2019–2038’ (National Electricity General Plan) in
August 2019. This plan projects the country’s electricity demand to increase at an annual
growth of 7.9% and reach 1,361 TWh in 2038, a more-than-fourfold increase from 2019.
The Indonesian government has tried to fully utilise natural resources, including coal, to
develop additional power generation capacities to meet the country’s growing electricity
demand despite opposition campaigns of local and international environmental groups
against CFPPs. At the workshop for this study, the Indonesian government confirmed its
intention to continue using coal for power generation, although it plans to expand
renewables significantly.
RUKN 2019–2038 projects additional generation capacities coming online between 2019
and 2038, amounting to 267 GW. Following natural gas, coal will be the second-largest in
terms of additional capacities during the same period.12 The recent two coal power
projects are both in Java. PT Shenhua Guohua Pembangkitan Jawa Bali13 commissioned
the country’s first two USC-based units (1 GW each) in 2019–2020 at Java 7 coal-fired
power station in Banten Province, the easternmost of Java. PT. Bhumi Jati Power14 is
building nos. 5 and 6 USC-based units (1 GW each15 2021) adjacent to the existing four
units at the Tanjung Jati (Java 4) coal-fired power station in Central Java.16
10 It includes gas turbines, gas cogeneration, and gas and oil dual fuel power plants. 11 PT. PLN (Persero), Rencana Usaha Penyediaan Tenaga Listrik (RUPTL) 2019–2038, 20 February 2019. 12 Kementerian Energi Dan Sumber Daya Mineral, RUKN 2019–2038, 1 August 2019. 13 It is an independent power producer (IPP) owned by PT Pembangkitan Jawa Bali (a subsidiary of PLN , the national electric power company) and China Shenhua Energy Co., http://www.xinhuanet.com/english/asiapacific/2019-12/13/c_138629371.htm. 14 It is an IPP owned by PT. United Tractors, Sumitomo Corporation, and The Kansai Electric Co. 15 Commercial operation date. 16 https://www.bhumi-jati.co.id/project-profile/background-and-introduction.html.

12
Figure 2.4: Power Generation Capacity in Indonesia
Source: IEEJ, based on Kementerian Energi Dan Sumber Daya Mineral, ‘Rencana Umum Ketenagalistrikan
Nasional 2019–2038’ (RUKN 2019–2038), 1 August 2019.
3. Malaysia
3.1. Coal in the power mix
Malaysia’s power generation has increased by 2.5 times since 2000, with an average
annual growth rate of 5.1% and reaching 170 TWh in 2018. Coal-fired power generation
increased tenfold from 2000, with an average yearly growth rate of 13.7%, overtaking
natural gas in 2016.
GW % GW % GW % GW %
Existing capacities 55 90% 54 68% 42 25% 35 13%
Additionall capacities
Natural gas 3 5% 13 16% 47 28% 85 32%
Coal 2 3% 8 10% 40 24% 73 27%
Oil 0.1 0% 0.1 0% 0.1 0% 0.1 0%
Hydro (Conventional &
Pumped storage)1 2% 2 3% 28 17% 46 17%
Renewables 0 0% 2 3% 9 5% 27 10%
Total 62 100% 79 100% 166 100% 267 100%
2020 2030 20382019
0
50
100
150
200
250
300
2019 2020 2030 2038
GW
Existing capacities Natural gas
Coal Oil
Hydro (Conventional & Pumped storage) Renewables

13
Figure 2.5: Power Mix in Malaysia
CAGR = compound annual growth rate.
Source: IEEJ, based on IEA’s ‘World Energy Statistics and Balances 2020’, July 2020.
3.2. Coal-fired power development
As of December 2018, Malaysia’s installed power generation capacity was 33,991 MW,
consisting of gas 14,853 MW (44% of the total capacity); coal 10,660 MW (31%); hydro
6,168 MW (18%); renewables 1,497 MW (4%); and oil 812 MW (2%) (Energy Commission,
2020a).
The Malaysian government is preparing the Twelfth Malaysia Plan (12MP), a national
development plan for 2021–2025 until 2030. Under 12MP, the government targets an
average yearly growth rate of 4.7% to achieve a GDP of RM3.4 trillion within 2021–2030
(Ministry of Economic Affairs, 2019). However, the projection of electricity demand in
12MP is not yet available.
Jimah East (1 GW x 2) in the Malay Peninsula and Balingan (312 MW x 2) in Sarawak, which
commenced commercial operations in 2019, are the newest CFPPs in Malaysia. They may
be the last ones as no specific CFPPs are currently scheduled. The largest power generator,
Tenaga Nasional Berhad (TNB), has pledged not to invest in a greenfield coal plant in its
investor presentation in December 2020 (TNB, 2020). The ageing CFPPs in Kapar (1,486
MW owned by Kapar Energy Ventures Sdn Bhd) and Manjung (2,070 MW owned by TNB
Janamanjung Sdn Bhd) are scheduled to retire in 2029 and 2030, respectively (Energy
Commission, 2020b).
2000 2005 2010 2011 2012 2013 2014 2015 2016 2017 2018 Share CAGR B/A
(A) (B) (2018) (’00-’18)
% %
Coal 7,691 19,991 42,839 52,983 55,788 53,372 55,827 63,474 69,153 71,959 77,286 45.3 13.7 10.0
Oil 3,600 2,203 3,670 9,450 6,014 5,339 3,490 1,739 1,184 1,527 1,048 0.6 -6.6 0.3
Gas 50,998 55,287 70,795 58,158 62,649 67,761 73,836 69,962 65,234 63,273 63,886 37.5 1.3 1.3
Nuclear 0 0 0 0 0 0 0 0 0 0 0 0.0 n.a. n.a.
Hydro 6,966 5,191 6,472 7,623 9,056 10,586 13,388 13,924 20,019 26,575 26,325 15.4 7.7 3.8
Solar 0 1 0 0 47 141 227 273 310 330 573 0.3 n.a. n.a.
Wind 0 0 0 0 0 0 0 0 0 0 0 0.0 n.a. n.a.
Other Renewables 0 0 1,006 1,065 819 1,140 701 751 760 839 1,352 0.8 n.a. n.a.
Other 0 0 4 4 8 9 0 0 0 0 0 0.0 n.a. n.a.
Total 69,255 82,673 124,786 129,283 134,381 138,348 147,469 150,123 156,660 164,502 170,469 100.0 5.1 2.5
GWh
0
20
40
60
80
100
120
140
160
180
2000 2002 2004 2006 2008 2010 2012 2014 2016 2018
Coal Oil Gas Nuclear Hydro Solar Wind Other Renewables Other
(TWh)

14
The Malaysians have a strong interest in environmental issues, such as the growing use of
renewables and recycling. However, opposition campaigns against CFPPs have not been
outstanding in the Malay Peninsula as the newly installed coal-fired plants are highly
efficient and have a cleaner operation.
Figure 2.6: Power Generation Capacity in Malaysia
CAGR = compound annual growth rate.
Source: IEEJ, based on Energy Commission (2020a, 2020b), SESB (2019), Sarawak Energy website,
https://www.sarawakenergy.com.
4. Myanmar
4.1. Coal in the power mix
Myanmar’s power generation was 25 TWh in 2018, nearly a fivefold increase from 2000.
Hydro and natural gas are the primary sources of power generation in the country.
Hydropower had the most significant share (56%) in total generation, followed by natural
gas (34%), together totalling 90% of the mix. Figure 2.7 shows the power mix of Myanmar
since 2000.
CAGR Change
(A-B) (B/A)
MW % MW % MW % MW %
Coal 10,660 31% 13,284 34% 13,284 30% 9,728 22% -0.8% -8.7%
Natural gas 14,853 44% 15,514 40% 15,986 36% 18,430 41% 1.8% 24.1%
Oil 812 2% 825 2% 333 1% 333 1% -7.2% -59.0%
Hydro 6,168 18% 6,198 16% 6,198 14% 7,975 18% 2.2% 29.3%
Renewables 1,497 4% 2,749 7% 8,074 18% 8,527 19% 15.6% 469.5%
Interconnection 0 0% 386 1% 0 0% 0 0% n.a. n.a.
Total 33,991 100% 38,956 100% 43,876 100% 44,994 100% 2.4% 32.4%
2018 2020 2025 2030
(A) (A)
0
5
10
15
20
25
30
35
40
45
2018 2020 2025 2030
MW
Coal Natural gas Oil Hydro Renewables Interconnection

15
Figure 2.7: Power Mix in Myanmar
CAGR = compound annual growth rate.
Source: IEEJ, based on IEA World Energy Statistics and Balances 2020, July 2020.
Coal-fired power generation was 1,543 GWh in 2018, accounting for only 6.3%. Currently,
only one CFPP operates in the country: Tigyit (120 MW) in southern Shan State, which
commenced commercial operations in 2005. Tigyit is a mine-mouth power plant located
near the Tigyit coal mine. There has been local opposition against the mining activities
and power plant operations due to local health concerns and social impacts, leading to
the Tigyit power plant’s experiencing operational disruptions in 2014. 17 In 2016, a
commercial agreement with a Chinese engineering company was reached to upgrade and
operate the existing Tigyit plant.
4.2. Coal-fired power development
As of 2019, Myanmar’s installed power generation capacity was 5,632 MW, consisting of
hydro 3,255 MW (58%); gas 2,217 MW (39%); coal 120 MW (2%); diesel 92 MW; and
renewables 40 MW.18
17 Environmental Justice Atlas, https://ejatlas.org/conflict/tigyit-coal-power-plant-shan-state-myanmar
(accessed December 2020). 18 U Han Zaw, Current Status of Myanmar’s Electricity Sector, Ministry of Electricity and Energy, The Republic of the Union of Myanmar, Bangkok, March 2019
2000 2005 2010 2011 2012 2013 2014 2015 2016 2017 2018 Share CAGR B/A
(A) (B) (2018) (’00-’18)
% %
Coal 0 589 671 724 771 569 286 285 10 1,415 1,543 6.3 n.a. n.a.
Oil 691 34 33 38 51 61 65 55 61 69 77 0.3 -11.5 0.1
Gas 2,535 2,396 1,734 1,588 2,144 2,794 4,977 6,231 8,052 8,345 8,798 35.8 7.2 3.5
Nuclear 0 0 0 0 0 0 0 0 0 0 0 0.0 n.a. n.a.
Hydro 1,892 2,997 5,105 7,518 7,766 8,823 8,829 9,399 9,744 12,584 14,126 57.5 11.8 7.5
Solar 0 0 0 0 0 0 0 0 11 9 10 0.0 n.a. n.a.
Wind 0 0 0 0 0 0 0 0 0 0 0 0.0 n.a. n.a.
Other Renewables 0 0 0 0 0 0 0 0 0 0 0 0.0 n.a. n.a.
Other 0 0 0 0 0 0 0 0 0 0 0 0.0 n.a. n.a.
Total 5,118 6,016 7,543 9,868 10,732 12,247 14,157 15,970 17,878 22,422 24,554 100.0 9.1 4.8
GWh
0
5
10
15
20
25
30
2000 2002 2004 2006 2008 2010 2012 2014 2016 2018
Coal Oil Gas Nuclear Hydro Solar Wind Other Renewables Other
(TWh)

16
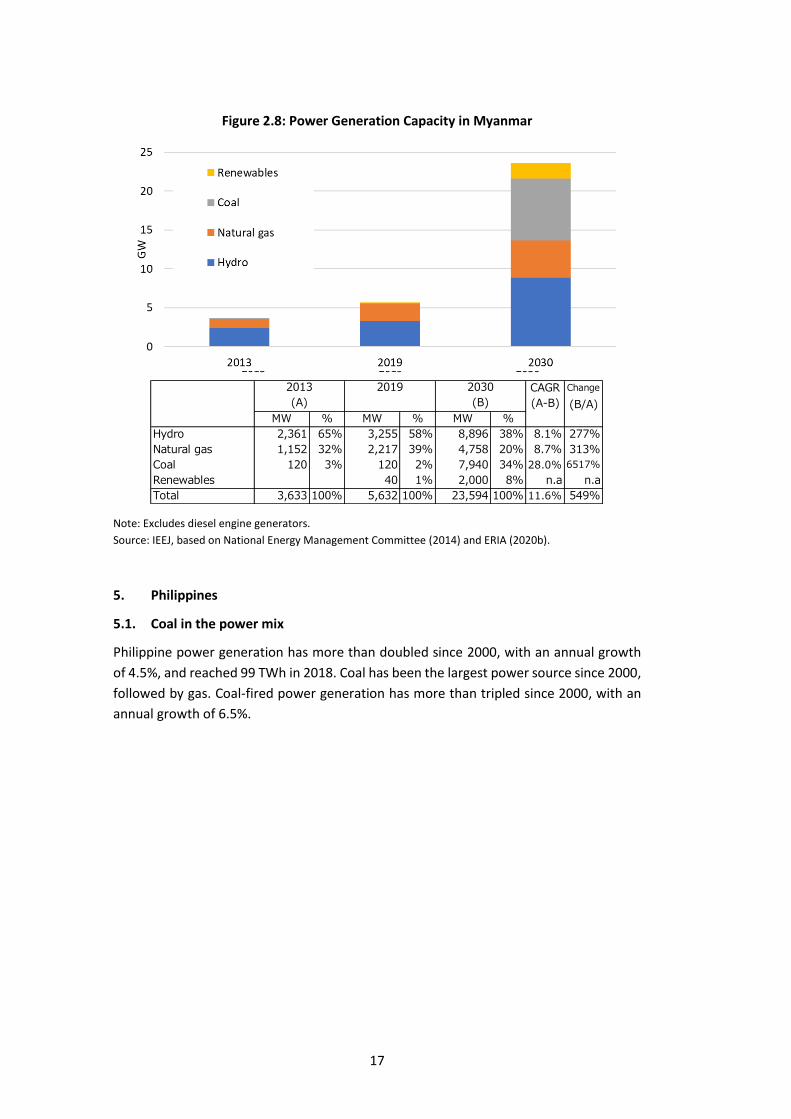
The government approved the National Energy Policy in 2014, which includes the Energy
Sector Development Plan. According to the Plan, new power plants to be constructed by
FY2030/31 will be based on the following energy mix: hydro 38% (8,896 MW); natural gas
20% (4,758 MW); coal 33% (7,940 MW); and renewables 9% (2,000 MW).19
As indicated in the Plan, coal was expected to play a more significant role in Myanmar’s
power mix to meet the nation’s growing energy demand, as hydro and gas resources had
their limits to expand further. In this background were several CFPP development projects
with an aggregate installed capacity of 3,325 MW upon the Plan’s endorsement. 20
However, due to widespread public opposition, including residents and environmental
groups, coal-fired power development projects have been stalled (EuroCham Myanmar,
2018). Local policymakers and residents have continuously challenged the operation of
the existing Tigyit plant. However, the central government sees the merit in having the
power plant supply electricity to the region.21
An ERIA study forecasted electricity demand to grow at a yearly average of 7%, a fivefold
increase from 2016 to 78 TWh in 2040 (ERIA, 2020a). Against the backdrop of widespread
opposition against coal-fired power generation projects, the Myanmar government is
expected to review the Power Development Plan. However, due to the coup in February
2021, most policies, including the Power Development Plan, seem to stall.
19 National Energy Policy, National Energy Management Committee, The Republic of the Union of Myanmar, 2014 20 Ibid. 21 https://www.iea-coal.org/myanmar-government-rejects-motion-to-shutter-polluting-chinese-owned-
coal-plant/
17
Figure 2.8: Power Generation Capacity in Myanmar
Note: Excludes diesel engine generators.
Source: IEEJ, based on National Energy Management Committee (2014) and ERIA (2020b).
5. Philippines
5.1. Coal in the power mix
Philippine power generation has more than doubled since 2000, with an annual growth
of 4.5%, and reached 99 TWh in 2018. Coal has been the largest power source since 2000,
followed by gas. Coal-fired power generation has more than tripled since 2000, with an
annual growth of 6.5%.
CAGR Change
(A-B) (B/A)
MW % MW % MW %
Hydro 2,361 65% 3,255 58% 8,896 38% 8.1% 277%
Natural gas 1,152 32% 2,217 39% 4,758 20% 8.7% 313%
Coal 120 3% 120 2% 7,940 34% 28.0% 6517%
Renewables 40 1% 2,000 8% n.a n.a
Total 3,633 100% 5,632 100% 23,594 100% 11.6% 549%
2019 20302013
(B)(A)
0
5
10
15
20
25
2013 2019 2030
GW
Renewables
Coal
Natural gas
Hydro

18
Figure 2.9: Power Mix in the Philippines
Source: IEEJ, based on IEA’s ‘World Energy Statistics and Balances 2020’, July 2020.
5.2. Coal-fired power development
As of 2019, the country’s installed power generation capacity was 25,531 MW, comprising
coal 10,417 MW (41% of the total capacity); oil 4,262 MW (17%); hydro 3,760 MW (15%);
renewables 3,639 MW (14%); and natural gas 3,453 MW (14%) (DOE, 2020).
The Department of Energy (DOE) projects the country’s electricity demand to grow by
about 5% annually and will reach 49,287 MW by 2040. To meet this demand growth,
43,765 MW additional capacities must come online (DOE, 2017). As ‘DOE stands with its
technology-neutral position, … ‘all types of technologies are welcome as long as they are
efficient, reliable, and able to provide the least-cost option and flexibility in the system’.22
As of August 2020, 6,733 MW committed capacities are expected to come online and
provide additional capacities to the system. Committed capacities come from power
generation projects, which already secured financing. Amongst the committed capacities,
5,530 MW are to start commercial operations by 2027, 50% of which are CFPPs. These
committed CFPPs include the GNPower Dinginin’s supercritical units (600 MW x 2)
scheduled to be commissioned in 2021 and the Atimonan One Energy’s No. 1 unit (600
MW) scheduled to be commissioned in 2024 in Luzon, the largest and most populous
island of the Philippines. On the other hand, the remaining 1,203 MW committed
capacities have no target commissioning dates yet; all these are CFPPs. These projects are
22 The Department of Energy website, https://www.doe.gov.ph (accessed January 2021).
2000 2005 2010 2011 2012 2013 2014 2015 2016 2017 2018 Share CAGR B/A
(A) (B) (2018) (’00-’18)
% %
Coal 16,663 15,257 23,301 25,342 28,265 32,081 33,054 36,686 43,303 46,847 51,932 52.4 6.5 3.1
Oil 9,185 6,141 7,101 3,398 4,254 4,491 5,708 5,886 5,661 3,787 3,173 3.2 -5.7 0.3
Gas 17 16,861 19,518 20,591 19,642 18,791 18,690 18,878 19,854 20,547 21,334 21.5 48.6 1254.9
Nuclear 0 0 0 0 0 0 0 0 0 0 0 0.0 n.a. n.a.
Hydro 7,799 8,387 7,803 9,698 10,252 10,019 9,137 8,665 8,111 9,611 9,384 9.5 1.0 1.2
Solar 0 2 1 1 1 1 17 139 1,097 1,201 1,249 1.3 n.a. n.a.
Wind 0 17 62 88 75 66 152 748 975 1,094 1,153 1.2 n.a. n.a.
Other Renewables 11,626 9,902 9,949 10,036 10,414 9,787 10,471 11,392 11,787 11,273 10,957 11.0 -0.3 0.9
Other 0 0 7 22 18 30 33 19 9 10 11 0.0 n.a. n.a.
Total 45,290 56,567 67,742 69,176 72,921 75,266 77,262 82,413 90,797 94,370 99,192 100.0 4.5 2.2
GWh
0
20
40
60
80
100
120
2000 2002 2004 2006 2008 2010 2012 2014 2016 2018
Coal Oil Gas Nuclear Hydro Solar Wind Other Renewables Other
(TWh)

19
still acquiring various permits, approvals, and licences, and may or may not have a definite
timeline for commercial operations.23
Although local and international environmental groups oppose new CFPPs in the
Philippines, the campaigns have failed to attract considerable support in the country in
great need of additional electric power supply. However, amongst major local
conglomerates actively involved in power generation, the Ayala Corporation firstly
revealed its plan in April 2020 to divest from CFPPs by 2030 (Jiao and Murtaugh, 2020).
Figure 2.10: Power Generation Capacity in the Philippines
COD = commercial operation date.
Source: IEEJ, based on DOE (2020a, 2020b, 2017).
23 The Department of Energy, Private Section Initiated Power Projects (Luzon) Committed as of 31 August 2020, Private Section Initiated Power Projects (Luzon) Indicative as of 31 August 2020, Private Section Initiated Power Projects (Visayas) Committed as of 31 August 2020, Private Section Initiated Power Projects (Visayas) Indicative as of 31 August 2020, Private Section Initiated Power Projects (Mindanao) Committed as of 31 August 2020, Private Section Initiated Power Projects (Mindanao) Indicative as of 31 August 2020, Power Development Plan 2017–2040.
MW % MW % MW % MW %
Coal 10,417 41% 2,791 50% 1,200 100% 5,400 43% 4,403 13% - -
Oil 4,262 17% 426 8% 0 0% 36 0% 1,325 4% - -
Natural gas 3,453 14% 1,750 32% 0 0% 3,600 28% 5,158 16% - -
Hydro 3,760 15% 0 0% 0 0% 979 8% 4,287 13% - -
Renewables 3,639 14% 564 10% 3 0% 2,685 21% 17,496 54% - -
Total 25,531 100% 5,530 100% 1,203 100% 12,700 100% 32,670 100% 43,765 100%
45,3706,733
2040
COD to be decided COD to be decidedMW %
COD in 2020-27
Indicative capacities as of August 20202019
MW %
Committed capacities as of August 2020
COD in 2020-27
0
5
10
15
20
25
30
35
40
2019 COD in 2020-27 COD to be decided COD in 2020-27 COD to be decided
GW
Coal Oil Natural gas Hydro Renewables
Indicative capacities as of August 2020Committed capacities as of August 2020

20
6. Thailand
6.1. Coal in the power mix
Thailand’s power generation has almost doubled since 2000 with an annual growth of
3.6% and reached 182 TWh in 2018. Natural gas has been the largest source of power
generation since 2000, followed by coal, including domestic lignite. Coal-fired power
generation has more than doubled since 2000, with an annual growth of 4.3%.
Figure 2.11: Power Mix in Thailand
Source: IEEJ, based on IEA’s ‘World Energy Statistics and Balances 2020’, July 2020.
6.2. Coal-fired power development
As of 2018, the Kingdom’s installed power generation capacity was 48,004 MW,
comprising natural gas 28,718 MW; renewables 6,473 MW; coal including domestic lignite
4,637 MW; conventional hydro 3,918 MW; oil 380 MW; and imports from neighbouring
countries 3,878 MW (National Energy Policy Council, 2019). The national power
generation company, Electricity Generating Authority of Thailand (EGAT), operates the
Mae Moh lignite-fired power plants24 in the north of the kingdom. Independent and small
power producers operate CFPPs based on imported coal around Bangkok, the capital city.
Major environmental disruptions, including health problems for the surrounding
population, occurred due to sulphur dioxide emissions from the Mae Moh power plants
from its commissioning in the 1960s, which created a strong anti-coal public opinion in
24 At Mae Moh power plant, six old subcritical units (300 MW each) and a new ultra-supercritical (USC) unit (655 MW) are in operation. The newest one began commercial operations in 2019 to replace four old subcritical units (150 MW each).
2000 2005 2010 2011 2012 2013 2014 2015 2016 2017 2018 Share CAGR B/A
(A) (B) (2018) (’00-’18)
% %
Coal 17,083 20,482 30,047 34,809 33,363 37,627 37,579 34,582 36,920 35,605 36,408 20.0 4.3 2.1
Oil 10,028 8,724 1,177 2,062 2,427 1,677 1,721 1,014 570 305 178 0.1 -20.1 0.0
Gas 61,639 95,621 119,349 106,566 117,058 117,006 118,560 126,986 124,760 120,015 115,640 63.4 3.6 1.9
Nuclear 0 0 0 0 0 0 0 0 0 0 0 0.0 n.a. n.a.
Hydro 6,026 5,798 5,537 8,163 8,754 5,748 5,540 3,752 3,527 4,694 7,565 4.1 1.3 1.3
Solar 0 0 20 95 493 1,080 1,385 2,378 3,377 4,543 4,537 2.5 n.a. n.a.
Wind 0 0 0 5 141 305 305 329 345 1,109 1,641 0.9 n.a. n.a.
Other Renewables 511 1,532 3,392 4,291 4,406 6,705 7,169 7,447 18,055 15,443 16,328 9.0 21.2 32.0
Other 690 40 0 0 0 0 0 0 0 0 0 0.0 -100.0 0.0
Total 95,977 132,197 159,522 155,991 166,642 170,148 172,259 176,488 187,554 181,714 182,298 100.0 3.6 1.9
GWh
0
50
100
150
200
2000 2002 2004 2006 2008 2010 2012 2014 2016 2018
Coal Oil Gas Nuclear Hydro Solar Wind Other Renewables Other
(TWh)

21
the kingdom.25 EGAT planned new CFPPs in the far south of Thailand,26 but residents and
environmental groups have strongly opposed for years, and the government eventually
put them on ice.
The government approved the Thailand Power Development Plan 2018–2037 (PDP2018)
in April 2019 and updated it in October 2020 as PDP2018 rev.1.27 According to Thailand’s
Board of Investment, PDP2018 rev.1 aims to increase the installed power generation
capacity by 61% from 2018 to 77,211 MW by 2037. PDP8 rev.1 projected that coal-fired
power generation capacity would decrease by 27% from 2018 to 3,370 MW by 2037, while
gas and other renewables would increase by 12% and 288%, respectively.28 New CFPPs
scheduled in PDP8 rev.1 are (i) EGAT’s USC unit (600 MW) replacing two old subcritical
units (300 MW each) at Mae Moh power plants, (ii) a 1 GW unit built in the eastern region,
and (iii) another 1 GW unit built in the southern region.29
Figure 2.12: Power Generation Capacity in Thailand
CAGR = compound annual growth rate.
Source: IEEJ, based on National Energy Policy Council (2019).
25 The problems have been settled once flue gas desulphurisation devices were retrofitted to the power plants and financial compensation was paid by EGAT for damages. 26 Krabi project (800 MW x 1) and Thepa project (1 GW x 2) PDP2015 (Ministry of Energy, 2015) 27 As of January 2021, available only in Thai. 28 Thailand Board of Investment, accessed January 2021. 29 The PDP rev.1 does not specify who will build the two 1 GW units in 2033–2034.
CAGR Change
(A-B) (B/A)
MW % MW % MW % MW %
Natural gas 28,718 60% 29,331 56% 33,224 53% 32,112 42% 0.6% 12%
Coal 4,637 10% 4,637 9% 3,377 5% 3,370 4% -1.7% -27%
Oil 380 1% 380 1% 380 1% 65 0% -8.9% -83%
Hydro (Conventional) 3,918 8% 3,918 8% 3,918 6% 3,918 5% 0.0% 0%
Renewables 6,473 13% 7,957 15% 14,461 23% 25,086 32% 7.4% 288%
Import 3,878 8% 5,721 11% 7,509 12% 8,661 11% 4.3% 123%
Energy conservation 0 0% 0 0% 0 0% 4,000 5% n.a. n.a.
Total 48,004 100% 51,943 100% 62,868 100% 77,211 100% 2.5% 61%
2018 2020 2030 2037
0
10
20
30
40
50
60
70
80
2018 2020 2030 2037
GW
Natural gas Coal Oil Hydro (Conventional) Renewables Import Energy conservation

22
7. Viet Nam
7.1. Coal in the power mix
Viet Nam’s power generation has grown ninefold since 2000 with an annual growth of
13% and exceeded 240 TWh in 2018. Coal-fired power generation has grown sharply by
more than 36 times since 2000. As coal overtook gas and then hydro in 2015 and 2016,
respectively, it has been the most significant power source since then.
Figure 2.13: Power Mix in Viet Nam
CAGR = compound annual growth rate.
Source: IEEJ, based on IEA’s ‘World Energy Statistics and Balances 2020’, July 2020.
2000 2005 2010 2011 2012 2013 2014 2015 2016 2017 2018 Share CAGR B/A
(A) (B) (2018) (’00-’18)
% %
Coal 3,135 12,175 19,690 22,429 24,855 27,192 34,602 56,469 68,211 67,558 114,182 47.4 22.1 36.4
Oil 4,519 2,167 3,410 1,749 372 424 515 1,293 1,910 700 258 0.1 -14.7 0.1
Gas 4,356 22,319 44,148 38,827 39,426 40,862 43,263 48,147 46,055 41,020 41,729 17.3 13.4 9.6
Nuclear 0 0 0 0 0 0 0 0 0 0 0 0.0 n.a. n.a.
Hydro 14,551 16,945 27,550 40,924 52,795 51,955 59,841 57,174 65,722 88,982 84,125 34.9 10.2 5.8
Solar 0 0 0 0 0 0 0 0 0 0 23 0.0 n.a. n.a.
Wind 0 0 50 87 87 87 87 124 218 323 497 0.2 n.a. n.a.
Other Renewables 0 50 55 55 56 57 58 70 68 76 126 0.1 n.a. n.a.
Other 0 0 0 0 0 0 0 0 0 0 0 0.0 n.a. n.a.
Total 26,561 53,656 94,903 104,071 117,591 120,577 138,366 163,277 182,184 198,659 240,940 100.0 13.0 9.1
GWh
0
50
100
150
200
250
300
2000 2002 2004 2006 2008 2010 2012 2014 2016 2018
Coal Oil Gas Nuclear Hydro Solar Wind Other Renewables Other
(TWh)

23
7.2. Coal-fired power development
As of 2018, Viet Nam’s installed power generation capacity was 48,573 MW, consisting of
coal 18,516 MW (38% of the total capacity); hydro 17,031 MW (35%); gas 8,978 MW
(18%); and renewables 3,476 MW (7%).30
The Prime Minister approved the Revised National Power Development Master Plan for
2011–2020 with the Vision to 2030 (RPDP7) in March 2016.31 Compared to PDP7 of 2011,
one noticeable change in the RPDP7 was a stronger emphasis on renewable energy
development.32 However, coal is still projected to remain the largest power source in 2030
while renewables (hydro and other renewables) will more than double the capacity during
the same period.
Viet Nam has strong opposition against CFPPs because of air pollution and their negative
impacts on climate change. Local and international environmental groups have vigorously
campaigned against specific CFPPs such as Van Phong 133 (660 MW x 2) and Vung Ang 234
(600 MW x 2).35 Viet Nam’s Ministry of Industry and Trade regards difficulty securing
financing as a serious problem for coal power projects.
Viet Nam requires foreign investment to develop additional power generation capacities
as its domestic financial institutions are not mature enough to support its power
development plan.36 It partly explains why a few CFPPs have been delayed by years and
coal-divestment trends, especially from OECD countries.37
30 In addition to domestic power plants, Viet Nam utilises generation capacities in the neighbouring countries to import electricity (EVN, 2019). 31 Prime Minister’s Decision on the Approval of the Revised National Power Development Master Plan for the 2011–2020 Period with the Vision to 2030, 18 March 2016. 32 Deutsche Gasellshaft fur Internationale Zusammenarbeit (GIZ) GmbH; Vietnam Power Development Plan for the period 2011 2020 - Highlights of the PDP 7 revised. 33 It is planned by Sumitomo Corporation. 34 It is planned by One Energy Asia, which is owned by CLP Holdings and Mitsubishi Corporation. 35 Friends of the Earth Japan, 19 March 2019, https://www.foejapan.org/en/aid/jbic02/vp/190319.html, 29 December 2020, https://www.foejapan.org/en/aid/jbic02/va/201229.html 36 Direct communication with the Vietnamese government. 37 Viet Nam is not a IDA-eligible country. Therefore, OECD lenders are required to restrict financing on both supercritical and subcritical plants.

24
Figure 2.14: Power Generation Capacity in Viet Nam
CAGR = compound annual growth rate.
Source: IEEJ, based on EVN (2019) and the ‘Prime Minister Decision on the Approval of the Revised National
Power Development Master Plan for the 2011–2020 Period with the Vision to 2030’, 18 March 2016.
According to the Power Sources Development Program, the government significantly
revised the renewables’ share in the power mix from the previous target of 21% to 32.5%
in 2030. On the other hand, coal’s share is expected to shrink from the previous 43% to
27.1% in 2030. This downward revision reflects the above-mentioned opposition against
coal-fired power generation and delays of new coal power projects.
CAGR Change
(A-B) (B/A)MW % MW % MW % MW %
Coal 18,516 38% 19,200 30% 29,478 29% 37,398 27% 6.0% 102%
Natural Gas 8,978 18% 9,536 15% 12,546 12% 27,462 20% 9.8% 206%Hydro (Conventional &
pumped Storage)17,031 35% 25,600 40% 19,686 19% 20,976 15% 1.8% 23%
Renewables 3,476 7% 6,336 10% 35,292 35% 44,850 33% 23.8% 1190%
Nuclear 0 0% 0 0% 0 0% 0 0% n.a. n.a.
Import 572 1% 1,536 2% 3,468 3% 5,658 4% 21.0% 889%
Total 48,573 100% 64,000 100% 102,000 100% 138,000 100% 9.1% 184%
2020 20302018 2025
(A) (B)
0
20
40
60
80
100
120
140
2018 2020 2025 2030
GW
Coal Natural Gas Hydro (Conventional & pumped Storage) Renewables Nuclear Import