CO2 Utilization beyond EOR - Resources for the Future · 1 | Office of Fossil Energy energy.gov/fe...
24
1 | Office of Fossil Energy energy.gov/fe Dr. Daniel Matuszak CO 2 Utilization Program Manager Office of Fossil Energy CO 2 Utilization beyond EOR Resources for the Future May 24, 2017
Transcript of CO2 Utilization beyond EOR - Resources for the Future · 1 | Office of Fossil Energy energy.gov/fe...

1 | Office of Fossil Energy energy.gov/fe
Dr. Daniel Matuszak
CO2 Utilization Program Manager
Office of Fossil Energy
CO2 Utilization beyond EOR
Resources for the FutureMay 24, 2017

energy.gov/fe
There are many reasons to advance CO2 Utilization technologies
2
Environment Infrastructure
Jobs

energy.gov/fe
Abundant energy
All resources but electricity may become net exports.
Can efficient U.S. electricity be exported by embedding into salable products derived from CO2?
3
U.S. is projected to become a net energy exporter in
most AEO2017 cases. EIA Annual Energy Outlook 2017.

energy.gov/fe
Abundant electric capacity
U.S. infrastructure has excess generation capacity to the extent that even new natural gas plants cannot become economical in some areas (e.g. Hughes vs. Talen Energy Marketing).
4
(A) nuclear(B) geothermal(C) landfill gas and muni solid(D) natural gas fired combined cycle(E) coal(F) other biomass incl. wood(G) conv. hydropower(H) wind(I) solar PV(J) solar thermal(K) steam turbine, gas(L) steam turbine, petroleum(M) internal combustion engine, gas(N) combustion turbine, gas(O) internal combustion engine, petroleum(P) combustion turbine, petroleum
Monthly Capacity Factors for Utility Scale Electricity
Generators 2015-16. EIA, Electric Power Monthly (Table
6.7, April 2017).
0%
20%
40%
60%
80%
100%
A B C D E F G H I J K L M N O P
Can the existing fleet be repurposed to service an export economy?

energy.gov/fe
U.S. CO2 sources and use
5
NETL, NatCarb database: http://natcarb.netl.doe.gov
Bala Suresh, IHS Markit, “Global Market for Carbon Dioxide”, presented at 8th Carbon Dioxide Utilization Summit (Feb 2017)
U.S. CO2 Consumption. The majority of
CO2 is used in the Oil & Gas sector, mostly by
pipeline. Adapted from IHS Markit sources.
0
10
20
30
40
50
60
70
80
90
20
05
20
06
20
07
20
08
20
09
20
10
20
11
20
12
20
13
20
14
20
15
20
16
[mill
ion
MT]
O&G Other
U.S. CO2 Sources. Many point sources provide
high to low purity CO2. The total CO2 supply was
5,414 million MT in 2015. Source: NatCarb.

energy.gov/fe
Global CO2 demand and supply
6
Y2011 Demand
(0.08 Gtpa, GCCSI
>62% for EOR)
Y2011 Demand &
Y2016 Demand
(~0.22 Gtpa, IHS)
Emissions from High
Concentration Large Point
Sources (0.5 Gtpa, GCCSI)
Emissions from Dilute Large
Point Sources (18 Gtpa, GCCSI)
Total Emissions
(36.3 Gtpa)
GCCSI, Parsons Brinckerhoff, “Accelerating the Uptake of CCS: industrial use of carbon dioxide” (Dec 2011);
Bala Suresh, IHS Markit, “Global Market for Carbon Dioxide”, presented at 8th Carbon Dioxide Utilization Summit (Feb 2017)

energy.gov/fe
An upper bound for CO2 markets?
7
• “CO2U has the potential to utilize 7 billion
metric tons of CO2 per year by 2030”
• Revenue potential estimated at >$800
billion by 2030
• “This is an upper bound estimate,
assuming zero carbon energy is used in all
production processes”
• “To the extent that climate benefits are a
goal of those promoting CO2U products,
life cycle analysis (LCA) is essential.”
• “Considerable work is needed to
standardize life cycle analysis
methodologies for CO2U.”
Global CO2 Initiative, “Carbon Dioxide Utilization (CO2U)--ICEF Roadmap 1.0” (Nov 2016)
Global CO2 Initiative provides the following perspective,

energy.gov/fe
Upper bound for Polymers
8
“If CO2 was to be used as the source of all carbon
in the global annual production of plastics (311
million tonnes (MT) per year in 2014), it would
consume about 0.8 GtCO2 per year.”
Y2011 Demand (0.08 Gtpa, GCCSI; >62% for EOR)
36.3 Gtpa total
22.5
40 Gtpa total (assumed)
“By 2030, the annual global plastic production is
expected to rise to 700 MT, which would require
roughly 490 MtC/yr or about 1.8 GtCO2/yr.”
Final report of the Secretary of Energy Advisory Board (SEAB) Task Force on CO2 Utilization
https://energy.gov/seab/downloads/final-report-task-force-co2-utilization

energy.gov/fe
Limitations of Existing Renewable and Nuclear Energy
U.S. renewable and nuclear generation would need expand by a minimum of 897% in order to displace crude oil consumption.
9
If CO2 was converted into barrel of oil equivalents, and so used to replace the barrels of oil consumed in the US in Y2015,
Comparison attributed to Final report of the Secretary of Energy Advisory Board (SEAB) Task Force on CO2 Utilization
https://energy.gov/seab/downloads/final-report-task-force-co2-utilization
Primary Energy Consumption
97.4 Q
MinimumEnergy
Required
41.1 Q
4.58 QCarbon-Free
Generation, net(nuclear, wind, solar, hydro)

energy.gov/fe
Building confidence in CCS
Can non-EOR CO2 utilization drive a project into the “Operate” stage?
10
17 large scale projects in “Operate” stage
• 14 EOR + 3 geological storage
• 2 power generation (EOR)
+ 5 currently active in “Execute” stage
(i.e. beyond the final investment decision)

energy.gov/fe
Making CCS look cheaper: high-purity CO2 sources
11
SOURCE: P. Zakkour, G. Cook, “CCS Roadmap for Industry: High-purity CO2 sources”, Carbon Counts report (2010)
SourceCost Estimate
[USD/tCO2]
LNG plant 9
Offshore NGP
(deep water)31
Offshore NGP
(shallow water)18-21
Onshore NGP 16-19
Ammonia 4-47
Hydrogen 15
Coal-to-Liquids <25
High-purity gas streams are easier to separate - makes CCS appear cheaper
More than half of the 17 large-scale
projects in “Operate” stage use high
purity sources:
• 8 Natural Gas Processing (NGP)
• 2 Ammonia production (fertilizer)
• 2 Hydrogen production
EOR & geological storage only~31.2 Mtpa CO2 capacity globally
~21.9 Mtpa CO2 capacity in the US

energy.gov/fe
Yet >10 Mtpa merchant CO2 market (non-EOR) in U.S.
There is plenty of carbon capture from high-purity CO2 sources; very little storage.
12
Crude CO2 sources for the U.S.
Merchant Market 2015. Nameplate
capacity ~12.9 Mtpa; capacity factor 86%.
SOURCE: Maura D. Garvey, published in CryoGas magazine (May 2016)
Merchant demand by End-Use,
US: 10 Mtpa (2016). Food industry
drives ~70% of market.
Adapted from Maura Garvey (presentation Mar 2017); original source JR Campbell & Associates
The majority of CO2 remains unreacted after being used in the merchant markets.
These commercial approaches rely on carbon capture and are sufficiently addressed by the private sector. Most emit CO2 and operate on a small scale.

energy.gov/fe
Case Study: exporting excess electricity from Iceland
Electricity is used to convert CO2 from a natural source (at $7/tonne) to a transportation fuel for a Swedish ferry operator, Stena.
13

energy.gov/fe
Review and potential whitespace
14
State of CO2 at Sale
ConvertedCO2
Purity of Starting CO2
High
Low Power/CCS → EOR
Ammonia Plant (SMR) → Merchants
Natural Gas Processing → Merchants
H2 plant (SMR) → Merchants
[CRI Methanol plant → End-Users]
Conventional biologicals → Various
[ Urea plant → End-Users ]*
[*=net emitter of CO2]
[Polyol plant → Polymer industry ]
E.g., opportunities for
reactive capture
typically highest cost
typically lowest cost
[=small scale]
Potential Whitespace

energy.gov/fe
Infrastructure – concepts that may improve resilience
CO2-enhanced water recovery & CO2-enhanced food production (e.g. algae for animal feed) may supplement current sources in times of need.
15
Potentially suitable lands for algae
facilities. EERE, 2016 Billion Ton Report
Saline formations and CO2 point
sources. NETL, NatCarb 2015.
U.S. farmers expect volatile weather to be the norm.
WSJ, May 15, 2017.
Exemplary variation in crop production. WSJ, May 15,
2017; USDA data.

energy.gov/fe
Building materials
16
IMAGES: Portland Cement Association
Aggregates and their qualities are essential to well functioning
and durable concrete structures. They can be made by
mineralizing CO2.
Key Challenges*. Forming stable mineral carbonates is
• highly process-dependent and thus has the potential to
emit more CO2 than is sequestered
• may be constrained to a limited scale due to the supply
of make up materials
* Newall, P. S., Clarke, S.J., Haywood, H.M., Scholes, H., Clarke, N.R ., King, P.A., Barley, R.W., 2000: CO2 storage as carbonate minerals, report PH3/17 for IEA Greenhouse Gas
R&D Programme, CSMA Consultants Ltd, Cornwall, UK
Erla Zwingle, “Cities -- Challenges for Humanity”, National Geographic Magazine, November 2002
UN Department of Economic and Social Affairs, Urban and Rural Areas wallchart 2014.
Key trend: Urbanization
By 2030, 60% of the population will
live in an urban world. Less developed
regions will add more than 1 billion
people to urban centers.
DATA: UN DESA
IMAGE: Erla Zwingle (National Geographic)
energy.gov/fe
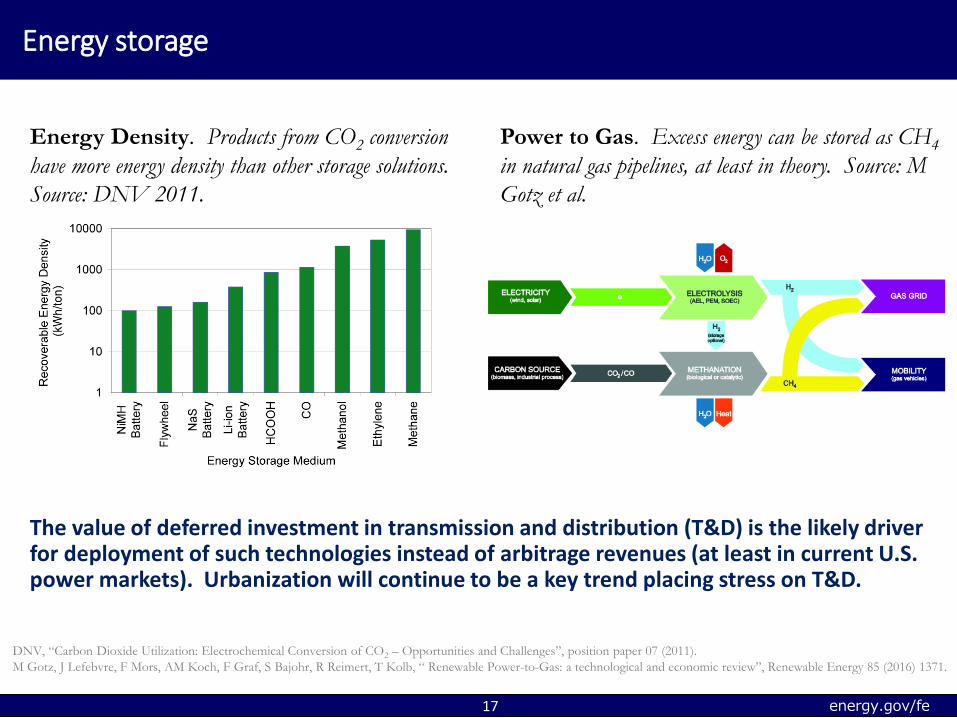
Energy storage
The value of deferred investment in transmission and distribution (T&D) is the likely driver for deployment of such technologies instead of arbitrage revenues (at least in current U.S. power markets). Urbanization will continue to be a key trend placing stress on T&D.
17
Energy Density. Products from CO2 conversion
have more energy density than other storage solutions.
Source: DNV 2011.
DNV, “Carbon Dioxide Utilization: Electrochemical Conversion of CO2 – Opportunities and Challenges”, position paper 07 (2011).
M Gotz, J Lefebvre, F Mors, AM Koch, F Graf, S Bajohr, R Reimert, T Kolb, “ Renewable Power-to-Gas: a technological and economic review”, Renewable Energy 85 (2016) 1371.
Power to Gas. Excess energy can be stored as CH4
in natural gas pipelines, at least in theory. Source: M
Gotz et al.

energy.gov/fe
Carbon - the backbone of advanced economies
18
CREDITS: DOE Big Ideas Carbon Team comprising national lab colleagues

energy.gov/fe
Sample of Marketable Products and Services derived from CO2 Use
19
Energy Services
Compressed Gas Energy StorageChemical Energy StorageHeat Transfer Working Fluid
FE/NETL supported area
Building Products
Carbonates
MethanolUreaCO Methane
Liquid Fuels
Fertilizer
Secondary Chemicals
Flavors/FragrancesDecaffeination
AlgaeBiogasesGlasshouse gas
FuelsFood
Carbonated Beverages
Oil Gas
EOREGRECBM
Polycarbonate Polymers
Fire ExtinguishersBlanket ProductsProtect Reactive PowdersShield Gas in Welding
Injected into metal castingsAdded to medical O2 as respiratory stimulantAerosol-can propellantDry ice pellets for sand blastingRed mud carbonation
Pharmaceutical Additives
CapturedCO2
Bio
log
ica
l C
on
ve
rsio
n
Enhanced Fuel Recovery
Ine
rtin
g
Ag
en
t
Chemicals
RefrigerationDry Ice

energy.gov/fe
$5.9 million to advance novel CO2 utilization strategies
OBJECTIVE: to support efforts to develop technologies that utilize CO2 from coal-fired power plants as a reactant to produce useful products without generating additional CO2 or greenhouse gas emissions validated via a product Life Cycle Analysis.
20
Biological based
concepts
Mineralization based
concepts
Novel physical and chemical
processes

energy.gov/fe
$5.9 million to advance novel CO2 utilization strategies
21
CO2 to light olefins via a low temperature process using
nano-engineered catalysts. [Southern Research Institute]
CO2 to Bioplastics, beneficial re-use of carbon emissions
using microalgae. Image: pilot-scale cyclic flow photobioreactor
at Duke’s East Bend Station [U. Kentucky]
Dry reforming by nano-engineered hollow-fiber supported
catalysts in a modular reactor for syngas production.
[Gas Technology Institute]
Direct Electron Beam Synthesis for highly selective
conversion of CO2 [Gas Technology Institute]

energy.gov/fe
$5.9 million to advance novel CO2 utilization strategies
22
“CO2-negative” construction materials via industrial waste re-processing and power plant heat integration. [UCLA]
CO2 to Alcohols, electrochemical conversion to liquid
C2/C3 alcohols using nanostructured catalysts
[U. Delaware]
CO2 to Fuel, mixed-oxide sorbent-based, thermo-catalytic
process to convert CO2 to syngas [TDA Research]

energy.gov/fe
Novomer, Covestro
23
16-May-2016
Novomer received $20.4 million in ARRA funding from
DOE/FE + had lower TRL support from DOE/AMO and NSF.
Ford tests foams based on CO2.
Materials partially consist of CO2-based polyols;
considered for use as insulation.
Covestro inaugurates production
facility for foams with 20wt% CO2.
Plant capacity of 5,000 tons/year.