CO2 Emissions Mitigation and Technological Advance: An Updated ...
230
PNNL-18075 CO 2 Emissions Mitigation and Technological Advance: An Updated Analysis of Advanced Technology Scenarios (Scenarios Updated January 2009) Appendices L. Clarke P. Kyle M. Wise K. Calvin J. Edmonds S. Kim M. Placet S. Smith December, 2008
Transcript of CO2 Emissions Mitigation and Technological Advance: An Updated ...
PNNL-18075
CO2 Emissions Mitigation and
Technological Advance: An
Updated Analysis of Advanced
Technology Scenarios (Scenarios Updated January 2009)
Appendices
L. Clarke P. Kyle
M. Wise K. Calvin
J. Edmonds S. Kim
M. Placet S. Smith
December, 2008

DISCLAIMER
This report was prepared as an account of work sponsored by an agency of the
United States Government. Neither the United States Government nor any agency
thereof, nor Battelle Memorial Institute, nor any of their employees, makes any
warranty, express or implied, or assumes any legal liability or responsibility for
the accuracy, completeness, or usefulness of any information, apparatus,
product, or process disclosed, or represents that its use would not infringe
privately owned rights. Reference herein to any specific commercial product,
process, or service by trade name, trademark, manufacturer, or otherwise does not
necessarily constitute or imply its endorsement, recommendation, or favoring by the
United States Government or any agency thereof, or Battelle Memorial Institute. The
views and opinions of authors expressed herein do not necessarily state or reflect
those of the United States Government or any agency thereof.
PACIFIC NORTHWEST NATIONAL LABORATORY
operated by
BATTELLE
for the
UNITED STATES DEPARTMENT OF ENERGY
under Contract DE-AC05-76RL01830
Printed in the United States of America
Available to DOE and DOE contractors from the
Office of Scientific and Technical Information,
P.O. Box 62, Oak Ridge, TN 37831-0062;
ph: (865) 576-8401
fax: (865) 576-5728
email: [email protected]
Available to the public from the National Technical Information Service,
U.S. Department of Commerce, 5285 Port Royal Rd., Springfield, VA 22161
ph: (800) 553-6847
fax: (703) 605-6900
email: [email protected]
online ordering: http://www.ntis.gov/ordering.htm
This document was printed on recycled paper.
(9/2003)

PNNL-18075
CO2 Emissions Mitigation and Technological
Advance: An Analysis of Advanced Technology
Scenarios
(Scenarios Updated January 2009)
Appendices
L. Clarke P. Kyle
M. Wise K. Calvin
J. Edmonds S. Kim
M. Placet S. Smith
December, 2008
Prepared for the U.S. Department of Energy
under Contract DE-AC05-76RL01830
Pacific Northwest National Laboratory
Richland, Washington 99352


1
Contents
Appendix A: 450 ppmv Scenarios: Global Results .................................................................................. A.1
Appendix B: 550 ppmv Scenarios: Global Results....................................................................................B.1

A.1
Appendix A: 450 ppmv Scenarios: Global Results

A.2

Scenario: ref Page 1
Final Energy Consumption
1990 2005 2020 2035 2050 2065 2080 2095 Units
building liquids 15.2 16.4 20.9 24.7 26.8 30.6 32.4 31.0 EJ/yr
building gas 18.7 26.7 29.3 31.2 31.5 29.6 29.2 28.3 EJ/yr
building coal 10.1 5.1 8.0 8.3 7.7 7.1 6.2 5.3 EJ/yr
building biomass 4.5 5.5 7.9 9.0 9.3 9.8 9.4 8.6 EJ/yr
building electricity 16.9 29.0 44.7 65.7 89.2 114.3 145.2 174.8 EJ/yr
building trad biomass 23.5 29.9 32.1 27.9 22.9 17.9 12.2 8.0 EJ/yr
building energy reduction 0.0 0.0 0.0 0.0 0.0 0.0 0.0 0.0 EJ/yr
total: w/o reduction 88.9 112.7 142.9 166.6 187.4 209.2 234.7 256.0 EJ/yr
industry liquids 22.4 21.2 20.3 23.9 27.3 35.3 37.9 33.5 EJ/yr
industry gas 26.6 30.5 34.0 39.6 39.4 32.9 33.3 34.1 EJ/yr
industry coal 31.4 35.8 59.0 77.7 88.6 94.5 91.4 88.0 EJ/yr
industry biomass 7.3 11.2 17.1 23.4 31.1 43.3 50.0 57.7 EJ/yr
industry electricity 18.1 24.8 34.7 49.0 66.3 80.1 94.4 109.8 EJ/yr
industry hydrogen 0.0 0.0 2.7 3.1 3.7 4.4 5.0 5.8 EJ/yr
industry energy reduction 0.0 0.0 0.0 0.0 0.0 0.0 0.0 0.0 EJ/yr
industry feedstocks 15.2 23.7 27.9 33.6 38.7 43.4 46.3 48.2 EJ/yr
total: w/o reduction 105.8 123.6 167.9 216.7 256.3 290.6 312.0 328.9 EJ/yr
transportation liquids 62.7 87.7 101.1 120.9 136.7 154.4 171.9 177.0 EJ/yr
transportation gas 2.2 3.0 6.5 12.2 17.8 21.1 26.8 32.9 EJ/yr
transportation coal 0.5 0.2 0.4 0.5 0.6 0.5 0.3 0.2 EJ/yr
transportation electricity 1.0 1.0 2.2 4.8 11.0 16.0 21.3 27.3 EJ/yr
transportation hydrogen 0.0 0.0 0.6 2.1 5.7 9.8 15.0 21.9 EJ/yr
transportation energy reduction 0.0 0.0 0.0 0.0 0.0 0.0 0.0 0.0 EJ/yr
total: w/o reduction 66.4 91.8 110.7 140.4 171.7 201.7 235.2 259.3 EJ/yr
total final energy buildings 88.9 112.7 142.9 166.6 187.4 209.2 234.7 256.0 EJ/yr
total final energy industry 105.8 123.6 167.9 216.7 256.3 290.6 312.0 328.9 EJ/yr
total final energy transportation 66.4 91.8 110.7 140.4 171.7 201.7 235.2 259.3 EJ/yr
total final energy energy reduction 0.0 0.0 0.0 0.0 0.0 0.0 0.0 0.0 EJ/yr
total: w/o reduction 261.1 328.1 421.5 523.7 615.4 701.5 781.9 844.2 EJ/yr

Scenario: ref Page 2
Primary Energy w/CCS
1990 2005 2020 2035 2050 2065 2080 2095 Units
oil w/o ccs 135.6 167.5 183.8 203.9 211.9 235.1 252.4 207.8 EJ/yr
oil w/ ccs 0.0 0.0 0.0 0.0 0.0 0.0 0.0 0.0 EJ/yr
natural gas w/o ccs 69.9 97.5 130.4 179.6 224.3 233.1 256.2 290.0 EJ/yr
natural gas w/ ccs 0.0 0.0 0.0 0.0 0.0 0.0 0.0 0.0 EJ/yr
coal w/o ccs 91.2 119.1 176.8 242.2 317.2 402.3 480.2 597.1 EJ/yr
coal w/ ccs 0.0 0.0 0.0 0.0 0.0 0.0 0.0 0.0 EJ/yr
biomass w/o ccs 14.4 21.6 32.1 43.8 60.3 83.6 101.3 130.1 EJ/yr
biomass w/ ccs 0.0 0.0 0.0 0.0 0.0 0.0 0.0 0.0 EJ/yr
nuclear 21.0 26.1 23.3 21.6 19.3 18.7 18.3 18.1 EJ/yr
hydro 23.6 29.2 29.0 30.5 31.1 33.5 36.1 38.9 EJ/yr
wind 0.0 0.9 14.7 31.3 39.1 46.9 53.9 64.2 EJ/yr
solar 0.0 0.1 1.3 3.5 5.9 9.0 12.9 19.0 EJ/yr
geothermal 0.4 0.5 1.3 5.2 7.9 8.0 7.8 7.7 EJ/yr
energy reduction 0.0 0.0 0.0 0.0 0.0 0.0 0.0 0.0 EJ/yr
total: w/o reduction 356 463 593 762 917 1070 1219 1373 EJ/yr
Electricity Production by Fuel
1990 2005 2020 2035 2050 2065 2080 2095 Units
oil 4.86 4.33 4.26 3.80 4.44 6.23 8.00 6.13 EJ/yr
oil w/ccs 0.00 0.00 0.00 0.00 0.00 0.00 0.00 0.00 EJ/yr
gas 6.07 12.82 24.71 40.05 58.99 69.35 81.78 95.52 EJ/yr
gas w/ccs 0.00 0.00 0.00 0.00 0.00 0.00 0.00 0.00 EJ/yr
coal 16.06 26.35 37.89 53.64 76.37 102.24 133.45 164.44 EJ/yr
coal w/ccs 0.00 0.00 0.00 0.00 0.00 0.00 0.00 0.00 EJ/yr
biomass 0.43 0.71 1.24 2.48 5.18 7.98 11.07 14.05 EJ/yr
biomass w/ccs 0.00 0.00 0.00 0.00 0.00 0.00 0.00 0.00 EJ/yr
nuclear 7.36 9.97 9.95 9.95 9.95 9.95 9.95 9.95 EJ/yr
hydro 7.82 10.44 12.13 13.99 15.85 17.70 19.56 21.42 EJ/yr
wind w/backup 0.01 0.36 4.90 10.50 13.65 16.64 19.28 22.91 EJ/yr
wind w/storage 0.00 0.00 1.22 3.66 5.95 8.05 10.00 12.69 EJ/yr
CSP w/backup 0.00 0.00 0.35 0.59 0.60 0.85 1.18 1.78 EJ/yr
CSP w/storage 0.00 0.00 0.12 0.85 1.91 2.78 3.82 5.73 EJ/yr
PV w/backup 0.00 0.04 0.05 0.05 0.20 0.56 1.05 1.54 EJ/yr
PV w/storage 0.00 0.00 0.00 0.03 0.10 0.26 0.47 0.68 EJ/yr
rooftop PV w/backup 0.00 0.00 0.29 0.80 1.68 3.32 4.25 5.00 EJ/yr
geothermal 0.13 0.21 0.57 2.44 4.14 4.32 4.32 4.35 EJ/yr
energy reduction 0.00 0.00 0.00 0.00 0.00 0.00 0.00 0.00 EJ/yr
total: w/o reduction 42.7 65.2 97.7 142.8 199.0 250.2 308.2 366.2 EJ/yr

Scenario: ref Page 3
Transportation Fuels Production by Fuel
1990 2005 2020 2035 2050 2065 2080 2095 Units
conventional oil 62.5 86.8 95.3 102.7 97.9 99.2 99.8 61.5 EJ/yr
unconventional oil 0.0 0.0 1.6 6.7 15.8 24.0 34.6 54.5 EJ/yr
coal liquids 0.0 0.0 1.6 5.2 12.3 20.0 25.7 42.6 EJ/yr
coal liquids w/ ccs 0.0 0.0 0.0 0.0 0.0 0.0 0.0 0.0 EJ/yr
bio fuels 0.2 0.9 1.2 1.7 2.5 3.9 5.6 11.2 EJ/yr
gas liquids 0.0 0.0 1.4 4.7 8.2 7.3 6.1 7.2 EJ/yr
gas 2.2 3.0 6.5 12.2 17.8 21.1 26.8 32.9 EJ/yr
coal 0.5 0.2 0.4 0.5 0.6 0.5 0.3 0.2 EJ/yr
electricity 1.0 1.0 2.2 4.8 11.0 16.0 21.3 27.3 EJ/yr
hydrogen 0.0 0.0 0.6 2.1 5.7 9.8 15.0 21.9 EJ/yr
energy reduction 0.0 0.0 0.0 0.0 0.0 0.0 0.0 0.0 EJ/yr
total: w/o reduction 66.4 91.8 110.7 140.4 171.7 201.7 235.2 259.3 EJ/yr
Industrial Liquids Production by Fuel
1990 2005 2020 2035 2050 2065 2080 2095 Units
conventional oil 36.59 43.89 45.94 51.18 51.64 57.44 56.80 32.92 EJ/yr
unconventional oil 0.00 0.00 0.42 2.16 5.98 9.74 14.06 24.53 EJ/yr
coal liquids 0.00 0.00 0.39 1.53 4.35 7.65 9.63 18.42 EJ/yr
coal liquids w/ ccs 0.00 0.00 0.00 0.00 0.00 0.00 0.00 0.00 EJ/yr
bio fuels 0.01 0.05 0.13 0.25 0.48 0.88 1.27 3.09 EJ/yr
gas liquids 0.00 0.00 0.36 1.43 2.56 2.17 1.64 1.98 EJ/yr
energy reduction 0.0 0.0 0.0 0.0 0.0 0.0 0.0 0.0 EJ/yr
total: w/o reduction 36.6 43.9 47.2 56.5 65.0 77.9 83.4 80.9 EJ/yr
Hydrogen Production by Fuel
1990 2005 2020 2035 2050 2065 2080 2095 Units
gas 0.00 0.00 2.36 3.85 6.72 9.42 12.66 16.68 EJ/yr
gas w/ccs 0.00 0.00 0.00 0.00 0.00 0.00 0.00 0.00 EJ/yr
coal 0.00 0.00 0.54 0.86 1.67 3.15 4.76 7.19 EJ/yr
coal w/ccs 0.00 0.00 0.00 0.00 0.00 0.00 0.00 0.00 EJ/yr
biomass 0.00 0.00 0.16 0.24 0.45 0.81 1.22 1.84 EJ/yr
biomass w/ccs 0.00 0.00 0.00 0.00 0.00 0.00 0.00 0.00 EJ/yr
nuclear 0.00 0.00 0.00 0.00 0.00 0.00 0.00 0.00 EJ/yr
bulk electricity 0.00 0.00 0.08 0.15 0.31 0.51 0.74 1.04 EJ/yr
wind 0.00 0.00 0.06 0.06 0.08 0.13 0.21 0.31 EJ/yr
solar 0.00 0.00 0.06 0.08 0.14 0.23 0.39 0.66 EJ/yr
energy reduction 0.00 0.00 0.00 0.00 0.00 0.00 0.00 0.00 EJ/yr
total: w/o reduction 0.00 0.00 3.24 5.24 9.37 14.25 19.98 27.72 EJ/yr

Scenario: ref Page 4
Dedicated Bioenergy Crops, Crop Residues, and Municipal Solid Waste Consumption by Sector
1990 2005 2020 2035 2050 2065 2080 2095 Units
direct buildings 4.5 5.5 7.9 9.0 9.3 9.8 9.4 8.6 EJ/yr
Industry 7.4 11.3 17.4 23.9 32.0 45.0 52.4 63.2 EJ/yr
electricity 2.1 2.5 3.5 6.4 12.2 18.2 24.7 30.9 EJ/yr
refined liquids: tran & bldg 0.5 2.2 2.9 4.0 5.8 8.9 12.3 23.7 EJ/yr
hydrogen 0.0 0.0 0.4 0.5 0.9 1.7 2.4 3.6 EJ/yr
synthetic gas 0.0 0.0 0.0 0.0 0.0 0.1 0.1 0.1 EJ/yr
energy reduction 0.0 0.0 0.0 0.0 0.0 0.0 0.0 0.0 EJ/yr
total: w/o reduction 14.4 21.6 32.1 43.8 60.3 83.6 101.3 130.1 EJ/yr
Biomass Production
1990 2005 2020 2035 2050 2065 2080 2095 Units
waste biomass 14.4 21.5 31.7 37.9 41.7 45.4 47.1 49.4 EJ
dedicated biomass crops 0.0 0.0 0.0 4.9 16.7 34.8 48.7 70.4 EJ
municipal solid waste 0.0 0.1 0.4 1.0 1.8 3.4 5.5 10.3 EJ
waste biomass 0.0 0.0 0.0 0.0 0.0 0.0 0.0 0.0 EJ
reduction in biomass crops 0.0 0.0 0.0 0.0 0.0 0.0 0.0 0.0 EJ
reduction in municipal solid wate 0.0 0.0 0.0 0.0 0.0 0.0 0.0 0.0 EJ
total: w/o reduction 14.4 21.6 32.1 43.8 60.3 83.6 101.3 130.1 EJ
Arable Land Use by Type
1990 2005 2020 2035 2050 2065 2080 2095 Units
urban land 0.05 0.05 0.05 0.05 0.05 0.05 0.05 0.05 billion Ha
crops 1.20 1.21 1.37 1.40 1.37 1.37 1.30 1.24 billion Ha
pasture 0.70 0.73 0.92 1.07 1.17 1.21 1.23 1.18 billion Ha
managed forest 0.69 0.74 0.79 0.84 0.88 0.92 0.95 0.97 billion Ha
bioenergy crops 0.00 0.00 0.00 0.02 0.13 0.42 0.68 1.22 billion Ha
unmanaged forest 3.32 3.25 3.11 3.02 2.94 2.78 2.67 2.46 billion Ha
unmanaged land 4.58 4.58 4.31 4.14 4.01 3.80 3.67 3.43 billion Ha
rock/ice/desert/tundra 2.62 2.62 2.62 2.62 2.62 2.62 2.62 2.62 billion Ha
total 10.50 10.50 10.50 10.50 10.50 10.50 10.50 10.50 billion Ha

Scenario: ref Page 5
Population, GDP, and Energy Indicators
1990 2005 2020 2035 2050 2065 2080 2095 Units
Economic Activity reference GDP $26.1 $39.4 $58.8 $85.2 $121.7 $172.4 $241.5 $328.8 trillion 2005$
Final Energy Intensity building 3.41 2.86 2.43 1.96 1.54 1.21 0.97 0.78 GJ/1000$ (2005$)
Final Energy Intensity industry 4.06 3.14 2.85 2.54 2.11 1.69 1.29 1.00 GJ/1000$ (2005$)
Final Energy Intensity transportation 2.55 2.33 1.88 1.65 1.41 1.17 0.97 0.79 GJ/1000$ (2005$)
Final Energy Intensity total 10.01 8.33 7.16 6.15 5.06 4.07 3.24 2.57 GJ/1000$ (2005$)
Population population 5.2 6.4 7.5 8.3 8.8 9.1 9.0 8.7 billion
Final Energy per Capita building 16.9 17.5 19.0 20.0 21.3 23.1 26.1 29.3 GJ/capita
Final Energy per Capita industry 20.2 19.2 22.3 26.0 29.1 32.1 34.6 37.6 GJ/capita
Final Energy per Capita transportation 12.7 14.3 14.7 16.8 19.5 22.3 26.1 29.6 GJ/capita
Final Energy per Capita total 49.7 51.0 56.0 62.8 69.8 77.4 86.8 96.5 GJ/capita
Long-Term Equilibrium Energy Producer Prices
1990 2005 2020 2035 2050 2065 2080 2095 Units
global oil (w/o carbon charge) $27.6 $32.5 $39.8 $42.2 $45.1 $46.9 $48.3 $62.1 $/barrel (2005$)
global oil (w/ carbon charge) $27.6 $32.5 $39.8 $42.2 $45.1 $46.9 $48.3 $62.1 $/barrel (2005$)
domestic natural gas (w/o carbon charge) $3.3 $3.8 $4.4 $4.2 $4.6 $5.7 $5.9 $6.1 $/mmBTU (2005$)
domestic natural gas (w/ carbon charge) $3.3 $3.8 $4.4 $4.2 $4.6 $5.7 $5.9 $6.1 $/mmBTU (2005$)
domestic coal (w/o carbon charge) $1.7 $1.7 $1.8 $1.8 $1.8 $1.9 $2.0 $2.1 $/GJ (2005$)
domestic coal (w/ carbon charge) $1.7 $1.7 $1.8 $1.8 $1.8 $1.9 $2.0 $2.1 $/GJ (2005$)
domestic electricity (w/ carbon charge) 6.21 5.75 5.76 5.52 5.37 5.50 5.35 5.30 cents/kWh (2005$)
carbon price 0.0 0.0 0.0 0.0 0.0 0.0 0.0 0.0 $/tC (2005$)
Crop Prices
1990 2005 2020 2035 2050 2065 2080 2095 Units
global corn 33 33 33 33 33 33 33 33 $/Gcal (2005$)
global rice 32 32 32 32 32 32 32 32 $/Gcal (2005$)
global wheat 27 27 27 26 26 26 26 26 $/Gcal (2005$)
Emissions by Sectors
1990 2005 2020 2035 2050 2065 2080 2095 Units
buildings 0.858 0.860 1.081 1.223 1.303 1.382 1.410 1.411 GtC/yr
industry 1.623 1.706 2.271 2.844 3.240 3.599 3.681 3.839 GtC/yr
transportation 1.354 1.863 2.272 2.935 3.673 4.399 5.088 5.871 GtC/yr
electricity 1.909 2.848 3.749 4.992 6.435 8.085 10.070 11.951 GtC/yr
cement 0.261 0.483 0.893 1.271 1.474 1.472 1.365 1.226 GtC/yr
emissions reduction 0.000 0.000 0.000 0.000 0.000 0.000 0.000 0.000 GtC/yr
total: w/o reduction 6.006 7.760 10.266 13.264 16.125 18.936 21.615 24.298 GtC/yr

Scenario: ref Page 6
Final Energy Consumption: Buildings Final Energy Consumption: Industry (Does not Include Feedstocks)
Final Energy Consumption: Transportation Final Energy Consumption by Sector
0
50
100
150
200
250
300
1990 2005 2020 2035 2050 2065 2080 2095
EJ
/yr
liquids gascoal biomasselectricity trad biomassenergy reduction
0
50
100
150
200
250
300
350
400
1990 2005 2020 2035 2050 2065 2080 2095
EJ
/yr
liquids gas
coal biomass
electricity hydrogen
energy reduction feedstocks
0
50
100
150
200
250
300
1990 2005 2020 2035 2050 2065 2080 2095
EJ
/yr
liquids gas
coal electricity
hydrogen energy reduction
0
100
200
300
400
500
600
700
800
900
1990 2005 2020 2035 2050 2065 2080 2095
EJ
/yr
buildings industry
transportation energy reduction

Scenario: ref Page 7
Primary Energy Consumption Electricity Production by Fuel: CCS Focus
Hydrogen Production by Fuel Electricity Production by Fuel: Renewable Focus
-50
0
50
100
150
200
250
300
350
400
1990 2005 2020 2035 2050 2065 2080 2095
EJ
/yr
liquids liquids w/CCS
gas gas w/ccs
coal coal w/ccs
biomass biomass w/ccs
nuclear hydro
wind solar
geothermal energy reduction
-50
-40
-30
-20
-10
0
10
20
30
40
50
60
70
80
1990 2005 2020 2035 2050 2065 2080 2095
EJ
/yr
gas gas w/ccs
coal coal w/ccs
biomass biomass w/ccs
nuclear bulk electricity
wind solar
energy reduction
-50
0
50
100
150
200
250
300
350
400
1990 2005 2020 2035 2050 2065 2080 2095
EJ
/yr
liquids gascoal biomassnuclear hydrowind w/ backup wind w/ storagecsp w/ backup csp w/ storagepv w/ backup pv w/ storagerooftop solar w/ backup geothermalenergy reduction
0
200
400
600
800
1,000
1,200
1,400
1,600
1990 2005 2020 2035 2050 2065 2080 2095
EJ
/yr
oil w/o ccs oil w/ ccsnatural gas w/o ccs natural gas w/ ccscoal w/o ccs coal w/ ccsbiomass w/o ccs biomass w/ ccsnuclear hydrowind solargeothermal energy reduction
Scenario: ref Page 8
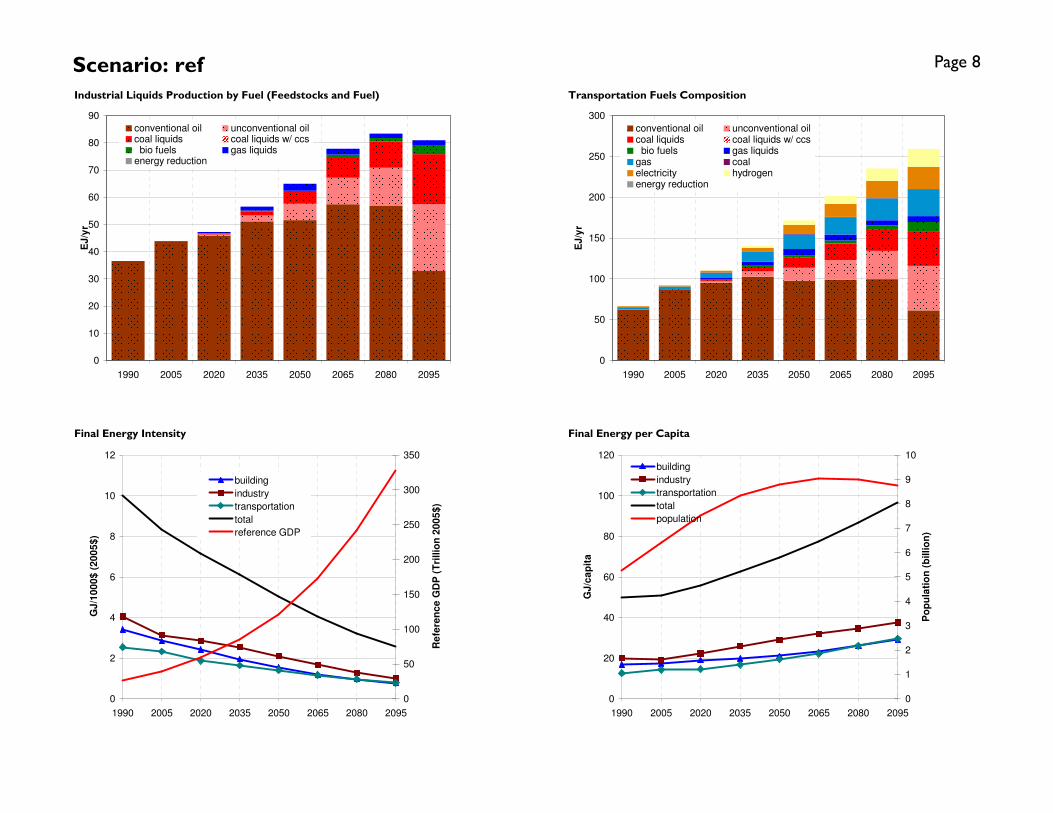
Industrial Liquids Production by Fuel (Feedstocks and Fuel) Transportation Fuels Composition
Final Energy Intensity Final Energy per Capita
0
50
100
150
200
250
300
1990 2005 2020 2035 2050 2065 2080 2095
EJ
/yr
conventional oil unconventional oilcoal liquids coal liquids w/ ccs bio fuels gas liquidsgas coalelectricity hydrogenenergy reduction
0
10
20
30
40
50
60
70
80
90
1990 2005 2020 2035 2050 2065 2080 2095
EJ
/yr
conventional oil unconventional oilcoal liquids coal liquids w/ ccs bio fuels gas liquidsenergy reduction
0
2
4
6
8
10
12
1990 2005 2020 2035 2050 2065 2080 2095
GJ
/10
00
$ (
20
05
$)
0
50
100
150
200
250
300
350
Re
fere
nc
e G
DP
(T
rillio
n 2
00
5$
)
building
industry
transportation
total
reference GDP
0
20
40
60
80
100
120
1990 2005 2020 2035 2050 2065 2080 2095
GJ
/ca
pit
a
0
1
2
3
4
5
6
7
8
9
10
Po
pu
lati
on
(b
illio
n)
building
industry
transportation
total
population

Scenario: ref Page 9
Dedicated Energy Crops, Waste Biomass, and Municipal Solid Waste Consumption by Sector Land Use by Type
Biomass Production by Source CO2 Emissions by Sector
-125
-100
-75
-50
-25
0
25
50
75
100
125
150
175
200
225
250
1990 2005 2020 2035 2050 2065 2080 2095
EJ
/yr
energy reductionsynthetic gashydrogenrefined liquids: tran & bldgelectricityIndustrydirect buildings
0
2
4
6
8
10
12
14
16
1990 2005 2020 2035 2050 2065 2080 2095
Billio
n H
ec
tare
s
urban land cropspasture managed forestbioenergy crops unmanaged forestunmanaged land rock/ice/desert/tundra
-125
-100
-75
-50
-25
0
25
50
75
100
125
150
175
200
225
250
1990 2005 2020 2035 2050 2065 2080 2095
EJ
/yr
reduction in municipal solid wate
reduction in biomass crops
waste biomass
municipal solid waste
dedicated biomass crops
waste biomass
-5
0
5
10
15
20
25
1990 2005 2020 2035 2050 2065 2080 2095
GtC
/yr
buildings industry
transportation electricity
cement emissions reduction

Scenario: nucref Page 10
Final Energy Consumption
1990 2005 2020 2035 2050 2065 2080 2095 Units
building liquids 15.2 16.4 20.8 24.7 27.0 30.7 32.6 31.6 EJ/yr
building gas 18.7 26.7 29.2 31.4 31.9 30.2 30.1 29.0 EJ/yr
building coal 10.1 5.1 8.0 8.3 7.8 7.2 6.4 5.5 EJ/yr
building biomass 4.5 5.5 7.9 9.0 9.3 9.8 9.5 8.7 EJ/yr
building electricity 16.9 29.0 44.9 65.6 88.7 113.8 144.4 173.5 EJ/yr
building trad biomass 23.5 29.9 32.1 27.8 22.9 17.9 12.2 8.0 EJ/yr
building energy reduction 0.0 0.0 0.0 -0.1 -0.2 -0.4 -0.6 -0.4 EJ/yr
total: w/o reduction 88.9 112.7 142.9 166.7 187.5 209.6 235.2 256.4 EJ/yr
industry liquids 22.4 21.2 20.3 23.9 27.4 35.3 37.9 34.4 EJ/yr
industry gas 26.6 30.5 34.2 40.3 40.5 34.4 35.8 36.5 EJ/yr
industry coal 31.4 35.8 59.0 77.7 89.7 96.2 94.5 91.9 EJ/yr
industry biomass 7.3 11.2 17.1 23.4 31.2 43.4 50.1 58.5 EJ/yr
industry electricity 18.1 24.8 34.9 48.7 65.0 78.6 91.8 105.9 EJ/yr
industry hydrogen 0.0 0.0 2.5 3.0 3.6 4.4 5.0 5.8 EJ/yr
industry energy reduction 0.0 0.0 -0.1 -0.4 -1.1 -1.8 -3.2 -4.2 EJ/yr
industry feedstocks 15.2 23.7 28.0 33.7 38.8 43.6 46.6 48.6 EJ/yr
total: w/o reduction 105.8 123.6 168.0 217.0 257.4 292.3 315.2 333.1 EJ/yr
transportation liquids 62.7 87.7 101.1 120.9 137.0 154.6 172.1 178.2 EJ/yr
transportation gas 2.2 3.0 6.5 12.3 18.1 21.6 27.9 34.0 EJ/yr
transportation coal 0.5 0.2 0.4 0.5 0.6 0.5 0.3 0.2 EJ/yr
transportation electricity 1.0 1.0 2.2 4.7 10.8 15.8 20.9 26.6 EJ/yr
transportation hydrogen 0.0 0.0 0.6 2.1 5.6 9.8 15.0 21.8 EJ/yr
transportation energy reduction 0.0 0.0 -0.1 -0.1 -0.3 -0.5 -0.9 -1.5 EJ/yr
total: w/o reduction 66.4 91.8 110.7 140.6 172.0 202.2 236.1 260.8 EJ/yr
total final energy buildings 88.9 112.7 142.9 166.7 187.5 209.6 235.2 256.4 EJ/yr
total final energy industry 105.8 123.6 168.0 217.0 257.4 292.3 315.2 333.1 EJ/yr
total final energy transportation 66.4 91.8 110.7 140.6 172.0 202.2 236.1 260.8 EJ/yr
total final energy energy reduction 0.0 0.0 -0.1 -0.6 -1.6 -2.6 -4.6 -6.1 EJ/yr
total: w/o reduction 261.1 328.1 421.6 524.3 617.0 704.2 786.6 850.3 EJ/yr

Scenario: nucref Page 11
Primary Energy w/CCS
1990 2005 2020 2035 2050 2065 2080 2095 Units
oil w/o ccs 135.6 167.5 183.6 203.2 210.2 231.3 246.4 209.3 EJ/yr
oil w/ ccs 0.0 0.0 0.0 0.0 0.0 0.0 0.0 0.0 EJ/yr
natural gas w/o ccs 69.9 97.5 129.6 177.4 218.6 221.5 242.0 267.1 EJ/yr
natural gas w/ ccs 0.0 0.0 0.0 0.0 0.0 0.0 0.0 0.0 EJ/yr
coal w/o ccs 91.2 119.1 175.9 235.1 295.1 355.7 414.0 505.0 EJ/yr
coal w/ ccs 0.0 0.0 0.0 0.0 0.0 0.0 0.0 0.0 EJ/yr
biomass w/o ccs 14.4 21.6 32.1 43.3 58.6 79.5 94.8 119.7 EJ/yr
biomass w/ ccs 0.0 0.0 0.0 0.0 0.0 0.0 0.0 0.0 EJ/yr
nuclear 21.0 26.1 25.8 35.4 54.6 91.7 120.8 149.6 EJ/yr
hydro 23.6 29.2 29.1 30.8 31.1 33.5 36.0 38.8 EJ/yr
wind 0.0 0.9 14.6 29.6 35.2 40.5 45.4 54.2 EJ/yr
solar 0.0 0.1 1.4 3.4 5.0 6.9 9.4 13.6 EJ/yr
geothermal 0.4 0.5 1.3 5.0 7.8 7.9 7.7 7.6 EJ/yr
energy reduction 0.0 0.0 -0.7 -1.4 0.7 1.8 2.5 7.9 EJ/yr
total: w/o reduction 356 463 593 763 916 1068 1217 1365 EJ/yr
Electricity Production by Fuel
1990 2005 2020 2035 2050 2065 2080 2095 Units
oil 4.86 4.33 4.24 3.56 3.81 4.83 6.11 5.10 EJ/yr
oil w/ccs 0.00 0.00 0.00 0.00 0.00 0.00 0.00 0.00 EJ/yr
gas 6.07 12.82 24.30 38.10 53.95 59.60 68.33 76.59 EJ/yr
gas w/ccs 0.00 0.00 0.00 0.00 0.00 0.00 0.00 0.00 EJ/yr
coal 16.06 26.35 37.60 50.68 65.95 80.45 100.87 121.09 EJ/yr
coal w/ccs 0.00 0.00 0.00 0.00 0.00 0.00 0.00 0.00 EJ/yr
biomass 0.43 0.71 1.26 2.30 4.42 6.27 8.33 10.20 EJ/yr
biomass w/ccs 0.00 0.00 0.00 0.00 0.00 0.00 0.00 0.00 EJ/yr
nuclear 7.36 9.97 11.00 15.88 26.89 46.35 62.41 78.25 EJ/yr
hydro 7.82 10.44 12.13 13.99 15.85 17.70 19.56 21.42 EJ/yr
wind w/backup 0.01 0.36 4.88 9.95 12.47 14.72 16.79 19.99 EJ/yr
wind w/storage 0.00 0.00 1.21 3.36 5.19 6.60 7.93 10.05 EJ/yr
CSP w/backup 0.00 0.00 0.39 0.61 0.51 0.65 0.86 1.28 EJ/yr
CSP w/storage 0.00 0.00 0.13 0.79 1.61 2.15 2.81 4.10 EJ/yr
PV w/backup 0.00 0.04 0.05 0.05 0.17 0.42 0.77 1.11 EJ/yr
PV w/storage 0.00 0.00 0.01 0.03 0.09 0.20 0.35 0.49 EJ/yr
rooftop PV w/backup 0.00 0.00 0.28 0.80 1.70 3.35 4.31 5.13 EJ/yr
geothermal 0.13 0.21 0.57 2.33 4.07 4.29 4.29 4.32 EJ/yr
energy reduction 0.00 0.00 -0.33 0.25 1.95 1.84 3.08 4.95 EJ/yr
total: w/o reduction 42.7 65.2 98.0 142.4 196.7 247.6 303.7 359.1 EJ/yr

Scenario: nucref Page 12
Transportation Fuels Production by Fuel
1990 2005 2020 2035 2050 2065 2080 2095 Units
conventional oil 62.5 86.8 95.3 102.6 97.7 98.7 98.7 65.2 EJ/yr
unconventional oil 0.0 0.0 1.7 6.7 15.8 23.9 34.2 52.5 EJ/yr
coal liquids 0.0 0.0 1.6 5.2 12.5 20.3 26.7 42.3 EJ/yr
coal liquids w/ ccs 0.0 0.0 0.0 0.0 0.0 0.0 0.0 0.0 EJ/yr
bio fuels 0.2 0.9 1.2 1.7 2.5 3.9 5.5 10.4 EJ/yr
gas liquids 0.0 0.0 1.4 4.8 8.6 7.8 6.9 7.9 EJ/yr
gas 2.2 3.0 6.5 12.3 18.1 21.6 27.9 34.0 EJ/yr
coal 0.5 0.2 0.4 0.5 0.6 0.5 0.3 0.2 EJ/yr
electricity 1.0 1.0 2.2 4.7 10.8 15.8 20.9 26.6 EJ/yr
hydrogen 0.0 0.0 0.6 2.1 5.6 9.8 15.0 21.8 EJ/yr
energy reduction 0.0 0.0 -0.1 -0.1 -0.3 -0.5 -0.9 -1.5 EJ/yr
total: w/o reduction 66.4 91.8 110.7 140.6 172.0 202.2 236.1 260.8 EJ/yr
Industrial Liquids Production by Fuel
1990 2005 2020 2035 2050 2065 2080 2095 Units
conventional oil 36.59 43.89 45.89 51.15 51.65 57.30 56.45 34.94 EJ/yr
unconventional oil 0.00 0.00 0.42 2.15 5.96 9.71 14.00 23.80 EJ/yr
coal liquids 0.00 0.00 0.39 1.53 4.45 7.84 10.14 18.47 EJ/yr
coal liquids w/ ccs 0.00 0.00 0.00 0.00 0.00 0.00 0.00 0.00 EJ/yr
bio fuels 0.01 0.05 0.13 0.25 0.48 0.87 1.27 2.83 EJ/yr
gas liquids 0.00 0.00 0.37 1.48 2.70 2.35 1.89 2.20 EJ/yr
energy reduction 0.0 0.0 0.0 0.0 -0.2 -0.2 -0.3 -1.3 EJ/yr
total: w/o reduction 36.6 43.9 47.2 56.6 65.2 78.1 83.7 82.2 EJ/yr
Hydrogen Production by Fuel
1990 2005 2020 2035 2050 2065 2080 2095 Units
gas 0.00 0.00 2.21 3.72 6.65 9.20 12.52 16.28 EJ/yr
gas w/ccs 0.00 0.00 0.00 0.00 0.00 0.00 0.00 0.00 EJ/yr
coal 0.00 0.00 0.48 0.78 1.53 2.62 3.95 5.98 EJ/yr
coal w/ccs 0.00 0.00 0.00 0.00 0.00 0.00 0.00 0.00 EJ/yr
biomass 0.00 0.00 0.14 0.22 0.41 0.67 1.00 1.49 EJ/yr
biomass w/ccs 0.00 0.00 0.00 0.00 0.00 0.00 0.00 0.00 EJ/yr
nuclear 0.00 0.00 0.08 0.11 0.17 0.85 1.30 2.06 EJ/yr
bulk electricity 0.00 0.00 0.08 0.15 0.31 0.51 0.73 1.02 EJ/yr
wind 0.00 0.00 0.05 0.05 0.08 0.12 0.18 0.27 EJ/yr
solar 0.00 0.00 0.05 0.07 0.13 0.19 0.31 0.53 EJ/yr
energy reduction 0.00 0.00 0.15 0.12 0.09 0.10 -0.01 0.09 EJ/yr
total: w/o reduction 0.00 0.00 3.09 5.12 9.28 14.15 19.99 27.63 EJ/yr

Scenario: nucref Page 13
Dedicated Bioenergy Crops, Crop Residues, and Municipal Solid Waste Consumption by Sector
1990 2005 2020 2035 2050 2065 2080 2095 Units
direct buildings 4.5 5.5 7.9 9.0 9.3 9.8 9.5 8.7 EJ/yr
Industry 7.4 11.3 17.4 23.9 32.1 45.1 52.5 63.6 EJ/yr
electricity 2.1 2.5 3.6 6.0 10.4 14.3 18.6 22.4 EJ/yr
refined liquids: tran & bldg 0.5 2.2 2.9 4.0 5.8 8.9 12.2 22.0 EJ/yr
hydrogen 0.0 0.0 0.3 0.5 0.9 1.4 2.0 2.9 EJ/yr
synthetic gas 0.0 0.0 0.0 0.0 0.0 0.1 0.1 0.1 EJ/yr
energy reduction 0.0 0.0 0.1 0.5 1.7 4.1 6.5 10.4 EJ/yr
total: w/o reduction 14.4 21.6 32.1 43.3 58.6 79.5 94.8 119.7 EJ/yr
Biomass Production
1990 2005 2020 2035 2050 2065 2080 2095 Units
waste biomass 14.4 21.5 31.6 37.8 41.6 44.8 46.2 47.9 EJ
dedicated biomass crops 0.0 0.0 0.0 4.5 15.3 31.6 43.8 63.4 EJ
municipal solid waste 0.0 0.1 0.4 1.0 1.7 3.1 4.8 8.4 EJ
waste biomass 0.0 0.0 0.0 0.1 0.2 0.5 0.9 1.4 EJ
reduction in biomass crops 0.0 0.0 0.0 0.4 1.4 3.2 4.9 7.0 EJ
reduction in municipal solid wate 0.0 0.0 0.0 0.0 0.1 0.3 0.7 1.9 EJ
total: w/o reduction 14.4 21.6 32.1 43.8 60.2 83.3 100.6 128.1 EJ
Arable Land Use by Type
1990 2005 2020 2035 2050 2065 2080 2095 Units
urban land 0.05 0.05 0.05 0.05 0.05 0.05 0.05 0.05 billion Ha
crops 1.20 1.21 1.37 1.40 1.36 1.34 1.27 1.20 billion Ha
pasture 0.70 0.73 0.92 1.07 1.17 1.22 1.25 1.22 billion Ha
managed forest 0.69 0.74 0.79 0.84 0.89 0.92 0.95 0.98 billion Ha
bioenergy crops 0.00 0.00 0.00 0.02 0.11 0.35 0.55 0.98 billion Ha
unmanaged forest 3.32 3.25 3.11 3.02 2.95 2.82 2.73 2.56 billion Ha
unmanaged land 4.58 4.58 4.31 4.15 4.03 3.85 3.75 3.57 billion Ha
rock/ice/desert/tundra 2.62 2.62 2.62 2.62 2.62 2.62 2.62 2.62 billion Ha
total 10.50 10.50 10.50 10.50 10.50 10.50 10.50 10.50 billion Ha

Scenario: nucref Page 14
Population, GDP, and Energy Indicators
1990 2005 2020 2035 2050 2065 2080 2095 Units
Economic Activity reference GDP $26.1 $39.4 $58.8 $85.2 $121.7 $172.4 $241.5 $328.9 trillion 2005$
Final Energy Intensity building 3.41 2.86 2.43 1.96 1.54 1.22 0.97 0.78 GJ/1000$ (2005$)
Final Energy Intensity industry 4.06 3.14 2.86 2.55 2.11 1.70 1.31 1.01 GJ/1000$ (2005$)
Final Energy Intensity transportation 2.55 2.33 1.88 1.65 1.41 1.17 0.98 0.79 GJ/1000$ (2005$)
Final Energy Intensity total 10.01 8.33 7.17 6.15 5.07 4.08 3.26 2.59 GJ/1000$ (2005$)
Population population 5.2 6.4 7.5 8.3 8.8 9.1 9.0 8.7 billion
Final Energy per Capita building 16.9 17.5 19.0 20.0 21.3 23.1 26.1 29.3 GJ/capita
Final Energy per Capita industry 20.2 19.2 22.3 26.0 29.2 32.3 35.0 38.1 GJ/capita
Final Energy per Capita transportation 12.7 14.3 14.7 16.8 19.5 22.3 26.2 29.8 GJ/capita
Final Energy per Capita total 49.7 51.0 56.0 62.9 70.0 77.7 87.3 97.2 GJ/capita
Long-Term Equilibrium Energy Producer Prices
1990 2005 2020 2035 2050 2065 2080 2095 Units
global oil (w/o carbon charge) $27.6 $32.5 $39.8 $42.2 $45.1 $46.8 $48.1 $59.1 $/barrel (2005$)
global oil (w/ carbon charge) $27.6 $32.5 $39.8 $42.2 $45.1 $46.8 $48.1 $59.1 $/barrel (2005$)
domestic natural gas (w/o carbon charge) $3.3 $3.8 $4.4 $4.2 $4.5 $5.6 $5.7 $5.9 $/mmBTU (2005$)
domestic natural gas (w/ carbon charge) $3.3 $3.8 $4.4 $4.2 $4.5 $5.6 $5.7 $5.9 $/mmBTU (2005$)
domestic coal (w/o carbon charge) $1.7 $1.7 $1.8 $1.8 $1.8 $1.9 $1.9 $2.0 $/GJ (2005$)
domestic coal (w/ carbon charge) $1.7 $1.7 $1.8 $1.8 $1.8 $1.9 $1.9 $2.0 $/GJ (2005$)
domestic electricity (w/ carbon charge) 6.21 5.75 5.78 5.58 5.47 5.58 5.43 5.41 cents/kWh (2005$)
carbon price 0.0 0.0 0.0 0.0 0.0 0.0 0.0 0.0 $/tC (2005$)
Crop Prices
1990 2005 2020 2035 2050 2065 2080 2095 Units
global corn 33 33 33 33 33 33 33 33 $/Gcal (2005$)
global rice 32 32 32 32 32 32 32 31 $/Gcal (2005$)
global wheat 27 27 27 26 26 26 26 26 $/Gcal (2005$)
Emissions by Sectors
1990 2005 2020 2035 2050 2065 2080 2095 Units
buildings 0.858 0.860 1.079 1.226 1.315 1.398 1.438 1.441 GtC/yr
industry 1.623 1.706 2.266 2.851 3.289 3.663 3.808 3.991 GtC/yr
transportation 1.354 1.863 2.272 2.937 3.684 4.403 5.111 5.864 GtC/yr
electricity 1.909 2.848 3.717 4.740 5.643 6.483 7.759 8.956 GtC/yr
cement 0.261 0.483 0.893 1.271 1.474 1.473 1.367 1.228 GtC/yr
emissions reduction 0.000 0.000 0.039 0.239 0.720 1.517 2.132 2.818 GtC/yr
total: w/o reduction 6.006 7.760 10.227 13.025 15.405 17.419 19.483 21.480 GtC/yr
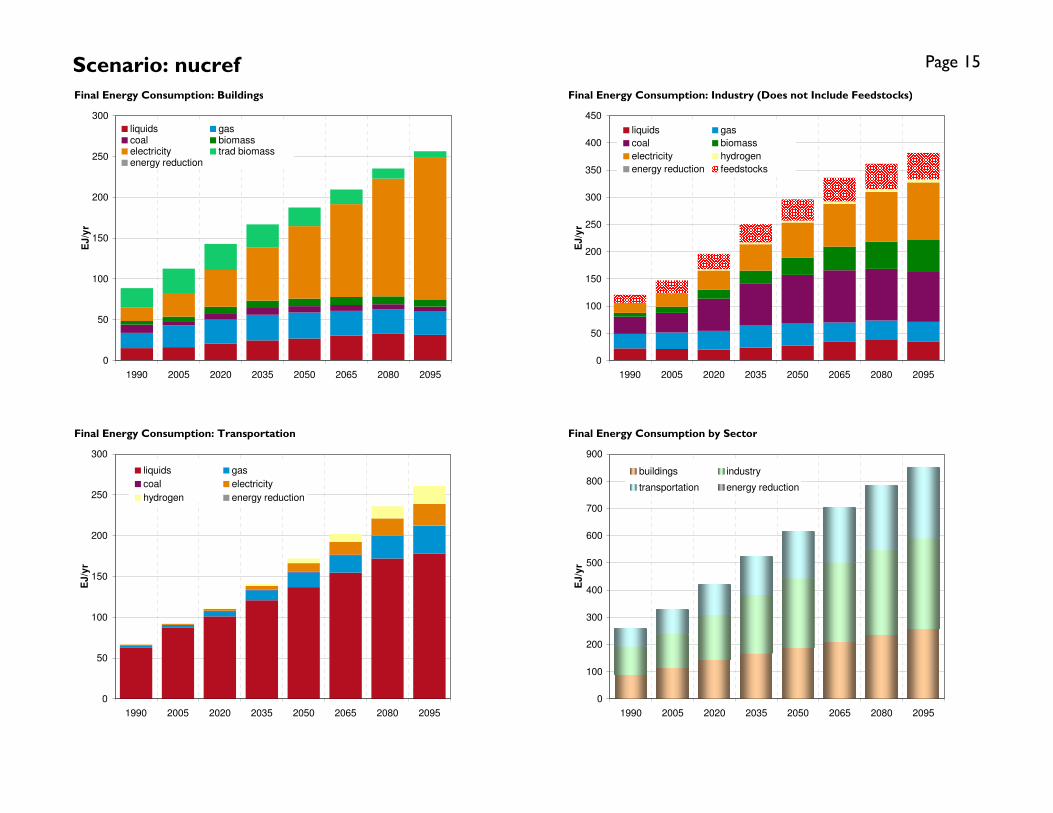
Scenario: nucref Page 15
Final Energy Consumption: Buildings Final Energy Consumption: Industry (Does not Include Feedstocks)
Final Energy Consumption: Transportation Final Energy Consumption by Sector
0
50
100
150
200
250
300
1990 2005 2020 2035 2050 2065 2080 2095
EJ
/yr
liquids gascoal biomasselectricity trad biomassenergy reduction
0
50
100
150
200
250
300
350
400
450
1990 2005 2020 2035 2050 2065 2080 2095
EJ
/yr
liquids gas
coal biomass
electricity hydrogen
energy reduction feedstocks
0
50
100
150
200
250
300
1990 2005 2020 2035 2050 2065 2080 2095
EJ
/yr
liquids gas
coal electricity
hydrogen energy reduction
0
100
200
300
400
500
600
700
800
900
1990 2005 2020 2035 2050 2065 2080 2095
EJ
/yr
buildings industry
transportation energy reduction

Scenario: nucref Page 16
Primary Energy Consumption Electricity Production by Fuel: CCS Focus
Hydrogen Production by Fuel Electricity Production by Fuel: Renewable Focus
-50
0
50
100
150
200
250
300
350
400
1990 2005 2020 2035 2050 2065 2080 2095
EJ
/yr
liquids liquids w/CCS
gas gas w/ccs
coal coal w/ccs
biomass biomass w/ccs
nuclear hydro
wind solar
geothermal energy reduction
-50
-40
-30
-20
-10
0
10
20
30
40
50
60
70
80
1990 2005 2020 2035 2050 2065 2080 2095
EJ
/yr
gas gas w/ccs
coal coal w/ccs
biomass biomass w/ccs
nuclear bulk electricity
wind solar
energy reduction
-50
0
50
100
150
200
250
300
350
400
1990 2005 2020 2035 2050 2065 2080 2095
EJ
/yr
liquids gascoal biomassnuclear hydrowind w/ backup wind w/ storagecsp w/ backup csp w/ storagepv w/ backup pv w/ storagerooftop solar w/ backup geothermalenergy reduction
0
200
400
600
800
1,000
1,200
1,400
1,600
1990 2005 2020 2035 2050 2065 2080 2095
EJ
/yr
oil w/o ccs oil w/ ccsnatural gas w/o ccs natural gas w/ ccscoal w/o ccs coal w/ ccsbiomass w/o ccs biomass w/ ccsnuclear hydrowind solargeothermal energy reduction

Scenario: nucref Page 17
Industrial Liquids Production by Fuel (Feedstocks and Fuel) Transportation Fuels Composition
Final Energy Intensity Final Energy per Capita
-50
0
50
100
150
200
250
300
1990 2005 2020 2035 2050 2065 2080 2095
EJ
/yr
conventional oil unconventional oilcoal liquids coal liquids w/ ccs bio fuels gas liquidsgas coalelectricity hydrogenenergy reduction
-10
0
10
20
30
40
50
60
70
80
90
1990 2005 2020 2035 2050 2065 2080 2095
EJ
/yr
conventional oil unconventional oilcoal liquids coal liquids w/ ccs bio fuels gas liquidsenergy reduction
0
2
4
6
8
10
12
1990 2005 2020 2035 2050 2065 2080 2095
GJ
/10
00
$ (
20
05
$)
0
50
100
150
200
250
300
350
Re
fere
nc
e G
DP
(T
rillio
n 2
00
5$
)
building
industry
transportation
total
reference GDP
0
20
40
60
80
100
120
1990 2005 2020 2035 2050 2065 2080 2095
GJ
/ca
pit
a
0
1
2
3
4
5
6
7
8
9
10
Po
pu
lati
on
(b
illio
n)
building
industry
transportation
total
population
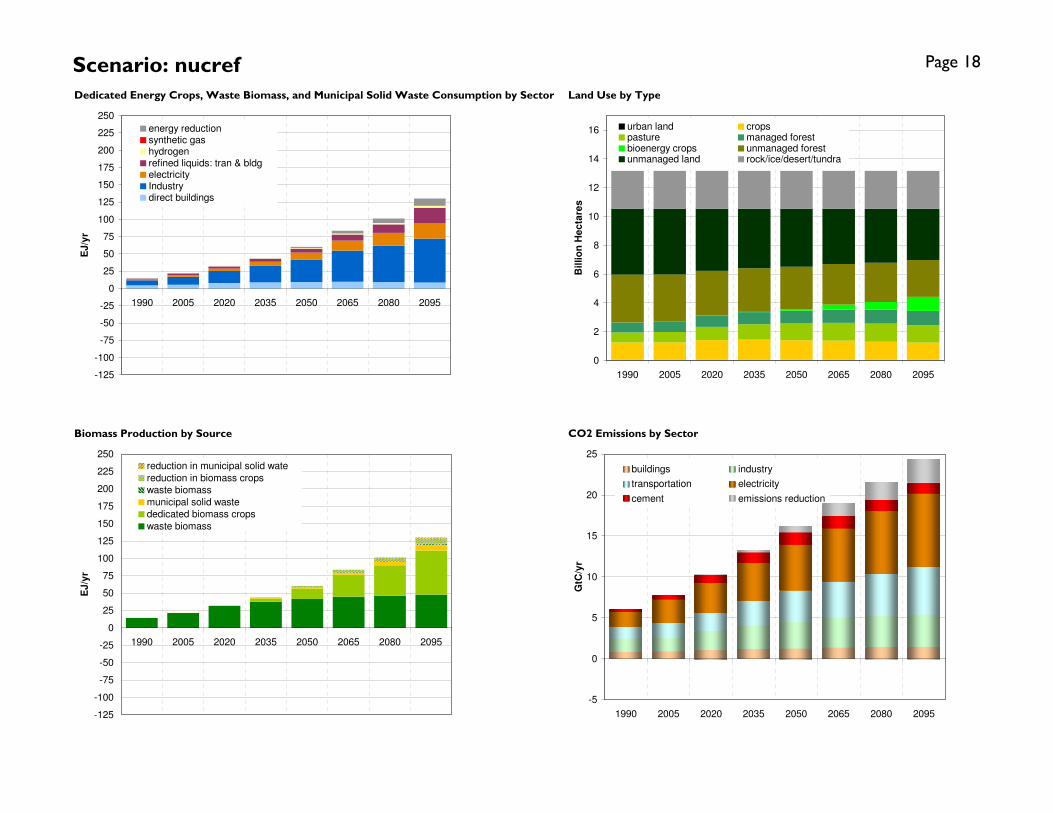
Scenario: nucref Page 18
Dedicated Energy Crops, Waste Biomass, and Municipal Solid Waste Consumption by Sector Land Use by Type
Biomass Production by Source CO2 Emissions by Sector
-125
-100
-75
-50
-25
0
25
50
75
100
125
150
175
200
225
250
1990 2005 2020 2035 2050 2065 2080 2095
EJ
/yr
energy reductionsynthetic gashydrogenrefined liquids: tran & bldgelectricityIndustrydirect buildings
0
2
4
6
8
10
12
14
16
1990 2005 2020 2035 2050 2065 2080 2095
Billio
n H
ec
tare
s
urban land cropspasture managed forestbioenergy crops unmanaged forestunmanaged land rock/ice/desert/tundra
-125
-100
-75
-50
-25
0
25
50
75
100
125
150
175
200
225
250
1990 2005 2020 2035 2050 2065 2080 2095
EJ
/yr
reduction in municipal solid wate
reduction in biomass crops
waste biomass
municipal solid waste
dedicated biomass crops
waste biomass
-5
0
5
10
15
20
25
1990 2005 2020 2035 2050 2065 2080 2095
GtC
/yr
buildings industry
transportation electricity
cement emissions reduction

Scenario: ref stab Page 19
Final Energy Consumption
1990 2005 2020 2035 2050 2065 2080 2095 Units
building liquids 15.2 16.4 18.1 19.7 18.2 13.3 12.0 11.9 EJ/yr
building gas 18.7 26.7 26.5 25.5 21.4 14.0 12.0 10.6 EJ/yr
building coal 10.1 5.1 3.7 2.1 0.8 0.2 0.1 0.1 EJ/yr
building biomass 4.5 5.5 8.7 8.9 6.2 3.0 2.1 1.7 EJ/yr
building electricity 16.9 29.0 39.4 53.8 64.6 78.1 98.9 120.2 EJ/yr
building trad biomass 23.5 29.9 33.4 31.7 29.1 25.3 19.2 12.6 EJ/yr
building energy reduction 0.0 0.0 13.2 24.9 47.1 75.3 90.3 99.0 EJ/yr
total: w/o reduction 88.9 112.7 129.7 141.7 140.3 133.9 144.3 157.0 EJ/yr
industry liquids 22.4 21.2 20.0 21.7 20.9 15.1 12.7 11.0 EJ/yr
industry gas 26.6 30.5 27.9 25.8 19.2 11.4 9.8 9.1 EJ/yr
industry coal 31.4 35.8 22.7 15.1 7.2 2.2 1.5 1.2 EJ/yr
industry biomass 7.3 11.2 29.8 42.4 41.6 29.6 24.8 24.2 EJ/yr
industry electricity 18.1 24.8 34.2 47.4 60.0 79.3 94.1 108.5 EJ/yr
industry hydrogen 0.0 0.0 3.1 3.8 5.0 5.4 6.0 7.0 EJ/yr
industry energy reduction 0.0 0.0 30.2 60.4 102.3 147.6 163.1 168.0 EJ/yr
industry feedstocks 15.2 23.7 24.1 26.2 26.1 25.2 26.2 28.0 EJ/yr
total: w/o reduction 105.8 123.6 137.7 156.2 154.0 143.0 148.9 161.0 EJ/yr
transportation liquids 62.7 87.7 95.5 107.7 107.9 91.6 91.8 94.7 EJ/yr
transportation gas 2.2 3.0 5.8 10.6 14.9 16.6 19.3 21.4 EJ/yr
transportation coal 0.5 0.2 0.1 0.1 0.0 0.0 0.0 0.0 EJ/yr
transportation electricity 1.0 1.0 2.2 5.0 12.0 23.0 31.3 37.2 EJ/yr
transportation hydrogen 0.0 0.0 0.6 2.2 6.4 12.3 19.3 27.4 EJ/yr
transportation energy reduction 0.0 0.0 6.6 14.8 30.5 58.2 73.6 78.6 EJ/yr
total: w/o reduction 66.4 91.8 104.1 125.6 141.3 143.6 161.6 180.7 EJ/yr
total final energy buildings 88.9 112.7 129.7 141.7 140.3 133.9 144.3 157.0 EJ/yr
total final energy industry 105.8 123.6 137.7 156.2 154.0 143.0 148.9 161.0 EJ/yr
total final energy transportation 66.4 91.8 104.1 125.6 141.3 143.6 161.6 180.7 EJ/yr
total final energy energy reduction 0.0 0.0 50.0 100.2 179.9 281.1 327.1 345.6 EJ/yr
total: w/o reduction 261.1 328.1 371.5 423.5 435.5 420.4 454.9 498.7 EJ/yr

Scenario: ref stab Page 20
Primary Energy w/CCS
1990 2005 2020 2035 2050 2065 2080 2095 Units
oil w/o ccs 135.6 167.5 168.2 168.0 145.1 101.8 84.6 75.1 EJ/yr
oil w/ ccs 0.0 0.0 0.0 0.0 0.0 0.0 0.0 0.0 EJ/yr
natural gas w/o ccs 69.9 97.5 115.1 143.7 156.4 125.2 118.0 115.3 EJ/yr
natural gas w/ ccs 0.0 0.0 0.0 0.0 0.0 0.0 0.0 0.0 EJ/yr
coal w/o ccs 91.2 119.1 108.8 92.4 38.5 12.8 10.5 10.4 EJ/yr
coal w/ ccs 0.0 0.0 0.0 0.0 0.0 0.0 0.0 0.0 EJ/yr
biomass w/o ccs 14.4 21.6 56.3 100.6 147.0 168.8 185.4 202.3 EJ/yr
biomass w/ ccs 0.0 0.0 0.0 0.0 0.0 0.0 0.0 0.0 EJ/yr
nuclear 21.0 26.1 23.3 21.3 17.1 16.0 15.4 15.0 EJ/yr
hydro 23.6 29.2 29.2 29.6 28.6 29.7 31.7 34.4 EJ/yr
wind 0.0 0.9 19.9 48.4 75.7 120.4 144.4 159.3 EJ/yr
solar 0.0 0.1 1.7 7.4 24.0 70.3 127.9 191.1 EJ/yr
geothermal 0.4 0.5 1.6 6.8 7.7 7.4 7.1 7.0 EJ/yr
energy reduction 0.0 0.0 68.5 143.4 276.9 417.8 494.1 562.8 EJ/yr
total: w/o reduction 356 463 524 618 640 652 725 810 EJ/yr
Electricity Production by Fuel
1990 2005 2020 2035 2050 2065 2080 2095 Units
oil 4.86 4.33 4.20 3.68 4.09 4.51 4.43 5.40 EJ/yr
oil w/ccs 0.00 0.00 0.00 0.00 0.00 0.00 0.00 0.00 EJ/yr
gas 6.07 12.82 22.62 34.43 44.55 36.43 34.45 34.51 EJ/yr
gas w/ccs 0.00 0.00 0.00 0.00 0.00 0.00 0.00 0.00 EJ/yr
coal 16.06 26.35 29.51 28.88 13.27 4.50 3.81 3.90 EJ/yr
coal w/ccs 0.00 0.00 0.00 0.00 0.00 0.00 0.00 0.00 EJ/yr
biomass 0.43 0.71 1.73 4.59 11.85 15.94 14.92 12.44 EJ/yr
biomass w/ccs 0.00 0.00 0.00 0.00 0.00 0.00 0.00 0.00 EJ/yr
nuclear 7.36 9.97 9.95 9.95 9.95 9.95 9.95 9.95 EJ/yr
hydro 7.82 10.44 12.13 13.99 15.85 17.70 19.56 21.42 EJ/yr
wind w/backup 0.01 0.36 6.24 14.91 23.78 35.70 40.89 44.13 EJ/yr
wind w/storage 0.00 0.00 2.07 7.31 17.10 35.69 47.35 53.79 EJ/yr
CSP w/backup 0.00 0.00 0.44 1.05 2.51 7.30 13.04 19.17 EJ/yr
CSP w/storage 0.00 0.00 0.16 2.00 8.10 24.06 43.52 66.07 EJ/yr
PV w/backup 0.00 0.04 0.05 0.12 0.85 4.10 8.03 10.75 EJ/yr
PV w/storage 0.00 0.00 0.01 0.07 0.43 2.51 5.98 9.05 EJ/yr
rooftop PV w/backup 0.00 0.00 0.38 1.35 3.95 7.91 10.23 12.02 EJ/yr
geothermal 0.13 0.21 0.70 3.30 4.41 4.50 4.51 4.50 EJ/yr
energy reduction 0.00 0.00 7.78 19.88 48.02 71.27 105.85 144.19 EJ/yr
total: w/o reduction 42.7 65.2 90.2 125.6 160.7 210.8 260.7 307.1 EJ/yr

Scenario: ref stab Page 21
Transportation Fuels Production by Fuel
1990 2005 2020 2035 2050 2065 2080 2095 Units
conventional oil 62.5 86.8 89.0 89.7 76.9 53.8 45.3 39.3 EJ/yr
unconventional oil 0.0 0.0 0.8 2.1 2.9 1.2 0.7 0.7 EJ/yr
coal liquids 0.0 0.0 0.1 0.1 0.0 0.0 0.0 0.0 EJ/yr
coal liquids w/ ccs 0.0 0.0 0.0 0.0 0.0 0.0 0.0 0.0 EJ/yr
bio fuels 0.2 0.9 4.3 12.4 23.4 33.3 43.5 53.4 EJ/yr
gas liquids 0.0 0.0 1.2 3.5 4.8 3.4 2.2 1.3 EJ/yr
gas 2.2 3.0 5.8 10.6 14.9 16.6 19.3 21.4 EJ/yr
coal 0.5 0.2 0.1 0.1 0.0 0.0 0.0 0.0 EJ/yr
electricity 1.0 1.0 2.2 5.0 12.0 23.0 31.3 37.2 EJ/yr
hydrogen 0.0 0.0 0.6 2.2 6.4 12.3 19.3 27.4 EJ/yr
energy reduction 0.0 0.0 6.6 14.8 30.5 58.2 73.6 78.6 EJ/yr
total: w/o reduction 66.4 91.8 104.1 125.6 141.3 143.6 161.6 180.7 EJ/yr
Industrial Liquids Production by Fuel
1990 2005 2020 2035 2050 2065 2080 2095 Units
conventional oil 36.59 43.89 41.79 42.10 36.49 25.68 20.88 17.48 EJ/yr
unconventional oil 0.00 0.00 0.17 0.35 0.35 0.07 0.09 0.08 EJ/yr
coal liquids 0.00 0.00 0.01 0.00 0.00 0.00 0.00 0.00 EJ/yr
coal liquids w/ ccs 0.00 0.00 0.00 0.00 0.00 0.00 0.00 0.00 EJ/yr
bio fuels 0.01 0.05 0.83 3.47 7.95 12.78 16.66 20.47 EJ/yr
gas liquids 0.00 0.00 0.29 0.95 1.24 0.85 0.47 0.17 EJ/yr
energy reduction 0.0 0.0 4.1 9.7 19.0 38.5 45.3 42.7 EJ/yr
total: w/o reduction 36.6 43.9 43.1 46.9 46.0 39.4 38.1 38.2 EJ/yr
Hydrogen Production by Fuel
1990 2005 2020 2035 2050 2065 2080 2095 Units
gas 0.00 0.00 2.69 4.49 8.35 10.75 12.30 13.13 EJ/yr
gas w/ccs 0.00 0.00 0.00 0.00 0.00 0.00 0.00 0.00 EJ/yr
coal 0.00 0.00 0.34 0.36 0.38 0.31 0.39 0.49 EJ/yr
coal w/ccs 0.00 0.00 0.00 0.00 0.00 0.00 0.00 0.00 EJ/yr
biomass 0.00 0.00 0.31 0.61 1.08 1.45 1.89 2.45 EJ/yr
biomass w/ccs 0.00 0.00 0.00 0.00 0.00 0.00 0.00 0.00 EJ/yr
nuclear 0.00 0.00 0.00 0.00 0.00 0.00 0.00 0.00 EJ/yr
bulk electricity 0.00 0.00 0.09 0.20 0.44 0.91 1.31 1.69 EJ/yr
wind 0.00 0.00 0.11 0.14 0.31 0.90 1.59 2.45 EJ/yr
solar 0.00 0.00 0.11 0.24 0.85 3.39 7.83 14.12 EJ/yr
energy reduction 0.00 0.00 -0.41 -0.80 -2.04 -3.46 -5.32 -6.61 EJ/yr
total: w/o reduction 0.00 0.00 3.66 6.03 11.41 17.71 25.30 34.33 EJ/yr

Scenario: ref stab Page 22
Dedicated Bioenergy Crops, Crop Residues, and Municipal Solid Waste Consumption by Sector
1990 2005 2020 2035 2050 2065 2080 2095 Units
direct buildings 4.5 5.5 8.7 8.9 6.2 3.0 2.1 1.7 EJ/yr
Industry 7.4 11.3 31.6 49.4 57.2 54.0 55.8 61.2 EJ/yr
electricity 2.1 2.5 4.8 11.6 27.6 36.1 32.3 26.3 EJ/yr
refined liquids: tran & bldg 0.5 2.2 10.6 29.4 53.7 72.9 91.4 108.3 EJ/yr
hydrogen 0.0 0.0 0.7 1.3 2.3 3.0 3.8 4.8 EJ/yr
synthetic gas 0.0 0.0 0.0 0.0 0.0 0.0 0.0 0.0 EJ/yr
energy reduction 0.0 0.0 -24.2 -56.7 -86.7 -85.2 -84.1 -72.3 EJ/yr
total: w/o reduction 14.4 21.6 56.3 100.6 147.0 168.8 185.4 202.3 EJ/yr
Biomass Production
1990 2005 2020 2035 2050 2065 2080 2095 Units
waste biomass 14.4 21.5 26.7 53.7 78.7 82.8 82.7 80.6 EJ
dedicated biomass crops 0.0 0.0 29.4 39.1 52.1 64.2 73.8 84.1 EJ
municipal solid waste 0.0 0.1 0.2 7.8 16.2 21.9 29.0 37.5 EJ
waste biomass 0.0 0.0 4.9 -15.9 -36.9 -37.4 -35.6 -31.3 EJ
reduction in biomass crops 0.0 0.0 -29.4 -34.1 -35.4 -29.4 -25.0 -13.7 EJ
reduction in municipal solid wate 0.0 0.0 0.3 -6.7 -14.4 -18.5 -23.4 -27.2 EJ
total: w/o reduction 14.4 21.6 31.8 50.6 74.7 102.1 124.8 157.3 EJ
Arable Land Use by Type
1990 2005 2020 2035 2050 2065 2080 2095 Units
urban land 0.05 0.05 0.05 0.05 0.05 0.05 0.05 0.05 billion Ha
crops 1.20 1.21 0.91 0.83 0.71 0.61 0.54 0.48 billion Ha
pasture 0.70 0.73 0.70 0.70 0.69 0.69 0.69 0.69 billion Ha
managed forest 0.69 0.74 0.83 0.91 0.95 0.94 0.93 0.93 billion Ha
bioenergy crops 0.00 0.00 0.15 0.20 0.28 0.34 0.38 0.42 billion Ha
unmanaged forest 3.32 3.25 3.95 3.91 3.90 3.93 3.95 3.96 billion Ha
unmanaged land 4.58 4.58 3.95 3.96 3.98 4.00 4.02 4.03 billion Ha
rock/ice/desert/tundra 2.62 2.62 2.62 2.62 2.62 2.62 2.62 2.62 billion Ha
total 10.50 10.50 10.50 10.50 10.50 10.50 10.50 10.50 billion Ha

Scenario: ref stab Page 23
Population, GDP, and Energy Indicators
1990 2005 2020 2035 2050 2065 2080 2095 Units
Economic Activity reference GDP $26.1 $39.4 $56.7 $80.5 $112.7 $156.2 $218.8 $299.7 trillion 2005$
Final Energy Intensity building 3.41 2.86 2.29 1.76 1.25 0.86 0.66 0.52 GJ/1000$ (2005$)
Final Energy Intensity industry 4.06 3.14 2.43 1.94 1.37 0.92 0.68 0.54 GJ/1000$ (2005$)
Final Energy Intensity transportation 2.55 2.33 1.84 1.56 1.25 0.92 0.74 0.60 GJ/1000$ (2005$)
Final Energy Intensity total 10.01 8.33 6.55 5.26 3.87 2.69 2.08 1.66 GJ/1000$ (2005$)
Population population 5.2 6.4 7.5 8.3 8.8 9.1 9.0 8.7 billion
Final Energy per Capita building 16.9 17.5 17.2 17.0 15.9 14.8 16.0 17.9 GJ/capita
Final Energy per Capita industry 20.2 19.2 18.3 18.7 17.5 15.8 16.5 18.4 GJ/capita
Final Energy per Capita transportation 12.7 14.3 13.8 15.1 16.0 15.8 17.9 20.7 GJ/capita
Final Energy per Capita total 49.7 51.0 49.3 50.8 49.4 46.4 50.5 57.0 GJ/capita
Long-Term Equilibrium Energy Producer Prices
1990 2005 2020 2035 2050 2065 2080 2095 Units
global oil (w/o carbon charge) $27.6 $32.5 $39.5 $40.7 $42.6 $42.2 $41.2 $39.9 $/barrel (2005$)
global oil (w/ carbon charge) $27.6 $32.5 $52.3 $67.3 $98.1 $156.9 $178.7 $188.2 $/barrel (2005$)
domestic natural gas (w/o carbon charge) $3.3 $3.8 $4.2 $3.9 $4.1 $4.3 $4.3 $4.4 $/mmBTU (2005$)
domestic natural gas (w/ carbon charge) $3.3 $3.8 $5.8 $7.2 $11.0 $18.6 $21.4 $22.8 $/mmBTU (2005$)
domestic coal (w/o carbon charge) $1.7 $1.7 $1.7 $1.6 $1.5 $1.4 $1.3 $1.2 $/GJ (2005$)
domestic coal (w/ carbon charge) $1.7 $1.7 $4.6 $7.6 $14.0 $27.3 $32.4 $34.8 $/GJ (2005$)
domestic electricity (w/ carbon charge) 6.21 5.75 7.09 7.54 9.73 11.74 11.79 12.01 cents/kWh (2005$)
carbon price 0.0 0.0 105.6 219.4 456.2 948.6 1138.1 1228.1 $/tC (2005$)
Crop Prices
1990 2005 2020 2035 2050 2065 2080 2095 Units
global corn 33 33 54 68 89 122 124 115 $/Gcal (2005$)
global rice 32 32 66 87 129 193 183 150 $/Gcal (2005$)
global wheat 27 27 65 91 134 204 198 168 $/Gcal (2005$)
Emissions by Sectors
1990 2005 2020 2035 2050 2065 2080 2095 Units
buildings 0.858 0.860 0.839 0.785 0.623 0.380 0.304 0.258 GtC/yr
industry 1.623 1.706 1.396 1.194 0.801 0.333 0.159 0.021 GtC/yr
transportation 1.354 1.863 2.013 2.199 2.082 1.592 1.443 1.342 GtC/yr
electricity 1.909 2.848 3.068 3.100 2.055 1.299 1.184 1.211 GtC/yr
cement 0.261 0.483 0.533 0.594 0.553 0.439 0.381 0.341 GtC/yr
emissions reduction 0.000 0.000 2.416 5.391 10.011 14.893 18.145 21.127 GtC/yr
total: w/o reduction 6.006 7.760 7.849 7.872 6.114 4.043 3.470 3.171 GtC/yr

Scenario: ref stab Page 24
Final Energy Consumption: Buildings Final Energy Consumption: Industry (Does not Include Feedstocks)
Final Energy Consumption: Transportation Final Energy Consumption by Sector
0
50
100
150
200
250
300
1990 2005 2020 2035 2050 2065 2080 2095
EJ
/yr
liquids gascoal biomasselectricity trad biomassenergy reduction
0
50
100
150
200
250
300
350
400
1990 2005 2020 2035 2050 2065 2080 2095
EJ
/yr
liquids gas
coal biomass
electricity hydrogen
energy reduction feedstocks
0
50
100
150
200
250
300
1990 2005 2020 2035 2050 2065 2080 2095
EJ
/yr
liquids gas
coal electricity
hydrogen energy reduction
0
100
200
300
400
500
600
700
800
900
1990 2005 2020 2035 2050 2065 2080 2095
EJ
/yr
buildings industry
transportation energy reduction

Scenario: ref stab Page 25
Primary Energy Consumption Electricity Production by Fuel: CCS Focus
Hydrogen Production by Fuel Electricity Production by Fuel: Renewable Focus
-50
0
50
100
150
200
250
300
350
400
1990 2005 2020 2035 2050 2065 2080 2095
EJ
/yr
liquids liquids w/CCS
gas gas w/ccs
coal coal w/ccs
biomass biomass w/ccs
nuclear hydro
wind solar
geothermal energy reduction
-50
-40
-30
-20
-10
0
10
20
30
40
50
60
70
80
1990 2005 2020 2035 2050 2065 2080 2095
EJ
/yr
gas gas w/ccs
coal coal w/ccs
biomass biomass w/ccs
nuclear bulk electricity
wind solar
energy reduction
-50
0
50
100
150
200
250
300
350
400
1990 2005 2020 2035 2050 2065 2080 2095
EJ
/yr
liquids gascoal biomassnuclear hydrowind w/ backup wind w/ storagecsp w/ backup csp w/ storagepv w/ backup pv w/ storagerooftop solar w/ backup geothermalenergy reduction
0
200
400
600
800
1,000
1,200
1,400
1,600
1990 2005 2020 2035 2050 2065 2080 2095
EJ
/yr
oil w/o ccs oil w/ ccsnatural gas w/o ccs natural gas w/ ccscoal w/o ccs coal w/ ccsbiomass w/o ccs biomass w/ ccsnuclear hydrowind solargeothermal energy reduction

Scenario: ref stab Page 26
Industrial Liquids Production by Fuel (Feedstocks and Fuel) Transportation Fuels Composition
Final Energy Intensity Final Energy per Capita
0
50
100
150
200
250
300
1990 2005 2020 2035 2050 2065 2080 2095
EJ
/yr
conventional oil unconventional oilcoal liquids coal liquids w/ ccs bio fuels gas liquidsgas coalelectricity hydrogenenergy reduction
0
10
20
30
40
50
60
70
80
90
1990 2005 2020 2035 2050 2065 2080 2095
EJ
/yr
conventional oil unconventional oilcoal liquids coal liquids w/ ccs bio fuels gas liquidsenergy reduction
0
2
4
6
8
10
12
1990 2005 2020 2035 2050 2065 2080 2095
GJ
/10
00
$ (
20
05
$)
0
50
100
150
200
250
300
350
Re
fere
nc
e G
DP
(T
rillio
n 2
00
5$
)
building
industry
transportation
total
reference GDP
0
10
20
30
40
50
60
1990 2005 2020 2035 2050 2065 2080 2095
GJ
/ca
pit
a
0
1
2
3
4
5
6
7
8
9
10
Po
pu
lati
on
(b
illio
n)
building
industry
transportation
total
population

Scenario: ref stab Page 27
Dedicated Energy Crops, Waste Biomass, and Municipal Solid Waste Consumption by Sector Land Use by Type
Biomass Production by Source CO2 Emissions by Sector
-125
-100
-75
-50
-25
0
25
50
75
100
125
150
175
200
225
250
1990 2005 2020 2035 2050 2065 2080 2095
EJ
/yr
energy reductionsynthetic gashydrogenrefined liquids: tran & bldgelectricityIndustrydirect buildings
0
2
4
6
8
10
12
14
16
1990 2005 2020 2035 2050 2065 2080 2095
Billio
n H
ec
tare
s
urban land cropspasture managed forestbioenergy crops unmanaged forestunmanaged land rock/ice/desert/tundra
-125
-100
-75
-50
-25
0
25
50
75
100
125
150
175
200
225
250
1990 2005 2020 2035 2050 2065 2080 2095
EJ
/yr
reduction in municipal solid wate
reduction in biomass crops
waste biomass
municipal solid waste
dedicated biomass crops
waste biomass
-5
0
5
10
15
20
25
1990 2005 2020 2035 2050 2065 2080 2095
GtC
/yr
buildings industry
transportation electricity
cement emissions reduction

Scenario: nucref stab Page 28
Final Energy Consumption
1990 2005 2020 2035 2050 2065 2080 2095 Units
building liquids 15.2 16.4 18.5 20.1 18.2 13.9 14.9 14.9 EJ/yr
building gas 18.7 26.7 26.8 26.4 22.2 15.3 15.5 13.9 EJ/yr
building coal 10.1 5.1 4.4 2.7 1.1 0.3 0.3 0.2 EJ/yr
building biomass 4.5 5.5 8.7 9.1 7.3 4.0 3.4 2.8 EJ/yr
building electricity 16.9 29.0 40.9 57.6 74.8 96.5 119.8 141.9 EJ/yr
building trad biomass 23.5 29.9 33.0 30.4 26.1 21.4 15.7 10.5 EJ/yr
building energy reduction 0.0 0.0 10.6 20.4 37.6 57.8 65.0 71.8 EJ/yr
total: w/o reduction 88.9 112.7 132.3 146.2 149.7 151.5 169.6 184.1 EJ/yr
industry liquids 22.4 21.2 20.1 21.8 19.1 13.2 14.0 12.9 EJ/yr
industry gas 26.6 30.5 29.2 28.7 20.2 11.2 12.3 11.4 EJ/yr
industry coal 31.4 35.8 28.1 18.8 7.7 1.9 2.1 1.7 EJ/yr
industry biomass 7.3 11.2 27.5 40.6 45.2 32.2 31.9 32.2 EJ/yr
industry electricity 18.1 24.8 35.4 51.7 73.7 104.2 114.4 126.7 EJ/yr
industry hydrogen 0.0 0.0 2.7 3.3 3.9 4.6 5.5 6.8 EJ/yr
industry energy reduction 0.0 0.0 24.8 51.7 86.5 123.3 131.7 137.2 EJ/yr
industry feedstocks 15.2 23.7 24.9 27.5 28.5 29.3 31.1 32.6 EJ/yr
total: w/o reduction 105.8 123.6 143.2 165.0 169.8 167.3 180.3 191.7 EJ/yr
transportation liquids 62.7 87.7 96.6 110.0 111.3 97.3 108.6 112.7 EJ/yr
transportation gas 2.2 3.0 5.9 10.9 14.6 15.7 20.5 23.4 EJ/yr
transportation coal 0.5 0.2 0.2 0.1 0.0 0.0 0.0 0.0 EJ/yr
transportation electricity 1.0 1.0 2.2 5.1 13.4 25.6 30.7 36.1 EJ/yr
transportation hydrogen 0.0 0.0 0.6 2.1 5.8 12.0 18.4 26.5 EJ/yr
transportation energy reduction 0.0 0.0 5.2 12.3 26.6 51.1 57.0 60.6 EJ/yr
total: w/o reduction 66.4 91.8 105.4 128.1 145.2 150.6 178.2 198.7 EJ/yr
total final energy buildings 88.9 112.7 132.3 146.2 149.7 151.5 169.6 184.1 EJ/yr
total final energy industry 105.8 123.6 143.2 165.0 169.8 167.3 180.3 191.7 EJ/yr
total final energy transportation 66.4 91.8 105.4 128.1 145.2 150.6 178.2 198.7 EJ/yr
total final energy energy reduction 0.0 0.0 40.6 84.4 150.7 232.1 253.8 269.7 EJ/yr
total: w/o reduction 261.1 328.1 380.9 439.3 464.7 469.4 528.1 574.5 EJ/yr

Scenario: nucref stab Page 29
Primary Energy w/CCS
1990 2005 2020 2035 2050 2065 2080 2095 Units
oil w/o ccs 135.6 167.5 171.8 176.3 148.4 98.5 99.1 91.0 EJ/yr
oil w/ ccs 0.0 0.0 0.0 0.0 0.0 0.0 0.0 0.0 EJ/yr
natural gas w/o ccs 69.9 97.5 117.8 145.6 153.5 92.8 105.9 102.1 EJ/yr
natural gas w/ ccs 0.0 0.0 0.0 0.0 0.0 0.0 0.0 0.0 EJ/yr
coal w/o ccs 91.2 119.1 121.1 110.4 28.8 8.5 7.4 7.2 EJ/yr
coal w/ ccs 0.0 0.0 0.0 0.0 0.0 0.0 0.0 0.0 EJ/yr
biomass w/o ccs 14.4 21.6 50.7 84.9 139.6 167.0 183.8 201.4 EJ/yr
biomass w/ ccs 0.0 0.0 0.0 0.0 0.0 0.0 0.0 0.0 EJ/yr
nuclear 21.0 26.1 29.3 53.5 129.9 266.0 309.1 372.2 EJ/yr
hydro 23.6 29.2 29.3 30.6 28.5 30.2 31.8 34.8 EJ/yr
wind 0.0 0.9 18.5 41.2 55.9 77.5 78.3 86.4 EJ/yr
solar 0.0 0.1 1.9 5.8 13.1 26.2 30.8 40.2 EJ/yr
geothermal 0.4 0.5 1.6 6.1 7.6 7.3 6.9 6.9 EJ/yr
energy reduction 0.0 0.0 50.8 107.2 211.7 296.2 366.0 430.7 EJ/yr
total: w/o reduction 356 463 542 654 705 774 853 942 EJ/yr
Electricity Production by Fuel
1990 2005 2020 2035 2050 2065 2080 2095 Units
oil 4.86 4.33 4.10 3.38 3.32 2.94 2.33 2.99 EJ/yr
oil w/ccs 0.00 0.00 0.00 0.00 0.00 0.00 0.00 0.00 EJ/yr
gas 6.07 12.82 22.46 32.56 41.63 18.39 22.23 20.57 EJ/yr
gas w/ccs 0.00 0.00 0.00 0.00 0.00 0.00 0.00 0.00 EJ/yr
coal 16.06 26.35 31.42 33.34 8.61 2.60 1.97 2.09 EJ/yr
coal w/ccs 0.00 0.00 0.00 0.00 0.00 0.00 0.00 0.00 EJ/yr
biomass 0.43 0.71 1.65 3.68 8.71 8.08 6.55 4.56 EJ/yr
biomass w/ccs 0.00 0.00 0.00 0.00 0.00 0.00 0.00 0.00 EJ/yr
nuclear 7.36 9.97 12.45 23.75 69.20 147.19 179.60 213.53 EJ/yr
hydro 7.82 10.44 12.13 13.99 15.85 17.70 19.56 21.42 EJ/yr
wind w/backup 0.01 0.36 5.86 13.00 19.18 26.21 26.68 28.88 EJ/yr
wind w/storage 0.00 0.00 1.76 5.53 11.11 18.89 21.05 23.28 EJ/yr
CSP w/backup 0.00 0.00 0.50 0.92 1.40 2.62 3.06 3.88 EJ/yr
CSP w/storage 0.00 0.00 0.18 1.45 4.49 8.59 9.93 12.45 EJ/yr
PV w/backup 0.00 0.04 0.05 0.08 0.49 1.83 2.71 3.35 EJ/yr
PV w/storage 0.00 0.00 0.01 0.04 0.26 0.87 1.23 1.49 EJ/yr
rooftop PV w/backup 0.00 0.00 0.34 1.11 2.77 5.39 7.36 9.08 EJ/yr
geothermal 0.13 0.21 0.66 2.88 4.35 4.43 4.40 4.39 EJ/yr
energy reduction 0.00 0.00 4.34 8.53 11.97 -5.63 11.24 27.69 EJ/yr
total: w/o reduction 42.7 65.2 93.6 135.7 191.4 265.8 308.7 352.0 EJ/yr

Scenario: nucref stab Page 30
Transportation Fuels Production by Fuel
1990 2005 2020 2035 2050 2065 2080 2095 Units
conventional oil 62.5 86.8 90.8 93.9 78.8 52.1 54.0 49.6 EJ/yr
unconventional oil 0.0 0.0 1.0 3.1 4.8 3.7 4.2 3.7 EJ/yr
coal liquids 0.0 0.0 0.2 0.2 0.0 0.0 0.0 0.0 EJ/yr
coal liquids w/ ccs 0.0 0.0 0.0 0.0 0.0 0.0 0.0 0.0 EJ/yr
bio fuels 0.2 0.9 3.4 8.7 22.1 37.2 46.5 56.2 EJ/yr
gas liquids 0.0 0.0 1.3 4.1 5.7 4.3 3.9 3.2 EJ/yr
gas 2.2 3.0 5.9 10.9 14.6 15.7 20.5 23.4 EJ/yr
coal 0.5 0.2 0.2 0.1 0.0 0.0 0.0 0.0 EJ/yr
electricity 1.0 1.0 2.2 5.1 13.4 25.6 30.7 36.1 EJ/yr
hydrogen 0.0 0.0 0.6 2.1 5.8 12.0 18.4 26.5 EJ/yr
energy reduction 0.0 0.0 5.2 12.3 26.6 51.1 57.0 60.6 EJ/yr
total: w/o reduction 66.4 91.8 105.4 128.1 145.2 150.6 178.2 198.7 EJ/yr
Industrial Liquids Production by Fuel
1990 2005 2020 2035 2050 2065 2080 2095 Units
conventional oil 36.59 43.89 42.81 44.36 36.90 24.70 24.97 22.53 EJ/yr
unconventional oil 0.00 0.00 0.23 0.59 0.73 0.19 0.52 0.34 EJ/yr
coal liquids 0.00 0.00 0.03 0.03 0.00 0.00 0.00 0.00 EJ/yr
coal liquids w/ ccs 0.00 0.00 0.00 0.00 0.00 0.00 0.00 0.00 EJ/yr
bio fuels 0.01 0.05 0.59 2.14 7.45 15.63 17.84 21.22 EJ/yr
gas liquids 0.00 0.00 0.31 1.18 1.51 1.09 0.85 0.63 EJ/yr
energy reduction 0.0 0.0 3.3 8.2 18.4 36.3 39.2 36.2 EJ/yr
total: w/o reduction 36.6 43.9 44.0 48.3 46.6 41.6 44.2 44.7 EJ/yr
Hydrogen Production by Fuel
1990 2005 2020 2035 2050 2065 2080 2095 Units
gas 0.00 0.00 2.37 3.96 6.80 7.08 9.61 10.64 EJ/yr
gas w/ccs 0.00 0.00 0.00 0.00 0.00 0.00 0.00 0.00 EJ/yr
coal 0.00 0.00 0.32 0.35 0.35 0.26 0.37 0.43 EJ/yr
coal w/ccs 0.00 0.00 0.00 0.00 0.00 0.00 0.00 0.00 EJ/yr
biomass 0.00 0.00 0.24 0.44 0.82 1.07 1.33 1.74 EJ/yr
biomass w/ccs 0.00 0.00 0.00 0.00 0.00 0.00 0.00 0.00 EJ/yr
nuclear 0.00 0.00 0.13 0.23 0.59 5.56 8.35 13.45 EJ/yr
bulk electricity 0.00 0.00 0.10 0.20 0.47 0.83 1.12 1.40 EJ/yr
wind 0.00 0.00 0.07 0.10 0.20 0.53 0.89 1.47 EJ/yr
solar 0.00 0.00 0.08 0.15 0.44 1.32 2.26 4.10 EJ/yr
energy reduction 0.00 0.00 -0.06 -0.19 -0.30 -2.40 -3.95 -5.51 EJ/yr
total: w/o reduction 0.00 0.00 3.30 5.43 9.66 16.65 23.93 33.23 EJ/yr

Scenario: nucref stab Page 31
Dedicated Bioenergy Crops, Crop Residues, and Municipal Solid Waste Consumption by Sector
1990 2005 2020 2035 2050 2065 2080 2095 Units
direct buildings 4.5 5.5 8.7 9.1 7.3 4.0 3.4 2.8 EJ/yr
Industry 7.4 11.3 28.7 44.9 59.8 61.9 65.1 70.5 EJ/yr
electricity 2.1 2.5 4.6 9.4 20.4 17.9 14.1 9.7 EJ/yr
refined liquids: tran & bldg 0.5 2.2 8.2 20.6 50.3 81.0 98.4 114.9 EJ/yr
hydrogen 0.0 0.0 0.5 0.9 1.7 2.2 2.7 3.4 EJ/yr
synthetic gas 0.0 0.0 0.0 0.0 0.0 0.0 0.0 0.0 EJ/yr
energy reduction 0.0 0.0 -18.6 -41.1 -79.3 -83.4 -82.5 -71.3 EJ/yr
total: w/o reduction 14.4 21.6 50.7 84.9 139.6 167.0 183.8 201.4 EJ/yr
Biomass Production
1990 2005 2020 2035 2050 2065 2080 2095 Units
waste biomass 14.4 21.5 24.0 45.3 74.1 83.0 83.7 82.0 EJ
dedicated biomass crops 0.0 0.0 26.6 36.5 49.2 61.9 70.9 81.3 EJ
municipal solid waste 0.0 0.1 0.1 3.0 16.2 22.0 29.2 38.1 EJ
waste biomass 0.0 0.0 7.6 -7.5 -32.4 -37.7 -36.6 -32.6 EJ
reduction in biomass crops 0.0 0.0 -26.6 -31.6 -32.5 -27.1 -22.2 -11.0 EJ
reduction in municipal solid wate 0.0 0.0 0.4 -2.0 -14.4 -18.6 -23.7 -27.7 EJ
total: w/o reduction 14.4 21.6 31.8 45.8 74.7 102.2 125.0 157.8 EJ
Arable Land Use by Type
1990 2005 2020 2035 2050 2065 2080 2095 Units
urban land 0.05 0.05 0.05 0.05 0.05 0.05 0.05 0.05 billion Ha
crops 1.20 1.21 0.94 0.86 0.73 0.62 0.57 0.50 billion Ha
pasture 0.70 0.73 0.71 0.70 0.69 0.69 0.69 0.69 billion Ha
managed forest 0.69 0.74 0.83 0.91 0.96 0.95 0.95 0.96 billion Ha
bioenergy crops 0.00 0.00 0.13 0.18 0.25 0.32 0.36 0.39 billion Ha
unmanaged forest 3.32 3.25 3.94 3.90 3.89 3.92 3.93 3.94 billion Ha
unmanaged land 4.58 4.58 3.95 3.95 3.97 4.00 4.01 4.03 billion Ha
rock/ice/desert/tundra 2.62 2.62 2.62 2.62 2.62 2.62 2.62 2.62 billion Ha
total 10.50 10.50 10.50 10.50 10.50 10.50 10.50 10.50 billion Ha

Scenario: nucref stab Page 32
Population, GDP, and Energy Indicators
1990 2005 2020 2035 2050 2065 2080 2095 Units
Economic Activity reference GDP $26.1 $39.4 $57.1 $81.1 $113.9 $158.3 $222.7 $304.5 trillion 2005$
Final Energy Intensity building 3.41 2.86 2.32 1.80 1.31 0.96 0.76 0.60 GJ/1000$ (2005$)
Final Energy Intensity industry 4.06 3.14 2.51 2.03 1.49 1.06 0.81 0.63 GJ/1000$ (2005$)
Final Energy Intensity transportation 2.55 2.33 1.85 1.58 1.27 0.95 0.80 0.65 GJ/1000$ (2005$)
Final Energy Intensity total 10.01 8.33 6.67 5.42 4.08 2.97 2.37 1.89 GJ/1000$ (2005$)
Population population 5.2 6.4 7.5 8.3 8.8 9.1 9.0 8.7 billion
Final Energy per Capita building 16.9 17.5 17.6 17.5 17.0 16.7 18.8 21.0 GJ/capita
Final Energy per Capita industry 20.2 19.2 19.0 19.8 19.3 18.5 20.0 21.9 GJ/capita
Final Energy per Capita transportation 12.7 14.3 14.0 15.4 16.5 16.6 19.8 22.7 GJ/capita
Final Energy per Capita total 49.7 51.0 50.6 52.7 52.7 51.8 58.6 65.7 GJ/capita
Long-Term Equilibrium Energy Producer Prices
1990 2005 2020 2035 2050 2065 2080 2095 Units
global oil (w/o carbon charge) $27.6 $32.5 $39.6 $41.1 $43.1 $43.0 $42.6 $41.4 $/barrel (2005$)
global oil (w/ carbon charge) $27.6 $32.5 $48.9 $60.6 $84.1 $128.4 $129.0 $138.7 $/barrel (2005$)
domestic natural gas (w/o carbon charge) $3.3 $3.8 $4.3 $3.9 $4.1 $4.1 $4.2 $4.1 $/mmBTU (2005$)
domestic natural gas (w/ carbon charge) $3.3 $3.8 $5.4 $6.3 $9.1 $14.6 $14.8 $16.0 $/mmBTU (2005$)
domestic coal (w/o carbon charge) $1.7 $1.7 $1.7 $1.7 $1.5 $1.4 $1.3 $1.2 $/GJ (2005$)
domestic coal (w/ carbon charge) $1.7 $1.7 $3.8 $6.1 $10.7 $20.4 $20.5 $22.9 $/GJ (2005$)
domestic electricity (w/ carbon charge) 6.21 5.75 6.59 6.64 7.40 7.82 7.93 8.12 cents/kWh (2005$)
carbon price 0.0 0.0 77.5 161.2 335.0 696.4 703.3 793.1 $/tC (2005$)
Crop Prices
1990 2005 2020 2035 2050 2065 2080 2095 Units
global corn 33 33 49 61 77 103 96 92 $/Gcal (2005$)
global rice 32 32 57 73 102 149 125 107 $/Gcal (2005$)
global wheat 27 27 55 75 105 156 134 118 $/Gcal (2005$)
Emissions by Sectors
1990 2005 2020 2035 2050 2065 2080 2095 Units
buildings 0.858 0.860 0.877 0.839 0.652 0.404 0.403 0.355 GtC/yr
industry 1.623 1.706 1.521 1.327 0.783 0.210 0.200 0.084 GtC/yr
transportation 1.354 1.863 2.064 2.333 2.172 1.582 1.718 1.652 GtC/yr
electricity 1.909 2.848 3.239 3.401 1.664 0.689 0.697 0.682 GtC/yr
cement 0.261 0.483 0.596 0.660 0.607 0.486 0.452 0.397 GtC/yr
emissions reduction 0.000 0.000 1.968 4.703 10.248 15.564 18.145 21.128 GtC/yr
total: w/o reduction 6.006 7.760 8.298 8.561 5.877 3.372 3.470 3.170 GtC/yr

Scenario: nucref stab Page 33
Final Energy Consumption: Buildings Final Energy Consumption: Industry (Does not Include Feedstocks)
Final Energy Consumption: Transportation Final Energy Consumption by Sector
0
50
100
150
200
250
300
1990 2005 2020 2035 2050 2065 2080 2095
EJ
/yr
liquids gascoal biomasselectricity trad biomassenergy reduction
0
50
100
150
200
250
300
350
400
1990 2005 2020 2035 2050 2065 2080 2095
EJ
/yr
liquids gas
coal biomass
electricity hydrogen
energy reduction feedstocks
0
50
100
150
200
250
300
1990 2005 2020 2035 2050 2065 2080 2095
EJ
/yr
liquids gas
coal electricity
hydrogen energy reduction
0
100
200
300
400
500
600
700
800
900
1990 2005 2020 2035 2050 2065 2080 2095
EJ
/yr
buildings industry
transportation energy reduction
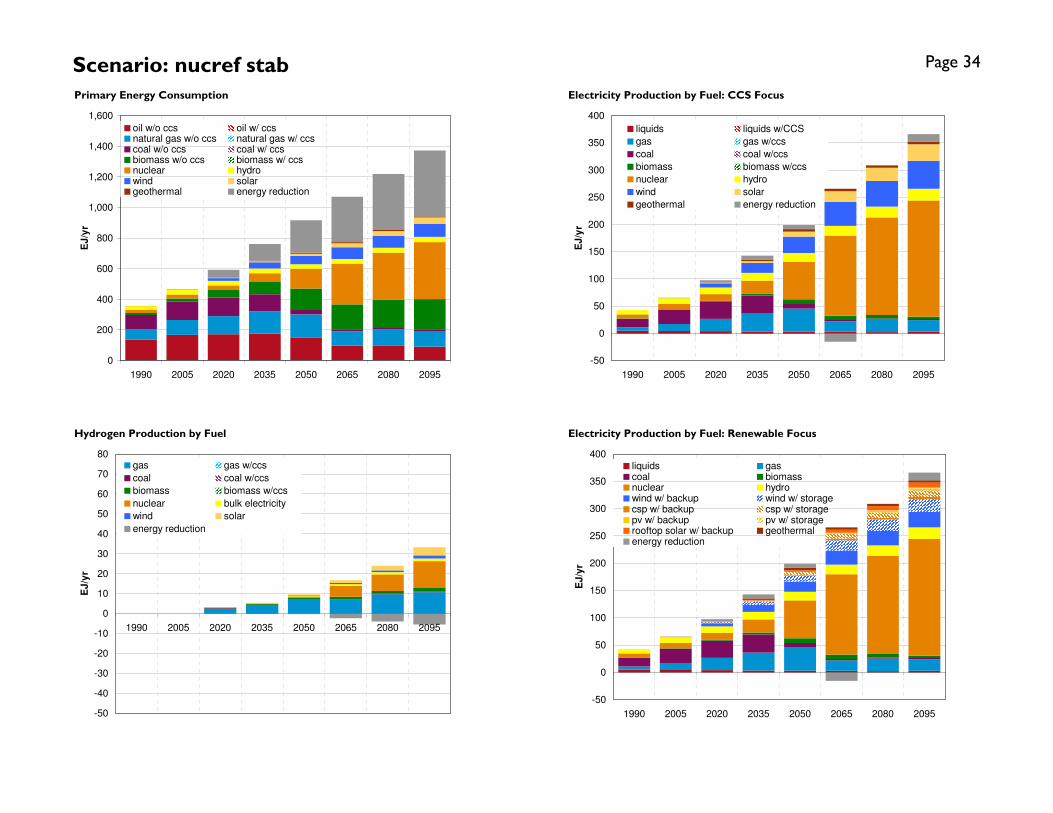
Scenario: nucref stab Page 34
Primary Energy Consumption Electricity Production by Fuel: CCS Focus
Hydrogen Production by Fuel Electricity Production by Fuel: Renewable Focus
-50
0
50
100
150
200
250
300
350
400
1990 2005 2020 2035 2050 2065 2080 2095
EJ
/yr
liquids liquids w/CCS
gas gas w/ccs
coal coal w/ccs
biomass biomass w/ccs
nuclear hydro
wind solar
geothermal energy reduction
-50
-40
-30
-20
-10
0
10
20
30
40
50
60
70
80
1990 2005 2020 2035 2050 2065 2080 2095
EJ
/yr
gas gas w/ccs
coal coal w/ccs
biomass biomass w/ccs
nuclear bulk electricity
wind solar
energy reduction
-50
0
50
100
150
200
250
300
350
400
1990 2005 2020 2035 2050 2065 2080 2095
EJ
/yr
liquids gascoal biomassnuclear hydrowind w/ backup wind w/ storagecsp w/ backup csp w/ storagepv w/ backup pv w/ storagerooftop solar w/ backup geothermalenergy reduction
0
200
400
600
800
1,000
1,200
1,400
1,600
1990 2005 2020 2035 2050 2065 2080 2095
EJ
/yr
oil w/o ccs oil w/ ccsnatural gas w/o ccs natural gas w/ ccscoal w/o ccs coal w/ ccsbiomass w/o ccs biomass w/ ccsnuclear hydrowind solargeothermal energy reduction
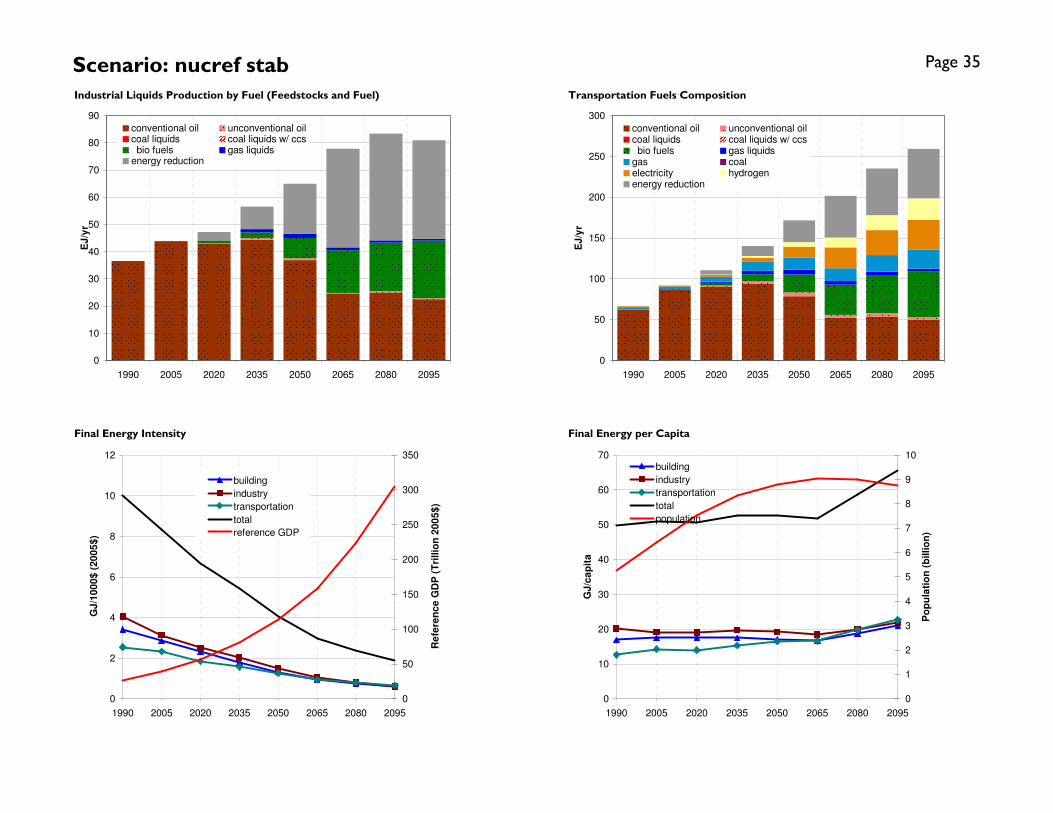
Scenario: nucref stab Page 35
Industrial Liquids Production by Fuel (Feedstocks and Fuel) Transportation Fuels Composition
Final Energy Intensity Final Energy per Capita
0
50
100
150
200
250
300
1990 2005 2020 2035 2050 2065 2080 2095
EJ
/yr
conventional oil unconventional oilcoal liquids coal liquids w/ ccs bio fuels gas liquidsgas coalelectricity hydrogenenergy reduction
0
10
20
30
40
50
60
70
80
90
1990 2005 2020 2035 2050 2065 2080 2095
EJ
/yr
conventional oil unconventional oilcoal liquids coal liquids w/ ccs bio fuels gas liquidsenergy reduction
0
2
4
6
8
10
12
1990 2005 2020 2035 2050 2065 2080 2095
GJ
/10
00
$ (
20
05
$)
0
50
100
150
200
250
300
350
Re
fere
nc
e G
DP
(T
rillio
n 2
00
5$
)
building
industry
transportation
total
reference GDP
0
10
20
30
40
50
60
70
1990 2005 2020 2035 2050 2065 2080 2095
GJ
/ca
pit
a
0
1
2
3
4
5
6
7
8
9
10
Po
pu
lati
on
(b
illio
n)
building
industry
transportation
total
population

Scenario: nucref stab Page 36
Dedicated Energy Crops, Waste Biomass, and Municipal Solid Waste Consumption by Sector Land Use by Type
Biomass Production by Source CO2 Emissions by Sector
-125
-100
-75
-50
-25
0
25
50
75
100
125
150
175
200
225
250
1990 2005 2020 2035 2050 2065 2080 2095
EJ
/yr
energy reductionsynthetic gashydrogenrefined liquids: tran & bldgelectricityIndustrydirect buildings
0
2
4
6
8
10
12
14
16
1990 2005 2020 2035 2050 2065 2080 2095
Billio
n H
ec
tare
s
urban land cropspasture managed forestbioenergy crops unmanaged forestunmanaged land rock/ice/desert/tundra
-125
-100
-75
-50
-25
0
25
50
75
100
125
150
175
200
225
250
1990 2005 2020 2035 2050 2065 2080 2095
EJ
/yr
reduction in municipal solid wate
reduction in biomass crops
waste biomass
municipal solid waste
dedicated biomass crops
waste biomass
-5
0
5
10
15
20
25
1990 2005 2020 2035 2050 2065 2080 2095
GtC
/yr
buildings industry
transportation electricity
cement emissions reduction
Scenario: nucadv stab Page 37
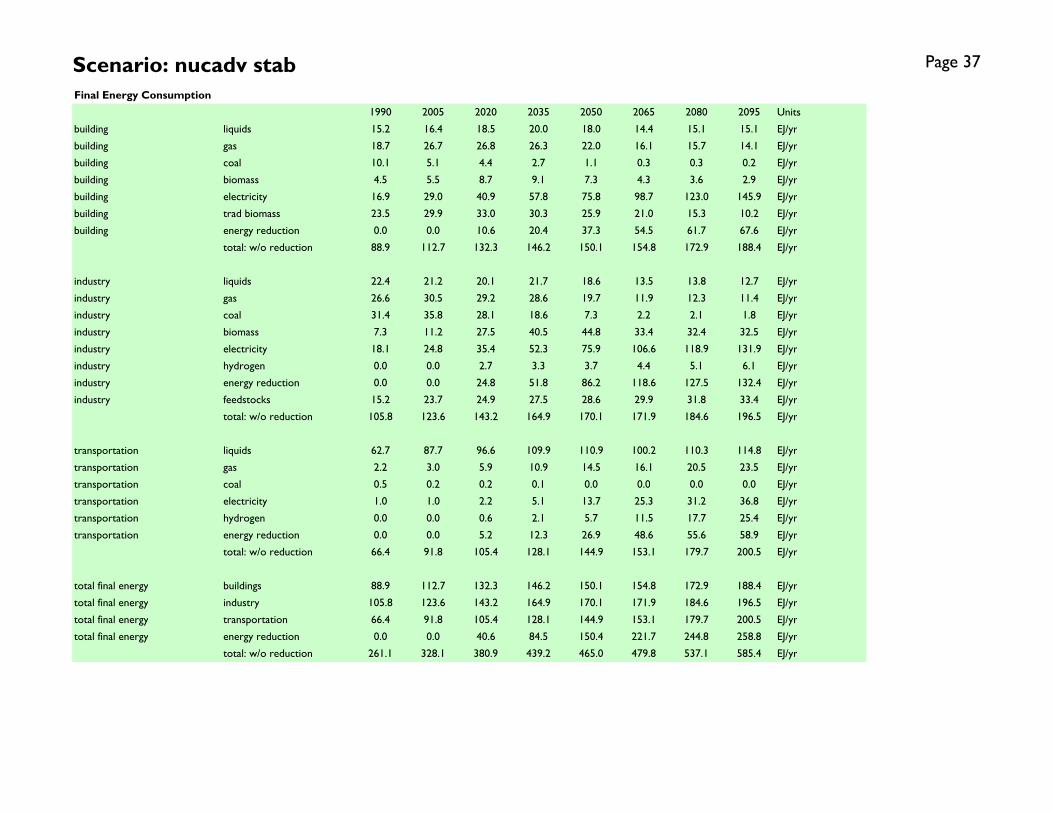
Final Energy Consumption
1990 2005 2020 2035 2050 2065 2080 2095 Units
building liquids 15.2 16.4 18.5 20.0 18.0 14.4 15.1 15.1 EJ/yr
building gas 18.7 26.7 26.8 26.3 22.0 16.1 15.7 14.1 EJ/yr
building coal 10.1 5.1 4.4 2.7 1.1 0.3 0.3 0.2 EJ/yr
building biomass 4.5 5.5 8.7 9.1 7.3 4.3 3.6 2.9 EJ/yr
building electricity 16.9 29.0 40.9 57.8 75.8 98.7 123.0 145.9 EJ/yr
building trad biomass 23.5 29.9 33.0 30.3 25.9 21.0 15.3 10.2 EJ/yr
building energy reduction 0.0 0.0 10.6 20.4 37.3 54.5 61.7 67.6 EJ/yr
total: w/o reduction 88.9 112.7 132.3 146.2 150.1 154.8 172.9 188.4 EJ/yr
industry liquids 22.4 21.2 20.1 21.7 18.6 13.5 13.8 12.7 EJ/yr
industry gas 26.6 30.5 29.2 28.6 19.7 11.9 12.3 11.4 EJ/yr
industry coal 31.4 35.8 28.1 18.6 7.3 2.2 2.1 1.8 EJ/yr
industry biomass 7.3 11.2 27.5 40.5 44.8 33.4 32.4 32.5 EJ/yr
industry electricity 18.1 24.8 35.4 52.3 75.9 106.6 118.9 131.9 EJ/yr
industry hydrogen 0.0 0.0 2.7 3.3 3.7 4.4 5.1 6.1 EJ/yr
industry energy reduction 0.0 0.0 24.8 51.8 86.2 118.6 127.5 132.4 EJ/yr
industry feedstocks 15.2 23.7 24.9 27.5 28.6 29.9 31.8 33.4 EJ/yr
total: w/o reduction 105.8 123.6 143.2 164.9 170.1 171.9 184.6 196.5 EJ/yr
transportation liquids 62.7 87.7 96.6 109.9 110.9 100.2 110.3 114.8 EJ/yr
transportation gas 2.2 3.0 5.9 10.9 14.5 16.1 20.5 23.5 EJ/yr
transportation coal 0.5 0.2 0.2 0.1 0.0 0.0 0.0 0.0 EJ/yr
transportation electricity 1.0 1.0 2.2 5.1 13.7 25.3 31.2 36.8 EJ/yr
transportation hydrogen 0.0 0.0 0.6 2.1 5.7 11.5 17.7 25.4 EJ/yr
transportation energy reduction 0.0 0.0 5.2 12.3 26.9 48.6 55.6 58.9 EJ/yr
total: w/o reduction 66.4 91.8 105.4 128.1 144.9 153.1 179.7 200.5 EJ/yr
total final energy buildings 88.9 112.7 132.3 146.2 150.1 154.8 172.9 188.4 EJ/yr
total final energy industry 105.8 123.6 143.2 164.9 170.1 171.9 184.6 196.5 EJ/yr
total final energy transportation 66.4 91.8 105.4 128.1 144.9 153.1 179.7 200.5 EJ/yr
total final energy energy reduction 0.0 0.0 40.6 84.5 150.4 221.7 244.8 258.8 EJ/yr
total: w/o reduction 261.1 328.1 380.9 439.2 465.0 479.8 537.1 585.4 EJ/yr

Scenario: nucadv stab Page 38
Primary Energy w/CCS
1990 2005 2020 2035 2050 2065 2080 2095 Units
oil w/o ccs 135.6 167.5 171.8 176.1 147.0 103.6 100.6 92.8 EJ/yr
oil w/ ccs 0.0 0.0 0.0 0.0 0.0 0.0 0.0 0.0 EJ/yr
natural gas w/o ccs 69.9 97.5 117.8 145.4 151.8 96.2 103.7 100.4 EJ/yr
natural gas w/ ccs 0.0 0.0 0.0 0.0 0.0 0.0 0.0 0.0 EJ/yr
coal w/o ccs 91.2 119.1 121.1 109.4 27.7 9.2 7.7 7.1 EJ/yr
coal w/ ccs 0.0 0.0 0.0 0.0 0.0 0.0 0.0 0.0 EJ/yr
biomass w/o ccs 14.4 21.6 50.7 84.8 139.3 166.4 183.5 201.1 EJ/yr
biomass w/ ccs 0.0 0.0 0.0 0.0 0.0 0.0 0.0 0.0 EJ/yr
nuclear 21.0 26.1 29.3 55.9 140.3 280.4 342.2 406.8 EJ/yr
hydro 23.6 29.2 29.3 30.6 28.5 30.3 32.2 35.1 EJ/yr
wind 0.0 0.9 18.5 41.2 55.3 73.7 75.7 82.2 EJ/yr
solar 0.0 0.1 1.9 5.8 12.8 23.8 28.3 36.2 EJ/yr
geothermal 0.4 0.5 1.6 6.1 7.6 7.3 7.0 6.9 EJ/yr
energy reduction 0.0 0.0 50.8 106.5 206.6 279.3 338.2 404.2 EJ/yr
total: w/o reduction 356 463 542 655 710 791 881 969 EJ/yr
Electricity Production by Fuel
1990 2005 2020 2035 2050 2065 2080 2095 Units
oil 4.86 4.33 4.10 3.38 3.25 2.98 2.35 2.89 EJ/yr
oil w/ccs 0.00 0.00 0.00 0.00 0.00 0.00 0.00 0.00 EJ/yr
gas 6.07 12.82 22.46 32.60 41.33 18.77 20.38 18.56 EJ/yr
gas w/ccs 0.00 0.00 0.00 0.00 0.00 0.00 0.00 0.00 EJ/yr
coal 16.06 26.35 31.42 33.10 8.28 2.78 2.07 2.02 EJ/yr
coal w/ccs 0.00 0.00 0.00 0.00 0.00 0.00 0.00 0.00 EJ/yr
biomass 0.43 0.71 1.65 3.69 8.55 7.98 5.64 3.72 EJ/yr
biomass w/ccs 0.00 0.00 0.00 0.00 0.00 0.00 0.00 0.00 EJ/yr
nuclear 7.36 9.97 12.45 24.86 74.85 155.89 196.31 234.15 EJ/yr
hydro 7.82 10.44 12.13 13.99 15.85 17.70 19.56 21.42 EJ/yr
wind w/backup 0.01 0.36 5.86 13.03 19.07 25.32 26.01 27.97 EJ/yr
wind w/storage 0.00 0.00 1.76 5.54 10.91 17.55 19.52 21.43 EJ/yr
CSP w/backup 0.00 0.00 0.50 0.92 1.38 2.40 2.77 3.47 EJ/yr
CSP w/storage 0.00 0.00 0.18 1.45 4.42 7.86 9.00 11.11 EJ/yr
PV w/backup 0.00 0.04 0.05 0.08 0.47 1.64 2.47 3.01 EJ/yr
PV w/storage 0.00 0.00 0.01 0.05 0.26 0.79 1.12 1.34 EJ/yr
rooftop PV w/backup 0.00 0.00 0.34 1.10 2.66 5.00 6.82 8.42 EJ/yr
geothermal 0.13 0.21 0.66 2.88 4.35 4.43 4.39 4.38 EJ/yr
energy reduction 0.00 0.00 4.34 7.56 7.51 -12.36 -0.34 13.29 EJ/yr
total: w/o reduction 42.7 65.2 93.6 136.7 195.6 271.1 318.4 363.9 EJ/yr
Scenario: nucadv stab Page 39
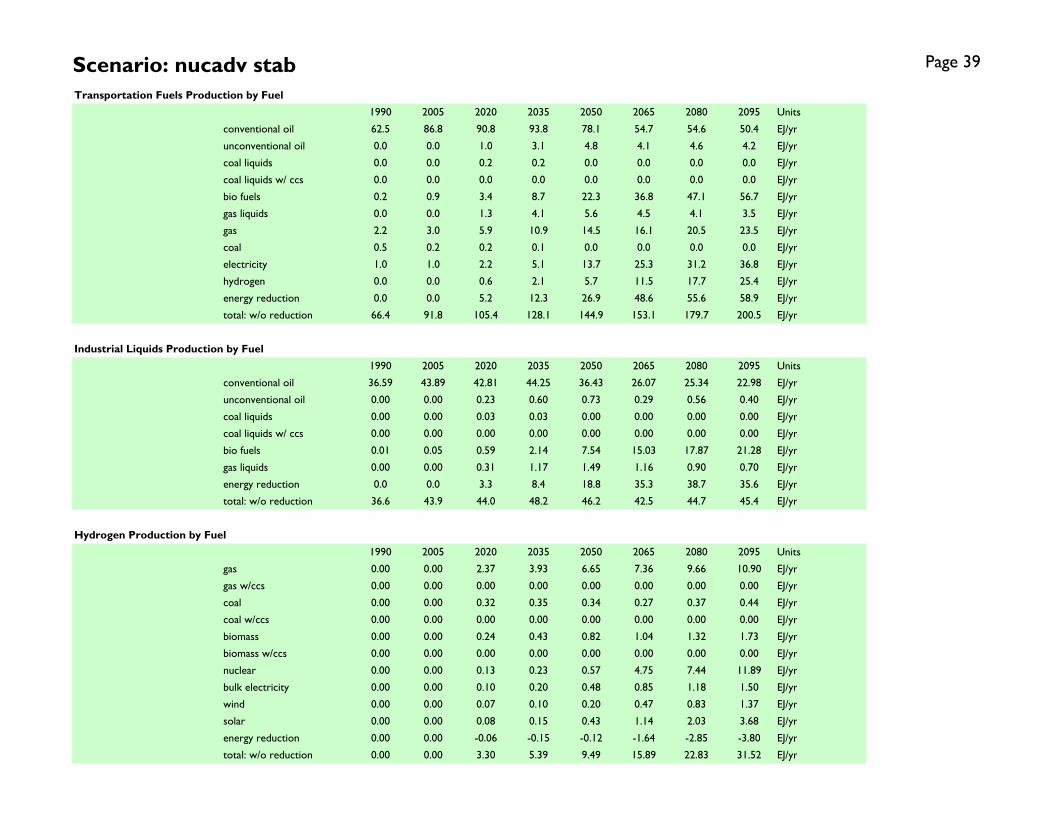
Transportation Fuels Production by Fuel
1990 2005 2020 2035 2050 2065 2080 2095 Units
conventional oil 62.5 86.8 90.8 93.8 78.1 54.7 54.6 50.4 EJ/yr
unconventional oil 0.0 0.0 1.0 3.1 4.8 4.1 4.6 4.2 EJ/yr
coal liquids 0.0 0.0 0.2 0.2 0.0 0.0 0.0 0.0 EJ/yr
coal liquids w/ ccs 0.0 0.0 0.0 0.0 0.0 0.0 0.0 0.0 EJ/yr
bio fuels 0.2 0.9 3.4 8.7 22.3 36.8 47.1 56.7 EJ/yr
gas liquids 0.0 0.0 1.3 4.1 5.6 4.5 4.1 3.5 EJ/yr
gas 2.2 3.0 5.9 10.9 14.5 16.1 20.5 23.5 EJ/yr
coal 0.5 0.2 0.2 0.1 0.0 0.0 0.0 0.0 EJ/yr
electricity 1.0 1.0 2.2 5.1 13.7 25.3 31.2 36.8 EJ/yr
hydrogen 0.0 0.0 0.6 2.1 5.7 11.5 17.7 25.4 EJ/yr
energy reduction 0.0 0.0 5.2 12.3 26.9 48.6 55.6 58.9 EJ/yr
total: w/o reduction 66.4 91.8 105.4 128.1 144.9 153.1 179.7 200.5 EJ/yr
Industrial Liquids Production by Fuel
1990 2005 2020 2035 2050 2065 2080 2095 Units
conventional oil 36.59 43.89 42.81 44.25 36.43 26.07 25.34 22.98 EJ/yr
unconventional oil 0.00 0.00 0.23 0.60 0.73 0.29 0.56 0.40 EJ/yr
coal liquids 0.00 0.00 0.03 0.03 0.00 0.00 0.00 0.00 EJ/yr
coal liquids w/ ccs 0.00 0.00 0.00 0.00 0.00 0.00 0.00 0.00 EJ/yr
bio fuels 0.01 0.05 0.59 2.14 7.54 15.03 17.87 21.28 EJ/yr
gas liquids 0.00 0.00 0.31 1.17 1.49 1.16 0.90 0.70 EJ/yr
energy reduction 0.0 0.0 3.3 8.4 18.8 35.3 38.7 35.6 EJ/yr
total: w/o reduction 36.6 43.9 44.0 48.2 46.2 42.5 44.7 45.4 EJ/yr
Hydrogen Production by Fuel
1990 2005 2020 2035 2050 2065 2080 2095 Units
gas 0.00 0.00 2.37 3.93 6.65 7.36 9.66 10.90 EJ/yr
gas w/ccs 0.00 0.00 0.00 0.00 0.00 0.00 0.00 0.00 EJ/yr
coal 0.00 0.00 0.32 0.35 0.34 0.27 0.37 0.44 EJ/yr
coal w/ccs 0.00 0.00 0.00 0.00 0.00 0.00 0.00 0.00 EJ/yr
biomass 0.00 0.00 0.24 0.43 0.82 1.04 1.32 1.73 EJ/yr
biomass w/ccs 0.00 0.00 0.00 0.00 0.00 0.00 0.00 0.00 EJ/yr
nuclear 0.00 0.00 0.13 0.23 0.57 4.75 7.44 11.89 EJ/yr
bulk electricity 0.00 0.00 0.10 0.20 0.48 0.85 1.18 1.50 EJ/yr
wind 0.00 0.00 0.07 0.10 0.20 0.47 0.83 1.37 EJ/yr
solar 0.00 0.00 0.08 0.15 0.43 1.14 2.03 3.68 EJ/yr
energy reduction 0.00 0.00 -0.06 -0.15 -0.12 -1.64 -2.85 -3.80 EJ/yr
total: w/o reduction 0.00 0.00 3.30 5.39 9.49 15.89 22.83 31.52 EJ/yr
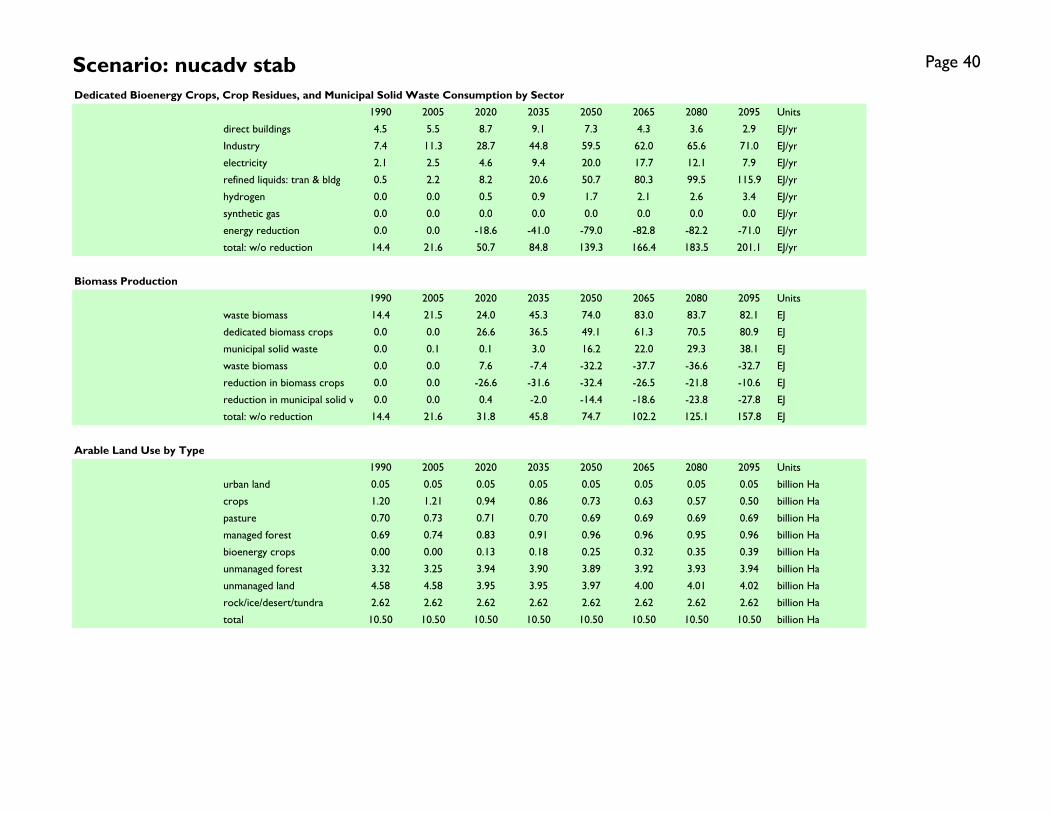
Scenario: nucadv stab Page 40
Dedicated Bioenergy Crops, Crop Residues, and Municipal Solid Waste Consumption by Sector
1990 2005 2020 2035 2050 2065 2080 2095 Units
direct buildings 4.5 5.5 8.7 9.1 7.3 4.3 3.6 2.9 EJ/yr
Industry 7.4 11.3 28.7 44.8 59.5 62.0 65.6 71.0 EJ/yr
electricity 2.1 2.5 4.6 9.4 20.0 17.7 12.1 7.9 EJ/yr
refined liquids: tran & bldg 0.5 2.2 8.2 20.6 50.7 80.3 99.5 115.9 EJ/yr
hydrogen 0.0 0.0 0.5 0.9 1.7 2.1 2.6 3.4 EJ/yr
synthetic gas 0.0 0.0 0.0 0.0 0.0 0.0 0.0 0.0 EJ/yr
energy reduction 0.0 0.0 -18.6 -41.0 -79.0 -82.8 -82.2 -71.0 EJ/yr
total: w/o reduction 14.4 21.6 50.7 84.8 139.3 166.4 183.5 201.1 EJ/yr
Biomass Production
1990 2005 2020 2035 2050 2065 2080 2095 Units
waste biomass 14.4 21.5 24.0 45.3 74.0 83.0 83.7 82.1 EJ
dedicated biomass crops 0.0 0.0 26.6 36.5 49.1 61.3 70.5 80.9 EJ
municipal solid waste 0.0 0.1 0.1 3.0 16.2 22.0 29.3 38.1 EJ
waste biomass 0.0 0.0 7.6 -7.4 -32.2 -37.7 -36.6 -32.7 EJ
reduction in biomass crops 0.0 0.0 -26.6 -31.6 -32.4 -26.5 -21.8 -10.6 EJ
reduction in municipal solid wate 0.0 0.0 0.4 -2.0 -14.4 -18.6 -23.8 -27.8 EJ
total: w/o reduction 14.4 21.6 31.8 45.8 74.7 102.2 125.1 157.8 EJ
Arable Land Use by Type
1990 2005 2020 2035 2050 2065 2080 2095 Units
urban land 0.05 0.05 0.05 0.05 0.05 0.05 0.05 0.05 billion Ha
crops 1.20 1.21 0.94 0.86 0.73 0.63 0.57 0.50 billion Ha
pasture 0.70 0.73 0.71 0.70 0.69 0.69 0.69 0.69 billion Ha
managed forest 0.69 0.74 0.83 0.91 0.96 0.96 0.95 0.96 billion Ha
bioenergy crops 0.00 0.00 0.13 0.18 0.25 0.32 0.35 0.39 billion Ha
unmanaged forest 3.32 3.25 3.94 3.90 3.89 3.92 3.93 3.94 billion Ha
unmanaged land 4.58 4.58 3.95 3.95 3.97 4.00 4.01 4.02 billion Ha
rock/ice/desert/tundra 2.62 2.62 2.62 2.62 2.62 2.62 2.62 2.62 billion Ha
total 10.50 10.50 10.50 10.50 10.50 10.50 10.50 10.50 billion Ha

Scenario: nucadv stab Page 41
Population, GDP, and Energy Indicators
1990 2005 2020 2035 2050 2065 2080 2095 Units
Economic Activity reference GDP $26.1 $39.4 $57.1 $81.1 $113.9 $158.8 $223.1 $305.0 trillion 2005$
Final Energy Intensity building 3.41 2.86 2.32 1.80 1.32 0.97 0.77 0.62 GJ/1000$ (2005$)
Final Energy Intensity industry 4.06 3.14 2.51 2.03 1.49 1.08 0.83 0.64 GJ/1000$ (2005$)
Final Energy Intensity transportation 2.55 2.33 1.85 1.58 1.27 0.96 0.81 0.66 GJ/1000$ (2005$)
Final Energy Intensity total 10.01 8.33 6.67 5.41 4.08 3.02 2.41 1.92 GJ/1000$ (2005$)
Population population 5.2 6.4 7.5 8.3 8.8 9.1 9.0 8.7 billion
Final Energy per Capita building 16.9 17.5 17.6 17.5 17.0 17.1 19.2 21.5 GJ/capita
Final Energy per Capita industry 20.2 19.2 19.0 19.8 19.3 19.0 20.5 22.5 GJ/capita
Final Energy per Capita transportation 12.7 14.3 14.0 15.4 16.4 16.9 19.9 22.9 GJ/capita
Final Energy per Capita total 49.7 51.0 50.6 52.7 52.8 53.0 59.6 66.9 GJ/capita
Long-Term Equilibrium Energy Producer Prices
1990 2005 2020 2035 2050 2065 2080 2095 Units
global oil (w/o carbon charge) $27.6 $32.5 $39.6 $41.1 $43.0 $43.0 $42.6 $41.5 $/barrel (2005$)
global oil (w/ carbon charge) $27.6 $32.5 $48.9 $60.6 $84.1 $121.1 $125.1 $134.0 $/barrel (2005$)
domestic natural gas (w/o carbon charge) $3.3 $3.8 $4.3 $3.9 $4.1 $4.1 $4.2 $4.1 $/mmBTU (2005$)
domestic natural gas (w/ carbon charge) $3.3 $3.8 $5.4 $6.3 $9.1 $13.7 $14.2 $15.4 $/mmBTU (2005$)
domestic coal (w/o carbon charge) $1.7 $1.7 $1.7 $1.7 $1.5 $1.4 $1.3 $1.2 $/GJ (2005$)
domestic coal (w/ carbon charge) $1.7 $1.7 $3.8 $6.1 $10.7 $18.8 $19.6 $21.8 $/GJ (2005$)
domestic electricity (w/ carbon charge) 6.21 5.75 6.59 6.57 7.18 7.44 7.50 7.63 cents/kWh (2005$)
carbon price 0.0 0.0 77.5 161.2 335.0 636.3 669.7 751.9 $/tC (2005$)
Crop Prices
1990 2005 2020 2035 2050 2065 2080 2095 Units
global corn 33 33 49 61 77 98 94 89 $/Gcal (2005$)
global rice 32 32 57 73 102 139 120 103 $/Gcal (2005$)
global wheat 27 27 55 75 105 145 128 113 $/Gcal (2005$)
Emissions by Sectors
1990 2005 2020 2035 2050 2065 2080 2095 Units
buildings 0.858 0.860 0.877 0.836 0.643 0.426 0.409 0.363 GtC/yr
industry 1.623 1.706 1.521 1.317 0.754 0.244 0.195 0.081 GtC/yr
transportation 1.354 1.863 2.064 2.332 2.155 1.660 1.745 1.692 GtC/yr
electricity 1.909 2.848 3.239 3.380 1.634 0.708 0.662 0.631 GtC/yr
cement 0.261 0.483 0.596 0.661 0.607 0.502 0.459 0.404 GtC/yr
emissions reduction 0.000 0.000 1.968 4.738 10.332 15.396 18.145 21.129 GtC/yr
total: w/o reduction 6.006 7.760 8.298 8.525 5.793 3.540 3.470 3.170 GtC/yr

Scenario: nucadv stab Page 42
Final Energy Consumption: Buildings Final Energy Consumption: Industry (Does not Include Feedstocks)
Final Energy Consumption: Transportation Final Energy Consumption by Sector
0
50
100
150
200
250
300
1990 2005 2020 2035 2050 2065 2080 2095
EJ
/yr
liquids gascoal biomasselectricity trad biomassenergy reduction
0
50
100
150
200
250
300
350
400
1990 2005 2020 2035 2050 2065 2080 2095
EJ
/yr
liquids gas
coal biomass
electricity hydrogen
energy reduction feedstocks
0
50
100
150
200
250
300
1990 2005 2020 2035 2050 2065 2080 2095
EJ
/yr
liquids gas
coal electricity
hydrogen energy reduction
0
100
200
300
400
500
600
700
800
900
1990 2005 2020 2035 2050 2065 2080 2095
EJ
/yr
buildings industry
transportation energy reduction
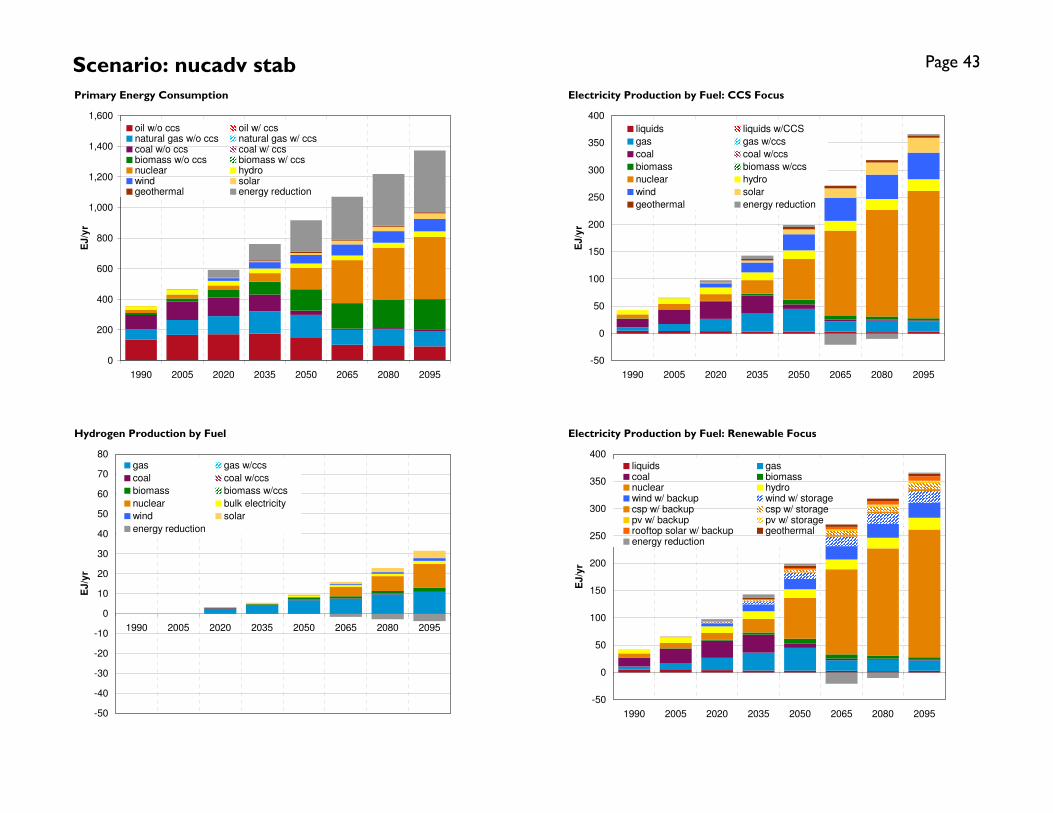
Scenario: nucadv stab Page 43
Primary Energy Consumption Electricity Production by Fuel: CCS Focus
Hydrogen Production by Fuel Electricity Production by Fuel: Renewable Focus
-50
0
50
100
150
200
250
300
350
400
1990 2005 2020 2035 2050 2065 2080 2095
EJ
/yr
liquids liquids w/CCS
gas gas w/ccs
coal coal w/ccs
biomass biomass w/ccs
nuclear hydro
wind solar
geothermal energy reduction
-50
-40
-30
-20
-10
0
10
20
30
40
50
60
70
80
1990 2005 2020 2035 2050 2065 2080 2095
EJ
/yr
gas gas w/ccs
coal coal w/ccs
biomass biomass w/ccs
nuclear bulk electricity
wind solar
energy reduction
-50
0
50
100
150
200
250
300
350
400
1990 2005 2020 2035 2050 2065 2080 2095
EJ
/yr
liquids gascoal biomassnuclear hydrowind w/ backup wind w/ storagecsp w/ backup csp w/ storagepv w/ backup pv w/ storagerooftop solar w/ backup geothermalenergy reduction
0
200
400
600
800
1,000
1,200
1,400
1,600
1990 2005 2020 2035 2050 2065 2080 2095
EJ
/yr
oil w/o ccs oil w/ ccsnatural gas w/o ccs natural gas w/ ccscoal w/o ccs coal w/ ccsbiomass w/o ccs biomass w/ ccsnuclear hydrowind solargeothermal energy reduction

Scenario: nucadv stab Page 44
Industrial Liquids Production by Fuel (Feedstocks and Fuel) Transportation Fuels Composition
Final Energy Intensity Final Energy per Capita
0
50
100
150
200
250
300
1990 2005 2020 2035 2050 2065 2080 2095
EJ
/yr
conventional oil unconventional oilcoal liquids coal liquids w/ ccs bio fuels gas liquidsgas coalelectricity hydrogenenergy reduction
0
10
20
30
40
50
60
70
80
90
1990 2005 2020 2035 2050 2065 2080 2095
EJ
/yr
conventional oil unconventional oilcoal liquids coal liquids w/ ccs bio fuels gas liquidsenergy reduction
0
2
4
6
8
10
12
1990 2005 2020 2035 2050 2065 2080 2095
GJ
/10
00
$ (
20
05
$)
0
50
100
150
200
250
300
350
Re
fere
nc
e G
DP
(T
rillio
n 2
00
5$
)
building
industry
transportation
total
reference GDP
0
10
20
30
40
50
60
70
80
1990 2005 2020 2035 2050 2065 2080 2095
GJ
/ca
pit
a
0
1
2
3
4
5
6
7
8
9
10
Po
pu
lati
on
(b
illio
n)
building
industry
transportation
total
population

Scenario: nucadv stab Page 45
Dedicated Energy Crops, Waste Biomass, and Municipal Solid Waste Consumption by Sector Land Use by Type
Biomass Production by Source CO2 Emissions by Sector
-125
-100
-75
-50
-25
0
25
50
75
100
125
150
175
200
225
250
1990 2005 2020 2035 2050 2065 2080 2095
EJ
/yr
energy reductionsynthetic gashydrogenrefined liquids: tran & bldgelectricityIndustrydirect buildings
0
2
4
6
8
10
12
14
16
1990 2005 2020 2035 2050 2065 2080 2095
Billio
n H
ec
tare
s
urban land cropspasture managed forestbioenergy crops unmanaged forestunmanaged land rock/ice/desert/tundra
-125
-100
-75
-50
-25
0
25
50
75
100
125
150
175
200
225
250
1990 2005 2020 2035 2050 2065 2080 2095
EJ
/yr
reduction in municipal solid wate
reduction in biomass crops
waste biomass
municipal solid waste
dedicated biomass crops
waste biomass
-5
0
5
10
15
20
25
1990 2005 2020 2035 2050 2065 2080 2095
GtC
/yr
buildings industry
transportation electricity
cement emissions reduction

Scenario: ccs stab Page 46
Final Energy Consumption
1990 2005 2020 2035 2050 2065 2080 2095 Units
building liquids 15.2 16.4 19.2 21.6 19.8 20.0 21.5 20.6 EJ/yr
building gas 18.7 26.7 27.8 28.2 24.2 21.3 20.9 19.9 EJ/yr
building coal 10.1 5.1 5.1 3.7 1.6 1.0 0.9 0.8 EJ/yr
building biomass 4.5 5.5 8.7 9.3 7.6 5.5 4.9 4.3 EJ/yr
building electricity 16.9 29.0 41.0 57.3 77.3 100.5 127.2 152.5 EJ/yr
building trad biomass 23.5 29.9 32.8 30.1 25.3 20.1 14.2 9.3 EJ/yr
building energy reduction 0.0 0.0 8.3 16.4 31.6 40.9 45.0 48.5 EJ/yr
total: w/o reduction 88.9 112.7 134.6 150.2 155.8 168.4 189.7 207.5 EJ/yr
industry liquids 22.4 21.2 20.6 23.9 21.5 22.6 23.9 19.7 EJ/yr
industry gas 26.6 30.5 30.9 33.0 23.4 19.4 19.7 19.8 EJ/yr
industry coal 31.4 35.8 34.8 28.0 12.3 8.3 9.0 9.2 EJ/yr
industry biomass 7.3 11.2 25.5 38.3 43.4 38.4 38.6 40.7 EJ/yr
industry electricity 18.1 24.8 33.9 47.4 74.2 98.2 112.0 126.2 EJ/yr
industry hydrogen 0.0 0.0 2.8 3.6 4.6 5.7 6.2 7.3 EJ/yr
industry energy reduction 0.0 0.0 19.4 42.5 76.9 97.9 102.7 106.1 EJ/yr
industry feedstocks 15.2 23.7 25.5 28.5 29.7 32.2 34.6 36.3 EJ/yr
total: w/o reduction 105.8 123.6 148.6 174.1 179.4 192.7 209.4 222.9 EJ/yr
transportation liquids 62.7 87.7 97.7 112.5 115.6 120.6 135.5 137.7 EJ/yr
transportation gas 2.2 3.0 6.1 11.3 14.9 17.9 22.4 27.3 EJ/yr
transportation coal 0.5 0.2 0.2 0.1 0.1 0.0 0.0 0.0 EJ/yr
transportation electricity 1.0 1.0 2.1 4.7 12.6 19.6 24.8 30.9 EJ/yr
transportation hydrogen 0.0 0.0 0.5 2.1 6.4 11.9 17.3 25.1 EJ/yr
transportation energy reduction 0.0 0.0 4.0 9.6 22.1 31.7 35.2 38.3 EJ/yr
total: w/o reduction 66.4 91.8 106.6 130.8 149.7 170.1 200.0 221.1 EJ/yr
total final energy buildings 88.9 112.7 134.6 150.2 155.8 168.4 189.7 207.5 EJ/yr
total final energy industry 105.8 123.6 148.6 174.1 179.4 192.7 209.4 222.9 EJ/yr
total final energy transportation 66.4 91.8 106.6 130.8 149.7 170.1 200.0 221.1 EJ/yr
total final energy energy reduction 0.0 0.0 31.7 68.5 130.5 170.4 182.9 192.8 EJ/yr
total: w/o reduction 261.1 328.1 389.8 455.2 484.9 531.1 599.1 651.4 EJ/yr

Scenario: ccs stab Page 47
Primary Energy w/CCS
1990 2005 2020 2035 2050 2065 2080 2095 Units
oil w/o ccs 135.6 167.5 174.9 184.2 166.9 173.6 195.4 187.1 EJ/yr
oil w/ ccs 0.0 0.0 0.6 2.7 8.0 11.6 12.6 13.6 EJ/yr
natural gas w/o ccs 69.9 97.5 119.6 146.4 137.5 116.2 114.1 123.1 EJ/yr
natural gas w/ ccs 0.0 0.0 2.2 12.6 44.0 77.7 98.9 115.4 EJ/yr
coal w/o ccs 91.2 119.1 130.5 117.7 33.3 11.5 12.0 12.3 EJ/yr
coal w/ ccs 0.0 0.0 1.6 17.3 94.8 156.8 206.7 244.2 EJ/yr
biomass w/o ccs 14.4 21.6 46.4 72.9 94.1 85.1 78.7 84.2 EJ/yr
biomass w/ ccs 0.0 0.0 0.2 3.2 40.5 78.8 103.5 116.9 EJ/yr
nuclear 21.0 26.1 23.5 21.9 17.6 16.2 15.5 15.0 EJ/yr
hydro 23.6 29.2 29.4 31.1 29.2 29.0 31.0 33.4 EJ/yr
wind 0.0 0.9 17.4 41.1 55.5 59.6 61.2 73.2 EJ/yr
solar 0.0 0.1 1.5 5.3 11.9 16.3 19.7 29.2 EJ/yr
geothermal 0.4 0.5 1.5 6.2 7.7 7.1 6.8 6.7 EJ/yr
energy reduction 0.0 0.0 43.5 99.1 175.9 230.8 262.8 318.5 EJ/yr
total: w/o reduction 356 463 549 663 741 839 956 1054 EJ/yr
Electricity Production by Fuel
1990 2005 2020 2035 2050 2065 2080 2095 Units
oil 4.86 4.33 3.84 2.50 1.30 0.87 1.01 1.23 EJ/yr
oil w/ccs 0.00 0.00 0.24 1.15 3.50 5.35 5.98 6.50 EJ/yr
gas 6.07 12.82 21.99 28.48 27.45 17.36 12.73 11.69 EJ/yr
gas w/ccs 0.00 0.00 0.89 6.50 24.76 45.60 59.67 70.77 EJ/yr
coal 16.06 26.35 32.07 31.92 8.00 0.77 0.71 0.77 EJ/yr
coal w/ccs 0.00 0.00 0.59 7.28 42.33 71.39 95.64 113.95 EJ/yr
biomass 0.43 0.71 1.50 2.66 2.77 1.93 0.91 0.58 EJ/yr
biomass w/ccs 0.00 0.00 0.02 1.16 16.74 32.33 43.44 48.88 EJ/yr
nuclear 7.36 9.97 9.95 9.95 9.95 9.95 9.95 9.95 EJ/yr
hydro 7.82 10.44 12.13 13.99 15.85 17.70 19.56 21.42 EJ/yr
wind w/backup 0.01 0.36 5.53 12.81 18.77 22.18 23.27 27.67 EJ/yr
wind w/storage 0.00 0.00 1.61 5.45 10.52 13.89 15.03 18.75 EJ/yr
CSP w/backup 0.00 0.00 0.37 0.78 1.25 1.79 2.08 3.14 EJ/yr
CSP w/storage 0.00 0.00 0.13 1.36 4.00 5.87 6.76 10.08 EJ/yr
PV w/backup 0.00 0.04 0.05 0.07 0.42 1.13 1.86 2.71 EJ/yr
PV w/storage 0.00 0.00 0.01 0.04 0.22 0.54 0.84 1.20 EJ/yr
rooftop PV w/backup 0.00 0.00 0.34 1.10 2.42 4.50 5.86 7.08 EJ/yr
geothermal 0.13 0.21 0.63 2.88 4.33 4.38 4.36 4.39 EJ/yr
energy reduction 0.00 0.00 5.93 14.04 7.78 -2.10 4.28 13.60 EJ/yr
total: w/o reduction 42.7 65.2 91.9 130.1 194.6 257.5 309.7 360.8 EJ/yr

Scenario: ccs stab Page 48
Transportation Fuels Production by Fuel
1990 2005 2020 2035 2050 2065 2080 2095 Units
conventional oil 62.5 86.8 92.2 97.6 88.5 89.0 97.1 83.1 EJ/yr
unconventional oil 0.0 0.0 1.1 3.7 7.4 11.7 19.8 32.0 EJ/yr
coal liquids 0.0 0.0 0.3 0.3 0.2 0.0 0.0 0.0 EJ/yr
coal liquids w/ ccs 0.0 0.0 0.0 0.1 0.2 0.4 0.5 0.9 EJ/yr
bio fuels 0.2 0.9 2.7 6.2 12.6 13.1 12.4 14.9 EJ/yr
gas liquids 0.0 0.0 1.3 4.6 6.7 6.4 5.7 6.8 EJ/yr
gas 2.2 3.0 6.1 11.3 14.9 17.9 22.4 27.3 EJ/yr
coal 0.5 0.2 0.2 0.1 0.1 0.0 0.0 0.0 EJ/yr
electricity 1.0 1.0 2.1 4.7 12.6 19.6 24.8 30.9 EJ/yr
hydrogen 0.0 0.0 0.5 2.1 6.4 11.9 17.3 25.1 EJ/yr
energy reduction 0.0 0.0 4.0 9.6 22.1 31.7 35.2 38.3 EJ/yr
total: w/o reduction 66.4 91.8 106.6 130.8 149.7 170.1 200.0 221.1 EJ/yr
Industrial Liquids Production by Fuel
1990 2005 2020 2035 2050 2065 2080 2095 Units
conventional oil 36.59 43.89 44.03 47.65 43.00 45.53 47.32 38.93 EJ/yr
unconventional oil 0.00 0.00 0.26 0.80 1.80 3.11 5.94 10.84 EJ/yr
coal liquids 0.00 0.00 0.06 0.06 0.03 0.05 0.07 0.15 EJ/yr
coal liquids w/ ccs 0.00 0.00 0.00 0.01 0.03 0.05 0.07 0.15 EJ/yr
bio fuels 0.01 0.05 0.45 1.44 3.51 3.56 3.07 3.70 EJ/yr
gas liquids 0.00 0.00 0.33 1.41 1.88 1.69 1.27 1.57 EJ/yr
energy reduction 0.0 0.0 2.1 5.2 14.8 23.9 25.7 25.6 EJ/yr
total: w/o reduction 36.6 43.9 45.1 51.4 50.3 54.0 57.7 55.3 EJ/yr
Hydrogen Production by Fuel
1990 2005 2020 2035 2050 2065 2080 2095 Units
gas 0.00 0.00 2.13 3.36 4.65 5.89 7.76 9.51 EJ/yr
gas w/ccs 0.00 0.00 0.38 0.96 2.57 4.18 5.36 7.26 EJ/yr
coal 0.00 0.00 0.27 0.25 0.14 0.11 0.16 0.21 EJ/yr
coal w/ccs 0.00 0.00 0.11 0.28 0.95 1.96 3.09 4.89 EJ/yr
biomass 0.00 0.00 0.17 0.24 0.22 0.15 0.20 0.25 EJ/yr
biomass w/ccs 0.00 0.00 0.06 0.22 1.62 3.92 4.73 6.88 EJ/yr
nuclear 0.00 0.00 0.00 0.00 0.00 0.00 0.00 0.00 EJ/yr
bulk electricity 0.00 0.00 0.09 0.18 0.36 0.58 0.83 1.12 EJ/yr
wind 0.00 0.00 0.09 0.10 0.16 0.27 0.43 0.63 EJ/yr
solar 0.00 0.00 0.09 0.15 0.35 0.58 0.97 1.64 EJ/yr
energy reduction 0.00 0.00 -0.14 -0.50 -1.65 -3.40 -3.56 -4.68 EJ/yr
total: w/o reduction 0.00 0.00 3.38 5.74 11.02 17.65 23.54 32.40 EJ/yr

Scenario: ccs stab Page 49
Dedicated Bioenergy Crops, Crop Residues, and Municipal Solid Waste Consumption by Sector
1990 2005 2020 2035 2050 2065 2080 2095 Units
direct buildings 4.5 5.5 8.7 9.3 7.6 5.5 4.9 4.3 EJ/yr
Industry 7.4 11.3 26.4 41.2 50.3 45.3 44.3 47.4 EJ/yr
electricity 2.1 2.5 4.2 9.6 43.8 75.3 96.0 104.7 EJ/yr
refined liquids: tran & bldg 0.5 2.2 6.7 15.0 29.0 29.4 27.0 30.8 EJ/yr
hydrogen 0.0 0.0 0.5 1.0 3.8 8.3 9.9 14.0 EJ/yr
synthetic gas 0.0 0.0 0.0 0.0 0.0 0.0 0.0 0.1 EJ/yr
energy reduction 0.0 0.0 -14.5 -32.2 -74.3 -80.3 -80.9 -71.1 EJ/yr
total: w/o reduction 14.4 21.6 46.6 76.1 134.6 163.9 182.2 201.1 EJ/yr
Biomass Production
1990 2005 2020 2035 2050 2065 2080 2095 Units
waste biomass 14.4 21.5 23.0 40.6 71.0 82.6 84.0 83.1 EJ
dedicated biomass crops 0.0 0.0 23.6 34.0 47.5 59.2 68.5 79.4 EJ
municipal solid waste 0.0 0.1 0.1 1.4 16.1 22.2 29.7 38.6 EJ
waste biomass 0.0 0.0 8.7 -2.7 -29.2 -37.2 -36.9 -33.7 EJ
reduction in biomass crops 0.0 0.0 -23.6 -29.1 -30.8 -24.4 -19.8 -9.1 EJ
reduction in municipal solid wate 0.0 0.0 0.4 -0.4 -14.3 -18.7 -24.2 -28.3 EJ
total: w/o reduction 14.4 21.6 31.7 44.3 74.6 102.3 125.5 158.4 EJ
Arable Land Use by Type
1990 2005 2020 2035 2050 2065 2080 2095 Units
urban land 0.05 0.05 0.05 0.05 0.05 0.05 0.05 0.05 billion Ha
crops 1.20 1.21 0.97 0.89 0.76 0.68 0.63 0.56 billion Ha
pasture 0.70 0.73 0.71 0.71 0.70 0.69 0.69 0.69 billion Ha
managed forest 0.69 0.74 0.83 0.91 0.97 0.98 0.99 1.01 billion Ha
bioenergy crops 0.00 0.00 0.11 0.17 0.24 0.31 0.35 0.40 billion Ha
unmanaged forest 3.32 3.25 3.93 3.89 3.87 3.87 3.87 3.86 billion Ha
unmanaged land 4.58 4.58 3.94 3.94 3.96 3.97 3.97 3.98 billion Ha
rock/ice/desert/tundra 2.62 2.62 2.62 2.62 2.62 2.62 2.62 2.62 billion Ha
total 10.50 10.50 10.50 10.50 10.50 10.50 10.50 10.50 billion Ha

Scenario: ccs stab Page 50
Population, GDP, and Energy Indicators
1990 2005 2020 2035 2050 2065 2080 2095 Units
Economic Activity reference GDP $26.1 $39.4 $57.4 $81.7 $114.8 $161.6 $227.3 $310.8 trillion 2005$
Final Energy Intensity building 3.41 2.86 2.35 1.84 1.36 1.04 0.83 0.67 GJ/1000$ (2005$)
Final Energy Intensity industry 4.06 3.14 2.59 2.13 1.56 1.19 0.92 0.72 GJ/1000$ (2005$)
Final Energy Intensity transportation 2.55 2.33 1.86 1.60 1.30 1.05 0.88 0.71 GJ/1000$ (2005$)
Final Energy Intensity total 10.01 8.33 6.79 5.57 4.22 3.29 2.64 2.10 GJ/1000$ (2005$)
Population population 5.2 6.4 7.5 8.3 8.8 9.1 9.0 8.7 billion
Final Energy per Capita building 16.9 17.5 17.9 18.0 17.7 18.6 21.1 23.7 GJ/capita
Final Energy per Capita industry 20.2 19.2 19.7 20.9 20.4 21.3 23.2 25.5 GJ/capita
Final Energy per Capita transportation 12.7 14.3 14.2 15.7 17.0 18.8 22.2 25.3 GJ/capita
Final Energy per Capita total 49.7 51.0 51.8 54.6 55.0 58.6 66.5 74.4 GJ/capita
Long-Term Equilibrium Energy Producer Prices
1990 2005 2020 2035 2050 2065 2080 2095 Units
global oil (w/o carbon charge) $27.6 $32.5 $39.6 $41.5 $43.9 $45.2 $46.7 $55.1 $/barrel (2005$)
global oil (w/ carbon charge) $27.6 $32.5 $46.4 $55.7 $73.9 $86.1 $87.7 $98.7 $/barrel (2005$)
domestic natural gas (w/o carbon charge) $3.3 $3.8 $4.3 $4.0 $4.3 $5.0 $5.4 $5.7 $/mmBTU (2005$)
domestic natural gas (w/ carbon charge) $3.3 $3.8 $5.1 $5.7 $8.0 $9.9 $10.2 $10.6 $/mmBTU (2005$)
domestic coal (w/o carbon charge) $1.7 $1.7 $1.7 $1.7 $1.6 $1.6 $1.6 $1.6 $/GJ (2005$)
domestic coal (w/ carbon charge) $1.7 $1.7 $3.3 $4.9 $8.2 $10.6 $10.4 $10.6 $/GJ (2005$)
domestic electricity (w/ carbon charge) 6.21 5.75 6.59 6.78 6.90 6.87 6.69 6.77 cents/kWh (2005$)
carbon price 0.0 0.0 56.1 116.7 242.6 327.0 321.6 330.2 $/tC (2005$)
Crop Prices
1990 2005 2020 2035 2050 2065 2080 2095 Units
global corn 33 33 45 55 68 74 70 66 $/Gcal (2005$)
global rice 32 32 50 63 85 92 80 68 $/Gcal (2005$)
global wheat 27 27 48 63 86 94 82 71 $/Gcal (2005$)
Emissions by Sectors
1990 2005 2020 2035 2050 2065 2080 2095 Units
buildings 0.858 0.860 0.930 0.932 0.760 0.702 0.729 0.687 GtC/yr
industry 1.623 1.706 1.687 1.630 1.013 0.830 0.891 0.815 GtC/yr
transportation 1.354 1.863 2.106 2.441 2.408 2.474 2.852 2.882 GtC/yr
electricity 1.909 2.848 3.266 3.179 0.679 -0.666 -1.206 -1.386 GtC/yr
cement 0.261 0.483 0.659 0.714 0.323 0.201 0.204 0.172 GtC/yr
emissions reduction 0.000 0.000 1.618 4.367 10.942 15.396 18.145 21.128 GtC/yr
total: w/o reduction 6.006 7.760 8.648 8.896 5.182 3.540 3.470 3.170 GtC/yr

Scenario: ccs stab Page 51
Final Energy Consumption: Buildings Final Energy Consumption: Industry (Does not Include Feedstocks)
Final Energy Consumption: Transportation Final Energy Consumption by Sector
0
50
100
150
200
250
300
1990 2005 2020 2035 2050 2065 2080 2095
EJ
/yr
liquids gascoal biomasselectricity trad biomassenergy reduction
0
50
100
150
200
250
300
350
400
1990 2005 2020 2035 2050 2065 2080 2095
EJ
/yr
liquids gas
coal biomass
electricity hydrogen
energy reduction feedstocks
0
50
100
150
200
250
300
1990 2005 2020 2035 2050 2065 2080 2095
EJ
/yr
liquids gas
coal electricity
hydrogen energy reduction
0
100
200
300
400
500
600
700
800
900
1990 2005 2020 2035 2050 2065 2080 2095
EJ
/yr
buildings industry
transportation energy reduction

Scenario: ccs stab Page 52
Primary Energy Consumption Electricity Production by Fuel: CCS Focus
Hydrogen Production by Fuel Electricity Production by Fuel: Renewable Focus
-50
0
50
100
150
200
250
300
350
400
1990 2005 2020 2035 2050 2065 2080 2095
EJ
/yr
liquids liquids w/CCS
gas gas w/ccs
coal coal w/ccs
biomass biomass w/ccs
nuclear hydro
wind solar
geothermal energy reduction
-50
-40
-30
-20
-10
0
10
20
30
40
50
60
70
80
1990 2005 2020 2035 2050 2065 2080 2095
EJ
/yr
gas gas w/ccs
coal coal w/ccs
biomass biomass w/ccs
nuclear bulk electricity
wind solar
energy reduction
-50
0
50
100
150
200
250
300
350
400
1990 2005 2020 2035 2050 2065 2080 2095
EJ
/yr
liquids gascoal biomassnuclear hydrowind w/ backup wind w/ storagecsp w/ backup csp w/ storagepv w/ backup pv w/ storagerooftop solar w/ backup geothermalenergy reduction
0
200
400
600
800
1,000
1,200
1,400
1,600
1990 2005 2020 2035 2050 2065 2080 2095
EJ
/yr
oil w/o ccs oil w/ ccsnatural gas w/o ccs natural gas w/ ccscoal w/o ccs coal w/ ccsbiomass w/o ccs biomass w/ ccsnuclear hydrowind solargeothermal energy reduction

Scenario: ccs stab Page 53
Industrial Liquids Production by Fuel (Feedstocks and Fuel) Transportation Fuels Composition
Final Energy Intensity Final Energy per Capita
0
50
100
150
200
250
300
1990 2005 2020 2035 2050 2065 2080 2095
EJ
/yr
conventional oil unconventional oilcoal liquids coal liquids w/ ccs bio fuels gas liquidsgas coalelectricity hydrogenenergy reduction
0
10
20
30
40
50
60
70
80
90
1990 2005 2020 2035 2050 2065 2080 2095
EJ
/yr
conventional oil unconventional oilcoal liquids coal liquids w/ ccs bio fuels gas liquidsenergy reduction
0
2
4
6
8
10
12
1990 2005 2020 2035 2050 2065 2080 2095
GJ
/10
00
$ (
20
05
$)
0
50
100
150
200
250
300
350
Re
fere
nc
e G
DP
(T
rillio
n 2
00
5$
)
building
industry
transportation
total
reference GDP
0
10
20
30
40
50
60
70
80
1990 2005 2020 2035 2050 2065 2080 2095
GJ
/ca
pit
a
0
1
2
3
4
5
6
7
8
9
10
Po
pu
lati
on
(b
illio
n)
building
industry
transportation
total
population

Scenario: ccs stab Page 54
Dedicated Energy Crops, Waste Biomass, and Municipal Solid Waste Consumption by Sector Land Use by Type
Biomass Production by Source CO2 Emissions by Sector
-125
-100
-75
-50
-25
0
25
50
75
100
125
150
175
200
225
250
1990 2005 2020 2035 2050 2065 2080 2095
EJ
/yr
energy reductionsynthetic gashydrogenrefined liquids: tran & bldgelectricityIndustrydirect buildings
0
2
4
6
8
10
12
14
16
1990 2005 2020 2035 2050 2065 2080 2095
Billio
n H
ec
tare
s
urban land cropspasture managed forestbioenergy crops unmanaged forestunmanaged land rock/ice/desert/tundra
-125
-100
-75
-50
-25
0
25
50
75
100
125
150
175
200
225
250
1990 2005 2020 2035 2050 2065 2080 2095
EJ
/yr
reduction in municipal solid wate
reduction in biomass crops
waste biomass
municipal solid waste
dedicated biomass crops
waste biomass
-5
0
5
10
15
20
25
1990 2005 2020 2035 2050 2065 2080 2095
GtC
/yr
buildings industry
transportation electricity
cement emissions reduction

Scenario: bioccs stab Page 55
Final Energy Consumption
1990 2005 2020 2035 2050 2065 2080 2095 Units
building liquids 15.2 16.4 19.3 21.7 20.0 20.4 22.1 21.4 EJ/yr
building gas 18.7 26.7 27.8 28.4 24.3 21.7 21.5 20.5 EJ/yr
building coal 10.1 5.1 5.2 3.7 1.6 1.1 1.0 0.9 EJ/yr
building biomass 4.5 5.5 8.8 9.6 7.9 6.0 5.4 4.7 EJ/yr
building electricity 16.9 29.0 41.1 57.7 78.1 101.6 128.6 154.2 EJ/yr
building trad biomass 23.5 29.9 32.8 30.1 25.2 20.0 14.0 9.2 EJ/yr
building energy reduction 0.0 0.0 7.9 15.5 30.3 38.5 42.0 45.1 EJ/yr
total: w/o reduction 88.9 112.7 135.0 151.1 157.1 170.8 192.7 210.9 EJ/yr
industry liquids 22.4 21.2 20.6 23.8 21.4 22.9 24.4 20.8 EJ/yr
industry gas 26.6 30.5 30.9 33.0 23.3 19.8 20.2 20.2 EJ/yr
industry coal 31.4 35.8 34.8 28.0 12.3 8.8 9.7 9.9 EJ/yr
industry biomass 7.3 11.2 26.0 39.6 45.5 42.0 43.0 45.5 EJ/yr
industry electricity 18.1 24.8 33.9 47.4 74.4 97.6 110.9 124.8 EJ/yr
industry hydrogen 0.0 0.0 2.8 3.6 4.6 5.7 6.2 7.3 EJ/yr
industry energy reduction 0.0 0.0 18.9 41.2 74.8 93.8 97.6 100.4 EJ/yr
industry feedstocks 15.2 23.7 25.6 28.7 29.9 32.7 35.2 36.9 EJ/yr
total: w/o reduction 105.8 123.6 149.1 175.4 181.5 196.8 214.4 228.6 EJ/yr
transportation liquids 62.7 87.7 97.9 113.1 116.5 122.8 138.3 141.6 EJ/yr
transportation gas 2.2 3.0 6.1 11.4 15.1 18.2 22.8 27.7 EJ/yr
transportation coal 0.5 0.2 0.2 0.2 0.1 0.0 0.0 0.0 EJ/yr
transportation electricity 1.0 1.0 2.1 4.8 12.7 19.5 24.6 30.6 EJ/yr
transportation hydrogen 0.0 0.0 0.5 2.1 6.5 11.9 17.3 25.0 EJ/yr
transportation energy reduction 0.0 0.0 3.8 8.9 20.9 29.3 32.1 34.4 EJ/yr
total: w/o reduction 66.4 91.8 106.8 131.5 150.8 172.5 203.1 224.9 EJ/yr
total final energy buildings 88.9 112.7 135.0 151.1 157.1 170.8 192.7 210.9 EJ/yr
total final energy industry 105.8 123.6 149.1 175.4 181.5 196.8 214.4 228.6 EJ/yr
total final energy transportation 66.4 91.8 106.8 131.5 150.8 172.5 203.1 224.9 EJ/yr
total final energy energy reduction 0.0 0.0 30.5 65.7 126.0 161.5 171.7 179.9 EJ/yr
total: w/o reduction 261.1 328.1 390.9 458.0 489.4 540.0 610.2 664.4 EJ/yr
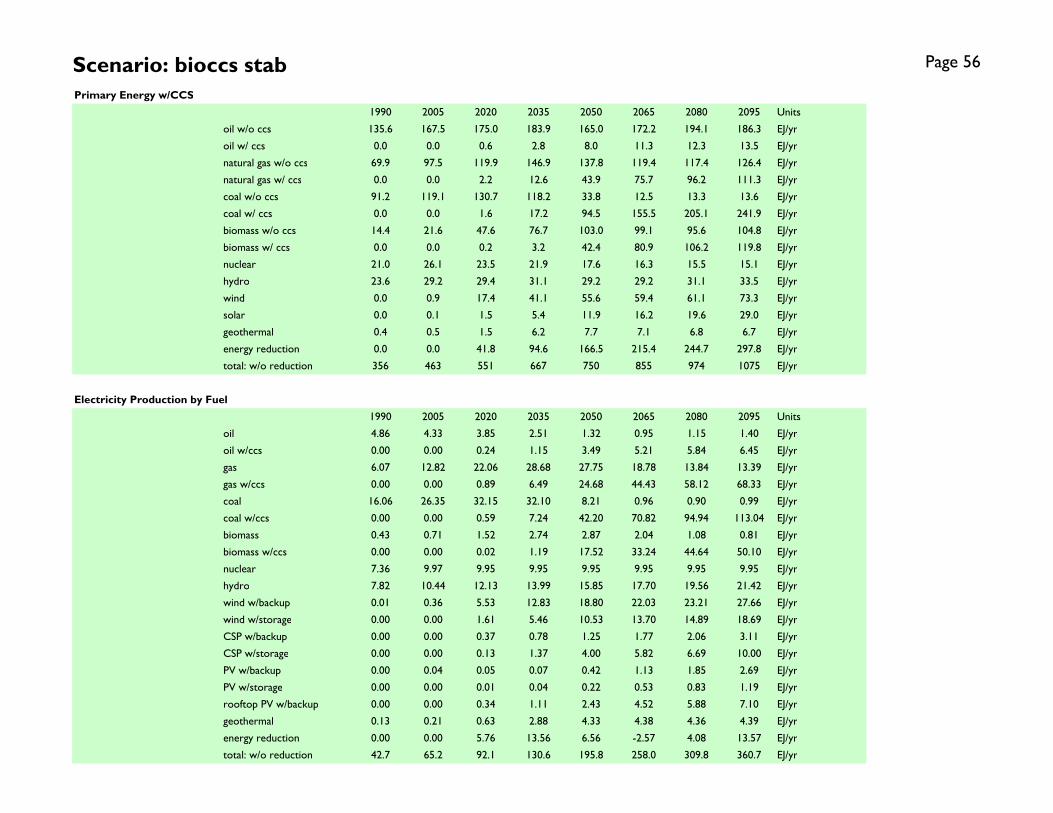
Scenario: bioccs stab Page 56
Primary Energy w/CCS
1990 2005 2020 2035 2050 2065 2080 2095 Units
oil w/o ccs 135.6 167.5 175.0 183.9 165.0 172.2 194.1 186.3 EJ/yr
oil w/ ccs 0.0 0.0 0.6 2.8 8.0 11.3 12.3 13.5 EJ/yr
natural gas w/o ccs 69.9 97.5 119.9 146.9 137.8 119.4 117.4 126.4 EJ/yr
natural gas w/ ccs 0.0 0.0 2.2 12.6 43.9 75.7 96.2 111.3 EJ/yr
coal w/o ccs 91.2 119.1 130.7 118.2 33.8 12.5 13.3 13.6 EJ/yr
coal w/ ccs 0.0 0.0 1.6 17.2 94.5 155.5 205.1 241.9 EJ/yr
biomass w/o ccs 14.4 21.6 47.6 76.7 103.0 99.1 95.6 104.8 EJ/yr
biomass w/ ccs 0.0 0.0 0.2 3.2 42.4 80.9 106.2 119.8 EJ/yr
nuclear 21.0 26.1 23.5 21.9 17.6 16.3 15.5 15.1 EJ/yr
hydro 23.6 29.2 29.4 31.1 29.2 29.2 31.1 33.5 EJ/yr
wind 0.0 0.9 17.4 41.1 55.6 59.4 61.1 73.3 EJ/yr
solar 0.0 0.1 1.5 5.4 11.9 16.2 19.6 29.0 EJ/yr
geothermal 0.4 0.5 1.5 6.2 7.7 7.1 6.8 6.7 EJ/yr
energy reduction 0.0 0.0 41.8 94.6 166.5 215.4 244.7 297.8 EJ/yr
total: w/o reduction 356 463 551 667 750 855 974 1075 EJ/yr
Electricity Production by Fuel
1990 2005 2020 2035 2050 2065 2080 2095 Units
oil 4.86 4.33 3.85 2.51 1.32 0.95 1.15 1.40 EJ/yr
oil w/ccs 0.00 0.00 0.24 1.15 3.49 5.21 5.84 6.45 EJ/yr
gas 6.07 12.82 22.06 28.68 27.75 18.78 13.84 13.39 EJ/yr
gas w/ccs 0.00 0.00 0.89 6.49 24.68 44.43 58.12 68.33 EJ/yr
coal 16.06 26.35 32.15 32.10 8.21 0.96 0.90 0.99 EJ/yr
coal w/ccs 0.00 0.00 0.59 7.24 42.20 70.82 94.94 113.04 EJ/yr
biomass 0.43 0.71 1.52 2.74 2.87 2.04 1.08 0.81 EJ/yr
biomass w/ccs 0.00 0.00 0.02 1.19 17.52 33.24 44.64 50.10 EJ/yr
nuclear 7.36 9.97 9.95 9.95 9.95 9.95 9.95 9.95 EJ/yr
hydro 7.82 10.44 12.13 13.99 15.85 17.70 19.56 21.42 EJ/yr
wind w/backup 0.01 0.36 5.53 12.83 18.80 22.03 23.21 27.66 EJ/yr
wind w/storage 0.00 0.00 1.61 5.46 10.53 13.70 14.89 18.69 EJ/yr
CSP w/backup 0.00 0.00 0.37 0.78 1.25 1.77 2.06 3.11 EJ/yr
CSP w/storage 0.00 0.00 0.13 1.37 4.00 5.82 6.69 10.00 EJ/yr
PV w/backup 0.00 0.04 0.05 0.07 0.42 1.13 1.85 2.69 EJ/yr
PV w/storage 0.00 0.00 0.01 0.04 0.22 0.53 0.83 1.19 EJ/yr
rooftop PV w/backup 0.00 0.00 0.34 1.11 2.43 4.52 5.88 7.10 EJ/yr
geothermal 0.13 0.21 0.63 2.88 4.33 4.38 4.36 4.39 EJ/yr
energy reduction 0.00 0.00 5.76 13.56 6.56 -2.57 4.08 13.57 EJ/yr
total: w/o reduction 42.7 65.2 92.1 130.6 195.8 258.0 309.8 360.7 EJ/yr

Scenario: bioccs stab Page 57
Transportation Fuels Production by Fuel
1990 2005 2020 2035 2050 2065 2080 2095 Units
conventional oil 62.5 86.8 92.2 97.5 87.5 87.9 95.7 82.4 EJ/yr
unconventional oil 0.0 0.0 1.1 3.7 7.3 11.7 19.9 31.5 EJ/yr
coal liquids 0.0 0.0 0.3 0.3 0.2 0.0 0.0 0.0 EJ/yr
coal liquids w/ ccs 0.0 0.0 0.0 0.1 0.2 0.3 0.5 0.9 EJ/yr
bio fuels 0.2 0.9 2.9 6.9 14.7 16.4 16.6 20.4 EJ/yr
gas liquids 0.0 0.0 1.3 4.6 6.6 6.3 5.6 6.4 EJ/yr
gas 2.2 3.0 6.1 11.4 15.1 18.2 22.8 27.7 EJ/yr
coal 0.5 0.2 0.2 0.2 0.1 0.0 0.0 0.0 EJ/yr
electricity 1.0 1.0 2.1 4.8 12.7 19.5 24.6 30.6 EJ/yr
hydrogen 0.0 0.0 0.5 2.1 6.5 11.9 17.3 25.0 EJ/yr
energy reduction 0.0 0.0 3.8 8.9 20.9 29.3 32.1 34.4 EJ/yr
total: w/o reduction 66.4 91.8 106.8 131.5 150.8 172.5 203.1 224.9 EJ/yr
Industrial Liquids Production by Fuel
1990 2005 2020 2035 2050 2065 2080 2095 Units
conventional oil 36.59 43.89 44.01 47.53 42.42 45.08 47.02 39.06 EJ/yr
unconventional oil 0.00 0.00 0.26 0.80 1.78 3.18 6.07 10.76 EJ/yr
coal liquids 0.00 0.00 0.06 0.07 0.03 0.05 0.07 0.14 EJ/yr
coal liquids w/ ccs 0.00 0.00 0.00 0.01 0.03 0.05 0.07 0.14 EJ/yr
bio fuels 0.01 0.05 0.48 1.64 4.29 4.72 4.39 5.49 EJ/yr
gas liquids 0.00 0.00 0.33 1.39 1.84 1.66 1.25 1.47 EJ/yr
energy reduction 0.0 0.0 2.1 5.1 14.6 23.1 24.5 23.9 EJ/yr
total: w/o reduction 36.6 43.9 45.1 51.4 50.4 54.7 58.9 57.1 EJ/yr
Hydrogen Production by Fuel
1990 2005 2020 2035 2050 2065 2080 2095 Units
gas 0.00 0.00 2.13 3.37 4.65 6.03 8.04 9.83 EJ/yr
gas w/ccs 0.00 0.00 0.37 0.95 2.54 4.01 5.10 6.89 EJ/yr
coal 0.00 0.00 0.27 0.25 0.14 0.13 0.19 0.24 EJ/yr
coal w/ccs 0.00 0.00 0.11 0.28 0.95 1.91 2.98 4.70 EJ/yr
biomass 0.00 0.00 0.17 0.25 0.23 0.17 0.24 0.30 EJ/yr
biomass w/ccs 0.00 0.00 0.07 0.23 1.70 3.98 4.77 7.01 EJ/yr
nuclear 0.00 0.00 0.00 0.00 0.00 0.00 0.00 0.00 EJ/yr
bulk electricity 0.00 0.00 0.09 0.18 0.36 0.58 0.83 1.11 EJ/yr
wind 0.00 0.00 0.09 0.10 0.16 0.26 0.42 0.60 EJ/yr
solar 0.00 0.00 0.09 0.15 0.34 0.57 0.94 1.58 EJ/yr
energy reduction 0.00 0.00 -0.14 -0.52 -1.71 -3.39 -3.53 -4.54 EJ/yr
total: w/o reduction 0.00 0.00 3.39 5.75 11.08 17.64 23.51 32.26 EJ/yr

Scenario: bioccs stab Page 58
Dedicated Bioenergy Crops, Crop Residues, and Municipal Solid Waste Consumption by Sector
1990 2005 2020 2035 2050 2065 2080 2095 Units
direct buildings 4.5 5.5 8.8 9.6 7.9 6.0 5.4 4.7 EJ/yr
Industry 7.4 11.3 27.0 42.9 53.9 51.1 51.2 55.4 EJ/yr
electricity 2.1 2.5 4.3 9.8 45.8 77.6 99.0 107.8 EJ/yr
refined liquids: tran & bldg 0.5 2.2 7.1 16.6 33.8 36.8 36.0 42.2 EJ/yr
hydrogen 0.0 0.0 0.5 1.0 4.0 8.5 10.0 14.3 EJ/yr
synthetic gas 0.0 0.0 0.0 0.0 0.1 0.1 0.1 0.1 EJ/yr
energy reduction 0.0 0.0 -15.7 -36.1 -85.1 -96.4 -100.5 -94.5 EJ/yr
total: w/o reduction 14.4 21.6 47.8 80.0 145.4 180.0 201.8 224.5 EJ/yr
Biomass Production
1990 2005 2020 2035 2050 2065 2080 2095 Units
waste biomass 14.4 21.5 21.6 38.4 71.4 84.7 86.5 85.9 EJ
dedicated biomass crops 0.0 0.0 26.2 40.7 58.1 73.0 85.3 99.6 EJ
municipal solid waste 0.0 0.1 0.0 0.9 15.9 22.3 30.0 39.0 EJ
waste biomass 0.0 0.0 10.1 -0.6 -29.6 -39.4 -39.5 -36.6 EJ
reduction in biomass crops 0.0 0.0 -26.2 -35.7 -41.4 -38.2 -36.6 -29.3 EJ
reduction in municipal solid wate 0.0 0.0 0.4 0.2 -14.1 -18.9 -24.4 -28.7 EJ
total: w/o reduction 14.4 21.6 31.7 43.7 74.4 102.5 125.8 158.7 EJ
Arable Land Use by Type
1990 2005 2020 2035 2050 2065 2080 2095 Units
urban land 0.05 0.05 0.05 0.05 0.05 0.05 0.05 0.05 billion Ha
crops 1.20 1.21 0.87 0.75 0.62 0.54 0.49 0.43 billion Ha
pasture 0.70 0.73 0.72 0.71 0.70 0.70 0.70 0.69 billion Ha
managed forest 0.69 0.74 0.84 0.92 0.98 0.99 1.00 1.03 billion Ha
bioenergy crops 0.00 0.00 0.12 0.19 0.29 0.36 0.40 0.45 billion Ha
unmanaged forest 3.32 3.25 3.97 3.93 3.91 3.90 3.90 3.88 billion Ha
unmanaged land 4.58 4.58 3.98 3.99 4.01 4.01 4.01 4.01 billion Ha
rock/ice/desert/tundra 2.62 2.62 2.62 2.62 2.62 2.62 2.62 2.62 billion Ha
total 10.50 10.50 10.50 10.50 10.50 10.50 10.50 10.50 billion Ha

Scenario: bioccs stab Page 59
Population, GDP, and Energy Indicators
1990 2005 2020 2035 2050 2065 2080 2095 Units
Economic Activity reference GDP $26.1 $39.4 $57.5 $82.2 $115.9 $163.5 $229.9 $314.4 trillion 2005$
Final Energy Intensity building 3.41 2.86 2.35 1.84 1.36 1.04 0.84 0.67 GJ/1000$ (2005$)
Final Energy Intensity industry 4.06 3.14 2.59 2.13 1.57 1.20 0.93 0.73 GJ/1000$ (2005$)
Final Energy Intensity transportation 2.55 2.33 1.86 1.60 1.30 1.05 0.88 0.72 GJ/1000$ (2005$)
Final Energy Intensity total 10.01 8.33 6.79 5.57 4.22 3.30 2.65 2.11 GJ/1000$ (2005$)
Population population 5.2 6.4 7.5 8.3 8.8 9.1 9.0 8.7 billion
Final Energy per Capita building 16.9 17.5 17.9 18.1 17.8 18.9 21.4 24.1 GJ/capita
Final Energy per Capita industry 20.2 19.2 19.8 21.0 20.6 21.7 23.8 26.1 GJ/capita
Final Energy per Capita transportation 12.7 14.3 14.2 15.8 17.1 19.0 22.6 25.7 GJ/capita
Final Energy per Capita total 49.7 51.0 51.9 54.9 55.5 59.6 67.8 75.9 GJ/capita
Long-Term Equilibrium Energy Producer Prices
1990 2005 2020 2035 2050 2065 2080 2095 Units
global oil (w/o carbon charge) $27.6 $32.5 $39.6 $41.5 $43.9 $45.1 $46.7 $54.3 $/barrel (2005$)
global oil (w/ carbon charge) $27.6 $32.5 $46.4 $55.6 $73.6 $84.3 $85.4 $95.4 $/barrel (2005$)
domestic natural gas (w/o carbon charge) $3.3 $3.8 $4.3 $4.0 $4.3 $5.0 $5.4 $5.7 $/mmBTU (2005$)
domestic natural gas (w/ carbon charge) $3.3 $3.8 $5.1 $5.7 $7.9 $9.7 $9.9 $10.3 $/mmBTU (2005$)
domestic coal (w/o carbon charge) $1.7 $1.7 $1.7 $1.7 $1.6 $1.6 $1.6 $1.6 $/GJ (2005$)
domestic coal (w/ carbon charge) $1.7 $1.7 $3.3 $4.8 $8.2 $10.2 $9.9 $10.1 $/GJ (2005$)
domestic electricity (w/ carbon charge) 6.21 5.75 6.59 6.77 6.88 6.85 6.67 6.75 cents/kWh (2005$)
carbon price 0.0 0.0 55.7 115.9 240.8 313.5 304.0 311.8 $/tC (2005$)
Crop Prices
1990 2005 2020 2035 2050 2065 2080 2095 Units
global corn 33 33 43 49 57 60 56 53 $/Gcal (2005$)
global rice 32 32 46 51 63 65 56 48 $/Gcal (2005$)
global wheat 27 27 43 51 64 66 56 49 $/Gcal (2005$)
Emissions by Sectors
1990 2005 2020 2035 2050 2065 2080 2095 Units
buildings 0.858 0.860 0.932 0.934 0.758 0.707 0.737 0.696 GtC/yr
industry 1.623 1.706 1.688 1.631 0.999 0.841 0.914 0.833 GtC/yr
transportation 1.354 1.863 2.107 2.439 2.382 2.455 2.834 2.854 GtC/yr
electricity 1.909 2.848 3.273 3.194 0.662 -0.666 -1.227 -1.394 GtC/yr
cement 0.261 0.483 0.658 0.713 0.322 0.203 0.212 0.181 GtC/yr
emissions reduction 0.000 0.000 1.607 4.352 11.001 15.396 18.145 21.128 GtC/yr
total: w/o reduction 6.006 7.760 8.659 8.912 5.124 3.540 3.470 3.170 GtC/yr

Scenario: bioccs stab Page 60
Final Energy Consumption: Buildings Final Energy Consumption: Industry (Does not Include Feedstocks)
Final Energy Consumption: Transportation Final Energy Consumption by Sector
0
50
100
150
200
250
300
1990 2005 2020 2035 2050 2065 2080 2095
EJ
/yr
liquids gascoal biomasselectricity trad biomassenergy reduction
0
50
100
150
200
250
300
350
400
1990 2005 2020 2035 2050 2065 2080 2095
EJ
/yr
liquids gas
coal biomass
electricity hydrogen
energy reduction feedstocks
0
50
100
150
200
250
300
1990 2005 2020 2035 2050 2065 2080 2095
EJ
/yr
liquids gas
coal electricity
hydrogen energy reduction
0
100
200
300
400
500
600
700
800
900
1990 2005 2020 2035 2050 2065 2080 2095
EJ
/yr
buildings industry
transportation energy reduction

Scenario: bioccs stab Page 61
Primary Energy Consumption Electricity Production by Fuel: CCS Focus
Hydrogen Production by Fuel Electricity Production by Fuel: Renewable Focus
-50
0
50
100
150
200
250
300
350
400
1990 2005 2020 2035 2050 2065 2080 2095
EJ
/yr
liquids liquids w/CCS
gas gas w/ccs
coal coal w/ccs
biomass biomass w/ccs
nuclear hydro
wind solar
geothermal energy reduction
-50
-40
-30
-20
-10
0
10
20
30
40
50
60
70
80
1990 2005 2020 2035 2050 2065 2080 2095
EJ
/yr
gas gas w/ccs
coal coal w/ccs
biomass biomass w/ccs
nuclear bulk electricity
wind solar
energy reduction
-50
0
50
100
150
200
250
300
350
400
1990 2005 2020 2035 2050 2065 2080 2095
EJ
/yr
liquids gascoal biomassnuclear hydrowind w/ backup wind w/ storagecsp w/ backup csp w/ storagepv w/ backup pv w/ storagerooftop solar w/ backup geothermalenergy reduction
0
200
400
600
800
1,000
1,200
1,400
1,600
1990 2005 2020 2035 2050 2065 2080 2095
EJ
/yr
oil w/o ccs oil w/ ccsnatural gas w/o ccs natural gas w/ ccscoal w/o ccs coal w/ ccsbiomass w/o ccs biomass w/ ccsnuclear hydrowind solargeothermal energy reduction

Scenario: bioccs stab Page 62
Industrial Liquids Production by Fuel (Feedstocks and Fuel) Transportation Fuels Composition
Final Energy Intensity Final Energy per Capita
0
50
100
150
200
250
300
1990 2005 2020 2035 2050 2065 2080 2095
EJ
/yr
conventional oil unconventional oilcoal liquids coal liquids w/ ccs bio fuels gas liquidsgas coalelectricity hydrogenenergy reduction
0
10
20
30
40
50
60
70
80
90
1990 2005 2020 2035 2050 2065 2080 2095
EJ
/yr
conventional oil unconventional oilcoal liquids coal liquids w/ ccs bio fuels gas liquidsenergy reduction
0
2
4
6
8
10
12
1990 2005 2020 2035 2050 2065 2080 2095
GJ
/10
00
$ (
20
05
$)
0
50
100
150
200
250
300
350
Re
fere
nc
e G
DP
(T
rillio
n 2
00
5$
)
building
industry
transportation
total
reference GDP
0
10
20
30
40
50
60
70
80
1990 2005 2020 2035 2050 2065 2080 2095
GJ
/ca
pit
a
0
1
2
3
4
5
6
7
8
9
10
Po
pu
lati
on
(b
illio
n)
building
industry
transportation
total
population

Scenario: bioccs stab Page 63
Dedicated Energy Crops, Waste Biomass, and Municipal Solid Waste Consumption by Sector Land Use by Type
Biomass Production by Source CO2 Emissions by Sector
-125
-100
-75
-50
-25
0
25
50
75
100
125
150
175
200
225
250
1990 2005 2020 2035 2050 2065 2080 2095
EJ
/yr
energy reductionsynthetic gashydrogenrefined liquids: tran & bldgelectricityIndustrydirect buildings
0
2
4
6
8
10
12
14
16
1990 2005 2020 2035 2050 2065 2080 2095
Billio
n H
ec
tare
s
urban land cropspasture managed forestbioenergy crops unmanaged forestunmanaged land rock/ice/desert/tundra
-125
-100
-75
-50
-25
0
25
50
75
100
125
150
175
200
225
250
1990 2005 2020 2035 2050 2065 2080 2095
EJ
/yr
reduction in municipal solid wate
reduction in biomass crops
waste biomass
municipal solid waste
dedicated biomass crops
waste biomass
-5
0
5
10
15
20
25
1990 2005 2020 2035 2050 2065 2080 2095
GtC
/yr
buildings industry
transportation electricity
cement emissions reduction

Scenario: re stab Page 64
Final Energy Consumption
1990 2005 2020 2035 2050 2065 2080 2095 Units
building liquids 15.2 16.4 18.8 20.3 18.8 14.2 13.9 14.1 EJ/yr
building gas 18.7 26.7 27.3 26.6 22.6 15.4 14.3 13.0 EJ/yr
building coal 10.1 5.1 4.3 2.7 1.1 0.3 0.2 0.2 EJ/yr
building biomass 4.5 5.5 9.0 9.3 7.2 3.7 3.0 2.5 EJ/yr
building electricity 16.9 29.0 39.7 56.4 71.9 91.9 117.7 143.2 EJ/yr
building trad biomass 23.5 29.9 33.3 30.7 27.0 22.3 15.9 10.4 EJ/yr
building energy reduction 0.0 0.0 10.4 20.6 38.7 61.5 69.6 72.8 EJ/yr
total: w/o reduction 88.9 112.7 132.4 146.1 148.6 147.7 165.0 183.2 EJ/yr
industry liquids 22.4 21.2 20.3 21.5 19.8 14.0 12.7 11.4 EJ/yr
industry gas 26.6 30.5 29.1 27.5 19.4 11.0 10.4 9.7 EJ/yr
industry coal 31.4 35.8 27.0 18.1 8.5 2.3 1.9 1.6 EJ/yr
industry biomass 7.3 11.2 28.7 41.4 44.4 30.6 27.7 27.7 EJ/yr
industry electricity 18.1 24.8 34.3 51.5 70.5 99.3 117.3 135.3 EJ/yr
industry hydrogen 0.0 0.0 3.1 3.6 4.3 4.3 4.5 4.9 EJ/yr
industry energy reduction 0.0 0.0 25.5 53.1 89.4 129.0 137.5 138.4 EJ/yr
industry feedstocks 15.2 23.7 24.7 27.3 28.0 28.3 30.4 32.7 EJ/yr
total: w/o reduction 105.8 123.6 142.4 163.6 166.9 161.6 174.6 190.5 EJ/yr
transportation liquids 62.7 87.7 96.6 109.9 111.8 98.9 106.1 112.5 EJ/yr
transportation gas 2.2 3.0 5.9 10.8 14.8 16.3 20.0 22.9 EJ/yr
transportation coal 0.5 0.2 0.1 0.1 0.0 0.0 0.0 0.0 EJ/yr
transportation electricity 1.0 1.0 2.2 5.2 13.1 25.4 33.3 40.0 EJ/yr
transportation hydrogen 0.0 0.0 0.6 2.2 6.0 10.7 16.0 22.1 EJ/yr
transportation energy reduction 0.0 0.0 5.3 12.3 26.0 50.4 59.8 61.9 EJ/yr
total: w/o reduction 66.4 91.8 105.4 128.1 145.7 151.3 175.4 197.4 EJ/yr
total final energy buildings 88.9 112.7 132.4 146.1 148.6 147.7 165.0 183.2 EJ/yr
total final energy industry 105.8 123.6 142.4 163.6 166.9 161.6 174.6 190.5 EJ/yr
total final energy transportation 66.4 91.8 105.4 128.1 145.7 151.3 175.4 197.4 EJ/yr
total final energy energy reduction 0.0 0.0 41.2 85.9 154.1 240.9 266.9 273.1 EJ/yr
total: w/o reduction 261.1 328.1 380.2 437.8 461.3 460.6 515.0 571.2 EJ/yr
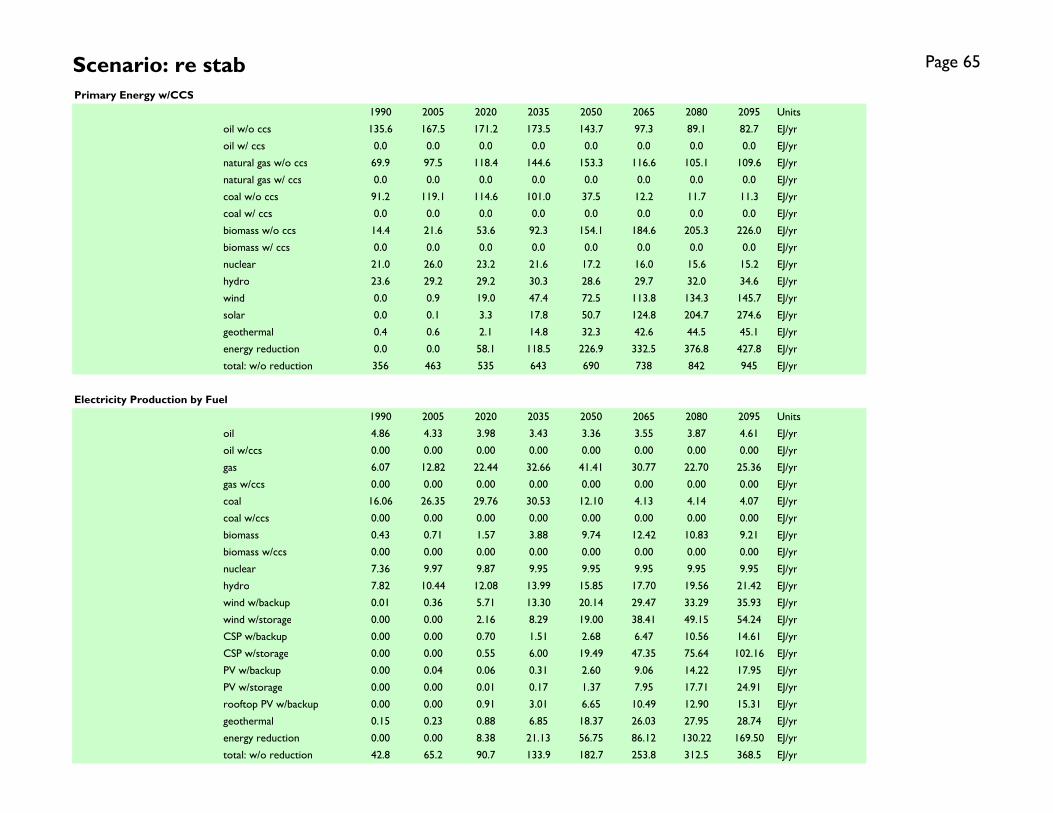
Scenario: re stab Page 65
Primary Energy w/CCS
1990 2005 2020 2035 2050 2065 2080 2095 Units
oil w/o ccs 135.6 167.5 171.2 173.5 143.7 97.3 89.1 82.7 EJ/yr
oil w/ ccs 0.0 0.0 0.0 0.0 0.0 0.0 0.0 0.0 EJ/yr
natural gas w/o ccs 69.9 97.5 118.4 144.6 153.3 116.6 105.1 109.6 EJ/yr
natural gas w/ ccs 0.0 0.0 0.0 0.0 0.0 0.0 0.0 0.0 EJ/yr
coal w/o ccs 91.2 119.1 114.6 101.0 37.5 12.2 11.7 11.3 EJ/yr
coal w/ ccs 0.0 0.0 0.0 0.0 0.0 0.0 0.0 0.0 EJ/yr
biomass w/o ccs 14.4 21.6 53.6 92.3 154.1 184.6 205.3 226.0 EJ/yr
biomass w/ ccs 0.0 0.0 0.0 0.0 0.0 0.0 0.0 0.0 EJ/yr
nuclear 21.0 26.0 23.2 21.6 17.2 16.0 15.6 15.2 EJ/yr
hydro 23.6 29.2 29.2 30.3 28.6 29.7 32.0 34.6 EJ/yr
wind 0.0 0.9 19.0 47.4 72.5 113.8 134.3 145.7 EJ/yr
solar 0.0 0.1 3.3 17.8 50.7 124.8 204.7 274.6 EJ/yr
geothermal 0.4 0.6 2.1 14.8 32.3 42.6 44.5 45.1 EJ/yr
energy reduction 0.0 0.0 58.1 118.5 226.9 332.5 376.8 427.8 EJ/yr
total: w/o reduction 356 463 535 643 690 738 842 945 EJ/yr
Electricity Production by Fuel
1990 2005 2020 2035 2050 2065 2080 2095 Units
oil 4.86 4.33 3.98 3.43 3.36 3.55 3.87 4.61 EJ/yr
oil w/ccs 0.00 0.00 0.00 0.00 0.00 0.00 0.00 0.00 EJ/yr
gas 6.07 12.82 22.44 32.66 41.41 30.77 22.70 25.36 EJ/yr
gas w/ccs 0.00 0.00 0.00 0.00 0.00 0.00 0.00 0.00 EJ/yr
coal 16.06 26.35 29.76 30.53 12.10 4.13 4.14 4.07 EJ/yr
coal w/ccs 0.00 0.00 0.00 0.00 0.00 0.00 0.00 0.00 EJ/yr
biomass 0.43 0.71 1.57 3.88 9.74 12.42 10.83 9.21 EJ/yr
biomass w/ccs 0.00 0.00 0.00 0.00 0.00 0.00 0.00 0.00 EJ/yr
nuclear 7.36 9.97 9.87 9.95 9.95 9.95 9.95 9.95 EJ/yr
hydro 7.82 10.44 12.08 13.99 15.85 17.70 19.56 21.42 EJ/yr
wind w/backup 0.01 0.36 5.71 13.30 20.14 29.47 33.29 35.93 EJ/yr
wind w/storage 0.00 0.00 2.16 8.29 19.00 38.41 49.15 54.24 EJ/yr
CSP w/backup 0.00 0.00 0.70 1.51 2.68 6.47 10.56 14.61 EJ/yr
CSP w/storage 0.00 0.00 0.55 6.00 19.49 47.35 75.64 102.16 EJ/yr
PV w/backup 0.00 0.04 0.06 0.31 2.60 9.06 14.22 17.95 EJ/yr
PV w/storage 0.00 0.00 0.01 0.17 1.37 7.95 17.71 24.91 EJ/yr
rooftop PV w/backup 0.00 0.00 0.91 3.01 6.65 10.49 12.90 15.31 EJ/yr
geothermal 0.15 0.23 0.88 6.85 18.37 26.03 27.95 28.74 EJ/yr
energy reduction 0.00 0.00 8.38 21.13 56.75 86.12 130.22 169.50 EJ/yr
total: w/o reduction 42.8 65.2 90.7 133.9 182.7 253.8 312.5 368.5 EJ/yr

Scenario: re stab Page 66
Transportation Fuels Production by Fuel
1990 2005 2020 2035 2050 2065 2080 2095 Units
conventional oil 62.5 86.8 90.4 92.5 76.3 51.4 47.7 44.2 EJ/yr
unconventional oil 0.0 0.0 1.0 2.8 4.1 3.1 2.9 2.6 EJ/yr
coal liquids 0.0 0.0 0.2 0.2 0.0 0.0 0.0 0.0 EJ/yr
coal liquids w/ ccs 0.0 0.0 0.0 0.0 0.0 0.0 0.0 0.0 EJ/yr
bio fuels 0.2 0.9 3.8 10.5 26.0 40.4 52.5 63.5 EJ/yr
gas liquids 0.0 0.0 1.3 3.9 5.3 4.0 3.0 2.3 EJ/yr
gas 2.2 3.0 5.9 10.8 14.8 16.3 20.0 22.9 EJ/yr
coal 0.5 0.2 0.1 0.1 0.0 0.0 0.0 0.0 EJ/yr
electricity 1.0 1.0 2.2 5.2 13.1 25.4 33.3 40.0 EJ/yr
hydrogen 0.0 0.0 0.6 2.2 6.0 10.7 16.0 22.1 EJ/yr
energy reduction 0.0 0.0 5.3 12.3 26.0 50.4 59.8 61.9 EJ/yr
total: w/o reduction 66.4 91.8 105.4 128.1 145.7 151.3 175.4 197.4 EJ/yr
Industrial Liquids Production by Fuel
1990 2005 2020 2035 2050 2065 2080 2095 Units
conventional oil 36.59 43.88 42.71 43.41 35.64 23.84 21.17 18.87 EJ/yr
unconventional oil 0.00 0.00 0.21 0.52 0.58 0.14 0.28 0.24 EJ/yr
coal liquids 0.00 0.00 0.02 0.02 0.00 0.00 0.00 0.00 EJ/yr
coal liquids w/ ccs 0.00 0.00 0.00 0.00 0.00 0.00 0.00 0.00 EJ/yr
bio fuels 0.01 0.05 0.70 2.74 9.26 16.47 20.18 23.83 EJ/yr
gas liquids 0.00 0.00 0.30 1.09 1.41 0.99 0.63 0.40 EJ/yr
energy reduction 0.0 0.0 3.3 8.8 18.1 36.4 41.2 37.6 EJ/yr
total: w/o reduction 36.6 43.9 44.0 47.8 46.9 41.4 42.3 43.3 EJ/yr
Hydrogen Production by Fuel
1990 2005 2020 2035 2050 2065 2080 2095 Units
gas 0.00 0.00 2.68 4.29 7.58 9.78 12.45 14.51 EJ/yr
gas w/ccs 0.00 0.00 0.00 0.00 0.00 0.00 0.00 0.00 EJ/yr
coal 0.00 0.00 0.37 0.40 0.42 0.31 0.41 0.52 EJ/yr
coal w/ccs 0.00 0.00 0.00 0.00 0.00 0.00 0.00 0.00 EJ/yr
biomass 0.00 0.00 0.30 0.55 1.08 1.35 1.71 2.25 EJ/yr
biomass w/ccs 0.00 0.00 0.00 0.00 0.00 0.00 0.00 0.00 EJ/yr
nuclear 0.00 0.00 0.00 0.00 0.00 0.00 0.00 0.00 EJ/yr
bulk electricity 0.00 0.00 0.09 0.20 0.46 1.04 1.57 2.18 EJ/yr
wind 0.00 0.00 0.10 0.11 0.23 0.56 0.85 1.31 EJ/yr
solar 0.00 0.00 0.10 0.19 0.60 1.92 3.60 6.16 EJ/yr
energy reduction 0.00 0.00 -0.40 -0.51 -1.00 -0.72 -0.61 0.80 EJ/yr
total: w/o reduction 0.00 0.00 3.64 5.74 10.37 14.97 20.59 26.92 EJ/yr

Scenario: re stab Page 67
Dedicated Bioenergy Crops, Crop Residues, and Municipal Solid Waste Consumption by Sector
1990 2005 2020 2035 2050 2065 2080 2095 Units
direct buildings 4.5 5.5 9.0 9.3 7.2 3.7 3.0 2.5 EJ/yr
Industry 7.4 11.3 30.2 46.9 62.5 61.9 65.3 70.7 EJ/yr
electricity 2.1 2.5 4.4 9.8 22.8 28.1 23.3 19.6 EJ/yr
refined liquids: tran & bldg 0.5 2.2 9.4 25.0 59.4 88.1 110.3 128.8 EJ/yr
hydrogen 0.0 0.0 0.7 1.2 2.2 2.8 3.4 4.4 EJ/yr
synthetic gas 0.0 0.0 0.0 0.0 0.0 0.0 0.0 0.0 EJ/yr
energy reduction 0.0 0.0 -21.5 -48.5 -93.9 -101.0 -104.0 -96.0 EJ/yr
total: w/o reduction 14.4 21.6 53.6 92.3 154.1 184.6 205.3 226.0 EJ/yr
Biomass Production
1990 2005 2020 2035 2050 2065 2080 2095 Units
waste biomass 14.4 21.5 23.2 45.5 77.4 85.7 86.4 84.8 EJ
dedicated biomass crops 0.0 0.0 30.4 44.2 60.8 77.1 89.4 102.8 EJ
municipal solid waste 0.0 0.1 0.1 2.6 16.3 22.2 29.5 38.4 EJ
waste biomass 0.0 0.0 8.5 -7.6 -35.7 -40.4 -39.3 -35.5 EJ
reduction in biomass crops 0.0 0.0 -30.4 -39.2 -44.1 -42.3 -40.7 -32.4 EJ
reduction in municipal solid wate 0.0 0.0 0.4 -1.6 -14.5 -18.8 -24.0 -28.0 EJ
total: w/o reduction 14.4 21.6 31.7 45.4 74.8 102.4 125.3 158.1 EJ
Arable Land Use by Type
1990 2005 2020 2035 2050 2065 2080 2095 Units
urban land 0.05 0.05 0.05 0.05 0.05 0.05 0.05 0.05 billion Ha
crops 1.20 1.21 0.85 0.72 0.59 0.49 0.44 0.38 billion Ha
pasture 0.70 0.73 0.71 0.71 0.70 0.69 0.69 0.69 billion Ha
managed forest 0.69 0.74 0.84 0.92 0.97 0.96 0.95 0.96 billion Ha
bioenergy crops 0.00 0.00 0.15 0.22 0.30 0.38 0.42 0.46 billion Ha
unmanaged forest 3.32 3.25 3.98 3.94 3.93 3.95 3.96 3.96 billion Ha
unmanaged land 4.58 4.58 3.99 4.00 4.02 4.03 4.04 4.05 billion Ha
rock/ice/desert/tundra 2.62 2.62 2.62 2.62 2.62 2.62 2.62 2.62 billion Ha
total 10.50 10.50 10.50 10.50 10.50 10.50 10.50 10.50 billion Ha

Scenario: re stab Page 68
Population, GDP, and Energy Indicators
1990 2005 2020 2035 2050 2065 2080 2095 Units
Economic Activity reference GDP $26.1 $39.4 $57.2 $81.5 $114.8 $160.0 $224.9 $308.0 trillion 2005$
Final Energy Intensity building 3.41 2.86 2.32 1.79 1.29 0.92 0.73 0.59 GJ/1000$ (2005$)
Final Energy Intensity industry 4.06 3.14 2.49 2.01 1.45 1.01 0.78 0.62 GJ/1000$ (2005$)
Final Energy Intensity transportation 2.55 2.33 1.84 1.57 1.27 0.95 0.78 0.64 GJ/1000$ (2005$)
Final Energy Intensity total 10.01 8.33 6.65 5.37 4.02 2.88 2.29 1.85 GJ/1000$ (2005$)
Population population 5.2 6.4 7.5 8.3 8.8 9.1 9.0 8.7 billion
Final Energy per Capita building 16.9 17.5 17.6 17.5 16.9 16.3 18.3 20.9 GJ/capita
Final Energy per Capita industry 20.2 19.2 18.9 19.6 18.9 17.8 19.4 21.8 GJ/capita
Final Energy per Capita transportation 12.7 14.3 14.0 15.4 16.5 16.7 19.5 22.6 GJ/capita
Final Energy per Capita total 49.7 51.0 50.5 52.5 52.3 50.8 57.2 65.3 GJ/capita
Long-Term Equilibrium Energy Producer Prices
1990 2005 2020 2035 2050 2065 2080 2095 Units
global oil (w/o carbon charge) $27.6 $32.5 $39.6 $40.9 $42.9 $42.8 $41.9 $40.6 $/barrel (2005$)
global oil (w/ carbon charge) $27.6 $32.5 $49.7 $62.0 $87.0 $134.5 $141.6 $146.8 $/barrel (2005$)
domestic natural gas (w/o carbon charge) $3.3 $3.8 $4.3 $3.9 $4.1 $4.2 $4.3 $4.2 $/mmBTU (2005$)
domestic natural gas (w/ carbon charge) $3.3 $3.8 $5.5 $6.5 $9.5 $15.4 $16.5 $17.2 $/mmBTU (2005$)
domestic coal (w/o carbon charge) $1.7 $1.7 $1.7 $1.6 $1.5 $1.4 $1.3 $1.2 $/GJ (2005$)
domestic coal (w/ carbon charge) $1.7 $1.7 $4.0 $6.4 $11.4 $21.9 $23.6 $24.9 $/GJ (2005$)
domestic electricity (w/ carbon charge) 6.21 5.74 6.83 6.73 7.74 8.80 8.65 8.56 cents/kWh (2005$)
carbon price 0.0 0.0 83.5 173.6 361.0 750.5 815.2 868.6 $/tC (2005$)
Crop Prices
1990 2005 2020 2035 2050 2065 2080 2095 Units
global corn 33 33 47 55 66 84 81 74 $/Gcal (2005$)
global rice 32 32 53 61 78 107 92 73 $/Gcal (2005$)
global wheat 27 27 51 63 82 113 98 81 $/Gcal (2005$)
Emissions by Sectors
1990 2005 2020 2035 2050 2065 2080 2095 Units
buildings 0.858 0.860 0.887 0.837 0.653 0.400 0.354 0.315 GtC/yr
industry 1.623 1.706 1.509 1.293 0.788 0.234 0.108 -0.018 GtC/yr
transportation 1.354 1.863 2.054 2.293 2.109 1.590 1.576 1.551 GtC/yr
electricity 1.909 2.848 3.089 3.169 1.878 1.101 0.910 0.980 GtC/yr
cement 0.261 0.483 0.578 0.641 0.592 0.475 0.429 0.387 GtC/yr
emissions reduction 0.000 0.000 2.149 5.030 10.106 15.137 18.238 21.084 GtC/yr
total: w/o reduction 6.005 7.759 8.117 8.234 6.019 3.799 3.377 3.214 GtC/yr

Scenario: re stab Page 69
Final Energy Consumption: Buildings Final Energy Consumption: Industry (Does not Include Feedstocks)
Final Energy Consumption: Transportation Final Energy Consumption by Sector
0
50
100
150
200
250
300
1990 2005 2020 2035 2050 2065 2080 2095
EJ
/yr
liquids gascoal biomasselectricity trad biomassenergy reduction
0
50
100
150
200
250
300
350
400
1990 2005 2020 2035 2050 2065 2080 2095
EJ
/yr
liquids gas
coal biomass
electricity hydrogen
energy reduction feedstocks
0
50
100
150
200
250
300
1990 2005 2020 2035 2050 2065 2080 2095
EJ
/yr
liquids gas
coal electricity
hydrogen energy reduction
0
100
200
300
400
500
600
700
800
900
1990 2005 2020 2035 2050 2065 2080 2095
EJ
/yr
buildings industry
transportation energy reduction

Scenario: re stab Page 70
Primary Energy Consumption Electricity Production by Fuel: CCS Focus
Hydrogen Production by Fuel Electricity Production by Fuel: Renewable Focus
-50
0
50
100
150
200
250
300
350
400
1990 2005 2020 2035 2050 2065 2080 2095
EJ
/yr
liquids liquids w/CCS
gas gas w/ccs
coal coal w/ccs
biomass biomass w/ccs
nuclear hydro
wind solar
geothermal energy reduction
-50
-40
-30
-20
-10
0
10
20
30
40
50
60
70
80
1990 2005 2020 2035 2050 2065 2080 2095
EJ
/yr
gas gas w/ccs
coal coal w/ccs
biomass biomass w/ccs
nuclear bulk electricity
wind solar
energy reduction
-50
0
50
100
150
200
250
300
350
400
1990 2005 2020 2035 2050 2065 2080 2095
EJ
/yr
liquids gascoal biomassnuclear hydrowind w/ backup wind w/ storagecsp w/ backup csp w/ storagepv w/ backup pv w/ storagerooftop solar w/ backup geothermalenergy reduction
0
200
400
600
800
1,000
1,200
1,400
1,600
1990 2005 2020 2035 2050 2065 2080 2095
EJ
/yr
oil w/o ccs oil w/ ccsnatural gas w/o ccs natural gas w/ ccscoal w/o ccs coal w/ ccsbiomass w/o ccs biomass w/ ccsnuclear hydrowind solargeothermal energy reduction
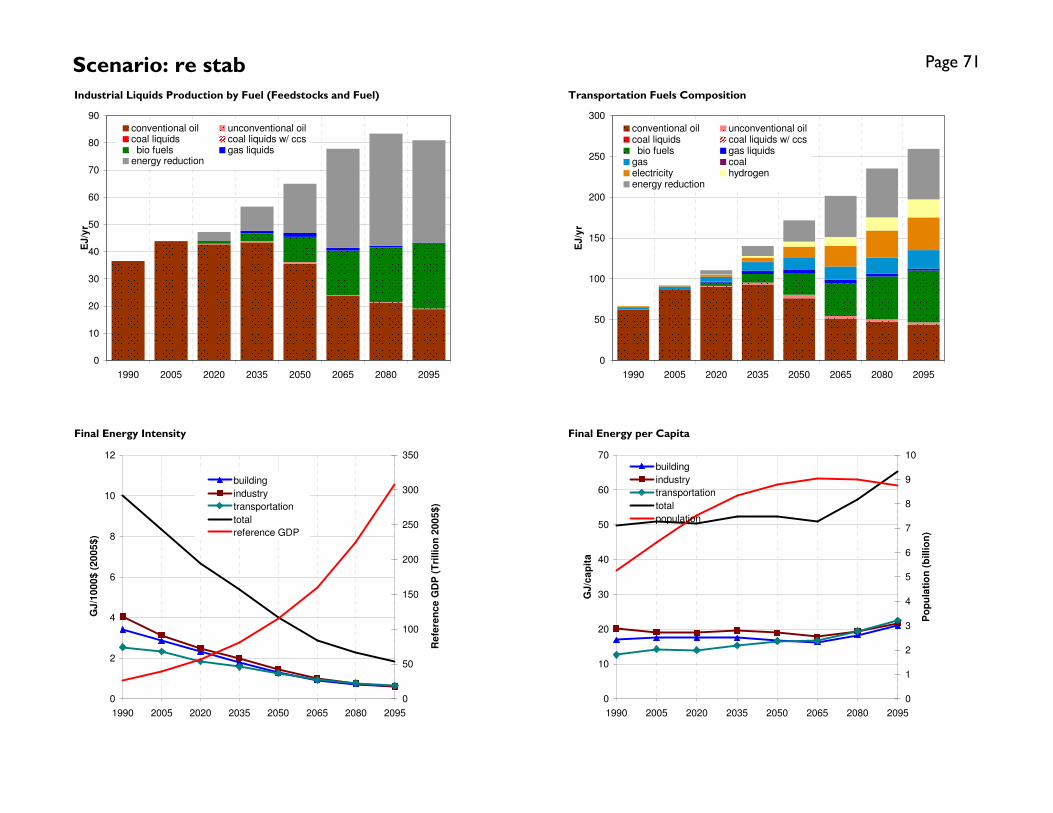
Scenario: re stab Page 71
Industrial Liquids Production by Fuel (Feedstocks and Fuel) Transportation Fuels Composition
Final Energy Intensity Final Energy per Capita
0
50
100
150
200
250
300
1990 2005 2020 2035 2050 2065 2080 2095
EJ
/yr
conventional oil unconventional oilcoal liquids coal liquids w/ ccs bio fuels gas liquidsgas coalelectricity hydrogenenergy reduction
0
10
20
30
40
50
60
70
80
90
1990 2005 2020 2035 2050 2065 2080 2095
EJ
/yr
conventional oil unconventional oilcoal liquids coal liquids w/ ccs bio fuels gas liquidsenergy reduction
0
2
4
6
8
10
12
1990 2005 2020 2035 2050 2065 2080 2095
GJ
/10
00
$ (
20
05
$)
0
50
100
150
200
250
300
350
Re
fere
nc
e G
DP
(T
rillio
n 2
00
5$
)
building
industry
transportation
total
reference GDP
0
10
20
30
40
50
60
70
1990 2005 2020 2035 2050 2065 2080 2095
GJ
/ca
pit
a
0
1
2
3
4
5
6
7
8
9
10
Po
pu
lati
on
(b
illio
n)
building
industry
transportation
total
population

Scenario: re stab Page 72
Dedicated Energy Crops, Waste Biomass, and Municipal Solid Waste Consumption by Sector Land Use by Type
Biomass Production by Source CO2 Emissions by Sector
-125
-100
-75
-50
-25
0
25
50
75
100
125
150
175
200
225
250
1990 2005 2020 2035 2050 2065 2080 2095
EJ
/yr
energy reductionsynthetic gashydrogenrefined liquids: tran & bldgelectricityIndustrydirect buildings
0
2
4
6
8
10
12
14
16
1990 2005 2020 2035 2050 2065 2080 2095
Billio
n H
ec
tare
s
urban land cropspasture managed forestbioenergy crops unmanaged forestunmanaged land rock/ice/desert/tundra
-125
-100
-75
-50
-25
0
25
50
75
100
125
150
175
200
225
250
1990 2005 2020 2035 2050 2065 2080 2095
EJ
/yr
reduction in municipal solid wate
reduction in biomass crops
waste biomass
municipal solid waste
dedicated biomass crops
waste biomass
-5
0
5
10
15
20
25
1990 2005 2020 2035 2050 2065 2080 2095
GtC
/yr
buildings industry
transportation electricity
cement emissions reduction

Scenario: ee stab Page 73
Final Energy Consumption
1990 2005 2020 2035 2050 2065 2080 2095 Units
building liquids 15.2 16.4 18.1 17.3 15.6 11.3 11.2 10.1 EJ/yr
building gas 18.7 26.7 26.0 22.1 18.2 11.4 10.8 8.8 EJ/yr
building coal 10.1 5.1 4.5 2.6 1.1 0.2 0.2 0.1 EJ/yr
building biomass 4.5 5.5 8.4 7.8 6.4 3.0 2.5 1.9 EJ/yr
building electricity 16.9 29.0 39.3 47.7 54.5 59.1 68.5 74.6 EJ/yr
building trad biomass 23.5 29.9 32.3 27.0 22.6 18.2 11.2 6.6 EJ/yr
building energy reduction 0.0 0.0 14.3 42.1 69.0 106.0 130.2 154.0 EJ/yr
total: w/o reduction 88.9 112.7 128.6 124.5 118.4 103.2 104.5 102.0 EJ/yr
industry liquids 22.4 21.2 18.8 20.6 20.3 16.7 17.8 16.8 EJ/yr
industry gas 26.6 30.5 28.5 27.5 21.3 12.3 13.7 12.2 EJ/yr
industry coal 31.4 35.8 29.3 21.3 11.3 3.5 4.0 3.1 EJ/yr
industry biomass 7.3 11.2 25.5 37.5 48.1 37.0 37.9 36.9 EJ/yr
industry electricity 18.1 24.8 33.2 45.2 56.4 71.1 80.0 91.6 EJ/yr
industry hydrogen 0.0 0.0 2.7 3.0 3.9 4.5 5.0 5.3 EJ/yr
industry energy reduction 0.0 0.0 29.9 61.6 95.1 145.5 153.6 163.0 EJ/yr
industry feedstocks 15.2 23.7 24.4 26.7 27.3 25.6 27.4 28.3 EJ/yr
total: w/o reduction 105.8 123.6 138.0 155.1 161.2 145.0 158.5 166.0 EJ/yr
transportation liquids 62.7 87.6 89.4 81.0 73.4 58.1 57.9 56.6 EJ/yr
transportation gas 2.3 3.0 5.6 7.2 8.2 7.2 8.2 8.0 EJ/yr
transportation coal 0.5 0.2 0.2 0.1 0.0 0.0 0.0 0.0 EJ/yr
transportation electricity 1.0 1.0 2.9 7.9 12.2 17.0 18.7 20.4 EJ/yr
transportation hydrogen 0.0 0.0 1.0 6.5 13.2 20.6 27.1 31.4 EJ/yr
transportation energy reduction 0.0 0.0 11.7 37.7 64.8 98.8 123.4 142.9 EJ/yr
total: w/o reduction 66.5 91.9 99.0 102.7 106.9 102.9 111.9 116.5 EJ/yr
total final energy buildings 88.9 112.7 128.6 124.5 118.4 103.2 104.5 102.0 EJ/yr
total final energy industry 105.8 123.6 138.0 155.1 161.2 145.0 158.5 166.0 EJ/yr
total final energy transportation 66.5 91.9 99.0 102.7 106.9 102.9 111.9 116.5 EJ/yr
total final energy energy reduction 0.0 0.0 55.9 141.5 228.9 350.3 407.1 459.8 EJ/yr
total: w/o reduction 261.2 328.2 365.6 382.3 386.5 351.2 374.8 384.4 EJ/yr

Scenario: ee stab Page 74
Primary Energy w/CCS
1990 2005 2020 2035 2050 2065 2080 2095 Units
oil w/o ccs 135.6 167.5 162.6 147.9 116.5 71.7 67.8 57.7 EJ/yr
oil w/ ccs 0.0 0.0 0.0 0.0 0.0 0.0 0.0 0.0 EJ/yr
natural gas w/o ccs 70.0 97.6 115.9 136.5 147.2 121.2 126.6 122.3 EJ/yr
natural gas w/ ccs 0.0 0.0 0.0 0.0 0.0 0.0 0.0 0.0 EJ/yr
coal w/o ccs 91.2 119.1 122.4 114.1 70.1 16.7 16.1 17.0 EJ/yr
coal w/ ccs 0.0 0.0 0.0 0.0 0.0 0.0 0.0 0.0 EJ/yr
biomass w/o ccs 14.4 21.6 46.7 71.6 129.6 166.8 183.0 200.5 EJ/yr
biomass w/ ccs 0.0 0.0 0.0 0.0 0.0 0.0 0.0 0.0 EJ/yr
nuclear 21.0 26.1 23.5 21.7 17.8 16.0 15.5 15.1 EJ/yr
hydro 23.6 29.2 29.4 30.7 29.5 29.8 31.7 34.2 EJ/yr
wind 0.0 0.9 17.0 38.1 54.9 88.5 94.9 100.9 EJ/yr
solar 0.0 0.1 1.4 5.0 12.7 41.0 58.4 75.9 EJ/yr
geothermal 0.4 0.5 1.5 5.9 7.7 7.3 7.0 6.8 EJ/yr
energy reduction 0.0 0.0 72.4 190.3 330.9 511.2 618.1 742.4 EJ/yr
total: w/o reduction 356 463 520 571 586 559 601 630 EJ/yr
Electricity Production by Fuel
1990 2005 2020 2035 2050 2065 2080 2095 Units
oil 4.86 4.33 4.01 3.34 3.34 3.85 3.80 5.10 EJ/yr
oil w/ccs 0.00 0.00 0.00 0.00 0.00 0.00 0.00 0.00 EJ/yr
gas 6.07 12.82 22.43 32.46 42.05 38.30 39.85 41.85 EJ/yr
gas w/ccs 0.00 0.00 0.00 0.00 0.00 0.00 0.00 0.00 EJ/yr
coal 16.06 26.35 31.33 33.61 24.17 5.55 4.97 5.87 EJ/yr
coal w/ccs 0.00 0.00 0.00 0.00 0.00 0.00 0.00 0.00 EJ/yr
biomass 0.43 0.71 1.50 3.46 8.94 14.82 17.26 18.32 EJ/yr
biomass w/ccs 0.00 0.00 0.00 0.00 0.00 0.00 0.00 0.00 EJ/yr
nuclear 7.36 9.97 9.95 9.95 9.95 9.95 9.95 9.95 EJ/yr
hydro 7.82 10.44 12.13 13.99 15.85 17.70 19.56 21.42 EJ/yr
wind w/backup 0.01 0.36 5.38 11.97 17.53 27.35 28.66 30.08 EJ/yr
wind w/storage 0.00 0.00 1.58 5.11 10.73 24.04 28.72 31.52 EJ/yr
CSP w/backup 0.00 0.00 0.34 0.72 1.23 4.00 5.83 7.63 EJ/yr
CSP w/storage 0.00 0.00 0.13 1.25 3.98 13.19 19.04 24.64 EJ/yr
PV w/backup 0.00 0.04 0.05 0.05 0.41 2.46 4.09 5.13 EJ/yr
PV w/storage 0.00 0.00 0.01 0.04 0.22 1.35 2.47 3.20 EJ/yr
rooftop PV w/backup 0.00 0.00 0.33 0.97 2.53 5.46 6.32 6.88 EJ/yr
geothermal 0.13 0.21 0.63 2.74 4.32 4.46 4.45 4.44 EJ/yr
energy reduction 0.00 0.00 8.00 24.06 57.18 93.43 135.67 177.16 EJ/yr
total: w/o reduction 42.7 65.2 89.8 119.7 145.3 172.5 195.0 216.0 EJ/yr

Scenario: ee stab Page 75
Transportation Fuels Production by Fuel
1990 2005 2020 2035 2050 2065 2080 2095 Units
conventional oil 62.5 86.7 84.3 71.6 52.8 30.3 27.4 22.0 EJ/yr
unconventional oil 0.0 0.0 0.9 1.7 2.5 1.1 1.3 0.9 EJ/yr
coal liquids 0.0 0.0 0.2 0.2 0.0 0.0 0.0 0.0 EJ/yr
coal liquids w/ ccs 0.0 0.0 0.0 0.0 0.0 0.0 0.0 0.0 EJ/yr
bio fuels 0.2 0.9 2.8 5.0 14.6 24.5 27.6 32.9 EJ/yr
gas liquids 0.0 0.0 1.1 2.5 3.4 2.2 1.6 0.9 EJ/yr
gas 2.3 3.0 5.6 7.2 8.2 7.2 8.2 8.0 EJ/yr
coal 0.5 0.2 0.2 0.1 0.0 0.0 0.0 0.0 EJ/yr
electricity 1.0 1.0 2.9 7.9 12.2 17.0 18.7 20.4 EJ/yr
hydrogen 0.0 0.0 1.0 6.5 13.2 20.6 27.1 31.4 EJ/yr
energy reduction 0.0 0.0 11.7 37.7 64.8 98.8 123.4 142.9 EJ/yr
total: w/o reduction 66.5 91.9 99.0 102.7 106.9 102.9 111.9 116.5 EJ/yr
Industrial Liquids Production by Fuel
1990 2005 2020 2035 2050 2065 2080 2095 Units
conventional oil 36.59 43.88 41.18 43.11 36.58 23.46 23.66 19.11 EJ/yr
unconventional oil 0.00 0.00 0.21 0.46 0.54 0.06 0.23 0.13 EJ/yr
coal liquids 0.00 0.00 0.03 0.03 0.00 0.00 0.00 0.00 EJ/yr
coal liquids w/ ccs 0.00 0.00 0.00 0.00 0.00 0.00 0.00 0.00 EJ/yr
bio fuels 0.01 0.05 0.49 1.73 8.14 17.07 20.00 25.00 EJ/yr
gas liquids 0.00 0.00 0.30 1.02 1.39 0.91 0.59 0.28 EJ/yr
energy reduction 0.0 0.0 5.0 10.2 18.3 36.4 38.9 36.4 EJ/yr
total: w/o reduction 36.6 43.9 42.2 46.4 46.7 41.5 44.5 44.5 EJ/yr
Hydrogen Production by Fuel
1990 2005 2020 2035 2050 2065 2080 2095 Units
gas 0.00 0.00 2.79 7.20 12.79 16.99 21.72 22.43 EJ/yr
gas w/ccs 0.00 0.00 0.00 0.00 0.00 0.00 0.00 0.00 EJ/yr
coal 0.00 0.00 0.42 0.73 0.79 0.54 0.75 0.81 EJ/yr
coal w/ccs 0.00 0.00 0.00 0.00 0.00 0.00 0.00 0.00 EJ/yr
biomass 0.00 0.00 0.28 0.84 1.79 2.40 2.79 3.44 EJ/yr
biomass w/ccs 0.00 0.00 0.00 0.00 0.00 0.00 0.00 0.00 EJ/yr
nuclear 0.00 0.00 0.00 0.00 0.00 0.00 0.00 0.00 EJ/yr
bulk electricity 0.00 0.00 0.09 0.29 0.61 1.23 1.57 1.90 EJ/yr
wind 0.00 0.00 0.10 0.18 0.38 1.05 1.31 1.89 EJ/yr
solar 0.00 0.00 0.09 0.27 0.76 2.86 3.95 6.29 EJ/yr
energy reduction 0.00 0.00 -0.52 -4.28 -7.77 -10.81 -12.11 -9.03 EJ/yr
total: w/o reduction 0.00 0.00 3.77 9.52 17.13 25.06 32.09 36.76 EJ/yr
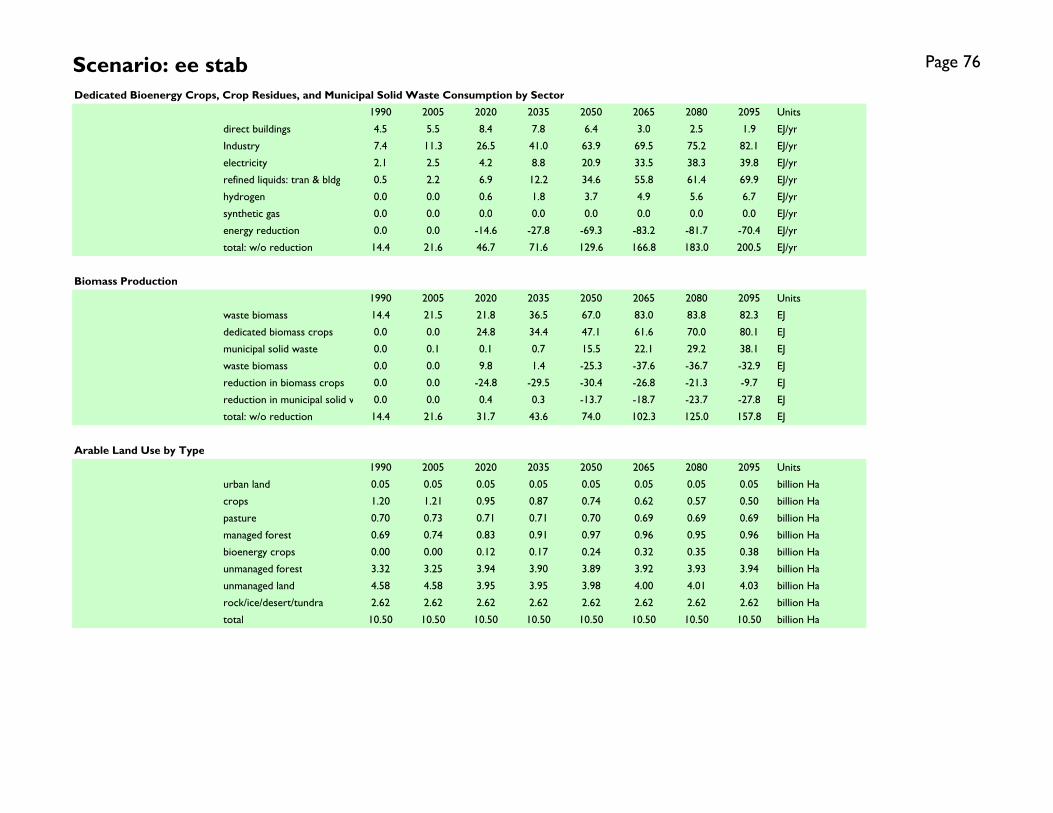
Scenario: ee stab Page 76
Dedicated Bioenergy Crops, Crop Residues, and Municipal Solid Waste Consumption by Sector
1990 2005 2020 2035 2050 2065 2080 2095 Units
direct buildings 4.5 5.5 8.4 7.8 6.4 3.0 2.5 1.9 EJ/yr
Industry 7.4 11.3 26.5 41.0 63.9 69.5 75.2 82.1 EJ/yr
electricity 2.1 2.5 4.2 8.8 20.9 33.5 38.3 39.8 EJ/yr
refined liquids: tran & bldg 0.5 2.2 6.9 12.2 34.6 55.8 61.4 69.9 EJ/yr
hydrogen 0.0 0.0 0.6 1.8 3.7 4.9 5.6 6.7 EJ/yr
synthetic gas 0.0 0.0 0.0 0.0 0.0 0.0 0.0 0.0 EJ/yr
energy reduction 0.0 0.0 -14.6 -27.8 -69.3 -83.2 -81.7 -70.4 EJ/yr
total: w/o reduction 14.4 21.6 46.7 71.6 129.6 166.8 183.0 200.5 EJ/yr
Biomass Production
1990 2005 2020 2035 2050 2065 2080 2095 Units
waste biomass 14.4 21.5 21.8 36.5 67.0 83.0 83.8 82.3 EJ
dedicated biomass crops 0.0 0.0 24.8 34.4 47.1 61.6 70.0 80.1 EJ
municipal solid waste 0.0 0.1 0.1 0.7 15.5 22.1 29.2 38.1 EJ
waste biomass 0.0 0.0 9.8 1.4 -25.3 -37.6 -36.7 -32.9 EJ
reduction in biomass crops 0.0 0.0 -24.8 -29.5 -30.4 -26.8 -21.3 -9.7 EJ
reduction in municipal solid wate 0.0 0.0 0.4 0.3 -13.7 -18.7 -23.7 -27.8 EJ
total: w/o reduction 14.4 21.6 31.7 43.6 74.0 102.3 125.0 157.8 EJ
Arable Land Use by Type
1990 2005 2020 2035 2050 2065 2080 2095 Units
urban land 0.05 0.05 0.05 0.05 0.05 0.05 0.05 0.05 billion Ha
crops 1.20 1.21 0.95 0.87 0.74 0.62 0.57 0.50 billion Ha
pasture 0.70 0.73 0.71 0.71 0.70 0.69 0.69 0.69 billion Ha
managed forest 0.69 0.74 0.83 0.91 0.97 0.96 0.95 0.96 billion Ha
bioenergy crops 0.00 0.00 0.12 0.17 0.24 0.32 0.35 0.38 billion Ha
unmanaged forest 3.32 3.25 3.94 3.90 3.89 3.92 3.93 3.94 billion Ha
unmanaged land 4.58 4.58 3.95 3.95 3.98 4.00 4.01 4.03 billion Ha
rock/ice/desert/tundra 2.62 2.62 2.62 2.62 2.62 2.62 2.62 2.62 billion Ha
total 10.50 10.50 10.50 10.50 10.50 10.50 10.50 10.50 billion Ha

Scenario: ee stab Page 77
Population, GDP, and Energy Indicators
1990 2005 2020 2035 2050 2065 2080 2095 Units
Economic Activity reference GDP $26.1 $39.4 $57.2 $81.5 $114.5 $158.3 $223.4 $305.7 trillion 2005$
Final Energy Intensity building 3.41 2.86 2.25 1.53 1.03 0.65 0.47 0.33 GJ/1000$ (2005$)
Final Energy Intensity industry 4.06 3.14 2.41 1.90 1.41 0.92 0.71 0.54 GJ/1000$ (2005$)
Final Energy Intensity transportation 2.55 2.33 1.73 1.26 0.93 0.65 0.50 0.38 GJ/1000$ (2005$)
Final Energy Intensity total 10.02 8.33 6.39 4.69 3.38 2.22 1.68 1.26 GJ/1000$ (2005$)
Population population 5.2 6.4 7.5 8.3 8.8 9.1 9.0 8.7 billion
Final Energy per Capita building 16.9 17.5 17.1 14.9 13.4 11.4 11.6 11.7 GJ/capita
Final Energy per Capita industry 20.2 19.2 18.3 18.6 18.3 16.0 17.6 19.0 GJ/capita
Final Energy per Capita transportation 12.7 14.3 13.1 12.3 12.1 11.4 12.4 13.3 GJ/capita
Final Energy per Capita total 49.8 51.0 48.6 45.8 43.8 38.8 41.6 43.9 GJ/capita
Long-Term Equilibrium Energy Producer Prices
1990 2005 2020 2035 2050 2065 2080 2095 Units
global oil (w/o carbon charge) $27.6 $32.5 $39.5 $39.8 $41.6 $40.5 $39.6 $38.1 $/barrel (2005$)
global oil (w/ carbon charge) $27.6 $32.5 $47.5 $56.6 $76.8 $126.1 $119.8 $126.6 $/barrel (2005$)
domestic natural gas (w/o carbon charge) $3.3 $3.8 $4.2 $3.9 $4.1 $4.2 $4.4 $4.4 $/mmBTU (2005$)
domestic natural gas (w/ carbon charge) $3.3 $3.8 $5.2 $6.0 $8.4 $14.8 $14.2 $15.3 $/mmBTU (2005$)
domestic coal (w/o carbon charge) $1.7 $1.7 $1.7 $1.7 $1.6 $1.5 $1.4 $1.3 $/GJ (2005$)
domestic coal (w/ carbon charge) $1.7 $1.7 $3.5 $5.5 $9.5 $20.7 $19.4 $21.2 $/GJ (2005$)
domestic electricity (w/ carbon charge) 6.21 5.75 6.64 6.83 8.40 10.52 10.07 10.13 cents/kWh (2005$)
carbon price 0.0 0.0 66.8 138.8 288.8 706.0 660.0 730.0 $/tC (2005$)
Crop Prices
1990 2005 2020 2035 2050 2065 2080 2095 Units
global corn 33 33 47 57 71 103 92 87 $/Gcal (2005$)
global rice 32 32 53 67 91 149 118 99 $/Gcal (2005$)
global wheat 27 27 52 68 94 157 126 109 $/Gcal (2005$)
Emissions by Sectors
1990 2005 2020 2035 2050 2065 2080 2095 Units
buildings 0.858 0.860 0.863 0.726 0.548 0.303 0.280 0.214 GtC/yr
industry 1.623 1.706 1.511 1.362 0.923 0.333 0.332 0.159 GtC/yr
transportation 1.355 1.863 1.930 1.827 1.563 1.072 1.087 0.957 GtC/yr
electricity 1.909 2.849 3.229 3.417 2.683 1.362 1.319 1.433 GtC/yr
cement 0.261 0.483 0.607 0.655 0.604 0.471 0.452 0.406 GtC/yr
emissions reduction 0.000 0.000 2.125 5.276 9.803 15.396 18.145 21.129 GtC/yr
total: w/o reduction 6.007 7.761 8.140 7.988 6.321 3.540 3.470 3.170 GtC/yr
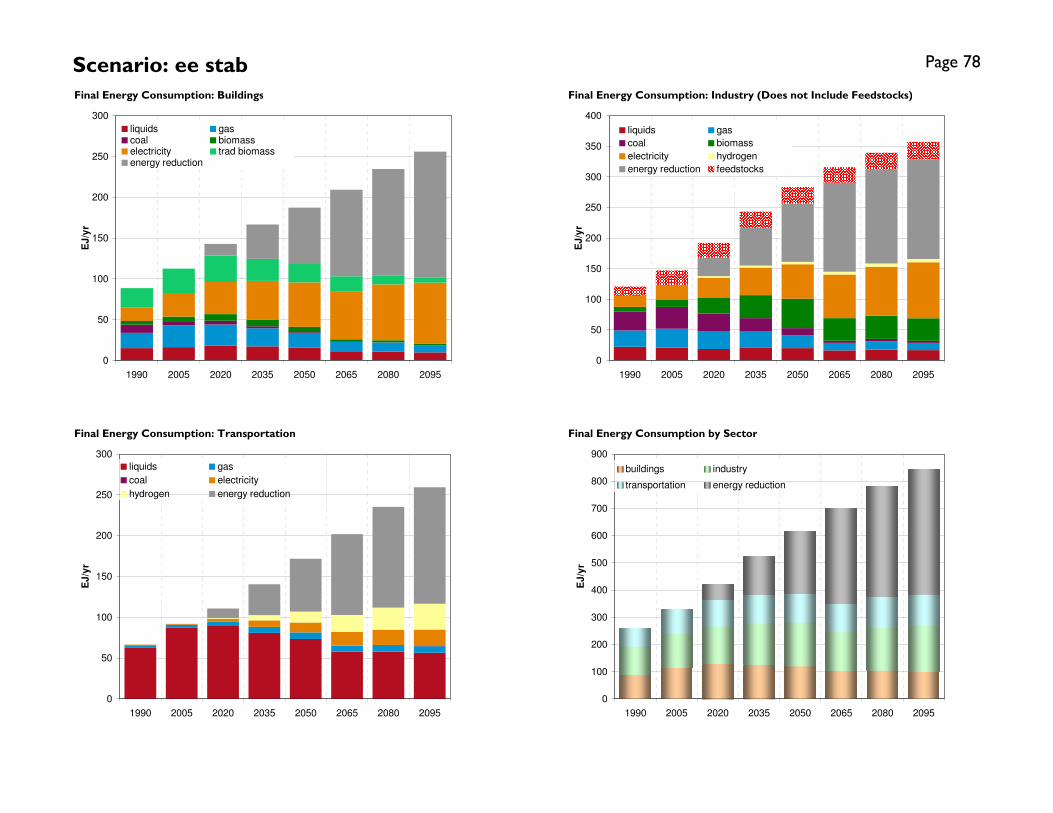
Scenario: ee stab Page 78
Final Energy Consumption: Buildings Final Energy Consumption: Industry (Does not Include Feedstocks)
Final Energy Consumption: Transportation Final Energy Consumption by Sector
0
50
100
150
200
250
300
1990 2005 2020 2035 2050 2065 2080 2095
EJ
/yr
liquids gascoal biomasselectricity trad biomassenergy reduction
0
50
100
150
200
250
300
350
400
1990 2005 2020 2035 2050 2065 2080 2095
EJ
/yr
liquids gas
coal biomass
electricity hydrogen
energy reduction feedstocks
0
50
100
150
200
250
300
1990 2005 2020 2035 2050 2065 2080 2095
EJ
/yr
liquids gas
coal electricity
hydrogen energy reduction
0
100
200
300
400
500
600
700
800
900
1990 2005 2020 2035 2050 2065 2080 2095
EJ
/yr
buildings industry
transportation energy reduction

Scenario: ee stab Page 79
Primary Energy Consumption Electricity Production by Fuel: CCS Focus
Hydrogen Production by Fuel Electricity Production by Fuel: Renewable Focus
-50
0
50
100
150
200
250
300
350
400
1990 2005 2020 2035 2050 2065 2080 2095
EJ
/yr
liquids liquids w/CCS
gas gas w/ccs
coal coal w/ccs
biomass biomass w/ccs
nuclear hydro
wind solar
geothermal energy reduction
-50
-40
-30
-20
-10
0
10
20
30
40
50
60
70
80
1990 2005 2020 2035 2050 2065 2080 2095
EJ
/yr
gas gas w/ccs
coal coal w/ccs
biomass biomass w/ccs
nuclear bulk electricity
wind solar
energy reduction
-50
0
50
100
150
200
250
300
350
400
1990 2005 2020 2035 2050 2065 2080 2095
EJ
/yr
liquids gascoal biomassnuclear hydrowind w/ backup wind w/ storagecsp w/ backup csp w/ storagepv w/ backup pv w/ storagerooftop solar w/ backup geothermalenergy reduction
0
200
400
600
800
1,000
1,200
1,400
1,600
1990 2005 2020 2035 2050 2065 2080 2095
EJ
/yr
oil w/o ccs oil w/ ccsnatural gas w/o ccs natural gas w/ ccscoal w/o ccs coal w/ ccsbiomass w/o ccs biomass w/ ccsnuclear hydrowind solargeothermal energy reduction

Scenario: ee stab Page 80
Industrial Liquids Production by Fuel (Feedstocks and Fuel) Transportation Fuels Composition
Final Energy Intensity Final Energy per Capita
0
50
100
150
200
250
300
1990 2005 2020 2035 2050 2065 2080 2095
EJ
/yr
conventional oil unconventional oilcoal liquids coal liquids w/ ccs bio fuels gas liquidsgas coalelectricity hydrogenenergy reduction
0
10
20
30
40
50
60
70
80
90
1990 2005 2020 2035 2050 2065 2080 2095
EJ
/yr
conventional oil unconventional oilcoal liquids coal liquids w/ ccs bio fuels gas liquidsenergy reduction
0
2
4
6
8
10
12
1990 2005 2020 2035 2050 2065 2080 2095
GJ
/10
00
$ (
20
05
$)
0
50
100
150
200
250
300
350
Re
fere
nc
e G
DP
(T
rillio
n 2
00
5$
)
building
industry
transportation
total
reference GDP
0
10
20
30
40
50
60
1990 2005 2020 2035 2050 2065 2080 2095
GJ
/ca
pit
a
0
1
2
3
4
5
6
7
8
9
10
Po
pu
lati
on
(b
illio
n)
building
industry
transportation
total
population

Scenario: ee stab Page 81
Dedicated Energy Crops, Waste Biomass, and Municipal Solid Waste Consumption by Sector Land Use by Type
Biomass Production by Source CO2 Emissions by Sector
-125
-100
-75
-50
-25
0
25
50
75
100
125
150
175
200
225
250
1990 2005 2020 2035 2050 2065 2080 2095
EJ
/yr
energy reductionsynthetic gashydrogenrefined liquids: tran & bldgelectricityIndustrydirect buildings
0
2
4
6
8
10
12
14
16
1990 2005 2020 2035 2050 2065 2080 2095
Billio
n H
ec
tare
s
urban land cropspasture managed forestbioenergy crops unmanaged forestunmanaged land rock/ice/desert/tundra
-125
-100
-75
-50
-25
0
25
50
75
100
125
150
175
200
225
250
1990 2005 2020 2035 2050 2065 2080 2095
EJ
/yr
reduction in municipal solid wate
reduction in biomass crops
waste biomass
municipal solid waste
dedicated biomass crops
waste biomass
-5
0
5
10
15
20
25
1990 2005 2020 2035 2050 2065 2080 2095
GtC
/yr
buildings industry
transportation electricity
cement emissions reduction
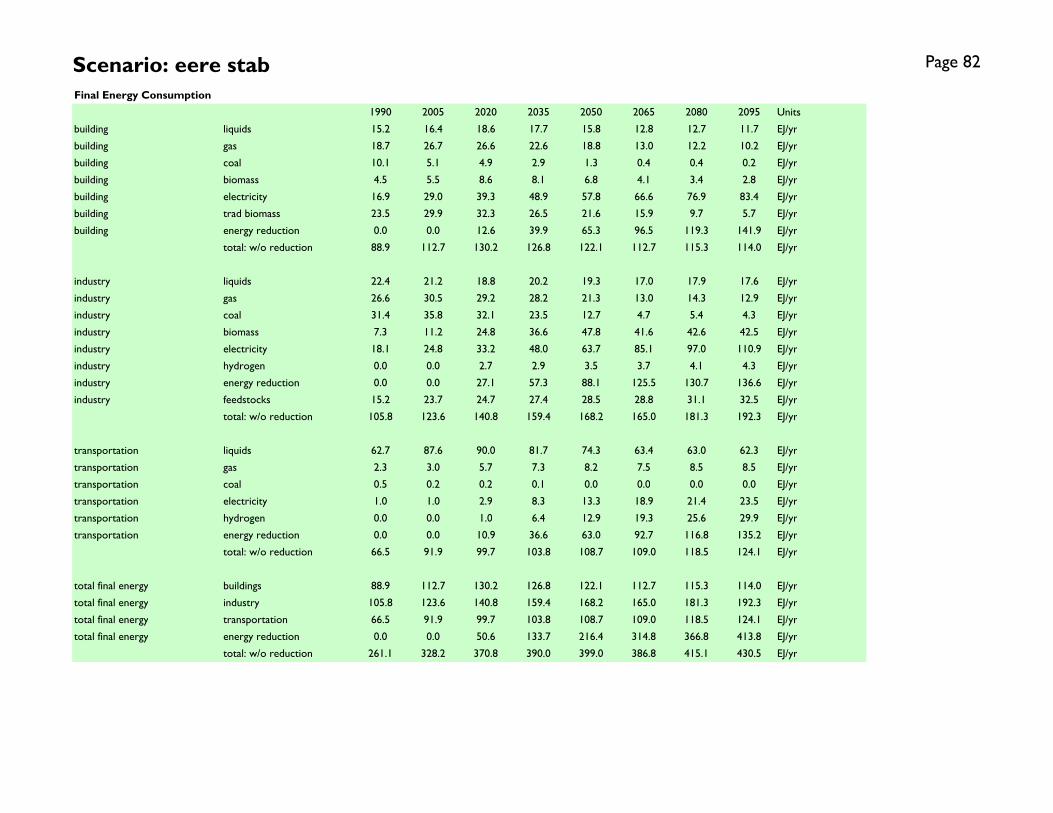
Scenario: eere stab Page 82
Final Energy Consumption
1990 2005 2020 2035 2050 2065 2080 2095 Units
building liquids 15.2 16.4 18.6 17.7 15.8 12.8 12.7 11.7 EJ/yr
building gas 18.7 26.7 26.6 22.6 18.8 13.0 12.2 10.2 EJ/yr
building coal 10.1 5.1 4.9 2.9 1.3 0.4 0.4 0.2 EJ/yr
building biomass 4.5 5.5 8.6 8.1 6.8 4.1 3.4 2.8 EJ/yr
building electricity 16.9 29.0 39.3 48.9 57.8 66.6 76.9 83.4 EJ/yr
building trad biomass 23.5 29.9 32.3 26.5 21.6 15.9 9.7 5.7 EJ/yr
building energy reduction 0.0 0.0 12.6 39.9 65.3 96.5 119.3 141.9 EJ/yr
total: w/o reduction 88.9 112.7 130.2 126.8 122.1 112.7 115.3 114.0 EJ/yr
industry liquids 22.4 21.2 18.8 20.2 19.3 17.0 17.9 17.6 EJ/yr
industry gas 26.6 30.5 29.2 28.2 21.3 13.0 14.3 12.9 EJ/yr
industry coal 31.4 35.8 32.1 23.5 12.7 4.7 5.4 4.3 EJ/yr
industry biomass 7.3 11.2 24.8 36.6 47.8 41.6 42.6 42.5 EJ/yr
industry electricity 18.1 24.8 33.2 48.0 63.7 85.1 97.0 110.9 EJ/yr
industry hydrogen 0.0 0.0 2.7 2.9 3.5 3.7 4.1 4.3 EJ/yr
industry energy reduction 0.0 0.0 27.1 57.3 88.1 125.5 130.7 136.6 EJ/yr
industry feedstocks 15.2 23.7 24.7 27.4 28.5 28.8 31.1 32.5 EJ/yr
total: w/o reduction 105.8 123.6 140.8 159.4 168.2 165.0 181.3 192.3 EJ/yr
transportation liquids 62.7 87.6 90.0 81.7 74.3 63.4 63.0 62.3 EJ/yr
transportation gas 2.3 3.0 5.7 7.3 8.2 7.5 8.5 8.5 EJ/yr
transportation coal 0.5 0.2 0.2 0.1 0.0 0.0 0.0 0.0 EJ/yr
transportation electricity 1.0 1.0 2.9 8.3 13.3 18.9 21.4 23.5 EJ/yr
transportation hydrogen 0.0 0.0 1.0 6.4 12.9 19.3 25.6 29.9 EJ/yr
transportation energy reduction 0.0 0.0 10.9 36.6 63.0 92.7 116.8 135.2 EJ/yr
total: w/o reduction 66.5 91.9 99.7 103.8 108.7 109.0 118.5 124.1 EJ/yr
total final energy buildings 88.9 112.7 130.2 126.8 122.1 112.7 115.3 114.0 EJ/yr
total final energy industry 105.8 123.6 140.8 159.4 168.2 165.0 181.3 192.3 EJ/yr
total final energy transportation 66.5 91.9 99.7 103.8 108.7 109.0 118.5 124.1 EJ/yr
total final energy energy reduction 0.0 0.0 50.6 133.7 216.4 314.8 366.8 413.8 EJ/yr
total: w/o reduction 261.1 328.2 370.8 390.0 399.0 386.8 415.1 430.5 EJ/yr

Scenario: eere stab Page 83
Primary Energy w/CCS
1990 2005 2020 2035 2050 2065 2080 2095 Units
oil w/o ccs 135.6 167.5 163.8 148.9 116.8 73.7 67.2 57.9 EJ/yr
oil w/ ccs 0.0 0.0 0.0 0.0 0.0 0.0 0.0 0.0 EJ/yr
natural gas w/o ccs 70.0 97.6 116.3 135.5 141.6 114.9 120.6 117.0 EJ/yr
natural gas w/ ccs 0.0 0.0 0.0 0.0 0.0 0.0 0.0 0.0 EJ/yr
coal w/o ccs 91.2 119.1 125.5 115.8 68.2 18.9 18.5 19.5 EJ/yr
coal w/ ccs 0.0 0.0 0.0 0.0 0.0 0.0 0.0 0.0 EJ/yr
biomass w/o ccs 14.4 21.6 45.6 69.2 124.2 179.5 198.9 220.4 EJ/yr
biomass w/ ccs 0.0 0.0 0.0 0.0 0.0 0.0 0.0 0.0 EJ/yr
nuclear 21.0 26.0 23.4 21.8 17.8 16.1 15.5 15.1 EJ/yr
hydro 23.6 29.2 29.4 30.8 29.6 29.9 31.8 34.4 EJ/yr
wind 0.0 0.9 16.7 38.9 56.0 85.3 91.3 96.8 EJ/yr
solar 0.0 0.1 2.8 12.6 29.3 71.9 94.5 113.3 EJ/yr
geothermal 0.4 0.6 1.9 12.0 27.0 35.8 35.2 36.5 EJ/yr
energy reduction 0.0 0.0 67.5 176.3 306.4 444.2 545.5 661.9 EJ/yr
total: w/o reduction 356 463 525 585 610 626 674 711 EJ/yr
Electricity Production by Fuel
1990 2005 2020 2035 2050 2065 2080 2095 Units
oil 4.86 4.33 3.90 3.12 2.76 3.35 3.04 4.28 EJ/yr
oil w/ccs 0.00 0.00 0.00 0.00 0.00 0.00 0.00 0.00 EJ/yr
gas 6.07 12.82 21.84 31.03 38.27 32.82 34.69 36.16 EJ/yr
gas w/ccs 0.00 0.00 0.00 0.00 0.00 0.00 0.00 0.00 EJ/yr
coal 16.05 26.35 31.13 33.05 22.32 5.84 5.20 6.24 EJ/yr
coal w/ccs 0.00 0.00 0.00 0.00 0.00 0.00 0.00 0.00 EJ/yr
biomass 0.43 0.71 1.40 3.08 7.17 12.30 14.28 15.88 EJ/yr
biomass w/ccs 0.00 0.00 0.00 0.00 0.00 0.00 0.00 0.00 EJ/yr
nuclear 7.36 9.97 9.88 9.95 9.95 9.95 9.95 9.95 EJ/yr
hydro 7.82 10.44 12.09 13.99 15.85 17.70 19.56 21.42 EJ/yr
wind w/backup 0.01 0.36 5.08 11.12 15.62 22.64 23.81 25.53 EJ/yr
wind w/storage 0.00 0.00 1.77 6.29 13.37 27.20 31.73 34.05 EJ/yr
CSP w/backup 0.00 0.00 0.58 1.08 1.44 3.59 4.68 5.72 EJ/yr
CSP w/storage 0.00 0.00 0.45 4.06 10.61 26.19 33.64 39.96 EJ/yr
PV w/backup 0.00 0.04 0.06 0.20 1.48 5.44 8.87 10.83 EJ/yr
PV w/storage 0.00 0.00 0.01 0.11 0.73 4.25 6.95 8.73 EJ/yr
rooftop PV w/backup 0.00 0.00 0.81 2.34 4.76 7.24 9.23 10.20 EJ/yr
geothermal 0.15 0.23 0.80 5.43 14.69 21.77 22.25 23.57 EJ/yr
energy reduction 0.00 0.00 9.00 25.95 64.21 103.61 147.30 189.67 EJ/yr
total: w/o reduction 42.8 65.2 89.8 124.9 159.0 200.3 227.9 252.5 EJ/yr

Scenario: eere stab Page 84
Transportation Fuels Production by Fuel
1990 2005 2020 2035 2050 2065 2080 2095 Units
conventional oil 62.5 86.7 84.9 72.1 53.1 30.9 27.2 22.2 EJ/yr
unconventional oil 0.0 0.0 1.0 2.0 3.1 2.3 2.2 1.8 EJ/yr
coal liquids 0.0 0.0 0.3 0.3 0.2 0.0 0.0 0.0 EJ/yr
coal liquids w/ ccs 0.0 0.0 0.0 0.0 0.0 0.0 0.0 0.0 EJ/yr
bio fuels 0.2 0.9 2.7 4.7 14.2 27.7 31.7 37.2 EJ/yr
gas liquids 0.0 0.0 1.2 2.6 3.6 2.5 1.9 1.2 EJ/yr
gas 2.3 3.0 5.7 7.3 8.2 7.5 8.5 8.5 EJ/yr
coal 0.5 0.2 0.2 0.1 0.0 0.0 0.0 0.0 EJ/yr
electricity 1.0 1.0 2.9 8.3 13.3 18.9 21.4 23.5 EJ/yr
hydrogen 0.0 0.0 1.0 6.4 12.9 19.3 25.6 29.9 EJ/yr
energy reduction 0.0 0.0 10.9 36.6 63.0 92.7 116.8 135.2 EJ/yr
total: w/o reduction 66.5 91.9 99.7 103.8 108.7 109.0 118.5 124.1 EJ/yr
Industrial Liquids Production by Fuel
1990 2005 2020 2035 2050 2065 2080 2095 Units
conventional oil 36.59 43.88 41.48 43.30 36.72 23.97 23.30 19.35 EJ/yr
unconventional oil 0.00 0.00 0.23 0.57 0.78 0.16 0.49 0.31 EJ/yr
coal liquids 0.00 0.00 0.05 0.05 0.00 0.00 0.00 0.00 EJ/yr
coal liquids w/ ccs 0.00 0.00 0.00 0.00 0.00 0.00 0.00 0.00 EJ/yr
bio fuels 0.01 0.05 0.46 1.60 7.92 19.88 23.77 29.41 EJ/yr
gas liquids 0.00 0.00 0.31 1.08 1.53 1.06 0.72 0.39 EJ/yr
energy reduction 0.0 0.0 4.7 9.9 18.1 32.8 35.1 31.5 EJ/yr
total: w/o reduction 36.6 43.9 42.5 46.6 46.9 45.1 48.3 49.5 EJ/yr
Hydrogen Production by Fuel
1990 2005 2020 2035 2050 2065 2080 2095 Units
gas 0.00 0.00 2.80 7.04 12.16 16.20 20.88 22.51 EJ/yr
gas w/ccs 0.00 0.00 0.00 0.00 0.00 0.00 0.00 0.00 EJ/yr
coal 0.00 0.00 0.44 0.78 0.87 0.65 0.95 1.04 EJ/yr
coal w/ccs 0.00 0.00 0.00 0.00 0.00 0.00 0.00 0.00 EJ/yr
biomass 0.00 0.00 0.28 0.80 1.75 2.51 2.98 3.75 EJ/yr
biomass w/ccs 0.00 0.00 0.00 0.00 0.00 0.00 0.00 0.00 EJ/yr
nuclear 0.00 0.00 0.00 0.00 0.00 0.00 0.00 0.00 EJ/yr
bulk electricity 0.00 0.00 0.09 0.30 0.66 1.33 1.77 2.23 EJ/yr
wind 0.00 0.00 0.09 0.16 0.31 0.65 0.82 1.15 EJ/yr
solar 0.00 0.00 0.09 0.24 0.62 1.65 2.28 3.44 EJ/yr
energy reduction 0.00 0.00 -0.54 -4.08 -7.00 -8.74 -9.71 -6.39 EJ/yr
total: w/o reduction 0.00 0.00 3.78 9.32 16.37 22.99 29.69 34.12 EJ/yr

Scenario: eere stab Page 85
Dedicated Bioenergy Crops, Crop Residues, and Municipal Solid Waste Consumption by Sector
1990 2005 2020 2035 2050 2065 2080 2095 Units
direct buildings 4.5 5.5 8.6 8.1 6.8 4.1 3.4 2.8 EJ/yr
Industry 7.4 11.3 25.8 39.8 63.2 79.2 86.8 95.6 EJ/yr
electricity 2.1 2.5 4.0 7.9 16.8 27.9 31.7 34.7 EJ/yr
refined liquids: tran & bldg 0.5 2.2 6.6 11.6 33.7 63.2 70.9 79.9 EJ/yr
hydrogen 0.0 0.0 0.6 1.7 3.6 5.1 6.0 7.4 EJ/yr
synthetic gas 0.0 0.0 0.0 0.0 0.0 0.1 0.0 0.0 EJ/yr
energy reduction 0.0 0.0 -13.5 -25.4 -63.9 -95.9 -97.6 -90.3 EJ/yr
total: w/o reduction 14.4 21.6 45.6 69.2 124.2 179.5 198.9 220.4 EJ/yr
Biomass Production
1990 2005 2020 2035 2050 2065 2080 2095 Units
waste biomass 14.4 21.5 19.9 29.8 58.5 84.4 85.8 85.1 EJ
dedicated biomass crops 0.0 0.0 25.6 39.2 55.7 72.8 83.8 96.7 EJ
municipal solid waste 0.0 0.1 0.0 0.2 9.9 22.3 29.8 38.8 EJ
waste biomass 0.0 0.0 11.8 8.0 -16.8 -39.0 -38.7 -35.7 EJ
reduction in biomass crops 0.0 0.0 -25.6 -34.2 -39.0 -38.0 -35.1 -26.3 EJ
reduction in municipal solid wate 0.0 0.0 0.4 0.8 -8.1 -18.9 -24.2 -28.5 EJ
total: w/o reduction 14.4 21.6 31.7 43.0 68.4 102.5 125.6 158.5 EJ
Arable Land Use by Type
1990 2005 2020 2035 2050 2065 2080 2095 Units
urban land 0.05 0.05 0.05 0.05 0.05 0.05 0.05 0.05 billion Ha
crops 1.20 1.21 0.87 0.75 0.61 0.51 0.46 0.40 billion Ha
pasture 0.70 0.73 0.72 0.71 0.70 0.70 0.70 0.70 billion Ha
managed forest 0.69 0.74 0.84 0.92 0.98 0.98 0.98 1.00 billion Ha
bioenergy crops 0.00 0.00 0.11 0.18 0.26 0.34 0.38 0.41 billion Ha
unmanaged forest 3.32 3.25 3.97 3.94 3.92 3.94 3.94 3.95 billion Ha
unmanaged land 4.58 4.58 3.99 4.00 4.02 4.04 4.04 4.06 billion Ha
rock/ice/desert/tundra 2.62 2.62 2.62 2.62 2.62 2.62 2.62 2.62 billion Ha
total 10.50 10.50 10.50 10.50 10.50 10.50 10.50 10.50 billion Ha

Scenario: eere stab Page 86
Population, GDP, and Energy Indicators
1990 2005 2020 2035 2050 2065 2080 2095 Units
Economic Activity reference GDP $26.1 $39.4 $57.6 $82.3 $116.1 $162.2 $228.8 $313.1 trillion 2005$
Final Energy Intensity building 3.41 2.86 2.26 1.54 1.05 0.69 0.50 0.36 GJ/1000$ (2005$)
Final Energy Intensity industry 4.06 3.14 2.45 1.94 1.45 1.02 0.79 0.61 GJ/1000$ (2005$)
Final Energy Intensity transportation 2.55 2.33 1.73 1.26 0.94 0.67 0.52 0.40 GJ/1000$ (2005$)
Final Energy Intensity total 10.02 8.33 6.44 4.74 3.44 2.38 1.81 1.37 GJ/1000$ (2005$)
Population population 5.2 6.4 7.5 8.3 8.8 9.1 9.0 8.7 billion
Final Energy per Capita building 16.9 17.5 17.3 15.2 13.8 12.4 12.8 13.0 GJ/capita
Final Energy per Capita industry 20.2 19.2 18.7 19.1 19.1 18.2 20.1 22.0 GJ/capita
Final Energy per Capita transportation 12.7 14.3 13.2 12.4 12.3 12.0 13.2 14.2 GJ/capita
Final Energy per Capita total 49.8 51.0 49.3 46.8 45.3 42.7 46.1 49.2 GJ/capita
Long-Term Equilibrium Energy Producer Prices
1990 2005 2020 2035 2050 2065 2080 2095 Units
global oil (w/o carbon charge) $27.6 $32.4 $39.5 $39.8 $41.7 $40.9 $39.8 $38.4 $/barrel (2005$)
global oil (w/ carbon charge) $27.6 $32.4 $46.3 $54.0 $71.4 $102.9 $96.7 $100.2 $/barrel (2005$)
domestic natural gas (w/o carbon charge) $3.3 $3.8 $4.3 $3.9 $4.0 $4.2 $4.3 $4.3 $/mmBTU (2005$)
domestic natural gas (w/ carbon charge) $3.3 $3.8 $5.1 $5.6 $7.7 $11.7 $11.3 $11.9 $/mmBTU (2005$)
domestic coal (w/o carbon charge) $1.7 $1.7 $1.7 $1.7 $1.6 $1.5 $1.4 $1.3 $/GJ (2005$)
domestic coal (w/ carbon charge) $1.7 $1.7 $3.3 $4.8 $8.2 $15.3 $14.0 $15.0 $/GJ (2005$)
domestic electricity (w/ carbon charge) 6.21 5.74 6.48 6.29 7.05 7.78 7.35 7.25 cents/kWh (2005$)
carbon price 0.0 0.0 56.1 116.7 242.6 506.9 464.0 504.7 $/tC (2005$)
Crop Prices
1990 2005 2020 2035 2050 2065 2080 2095 Units
global corn 33 33 43 48 56 69 62 58 $/Gcal (2005$)
global rice 32 32 45 50 61 79 62 51 $/Gcal (2005$)
global wheat 27 27 43 50 62 82 65 55 $/Gcal (2005$)
Emissions by Sectors
1990 2005 2020 2035 2050 2065 2080 2095 Units
buildings 0.858 0.860 0.894 0.753 0.570 0.343 0.313 0.248 GtC/yr
industry 1.623 1.706 1.578 1.409 0.939 0.323 0.301 0.123 GtC/yr
transportation 1.355 1.863 1.950 1.855 1.599 1.123 1.119 1.013 GtC/yr
electricity 1.909 2.848 3.194 3.336 2.457 1.227 1.181 1.296 GtC/yr
cement 0.261 0.483 0.639 0.693 0.637 0.524 0.506 0.457 GtC/yr
emissions reduction 0.000 0.000 2.011 5.217 9.923 15.396 18.194 21.161 GtC/yr
total: w/o reduction 6.006 7.760 8.255 8.046 6.201 3.540 3.420 3.138 GtC/yr

Scenario: eere stab Page 87
Final Energy Consumption: Buildings Final Energy Consumption: Industry (Does not Include Feedstocks)
Final Energy Consumption: Transportation Final Energy Consumption by Sector
0
50
100
150
200
250
300
1990 2005 2020 2035 2050 2065 2080 2095
EJ
/yr
liquids gascoal biomasselectricity trad biomassenergy reduction
0
50
100
150
200
250
300
350
400
1990 2005 2020 2035 2050 2065 2080 2095
EJ
/yr
liquids gas
coal biomass
electricity hydrogen
energy reduction feedstocks
0
50
100
150
200
250
300
1990 2005 2020 2035 2050 2065 2080 2095
EJ
/yr
liquids gas
coal electricity
hydrogen energy reduction
0
100
200
300
400
500
600
700
800
900
1990 2005 2020 2035 2050 2065 2080 2095
EJ
/yr
buildings industry
transportation energy reduction
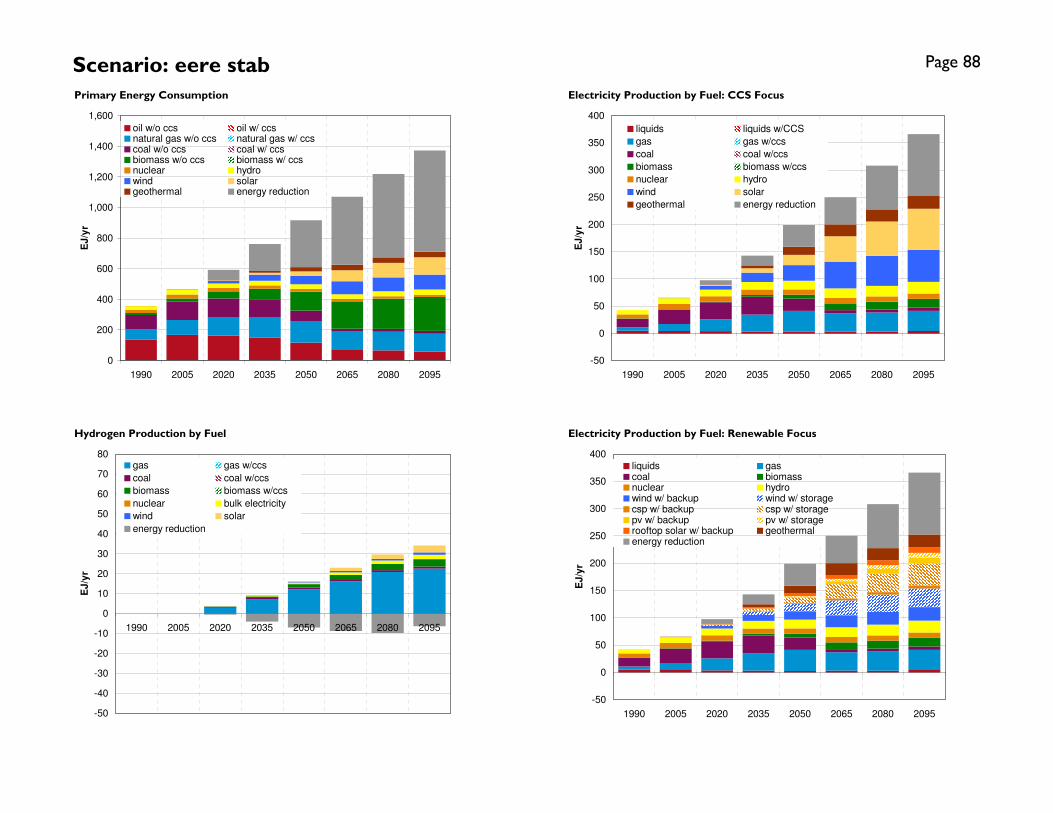
Scenario: eere stab Page 88
Primary Energy Consumption Electricity Production by Fuel: CCS Focus
Hydrogen Production by Fuel Electricity Production by Fuel: Renewable Focus
-50
0
50
100
150
200
250
300
350
400
1990 2005 2020 2035 2050 2065 2080 2095
EJ
/yr
liquids liquids w/CCS
gas gas w/ccs
coal coal w/ccs
biomass biomass w/ccs
nuclear hydro
wind solar
geothermal energy reduction
-50
-40
-30
-20
-10
0
10
20
30
40
50
60
70
80
1990 2005 2020 2035 2050 2065 2080 2095
EJ
/yr
gas gas w/ccs
coal coal w/ccs
biomass biomass w/ccs
nuclear bulk electricity
wind solar
energy reduction
-50
0
50
100
150
200
250
300
350
400
1990 2005 2020 2035 2050 2065 2080 2095
EJ
/yr
liquids gascoal biomassnuclear hydrowind w/ backup wind w/ storagecsp w/ backup csp w/ storagepv w/ backup pv w/ storagerooftop solar w/ backup geothermalenergy reduction
0
200
400
600
800
1,000
1,200
1,400
1,600
1990 2005 2020 2035 2050 2065 2080 2095
EJ
/yr
oil w/o ccs oil w/ ccsnatural gas w/o ccs natural gas w/ ccscoal w/o ccs coal w/ ccsbiomass w/o ccs biomass w/ ccsnuclear hydrowind solargeothermal energy reduction

Scenario: eere stab Page 89
Industrial Liquids Production by Fuel (Feedstocks and Fuel) Transportation Fuels Composition
Final Energy Intensity Final Energy per Capita
0
50
100
150
200
250
300
1990 2005 2020 2035 2050 2065 2080 2095
EJ
/yr
conventional oil unconventional oilcoal liquids coal liquids w/ ccs bio fuels gas liquidsgas coalelectricity hydrogenenergy reduction
0
10
20
30
40
50
60
70
80
90
1990 2005 2020 2035 2050 2065 2080 2095
EJ
/yr
conventional oil unconventional oilcoal liquids coal liquids w/ ccs bio fuels gas liquidsenergy reduction
0
2
4
6
8
10
12
1990 2005 2020 2035 2050 2065 2080 2095
GJ
/10
00
$ (
20
05
$)
0
50
100
150
200
250
300
350
Re
fere
nc
e G
DP
(T
rillio
n 2
00
5$
)
building
industry
transportation
total
reference GDP
0
10
20
30
40
50
60
1990 2005 2020 2035 2050 2065 2080 2095
GJ
/ca
pit
a
0
1
2
3
4
5
6
7
8
9
10
Po
pu
lati
on
(b
illio
n)
building
industry
transportation
total
population

Scenario: eere stab Page 90
Dedicated Energy Crops, Waste Biomass, and Municipal Solid Waste Consumption by Sector Land Use by Type
Biomass Production by Source CO2 Emissions by Sector
-125
-100
-75
-50
-25
0
25
50
75
100
125
150
175
200
225
250
1990 2005 2020 2035 2050 2065 2080 2095
EJ
/yr
energy reductionsynthetic gashydrogenrefined liquids: tran & bldgelectricityIndustrydirect buildings
0
2
4
6
8
10
12
14
16
1990 2005 2020 2035 2050 2065 2080 2095
Billio
n H
ec
tare
s
urban land cropspasture managed forestbioenergy crops unmanaged forestunmanaged land rock/ice/desert/tundra
-125
-100
-75
-50
-25
0
25
50
75
100
125
150
175
200
225
250
1990 2005 2020 2035 2050 2065 2080 2095
EJ
/yr
reduction in municipal solid wate
reduction in biomass crops
waste biomass
municipal solid waste
dedicated biomass crops
waste biomass
-5
0
5
10
15
20
25
1990 2005 2020 2035 2050 2065 2080 2095
GtC
/yr
buildings industry
transportation electricity
cement emissions reduction

Scenario: supply stab Page 91
Final Energy Consumption
1990 2005 2020 2035 2050 2065 2080 2095 Units
building liquids 15.2 16.4 19.5 21.7 20.4 21.5 23.4 24.4 EJ/yr
building gas 18.7 26.7 28.0 28.4 24.9 23.4 23.2 22.1 EJ/yr
building coal 10.1 5.1 5.4 3.9 1.9 1.4 1.4 1.2 EJ/yr
building biomass 4.5 5.5 8.8 9.7 8.7 7.6 7.1 6.5 EJ/yr
building electricity 16.9 29.0 41.3 59.3 80.3 105.6 133.8 160.5 EJ/yr
building trad biomass 23.5 29.9 32.8 29.5 24.7 19.3 13.4 8.7 EJ/yr
building energy reduction 0.0 0.0 7.0 14.1 26.6 30.5 32.5 32.6 EJ/yr
total: w/o reduction 88.9 112.7 135.9 152.5 160.8 178.8 202.2 223.4 EJ/yr
industry liquids 22.4 21.2 20.3 22.8 20.4 22.0 23.9 24.5 EJ/yr
industry gas 26.6 30.5 31.2 32.3 23.1 21.0 21.2 20.6 EJ/yr
industry coal 31.4 35.8 36.6 28.5 13.0 10.5 11.7 11.2 EJ/yr
industry biomass 7.3 11.2 25.1 38.0 47.9 50.1 52.7 58.2 EJ/yr
industry electricity 18.1 24.8 34.7 51.5 78.6 101.9 115.7 129.2 EJ/yr
industry hydrogen 0.0 0.0 2.6 4.5 5.3 6.1 6.8 7.9 EJ/yr
industry energy reduction 0.0 0.0 17.4 39.1 68.1 79.0 80.0 77.1 EJ/yr
industry feedstocks 15.2 23.7 25.8 29.1 31.0 34.7 37.6 40.2 EJ/yr
total: w/o reduction 105.8 123.6 150.6 177.6 188.2 211.6 232.0 251.8 EJ/yr
transportation liquids 62.7 87.7 97.3 99.8 93.0 90.6 95.9 99.3 EJ/yr
transportation gas 2.2 3.0 6.1 9.6 11.1 12.4 14.4 15.6 EJ/yr
transportation coal 0.5 0.2 0.2 0.2 0.1 0.0 0.0 0.0 EJ/yr
transportation electricity 1.0 1.0 2.1 4.4 10.0 13.2 15.6 17.6 EJ/yr
transportation hydrogen 0.0 0.0 1.1 11.8 25.4 39.5 52.2 63.3 EJ/yr
transportation energy reduction 0.0 0.0 3.8 14.6 32.2 46.0 57.2 63.6 EJ/yr
total: w/o reduction 66.4 91.8 106.8 125.8 139.5 155.8 178.1 195.8 EJ/yr
total final energy buildings 88.9 112.7 135.9 152.5 160.8 178.8 202.2 223.4 EJ/yr
total final energy industry 105.8 123.6 150.6 177.6 188.2 211.6 232.0 251.8 EJ/yr
total final energy transportation 66.4 91.8 106.8 125.8 139.5 155.8 178.1 195.8 EJ/yr
total final energy energy reduction 0.0 0.0 28.2 67.8 126.9 155.4 169.7 173.3 EJ/yr
total: w/o reduction 261.1 328.1 393.3 455.9 488.5 546.1 612.3 671.0 EJ/yr
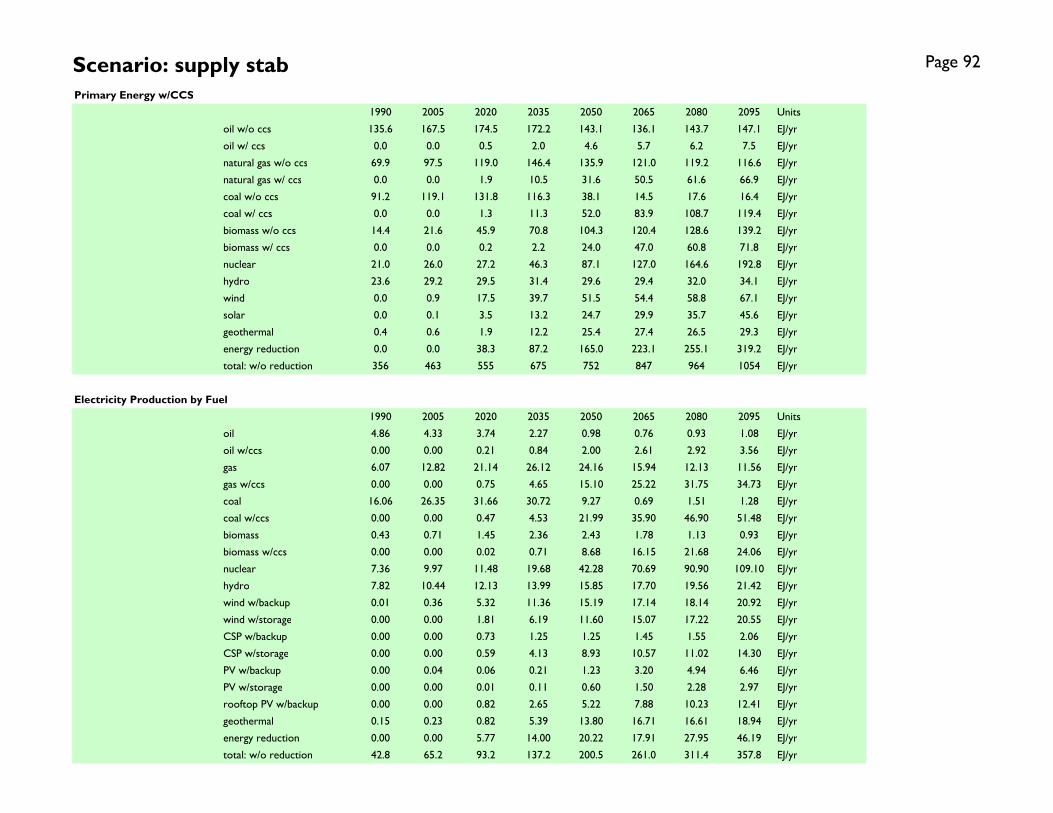
Scenario: supply stab Page 92
Primary Energy w/CCS
1990 2005 2020 2035 2050 2065 2080 2095 Units
oil w/o ccs 135.6 167.5 174.5 172.2 143.1 136.1 143.7 147.1 EJ/yr
oil w/ ccs 0.0 0.0 0.5 2.0 4.6 5.7 6.2 7.5 EJ/yr
natural gas w/o ccs 69.9 97.5 119.0 146.4 135.9 121.0 119.2 116.6 EJ/yr
natural gas w/ ccs 0.0 0.0 1.9 10.5 31.6 50.5 61.6 66.9 EJ/yr
coal w/o ccs 91.2 119.1 131.8 116.3 38.1 14.5 17.6 16.4 EJ/yr
coal w/ ccs 0.0 0.0 1.3 11.3 52.0 83.9 108.7 119.4 EJ/yr
biomass w/o ccs 14.4 21.6 45.9 70.8 104.3 120.4 128.6 139.2 EJ/yr
biomass w/ ccs 0.0 0.0 0.2 2.2 24.0 47.0 60.8 71.8 EJ/yr
nuclear 21.0 26.0 27.2 46.3 87.1 127.0 164.6 192.8 EJ/yr
hydro 23.6 29.2 29.5 31.4 29.6 29.4 32.0 34.1 EJ/yr
wind 0.0 0.9 17.5 39.7 51.5 54.4 58.8 67.1 EJ/yr
solar 0.0 0.1 3.5 13.2 24.7 29.9 35.7 45.6 EJ/yr
geothermal 0.4 0.6 1.9 12.2 25.4 27.4 26.5 29.3 EJ/yr
energy reduction 0.0 0.0 38.3 87.2 165.0 223.1 255.1 319.2 EJ/yr
total: w/o reduction 356 463 555 675 752 847 964 1054 EJ/yr
Electricity Production by Fuel
1990 2005 2020 2035 2050 2065 2080 2095 Units
oil 4.86 4.33 3.74 2.27 0.98 0.76 0.93 1.08 EJ/yr
oil w/ccs 0.00 0.00 0.21 0.84 2.00 2.61 2.92 3.56 EJ/yr
gas 6.07 12.82 21.14 26.12 24.16 15.94 12.13 11.56 EJ/yr
gas w/ccs 0.00 0.00 0.75 4.65 15.10 25.22 31.75 34.73 EJ/yr
coal 16.06 26.35 31.66 30.72 9.27 0.69 1.51 1.28 EJ/yr
coal w/ccs 0.00 0.00 0.47 4.53 21.99 35.90 46.90 51.48 EJ/yr
biomass 0.43 0.71 1.45 2.36 2.43 1.78 1.13 0.93 EJ/yr
biomass w/ccs 0.00 0.00 0.02 0.71 8.68 16.15 21.68 24.06 EJ/yr
nuclear 7.36 9.97 11.48 19.68 42.28 70.69 90.90 109.10 EJ/yr
hydro 7.82 10.44 12.13 13.99 15.85 17.70 19.56 21.42 EJ/yr
wind w/backup 0.01 0.36 5.32 11.36 15.19 17.14 18.14 20.92 EJ/yr
wind w/storage 0.00 0.00 1.81 6.19 11.60 15.07 17.22 20.55 EJ/yr
CSP w/backup 0.00 0.00 0.73 1.25 1.25 1.45 1.55 2.06 EJ/yr
CSP w/storage 0.00 0.00 0.59 4.13 8.93 10.57 11.02 14.30 EJ/yr
PV w/backup 0.00 0.04 0.06 0.21 1.23 3.20 4.94 6.46 EJ/yr
PV w/storage 0.00 0.00 0.01 0.11 0.60 1.50 2.28 2.97 EJ/yr
rooftop PV w/backup 0.00 0.00 0.82 2.65 5.22 7.88 10.23 12.41 EJ/yr
geothermal 0.15 0.23 0.82 5.39 13.80 16.71 16.61 18.94 EJ/yr
energy reduction 0.00 0.00 5.77 14.00 20.22 17.91 27.95 46.19 EJ/yr
total: w/o reduction 42.8 65.2 93.2 137.2 200.5 261.0 311.4 357.8 EJ/yr

Scenario: supply stab Page 93
Transportation Fuels Production by Fuel
1990 2005 2020 2035 2050 2065 2080 2095 Units
conventional oil 62.5 86.8 91.7 87.1 69.2 59.6 58.9 57.9 EJ/yr
unconventional oil 0.0 0.0 1.2 3.3 5.8 8.3 12.2 14.8 EJ/yr
coal liquids 0.0 0.0 0.4 0.4 0.3 0.1 0.0 0.0 EJ/yr
coal liquids w/ ccs 0.0 0.0 0.0 0.0 0.1 0.2 0.3 0.4 EJ/yr
bio fuels 0.2 0.9 2.7 5.3 12.7 17.6 20.2 22.7 EJ/yr
gas liquids 0.0 0.0 1.3 3.7 5.0 4.8 4.2 3.5 EJ/yr
gas 2.2 3.0 6.1 9.6 11.1 12.4 14.4 15.6 EJ/yr
coal 0.5 0.2 0.2 0.2 0.1 0.0 0.0 0.0 EJ/yr
electricity 1.0 1.0 2.1 4.4 10.0 13.2 15.6 17.6 EJ/yr
hydrogen 0.0 0.0 1.1 11.8 25.4 39.5 52.2 63.3 EJ/yr
energy reduction 0.0 0.0 3.8 14.6 32.2 46.0 57.2 63.6 EJ/yr
total: w/o reduction 66.4 91.8 106.8 125.8 139.5 155.8 178.1 195.8 EJ/yr
Industrial Liquids Production by Fuel
1990 2005 2020 2035 2050 2065 2080 2095 Units
conventional oil 36.59 43.88 43.97 47.27 41.39 42.48 44.13 44.96 EJ/yr
unconventional oil 0.00 0.00 0.28 0.87 2.01 3.49 5.69 7.11 EJ/yr
coal liquids 0.00 0.00 0.07 0.08 0.03 0.04 0.07 0.08 EJ/yr
coal liquids w/ ccs 0.00 0.00 0.00 0.01 0.03 0.04 0.07 0.08 EJ/yr
bio fuels 0.01 0.05 0.44 1.42 5.17 8.04 9.30 10.64 EJ/yr
gas liquids 0.00 0.00 0.34 1.32 1.78 1.77 1.43 1.14 EJ/yr
energy reduction 0.0 0.0 2.2 5.6 14.6 22.0 22.7 16.9 EJ/yr
total: w/o reduction 36.6 43.9 45.1 51.0 50.4 55.9 60.7 64.0 EJ/yr
Hydrogen Production by Fuel
1990 2005 2020 2035 2050 2065 2080 2095 Units
gas 0.00 0.00 2.32 10.47 14.40 16.88 20.48 21.03 EJ/yr
gas w/ccs 0.00 0.00 0.36 1.88 5.38 8.39 10.26 12.33 EJ/yr
coal 0.00 0.00 0.29 0.56 0.37 0.39 0.58 0.62 EJ/yr
coal w/ccs 0.00 0.00 0.10 0.56 2.17 4.17 6.22 8.44 EJ/yr
biomass 0.00 0.00 0.17 0.58 0.73 0.76 1.04 1.06 EJ/yr
biomass w/ccs 0.00 0.00 0.06 0.24 2.28 5.67 6.94 10.65 EJ/yr
nuclear 0.00 0.00 0.14 1.15 3.23 5.82 8.23 10.47 EJ/yr
bulk electricity 0.00 0.00 0.11 0.53 1.07 1.60 2.17 2.44 EJ/yr
wind 0.00 0.00 0.08 0.15 0.36 0.65 0.98 1.21 EJ/yr
solar 0.00 0.00 0.08 0.22 0.68 1.32 2.09 2.96 EJ/yr
energy reduction 0.00 0.00 -0.47 -11.09 -21.30 -31.40 -39.01 -43.50 EJ/yr
total: w/o reduction 0.00 0.00 3.72 16.33 30.67 45.65 58.99 71.22 EJ/yr

Scenario: supply stab Page 94
Dedicated Bioenergy Crops, Crop Residues, and Municipal Solid Waste Consumption by Sector
1990 2005 2020 2035 2050 2065 2080 2095 Units
direct buildings 4.5 5.5 8.8 9.7 8.7 7.6 7.1 6.5 EJ/yr
Industry 7.4 11.3 26.0 40.8 58.0 65.4 70.1 77.4 EJ/yr
electricity 2.1 2.5 4.1 7.8 25.1 39.6 49.4 52.9 EJ/yr
refined liquids: tran & bldg 0.5 2.2 6.6 13.0 30.3 41.6 46.9 51.2 EJ/yr
hydrogen 0.0 0.0 0.5 1.7 6.2 13.1 15.9 22.9 EJ/yr
synthetic gas 0.0 0.0 0.0 0.0 0.1 0.1 0.1 0.1 EJ/yr
energy reduction 0.0 0.0 -13.9 -29.1 -68.0 -83.8 -88.1 -81.0 EJ/yr
total: w/o reduction 14.4 21.6 46.1 73.0 128.3 167.4 189.5 211.0 EJ/yr
Biomass Production
1990 2005 2020 2035 2050 2065 2080 2095 Units
waste biomass 14.4 21.5 21.2 33.7 61.0 76.9 79.7 79.4 EJ
dedicated biomass crops 0.0 0.0 24.8 38.9 55.6 68.5 79.9 92.8 EJ
municipal solid waste 0.0 0.1 0.0 0.4 11.7 22.0 29.8 38.9 EJ
waste biomass 0.0 0.0 10.4 4.2 -19.3 -31.5 -32.7 -30.0 EJ
reduction in biomass crops 0.0 0.0 -24.8 -34.0 -38.9 -33.7 -31.2 -22.4 EJ
reduction in municipal solid wate 0.0 0.0 0.4 0.6 -9.9 -18.6 -24.3 -28.6 EJ
total: w/o reduction 14.4 21.6 31.7 43.2 70.1 102.2 125.6 158.6 EJ
Arable Land Use by Type
1990 2005 2020 2035 2050 2065 2080 2095 Units
urban land 0.05 0.05 0.05 0.05 0.05 0.05 0.05 0.05 billion Ha
crops 1.20 1.21 0.88 0.76 0.62 0.55 0.50 0.43 billion Ha
pasture 0.70 0.73 0.72 0.72 0.70 0.70 0.70 0.70 billion Ha
managed forest 0.69 0.74 0.84 0.92 0.98 1.00 1.02 1.05 billion Ha
bioenergy crops 0.00 0.00 0.11 0.18 0.26 0.32 0.35 0.38 billion Ha
unmanaged forest 3.32 3.25 3.97 3.93 3.91 3.91 3.90 3.90 billion Ha
unmanaged land 4.58 4.58 3.98 3.99 4.01 4.02 4.03 4.04 billion Ha
rock/ice/desert/tundra 2.62 2.62 2.62 2.62 2.62 2.62 2.62 2.62 billion Ha
total 10.50 10.50 10.50 10.50 10.50 10.50 10.50 10.50 billion Ha
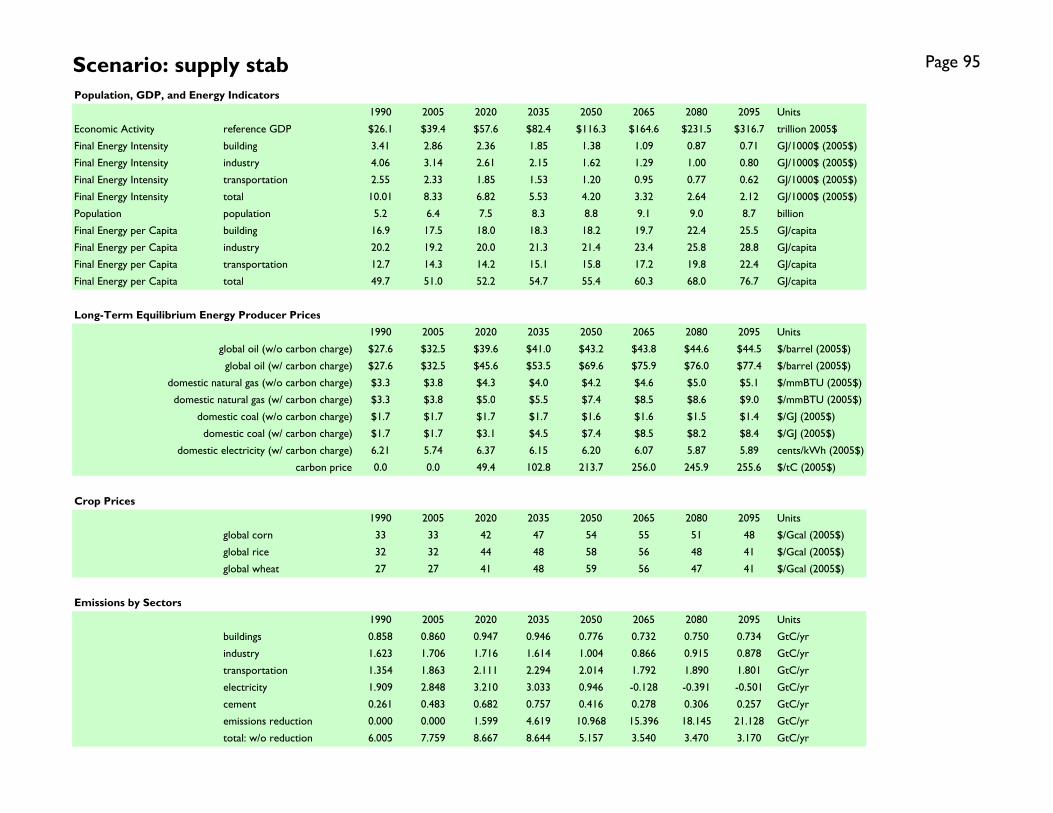
Scenario: supply stab Page 95
Population, GDP, and Energy Indicators
1990 2005 2020 2035 2050 2065 2080 2095 Units
Economic Activity reference GDP $26.1 $39.4 $57.6 $82.4 $116.3 $164.6 $231.5 $316.7 trillion 2005$
Final Energy Intensity building 3.41 2.86 2.36 1.85 1.38 1.09 0.87 0.71 GJ/1000$ (2005$)
Final Energy Intensity industry 4.06 3.14 2.61 2.15 1.62 1.29 1.00 0.80 GJ/1000$ (2005$)
Final Energy Intensity transportation 2.55 2.33 1.85 1.53 1.20 0.95 0.77 0.62 GJ/1000$ (2005$)
Final Energy Intensity total 10.01 8.33 6.82 5.53 4.20 3.32 2.64 2.12 GJ/1000$ (2005$)
Population population 5.2 6.4 7.5 8.3 8.8 9.1 9.0 8.7 billion
Final Energy per Capita building 16.9 17.5 18.0 18.3 18.2 19.7 22.4 25.5 GJ/capita
Final Energy per Capita industry 20.2 19.2 20.0 21.3 21.4 23.4 25.8 28.8 GJ/capita
Final Energy per Capita transportation 12.7 14.3 14.2 15.1 15.8 17.2 19.8 22.4 GJ/capita
Final Energy per Capita total 49.7 51.0 52.2 54.7 55.4 60.3 68.0 76.7 GJ/capita
Long-Term Equilibrium Energy Producer Prices
1990 2005 2020 2035 2050 2065 2080 2095 Units
global oil (w/o carbon charge) $27.6 $32.5 $39.6 $41.0 $43.2 $43.8 $44.6 $44.5 $/barrel (2005$)
global oil (w/ carbon charge) $27.6 $32.5 $45.6 $53.5 $69.6 $75.9 $76.0 $77.4 $/barrel (2005$)
domestic natural gas (w/o carbon charge) $3.3 $3.8 $4.3 $4.0 $4.2 $4.6 $5.0 $5.1 $/mmBTU (2005$)
domestic natural gas (w/ carbon charge) $3.3 $3.8 $5.0 $5.5 $7.4 $8.5 $8.6 $9.0 $/mmBTU (2005$)
domestic coal (w/o carbon charge) $1.7 $1.7 $1.7 $1.7 $1.6 $1.6 $1.5 $1.4 $/GJ (2005$)
domestic coal (w/ carbon charge) $1.7 $1.7 $3.1 $4.5 $7.4 $8.5 $8.2 $8.4 $/GJ (2005$)
domestic electricity (w/ carbon charge) 6.21 5.74 6.37 6.15 6.20 6.07 5.87 5.89 cents/kWh (2005$)
carbon price 0.0 0.0 49.4 102.8 213.7 256.0 245.9 255.6 $/tC (2005$)
Crop Prices
1990 2005 2020 2035 2050 2065 2080 2095 Units
global corn 33 33 42 47 54 55 51 48 $/Gcal (2005$)
global rice 32 32 44 48 58 56 48 41 $/Gcal (2005$)
global wheat 27 27 41 48 59 56 47 41 $/Gcal (2005$)
Emissions by Sectors
1990 2005 2020 2035 2050 2065 2080 2095 Units
buildings 0.858 0.860 0.947 0.946 0.776 0.732 0.750 0.734 GtC/yr
industry 1.623 1.706 1.716 1.614 1.004 0.866 0.915 0.878 GtC/yr
transportation 1.354 1.863 2.111 2.294 2.014 1.792 1.890 1.801 GtC/yr
electricity 1.909 2.848 3.210 3.033 0.946 -0.128 -0.391 -0.501 GtC/yr
cement 0.261 0.483 0.682 0.757 0.416 0.278 0.306 0.257 GtC/yr
emissions reduction 0.000 0.000 1.599 4.619 10.968 15.396 18.145 21.128 GtC/yr
total: w/o reduction 6.005 7.759 8.667 8.644 5.157 3.540 3.470 3.170 GtC/yr

Scenario: supply stab Page 96
Final Energy Consumption: Buildings Final Energy Consumption: Industry (Does not Include Feedstocks)
Final Energy Consumption: Transportation Final Energy Consumption by Sector
0
50
100
150
200
250
300
1990 2005 2020 2035 2050 2065 2080 2095
EJ
/yr
liquids gascoal biomasselectricity trad biomassenergy reduction
0
50
100
150
200
250
300
350
400
1990 2005 2020 2035 2050 2065 2080 2095
EJ
/yr
liquids gas
coal biomass
electricity hydrogen
energy reduction feedstocks
0
50
100
150
200
250
300
1990 2005 2020 2035 2050 2065 2080 2095
EJ
/yr
liquids gas
coal electricity
hydrogen energy reduction
0
100
200
300
400
500
600
700
800
900
1990 2005 2020 2035 2050 2065 2080 2095
EJ
/yr
buildings industry
transportation energy reduction
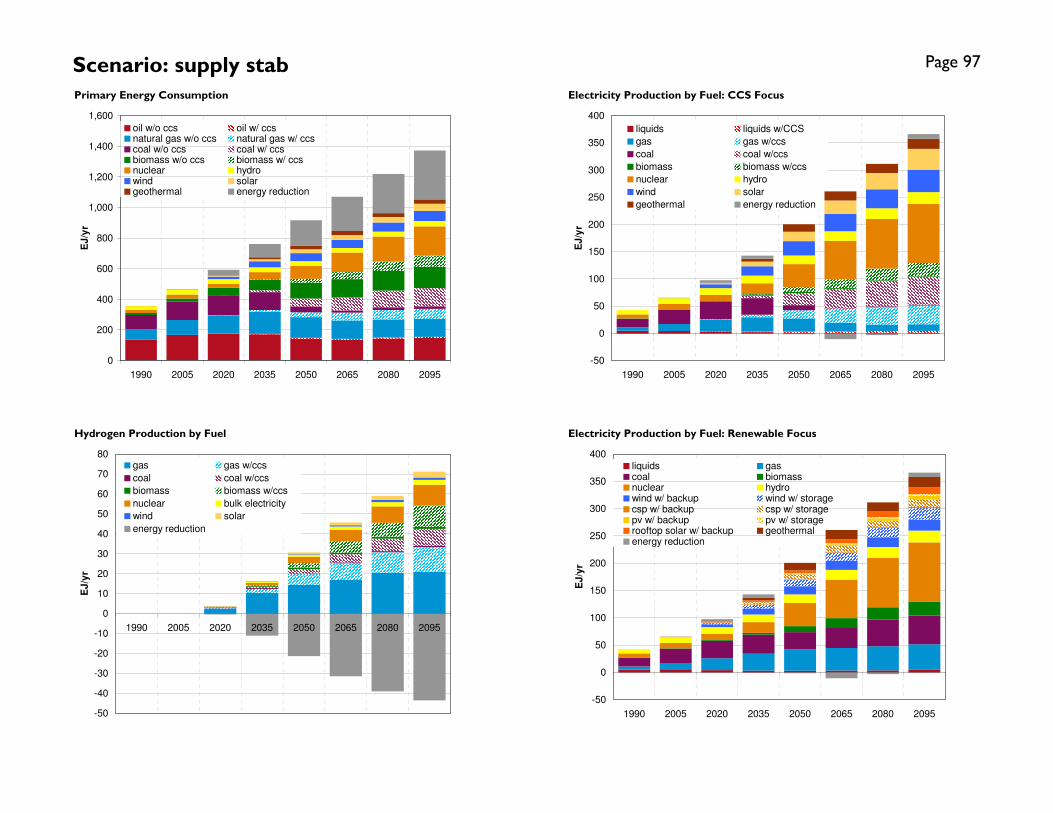
Scenario: supply stab Page 97
Primary Energy Consumption Electricity Production by Fuel: CCS Focus
Hydrogen Production by Fuel Electricity Production by Fuel: Renewable Focus
-50
0
50
100
150
200
250
300
350
400
1990 2005 2020 2035 2050 2065 2080 2095
EJ
/yr
liquids liquids w/CCS
gas gas w/ccs
coal coal w/ccs
biomass biomass w/ccs
nuclear hydro
wind solar
geothermal energy reduction
-50
-40
-30
-20
-10
0
10
20
30
40
50
60
70
80
1990 2005 2020 2035 2050 2065 2080 2095
EJ
/yr
gas gas w/ccs
coal coal w/ccs
biomass biomass w/ccs
nuclear bulk electricity
wind solar
energy reduction
-50
0
50
100
150
200
250
300
350
400
1990 2005 2020 2035 2050 2065 2080 2095
EJ
/yr
liquids gascoal biomassnuclear hydrowind w/ backup wind w/ storagecsp w/ backup csp w/ storagepv w/ backup pv w/ storagerooftop solar w/ backup geothermalenergy reduction
0
200
400
600
800
1,000
1,200
1,400
1,600
1990 2005 2020 2035 2050 2065 2080 2095
EJ
/yr
oil w/o ccs oil w/ ccsnatural gas w/o ccs natural gas w/ ccscoal w/o ccs coal w/ ccsbiomass w/o ccs biomass w/ ccsnuclear hydrowind solargeothermal energy reduction

Scenario: supply stab Page 98
Industrial Liquids Production by Fuel (Feedstocks and Fuel) Transportation Fuels Composition
Final Energy Intensity Final Energy per Capita
0
50
100
150
200
250
300
1990 2005 2020 2035 2050 2065 2080 2095
EJ
/yr
conventional oil unconventional oilcoal liquids coal liquids w/ ccs bio fuels gas liquidsgas coalelectricity hydrogenenergy reduction
0
10
20
30
40
50
60
70
80
90
1990 2005 2020 2035 2050 2065 2080 2095
EJ
/yr
conventional oil unconventional oilcoal liquids coal liquids w/ ccs bio fuels gas liquidsenergy reduction
0
2
4
6
8
10
12
1990 2005 2020 2035 2050 2065 2080 2095
GJ
/10
00
$ (
20
05
$)
0
50
100
150
200
250
300
350
Re
fere
nc
e G
DP
(T
rillio
n 2
00
5$
)
building
industry
transportation
total
reference GDP
0
10
20
30
40
50
60
70
80
90
1990 2005 2020 2035 2050 2065 2080 2095
GJ
/ca
pit
a
0
1
2
3
4
5
6
7
8
9
10
Po
pu
lati
on
(b
illio
n)
building
industry
transportation
total
population

Scenario: supply stab Page 99
Dedicated Energy Crops, Waste Biomass, and Municipal Solid Waste Consumption by Sector Land Use by Type
Biomass Production by Source CO2 Emissions by Sector
-125
-100
-75
-50
-25
0
25
50
75
100
125
150
175
200
225
250
1990 2005 2020 2035 2050 2065 2080 2095
EJ
/yr
energy reductionsynthetic gashydrogenrefined liquids: tran & bldgelectricityIndustrydirect buildings
0
2
4
6
8
10
12
14
16
1990 2005 2020 2035 2050 2065 2080 2095
Billio
n H
ec
tare
s
urban land cropspasture managed forestbioenergy crops unmanaged forestunmanaged land rock/ice/desert/tundra
-125
-100
-75
-50
-25
0
25
50
75
100
125
150
175
200
225
250
1990 2005 2020 2035 2050 2065 2080 2095
EJ
/yr
reduction in municipal solid wate
reduction in biomass crops
waste biomass
municipal solid waste
dedicated biomass crops
waste biomass
-5
0
5
10
15
20
25
1990 2005 2020 2035 2050 2065 2080 2095
GtC
/yr
buildings industry
transportation electricity
cement emissions reduction
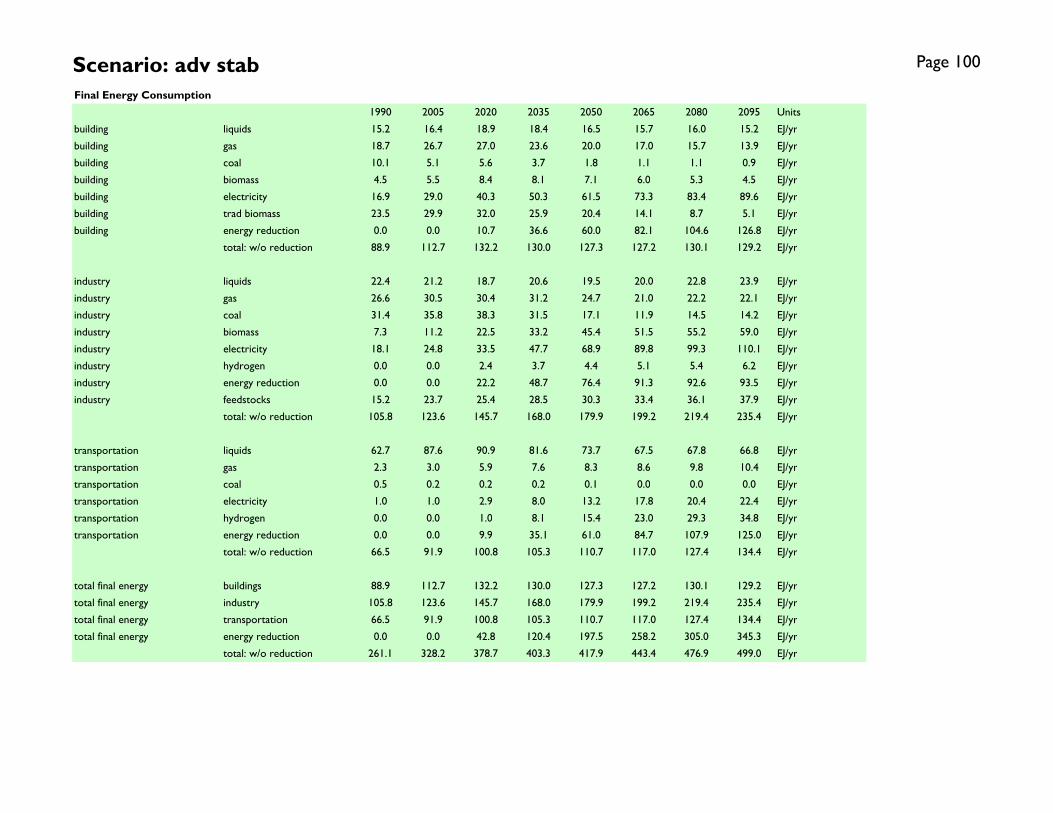
Scenario: adv stab Page 100
Final Energy Consumption
1990 2005 2020 2035 2050 2065 2080 2095 Units
building liquids 15.2 16.4 18.9 18.4 16.5 15.7 16.0 15.2 EJ/yr
building gas 18.7 26.7 27.0 23.6 20.0 17.0 15.7 13.9 EJ/yr
building coal 10.1 5.1 5.6 3.7 1.8 1.1 1.1 0.9 EJ/yr
building biomass 4.5 5.5 8.4 8.1 7.1 6.0 5.3 4.5 EJ/yr
building electricity 16.9 29.0 40.3 50.3 61.5 73.3 83.4 89.6 EJ/yr
building trad biomass 23.5 29.9 32.0 25.9 20.4 14.1 8.7 5.1 EJ/yr
building energy reduction 0.0 0.0 10.7 36.6 60.0 82.1 104.6 126.8 EJ/yr
total: w/o reduction 88.9 112.7 132.2 130.0 127.3 127.2 130.1 129.2 EJ/yr
industry liquids 22.4 21.2 18.7 20.6 19.5 20.0 22.8 23.9 EJ/yr
industry gas 26.6 30.5 30.4 31.2 24.7 21.0 22.2 22.1 EJ/yr
industry coal 31.4 35.8 38.3 31.5 17.1 11.9 14.5 14.2 EJ/yr
industry biomass 7.3 11.2 22.5 33.2 45.4 51.5 55.2 59.0 EJ/yr
industry electricity 18.1 24.8 33.5 47.7 68.9 89.8 99.3 110.1 EJ/yr
industry hydrogen 0.0 0.0 2.4 3.7 4.4 5.1 5.4 6.2 EJ/yr
industry energy reduction 0.0 0.0 22.2 48.7 76.4 91.3 92.6 93.5 EJ/yr
industry feedstocks 15.2 23.7 25.4 28.5 30.3 33.4 36.1 37.9 EJ/yr
total: w/o reduction 105.8 123.6 145.7 168.0 179.9 199.2 219.4 235.4 EJ/yr
transportation liquids 62.7 87.6 90.9 81.6 73.7 67.5 67.8 66.8 EJ/yr
transportation gas 2.3 3.0 5.9 7.6 8.3 8.6 9.8 10.4 EJ/yr
transportation coal 0.5 0.2 0.2 0.2 0.1 0.0 0.0 0.0 EJ/yr
transportation electricity 1.0 1.0 2.9 8.0 13.2 17.8 20.4 22.4 EJ/yr
transportation hydrogen 0.0 0.0 1.0 8.1 15.4 23.0 29.3 34.8 EJ/yr
transportation energy reduction 0.0 0.0 9.9 35.1 61.0 84.7 107.9 125.0 EJ/yr
total: w/o reduction 66.5 91.9 100.8 105.3 110.7 117.0 127.4 134.4 EJ/yr
total final energy buildings 88.9 112.7 132.2 130.0 127.3 127.2 130.1 129.2 EJ/yr
total final energy industry 105.8 123.6 145.7 168.0 179.9 199.2 219.4 235.4 EJ/yr
total final energy transportation 66.5 91.9 100.8 105.3 110.7 117.0 127.4 134.4 EJ/yr
total final energy energy reduction 0.0 0.0 42.8 120.4 197.5 258.2 305.0 345.3 EJ/yr
total: w/o reduction 261.1 328.2 378.7 403.3 417.9 443.4 476.9 499.0 EJ/yr

Scenario: adv stab Page 101
Primary Energy w/CCS
1990 2005 2020 2035 2050 2065 2080 2095 Units
oil w/o ccs 135.6 167.5 165.7 150.7 124.8 107.9 109.7 107.3 EJ/yr
oil w/ ccs 0.0 0.0 0.4 1.5 3.0 4.2 3.8 4.3 EJ/yr
natural gas w/o ccs 70.0 97.6 116.0 132.4 125.3 104.5 100.6 96.5 EJ/yr
natural gas w/ ccs 0.0 0.0 1.5 7.1 19.7 34.5 40.3 42.7 EJ/yr
coal w/o ccs 91.2 119.1 134.4 121.6 64.6 24.2 24.8 22.4 EJ/yr
coal w/ ccs 0.0 0.0 0.9 6.4 31.2 56.4 70.4 73.1 EJ/yr
biomass w/o ccs 14.4 21.6 41.1 58.4 87.7 113.5 123.2 131.1 EJ/yr
biomass w/ ccs 0.0 0.0 0.1 1.2 10.5 27.0 32.7 36.1 EJ/yr
nuclear 21.0 26.0 25.8 38.6 67.7 105.5 125.1 139.4 EJ/yr
hydro 23.6 29.2 29.5 31.4 30.9 30.8 32.9 34.9 EJ/yr
wind 0.0 0.9 16.1 34.3 44.3 48.6 48.6 51.3 EJ/yr
solar 0.0 0.1 3.1 10.5 18.6 23.7 25.5 28.3 EJ/yr
geothermal 0.4 0.6 1.8 10.5 23.2 25.0 22.9 23.9 EJ/yr
energy reduction 0.0 0.0 56.4 157.3 265.3 364.4 458.7 581.3 EJ/yr
total: w/o reduction 356 463 536 604 652 706 760 791 EJ/yr
Electricity Production by Fuel
1990 2005 2020 2035 2050 2065 2080 2095 Units
oil 4.86 4.33 3.70 2.24 1.04 0.78 0.90 1.07 EJ/yr
oil w/ccs 0.00 0.00 0.17 0.62 1.29 1.96 1.79 2.04 EJ/yr
gas 6.07 12.82 21.07 26.14 25.30 17.56 13.91 12.95 EJ/yr
gas w/ccs 0.00 0.00 0.61 3.21 9.69 17.83 21.56 22.93 EJ/yr
coal 16.05 26.35 31.82 31.61 18.18 4.62 3.67 2.85 EJ/yr
coal w/ccs 0.00 0.00 0.32 2.55 13.34 24.63 31.17 32.43 EJ/yr
biomass 0.43 0.71 1.36 2.20 2.66 2.20 1.74 1.48 EJ/yr
biomass w/ccs 0.00 0.00 0.01 0.38 3.98 9.73 12.50 13.40 EJ/yr
nuclear 7.36 9.97 10.90 16.53 31.97 55.75 67.80 77.90 EJ/yr
hydro 7.82 10.44 12.13 13.99 15.85 17.70 19.56 21.42 EJ/yr
wind w/backup 0.01 0.36 4.95 10.01 12.72 14.72 14.67 15.78 EJ/yr
wind w/storage 0.00 0.00 1.62 5.18 9.33 12.71 13.82 15.27 EJ/yr
CSP w/backup 0.00 0.00 0.66 1.07 0.92 1.09 1.10 1.27 EJ/yr
CSP w/storage 0.00 0.00 0.52 3.24 6.56 7.94 7.82 8.78 EJ/yr
PV w/backup 0.00 0.04 0.06 0.16 0.90 2.40 3.44 3.99 EJ/yr
PV w/storage 0.00 0.00 0.01 0.09 0.44 1.12 1.58 1.83 EJ/yr
rooftop PV w/backup 0.00 0.00 0.76 2.16 4.05 5.70 6.83 7.60 EJ/yr
geothermal 0.15 0.23 0.77 4.63 11.91 14.62 13.87 14.97 EJ/yr
energy reduction 0.00 0.00 7.36 22.95 44.70 57.72 90.06 128.12 EJ/yr
total: w/o reduction 42.8 65.2 91.4 126.0 170.1 213.1 237.7 258.0 EJ/yr
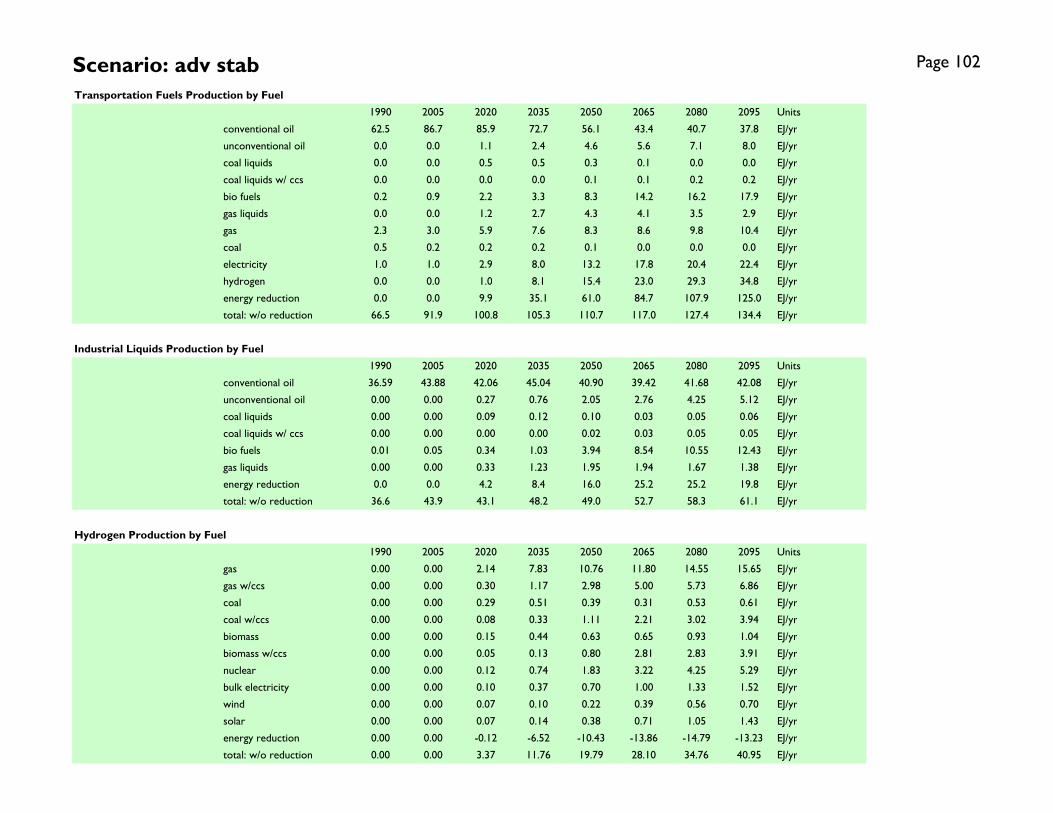
Scenario: adv stab Page 102
Transportation Fuels Production by Fuel
1990 2005 2020 2035 2050 2065 2080 2095 Units
conventional oil 62.5 86.7 85.9 72.7 56.1 43.4 40.7 37.8 EJ/yr
unconventional oil 0.0 0.0 1.1 2.4 4.6 5.6 7.1 8.0 EJ/yr
coal liquids 0.0 0.0 0.5 0.5 0.3 0.1 0.0 0.0 EJ/yr
coal liquids w/ ccs 0.0 0.0 0.0 0.0 0.1 0.1 0.2 0.2 EJ/yr
bio fuels 0.2 0.9 2.2 3.3 8.3 14.2 16.2 17.9 EJ/yr
gas liquids 0.0 0.0 1.2 2.7 4.3 4.1 3.5 2.9 EJ/yr
gas 2.3 3.0 5.9 7.6 8.3 8.6 9.8 10.4 EJ/yr
coal 0.5 0.2 0.2 0.2 0.1 0.0 0.0 0.0 EJ/yr
electricity 1.0 1.0 2.9 8.0 13.2 17.8 20.4 22.4 EJ/yr
hydrogen 0.0 0.0 1.0 8.1 15.4 23.0 29.3 34.8 EJ/yr
energy reduction 0.0 0.0 9.9 35.1 61.0 84.7 107.9 125.0 EJ/yr
total: w/o reduction 66.5 91.9 100.8 105.3 110.7 117.0 127.4 134.4 EJ/yr
Industrial Liquids Production by Fuel
1990 2005 2020 2035 2050 2065 2080 2095 Units
conventional oil 36.59 43.88 42.06 45.04 40.90 39.42 41.68 42.08 EJ/yr
unconventional oil 0.00 0.00 0.27 0.76 2.05 2.76 4.25 5.12 EJ/yr
coal liquids 0.00 0.00 0.09 0.12 0.10 0.03 0.05 0.06 EJ/yr
coal liquids w/ ccs 0.00 0.00 0.00 0.00 0.02 0.03 0.05 0.05 EJ/yr
bio fuels 0.01 0.05 0.34 1.03 3.94 8.54 10.55 12.43 EJ/yr
gas liquids 0.00 0.00 0.33 1.23 1.95 1.94 1.67 1.38 EJ/yr
energy reduction 0.0 0.0 4.2 8.4 16.0 25.2 25.2 19.8 EJ/yr
total: w/o reduction 36.6 43.9 43.1 48.2 49.0 52.7 58.3 61.1 EJ/yr
Hydrogen Production by Fuel
1990 2005 2020 2035 2050 2065 2080 2095 Units
gas 0.00 0.00 2.14 7.83 10.76 11.80 14.55 15.65 EJ/yr
gas w/ccs 0.00 0.00 0.30 1.17 2.98 5.00 5.73 6.86 EJ/yr
coal 0.00 0.00 0.29 0.51 0.39 0.31 0.53 0.61 EJ/yr
coal w/ccs 0.00 0.00 0.08 0.33 1.11 2.21 3.02 3.94 EJ/yr
biomass 0.00 0.00 0.15 0.44 0.63 0.65 0.93 1.04 EJ/yr
biomass w/ccs 0.00 0.00 0.05 0.13 0.80 2.81 2.83 3.91 EJ/yr
nuclear 0.00 0.00 0.12 0.74 1.83 3.22 4.25 5.29 EJ/yr
bulk electricity 0.00 0.00 0.10 0.37 0.70 1.00 1.33 1.52 EJ/yr
wind 0.00 0.00 0.07 0.10 0.22 0.39 0.56 0.70 EJ/yr
solar 0.00 0.00 0.07 0.14 0.38 0.71 1.05 1.43 EJ/yr
energy reduction 0.00 0.00 -0.12 -6.52 -10.43 -13.86 -14.79 -13.23 EJ/yr
total: w/o reduction 0.00 0.00 3.37 11.76 19.79 28.10 34.76 40.95 EJ/yr

Scenario: adv stab Page 103
Dedicated Bioenergy Crops, Crop Residues, and Municipal Solid Waste Consumption by Sector
1990 2005 2020 2035 2050 2065 2080 2095 Units
direct buildings 4.5 5.5 8.4 8.1 7.1 6.0 5.3 4.5 EJ/yr
Industry 7.4 11.3 23.1 35.3 53.1 67.7 74.8 81.4 EJ/yr
electricity 2.1 2.5 3.9 6.6 15.2 26.4 31.0 31.7 EJ/yr
refined liquids: tran & bldg 0.5 2.2 5.3 8.3 19.8 33.3 37.4 39.9 EJ/yr
hydrogen 0.0 0.0 0.4 1.2 2.9 7.0 7.4 9.7 EJ/yr
synthetic gas 0.0 0.0 0.0 0.0 0.0 0.0 0.0 0.1 EJ/yr
energy reduction 0.0 0.0 -9.1 -15.7 -37.9 -56.9 -54.6 -37.2 EJ/yr
total: w/o reduction 14.4 21.6 41.2 59.5 98.2 140.5 155.9 167.3 EJ/yr
Biomass Production
1990 2005 2020 2035 2050 2065 2080 2095 Units
waste biomass 14.4 21.5 20.1 25.0 44.6 61.9 62.9 60.3 EJ
dedicated biomass crops 0.0 0.0 21.1 34.4 51.7 64.7 74.5 86.2 EJ
municipal solid waste 0.0 0.1 0.0 0.1 1.9 13.8 18.5 20.7 EJ
waste biomass 0.0 0.0 11.6 12.8 -2.9 -16.6 -15.8 -11.0 EJ
reduction in biomass crops 0.0 0.0 -21.1 -29.5 -35.0 -29.9 -25.8 -15.9 EJ
reduction in municipal solid wate 0.0 0.0 0.4 1.0 -0.1 -10.4 -13.0 -10.3 EJ
total: w/o reduction 14.4 21.6 31.7 42.9 60.4 94.0 114.3 140.4 EJ
Arable Land Use by Type
1990 2005 2020 2035 2050 2065 2080 2095 Units
urban land 0.05 0.05 0.05 0.05 0.05 0.05 0.05 0.05 billion Ha
crops 1.20 1.21 0.90 0.77 0.64 0.55 0.50 0.43 billion Ha
pasture 0.70 0.73 0.73 0.73 0.71 0.71 0.71 0.71 billion Ha
managed forest 0.69 0.74 0.84 0.92 0.99 1.02 1.04 1.07 billion Ha
bioenergy crops 0.00 0.00 0.09 0.15 0.23 0.29 0.31 0.33 billion Ha
unmanaged forest 3.32 3.25 3.97 3.93 3.91 3.91 3.91 3.90 billion Ha
unmanaged land 4.58 4.58 3.99 3.99 4.01 4.03 4.04 4.06 billion Ha
rock/ice/desert/tundra 2.62 2.62 2.62 2.62 2.62 2.62 2.62 2.62 billion Ha
total 10.50 10.50 10.50 10.50 10.50 10.50 10.50 10.50 billion Ha

Scenario: adv stab Page 104
Population, GDP, and Energy Indicators
1990 2005 2020 2035 2050 2065 2080 2095 Units
Economic Activity reference GDP $26.1 $39.4 $57.9 $82.9 $117.1 $165.5 $233.2 $319.3 trillion 2005$
Final Energy Intensity building 3.41 2.86 2.28 1.57 1.09 0.77 0.56 0.40 GJ/1000$ (2005$)
Final Energy Intensity industry 4.06 3.14 2.52 2.03 1.54 1.20 0.94 0.74 GJ/1000$ (2005$)
Final Energy Intensity transportation 2.55 2.33 1.74 1.27 0.95 0.71 0.55 0.42 GJ/1000$ (2005$)
Final Energy Intensity total 10.02 8.33 6.54 4.86 3.57 2.68 2.04 1.56 GJ/1000$ (2005$)
Population population 5.2 6.4 7.5 8.3 8.8 9.1 9.0 8.7 billion
Final Energy per Capita building 16.9 17.5 17.6 15.6 14.4 14.0 14.4 14.8 GJ/capita
Final Energy per Capita industry 20.2 19.2 19.4 20.1 20.4 22.0 24.4 26.9 GJ/capita
Final Energy per Capita transportation 12.7 14.3 13.4 12.6 12.6 12.9 14.1 15.4 GJ/capita
Final Energy per Capita total 49.8 51.0 50.3 48.3 47.4 48.9 53.0 57.0 GJ/capita
Long-Term Equilibrium Energy Producer Prices
1990 2005 2020 2035 2050 2065 2080 2095 Units
global oil (w/o carbon charge) $27.6 $32.4 $39.5 $40.0 $42.2 $42.1 $42.1 $41.8 $/barrel (2005$)
global oil (w/ carbon charge) $27.6 $32.4 $44.0 $49.4 $62.2 $69.6 $66.9 $66.7 $/barrel (2005$)
domestic natural gas (w/o carbon charge) $3.3 $3.8 $4.3 $3.9 $4.1 $4.3 $4.5 $4.6 $/mmBTU (2005$)
domestic natural gas (w/ carbon charge) $3.3 $3.8 $4.8 $5.1 $6.5 $7.6 $7.5 $7.5 $/mmBTU (2005$)
domestic coal (w/o carbon charge) $1.7 $1.7 $1.7 $1.7 $1.6 $1.6 $1.5 $1.4 $/GJ (2005$)
domestic coal (w/ carbon charge) $1.7 $1.7 $2.8 $3.8 $6.0 $7.6 $6.8 $6.8 $/GJ (2005$)
domestic electricity (w/ carbon charge) 6.21 5.74 6.23 5.99 6.09 5.97 5.73 5.67 cents/kWh (2005$)
carbon price 0.0 0.0 37.4 77.8 161.7 220.2 196.5 196.8 $/tC (2005$)
Crop Prices
1990 2005 2020 2035 2050 2065 2080 2095 Units
global corn 33 33 40 43 49 51 46 43 $/Gcal (2005$)
global rice 32 32 41 44 51 50 42 36 $/Gcal (2005$)
global wheat 27 27 37 42 50 50 41 35 $/Gcal (2005$)
Emissions by Sectors
1990 2005 2020 2035 2050 2065 2080 2095 Units
buildings 0.858 0.860 0.929 0.811 0.644 0.530 0.506 0.451 GtC/yr
industry 1.623 1.706 1.701 1.617 1.147 0.877 0.979 0.952 GtC/yr
transportation 1.355 1.863 1.986 1.886 1.651 1.339 1.360 1.288 GtC/yr
electricity 1.909 2.848 3.216 3.093 1.747 0.384 0.125 0.015 GtC/yr
cement 0.261 0.483 0.706 0.797 0.648 0.410 0.500 0.465 GtC/yr
emissions reduction 0.000 0.000 1.727 5.060 10.288 15.396 18.145 21.128 GtC/yr
total: w/o reduction 6.006 7.760 8.539 8.204 5.836 3.540 3.470 3.171 GtC/yr

Scenario: adv stab Page 105
Final Energy Consumption: Buildings Final Energy Consumption: Industry (Does not Include Feedstocks)
Final Energy Consumption: Transportation Final Energy Consumption by Sector
0
50
100
150
200
250
300
1990 2005 2020 2035 2050 2065 2080 2095
EJ
/yr
liquids gascoal biomasselectricity trad biomassenergy reduction
0
50
100
150
200
250
300
350
400
1990 2005 2020 2035 2050 2065 2080 2095
EJ
/yr
liquids gas
coal biomass
electricity hydrogen
energy reduction feedstocks
0
50
100
150
200
250
300
1990 2005 2020 2035 2050 2065 2080 2095
EJ
/yr
liquids gas
coal electricity
hydrogen energy reduction
0
100
200
300
400
500
600
700
800
900
1990 2005 2020 2035 2050 2065 2080 2095
EJ
/yr
buildings industry
transportation energy reduction
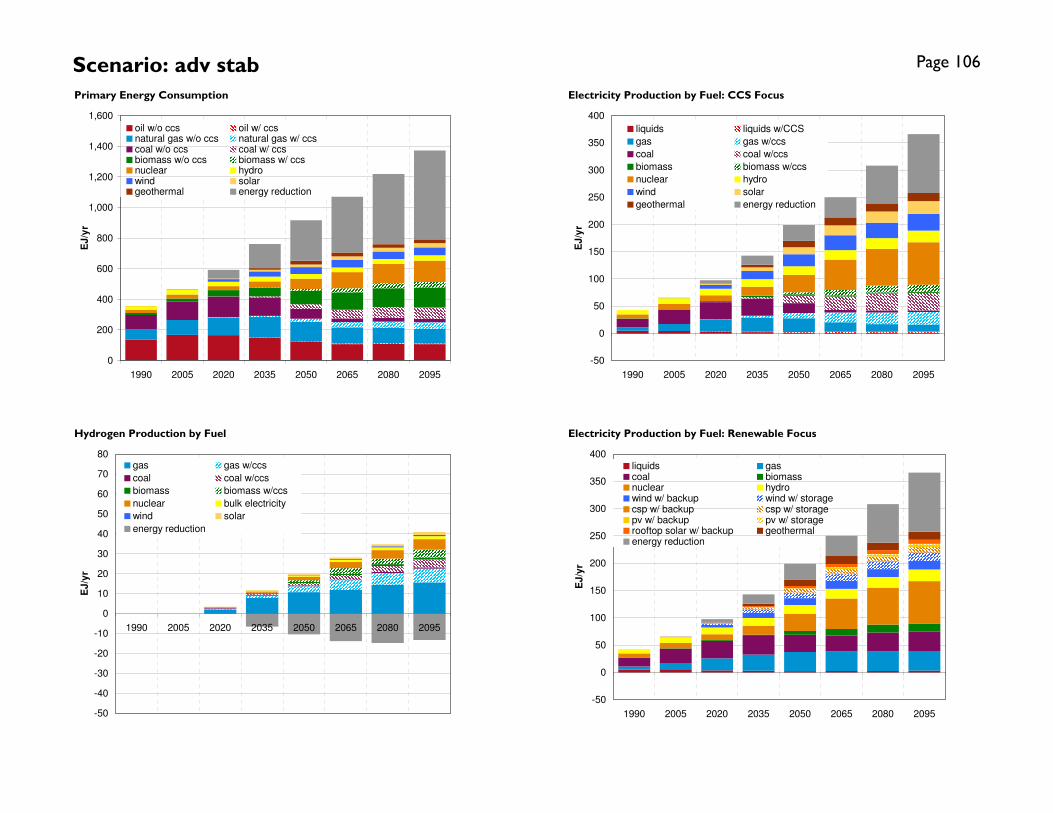
Scenario: adv stab Page 106
Primary Energy Consumption Electricity Production by Fuel: CCS Focus
Hydrogen Production by Fuel Electricity Production by Fuel: Renewable Focus
-50
0
50
100
150
200
250
300
350
400
1990 2005 2020 2035 2050 2065 2080 2095
EJ
/yr
liquids liquids w/CCS
gas gas w/ccs
coal coal w/ccs
biomass biomass w/ccs
nuclear hydro
wind solar
geothermal energy reduction
-50
-40
-30
-20
-10
0
10
20
30
40
50
60
70
80
1990 2005 2020 2035 2050 2065 2080 2095
EJ
/yr
gas gas w/ccs
coal coal w/ccs
biomass biomass w/ccs
nuclear bulk electricity
wind solar
energy reduction
-50
0
50
100
150
200
250
300
350
400
1990 2005 2020 2035 2050 2065 2080 2095
EJ
/yr
liquids gascoal biomassnuclear hydrowind w/ backup wind w/ storagecsp w/ backup csp w/ storagepv w/ backup pv w/ storagerooftop solar w/ backup geothermalenergy reduction
0
200
400
600
800
1,000
1,200
1,400
1,600
1990 2005 2020 2035 2050 2065 2080 2095
EJ
/yr
oil w/o ccs oil w/ ccsnatural gas w/o ccs natural gas w/ ccscoal w/o ccs coal w/ ccsbiomass w/o ccs biomass w/ ccsnuclear hydrowind solargeothermal energy reduction

Scenario: adv stab Page 107
Industrial Liquids Production by Fuel (Feedstocks and Fuel) Transportation Fuels Composition
Final Energy Intensity Final Energy per Capita
0
50
100
150
200
250
300
1990 2005 2020 2035 2050 2065 2080 2095
EJ
/yr
conventional oil unconventional oilcoal liquids coal liquids w/ ccs bio fuels gas liquidsgas coalelectricity hydrogenenergy reduction
0
10
20
30
40
50
60
70
80
90
1990 2005 2020 2035 2050 2065 2080 2095
EJ
/yr
conventional oil unconventional oilcoal liquids coal liquids w/ ccs bio fuels gas liquidsenergy reduction
0
2
4
6
8
10
12
1990 2005 2020 2035 2050 2065 2080 2095
GJ
/10
00
$ (
20
05
$)
0
50
100
150
200
250
300
350
Re
fere
nc
e G
DP
(T
rillio
n 2
00
5$
)
building
industry
transportation
total
reference GDP
0
10
20
30
40
50
60
1990 2005 2020 2035 2050 2065 2080 2095
GJ
/ca
pit
a
0
1
2
3
4
5
6
7
8
9
10
Po
pu
lati
on
(b
illio
n)
building
industry
transportation
total
population

Scenario: adv stab Page 108
Dedicated Energy Crops, Waste Biomass, and Municipal Solid Waste Consumption by Sector Land Use by Type
Biomass Production by Source CO2 Emissions by Sector
-125
-100
-75
-50
-25
0
25
50
75
100
125
150
175
200
225
250
1990 2005 2020 2035 2050 2065 2080 2095
EJ
/yr
energy reductionsynthetic gashydrogenrefined liquids: tran & bldgelectricityIndustrydirect buildings
0
2
4
6
8
10
12
14
16
1990 2005 2020 2035 2050 2065 2080 2095
Billio
n H
ec
tare
s
urban land cropspasture managed forestbioenergy crops unmanaged forestunmanaged land rock/ice/desert/tundra
-125
-100
-75
-50
-25
0
25
50
75
100
125
150
175
200
225
250
1990 2005 2020 2035 2050 2065 2080 2095
EJ
/yr
reduction in municipal solid wate
reduction in biomass crops
waste biomass
municipal solid waste
dedicated biomass crops
waste biomass
-5
0
5
10
15
20
25
1990 2005 2020 2035 2050 2065 2080 2095
GtC
/yr
buildings industry
transportation electricity
cement emissions reduction
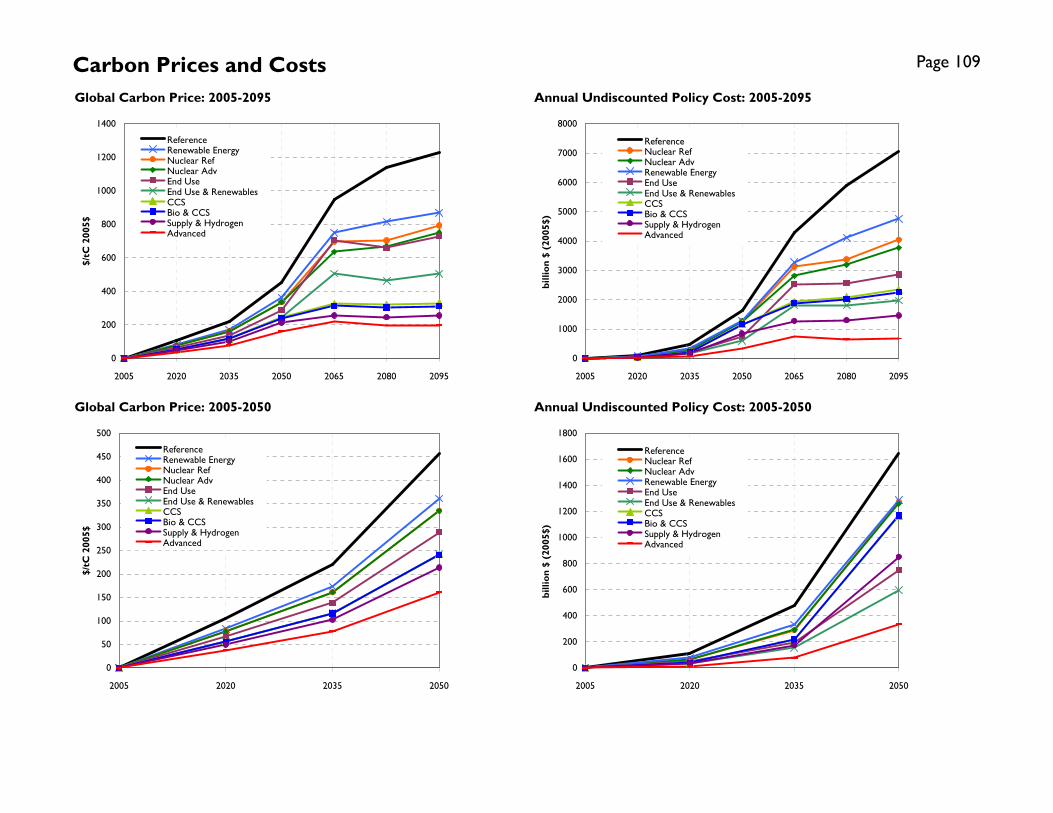
Carbon Prices and Costs Page 109
Global Carbon Price: 2005-2095 Annual Undiscounted Policy Cost: 2005-2095
Global Carbon Price: 2005-2050 Annual Undiscounted Policy Cost: 2005-2050
0
200
400
600
800
1000
1200
1400
2005 2020 2035 2050 2065 2080 2095
$/tC 2005$
ReferenceRenewable EnergyNuclear RefNuclear AdvEnd UseEnd Use & RenewablesCCSBio & CCSSupply & HydrogenAdvanced
0
1000
2000
3000
4000
5000
6000
7000
8000
2005 2020 2035 2050 2065 2080 2095
billion $ (2005$)
ReferenceNuclear RefNuclear AdvRenewable EnergyEnd UseEnd Use & RenewablesCCSBio & CCSSupply & HydrogenAdvanced
0
50
100
150
200
250
300
350
400
450
500
2005 2020 2035 2050
$/tC 2005$
ReferenceRenewable EnergyNuclear RefNuclear AdvEnd UseEnd Use & RenewablesCCSBio & CCSSupply & HydrogenAdvanced
0
200
400
600
800
1000
1200
1400
1600
1800
2005 2020 2035 2050
billion $ (2005$)
ReferenceNuclear RefNuclear AdvRenewable EnergyEnd UseEnd Use & RenewablesCCSBio & CCSSupply & HydrogenAdvanced

Carbon Prices and Costs Page 110
Reference 11.6 trillion 2005$
Renewable Energy 8.5 trillion 2005$
Nuclear Ref 7.8 trillion 2005$
Nuclear Adv 7.4 trillion 2005$
End Use 5.6 trillion 2005$
End Use & Renewables 4.1 trillion 2005$
CCS 5.6 trillion 2005$
Bio & CCS 5.5 trillion 2005$
Supply & Hydrogen 3.9 trillion 2005$
Advanced 1.9 trillion 2005$
Total Discounted Policy Cost 2005 through 2095
(5% Discount Rate)
Note that these costs assume comprehensive
international action and allocations of permits among
countries so that the U.S. neither buys nor sells
permits.

Appendix B: 550 ppmv Scenarios: Global Results


Scenario: ref Page 1
Final Energy Consumption
1990 2005 2020 2035 2050 2065 2080 2095 Units
building liquids 15.2 16.4 20.9 24.7 26.8 30.6 32.4 31.0 EJ/yr
building gas 18.7 26.7 29.3 31.2 31.5 29.6 29.2 28.3 EJ/yr
building coal 10.1 5.1 8.0 8.3 7.7 7.1 6.2 5.3 EJ/yr
building biomass 4.5 5.5 7.9 9.0 9.3 9.8 9.4 8.6 EJ/yr
building electricity 16.9 29.0 44.7 65.7 89.2 114.3 145.2 174.8 EJ/yr
building trad biomass 23.5 29.9 32.1 27.9 22.9 17.9 12.2 8.0 EJ/yr
building energy reduction 0.0 0.0 0.0 0.0 0.0 0.0 0.0 0.0 EJ/yr
total: w/o reduction 88.9 112.7 142.9 166.6 187.4 209.2 234.7 256.0 EJ/yr
industry liquids 22.4 21.2 20.3 23.9 27.3 35.3 37.9 33.5 EJ/yr
industry gas 26.6 30.5 34.0 39.6 39.4 32.9 33.3 34.1 EJ/yr
industry coal 31.4 35.8 59.0 77.7 88.6 94.5 91.4 88.0 EJ/yr
industry biomass 7.3 11.2 17.1 23.4 31.1 43.3 50.0 57.7 EJ/yr
industry electricity 18.1 24.8 34.7 49.0 66.3 80.1 94.4 109.8 EJ/yr
industry hydrogen 0.0 0.0 2.7 3.1 3.7 4.4 5.0 5.8 EJ/yr
industry energy reduction 0.0 0.0 0.0 0.0 0.0 0.0 0.0 0.0 EJ/yr
industry feedstocks 15.2 23.7 27.9 33.6 38.7 43.4 46.3 48.2 EJ/yr
total: w/o reduction 105.8 123.6 167.9 216.7 256.3 290.6 312.0 328.9 EJ/yr
transportation liquids 62.7 87.7 101.1 120.9 136.7 154.4 171.9 177.0 EJ/yr
transportation gas 2.2 3.0 6.5 12.2 17.8 21.1 26.8 32.9 EJ/yr
transportation coal 0.5 0.2 0.4 0.5 0.6 0.5 0.3 0.2 EJ/yr
transportation electricity 1.0 1.0 2.2 4.8 11.0 16.0 21.3 27.3 EJ/yr
transportation hydrogen 0.0 0.0 0.6 2.1 5.7 9.8 15.0 21.9 EJ/yr
transportation energy reduction 0.0 0.0 0.0 0.0 0.0 0.0 0.0 0.0 EJ/yr
total: w/o reduction 66.4 91.8 110.7 140.4 171.7 201.7 235.2 259.3 EJ/yr
total final energy buildings 88.9 112.7 142.9 166.6 187.4 209.2 234.7 256.0 EJ/yr
total final energy industry 105.8 123.6 167.9 216.7 256.3 290.6 312.0 328.9 EJ/yr
total final energy transportation 66.4 91.8 110.7 140.4 171.7 201.7 235.2 259.3 EJ/yr
total final energy energy reduction 0.0 0.0 0.0 0.0 0.0 0.0 0.0 0.0 EJ/yr
total: w/o reduction 261.1 328.1 421.5 523.7 615.4 701.5 781.9 844.2 EJ/yr

Scenario: ref Page 2
Primary Energy w/CCS
1990 2005 2020 2035 2050 2065 2080 2095 Units
oil w/o ccs 135.6 167.5 183.8 203.9 211.9 235.1 252.4 207.8 EJ/yr
oil w/ ccs 0.0 0.0 0.0 0.0 0.0 0.0 0.0 0.0 EJ/yr
natural gas w/o ccs 69.9 97.5 130.4 179.6 224.3 233.1 256.2 290.0 EJ/yr
natural gas w/ ccs 0.0 0.0 0.0 0.0 0.0 0.0 0.0 0.0 EJ/yr
coal w/o ccs 91.2 119.1 176.8 242.2 317.2 402.3 480.2 597.1 EJ/yr
coal w/ ccs 0.0 0.0 0.0 0.0 0.0 0.0 0.0 0.0 EJ/yr
biomass w/o ccs 14.4 21.6 32.1 43.8 60.3 83.6 101.3 130.1 EJ/yr
biomass w/ ccs 0.0 0.0 0.0 0.0 0.0 0.0 0.0 0.0 EJ/yr
nuclear 21.0 26.1 23.3 21.6 19.3 18.7 18.3 18.1 EJ/yr
hydro 23.6 29.2 29.0 30.5 31.1 33.5 36.1 38.9 EJ/yr
wind 0.0 0.9 14.7 31.3 39.1 46.9 53.9 64.2 EJ/yr
solar 0.0 0.1 1.3 3.5 5.9 9.0 12.9 19.0 EJ/yr
geothermal 0.4 0.5 1.3 5.2 7.9 8.0 7.8 7.7 EJ/yr
energy reduction 0.0 0.0 0.0 0.0 0.0 0.0 0.0 0.0 EJ/yr
total: w/o reduction 356 463 593 762 917 1070 1219 1373 EJ/yr
Electricity Production by Fuel
1990 2005 2020 2035 2050 2065 2080 2095 Units
oil 4.86 4.33 4.26 3.80 4.44 6.23 8.00 6.13 EJ/yr
oil w/ccs 0.00 0.00 0.00 0.00 0.00 0.00 0.00 0.00 EJ/yr
gas 6.07 12.82 24.71 40.05 58.99 69.35 81.78 95.52 EJ/yr
gas w/ccs 0.00 0.00 0.00 0.00 0.00 0.00 0.00 0.00 EJ/yr
coal 16.06 26.35 37.89 53.64 76.37 102.24 133.45 164.44 EJ/yr
coal w/ccs 0.00 0.00 0.00 0.00 0.00 0.00 0.00 0.00 EJ/yr
biomass 0.43 0.71 1.24 2.48 5.18 7.98 11.07 14.05 EJ/yr
biomass w/ccs 0.00 0.00 0.00 0.00 0.00 0.00 0.00 0.00 EJ/yr
nuclear 7.36 9.97 9.95 9.95 9.95 9.95 9.95 9.95 EJ/yr
hydro 7.82 10.44 12.13 13.99 15.85 17.70 19.56 21.42 EJ/yr
wind w/backup 0.01 0.36 4.90 10.50 13.65 16.64 19.28 22.91 EJ/yr
wind w/storage 0.00 0.00 1.22 3.66 5.95 8.05 10.00 12.69 EJ/yr
CSP w/backup 0.00 0.00 0.35 0.59 0.60 0.85 1.18 1.78 EJ/yr
CSP w/storage 0.00 0.00 0.12 0.85 1.91 2.78 3.82 5.73 EJ/yr
PV w/backup 0.00 0.04 0.05 0.05 0.20 0.56 1.05 1.54 EJ/yr
PV w/storage 0.00 0.00 0.00 0.03 0.10 0.26 0.47 0.68 EJ/yr
rooftop PV w/backup 0.00 0.00 0.29 0.80 1.68 3.32 4.25 5.00 EJ/yr
geothermal 0.13 0.21 0.57 2.44 4.14 4.32 4.32 4.35 EJ/yr
energy reduction 0.00 0.00 0.00 0.00 0.00 0.00 0.00 0.00 EJ/yr
total: w/o reduction 42.7 65.2 97.7 142.8 199.0 250.2 308.2 366.2 EJ/yr

Scenario: ref Page 3
Transportation Fuels Production by Fuel
1990 2005 2020 2035 2050 2065 2080 2095 Units
conventional oil 62.5 86.8 95.3 102.7 97.9 99.2 99.8 61.5 EJ/yr
unconventional oil 0.0 0.0 1.6 6.7 15.8 24.0 34.6 54.5 EJ/yr
coal liquids 0.0 0.0 1.6 5.2 12.3 20.0 25.7 42.6 EJ/yr
coal liquids w/ ccs 0.0 0.0 0.0 0.0 0.0 0.0 0.0 0.0 EJ/yr
bio fuels 0.2 0.9 1.2 1.7 2.5 3.9 5.6 11.2 EJ/yr
gas liquids 0.0 0.0 1.4 4.7 8.2 7.3 6.1 7.2 EJ/yr
gas 2.2 3.0 6.5 12.2 17.8 21.1 26.8 32.9 EJ/yr
coal 0.5 0.2 0.4 0.5 0.6 0.5 0.3 0.2 EJ/yr
electricity 1.0 1.0 2.2 4.8 11.0 16.0 21.3 27.3 EJ/yr
hydrogen 0.0 0.0 0.6 2.1 5.7 9.8 15.0 21.9 EJ/yr
energy reduction 0.0 0.0 0.0 0.0 0.0 0.0 0.0 0.0 EJ/yr
total: w/o reduction 66.4 91.8 110.7 140.4 171.7 201.7 235.2 259.3 EJ/yr
Industrial Liquids Production by Fuel
1990 2005 2020 2035 2050 2065 2080 2095 Units
conventional oil 36.59 43.89 45.94 51.18 51.64 57.44 56.80 32.92 EJ/yr
unconventional oil 0.00 0.00 0.42 2.16 5.98 9.74 14.06 24.53 EJ/yr
coal liquids 0.00 0.00 0.39 1.53 4.35 7.65 9.63 18.42 EJ/yr
coal liquids w/ ccs 0.00 0.00 0.00 0.00 0.00 0.00 0.00 0.00 EJ/yr
bio fuels 0.01 0.05 0.13 0.25 0.48 0.88 1.27 3.09 EJ/yr
gas liquids 0.00 0.00 0.36 1.43 2.56 2.17 1.64 1.98 EJ/yr
energy reduction 0.0 0.0 0.0 0.0 0.0 0.0 0.0 0.0 EJ/yr
total: w/o reduction 36.6 43.9 47.2 56.5 65.0 77.9 83.4 80.9 EJ/yr
Hydrogen Production by Fuel
1990 2005 2020 2035 2050 2065 2080 2095 Units
gas 0.00 0.00 2.36 3.85 6.72 9.42 12.66 16.68 EJ/yr
gas w/ccs 0.00 0.00 0.00 0.00 0.00 0.00 0.00 0.00 EJ/yr
coal 0.00 0.00 0.54 0.86 1.67 3.15 4.76 7.19 EJ/yr
coal w/ccs 0.00 0.00 0.00 0.00 0.00 0.00 0.00 0.00 EJ/yr
biomass 0.00 0.00 0.16 0.24 0.45 0.81 1.22 1.84 EJ/yr
biomass w/ccs 0.00 0.00 0.00 0.00 0.00 0.00 0.00 0.00 EJ/yr
nuclear 0.00 0.00 0.00 0.00 0.00 0.00 0.00 0.00 EJ/yr
bulk electricity 0.00 0.00 0.08 0.15 0.31 0.51 0.74 1.04 EJ/yr
wind 0.00 0.00 0.06 0.06 0.08 0.13 0.21 0.31 EJ/yr
solar 0.00 0.00 0.06 0.08 0.14 0.23 0.39 0.66 EJ/yr
energy reduction 0.00 0.00 0.00 0.00 0.00 0.00 0.00 0.00 EJ/yr
total: w/o reduction 0.00 0.00 3.24 5.24 9.37 14.25 19.98 27.72 EJ/yr

Scenario: ref Page 4
Dedicated Bioenergy Crops, Crop Residues, and Municipal Solid Waste Consumption by Sector
1990 2005 2020 2035 2050 2065 2080 2095 Units
direct buildings 4.5 5.5 7.9 9.0 9.3 9.8 9.4 8.6 EJ/yr
Industry 7.4 11.3 17.4 23.9 32.0 45.0 52.4 63.2 EJ/yr
electricity 2.1 2.5 3.5 6.4 12.2 18.2 24.7 30.9 EJ/yr
refined liquids: tran & bldg 0.5 2.2 2.9 4.0 5.8 8.9 12.3 23.7 EJ/yr
hydrogen 0.0 0.0 0.4 0.5 0.9 1.7 2.4 3.6 EJ/yr
synthetic gas 0.0 0.0 0.0 0.0 0.0 0.1 0.1 0.1 EJ/yr
energy reduction 0.0 0.0 0.0 0.0 0.0 0.0 0.0 0.0 EJ/yr
total: w/o reduction 14.4 21.6 32.1 43.8 60.3 83.6 101.3 130.1 EJ/yr
Biomass Production
1990 2005 2020 2035 2050 2065 2080 2095 Units
waste biomass 14.4 21.5 31.7 37.9 41.7 45.4 47.1 49.4 EJ
dedicated biomass crops 0.0 0.0 0.0 4.9 16.7 34.8 48.7 70.4 EJ
municipal solid waste 0.0 0.1 0.4 1.0 1.8 3.4 5.5 10.3 EJ
waste biomass 0.0 0.0 0.0 0.0 0.0 0.0 0.0 0.0 EJ
reduction in biomass crops 0.0 0.0 0.0 0.0 0.0 0.0 0.0 0.0 EJ
reduction in municipal solid wate0.0 0.0 0.0 0.0 0.0 0.0 0.0 0.0 EJ
total: w/o reduction 14.4 21.6 32.1 43.8 60.3 83.6 101.3 130.1 EJ
Arable Land Use by Type
1990 2005 2020 2035 2050 2065 2080 2095 Units
urban land 0.05 0.05 0.05 0.05 0.05 0.05 0.05 0.05 billion Ha
crops 1.20 1.21 1.37 1.40 1.37 1.37 1.30 1.24 billion Ha
pasture 0.70 0.73 0.92 1.07 1.17 1.21 1.23 1.18 billion Ha
managed forest 0.69 0.74 0.79 0.84 0.88 0.92 0.95 0.97 billion Ha
bioenergy crops 0.00 0.00 0.00 0.02 0.13 0.42 0.68 1.22 billion Ha
unmanaged forest 3.32 3.25 3.11 3.02 2.94 2.78 2.67 2.46 billion Ha
unmanaged land 4.58 4.58 4.31 4.14 4.01 3.80 3.67 3.43 billion Ha
rock/ice/desert/tundra 2.62 2.62 2.62 2.62 2.62 2.62 2.62 2.62 billion Ha
total 10.50 10.50 10.50 10.50 10.50 10.50 10.50 10.50 billion Ha
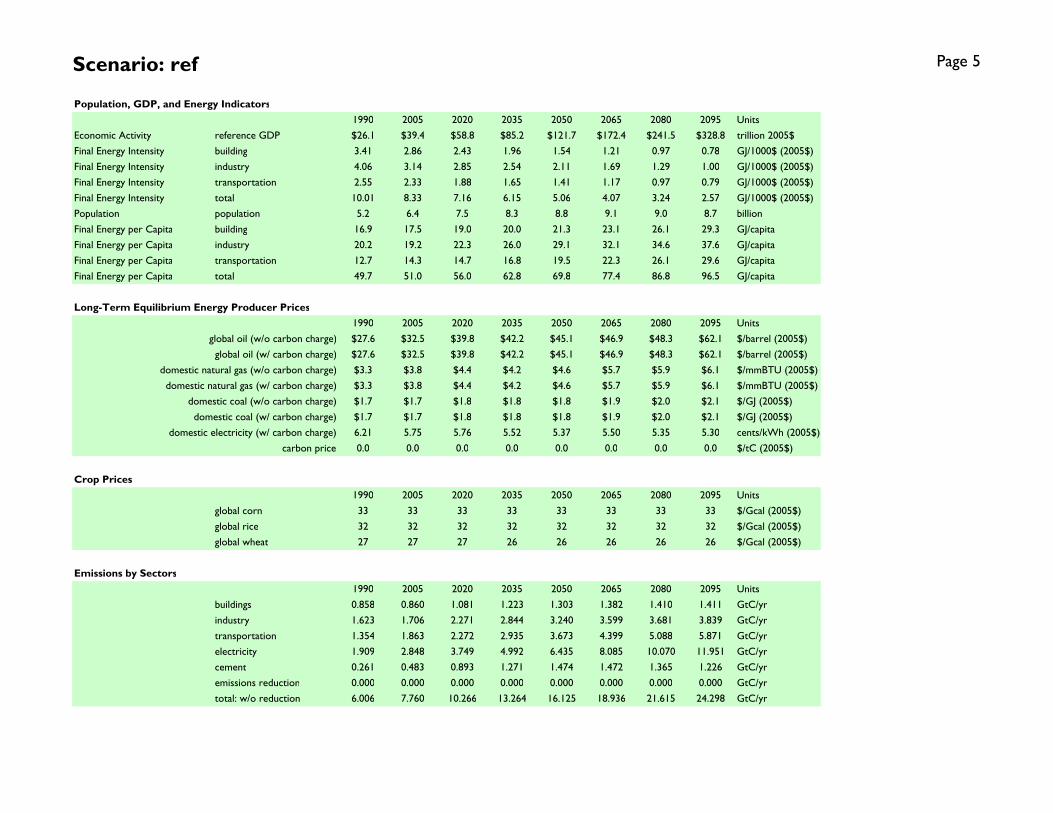
Scenario: ref Page 5
Population, GDP, and Energy Indicators
1990 2005 2020 2035 2050 2065 2080 2095 Units
Economic Activity reference GDP $26.1 $39.4 $58.8 $85.2 $121.7 $172.4 $241.5 $328.8 trillion 2005$
Final Energy Intensity building 3.41 2.86 2.43 1.96 1.54 1.21 0.97 0.78 GJ/1000$ (2005$)
Final Energy Intensity industry 4.06 3.14 2.85 2.54 2.11 1.69 1.29 1.00 GJ/1000$ (2005$)
Final Energy Intensity transportation 2.55 2.33 1.88 1.65 1.41 1.17 0.97 0.79 GJ/1000$ (2005$)
Final Energy Intensity total 10.01 8.33 7.16 6.15 5.06 4.07 3.24 2.57 GJ/1000$ (2005$)
Population population 5.2 6.4 7.5 8.3 8.8 9.1 9.0 8.7 billion
Final Energy per Capita building 16.9 17.5 19.0 20.0 21.3 23.1 26.1 29.3 GJ/capita
Final Energy per Capita industry 20.2 19.2 22.3 26.0 29.1 32.1 34.6 37.6 GJ/capita
Final Energy per Capita transportation 12.7 14.3 14.7 16.8 19.5 22.3 26.1 29.6 GJ/capita
Final Energy per Capita total 49.7 51.0 56.0 62.8 69.8 77.4 86.8 96.5 GJ/capita
Long-Term Equilibrium Energy Producer Prices
1990 2005 2020 2035 2050 2065 2080 2095 Units
global oil (w/o carbon charge) $27.6 $32.5 $39.8 $42.2 $45.1 $46.9 $48.3 $62.1 $/barrel (2005$)
global oil (w/ carbon charge) $27.6 $32.5 $39.8 $42.2 $45.1 $46.9 $48.3 $62.1 $/barrel (2005$)
domestic natural gas (w/o carbon charge) $3.3 $3.8 $4.4 $4.2 $4.6 $5.7 $5.9 $6.1 $/mmBTU (2005$)
domestic natural gas (w/ carbon charge) $3.3 $3.8 $4.4 $4.2 $4.6 $5.7 $5.9 $6.1 $/mmBTU (2005$)
domestic coal (w/o carbon charge) $1.7 $1.7 $1.8 $1.8 $1.8 $1.9 $2.0 $2.1 $/GJ (2005$)
domestic coal (w/ carbon charge) $1.7 $1.7 $1.8 $1.8 $1.8 $1.9 $2.0 $2.1 $/GJ (2005$)
domestic electricity (w/ carbon charge) 6.21 5.75 5.76 5.52 5.37 5.50 5.35 5.30 cents/kWh (2005$)
carbon price 0.0 0.0 0.0 0.0 0.0 0.0 0.0 0.0 $/tC (2005$)
Crop Prices
1990 2005 2020 2035 2050 2065 2080 2095 Units
global corn 33 33 33 33 33 33 33 33 $/Gcal (2005$)
global rice 32 32 32 32 32 32 32 32 $/Gcal (2005$)
global wheat 27 27 27 26 26 26 26 26 $/Gcal (2005$)
Emissions by Sectors
1990 2005 2020 2035 2050 2065 2080 2095 Units
buildings 0.858 0.860 1.081 1.223 1.303 1.382 1.410 1.411 GtC/yr
industry 1.623 1.706 2.271 2.844 3.240 3.599 3.681 3.839 GtC/yr
transportation 1.354 1.863 2.272 2.935 3.673 4.399 5.088 5.871 GtC/yr
electricity 1.909 2.848 3.749 4.992 6.435 8.085 10.070 11.951 GtC/yr
cement 0.261 0.483 0.893 1.271 1.474 1.472 1.365 1.226 GtC/yr
emissions reduction 0.000 0.000 0.000 0.000 0.000 0.000 0.000 0.000 GtC/yr
total: w/o reduction 6.006 7.760 10.266 13.264 16.125 18.936 21.615 24.298 GtC/yr
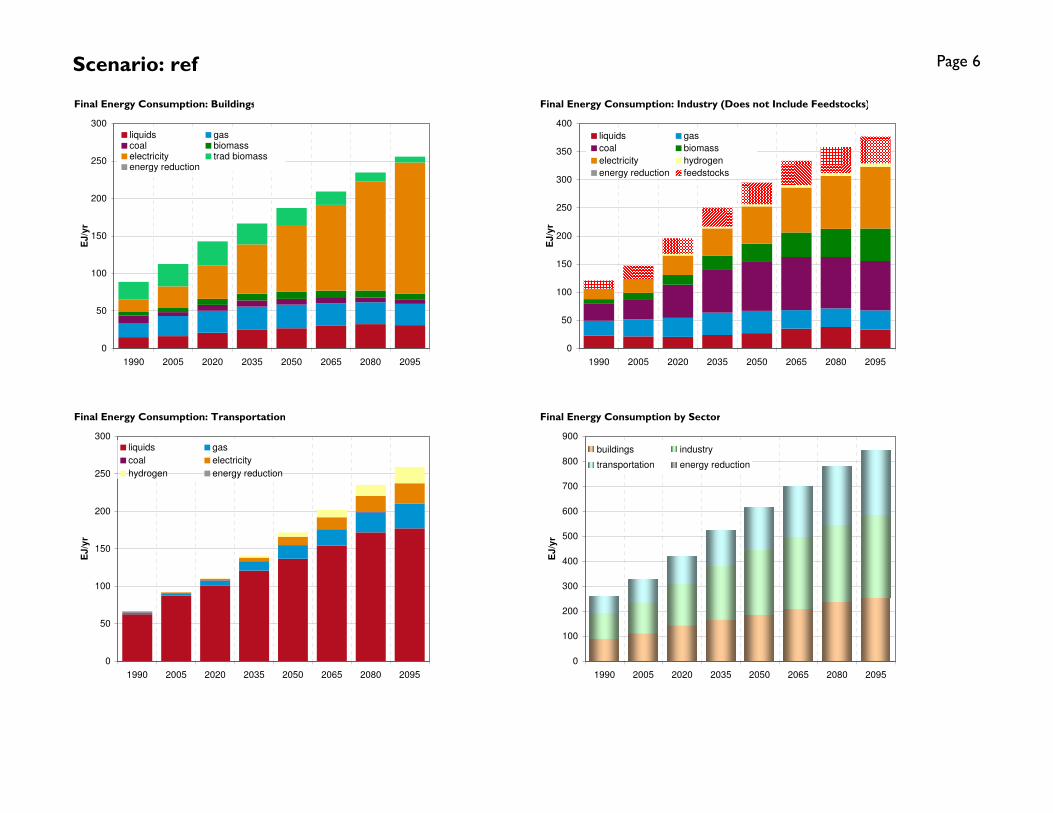
Scenario: ref Page 6
Final Energy Consumption: Buildings Final Energy Consumption: Industry (Does not Include Feedstocks)
Final Energy Consumption: Transportation Final Energy Consumption by Sector
0
50
100
150
200
250
300
1990 2005 2020 2035 2050 2065 2080 2095
EJ
/yr
liquids gascoal biomasselectricity trad biomassenergy reduction
0
50
100
150
200
250
300
350
400
1990 2005 2020 2035 2050 2065 2080 2095
EJ
/yr
liquids gas
coal biomass
electricity hydrogen
energy reduction feedstocks
0
50
100
150
200
250
300
1990 2005 2020 2035 2050 2065 2080 2095
EJ
/yr
liquids gas
coal electricity
hydrogen energy reduction
0
100
200
300
400
500
600
700
800
900
1990 2005 2020 2035 2050 2065 2080 2095
EJ
/yr
buildings industry
transportation energy reduction

Scenario: ref Page 7
Primary Energy Consumption Electricity Production by Fuel: CCS Focus
Hydrogen Production by Fuel Electricity Production by Fuel: Renewable Focus
-50
0
50
100
150
200
250
300
350
400
1990 2005 2020 2035 2050 2065 2080 2095
EJ
/yr
liquids liquids w/CCS
gas gas w/ccs
coal coal w/ccs
biomass biomass w/ccs
nuclear hydro
wind solar
geothermal energy reduction
-50
-40
-30
-20
-10
0
10
20
30
40
50
60
70
80
1990 2005 2020 2035 2050 2065 2080 2095
EJ
/yr
gas gas w/ccs
coal coal w/ccs
biomass biomass w/ccs
nuclear bulk electricity
wind solar
energy reduction
-50
0
50
100
150
200
250
300
350
400
1990 2005 2020 2035 2050 2065 2080 2095
EJ
/yr
liquids gascoal biomassnuclear hydrowind w/ backup wind w/ storagecsp w/ backup csp w/ storagepv w/ backup pv w/ storagerooftop solar w/ backup geothermalenergy reduction
0
200
400
600
800
1,000
1,200
1,400
1,600
1990 2005 2020 2035 2050 2065 2080 2095
EJ
/yr
oil w/o ccs oil w/ ccsnatural gas w/o ccs natural gas w/ ccscoal w/o ccs coal w/ ccsbiomass w/o ccs biomass w/ ccsnuclear hydrowind solargeothermal energy reduction

Scenario: ref Page 8
Industrial Liquids Production by Fuel (Feedstocks and Fuel) Transportation Fuels Composition
Final Energy Intensity Final Energy per Capita
0
50
100
150
200
250
300
1990 2005 2020 2035 2050 2065 2080 2095
EJ
/yr
conventional oil unconventional oilcoal liquids coal liquids w/ ccs bio fuels gas liquidsgas coalelectricity hydrogenenergy reduction
0
10
20
30
40
50
60
70
80
90
1990 2005 2020 2035 2050 2065 2080 2095
EJ
/yr
conventional oil unconventional oilcoal liquids coal liquids w/ ccs bio fuels gas liquidsenergy reduction
0
2
4
6
8
10
12
1990 2005 2020 2035 2050 2065 2080 2095
GJ
/10
00
$ (
20
05
$)
0
50
100
150
200
250
300
350
Re
fere
nc
e G
DP
(T
rillio
n 2
00
5$
)
building
industry
transportation
total
reference GDP
0
20
40
60
80
100
120
1990 2005 2020 2035 2050 2065 2080 2095
GJ
/ca
pit
a
0
1
2
3
4
5
6
7
8
9
10
Po
pu
lati
on
(b
illio
n)
building
industry
transportation
total
population

Scenario: ref Page 9
Dedicated Energy Crops, Waste Biomass, and Municipal Solid Waste Consumption by Sector Land Use by Type
Biomass Production by Source CO2 Emissions by Sector
-125
-100
-75
-50
-25
0
25
50
75
100
125
150
175
200
225
250
1990 2005 2020 2035 2050 2065 2080 2095
EJ
/yr
energy reductionsynthetic gashydrogenrefined liquids: tran & bldgelectricityIndustrydirect buildings
0
2
4
6
8
10
12
14
16
1990 2005 2020 2035 2050 2065 2080 2095
Billio
n H
ec
tare
s
urban land cropspasture managed forestbioenergy crops unmanaged forestunmanaged land rock/ice/desert/tundra
-125
-100
-75
-50
-25
0
25
50
75
100
125
150
175
200
225
250
1990 2005 2020 2035 2050 2065 2080 2095
EJ
/yr
reduction in municipal solid wate
reduction in biomass crops
waste biomass
municipal solid waste
dedicated biomass crops
waste biomass
-5
0
5
10
15
20
25
1990 2005 2020 2035 2050 2065 2080 2095
GtC
/yr
buildings industry
transportation electricity
cement emissions reduction

Scenario: nucref Page 10
Final Energy Consumption
1990 2005 2020 2035 2050 2065 2080 2095 Units
building liquids 15.2 16.4 20.8 24.7 27.0 30.7 32.6 31.6 EJ/yr
building gas 18.7 26.7 29.2 31.4 31.9 30.2 30.1 29.0 EJ/yr
building coal 10.1 5.1 8.0 8.3 7.8 7.2 6.4 5.5 EJ/yr
building biomass 4.5 5.5 7.9 9.0 9.3 9.8 9.5 8.7 EJ/yr
building electricity 16.9 29.0 44.9 65.6 88.7 113.8 144.4 173.5 EJ/yr
building trad biomass 23.5 29.9 32.1 27.8 22.9 17.9 12.2 8.0 EJ/yr
building energy reduction 0.0 0.0 0.0 -0.1 -0.2 -0.4 -0.6 -0.4 EJ/yr
total: w/o reduction 88.9 112.7 142.9 166.7 187.5 209.6 235.2 256.4 EJ/yr
industry liquids 22.4 21.2 20.3 23.9 27.4 35.3 37.9 34.4 EJ/yr
industry gas 26.6 30.5 34.2 40.3 40.5 34.4 35.8 36.5 EJ/yr
industry coal 31.4 35.8 59.0 77.7 89.7 96.2 94.5 91.9 EJ/yr
industry biomass 7.3 11.2 17.1 23.4 31.2 43.4 50.1 58.5 EJ/yr
industry electricity 18.1 24.8 34.9 48.7 65.0 78.6 91.8 105.9 EJ/yr
industry hydrogen 0.0 0.0 2.5 3.0 3.6 4.4 5.0 5.8 EJ/yr
industry energy reduction 0.0 0.0 -0.1 -0.4 -1.1 -1.8 -3.2 -4.2 EJ/yr
industry feedstocks 15.2 23.7 28.0 33.7 38.8 43.6 46.6 48.6 EJ/yr
total: w/o reduction 105.8 123.6 168.0 217.0 257.4 292.3 315.2 333.1 EJ/yr
transportation liquids 62.7 87.7 101.1 120.9 137.0 154.6 172.1 178.2 EJ/yr
transportation gas 2.2 3.0 6.5 12.3 18.1 21.6 27.9 34.0 EJ/yr
transportation coal 0.5 0.2 0.4 0.5 0.6 0.5 0.3 0.2 EJ/yr
transportation electricity 1.0 1.0 2.2 4.7 10.8 15.8 20.9 26.6 EJ/yr
transportation hydrogen 0.0 0.0 0.6 2.1 5.6 9.8 15.0 21.8 EJ/yr
transportation energy reduction 0.0 0.0 -0.1 -0.1 -0.3 -0.5 -0.9 -1.5 EJ/yr
total: w/o reduction 66.4 91.8 110.7 140.6 172.0 202.2 236.1 260.8 EJ/yr
total final energy buildings 88.9 112.7 142.9 166.7 187.5 209.6 235.2 256.4 EJ/yr
total final energy industry 105.8 123.6 168.0 217.0 257.4 292.3 315.2 333.1 EJ/yr
total final energy transportation 66.4 91.8 110.7 140.6 172.0 202.2 236.1 260.8 EJ/yr
total final energy energy reduction 0.0 0.0 -0.1 -0.6 -1.6 -2.6 -4.6 -6.1 EJ/yr
total: w/o reduction 261.1 328.1 421.6 524.3 617.0 704.2 786.6 850.3 EJ/yr
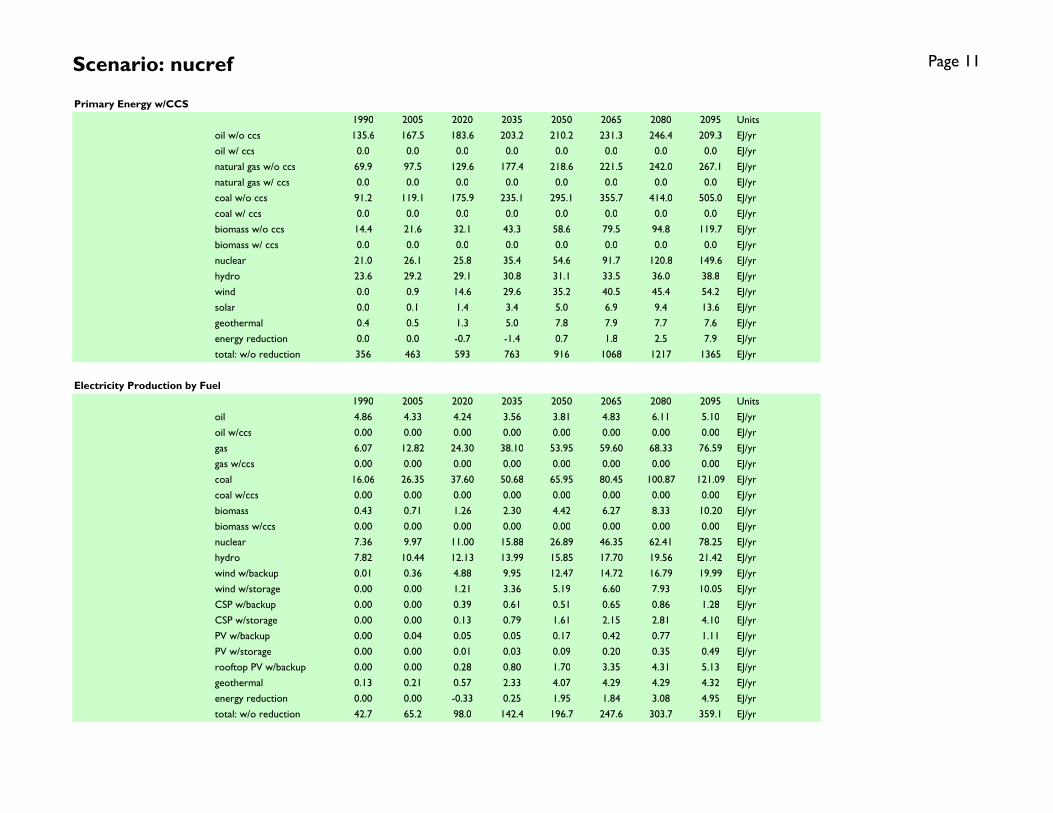
Scenario: nucref Page 11
Primary Energy w/CCS
1990 2005 2020 2035 2050 2065 2080 2095 Units
oil w/o ccs 135.6 167.5 183.6 203.2 210.2 231.3 246.4 209.3 EJ/yr
oil w/ ccs 0.0 0.0 0.0 0.0 0.0 0.0 0.0 0.0 EJ/yr
natural gas w/o ccs 69.9 97.5 129.6 177.4 218.6 221.5 242.0 267.1 EJ/yr
natural gas w/ ccs 0.0 0.0 0.0 0.0 0.0 0.0 0.0 0.0 EJ/yr
coal w/o ccs 91.2 119.1 175.9 235.1 295.1 355.7 414.0 505.0 EJ/yr
coal w/ ccs 0.0 0.0 0.0 0.0 0.0 0.0 0.0 0.0 EJ/yr
biomass w/o ccs 14.4 21.6 32.1 43.3 58.6 79.5 94.8 119.7 EJ/yr
biomass w/ ccs 0.0 0.0 0.0 0.0 0.0 0.0 0.0 0.0 EJ/yr
nuclear 21.0 26.1 25.8 35.4 54.6 91.7 120.8 149.6 EJ/yr
hydro 23.6 29.2 29.1 30.8 31.1 33.5 36.0 38.8 EJ/yr
wind 0.0 0.9 14.6 29.6 35.2 40.5 45.4 54.2 EJ/yr
solar 0.0 0.1 1.4 3.4 5.0 6.9 9.4 13.6 EJ/yr
geothermal 0.4 0.5 1.3 5.0 7.8 7.9 7.7 7.6 EJ/yr
energy reduction 0.0 0.0 -0.7 -1.4 0.7 1.8 2.5 7.9 EJ/yr
total: w/o reduction 356 463 593 763 916 1068 1217 1365 EJ/yr
Electricity Production by Fuel
1990 2005 2020 2035 2050 2065 2080 2095 Units
oil 4.86 4.33 4.24 3.56 3.81 4.83 6.11 5.10 EJ/yr
oil w/ccs 0.00 0.00 0.00 0.00 0.00 0.00 0.00 0.00 EJ/yr
gas 6.07 12.82 24.30 38.10 53.95 59.60 68.33 76.59 EJ/yr
gas w/ccs 0.00 0.00 0.00 0.00 0.00 0.00 0.00 0.00 EJ/yr
coal 16.06 26.35 37.60 50.68 65.95 80.45 100.87 121.09 EJ/yr
coal w/ccs 0.00 0.00 0.00 0.00 0.00 0.00 0.00 0.00 EJ/yr
biomass 0.43 0.71 1.26 2.30 4.42 6.27 8.33 10.20 EJ/yr
biomass w/ccs 0.00 0.00 0.00 0.00 0.00 0.00 0.00 0.00 EJ/yr
nuclear 7.36 9.97 11.00 15.88 26.89 46.35 62.41 78.25 EJ/yr
hydro 7.82 10.44 12.13 13.99 15.85 17.70 19.56 21.42 EJ/yr
wind w/backup 0.01 0.36 4.88 9.95 12.47 14.72 16.79 19.99 EJ/yr
wind w/storage 0.00 0.00 1.21 3.36 5.19 6.60 7.93 10.05 EJ/yr
CSP w/backup 0.00 0.00 0.39 0.61 0.51 0.65 0.86 1.28 EJ/yr
CSP w/storage 0.00 0.00 0.13 0.79 1.61 2.15 2.81 4.10 EJ/yr
PV w/backup 0.00 0.04 0.05 0.05 0.17 0.42 0.77 1.11 EJ/yr
PV w/storage 0.00 0.00 0.01 0.03 0.09 0.20 0.35 0.49 EJ/yr
rooftop PV w/backup 0.00 0.00 0.28 0.80 1.70 3.35 4.31 5.13 EJ/yr
geothermal 0.13 0.21 0.57 2.33 4.07 4.29 4.29 4.32 EJ/yr
energy reduction 0.00 0.00 -0.33 0.25 1.95 1.84 3.08 4.95 EJ/yr
total: w/o reduction 42.7 65.2 98.0 142.4 196.7 247.6 303.7 359.1 EJ/yr
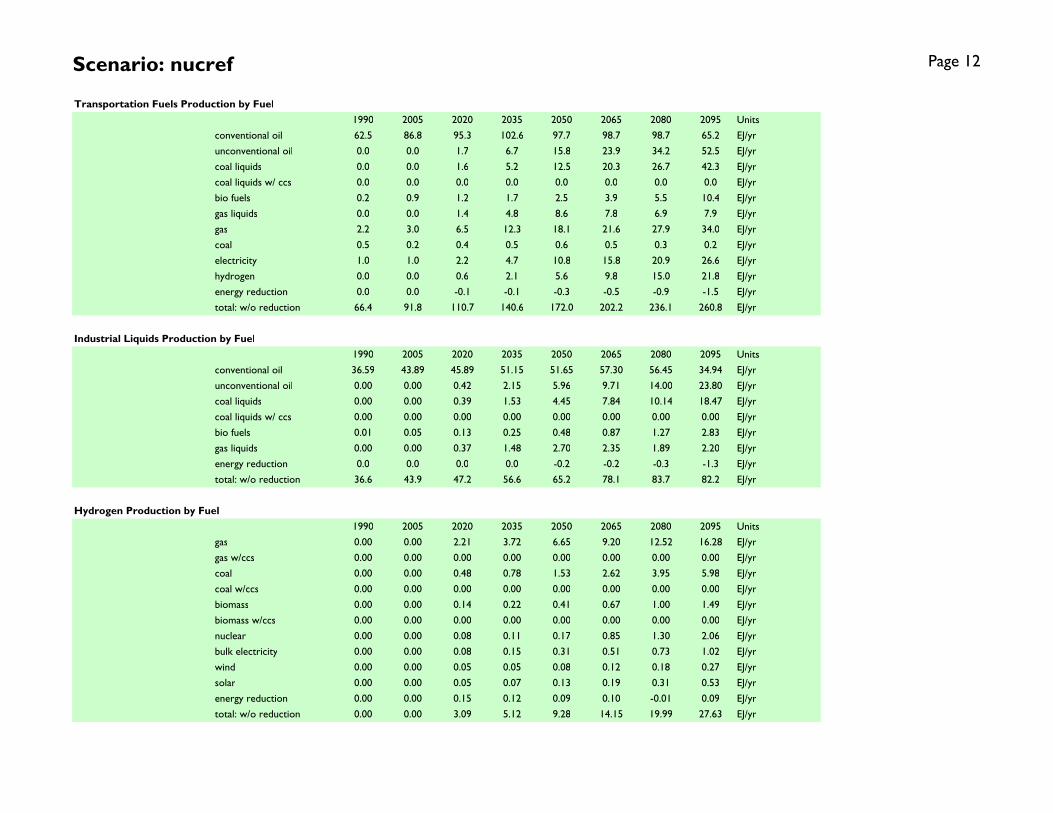
Scenario: nucref Page 12
Transportation Fuels Production by Fuel
1990 2005 2020 2035 2050 2065 2080 2095 Units
conventional oil 62.5 86.8 95.3 102.6 97.7 98.7 98.7 65.2 EJ/yr
unconventional oil 0.0 0.0 1.7 6.7 15.8 23.9 34.2 52.5 EJ/yr
coal liquids 0.0 0.0 1.6 5.2 12.5 20.3 26.7 42.3 EJ/yr
coal liquids w/ ccs 0.0 0.0 0.0 0.0 0.0 0.0 0.0 0.0 EJ/yr
bio fuels 0.2 0.9 1.2 1.7 2.5 3.9 5.5 10.4 EJ/yr
gas liquids 0.0 0.0 1.4 4.8 8.6 7.8 6.9 7.9 EJ/yr
gas 2.2 3.0 6.5 12.3 18.1 21.6 27.9 34.0 EJ/yr
coal 0.5 0.2 0.4 0.5 0.6 0.5 0.3 0.2 EJ/yr
electricity 1.0 1.0 2.2 4.7 10.8 15.8 20.9 26.6 EJ/yr
hydrogen 0.0 0.0 0.6 2.1 5.6 9.8 15.0 21.8 EJ/yr
energy reduction 0.0 0.0 -0.1 -0.1 -0.3 -0.5 -0.9 -1.5 EJ/yr
total: w/o reduction 66.4 91.8 110.7 140.6 172.0 202.2 236.1 260.8 EJ/yr
Industrial Liquids Production by Fuel
1990 2005 2020 2035 2050 2065 2080 2095 Units
conventional oil 36.59 43.89 45.89 51.15 51.65 57.30 56.45 34.94 EJ/yr
unconventional oil 0.00 0.00 0.42 2.15 5.96 9.71 14.00 23.80 EJ/yr
coal liquids 0.00 0.00 0.39 1.53 4.45 7.84 10.14 18.47 EJ/yr
coal liquids w/ ccs 0.00 0.00 0.00 0.00 0.00 0.00 0.00 0.00 EJ/yr
bio fuels 0.01 0.05 0.13 0.25 0.48 0.87 1.27 2.83 EJ/yr
gas liquids 0.00 0.00 0.37 1.48 2.70 2.35 1.89 2.20 EJ/yr
energy reduction 0.0 0.0 0.0 0.0 -0.2 -0.2 -0.3 -1.3 EJ/yr
total: w/o reduction 36.6 43.9 47.2 56.6 65.2 78.1 83.7 82.2 EJ/yr
Hydrogen Production by Fuel
1990 2005 2020 2035 2050 2065 2080 2095 Units
gas 0.00 0.00 2.21 3.72 6.65 9.20 12.52 16.28 EJ/yr
gas w/ccs 0.00 0.00 0.00 0.00 0.00 0.00 0.00 0.00 EJ/yr
coal 0.00 0.00 0.48 0.78 1.53 2.62 3.95 5.98 EJ/yr
coal w/ccs 0.00 0.00 0.00 0.00 0.00 0.00 0.00 0.00 EJ/yr
biomass 0.00 0.00 0.14 0.22 0.41 0.67 1.00 1.49 EJ/yr
biomass w/ccs 0.00 0.00 0.00 0.00 0.00 0.00 0.00 0.00 EJ/yr
nuclear 0.00 0.00 0.08 0.11 0.17 0.85 1.30 2.06 EJ/yr
bulk electricity 0.00 0.00 0.08 0.15 0.31 0.51 0.73 1.02 EJ/yr
wind 0.00 0.00 0.05 0.05 0.08 0.12 0.18 0.27 EJ/yr
solar 0.00 0.00 0.05 0.07 0.13 0.19 0.31 0.53 EJ/yr
energy reduction 0.00 0.00 0.15 0.12 0.09 0.10 -0.01 0.09 EJ/yr
total: w/o reduction 0.00 0.00 3.09 5.12 9.28 14.15 19.99 27.63 EJ/yr

Scenario: nucref Page 13
Dedicated Bioenergy Crops, Crop Residues, and Municipal Solid Waste Consumption by Sector
1990 2005 2020 2035 2050 2065 2080 2095 Units
direct buildings 4.5 5.5 7.9 9.0 9.3 9.8 9.5 8.7 EJ/yr
Industry 7.4 11.3 17.4 23.9 32.1 45.1 52.5 63.6 EJ/yr
electricity 2.1 2.5 3.6 6.0 10.4 14.3 18.6 22.4 EJ/yr
refined liquids: tran & bldg 0.5 2.2 2.9 4.0 5.8 8.9 12.2 22.0 EJ/yr
hydrogen 0.0 0.0 0.3 0.5 0.9 1.4 2.0 2.9 EJ/yr
synthetic gas 0.0 0.0 0.0 0.0 0.0 0.1 0.1 0.1 EJ/yr
energy reduction 0.0 0.0 0.1 0.5 1.7 4.1 6.5 10.4 EJ/yr
total: w/o reduction 14.4 21.6 32.1 43.3 58.6 79.5 94.8 119.7 EJ/yr
Biomass Production
1990 2005 2020 2035 2050 2065 2080 2095 Units
waste biomass 14.4 21.5 31.6 37.8 41.6 44.8 46.2 47.9 EJ
dedicated biomass crops 0.0 0.0 0.0 4.5 15.3 31.6 43.8 63.4 EJ
municipal solid waste 0.0 0.1 0.4 1.0 1.7 3.1 4.8 8.4 EJ
waste biomass 0.0 0.0 0.0 0.1 0.2 0.5 0.9 1.4 EJ
reduction in biomass crops 0.0 0.0 0.0 0.4 1.4 3.2 4.9 7.0 EJ
reduction in municipal solid wate0.0 0.0 0.0 0.0 0.1 0.3 0.7 1.9 EJ
total: w/o reduction 14.4 21.6 32.1 43.8 60.2 83.3 100.6 128.1 EJ
Arable Land Use by Type
1990 2005 2020 2035 2050 2065 2080 2095 Units
urban land 0.05 0.05 0.05 0.05 0.05 0.05 0.05 0.05 billion Ha
crops 1.20 1.21 1.37 1.40 1.36 1.34 1.27 1.20 billion Ha
pasture 0.70 0.73 0.92 1.07 1.17 1.22 1.25 1.22 billion Ha
managed forest 0.69 0.74 0.79 0.84 0.89 0.92 0.95 0.98 billion Ha
bioenergy crops 0.00 0.00 0.00 0.02 0.11 0.35 0.55 0.98 billion Ha
unmanaged forest 3.32 3.25 3.11 3.02 2.95 2.82 2.73 2.56 billion Ha
unmanaged land 4.58 4.58 4.31 4.15 4.03 3.85 3.75 3.57 billion Ha
rock/ice/desert/tundra 2.62 2.62 2.62 2.62 2.62 2.62 2.62 2.62 billion Ha
total 10.50 10.50 10.50 10.50 10.50 10.50 10.50 10.50 billion Ha

Scenario: nucref Page 14
Population, GDP, and Energy Indicators
1990 2005 2020 2035 2050 2065 2080 2095 Units
Economic Activity reference GDP $26.1 $39.4 $58.8 $85.2 $121.7 $172.4 $241.5 $328.9 trillion 2005$
Final Energy Intensity building 3.41 2.86 2.43 1.96 1.54 1.22 0.97 0.78 GJ/1000$ (2005$)
Final Energy Intensity industry 4.06 3.14 2.86 2.55 2.11 1.70 1.31 1.01 GJ/1000$ (2005$)
Final Energy Intensity transportation 2.55 2.33 1.88 1.65 1.41 1.17 0.98 0.79 GJ/1000$ (2005$)
Final Energy Intensity total 10.01 8.33 7.17 6.15 5.07 4.08 3.26 2.59 GJ/1000$ (2005$)
Population population 5.2 6.4 7.5 8.3 8.8 9.1 9.0 8.7 billion
Final Energy per Capita building 16.9 17.5 19.0 20.0 21.3 23.1 26.1 29.3 GJ/capita
Final Energy per Capita industry 20.2 19.2 22.3 26.0 29.2 32.3 35.0 38.1 GJ/capita
Final Energy per Capita transportation 12.7 14.3 14.7 16.8 19.5 22.3 26.2 29.8 GJ/capita
Final Energy per Capita total 49.7 51.0 56.0 62.9 70.0 77.7 87.3 97.2 GJ/capita
Long-Term Equilibrium Energy Producer Prices
1990 2005 2020 2035 2050 2065 2080 2095 Units
global oil (w/o carbon charge) $27.6 $32.5 $39.8 $42.2 $45.1 $46.8 $48.1 $59.1 $/barrel (2005$)
global oil (w/ carbon charge) $27.6 $32.5 $39.8 $42.2 $45.1 $46.8 $48.1 $59.1 $/barrel (2005$)
domestic natural gas (w/o carbon charge) $3.3 $3.8 $4.4 $4.2 $4.5 $5.6 $5.7 $5.9 $/mmBTU (2005$)
domestic natural gas (w/ carbon charge) $3.3 $3.8 $4.4 $4.2 $4.5 $5.6 $5.7 $5.9 $/mmBTU (2005$)
domestic coal (w/o carbon charge) $1.7 $1.7 $1.8 $1.8 $1.8 $1.9 $1.9 $2.0 $/GJ (2005$)
domestic coal (w/ carbon charge) $1.7 $1.7 $1.8 $1.8 $1.8 $1.9 $1.9 $2.0 $/GJ (2005$)
domestic electricity (w/ carbon charge) 6.21 5.75 5.78 5.58 5.47 5.58 5.43 5.41 cents/kWh (2005$)
carbon price 0.0 0.0 0.0 0.0 0.0 0.0 0.0 0.0 $/tC (2005$)
Crop Prices
1990 2005 2020 2035 2050 2065 2080 2095 Units
global corn 33 33 33 33 33 33 33 33 $/Gcal (2005$)
global rice 32 32 32 32 32 32 32 31 $/Gcal (2005$)
global wheat 27 27 27 26 26 26 26 26 $/Gcal (2005$)
Emissions by Sectors
1990 2005 2020 2035 2050 2065 2080 2095 Units
buildings 0.858 0.860 1.079 1.226 1.315 1.398 1.438 1.441 GtC/yr
industry 1.623 1.706 2.266 2.851 3.289 3.663 3.808 3.991 GtC/yr
transportation 1.354 1.863 2.272 2.937 3.684 4.403 5.111 5.864 GtC/yr
electricity 1.909 2.848 3.717 4.740 5.643 6.483 7.759 8.956 GtC/yr
cement 0.261 0.483 0.893 1.271 1.474 1.473 1.367 1.228 GtC/yr
emissions reduction 0.000 0.000 0.039 0.239 0.720 1.517 2.132 2.818 GtC/yr
total: w/o reduction 6.006 7.760 10.227 13.025 15.405 17.419 19.483 21.480 GtC/yr

Scenario: nucref Page 15
Final Energy Consumption: Buildings Final Energy Consumption: Industry (Does not Include Feedstocks)
Final Energy Consumption: Transportation Final Energy Consumption by Sector
0
50
100
150
200
250
300
1990 2005 2020 2035 2050 2065 2080 2095
EJ
/yr
liquids gascoal biomasselectricity trad biomassenergy reduction
0
50
100
150
200
250
300
350
400
450
1990 2005 2020 2035 2050 2065 2080 2095
EJ
/yr
liquids gas
coal biomass
electricity hydrogen
energy reduction feedstocks
0
50
100
150
200
250
300
1990 2005 2020 2035 2050 2065 2080 2095
EJ
/yr
liquids gas
coal electricity
hydrogen energy reduction
0
100
200
300
400
500
600
700
800
900
1990 2005 2020 2035 2050 2065 2080 2095
EJ
/yr
buildings industry
transportation energy reduction

Scenario: nucref Page 16
Primary Energy Consumption Electricity Production by Fuel: CCS Focus
Hydrogen Production by Fuel Electricity Production by Fuel: Renewable Focus
-50
0
50
100
150
200
250
300
350
400
1990 2005 2020 2035 2050 2065 2080 2095
EJ
/yr
liquids liquids w/CCS
gas gas w/ccs
coal coal w/ccs
biomass biomass w/ccs
nuclear hydro
wind solar
geothermal energy reduction
-50
-40
-30
-20
-10
0
10
20
30
40
50
60
70
80
1990 2005 2020 2035 2050 2065 2080 2095
EJ
/yr
gas gas w/ccs
coal coal w/ccs
biomass biomass w/ccs
nuclear bulk electricity
wind solar
energy reduction
-50
0
50
100
150
200
250
300
350
400
1990 2005 2020 2035 2050 2065 2080 2095
EJ
/yr
liquids gascoal biomassnuclear hydrowind w/ backup wind w/ storagecsp w/ backup csp w/ storagepv w/ backup pv w/ storagerooftop solar w/ backup geothermalenergy reduction
0
200
400
600
800
1,000
1,200
1,400
1,600
1990 2005 2020 2035 2050 2065 2080 2095
EJ
/yr
oil w/o ccs oil w/ ccsnatural gas w/o ccs natural gas w/ ccscoal w/o ccs coal w/ ccsbiomass w/o ccs biomass w/ ccsnuclear hydrowind solargeothermal energy reduction
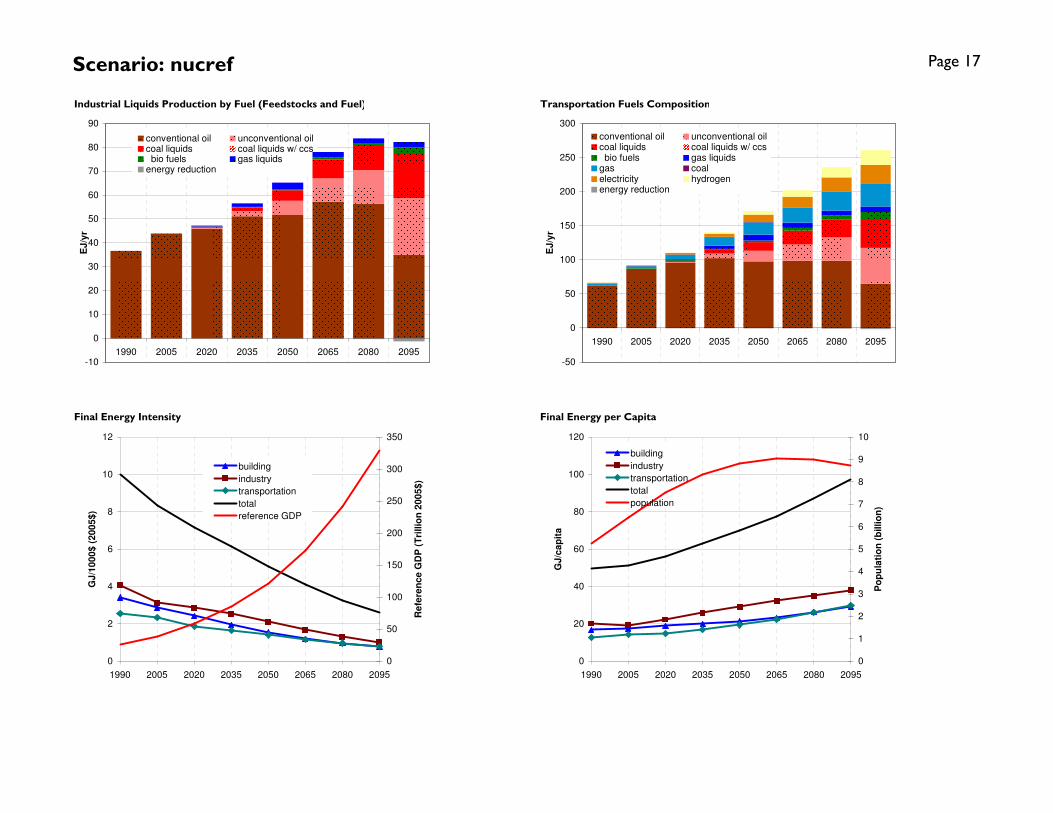
Scenario: nucref Page 17
Industrial Liquids Production by Fuel (Feedstocks and Fuel) Transportation Fuels Composition
Final Energy Intensity Final Energy per Capita
-50
0
50
100
150
200
250
300
1990 2005 2020 2035 2050 2065 2080 2095
EJ
/yr
conventional oil unconventional oilcoal liquids coal liquids w/ ccs bio fuels gas liquidsgas coalelectricity hydrogenenergy reduction
-10
0
10
20
30
40
50
60
70
80
90
1990 2005 2020 2035 2050 2065 2080 2095
EJ
/yr
conventional oil unconventional oilcoal liquids coal liquids w/ ccs bio fuels gas liquidsenergy reduction
0
2
4
6
8
10
12
1990 2005 2020 2035 2050 2065 2080 2095
GJ
/10
00
$ (
20
05
$)
0
50
100
150
200
250
300
350
Re
fere
nc
e G
DP
(T
rillio
n 2
00
5$
)
building
industry
transportation
total
reference GDP
0
20
40
60
80
100
120
1990 2005 2020 2035 2050 2065 2080 2095
GJ
/ca
pit
a
0
1
2
3
4
5
6
7
8
9
10
Po
pu
lati
on
(b
illio
n)
building
industry
transportation
total
population

Scenario: nucref Page 18
Dedicated Energy Crops, Waste Biomass, and Municipal Solid Waste Consumption by Sector Land Use by Type
Biomass Production by Source CO2 Emissions by Sector
-125
-100
-75
-50
-25
0
25
50
75
100
125
150
175
200
225
250
1990 2005 2020 2035 2050 2065 2080 2095
EJ
/yr
energy reductionsynthetic gashydrogenrefined liquids: tran & bldgelectricityIndustrydirect buildings
0
2
4
6
8
10
12
14
16
1990 2005 2020 2035 2050 2065 2080 2095
Billio
n H
ec
tare
s
urban land cropspasture managed forestbioenergy crops unmanaged forestunmanaged land rock/ice/desert/tundra
-125
-100
-75
-50
-25
0
25
50
75
100
125
150
175
200
225
250
1990 2005 2020 2035 2050 2065 2080 2095
EJ
/yr
reduction in municipal solid wate
reduction in biomass crops
waste biomass
municipal solid waste
dedicated biomass crops
waste biomass
-5
0
5
10
15
20
25
1990 2005 2020 2035 2050 2065 2080 2095
GtC
/yr
buildings industry
transportation electricity
cement emissions reduction

Scenario: ref stab Page 19
Final Energy Consumption
1990 2005 2020 2035 2050 2065 2080 2095 Units
building liquids 15.2 16.4 20.0 23.0 24.2 25.2 21.8 15.1 EJ/yr
building gas 18.7 26.7 28.5 29.8 28.9 25.1 20.3 12.8 EJ/yr
building coal 10.1 5.1 6.5 5.7 3.8 2.0 0.7 0.2 EJ/yr
building biomass 4.5 5.5 8.4 9.4 9.4 8.5 5.4 2.4 EJ/yr
building electricity 16.9 29.0 42.7 60.7 77.8 93.0 108.3 122.8 EJ/yr
building trad biomass 23.5 29.9 32.3 28.9 24.9 21.1 16.8 12.4 EJ/yr
building energy reduction 0.0 0.0 4.5 9.2 18.3 34.3 61.3 90.3 EJ/yr
total: w/o reduction 88.9 112.7 138.3 157.5 169.0 174.9 173.3 165.7 EJ/yr
industry liquids 22.4 21.2 20.3 24.1 27.4 30.8 25.6 15.1 EJ/yr
industry gas 26.6 30.5 32.4 36.6 33.5 25.1 19.0 11.0 EJ/yr
industry coal 31.4 35.8 46.7 49.5 37.3 20.0 8.1 2.2 EJ/yr
industry biomass 7.3 11.2 21.2 31.2 45.9 60.9 51.0 33.1 EJ/yr
industry electricity 18.1 24.8 34.3 47.6 61.5 72.2 84.9 104.7 EJ/yr
industry hydrogen 0.0 0.0 2.8 3.4 4.3 5.4 6.3 6.8 EJ/yr
industry energy reduction 0.0 0.0 10.2 24.2 46.4 76.1 117.2 156.0 EJ/yr
industry feedstocks 15.2 23.7 26.7 30.8 33.1 34.0 31.8 29.3 EJ/yr
total: w/o reduction 105.8 123.6 157.8 192.4 209.9 214.5 194.9 172.9 EJ/yr
transportation liquids 62.7 87.7 99.3 116.3 127.4 135.7 135.0 113.5 EJ/yr
transportation gas 2.2 3.0 6.3 11.7 16.6 19.9 23.7 23.4 EJ/yr
transportation coal 0.5 0.2 0.3 0.3 0.2 0.1 0.0 0.0 EJ/yr
transportation electricity 1.0 1.0 2.1 4.7 10.5 15.2 21.3 32.5 EJ/yr
transportation hydrogen 0.0 0.0 0.6 2.1 5.8 10.2 16.2 24.6 EJ/yr
transportation energy reduction 0.0 0.0 2.1 5.4 11.2 20.7 39.1 65.3 EJ/yr
total: w/o reduction 66.4 91.8 108.5 135.0 160.5 181.1 196.2 194.0 EJ/yr
total final energy buildings 88.9 112.7 138.3 157.5 169.0 174.9 173.3 165.7 EJ/yr
total final energy industry 105.8 123.6 157.8 192.4 209.9 214.5 194.9 172.9 EJ/yr
total final energy transportation 66.4 91.8 108.5 135.0 160.5 181.1 196.2 194.0 EJ/yr
total final energy energy reduction 0.0 0.0 16.8 38.8 76.0 131.1 217.5 311.6 EJ/yr
total: w/o reduction 261.1 328.1 404.6 484.9 539.4 570.5 564.4 532.7 EJ/yr

Scenario: ref stab Page 20
Primary Energy w/CCS
1990 2005 2020 2035 2050 2065 2080 2095 Units
oil w/o ccs 135.6 167.5 179.6 197.1 202.7 205.5 183.5 121.2 EJ/yr
oil w/ ccs 0.0 0.0 0.0 0.0 0.0 0.0 0.0 0.0 EJ/yr
natural gas w/o ccs 69.9 97.5 126.2 169.6 206.9 206.7 207.7 150.8 EJ/yr
natural gas w/ ccs 0.0 0.0 0.0 0.0 0.0 0.0 0.0 0.0 EJ/yr
coal w/o ccs 91.2 119.1 153.5 178.7 168.2 141.5 70.9 17.2 EJ/yr
coal w/ ccs 0.0 0.0 0.0 0.0 0.0 0.0 0.0 0.0 EJ/yr
biomass w/o ccs 14.4 21.6 39.1 59.4 96.1 150.3 182.7 204.0 EJ/yr
biomass w/ ccs 0.0 0.0 0.0 0.0 0.0 0.0 0.0 0.0 EJ/yr
nuclear 21.0 26.1 23.4 21.5 18.6 17.7 15.7 15.0 EJ/yr
hydro 23.6 29.2 29.2 30.5 30.5 32.2 32.7 34.2 EJ/yr
wind 0.0 0.9 15.7 34.9 47.8 65.5 94.6 147.3 EJ/yr
solar 0.0 0.1 1.3 4.1 8.8 18.0 47.8 137.7 EJ/yr
geothermal 0.4 0.5 1.4 5.6 7.9 7.7 7.1 7.0 EJ/yr
energy reduction 0.0 0.0 23.5 60.3 129.4 224.9 376.4 538.5 EJ/yr
total: w/o reduction 356 463 569 701 788 845 843 834 EJ/yr
Electricity Production by Fuel
1990 2005 2020 2035 2050 2065 2080 2095 Units
oil 4.86 4.33 4.15 3.73 4.22 5.50 7.34 6.76 EJ/yr
oil w/ccs 0.00 0.00 0.00 0.00 0.00 0.00 0.00 0.00 EJ/yr
gas 6.07 12.82 23.83 37.69 54.23 61.35 70.12 50.44 EJ/yr
gas w/ccs 0.00 0.00 0.00 0.00 0.00 0.00 0.00 0.00 EJ/yr
coal 16.06 26.35 35.20 45.21 51.42 51.33 28.79 6.57 EJ/yr
coal w/ccs 0.00 0.00 0.00 0.00 0.00 0.00 0.00 0.00 EJ/yr
biomass 0.43 0.71 1.38 3.09 7.53 12.67 19.79 21.56 EJ/yr
biomass w/ccs 0.00 0.00 0.00 0.00 0.00 0.00 0.00 0.00 EJ/yr
nuclear 7.36 9.97 9.95 9.95 9.95 9.95 9.95 9.95 EJ/yr
hydro 7.82 10.44 12.13 13.99 15.85 17.70 19.56 21.42 EJ/yr
wind w/backup 0.01 0.36 5.13 11.42 16.04 21.67 30.83 44.16 EJ/yr
wind w/storage 0.00 0.00 1.37 4.38 8.18 13.72 25.02 46.83 EJ/yr
CSP w/backup 0.00 0.00 0.33 0.64 0.89 1.70 4.57 14.27 EJ/yr
CSP w/storage 0.00 0.00 0.12 1.06 2.84 5.59 14.83 46.60 EJ/yr
PV w/backup 0.00 0.04 0.05 0.06 0.30 1.13 4.07 9.31 EJ/yr
PV w/storage 0.00 0.00 0.01 0.03 0.16 0.53 1.94 5.71 EJ/yr
rooftop PV w/backup 0.00 0.00 0.31 0.92 2.36 5.42 8.60 12.23 EJ/yr
geothermal 0.13 0.21 0.59 2.61 4.24 4.39 4.46 4.54 EJ/yr
energy reduction 0.00 0.00 3.19 8.56 22.66 43.41 78.28 126.93 EJ/yr
total: w/o reduction 42.7 65.2 94.6 134.8 178.2 212.7 249.9 300.4 EJ/yr

Scenario: ref stab Page 21
Transportation Fuels Production by Fuel
1990 2005 2020 2035 2050 2065 2080 2095 Units
conventional oil 62.5 86.8 93.9 101.1 97.7 94.8 86.9 59.5 EJ/yr
unconventional oil 0.0 0.0 1.4 5.2 12.0 15.4 14.2 8.0 EJ/yr
coal liquids 0.0 0.0 0.8 1.6 1.8 1.0 0.0 0.0 EJ/yr
coal liquids w/ ccs 0.0 0.0 0.0 0.0 0.0 0.0 0.0 0.0 EJ/yr
bio fuels 0.2 0.9 1.9 3.6 7.6 17.3 28.7 43.7 EJ/yr
gas liquids 0.0 0.0 1.4 4.8 8.3 7.1 5.1 2.3 EJ/yr
gas 2.2 3.0 6.3 11.7 16.6 19.9 23.7 23.4 EJ/yr
coal 0.5 0.2 0.3 0.3 0.2 0.1 0.0 0.0 EJ/yr
electricity 1.0 1.0 2.1 4.7 10.5 15.2 21.3 32.5 EJ/yr
hydrogen 0.0 0.0 0.6 2.1 5.8 10.2 16.2 24.6 EJ/yr
energy reduction 0.0 0.0 2.1 5.4 11.2 20.7 39.1 65.3 EJ/yr
total: w/o reduction 66.4 91.8 108.5 135.0 160.5 181.1 196.2 194.0 EJ/yr
Industrial Liquids Production by Fuel
1990 2005 2020 2035 2050 2065 2080 2095 Units
conventional oil 36.59 43.89 44.89 49.93 50.69 51.56 44.45 28.09 EJ/yr
unconventional oil 0.00 0.00 0.34 1.47 4.05 5.02 1.82 0.21 EJ/yr
coal liquids 0.00 0.00 0.16 0.35 0.37 0.01 0.00 0.00 EJ/yr
coal liquids w/ ccs 0.00 0.00 0.00 0.00 0.00 0.00 0.00 0.00 EJ/yr
bio fuels 0.01 0.05 0.26 0.70 1.97 5.36 9.03 15.24 EJ/yr
gas liquids 0.00 0.00 0.35 1.47 2.53 2.05 1.28 0.19 EJ/yr
energy reduction 0.0 0.0 1.3 2.6 5.4 13.9 26.8 37.2 EJ/yr
total: w/o reduction 36.6 43.9 46.0 53.9 59.6 64.0 56.6 43.7 EJ/yr
Hydrogen Production by Fuel
1990 2005 2020 2035 2050 2065 2080 2095 Units
gas 0.00 0.00 2.47 4.14 7.61 11.66 16.02 15.35 EJ/yr
gas w/ccs 0.00 0.00 0.00 0.00 0.00 0.00 0.00 0.00 EJ/yr
coal 0.00 0.00 0.48 0.66 0.98 1.07 0.85 0.63 EJ/yr
coal w/ccs 0.00 0.00 0.00 0.00 0.00 0.00 0.00 0.00 EJ/yr
biomass 0.00 0.00 0.21 0.35 0.75 1.42 1.98 2.67 EJ/yr
biomass w/ccs 0.00 0.00 0.00 0.00 0.00 0.00 0.00 0.00 EJ/yr
nuclear 0.00 0.00 0.00 0.00 0.00 0.00 0.00 0.00 EJ/yr
bulk electricity 0.00 0.00 0.08 0.16 0.34 0.61 1.01 1.59 EJ/yr
wind 0.00 0.00 0.07 0.07 0.13 0.28 0.65 1.87 EJ/yr
solar 0.00 0.00 0.07 0.11 0.25 0.59 2.01 9.35 EJ/yr
energy reduction 0.00 0.00 -0.12 -0.25 -0.69 -1.38 -2.53 -3.75 EJ/yr
total: w/o reduction 0.00 0.00 3.36 5.49 10.06 15.63 22.51 31.47 EJ/yr

Scenario: ref stab Page 22
Dedicated Bioenergy Crops, Crop Residues, and Municipal Solid Waste Consumption by Sector
1990 2005 2020 2035 2050 2065 2080 2095 Units
direct buildings 4.5 5.5 8.4 9.4 9.4 8.5 5.4 2.4 EJ/yr
Industry 7.4 11.3 21.7 32.6 49.7 71.1 67.7 60.4 EJ/yr
electricity 2.1 2.5 3.9 7.9 17.6 28.8 43.8 46.7 EJ/yr
refined liquids: tran & bldg 0.5 2.2 4.6 8.7 17.8 38.9 61.8 89.1 EJ/yr
hydrogen 0.0 0.0 0.5 0.8 1.6 2.9 4.0 5.2 EJ/yr
synthetic gas 0.0 0.0 0.0 0.0 0.0 0.1 0.1 0.0 EJ/yr
energy reduction 0.0 0.0 -7.0 -15.6 -35.9 -66.7 -81.4 -73.9 EJ/yr
total: w/o reduction 14.4 21.6 39.1 59.4 96.1 150.3 182.7 204.0 EJ/yr
Biomass Production
1990 2005 2020 2035 2050 2065 2080 2095 Units
waste biomass 14.4 21.5 23.6 32.8 50.9 74.3 84.2 82.8 EJ
dedicated biomass crops 0.0 0.0 15.4 26.3 40.0 53.9 68.6 82.8 EJ
municipal solid waste 0.0 0.1 0.1 0.4 5.2 22.1 30.0 38.5 EJ
waste biomass 0.0 0.0 8.1 5.1 -9.2 -28.9 -37.1 -33.4 EJ
reduction in biomass crops 0.0 0.0 -15.4 -21.3 -23.2 -19.1 -19.8 -12.4 EJ
reduction in municipal solid wate0.0 0.0 0.4 0.7 -3.4 -18.7 -24.5 -28.1 EJ
total: w/o reduction 14.4 21.6 31.8 43.2 63.7 102.3 125.8 158.2 EJ
Arable Land Use by Type
1990 2005 2020 2035 2050 2065 2080 2095 Units
urban land 0.05 0.05 0.05 0.05 0.05 0.05 0.05 0.05 billion Ha
crops 1.20 1.21 1.04 0.98 0.84 0.71 0.59 0.49 billion Ha
pasture 0.70 0.73 0.74 0.73 0.72 0.70 0.69 0.69 billion Ha
managed forest 0.69 0.74 0.83 0.91 0.98 1.01 1.00 0.97 billion Ha
bioenergy crops 0.00 0.00 0.06 0.12 0.19 0.27 0.34 0.41 billion Ha
unmanaged forest 3.32 3.25 3.90 3.85 3.84 3.86 3.88 3.93 billion Ha
unmanaged land 4.58 4.58 3.93 3.90 3.93 3.97 3.99 4.02 billion Ha
rock/ice/desert/tundra 2.62 2.62 2.62 2.62 2.62 2.62 2.62 2.62 billion Ha
total 10.50 10.50 10.50 10.50 10.50 10.50 10.50 10.50 billion Ha
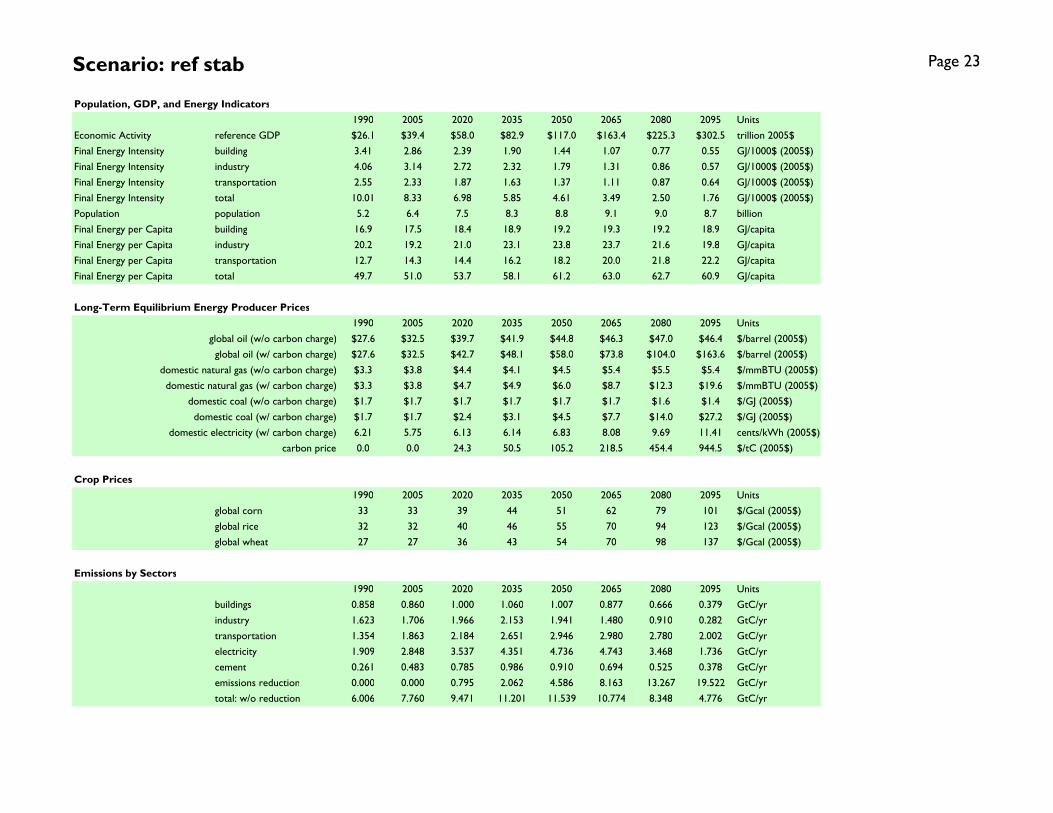
Scenario: ref stab Page 23
Population, GDP, and Energy Indicators
1990 2005 2020 2035 2050 2065 2080 2095 Units
Economic Activity reference GDP $26.1 $39.4 $58.0 $82.9 $117.0 $163.4 $225.3 $302.5 trillion 2005$
Final Energy Intensity building 3.41 2.86 2.39 1.90 1.44 1.07 0.77 0.55 GJ/1000$ (2005$)
Final Energy Intensity industry 4.06 3.14 2.72 2.32 1.79 1.31 0.86 0.57 GJ/1000$ (2005$)
Final Energy Intensity transportation 2.55 2.33 1.87 1.63 1.37 1.11 0.87 0.64 GJ/1000$ (2005$)
Final Energy Intensity total 10.01 8.33 6.98 5.85 4.61 3.49 2.50 1.76 GJ/1000$ (2005$)
Population population 5.2 6.4 7.5 8.3 8.8 9.1 9.0 8.7 billion
Final Energy per Capita building 16.9 17.5 18.4 18.9 19.2 19.3 19.2 18.9 GJ/capita
Final Energy per Capita industry 20.2 19.2 21.0 23.1 23.8 23.7 21.6 19.8 GJ/capita
Final Energy per Capita transportation 12.7 14.3 14.4 16.2 18.2 20.0 21.8 22.2 GJ/capita
Final Energy per Capita total 49.7 51.0 53.7 58.1 61.2 63.0 62.7 60.9 GJ/capita
Long-Term Equilibrium Energy Producer Prices
1990 2005 2020 2035 2050 2065 2080 2095 Units
global oil (w/o carbon charge) $27.6 $32.5 $39.7 $41.9 $44.8 $46.3 $47.0 $46.4 $/barrel (2005$)
global oil (w/ carbon charge) $27.6 $32.5 $42.7 $48.1 $58.0 $73.8 $104.0 $163.6 $/barrel (2005$)
domestic natural gas (w/o carbon charge) $3.3 $3.8 $4.4 $4.1 $4.5 $5.4 $5.5 $5.4 $/mmBTU (2005$)
domestic natural gas (w/ carbon charge) $3.3 $3.8 $4.7 $4.9 $6.0 $8.7 $12.3 $19.6 $/mmBTU (2005$)
domestic coal (w/o carbon charge) $1.7 $1.7 $1.7 $1.7 $1.7 $1.7 $1.6 $1.4 $/GJ (2005$)
domestic coal (w/ carbon charge) $1.7 $1.7 $2.4 $3.1 $4.5 $7.7 $14.0 $27.2 $/GJ (2005$)
domestic electricity (w/ carbon charge) 6.21 5.75 6.13 6.14 6.83 8.08 9.69 11.41 cents/kWh (2005$)
carbon price 0.0 0.0 24.3 50.5 105.2 218.5 454.4 944.5 $/tC (2005$)
Crop Prices
1990 2005 2020 2035 2050 2065 2080 2095 Units
global corn 33 33 39 44 51 62 79 101 $/Gcal (2005$)
global rice 32 32 40 46 55 70 94 123 $/Gcal (2005$)
global wheat 27 27 36 43 54 70 98 137 $/Gcal (2005$)
Emissions by Sectors
1990 2005 2020 2035 2050 2065 2080 2095 Units
buildings 0.858 0.860 1.000 1.060 1.007 0.877 0.666 0.379 GtC/yr
industry 1.623 1.706 1.966 2.153 1.941 1.480 0.910 0.282 GtC/yr
transportation 1.354 1.863 2.184 2.651 2.946 2.980 2.780 2.002 GtC/yr
electricity 1.909 2.848 3.537 4.351 4.736 4.743 3.468 1.736 GtC/yr
cement 0.261 0.483 0.785 0.986 0.910 0.694 0.525 0.378 GtC/yr
emissions reduction 0.000 0.000 0.795 2.062 4.586 8.163 13.267 19.522 GtC/yr
total: w/o reduction 6.006 7.760 9.471 11.201 11.539 10.774 8.348 4.776 GtC/yr

Scenario: ref stab Page 24
Final Energy Consumption: Buildings Final Energy Consumption: Industry (Does not Include Feedstocks)
Final Energy Consumption: Transportation Final Energy Consumption by Sector
0
50
100
150
200
250
300
1990 2005 2020 2035 2050 2065 2080 2095
EJ
/yr
liquids gascoal biomasselectricity trad biomassenergy reduction
0
50
100
150
200
250
300
350
400
1990 2005 2020 2035 2050 2065 2080 2095
EJ
/yr
liquids gas
coal biomass
electricity hydrogen
energy reduction feedstocks
0
50
100
150
200
250
300
1990 2005 2020 2035 2050 2065 2080 2095
EJ
/yr
liquids gas
coal electricity
hydrogen energy reduction
0
100
200
300
400
500
600
700
800
900
1990 2005 2020 2035 2050 2065 2080 2095
EJ
/yr
buildings industry
transportation energy reduction

Scenario: ref stab Page 25
Primary Energy Consumption Electricity Production by Fuel: CCS Focus
Hydrogen Production by Fuel Electricity Production by Fuel: Renewable Focus
-50
0
50
100
150
200
250
300
350
400
1990 2005 2020 2035 2050 2065 2080 2095
EJ
/yr
liquids liquids w/CCS
gas gas w/ccs
coal coal w/ccs
biomass biomass w/ccs
nuclear hydro
wind solar
geothermal energy reduction
-50
-40
-30
-20
-10
0
10
20
30
40
50
60
70
80
1990 2005 2020 2035 2050 2065 2080 2095
EJ
/yr
gas gas w/ccs
coal coal w/ccs
biomass biomass w/ccs
nuclear bulk electricity
wind solar
energy reduction
-50
0
50
100
150
200
250
300
350
400
1990 2005 2020 2035 2050 2065 2080 2095
EJ
/yr
liquids gascoal biomassnuclear hydrowind w/ backup wind w/ storagecsp w/ backup csp w/ storagepv w/ backup pv w/ storagerooftop solar w/ backup geothermalenergy reduction
0
200
400
600
800
1,000
1,200
1,400
1,600
1990 2005 2020 2035 2050 2065 2080 2095
EJ
/yr
oil w/o ccs oil w/ ccsnatural gas w/o ccs natural gas w/ ccscoal w/o ccs coal w/ ccsbiomass w/o ccs biomass w/ ccsnuclear hydrowind solargeothermal energy reduction

Scenario: ref stab Page 26
Industrial Liquids Production by Fuel (Feedstocks and Fuel) Transportation Fuels Composition
Final Energy Intensity Final Energy per Capita
0
50
100
150
200
250
300
1990 2005 2020 2035 2050 2065 2080 2095
EJ
/yr
conventional oil unconventional oilcoal liquids coal liquids w/ ccs bio fuels gas liquidsgas coalelectricity hydrogenenergy reduction
0
10
20
30
40
50
60
70
80
90
1990 2005 2020 2035 2050 2065 2080 2095
EJ
/yr
conventional oil unconventional oilcoal liquids coal liquids w/ ccs bio fuels gas liquidsenergy reduction
0
2
4
6
8
10
12
1990 2005 2020 2035 2050 2065 2080 2095
GJ
/10
00
$ (
20
05
$)
0
50
100
150
200
250
300
350
Re
fere
nc
e G
DP
(T
rillio
n 2
00
5$
)
building
industry
transportation
total
reference GDP
0
10
20
30
40
50
60
70
1990 2005 2020 2035 2050 2065 2080 2095
GJ
/ca
pit
a
0
1
2
3
4
5
6
7
8
9
10
Po
pu
lati
on
(b
illio
n)
building
industry
transportation
total
population
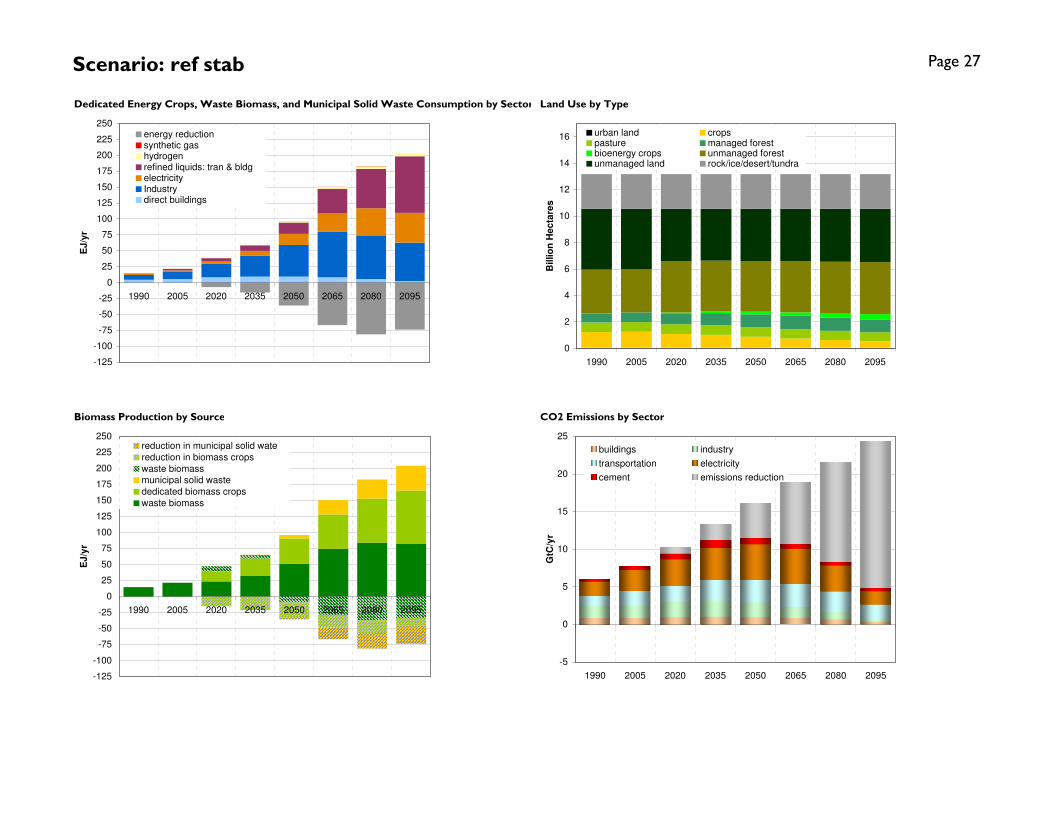
Scenario: ref stab Page 27
Dedicated Energy Crops, Waste Biomass, and Municipal Solid Waste Consumption by Sector Land Use by Type
Biomass Production by Source CO2 Emissions by Sector
-125
-100
-75
-50
-25
0
25
50
75
100
125
150
175
200
225
250
1990 2005 2020 2035 2050 2065 2080 2095
EJ
/yr
energy reductionsynthetic gashydrogenrefined liquids: tran & bldgelectricityIndustrydirect buildings
0
2
4
6
8
10
12
14
16
1990 2005 2020 2035 2050 2065 2080 2095
Billio
n H
ec
tare
s
urban land cropspasture managed forestbioenergy crops unmanaged forestunmanaged land rock/ice/desert/tundra
-125
-100
-75
-50
-25
0
25
50
75
100
125
150
175
200
225
250
1990 2005 2020 2035 2050 2065 2080 2095
EJ
/yr
reduction in municipal solid wate
reduction in biomass crops
waste biomass
municipal solid waste
dedicated biomass crops
waste biomass
-5
0
5
10
15
20
25
1990 2005 2020 2035 2050 2065 2080 2095
GtC
/yr
buildings industry
transportation electricity
cement emissions reduction

Scenario: nucref stab Page 28
Final Energy Consumption
1990 2005 2020 2035 2050 2065 2080 2095 Units
building liquids 15.2 16.4 20.1 23.3 24.6 25.6 23.0 17.5 EJ/yr
building gas 18.7 26.7 28.6 30.3 29.7 26.3 22.2 15.1 EJ/yr
building coal 10.1 5.1 6.9 6.3 4.6 2.6 1.1 0.3 EJ/yr
building biomass 4.5 5.5 8.2 9.3 9.5 9.2 7.0 3.7 EJ/yr
building electricity 16.9 29.0 43.5 62.2 81.5 101.6 123.9 145.3 EJ/yr
building trad biomass 23.5 29.9 32.2 28.5 24.1 19.7 14.7 10.3 EJ/yr
building energy reduction 0.0 0.0 3.4 6.8 13.4 24.3 42.8 63.8 EJ/yr
total: w/o reduction 88.9 112.7 139.5 159.9 173.9 185.0 191.8 192.2 EJ/yr
industry liquids 22.4 21.2 20.1 23.7 26.9 30.1 25.0 16.0 EJ/yr
industry gas 26.6 30.5 32.9 37.9 35.4 27.4 20.9 12.3 EJ/yr
industry coal 31.4 35.8 50.3 56.6 47.9 26.7 10.2 2.7 EJ/yr
industry biomass 7.3 11.2 19.9 28.8 41.6 59.7 58.7 40.8 EJ/yr
industry electricity 18.1 24.8 34.7 48.5 64.6 81.4 99.8 125.1 EJ/yr
industry hydrogen 0.0 0.0 2.6 3.2 3.9 4.8 5.5 6.6 EJ/yr
industry energy reduction 0.0 0.0 7.3 17.9 35.9 60.3 91.9 125.5 EJ/yr
industry feedstocks 15.2 23.7 27.1 31.6 34.5 36.3 35.4 34.0 EJ/yr
total: w/o reduction 105.8 123.6 160.6 198.8 220.4 230.2 220.1 203.4 EJ/yr
transportation liquids 62.7 87.7 99.8 117.4 129.5 138.9 141.5 125.6 EJ/yr
transportation gas 2.2 3.0 6.4 11.9 17.0 20.0 23.5 23.5 EJ/yr
transportation coal 0.5 0.2 0.3 0.3 0.3 0.1 0.0 0.0 EJ/yr
transportation electricity 1.0 1.0 2.1 4.7 10.8 16.2 23.2 33.8 EJ/yr
transportation hydrogen 0.0 0.0 0.6 2.1 5.6 9.9 15.7 24.7 EJ/yr
transportation energy reduction 0.0 0.0 1.5 4.0 8.7 16.6 31.3 51.8 EJ/yr
total: w/o reduction 66.4 91.8 109.2 136.4 163.1 185.2 204.0 207.6 EJ/yr
total final energy buildings 88.9 112.7 139.5 159.9 173.9 185.0 191.8 192.2 EJ/yr
total final energy industry 105.8 123.6 160.6 198.8 220.4 230.2 220.1 203.4 EJ/yr
total final energy transportation 66.4 91.8 109.2 136.4 163.1 185.2 204.0 207.6 EJ/yr
total final energy energy reduction 0.0 0.0 12.2 28.6 58.0 101.1 166.0 241.1 EJ/yr
total: w/o reduction 261.1 328.1 409.2 495.1 557.4 600.4 615.9 603.2 EJ/yr
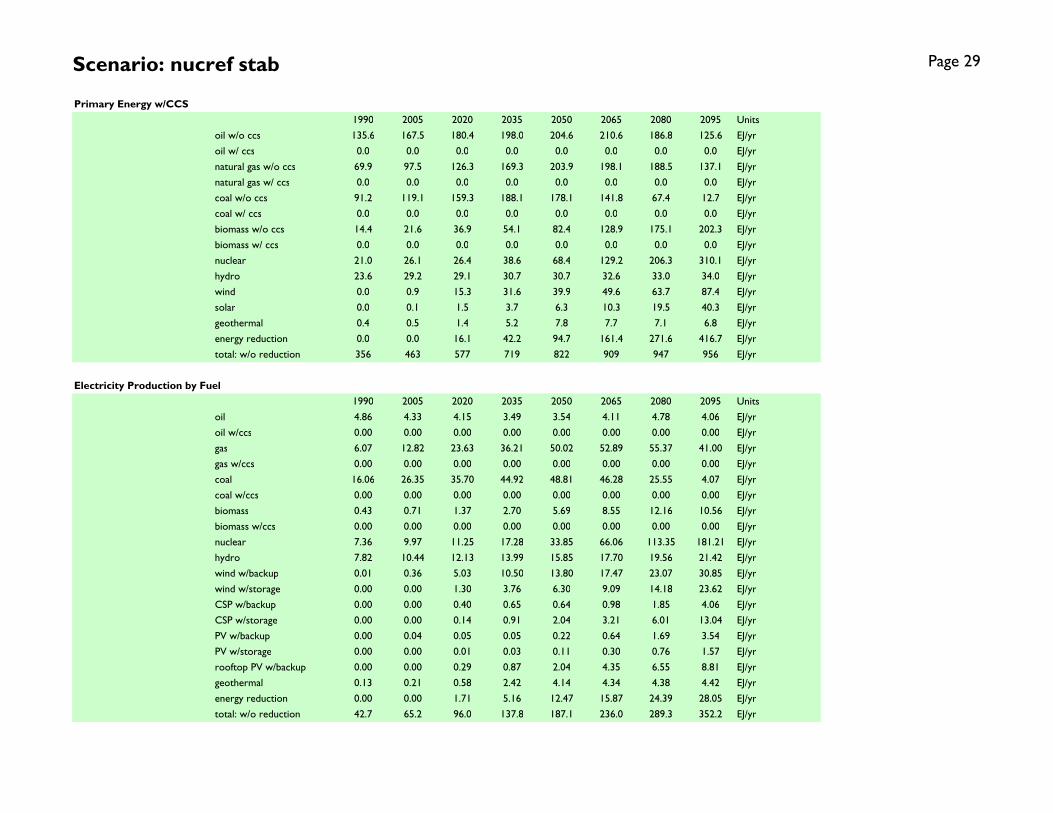
Scenario: nucref stab Page 29
Primary Energy w/CCS
1990 2005 2020 2035 2050 2065 2080 2095 Units
oil w/o ccs 135.6 167.5 180.4 198.0 204.6 210.6 186.8 125.6 EJ/yr
oil w/ ccs 0.0 0.0 0.0 0.0 0.0 0.0 0.0 0.0 EJ/yr
natural gas w/o ccs 69.9 97.5 126.3 169.3 203.9 198.1 188.5 137.1 EJ/yr
natural gas w/ ccs 0.0 0.0 0.0 0.0 0.0 0.0 0.0 0.0 EJ/yr
coal w/o ccs 91.2 119.1 159.3 188.1 178.1 141.8 67.4 12.7 EJ/yr
coal w/ ccs 0.0 0.0 0.0 0.0 0.0 0.0 0.0 0.0 EJ/yr
biomass w/o ccs 14.4 21.6 36.9 54.1 82.4 128.9 175.1 202.3 EJ/yr
biomass w/ ccs 0.0 0.0 0.0 0.0 0.0 0.0 0.0 0.0 EJ/yr
nuclear 21.0 26.1 26.4 38.6 68.4 129.2 206.3 310.1 EJ/yr
hydro 23.6 29.2 29.1 30.7 30.7 32.6 33.0 34.0 EJ/yr
wind 0.0 0.9 15.3 31.6 39.9 49.6 63.7 87.4 EJ/yr
solar 0.0 0.1 1.5 3.7 6.3 10.3 19.5 40.3 EJ/yr
geothermal 0.4 0.5 1.4 5.2 7.8 7.7 7.1 6.8 EJ/yr
energy reduction 0.0 0.0 16.1 42.2 94.7 161.4 271.6 416.7 EJ/yr
total: w/o reduction 356 463 577 719 822 909 947 956 EJ/yr
Electricity Production by Fuel
1990 2005 2020 2035 2050 2065 2080 2095 Units
oil 4.86 4.33 4.15 3.49 3.54 4.11 4.78 4.06 EJ/yr
oil w/ccs 0.00 0.00 0.00 0.00 0.00 0.00 0.00 0.00 EJ/yr
gas 6.07 12.82 23.63 36.21 50.02 52.89 55.37 41.00 EJ/yr
gas w/ccs 0.00 0.00 0.00 0.00 0.00 0.00 0.00 0.00 EJ/yr
coal 16.06 26.35 35.70 44.92 48.81 46.28 25.55 4.07 EJ/yr
coal w/ccs 0.00 0.00 0.00 0.00 0.00 0.00 0.00 0.00 EJ/yr
biomass 0.43 0.71 1.37 2.70 5.69 8.55 12.16 10.56 EJ/yr
biomass w/ccs 0.00 0.00 0.00 0.00 0.00 0.00 0.00 0.00 EJ/yr
nuclear 7.36 9.97 11.25 17.28 33.85 66.06 113.35 181.21 EJ/yr
hydro 7.82 10.44 12.13 13.99 15.85 17.70 19.56 21.42 EJ/yr
wind w/backup 0.01 0.36 5.03 10.50 13.80 17.47 23.07 30.85 EJ/yr
wind w/storage 0.00 0.00 1.30 3.76 6.30 9.09 14.18 23.62 EJ/yr
CSP w/backup 0.00 0.00 0.40 0.65 0.64 0.98 1.85 4.06 EJ/yr
CSP w/storage 0.00 0.00 0.14 0.91 2.04 3.21 6.01 13.04 EJ/yr
PV w/backup 0.00 0.04 0.05 0.05 0.22 0.64 1.69 3.54 EJ/yr
PV w/storage 0.00 0.00 0.01 0.03 0.11 0.30 0.76 1.57 EJ/yr
rooftop PV w/backup 0.00 0.00 0.29 0.87 2.04 4.35 6.55 8.81 EJ/yr
geothermal 0.13 0.21 0.58 2.42 4.14 4.34 4.38 4.42 EJ/yr
energy reduction 0.00 0.00 1.71 5.16 12.47 15.87 24.39 28.05 EJ/yr
total: w/o reduction 42.7 65.2 96.0 137.8 187.1 236.0 289.3 352.2 EJ/yr
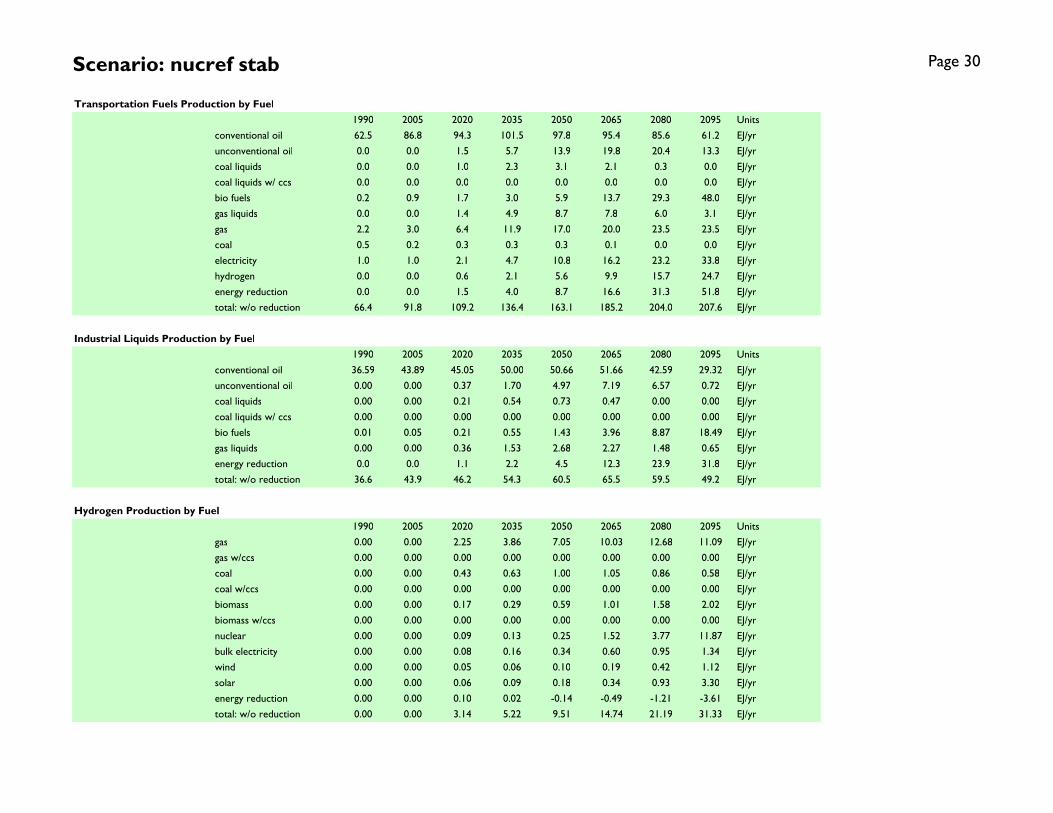
Scenario: nucref stab Page 30
Transportation Fuels Production by Fuel
1990 2005 2020 2035 2050 2065 2080 2095 Units
conventional oil 62.5 86.8 94.3 101.5 97.8 95.4 85.6 61.2 EJ/yr
unconventional oil 0.0 0.0 1.5 5.7 13.9 19.8 20.4 13.3 EJ/yr
coal liquids 0.0 0.0 1.0 2.3 3.1 2.1 0.3 0.0 EJ/yr
coal liquids w/ ccs 0.0 0.0 0.0 0.0 0.0 0.0 0.0 0.0 EJ/yr
bio fuels 0.2 0.9 1.7 3.0 5.9 13.7 29.3 48.0 EJ/yr
gas liquids 0.0 0.0 1.4 4.9 8.7 7.8 6.0 3.1 EJ/yr
gas 2.2 3.0 6.4 11.9 17.0 20.0 23.5 23.5 EJ/yr
coal 0.5 0.2 0.3 0.3 0.3 0.1 0.0 0.0 EJ/yr
electricity 1.0 1.0 2.1 4.7 10.8 16.2 23.2 33.8 EJ/yr
hydrogen 0.0 0.0 0.6 2.1 5.6 9.9 15.7 24.7 EJ/yr
energy reduction 0.0 0.0 1.5 4.0 8.7 16.6 31.3 51.8 EJ/yr
total: w/o reduction 66.4 91.8 109.2 136.4 163.1 185.2 204.0 207.6 EJ/yr
Industrial Liquids Production by Fuel
1990 2005 2020 2035 2050 2065 2080 2095 Units
conventional oil 36.59 43.89 45.05 50.00 50.66 51.66 42.59 29.32 EJ/yr
unconventional oil 0.00 0.00 0.37 1.70 4.97 7.19 6.57 0.72 EJ/yr
coal liquids 0.00 0.00 0.21 0.54 0.73 0.47 0.00 0.00 EJ/yr
coal liquids w/ ccs 0.00 0.00 0.00 0.00 0.00 0.00 0.00 0.00 EJ/yr
bio fuels 0.01 0.05 0.21 0.55 1.43 3.96 8.87 18.49 EJ/yr
gas liquids 0.00 0.00 0.36 1.53 2.68 2.27 1.48 0.65 EJ/yr
energy reduction 0.0 0.0 1.1 2.2 4.5 12.3 23.9 31.8 EJ/yr
total: w/o reduction 36.6 43.9 46.2 54.3 60.5 65.5 59.5 49.2 EJ/yr
Hydrogen Production by Fuel
1990 2005 2020 2035 2050 2065 2080 2095 Units
gas 0.00 0.00 2.25 3.86 7.05 10.03 12.68 11.09 EJ/yr
gas w/ccs 0.00 0.00 0.00 0.00 0.00 0.00 0.00 0.00 EJ/yr
coal 0.00 0.00 0.43 0.63 1.00 1.05 0.86 0.58 EJ/yr
coal w/ccs 0.00 0.00 0.00 0.00 0.00 0.00 0.00 0.00 EJ/yr
biomass 0.00 0.00 0.17 0.29 0.59 1.01 1.58 2.02 EJ/yr
biomass w/ccs 0.00 0.00 0.00 0.00 0.00 0.00 0.00 0.00 EJ/yr
nuclear 0.00 0.00 0.09 0.13 0.25 1.52 3.77 11.87 EJ/yr
bulk electricity 0.00 0.00 0.08 0.16 0.34 0.60 0.95 1.34 EJ/yr
wind 0.00 0.00 0.05 0.06 0.10 0.19 0.42 1.12 EJ/yr
solar 0.00 0.00 0.06 0.09 0.18 0.34 0.93 3.30 EJ/yr
energy reduction 0.00 0.00 0.10 0.02 -0.14 -0.49 -1.21 -3.61 EJ/yr
total: w/o reduction 0.00 0.00 3.14 5.22 9.51 14.74 21.19 31.33 EJ/yr

Scenario: nucref stab Page 31
Dedicated Bioenergy Crops, Crop Residues, and Municipal Solid Waste Consumption by Sector
1990 2005 2020 2035 2050 2065 2080 2095 Units
direct buildings 4.5 5.5 8.2 9.3 9.5 9.2 7.0 3.7 EJ/yr
Industry 7.4 11.3 20.4 29.9 44.4 67.2 75.0 73.9 EJ/yr
electricity 2.1 2.5 3.9 7.0 13.4 19.5 27.0 22.6 EJ/yr
refined liquids: tran & bldg 0.5 2.2 4.1 7.3 13.9 30.8 62.8 98.1 EJ/yr
hydrogen 0.0 0.0 0.4 0.6 1.2 2.1 3.2 4.0 EJ/yr
synthetic gas 0.0 0.0 0.0 0.0 0.0 0.1 0.1 0.1 EJ/yr
energy reduction 0.0 0.0 -4.8 -10.3 -22.1 -45.3 -73.8 -72.2 EJ/yr
total: w/o reduction 14.4 21.6 36.9 54.1 82.4 128.9 175.1 202.3 EJ/yr
Biomass Production
1990 2005 2020 2035 2050 2065 2080 2095 Units
waste biomass 14.4 21.5 24.9 31.5 44.3 62.7 80.6 83.7 EJ
dedicated biomass crops 0.0 0.0 11.9 22.3 36.0 49.7 64.3 79.8 EJ
municipal solid waste 0.0 0.1 0.1 0.3 2.1 16.5 30.2 38.8 EJ
waste biomass 0.0 0.0 6.7 6.3 -2.5 -17.4 -33.6 -34.4 EJ
reduction in biomass crops 0.0 0.0 -11.9 -17.4 -19.3 -14.9 -15.6 -9.4 EJ
reduction in municipal solid wate0.0 0.0 0.3 0.7 -0.3 -13.1 -24.6 -28.5 EJ
total: w/o reduction 14.4 21.6 31.8 43.1 60.5 96.7 125.9 158.5 EJ
Arable Land Use by Type
1990 2005 2020 2035 2050 2065 2080 2095 Units
urban land 0.05 0.05 0.05 0.05 0.05 0.05 0.05 0.05 billion Ha
crops 1.20 1.21 1.07 1.01 0.87 0.74 0.62 0.51 billion Ha
pasture 0.70 0.73 0.75 0.75 0.73 0.71 0.70 0.69 billion Ha
managed forest 0.69 0.74 0.83 0.91 0.98 1.02 1.03 1.00 billion Ha
bioenergy crops 0.00 0.00 0.04 0.10 0.17 0.24 0.31 0.38 billion Ha
unmanaged forest 3.32 3.25 3.88 3.84 3.83 3.84 3.86 3.90 billion Ha
unmanaged land 4.58 4.58 3.93 3.89 3.92 3.96 3.99 4.02 billion Ha
rock/ice/desert/tundra 2.62 2.62 2.62 2.62 2.62 2.62 2.62 2.62 billion Ha
total 10.50 10.50 10.50 10.50 10.50 10.50 10.50 10.50 billion Ha

Scenario: nucref stab Page 32
Population, GDP, and Energy Indicators
1990 2005 2020 2035 2050 2065 2080 2095 Units
Economic Activity reference GDP $26.1 $39.4 $58.2 $83.4 $117.9 $165.0 $228.1 $306.7 trillion 2005$
Final Energy Intensity building 3.41 2.86 2.40 1.92 1.48 1.12 0.84 0.63 GJ/1000$ (2005$)
Final Energy Intensity industry 4.06 3.14 2.76 2.38 1.87 1.40 0.96 0.66 GJ/1000$ (2005$)
Final Energy Intensity transportation 2.55 2.33 1.88 1.64 1.38 1.12 0.89 0.68 GJ/1000$ (2005$)
Final Energy Intensity total 10.01 8.33 7.03 5.93 4.73 3.64 2.70 1.97 GJ/1000$ (2005$)
Population population 5.2 6.4 7.5 8.3 8.8 9.1 9.0 8.7 billion
Final Energy per Capita building 16.9 17.5 18.5 19.2 19.7 20.4 21.3 22.0 GJ/capita
Final Energy per Capita industry 20.2 19.2 21.3 23.8 25.0 25.4 24.4 23.3 GJ/capita
Final Energy per Capita transportation 12.7 14.3 14.5 16.4 18.5 20.4 22.6 23.7 GJ/capita
Final Energy per Capita total 49.7 51.0 54.4 59.3 63.2 66.3 68.4 68.9 GJ/capita
Long-Term Equilibrium Energy Producer Prices
1990 2005 2020 2035 2050 2065 2080 2095 Units
global oil (w/o carbon charge) $27.6 $32.5 $39.7 $41.9 $44.9 $46.4 $47.3 $46.5 $/barrel (2005$)
global oil (w/ carbon charge) $27.6 $32.5 $41.7 $46.1 $53.7 $65.1 $86.4 $126.7 $/barrel (2005$)
domestic natural gas (w/o carbon charge) $3.3 $3.8 $4.4 $4.1 $4.4 $5.3 $5.3 $5.3 $/mmBTU (2005$)
domestic natural gas (w/ carbon charge) $3.3 $3.8 $4.6 $4.6 $5.5 $7.5 $9.9 $14.7 $/mmBTU (2005$)
domestic coal (w/o carbon charge) $1.7 $1.7 $1.7 $1.7 $1.7 $1.7 $1.6 $1.5 $/GJ (2005$)
domestic coal (w/ carbon charge) $1.7 $1.7 $2.2 $2.7 $3.6 $5.7 $9.9 $18.8 $/GJ (2005$)
domestic electricity (w/ carbon charge) 6.21 5.75 5.99 5.91 6.25 6.84 7.41 7.93 cents/kWh (2005$)
carbon price 0.0 0.0 16.3 33.9 70.4 146.5 304.6 633.2 $/tC (2005$)
Crop Prices
1990 2005 2020 2035 2050 2065 2080 2095 Units
global corn 33 33 37 41 46 54 66 83 $/Gcal (2005$)
global rice 32 32 37 41 48 57 72 92 $/Gcal (2005$)
global wheat 27 27 33 38 45 56 74 100 $/Gcal (2005$)
Emissions by Sectors
1990 2005 2020 2035 2050 2065 2080 2095 Units
buildings 0.858 0.860 1.018 1.098 1.065 0.945 0.729 0.447 GtC/yr
industry 1.623 1.706 2.041 2.306 2.160 1.661 0.975 0.252 GtC/yr
transportation 1.354 1.863 2.208 2.717 3.081 3.159 2.890 2.116 GtC/yr
electricity 1.909 2.848 3.566 4.289 4.454 4.199 2.851 1.261 GtC/yr
cement 0.261 0.483 0.820 1.074 1.062 0.804 0.589 0.431 GtC/yr
emissions reduction 0.000 0.000 0.613 1.779 4.302 8.170 13.580 19.792 GtC/yr
total: w/o reduction 6.006 7.760 9.653 11.484 11.823 10.766 8.035 4.506 GtC/yr

Scenario: nucref stab Page 33
Final Energy Consumption: Buildings Final Energy Consumption: Industry (Does not Include Feedstocks)
Final Energy Consumption: Transportation Final Energy Consumption by Sector
0
50
100
150
200
250
300
1990 2005 2020 2035 2050 2065 2080 2095
EJ
/yr
liquids gascoal biomasselectricity trad biomassenergy reduction
0
50
100
150
200
250
300
350
400
1990 2005 2020 2035 2050 2065 2080 2095
EJ
/yr
liquids gas
coal biomass
electricity hydrogen
energy reduction feedstocks
0
50
100
150
200
250
300
1990 2005 2020 2035 2050 2065 2080 2095
EJ
/yr
liquids gas
coal electricity
hydrogen energy reduction
0
100
200
300
400
500
600
700
800
900
1990 2005 2020 2035 2050 2065 2080 2095
EJ
/yr
buildings industry
transportation energy reduction

Scenario: nucref stab Page 34
Primary Energy Consumption Electricity Production by Fuel: CCS Focus
Hydrogen Production by Fuel Electricity Production by Fuel: Renewable Focus
-50
0
50
100
150
200
250
300
350
400
1990 2005 2020 2035 2050 2065 2080 2095
EJ
/yr
liquids liquids w/CCS
gas gas w/ccs
coal coal w/ccs
biomass biomass w/ccs
nuclear hydro
wind solar
geothermal energy reduction
-50
-40
-30
-20
-10
0
10
20
30
40
50
60
70
80
1990 2005 2020 2035 2050 2065 2080 2095
EJ
/yr
gas gas w/ccs
coal coal w/ccs
biomass biomass w/ccs
nuclear bulk electricity
wind solar
energy reduction
-50
0
50
100
150
200
250
300
350
400
1990 2005 2020 2035 2050 2065 2080 2095
EJ
/yr
liquids gascoal biomassnuclear hydrowind w/ backup wind w/ storagecsp w/ backup csp w/ storagepv w/ backup pv w/ storagerooftop solar w/ backup geothermalenergy reduction
0
200
400
600
800
1,000
1,200
1,400
1,600
1990 2005 2020 2035 2050 2065 2080 2095
EJ
/yr
oil w/o ccs oil w/ ccsnatural gas w/o ccs natural gas w/ ccscoal w/o ccs coal w/ ccsbiomass w/o ccs biomass w/ ccsnuclear hydrowind solargeothermal energy reduction
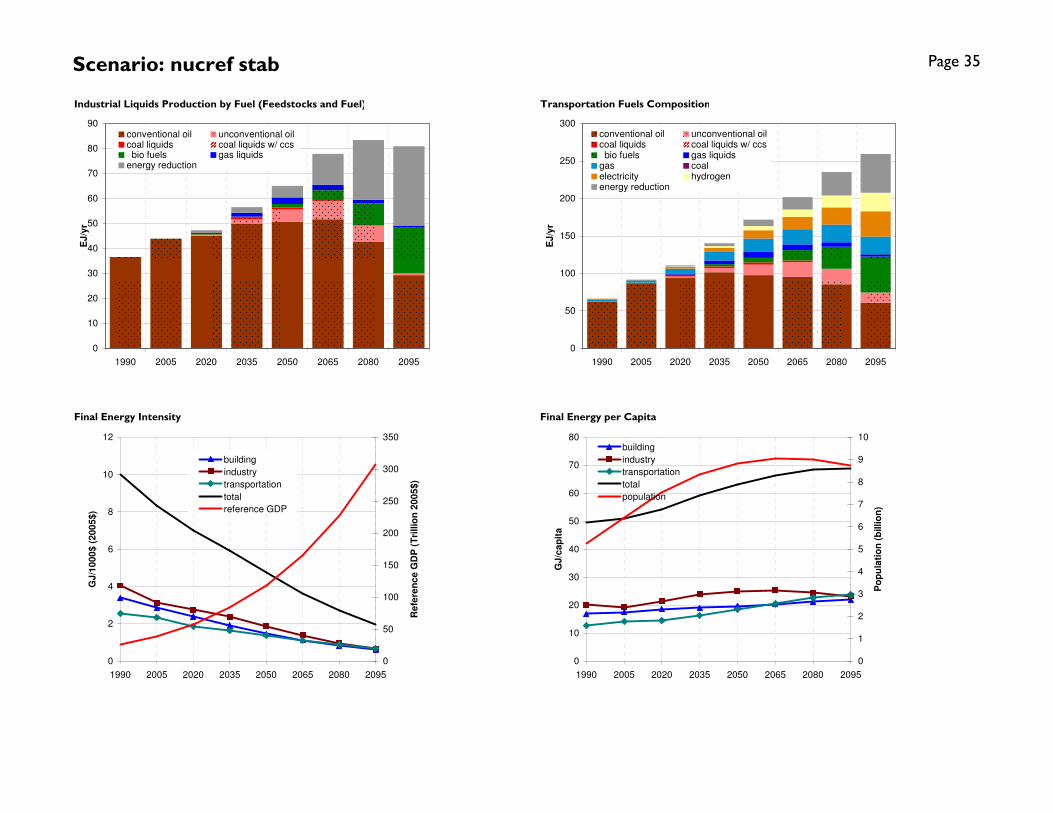
Scenario: nucref stab Page 35
Industrial Liquids Production by Fuel (Feedstocks and Fuel) Transportation Fuels Composition
Final Energy Intensity Final Energy per Capita
0
50
100
150
200
250
300
1990 2005 2020 2035 2050 2065 2080 2095
EJ
/yr
conventional oil unconventional oilcoal liquids coal liquids w/ ccs bio fuels gas liquidsgas coalelectricity hydrogenenergy reduction
0
10
20
30
40
50
60
70
80
90
1990 2005 2020 2035 2050 2065 2080 2095
EJ
/yr
conventional oil unconventional oilcoal liquids coal liquids w/ ccs bio fuels gas liquidsenergy reduction
0
2
4
6
8
10
12
1990 2005 2020 2035 2050 2065 2080 2095
GJ
/10
00
$ (
20
05
$)
0
50
100
150
200
250
300
350
Re
fere
nc
e G
DP
(T
rillio
n 2
00
5$
)
building
industry
transportation
total
reference GDP
0
10
20
30
40
50
60
70
80
1990 2005 2020 2035 2050 2065 2080 2095
GJ
/ca
pit
a
0
1
2
3
4
5
6
7
8
9
10
Po
pu
lati
on
(b
illio
n)
building
industry
transportation
total
population

Scenario: nucref stab Page 36
Dedicated Energy Crops, Waste Biomass, and Municipal Solid Waste Consumption by Sector Land Use by Type
Biomass Production by Source CO2 Emissions by Sector
-125
-100
-75
-50
-25
0
25
50
75
100
125
150
175
200
225
250
1990 2005 2020 2035 2050 2065 2080 2095
EJ
/yr
energy reductionsynthetic gashydrogenrefined liquids: tran & bldgelectricityIndustrydirect buildings
0
2
4
6
8
10
12
14
16
1990 2005 2020 2035 2050 2065 2080 2095
Billio
n H
ec
tare
s
urban land cropspasture managed forestbioenergy crops unmanaged forestunmanaged land rock/ice/desert/tundra
-125
-100
-75
-50
-25
0
25
50
75
100
125
150
175
200
225
250
1990 2005 2020 2035 2050 2065 2080 2095
EJ
/yr
reduction in municipal solid wate
reduction in biomass crops
waste biomass
municipal solid waste
dedicated biomass crops
waste biomass
-5
0
5
10
15
20
25
1990 2005 2020 2035 2050 2065 2080 2095
GtC
/yr
buildings industry
transportation electricity
cement emissions reduction
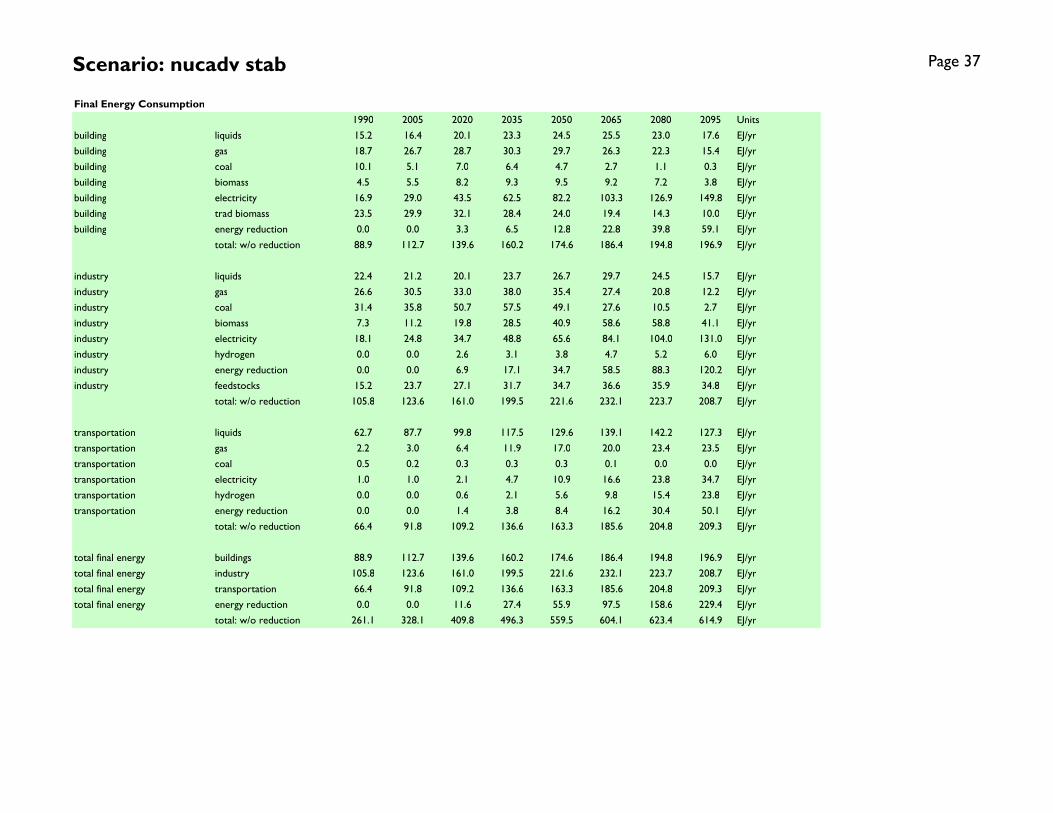
Scenario: nucadv stab Page 37
Final Energy Consumption
1990 2005 2020 2035 2050 2065 2080 2095 Units
building liquids 15.2 16.4 20.1 23.3 24.5 25.5 23.0 17.6 EJ/yr
building gas 18.7 26.7 28.7 30.3 29.7 26.3 22.3 15.4 EJ/yr
building coal 10.1 5.1 7.0 6.4 4.7 2.7 1.1 0.3 EJ/yr
building biomass 4.5 5.5 8.2 9.3 9.5 9.2 7.2 3.8 EJ/yr
building electricity 16.9 29.0 43.5 62.5 82.2 103.3 126.9 149.8 EJ/yr
building trad biomass 23.5 29.9 32.1 28.4 24.0 19.4 14.3 10.0 EJ/yr
building energy reduction 0.0 0.0 3.3 6.5 12.8 22.8 39.8 59.1 EJ/yr
total: w/o reduction 88.9 112.7 139.6 160.2 174.6 186.4 194.8 196.9 EJ/yr
industry liquids 22.4 21.2 20.1 23.7 26.7 29.7 24.5 15.7 EJ/yr
industry gas 26.6 30.5 33.0 38.0 35.4 27.4 20.8 12.2 EJ/yr
industry coal 31.4 35.8 50.7 57.5 49.1 27.6 10.5 2.7 EJ/yr
industry biomass 7.3 11.2 19.8 28.5 40.9 58.6 58.8 41.1 EJ/yr
industry electricity 18.1 24.8 34.7 48.8 65.6 84.1 104.0 131.0 EJ/yr
industry hydrogen 0.0 0.0 2.6 3.1 3.8 4.7 5.2 6.0 EJ/yr
industry energy reduction 0.0 0.0 6.9 17.1 34.7 58.5 88.3 120.2 EJ/yr
industry feedstocks 15.2 23.7 27.1 31.7 34.7 36.6 35.9 34.8 EJ/yr
total: w/o reduction 105.8 123.6 161.0 199.5 221.6 232.1 223.7 208.7 EJ/yr
transportation liquids 62.7 87.7 99.8 117.5 129.6 139.1 142.2 127.3 EJ/yr
transportation gas 2.2 3.0 6.4 11.9 17.0 20.0 23.4 23.5 EJ/yr
transportation coal 0.5 0.2 0.3 0.3 0.3 0.1 0.0 0.0 EJ/yr
transportation electricity 1.0 1.0 2.1 4.7 10.9 16.6 23.8 34.7 EJ/yr
transportation hydrogen 0.0 0.0 0.6 2.1 5.6 9.8 15.4 23.8 EJ/yr
transportation energy reduction 0.0 0.0 1.4 3.8 8.4 16.2 30.4 50.1 EJ/yr
total: w/o reduction 66.4 91.8 109.2 136.6 163.3 185.6 204.8 209.3 EJ/yr
total final energy buildings 88.9 112.7 139.6 160.2 174.6 186.4 194.8 196.9 EJ/yr
total final energy industry 105.8 123.6 161.0 199.5 221.6 232.1 223.7 208.7 EJ/yr
total final energy transportation 66.4 91.8 109.2 136.6 163.3 185.6 204.8 209.3 EJ/yr
total final energy energy reduction 0.0 0.0 11.6 27.4 55.9 97.5 158.6 229.4 EJ/yr
total: w/o reduction 261.1 328.1 409.8 496.3 559.5 604.1 623.4 614.9 EJ/yr

Scenario: nucadv stab Page 38
Primary Energy w/CCS
1990 2005 2020 2035 2050 2065 2080 2095 Units
oil w/o ccs 135.6 167.5 180.5 198.1 204.6 211.1 187.1 127.4 EJ/yr
oil w/ ccs 0.0 0.0 0.0 0.0 0.0 0.0 0.0 0.0 EJ/yr
natural gas w/o ccs 69.9 97.5 126.5 169.5 203.7 197.5 187.2 128.3 EJ/yr
natural gas w/ ccs 0.0 0.0 0.0 0.0 0.0 0.0 0.0 0.0 EJ/yr
coal w/o ccs 91.2 119.1 160.1 190.0 180.9 144.2 61.1 12.6 EJ/yr
coal w/ ccs 0.0 0.0 0.0 0.0 0.0 0.0 0.0 0.0 EJ/yr
biomass w/o ccs 14.4 21.6 36.7 53.5 80.8 125.3 173.2 201.9 EJ/yr
biomass w/ ccs 0.0 0.0 0.0 0.0 0.0 0.0 0.0 0.0 EJ/yr
nuclear 21.0 26.1 26.4 39.8 73.9 143.2 234.7 352.9 EJ/yr
hydro 23.6 29.2 29.1 30.7 30.7 32.6 32.9 34.3 EJ/yr
wind 0.0 0.9 15.2 31.5 39.4 48.4 61.5 85.0 EJ/yr
solar 0.0 0.1 1.5 3.7 6.2 9.8 18.2 36.7 EJ/yr
geothermal 0.4 0.5 1.4 5.2 7.8 7.7 7.1 6.8 EJ/yr
energy reduction 0.0 0.0 15.4 39.8 89.0 150.3 256.1 387.0 EJ/yr
total: w/o reduction 356 463 577 722 828 920 963 986 EJ/yr
Electricity Production by Fuel
1990 2005 2020 2035 2050 2065 2080 2095 Units
oil 4.86 4.33 4.15 3.49 3.50 4.05 4.66 4.07 EJ/yr
oil w/ccs 0.00 0.00 0.00 0.00 0.00 0.00 0.00 0.00 EJ/yr
gas 6.07 12.82 23.65 36.26 49.89 52.57 54.60 34.45 EJ/yr
gas w/ccs 0.00 0.00 0.00 0.00 0.00 0.00 0.00 0.00 EJ/yr
coal 16.06 26.35 35.79 45.16 49.12 46.61 21.56 3.99 EJ/yr
coal w/ccs 0.00 0.00 0.00 0.00 0.00 0.00 0.00 0.00 EJ/yr
biomass 0.43 0.71 1.36 2.68 5.57 8.30 11.90 9.82 EJ/yr
biomass w/ccs 0.00 0.00 0.00 0.00 0.00 0.00 0.00 0.00 EJ/yr
nuclear 7.36 9.97 11.24 17.79 36.51 73.30 130.28 207.10 EJ/yr
hydro 7.82 10.44 12.13 13.99 15.85 17.70 19.56 21.42 EJ/yr
wind w/backup 0.01 0.36 5.02 10.46 13.66 17.17 22.65 30.13 EJ/yr
wind w/storage 0.00 0.00 1.29 3.73 6.16 8.73 13.45 22.15 EJ/yr
CSP w/backup 0.00 0.00 0.39 0.65 0.63 0.93 1.75 3.69 EJ/yr
CSP w/storage 0.00 0.00 0.14 0.90 1.99 3.07 5.67 11.82 EJ/yr
PV w/backup 0.00 0.04 0.05 0.05 0.21 0.62 1.56 3.15 EJ/yr
PV w/storage 0.00 0.00 0.01 0.03 0.11 0.29 0.70 1.40 EJ/yr
rooftop PV w/backup 0.00 0.00 0.30 0.85 1.98 4.13 6.09 8.07 EJ/yr
geothermal 0.13 0.21 0.58 2.41 4.13 4.33 4.37 4.40 EJ/yr
energy reduction 0.00 0.00 1.63 4.47 10.09 9.64 13.85 12.08 EJ/yr
total: w/o reduction 42.7 65.2 96.1 138.4 189.3 241.8 298.8 365.7 EJ/yr

Scenario: nucadv stab Page 39
Transportation Fuels Production by Fuel
1990 2005 2020 2035 2050 2065 2080 2095 Units
conventional oil 62.5 86.8 94.3 101.5 97.7 95.4 85.0 61.5 EJ/yr
unconventional oil 0.0 0.0 1.5 5.8 14.2 20.3 21.4 14.3 EJ/yr
coal liquids 0.0 0.0 1.0 2.4 3.3 2.3 1.1 0.0 EJ/yr
coal liquids w/ ccs 0.0 0.0 0.0 0.0 0.0 0.0 0.0 0.0 EJ/yr
bio fuels 0.2 0.9 1.6 2.9 5.8 13.1 28.7 48.3 EJ/yr
gas liquids 0.0 0.0 1.4 4.9 8.7 7.9 6.0 3.2 EJ/yr
gas 2.2 3.0 6.4 11.9 17.0 20.0 23.4 23.5 EJ/yr
coal 0.5 0.2 0.3 0.3 0.3 0.1 0.0 0.0 EJ/yr
electricity 1.0 1.0 2.1 4.7 10.9 16.6 23.8 34.7 EJ/yr
hydrogen 0.0 0.0 0.6 2.1 5.6 9.8 15.4 23.8 EJ/yr
energy reduction 0.0 0.0 1.4 3.8 8.4 16.2 30.4 50.1 EJ/yr
total: w/o reduction 66.4 91.8 109.2 136.6 163.3 185.6 204.8 209.3 EJ/yr
Industrial Liquids Production by Fuel
1990 2005 2020 2035 2050 2065 2080 2095 Units
conventional oil 36.59 43.89 45.08 49.99 50.51 51.52 42.32 29.54 EJ/yr
unconventional oil 0.00 0.00 0.37 1.73 5.07 7.42 7.08 0.87 EJ/yr
coal liquids 0.00 0.00 0.22 0.57 0.79 0.53 0.00 0.00 EJ/yr
coal liquids w/ ccs 0.00 0.00 0.00 0.00 0.00 0.00 0.00 0.00 EJ/yr
bio fuels 0.01 0.05 0.21 0.53 1.37 3.72 8.70 18.65 EJ/yr
gas liquids 0.00 0.00 0.36 1.53 2.68 2.28 1.50 0.67 EJ/yr
energy reduction 0.0 0.0 1.0 2.2 4.6 12.4 23.8 31.2 EJ/yr
total: w/o reduction 36.6 43.9 46.2 54.3 60.4 65.5 59.6 49.7 EJ/yr
Hydrogen Production by Fuel
1990 2005 2020 2035 2050 2065 2080 2095 Units
gas 0.00 0.00 2.25 3.83 6.97 9.88 12.48 11.28 EJ/yr
gas w/ccs 0.00 0.00 0.00 0.00 0.00 0.00 0.00 0.00 EJ/yr
coal 0.00 0.00 0.44 0.64 1.01 1.08 0.89 0.59 EJ/yr
coal w/ccs 0.00 0.00 0.00 0.00 0.00 0.00 0.00 0.00 EJ/yr
biomass 0.00 0.00 0.17 0.28 0.58 0.99 1.57 2.01 EJ/yr
biomass w/ccs 0.00 0.00 0.00 0.00 0.00 0.00 0.00 0.00 EJ/yr
nuclear 0.00 0.00 0.09 0.13 0.24 1.44 3.46 10.43 EJ/yr
bulk electricity 0.00 0.00 0.08 0.16 0.34 0.61 0.98 1.45 EJ/yr
wind 0.00 0.00 0.05 0.06 0.10 0.18 0.40 1.05 EJ/yr
solar 0.00 0.00 0.06 0.09 0.18 0.32 0.87 2.95 EJ/yr
energy reduction 0.00 0.00 0.11 0.04 -0.06 -0.25 -0.65 -2.03 EJ/yr
total: w/o reduction 0.00 0.00 3.14 5.20 9.43 14.50 20.63 29.75 EJ/yr

Scenario: nucadv stab Page 40
Dedicated Bioenergy Crops, Crop Residues, and Municipal Solid Waste Consumption by Sector
1990 2005 2020 2035 2050 2065 2080 2095 Units
direct buildings 4.5 5.5 8.2 9.3 9.5 9.2 7.2 3.8 EJ/yr
Industry 7.4 11.3 20.2 29.6 43.6 65.6 74.8 74.5 EJ/yr
electricity 2.1 2.5 3.9 6.9 13.1 19.0 26.5 20.9 EJ/yr
refined liquids: tran & bldg 0.5 2.2 4.0 7.1 13.4 29.4 61.5 98.7 EJ/yr
hydrogen 0.0 0.0 0.4 0.6 1.2 2.0 3.1 3.9 EJ/yr
synthetic gas 0.0 0.0 0.0 0.0 0.0 0.1 0.1 0.1 EJ/yr
energy reduction 0.0 0.0 -4.6 -9.7 -20.5 -41.7 -71.9 -71.8 EJ/yr
total: w/o reduction 14.4 21.6 36.7 53.5 80.8 125.3 173.2 201.9 EJ/yr
Biomass Production
1990 2005 2020 2035 2050 2065 2080 2095 Units
waste biomass 14.4 21.5 25.2 31.5 43.5 61.2 79.5 83.8 EJ
dedicated biomass crops 0.0 0.0 11.4 21.7 35.4 49.1 63.6 79.3 EJ
municipal solid waste 0.0 0.1 0.1 0.3 1.8 15.0 30.1 38.8 EJ
waste biomass 0.0 0.0 6.5 6.4 -1.7 -15.8 -32.4 -34.4 EJ
reduction in biomass crops 0.0 0.0 -11.4 -16.8 -18.7 -14.3 -14.9 -8.9 EJ
reduction in municipal solid wate0.0 0.0 0.3 0.7 0.0 -11.5 -24.6 -28.5 EJ
total: w/o reduction 14.4 21.6 31.8 43.1 60.3 95.1 125.9 158.6 EJ
Arable Land Use by Type
1990 2005 2020 2035 2050 2065 2080 2095 Units
urban land 0.05 0.05 0.05 0.05 0.05 0.05 0.05 0.05 billion Ha
crops 1.20 1.21 1.07 1.02 0.88 0.74 0.62 0.51 billion Ha
pasture 0.70 0.73 0.76 0.76 0.73 0.71 0.70 0.69 billion Ha
managed forest 0.69 0.74 0.83 0.91 0.98 1.02 1.03 1.01 billion Ha
bioenergy crops 0.00 0.00 0.04 0.09 0.16 0.23 0.30 0.38 billion Ha
unmanaged forest 3.32 3.25 3.88 3.84 3.83 3.84 3.86 3.90 billion Ha
unmanaged land 4.58 4.58 3.93 3.89 3.92 3.96 3.99 4.02 billion Ha
rock/ice/desert/tundra 2.62 2.62 2.62 2.62 2.62 2.62 2.62 2.62 billion Ha
total 10.50 10.50 10.50 10.50 10.50 10.50 10.50 10.50 billion Ha
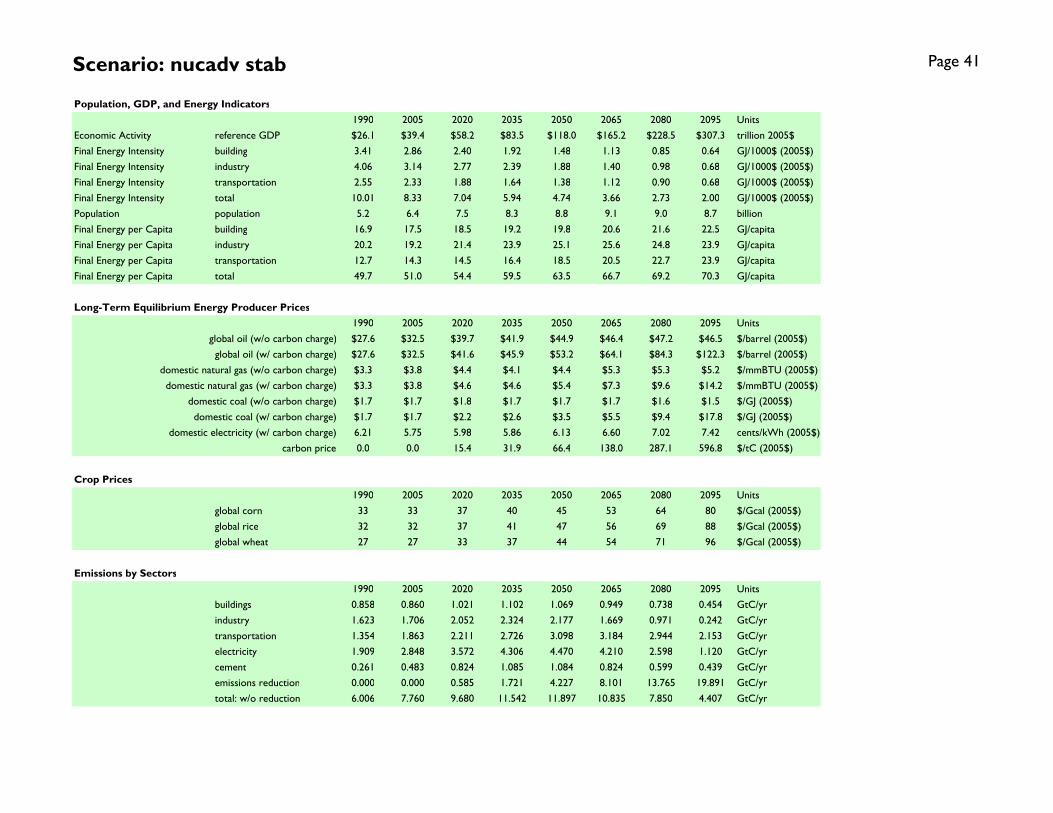
Scenario: nucadv stab Page 41
Population, GDP, and Energy Indicators
1990 2005 2020 2035 2050 2065 2080 2095 Units
Economic Activity reference GDP $26.1 $39.4 $58.2 $83.5 $118.0 $165.2 $228.5 $307.3 trillion 2005$
Final Energy Intensity building 3.41 2.86 2.40 1.92 1.48 1.13 0.85 0.64 GJ/1000$ (2005$)
Final Energy Intensity industry 4.06 3.14 2.77 2.39 1.88 1.40 0.98 0.68 GJ/1000$ (2005$)
Final Energy Intensity transportation 2.55 2.33 1.88 1.64 1.38 1.12 0.90 0.68 GJ/1000$ (2005$)
Final Energy Intensity total 10.01 8.33 7.04 5.94 4.74 3.66 2.73 2.00 GJ/1000$ (2005$)
Population population 5.2 6.4 7.5 8.3 8.8 9.1 9.0 8.7 billion
Final Energy per Capita building 16.9 17.5 18.5 19.2 19.8 20.6 21.6 22.5 GJ/capita
Final Energy per Capita industry 20.2 19.2 21.4 23.9 25.1 25.6 24.8 23.9 GJ/capita
Final Energy per Capita transportation 12.7 14.3 14.5 16.4 18.5 20.5 22.7 23.9 GJ/capita
Final Energy per Capita total 49.7 51.0 54.4 59.5 63.5 66.7 69.2 70.3 GJ/capita
Long-Term Equilibrium Energy Producer Prices
1990 2005 2020 2035 2050 2065 2080 2095 Units
global oil (w/o carbon charge) $27.6 $32.5 $39.7 $41.9 $44.9 $46.4 $47.2 $46.5 $/barrel (2005$)
global oil (w/ carbon charge) $27.6 $32.5 $41.6 $45.9 $53.2 $64.1 $84.3 $122.3 $/barrel (2005$)
domestic natural gas (w/o carbon charge) $3.3 $3.8 $4.4 $4.1 $4.4 $5.3 $5.3 $5.2 $/mmBTU (2005$)
domestic natural gas (w/ carbon charge) $3.3 $3.8 $4.6 $4.6 $5.4 $7.3 $9.6 $14.2 $/mmBTU (2005$)
domestic coal (w/o carbon charge) $1.7 $1.7 $1.8 $1.7 $1.7 $1.7 $1.6 $1.5 $/GJ (2005$)
domestic coal (w/ carbon charge) $1.7 $1.7 $2.2 $2.6 $3.5 $5.5 $9.4 $17.8 $/GJ (2005$)
domestic electricity (w/ carbon charge) 6.21 5.75 5.98 5.86 6.13 6.60 7.02 7.42 cents/kWh (2005$)
carbon price 0.0 0.0 15.4 31.9 66.4 138.0 287.1 596.8 $/tC (2005$)
Crop Prices
1990 2005 2020 2035 2050 2065 2080 2095 Units
global corn 33 33 37 40 45 53 64 80 $/Gcal (2005$)
global rice 32 32 37 41 47 56 69 88 $/Gcal (2005$)
global wheat 27 27 33 37 44 54 71 96 $/Gcal (2005$)
Emissions by Sectors
1990 2005 2020 2035 2050 2065 2080 2095 Units
buildings 0.858 0.860 1.021 1.102 1.069 0.949 0.738 0.454 GtC/yr
industry 1.623 1.706 2.052 2.324 2.177 1.669 0.971 0.242 GtC/yr
transportation 1.354 1.863 2.211 2.726 3.098 3.184 2.944 2.153 GtC/yr
electricity 1.909 2.848 3.572 4.306 4.470 4.210 2.598 1.120 GtC/yr
cement 0.261 0.483 0.824 1.085 1.084 0.824 0.599 0.439 GtC/yr
emissions reduction 0.000 0.000 0.585 1.721 4.227 8.101 13.765 19.891 GtC/yr
total: w/o reduction 6.006 7.760 9.680 11.542 11.897 10.835 7.850 4.407 GtC/yr

Scenario: nucadv stab Page 42
Final Energy Consumption: Buildings Final Energy Consumption: Industry (Does not Include Feedstocks)
Final Energy Consumption: Transportation Final Energy Consumption by Sector
0
50
100
150
200
250
300
1990 2005 2020 2035 2050 2065 2080 2095
EJ
/yr
liquids gascoal biomasselectricity trad biomassenergy reduction
0
50
100
150
200
250
300
350
400
1990 2005 2020 2035 2050 2065 2080 2095
EJ
/yr
liquids gas
coal biomass
electricity hydrogen
energy reduction feedstocks
0
50
100
150
200
250
300
1990 2005 2020 2035 2050 2065 2080 2095
EJ
/yr
liquids gas
coal electricity
hydrogen energy reduction
0
100
200
300
400
500
600
700
800
900
1990 2005 2020 2035 2050 2065 2080 2095
EJ
/yr
buildings industry
transportation energy reduction

Scenario: nucadv stab Page 43
Primary Energy Consumption Electricity Production by Fuel: CCS Focus
Hydrogen Production by Fuel Electricity Production by Fuel: Renewable Focus
-50
0
50
100
150
200
250
300
350
400
1990 2005 2020 2035 2050 2065 2080 2095
EJ
/yr
liquids liquids w/CCS
gas gas w/ccs
coal coal w/ccs
biomass biomass w/ccs
nuclear hydro
wind solar
geothermal energy reduction
-50
-40
-30
-20
-10
0
10
20
30
40
50
60
70
80
1990 2005 2020 2035 2050 2065 2080 2095
EJ
/yr
gas gas w/ccs
coal coal w/ccs
biomass biomass w/ccs
nuclear bulk electricity
wind solar
energy reduction
-50
0
50
100
150
200
250
300
350
400
1990 2005 2020 2035 2050 2065 2080 2095
EJ
/yr
liquids gascoal biomassnuclear hydrowind w/ backup wind w/ storagecsp w/ backup csp w/ storagepv w/ backup pv w/ storagerooftop solar w/ backup geothermalenergy reduction
0
200
400
600
800
1,000
1,200
1,400
1,600
1990 2005 2020 2035 2050 2065 2080 2095
EJ
/yr
oil w/o ccs oil w/ ccsnatural gas w/o ccs natural gas w/ ccscoal w/o ccs coal w/ ccsbiomass w/o ccs biomass w/ ccsnuclear hydrowind solargeothermal energy reduction

Scenario: nucadv stab Page 44
Industrial Liquids Production by Fuel (Feedstocks and Fuel) Transportation Fuels Composition
Final Energy Intensity Final Energy per Capita
0
50
100
150
200
250
300
1990 2005 2020 2035 2050 2065 2080 2095
EJ
/yr
conventional oil unconventional oilcoal liquids coal liquids w/ ccs bio fuels gas liquidsgas coalelectricity hydrogenenergy reduction
0
10
20
30
40
50
60
70
80
90
1990 2005 2020 2035 2050 2065 2080 2095
EJ
/yr
conventional oil unconventional oilcoal liquids coal liquids w/ ccs bio fuels gas liquidsenergy reduction
0
2
4
6
8
10
12
1990 2005 2020 2035 2050 2065 2080 2095
GJ
/10
00
$ (
20
05
$)
0
50
100
150
200
250
300
350
Re
fere
nc
e G
DP
(T
rillio
n 2
00
5$
)
building
industry
transportation
total
reference GDP
0
10
20
30
40
50
60
70
80
1990 2005 2020 2035 2050 2065 2080 2095
GJ
/ca
pit
a
0
1
2
3
4
5
6
7
8
9
10
Po
pu
lati
on
(b
illio
n)
building
industry
transportation
total
population

Scenario: nucadv stab Page 45
Dedicated Energy Crops, Waste Biomass, and Municipal Solid Waste Consumption by Sector Land Use by Type
Biomass Production by Source CO2 Emissions by Sector
-125
-100
-75
-50
-25
0
25
50
75
100
125
150
175
200
225
250
1990 2005 2020 2035 2050 2065 2080 2095
EJ
/yr
energy reductionsynthetic gashydrogenrefined liquids: tran & bldgelectricityIndustrydirect buildings
0
2
4
6
8
10
12
14
16
1990 2005 2020 2035 2050 2065 2080 2095
Billio
n H
ec
tare
s
urban land cropspasture managed forestbioenergy crops unmanaged forestunmanaged land rock/ice/desert/tundra
-125
-100
-75
-50
-25
0
25
50
75
100
125
150
175
200
225
250
1990 2005 2020 2035 2050 2065 2080 2095
EJ
/yr
reduction in municipal solid wate
reduction in biomass crops
waste biomass
municipal solid waste
dedicated biomass crops
waste biomass
-5
0
5
10
15
20
25
1990 2005 2020 2035 2050 2065 2080 2095
GtC
/yr
buildings industry
transportation electricity
cement emissions reduction

Scenario: ccs stab Page 46
Final Energy Consumption
1990 2005 2020 2035 2050 2065 2080 2095 Units
building liquids 15.2 16.4 20.3 23.7 25.4 27.3 24.2 20.2 EJ/yr
building gas 18.7 26.7 28.9 30.6 30.4 27.3 23.1 19.7 EJ/yr
building coal 10.1 5.1 7.1 6.8 5.2 3.3 1.4 0.8 EJ/yr
building biomass 4.5 5.5 8.2 9.3 9.5 9.4 6.9 4.2 EJ/yr
building electricity 16.9 29.0 43.4 62.1 81.1 99.9 127.2 153.5 EJ/yr
building trad biomass 23.5 29.9 32.2 28.5 24.2 19.8 14.2 9.5 EJ/yr
building energy reduction 0.0 0.0 2.8 5.7 11.6 22.2 37.6 48.1 EJ/yr
total: w/o reduction 88.9 112.7 140.1 161.0 175.8 187.0 197.0 207.9 EJ/yr
industry liquids 22.4 21.2 20.3 24.2 27.8 33.6 27.2 18.6 EJ/yr
industry gas 26.6 30.5 33.3 38.4 36.9 29.0 22.3 19.5 EJ/yr
industry coal 31.4 35.8 52.2 61.6 56.7 37.1 14.3 9.3 EJ/yr
industry biomass 7.3 11.2 19.5 28.1 39.9 58.3 54.8 40.3 EJ/yr
industry electricity 18.1 24.8 34.2 46.9 61.4 74.6 102.0 127.3 EJ/yr
industry hydrogen 0.0 0.0 2.6 3.2 4.0 5.1 6.0 7.4 EJ/yr
industry energy reduction 0.0 0.0 5.8 14.3 29.6 53.0 85.4 106.6 EJ/yr
industry feedstocks 15.2 23.7 27.2 32.0 35.2 37.0 36.3 36.2 EJ/yr
total: w/o reduction 105.8 123.6 162.1 202.3 226.7 237.6 226.6 222.3 EJ/yr
transportation liquids 62.7 87.7 100.1 118.2 131.1 142.7 144.8 135.4 EJ/yr
transportation gas 2.2 3.0 6.4 11.9 17.2 20.3 23.5 27.5 EJ/yr
transportation coal 0.5 0.2 0.3 0.4 0.3 0.1 0.0 0.0 EJ/yr
transportation electricity 1.0 1.0 2.1 4.6 10.4 15.2 22.9 31.5 EJ/yr
transportation hydrogen 0.0 0.0 0.5 2.0 5.6 9.9 16.3 25.6 EJ/yr
transportation energy reduction 0.0 0.0 1.2 3.3 7.0 13.5 27.8 39.4 EJ/yr
total: w/o reduction 66.4 91.8 109.4 137.1 164.7 188.3 207.5 220.0 EJ/yr
total final energy buildings 88.9 112.7 140.1 161.0 175.8 187.0 197.0 207.9 EJ/yr
total final energy industry 105.8 123.6 162.1 202.3 226.7 237.6 226.6 222.3 EJ/yr
total final energy transportation 66.4 91.8 109.4 137.1 164.7 188.3 207.5 220.0 EJ/yr
total final energy energy reduction 0.0 0.0 9.8 23.3 48.2 88.7 150.8 194.1 EJ/yr
total: w/o reduction 261.1 328.1 411.6 500.4 567.2 612.9 631.1 650.2 EJ/yr

Scenario: ccs stab Page 47
Primary Energy w/CCS
1990 2005 2020 2035 2050 2065 2080 2095 Units
oil w/o ccs 135.6 167.5 180.8 198.8 207.3 222.1 205.5 171.8 EJ/yr
oil w/ ccs 0.0 0.0 0.4 1.3 2.6 5.7 12.9 12.2 EJ/yr
natural gas w/o ccs 69.9 97.5 126.4 168.6 201.0 191.6 167.1 149.0 EJ/yr
natural gas w/ ccs 0.0 0.0 1.2 4.7 12.4 25.2 56.0 98.8 EJ/yr
coal w/o ccs 91.2 119.1 162.6 199.1 200.8 161.0 74.9 13.5 EJ/yr
coal w/ ccs 0.0 0.0 0.5 3.1 14.9 49.5 144.5 243.3 EJ/yr
biomass w/o ccs 14.4 21.6 36.0 52.3 77.2 115.6 123.4 105.3 EJ/yr
biomass w/ ccs 0.0 0.0 0.1 0.6 3.0 10.5 51.2 97.8 EJ/yr
nuclear 21.0 26.1 23.4 21.8 19.0 18.2 16.8 15.0 EJ/yr
hydro 23.6 29.2 29.2 30.8 30.8 32.8 33.6 32.6 EJ/yr
wind 0.0 0.9 15.2 33.4 44.4 57.8 71.2 77.1 EJ/yr
solar 0.0 0.1 1.3 3.8 7.6 13.7 24.1 33.4 EJ/yr
geothermal 0.4 0.5 1.4 5.4 7.9 7.8 7.3 6.6 EJ/yr
energy reduction 0.0 0.0 14.3 38.2 88.0 158.7 230.5 316.3 EJ/yr
total: w/o reduction 356 463 578 724 829 911 989 1056 EJ/yr
Electricity Production by Fuel
1990 2005 2020 2035 2050 2065 2080 2095 Units
oil 4.86 4.33 3.97 2.98 2.99 3.17 2.13 1.26 EJ/yr
oil w/ccs 0.00 0.00 0.15 0.54 1.15 2.61 6.12 5.80 EJ/yr
gas 6.07 12.82 23.42 35.11 47.27 47.41 40.60 26.64 EJ/yr
gas w/ccs 0.00 0.00 0.47 2.34 6.66 14.44 33.42 60.10 EJ/yr
coal 16.06 26.35 36.04 46.69 53.43 48.98 25.79 1.08 EJ/yr
coal w/ccs 0.00 0.00 0.17 1.26 6.47 22.40 67.49 113.40 EJ/yr
biomass 0.43 0.71 1.32 2.58 5.30 7.34 6.54 2.73 EJ/yr
biomass w/ccs 0.00 0.00 0.01 0.20 1.19 4.21 20.76 40.09 EJ/yr
nuclear 7.36 9.97 9.95 9.95 9.95 9.95 9.95 9.95 EJ/yr
hydro 7.82 10.44 12.13 13.99 15.85 17.70 19.56 21.42 EJ/yr
wind w/backup 0.01 0.36 5.01 10.91 15.03 19.56 24.73 29.36 EJ/yr
wind w/storage 0.00 0.00 1.30 4.02 7.25 11.20 16.09 20.84 EJ/yr
CSP w/backup 0.00 0.00 0.33 0.61 0.76 1.29 2.28 3.70 EJ/yr
CSP w/storage 0.00 0.00 0.12 0.95 2.43 4.25 7.42 11.89 EJ/yr
PV w/backup 0.00 0.04 0.05 0.06 0.26 0.85 2.05 3.25 EJ/yr
PV w/storage 0.00 0.00 0.01 0.03 0.13 0.40 0.92 1.44 EJ/yr
rooftop PV w/backup 0.00 0.00 0.30 0.88 2.09 4.58 6.03 7.31 EJ/yr
geothermal 0.13 0.21 0.58 2.53 4.20 4.36 4.39 4.40 EJ/yr
energy reduction 0.00 0.00 2.40 7.49 17.67 28.72 18.81 12.53 EJ/yr
total: w/o reduction 42.7 65.2 95.3 135.6 182.4 224.7 296.3 364.7 EJ/yr

Scenario: ccs stab Page 48
Transportation Fuels Production by Fuel
1990 2005 2020 2035 2050 2065 2080 2095 Units
conventional oil 62.5 86.8 94.5 102.1 98.9 100.5 94.3 63.2 EJ/yr
unconventional oil 0.0 0.0 1.5 5.8 14.4 20.9 25.3 42.6 EJ/yr
coal liquids 0.0 0.0 1.1 2.7 4.0 2.8 1.3 0.2 EJ/yr
coal liquids w/ ccs 0.0 0.0 0.0 0.0 0.0 0.2 0.5 1.1 EJ/yr
bio fuels 0.2 0.9 1.6 2.8 5.1 10.7 17.4 21.1 EJ/yr
gas liquids 0.0 0.0 1.4 4.8 8.6 7.6 5.9 7.2 EJ/yr
gas 2.2 3.0 6.4 11.9 17.2 20.3 23.5 27.5 EJ/yr
coal 0.5 0.2 0.3 0.4 0.3 0.1 0.0 0.0 EJ/yr
electricity 1.0 1.0 2.1 4.6 10.4 15.2 22.9 31.5 EJ/yr
hydrogen 0.0 0.0 0.5 2.0 5.6 9.9 16.3 25.6 EJ/yr
energy reduction 0.0 0.0 1.2 3.3 7.0 13.5 27.8 39.4 EJ/yr
total: w/o reduction 66.4 91.8 109.4 137.1 164.7 188.3 207.5 220.0 EJ/yr
Industrial Liquids Production by Fuel
1990 2005 2020 2035 2050 2065 2080 2095 Units
conventional oil 36.59 43.89 45.36 50.69 51.85 55.96 47.96 29.49 EJ/yr
unconventional oil 0.00 0.00 0.37 1.75 5.22 7.84 8.61 16.59 EJ/yr
coal liquids 0.00 0.00 0.25 0.68 1.04 0.74 0.07 0.20 EJ/yr
coal liquids w/ ccs 0.00 0.00 0.00 0.00 0.00 0.03 0.07 0.20 EJ/yr
bio fuels 0.01 0.05 0.20 0.49 1.20 2.95 4.59 5.87 EJ/yr
gas liquids 0.00 0.00 0.36 1.49 2.68 2.24 1.49 1.82 EJ/yr
energy reduction 0.0 0.0 0.7 1.4 3.0 8.1 20.6 26.8 EJ/yr
total: w/o reduction 36.6 43.9 46.5 55.1 62.0 69.8 62.8 54.2 EJ/yr
Hydrogen Production by Fuel
1990 2005 2020 2035 2050 2065 2080 2095 Units
gas 0.00 0.00 2.08 3.46 6.23 9.00 9.33 9.62 EJ/yr
gas w/ccs 0.00 0.00 0.25 0.47 1.03 1.88 4.11 7.29 EJ/yr
coal 0.00 0.00 0.39 0.56 0.79 0.76 0.33 0.21 EJ/yr
coal w/ccs 0.00 0.00 0.07 0.12 0.34 0.98 2.60 5.07 EJ/yr
biomass 0.00 0.00 0.14 0.22 0.40 0.60 0.42 0.26 EJ/yr
biomass w/ccs 0.00 0.00 0.03 0.06 0.17 0.64 3.45 6.93 EJ/yr
nuclear 0.00 0.00 0.00 0.00 0.00 0.00 0.00 0.00 EJ/yr
bulk electricity 0.00 0.00 0.08 0.16 0.33 0.56 0.83 1.15 EJ/yr
wind 0.00 0.00 0.07 0.07 0.11 0.20 0.37 0.63 EJ/yr
solar 0.00 0.00 0.07 0.10 0.20 0.40 0.87 1.76 EJ/yr
energy reduction 0.00 0.00 0.06 0.02 -0.24 -0.77 -2.32 -5.19 EJ/yr
total: w/o reduction 0.00 0.00 3.18 5.22 9.60 15.02 22.30 32.92 EJ/yr

Scenario: ccs stab Page 49
Dedicated Bioenergy Crops, Crop Residues, and Municipal Solid Waste Consumption by Sector
1990 2005 2020 2035 2050 2065 2080 2095 Units
direct buildings 4.5 5.5 8.2 9.3 9.5 9.4 6.9 4.2 EJ/yr
Industry 7.4 11.3 19.9 29.1 42.3 63.9 63.3 50.9 EJ/yr
electricity 2.1 2.5 3.8 7.1 15.1 26.0 59.0 90.1 EJ/yr
refined liquids: tran & bldg 0.5 2.2 3.9 6.7 12.0 24.2 37.6 43.9 EJ/yr
hydrogen 0.0 0.0 0.4 0.6 1.2 2.5 7.8 14.1 EJ/yr
synthetic gas 0.0 0.0 0.0 0.0 0.0 0.1 0.1 0.1 EJ/yr
energy reduction 0.0 0.0 -4.0 -9.0 -19.9 -42.5 -73.3 -73.1 EJ/yr
total: w/o reduction 14.4 21.6 36.1 52.9 80.2 126.1 174.6 203.2 EJ/yr
Biomass Production
1990 2005 2020 2035 2050 2065 2080 2095 Units
waste biomass 14.4 21.5 25.9 32.1 43.9 61.9 80.4 84.4 EJ
dedicated biomass crops 0.0 0.0 10.1 20.4 34.4 48.7 64.0 79.9 EJ
municipal solid waste 0.0 0.1 0.1 0.3 1.9 15.5 30.2 38.9 EJ
waste biomass 0.0 0.0 5.8 5.7 -2.1 -16.5 -33.3 -35.0 EJ
reduction in biomass crops 0.0 0.0 -10.1 -15.5 -17.7 -13.9 -15.3 -9.5 EJ
reduction in municipal solid wate0.0 0.0 0.3 0.7 -0.1 -12.1 -24.7 -28.6 EJ
total: w/o reduction 14.4 21.6 31.8 43.1 60.4 95.7 126.0 158.6 EJ
Arable Land Use by Type
1990 2005 2020 2035 2050 2065 2080 2095 Units
urban land 0.05 0.05 0.05 0.05 0.05 0.05 0.05 0.05 billion Ha
crops 1.20 1.21 1.08 1.03 0.90 0.76 0.64 0.56 billion Ha
pasture 0.70 0.73 0.76 0.77 0.74 0.72 0.70 0.69 billion Ha
managed forest 0.69 0.74 0.83 0.91 0.98 1.02 1.04 1.03 billion Ha
bioenergy crops 0.00 0.00 0.04 0.09 0.16 0.23 0.31 0.40 billion Ha
unmanaged forest 3.32 3.25 3.87 3.83 3.81 3.82 3.84 3.84 billion Ha
unmanaged land 4.58 4.58 3.93 3.88 3.91 3.94 3.97 3.98 billion Ha
rock/ice/desert/tundra 2.62 2.62 2.62 2.62 2.62 2.62 2.62 2.62 billion Ha
total 10.50 10.50 10.50 10.50 10.50 10.50 10.50 10.50 billion Ha
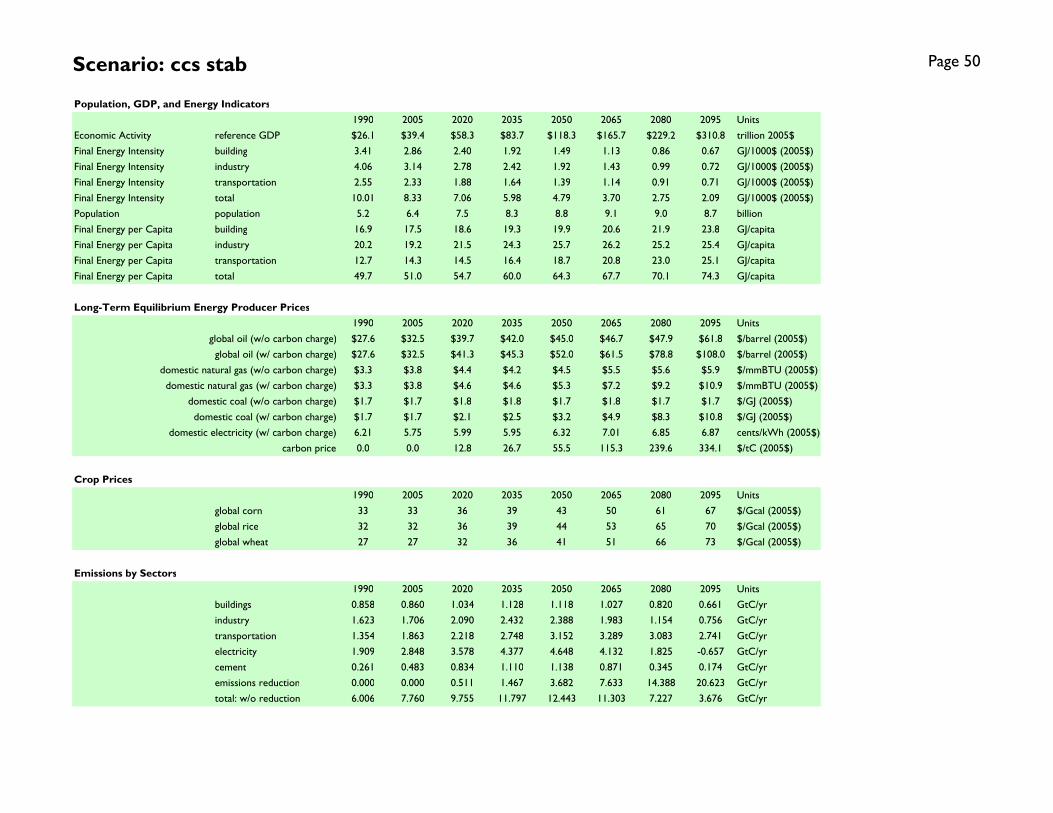
Scenario: ccs stab Page 50
Population, GDP, and Energy Indicators
1990 2005 2020 2035 2050 2065 2080 2095 Units
Economic Activity reference GDP $26.1 $39.4 $58.3 $83.7 $118.3 $165.7 $229.2 $310.8 trillion 2005$
Final Energy Intensity building 3.41 2.86 2.40 1.92 1.49 1.13 0.86 0.67 GJ/1000$ (2005$)
Final Energy Intensity industry 4.06 3.14 2.78 2.42 1.92 1.43 0.99 0.72 GJ/1000$ (2005$)
Final Energy Intensity transportation 2.55 2.33 1.88 1.64 1.39 1.14 0.91 0.71 GJ/1000$ (2005$)
Final Energy Intensity total 10.01 8.33 7.06 5.98 4.79 3.70 2.75 2.09 GJ/1000$ (2005$)
Population population 5.2 6.4 7.5 8.3 8.8 9.1 9.0 8.7 billion
Final Energy per Capita building 16.9 17.5 18.6 19.3 19.9 20.6 21.9 23.8 GJ/capita
Final Energy per Capita industry 20.2 19.2 21.5 24.3 25.7 26.2 25.2 25.4 GJ/capita
Final Energy per Capita transportation 12.7 14.3 14.5 16.4 18.7 20.8 23.0 25.1 GJ/capita
Final Energy per Capita total 49.7 51.0 54.7 60.0 64.3 67.7 70.1 74.3 GJ/capita
Long-Term Equilibrium Energy Producer Prices
1990 2005 2020 2035 2050 2065 2080 2095 Units
global oil (w/o carbon charge) $27.6 $32.5 $39.7 $42.0 $45.0 $46.7 $47.9 $61.8 $/barrel (2005$)
global oil (w/ carbon charge) $27.6 $32.5 $41.3 $45.3 $52.0 $61.5 $78.8 $108.0 $/barrel (2005$)
domestic natural gas (w/o carbon charge) $3.3 $3.8 $4.4 $4.2 $4.5 $5.5 $5.6 $5.9 $/mmBTU (2005$)
domestic natural gas (w/ carbon charge) $3.3 $3.8 $4.6 $4.6 $5.3 $7.2 $9.2 $10.9 $/mmBTU (2005$)
domestic coal (w/o carbon charge) $1.7 $1.7 $1.8 $1.8 $1.7 $1.8 $1.7 $1.7 $/GJ (2005$)
domestic coal (w/ carbon charge) $1.7 $1.7 $2.1 $2.5 $3.2 $4.9 $8.3 $10.8 $/GJ (2005$)
domestic electricity (w/ carbon charge) 6.21 5.75 5.99 5.95 6.32 7.01 6.85 6.87 cents/kWh (2005$)
carbon price 0.0 0.0 12.8 26.7 55.5 115.3 239.6 334.1 $/tC (2005$)
Crop Prices
1990 2005 2020 2035 2050 2065 2080 2095 Units
global corn 33 33 36 39 43 50 61 67 $/Gcal (2005$)
global rice 32 32 36 39 44 53 65 70 $/Gcal (2005$)
global wheat 27 27 32 36 41 51 66 73 $/Gcal (2005$)
Emissions by Sectors
1990 2005 2020 2035 2050 2065 2080 2095 Units
buildings 0.858 0.860 1.034 1.128 1.118 1.027 0.820 0.661 GtC/yr
industry 1.623 1.706 2.090 2.432 2.388 1.983 1.154 0.756 GtC/yr
transportation 1.354 1.863 2.218 2.748 3.152 3.289 3.083 2.741 GtC/yr
electricity 1.909 2.848 3.578 4.377 4.648 4.132 1.825 -0.657 GtC/yr
cement 0.261 0.483 0.834 1.110 1.138 0.871 0.345 0.174 GtC/yr
emissions reduction 0.000 0.000 0.511 1.467 3.682 7.633 14.388 20.623 GtC/yr
total: w/o reduction 6.006 7.760 9.755 11.797 12.443 11.303 7.227 3.676 GtC/yr

Scenario: ccs stab Page 51
Final Energy Consumption: Buildings Final Energy Consumption: Industry (Does not Include Feedstocks)
Final Energy Consumption: Transportation Final Energy Consumption by Sector
0
50
100
150
200
250
300
1990 2005 2020 2035 2050 2065 2080 2095
EJ
/yr
liquids gascoal biomasselectricity trad biomassenergy reduction
0
50
100
150
200
250
300
350
400
1990 2005 2020 2035 2050 2065 2080 2095
EJ
/yr
liquids gas
coal biomass
electricity hydrogen
energy reduction feedstocks
0
50
100
150
200
250
300
1990 2005 2020 2035 2050 2065 2080 2095
EJ
/yr
liquids gas
coal electricity
hydrogen energy reduction
0
100
200
300
400
500
600
700
800
900
1990 2005 2020 2035 2050 2065 2080 2095
EJ
/yr
buildings industry
transportation energy reduction

Scenario: ccs stab Page 52
Primary Energy Consumption Electricity Production by Fuel: CCS Focus
Hydrogen Production by Fuel Electricity Production by Fuel: Renewable Focus
-50
0
50
100
150
200
250
300
350
400
1990 2005 2020 2035 2050 2065 2080 2095
EJ
/yr
liquids liquids w/CCS
gas gas w/ccs
coal coal w/ccs
biomass biomass w/ccs
nuclear hydro
wind solar
geothermal energy reduction
-50
-40
-30
-20
-10
0
10
20
30
40
50
60
70
80
1990 2005 2020 2035 2050 2065 2080 2095
EJ
/yr
gas gas w/ccs
coal coal w/ccs
biomass biomass w/ccs
nuclear bulk electricity
wind solar
energy reduction
-50
0
50
100
150
200
250
300
350
400
1990 2005 2020 2035 2050 2065 2080 2095
EJ
/yr
liquids gascoal biomassnuclear hydrowind w/ backup wind w/ storagecsp w/ backup csp w/ storagepv w/ backup pv w/ storagerooftop solar w/ backup geothermalenergy reduction
0
200
400
600
800
1,000
1,200
1,400
1,600
1990 2005 2020 2035 2050 2065 2080 2095
EJ
/yr
oil w/o ccs oil w/ ccsnatural gas w/o ccs natural gas w/ ccscoal w/o ccs coal w/ ccsbiomass w/o ccs biomass w/ ccsnuclear hydrowind solargeothermal energy reduction

Scenario: ccs stab Page 53
Industrial Liquids Production by Fuel (Feedstocks and Fuel) Transportation Fuels Composition
Final Energy Intensity Final Energy per Capita
0
50
100
150
200
250
300
1990 2005 2020 2035 2050 2065 2080 2095
EJ
/yr
conventional oil unconventional oilcoal liquids coal liquids w/ ccs bio fuels gas liquidsgas coalelectricity hydrogenenergy reduction
0
10
20
30
40
50
60
70
80
90
1990 2005 2020 2035 2050 2065 2080 2095
EJ
/yr
conventional oil unconventional oilcoal liquids coal liquids w/ ccs bio fuels gas liquidsenergy reduction
0
2
4
6
8
10
12
1990 2005 2020 2035 2050 2065 2080 2095
GJ
/10
00
$ (
20
05
$)
0
50
100
150
200
250
300
350
Re
fere
nc
e G
DP
(T
rillio
n 2
00
5$
)
building
industry
transportation
total
reference GDP
0
10
20
30
40
50
60
70
80
1990 2005 2020 2035 2050 2065 2080 2095
GJ
/ca
pit
a
0
1
2
3
4
5
6
7
8
9
10
Po
pu
lati
on
(b
illio
n)
building
industry
transportation
total
population
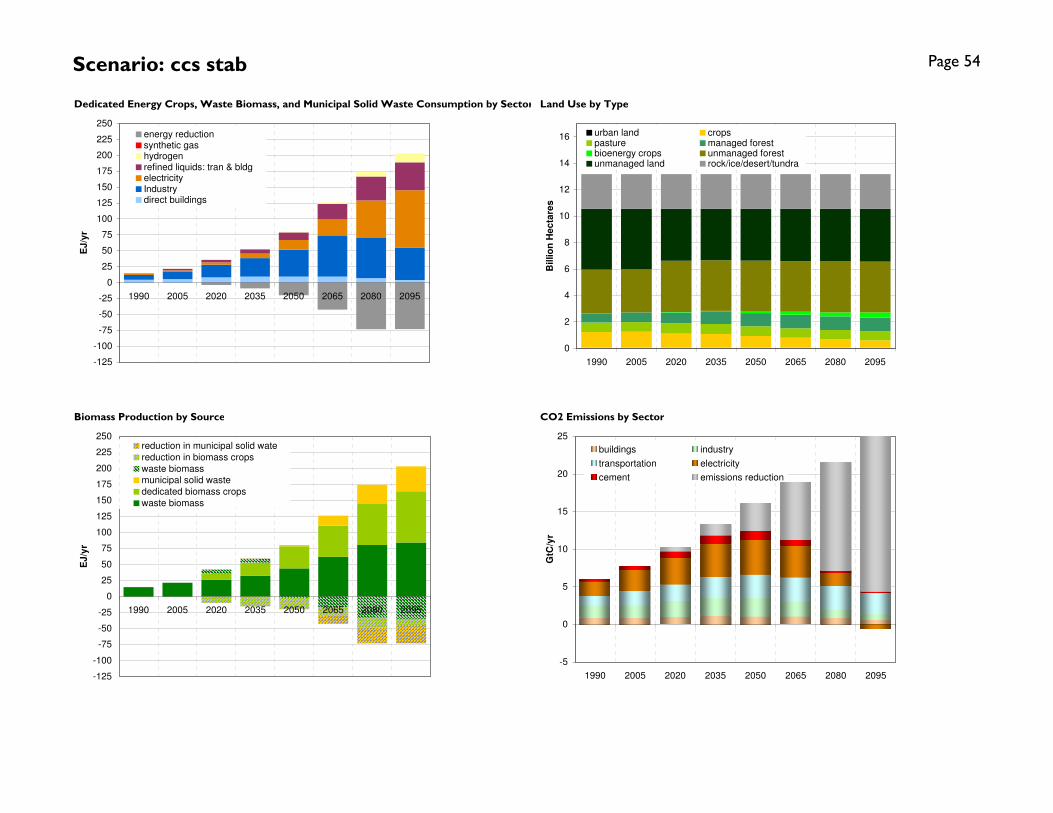
Scenario: ccs stab Page 54
Dedicated Energy Crops, Waste Biomass, and Municipal Solid Waste Consumption by Sector Land Use by Type
Biomass Production by Source CO2 Emissions by Sector
-125
-100
-75
-50
-25
0
25
50
75
100
125
150
175
200
225
250
1990 2005 2020 2035 2050 2065 2080 2095
EJ
/yr
energy reductionsynthetic gashydrogenrefined liquids: tran & bldgelectricityIndustrydirect buildings
0
2
4
6
8
10
12
14
16
1990 2005 2020 2035 2050 2065 2080 2095
Billio
n H
ec
tare
s
urban land cropspasture managed forestbioenergy crops unmanaged forestunmanaged land rock/ice/desert/tundra
-125
-100
-75
-50
-25
0
25
50
75
100
125
150
175
200
225
250
1990 2005 2020 2035 2050 2065 2080 2095
EJ
/yr
reduction in municipal solid wate
reduction in biomass crops
waste biomass
municipal solid waste
dedicated biomass crops
waste biomass
-5
0
5
10
15
20
25
1990 2005 2020 2035 2050 2065 2080 2095
GtC
/yr
buildings industry
transportation electricity
cement emissions reduction

Scenario: bioccs stab Page 55
Final Energy Consumption
1990 2005 2020 2035 2050 2065 2080 2095 Units
building liquids 15.2 16.4 20.4 23.8 25.5 27.5 24.4 21.4 EJ/yr
building gas 18.7 26.7 29.0 30.6 30.5 27.4 23.2 20.7 EJ/yr
building coal 10.1 5.1 7.1 6.8 5.3 3.3 1.4 0.9 EJ/yr
building biomass 4.5 5.5 8.2 9.5 9.9 9.7 7.3 4.8 EJ/yr
building electricity 16.9 29.0 43.5 62.4 81.7 100.7 128.5 154.7 EJ/yr
building trad biomass 23.5 29.9 32.2 28.5 24.1 19.7 14.1 9.4 EJ/yr
building energy reduction 0.0 0.0 2.6 5.0 10.6 20.9 35.6 44.1 EJ/yr
total: w/o reduction 88.9 112.7 140.3 161.6 176.8 188.4 199.0 211.9 EJ/yr
industry liquids 22.4 21.2 20.3 24.1 27.7 33.5 27.2 20.3 EJ/yr
industry gas 26.6 30.5 33.3 38.3 36.8 29.0 22.2 20.7 EJ/yr
industry coal 31.4 35.8 52.3 61.8 56.8 37.1 14.2 10.9 EJ/yr
industry biomass 7.3 11.2 19.7 29.0 41.9 61.0 58.3 45.9 EJ/yr
industry electricity 18.1 24.8 34.2 46.9 61.4 74.6 102.1 124.2 EJ/yr
industry hydrogen 0.0 0.0 2.6 3.2 4.0 5.1 6.0 7.3 EJ/yr
industry energy reduction 0.0 0.0 5.5 13.3 27.8 50.3 82.0 99.6 EJ/yr
industry feedstocks 15.2 23.7 27.3 32.1 35.4 37.3 36.7 36.9 EJ/yr
total: w/o reduction 105.8 123.6 162.4 203.3 228.5 240.2 230.0 229.4 EJ/yr
transportation liquids 62.7 87.7 100.2 118.5 131.7 143.7 146.2 140.9 EJ/yr
transportation gas 2.2 3.0 6.4 12.0 17.3 20.4 23.7 28.2 EJ/yr
transportation coal 0.5 0.2 0.3 0.4 0.3 0.1 0.0 0.0 EJ/yr
transportation electricity 1.0 1.0 2.1 4.6 10.5 15.3 23.0 30.8 EJ/yr
transportation hydrogen 0.0 0.0 0.5 2.1 5.6 10.0 16.4 25.0 EJ/yr
transportation energy reduction 0.0 0.0 1.1 2.8 6.2 12.2 25.9 34.4 EJ/yr
total: w/o reduction 66.4 91.8 109.5 137.6 165.5 189.5 209.3 224.9 EJ/yr
total final energy buildings 88.9 112.7 140.3 161.6 176.8 188.4 199.0 211.9 EJ/yr
total final energy industry 105.8 123.6 162.4 203.3 228.5 240.2 230.0 229.4 EJ/yr
total final energy transportation 66.4 91.8 109.5 137.6 165.5 189.5 209.3 224.9 EJ/yr
total final energy energy reduction 0.0 0.0 9.2 21.2 44.6 83.5 143.6 178.1 EJ/yr
total: w/o reduction 261.1 328.1 412.2 502.5 570.8 618.1 638.4 666.1 EJ/yr

Scenario: bioccs stab Page 56
Primary Energy w/CCS
1990 2005 2020 2035 2050 2065 2080 2095 Units
oil w/o ccs 135.6 167.5 181.0 198.9 207.1 221.1 201.9 172.4 EJ/yr
oil w/ ccs 0.0 0.0 0.4 1.3 2.6 5.6 12.9 11.6 EJ/yr
natural gas w/o ccs 69.9 97.5 126.5 169.0 201.5 192.3 167.5 155.2 EJ/yr
natural gas w/ ccs 0.0 0.0 1.2 4.7 12.3 25.1 55.7 93.9 EJ/yr
coal w/o ccs 91.2 119.1 162.8 199.7 201.8 162.3 75.8 16.8 EJ/yr
coal w/ ccs 0.0 0.0 0.5 3.1 14.7 48.9 143.4 238.4 EJ/yr
biomass w/o ccs 14.4 21.6 36.4 54.2 82.0 124.0 138.6 131.3 EJ/yr
biomass w/ ccs 0.0 0.0 0.1 0.6 3.1 10.7 54.3 95.2 EJ/yr
nuclear 21.0 26.1 23.4 21.8 19.0 18.2 16.8 15.3 EJ/yr
hydro 23.6 29.2 29.2 30.8 30.9 32.8 33.6 33.0 EJ/yr
wind 0.0 0.9 15.3 33.4 44.5 57.8 71.2 77.0 EJ/yr
solar 0.0 0.1 1.3 3.8 7.6 13.7 24.1 33.0 EJ/yr
geothermal 0.4 0.5 1.4 5.5 7.9 7.8 7.3 6.7 EJ/yr
energy reduction 0.0 0.0 13.4 35.1 82.1 149.7 216.0 293.1 EJ/yr
total: w/o reduction 356 463 579 727 835 921 1003 1080 EJ/yr
Electricity Production by Fuel
1990 2005 2020 2035 2050 2065 2080 2095 Units
oil 4.86 4.33 3.98 2.99 3.01 3.21 2.17 1.52 EJ/yr
oil w/ccs 0.00 0.00 0.15 0.54 1.15 2.61 6.10 5.53 EJ/yr
gas 6.07 12.82 23.47 35.24 47.52 47.80 41.07 28.48 EJ/yr
gas w/ccs 0.00 0.00 0.47 2.34 6.65 14.40 33.26 57.25 EJ/yr
coal 16.06 26.35 36.08 46.86 53.78 49.51 26.19 1.73 EJ/yr
coal w/ccs 0.00 0.00 0.17 1.25 6.40 22.12 67.00 111.20 EJ/yr
biomass 0.43 0.71 1.33 2.63 5.48 7.64 6.83 4.03 EJ/yr
biomass w/ccs 0.00 0.00 0.01 0.20 1.21 4.29 21.96 39.43 EJ/yr
nuclear 7.36 9.97 9.95 9.95 9.95 9.95 9.95 9.95 EJ/yr
hydro 7.82 10.44 12.13 13.99 15.85 17.70 19.56 21.42 EJ/yr
wind w/backup 0.01 0.36 5.01 10.93 15.04 19.59 24.76 29.06 EJ/yr
wind w/storage 0.00 0.00 1.30 4.03 7.25 11.19 16.07 20.50 EJ/yr
CSP w/backup 0.00 0.00 0.33 0.61 0.76 1.30 2.28 3.62 EJ/yr
CSP w/storage 0.00 0.00 0.12 0.96 2.43 4.25 7.41 11.63 EJ/yr
PV w/backup 0.00 0.04 0.05 0.06 0.26 0.86 2.05 3.20 EJ/yr
PV w/storage 0.00 0.00 0.01 0.03 0.13 0.40 0.92 1.42 EJ/yr
rooftop PV w/backup 0.00 0.00 0.30 0.88 2.10 4.60 6.05 7.36 EJ/yr
geothermal 0.13 0.21 0.58 2.54 4.20 4.36 4.39 4.40 EJ/yr
energy reduction 0.00 0.00 2.29 7.12 16.91 27.68 17.03 15.16 EJ/yr
total: w/o reduction 42.7 65.2 95.4 136.0 183.2 225.8 298.0 361.7 EJ/yr

Scenario: bioccs stab Page 57
Transportation Fuels Production by Fuel
1990 2005 2020 2035 2050 2065 2080 2095 Units
conventional oil 62.5 86.8 94.6 102.2 98.8 99.9 92.5 63.1 EJ/yr
unconventional oil 0.0 0.0 1.5 5.8 14.4 20.9 24.9 42.3 EJ/yr
coal liquids 0.0 0.0 1.1 2.7 4.0 2.8 1.3 0.2 EJ/yr
coal liquids w/ ccs 0.0 0.0 0.0 0.0 0.0 0.2 0.4 1.1 EJ/yr
bio fuels 0.2 0.9 1.6 3.0 5.8 12.3 21.2 27.2 EJ/yr
gas liquids 0.0 0.0 1.4 4.8 8.6 7.6 5.8 7.0 EJ/yr
gas 2.2 3.0 6.4 12.0 17.3 20.4 23.7 28.2 EJ/yr
coal 0.5 0.2 0.3 0.4 0.3 0.1 0.0 0.0 EJ/yr
electricity 1.0 1.0 2.1 4.6 10.5 15.3 23.0 30.8 EJ/yr
hydrogen 0.0 0.0 0.5 2.1 5.6 10.0 16.4 25.0 EJ/yr
energy reduction 0.0 0.0 1.1 2.8 6.2 12.2 25.9 34.4 EJ/yr
total: w/o reduction 66.4 91.8 109.5 137.6 165.5 189.5 209.3 224.9 EJ/yr
Industrial Liquids Production by Fuel
1990 2005 2020 2035 2050 2065 2080 2095 Units
conventional oil 36.59 43.89 45.37 50.70 51.76 55.64 47.12 29.62 EJ/yr
unconventional oil 0.00 0.00 0.37 1.75 5.23 7.85 8.48 16.69 EJ/yr
coal liquids 0.00 0.00 0.25 0.68 1.05 0.75 0.06 0.21 EJ/yr
coal liquids w/ ccs 0.00 0.00 0.00 0.00 0.00 0.03 0.06 0.20 EJ/yr
bio fuels 0.01 0.05 0.20 0.55 1.41 3.51 5.91 8.09 EJ/yr
gas liquids 0.00 0.00 0.36 1.49 2.66 2.22 1.46 1.78 EJ/yr
energy reduction 0.0 0.0 0.7 1.4 2.9 7.9 20.3 24.4 EJ/yr
total: w/o reduction 36.6 43.9 46.6 55.2 62.1 70.0 63.1 56.6 EJ/yr
Hydrogen Production by Fuel
1990 2005 2020 2035 2050 2065 2080 2095 Units
gas 0.00 0.00 2.09 3.46 6.24 9.03 9.30 10.48 EJ/yr
gas w/ccs 0.00 0.00 0.25 0.47 1.02 1.87 4.06 6.73 EJ/yr
coal 0.00 0.00 0.39 0.56 0.80 0.77 0.33 0.28 EJ/yr
coal w/ccs 0.00 0.00 0.07 0.12 0.34 0.97 2.57 4.80 EJ/yr
biomass 0.00 0.00 0.14 0.23 0.42 0.63 0.45 0.34 EJ/yr
biomass w/ccs 0.00 0.00 0.03 0.06 0.17 0.66 3.71 6.24 EJ/yr
nuclear 0.00 0.00 0.00 0.00 0.00 0.00 0.00 0.00 EJ/yr
bulk electricity 0.00 0.00 0.08 0.16 0.33 0.56 0.83 1.15 EJ/yr
wind 0.00 0.00 0.07 0.07 0.11 0.20 0.36 0.60 EJ/yr
solar 0.00 0.00 0.07 0.10 0.20 0.40 0.86 1.66 EJ/yr
energy reduction 0.00 0.00 0.06 0.01 -0.27 -0.83 -2.49 -4.58 EJ/yr
total: w/o reduction 0.00 0.00 3.18 5.23 9.63 15.08 22.47 32.30 EJ/yr

Scenario: bioccs stab Page 58
Dedicated Bioenergy Crops, Crop Residues, and Municipal Solid Waste Consumption by Sector
1990 2005 2020 2035 2050 2065 2080 2095 Units
direct buildings 4.5 5.5 8.2 9.5 9.9 9.7 7.3 4.8 EJ/yr
Industry 7.4 11.3 20.1 30.1 44.6 67.6 69.2 60.5 EJ/yr
electricity 2.1 2.5 3.8 7.3 15.6 26.9 62.2 91.8 EJ/yr
refined liquids: tran & bldg 0.5 2.2 4.0 7.2 13.7 27.8 45.8 56.4 EJ/yr
hydrogen 0.0 0.0 0.4 0.6 1.2 2.6 8.3 12.9 EJ/yr
synthetic gas 0.0 0.0 0.0 0.0 0.0 0.1 0.1 0.1 EJ/yr
energy reduction 0.0 0.0 -4.4 -11.0 -24.7 -51.1 -91.6 -96.4 EJ/yr
total: w/o reduction 14.4 21.6 36.5 54.8 85.0 134.7 192.9 226.5 EJ/yr
Biomass Production
1990 2005 2020 2035 2050 2065 2080 2095 Units
waste biomass 14.4 21.5 25.4 30.1 40.7 60.6 81.8 87.2 EJ
dedicated biomass crops 0.0 0.0 11.0 24.5 43.3 62.1 80.7 100.1 EJ
municipal solid waste 0.0 0.1 0.1 0.2 1.0 12.1 30.3 39.2 EJ
waste biomass 0.0 0.0 6.3 7.8 1.0 -15.2 -34.7 -37.8 EJ
reduction in biomass crops 0.0 0.0 -11.0 -19.6 -26.6 -27.2 -32.0 -29.7 EJ
reduction in municipal solid wate0.0 0.0 0.3 0.8 0.8 -8.7 -24.8 -28.9 EJ
total: w/o reduction 14.4 21.6 31.8 43.0 59.5 92.3 126.1 158.9 EJ
Arable Land Use by Type
1990 2005 2020 2035 2050 2065 2080 2095 Units
urban land 0.05 0.05 0.05 0.05 0.05 0.05 0.05 0.05 billion Ha
crops 1.20 1.21 0.95 0.84 0.71 0.60 0.50 0.44 billion Ha
pasture 0.70 0.73 0.77 0.78 0.75 0.72 0.70 0.69 billion Ha
managed forest 0.69 0.74 0.83 0.92 1.00 1.04 1.05 1.05 billion Ha
bioenergy crops 0.00 0.00 0.04 0.10 0.19 0.28 0.36 0.46 billion Ha
unmanaged forest 3.32 3.25 3.92 3.90 3.88 3.87 3.87 3.86 billion Ha
unmanaged land 4.58 4.58 3.99 3.97 3.98 4.00 4.01 4.01 billion Ha
rock/ice/desert/tundra 2.62 2.62 2.62 2.62 2.62 2.62 2.62 2.62 billion Ha
total 10.50 10.50 10.50 10.50 10.50 10.50 10.50 10.50 billion Ha

Scenario: bioccs stab Page 59
Population, GDP, and Energy Indicators
1990 2005 2020 2035 2050 2065 2080 2095 Units
Economic Activity reference GDP $26.1 $39.4 $58.4 $84.0 $119.0 $167.0 $231.5 $314.7 trillion 2005$
Final Energy Intensity building 3.41 2.86 2.40 1.92 1.49 1.13 0.86 0.67 GJ/1000$ (2005$)
Final Energy Intensity industry 4.06 3.14 2.78 2.42 1.92 1.44 0.99 0.73 GJ/1000$ (2005$)
Final Energy Intensity transportation 2.55 2.33 1.88 1.64 1.39 1.13 0.90 0.71 GJ/1000$ (2005$)
Final Energy Intensity total 10.01 8.33 7.06 5.98 4.80 3.70 2.76 2.12 GJ/1000$ (2005$)
Population population 5.2 6.4 7.5 8.3 8.8 9.1 9.0 8.7 billion
Final Energy per Capita building 16.9 17.5 18.6 19.4 20.1 20.8 22.1 24.2 GJ/capita
Final Energy per Capita industry 20.2 19.2 21.6 24.4 25.9 26.5 25.5 26.2 GJ/capita
Final Energy per Capita transportation 12.7 14.3 14.6 16.5 18.8 20.9 23.2 25.7 GJ/capita
Final Energy per Capita total 49.7 51.0 54.8 60.2 64.8 68.2 70.9 76.1 GJ/capita
Long-Term Equilibrium Energy Producer Prices
1990 2005 2020 2035 2050 2065 2080 2095 Units
global oil (w/o carbon charge) $27.6 $32.5 $39.7 $42.0 $45.0 $46.7 $47.8 $60.9 $/barrel (2005$)
global oil (w/ carbon charge) $27.6 $32.5 $41.3 $45.2 $51.9 $61.3 $78.5 $102.4 $/barrel (2005$)
domestic natural gas (w/o carbon charge) $3.3 $3.8 $4.4 $4.2 $4.5 $5.5 $5.6 $5.9 $/mmBTU (2005$)
domestic natural gas (w/ carbon charge) $3.3 $3.8 $4.6 $4.6 $5.3 $7.2 $9.2 $10.4 $/mmBTU (2005$)
domestic coal (w/o carbon charge) $1.7 $1.7 $1.8 $1.8 $1.7 $1.8 $1.7 $1.7 $/GJ (2005$)
domestic coal (w/ carbon charge) $1.7 $1.7 $2.1 $2.5 $3.2 $4.9 $8.2 $9.9 $/GJ (2005$)
domestic electricity (w/ carbon charge) 6.21 5.75 5.98 5.95 6.31 7.00 6.83 6.86 cents/kWh (2005$)
carbon price 0.0 0.0 12.7 26.3 54.9 114.1 237.2 300.7 $/tC (2005$)
Crop Prices
1990 2005 2020 2035 2050 2065 2080 2095 Units
global corn 33 33 35 37 39 44 51 53 $/Gcal (2005$)
global rice 32 32 34 35 38 42 48 49 $/Gcal (2005$)
global wheat 27 27 30 31 34 39 48 49 $/Gcal (2005$)
Emissions by Sectors
1990 2005 2020 2035 2050 2065 2080 2095 Units
buildings 0.858 0.860 1.036 1.131 1.120 1.027 0.814 0.683 GtC/yr
industry 1.623 1.706 2.092 2.436 2.387 1.980 1.130 0.818 GtC/yr
transportation 1.354 1.863 2.220 2.753 3.153 3.280 3.027 2.774 GtC/yr
electricity 1.909 2.848 3.582 4.392 4.675 4.170 1.802 -0.555 GtC/yr
cement 0.261 0.483 0.834 1.112 1.136 0.868 0.345 0.205 GtC/yr
emissions reduction 0.000 0.000 0.502 1.440 3.655 7.612 14.497 20.373 GtC/yr
total: w/o reduction 6.006 7.760 9.764 11.823 12.470 11.324 7.118 3.926 GtC/yr

Scenario: bioccs stab Page 60
Final Energy Consumption: Buildings Final Energy Consumption: Industry (Does not Include Feedstocks)
Final Energy Consumption: Transportation Final Energy Consumption by Sector
0
50
100
150
200
250
300
1990 2005 2020 2035 2050 2065 2080 2095
EJ
/yr
liquids gascoal biomasselectricity trad biomassenergy reduction
0
50
100
150
200
250
300
350
400
1990 2005 2020 2035 2050 2065 2080 2095
EJ
/yr
liquids gas
coal biomass
electricity hydrogen
energy reduction feedstocks
0
50
100
150
200
250
300
1990 2005 2020 2035 2050 2065 2080 2095
EJ
/yr
liquids gas
coal electricity
hydrogen energy reduction
0
100
200
300
400
500
600
700
800
900
1990 2005 2020 2035 2050 2065 2080 2095
EJ
/yr
buildings industry
transportation energy reduction

Scenario: bioccs stab Page 61
Primary Energy Consumption Electricity Production by Fuel: CCS Focus
Hydrogen Production by Fuel Electricity Production by Fuel: Renewable Focus
-50
0
50
100
150
200
250
300
350
400
1990 2005 2020 2035 2050 2065 2080 2095
EJ
/yr
liquids liquids w/CCS
gas gas w/ccs
coal coal w/ccs
biomass biomass w/ccs
nuclear hydro
wind solar
geothermal energy reduction
-50
-40
-30
-20
-10
0
10
20
30
40
50
60
70
80
1990 2005 2020 2035 2050 2065 2080 2095
EJ
/yr
gas gas w/ccs
coal coal w/ccs
biomass biomass w/ccs
nuclear bulk electricity
wind solar
energy reduction
-50
0
50
100
150
200
250
300
350
400
1990 2005 2020 2035 2050 2065 2080 2095
EJ
/yr
liquids gascoal biomassnuclear hydrowind w/ backup wind w/ storagecsp w/ backup csp w/ storagepv w/ backup pv w/ storagerooftop solar w/ backup geothermalenergy reduction
0
200
400
600
800
1,000
1,200
1,400
1,600
1990 2005 2020 2035 2050 2065 2080 2095
EJ
/yr
oil w/o ccs oil w/ ccsnatural gas w/o ccs natural gas w/ ccscoal w/o ccs coal w/ ccsbiomass w/o ccs biomass w/ ccsnuclear hydrowind solargeothermal energy reduction

Scenario: bioccs stab Page 62
Industrial Liquids Production by Fuel (Feedstocks and Fuel) Transportation Fuels Composition
Final Energy Intensity Final Energy per Capita
0
50
100
150
200
250
300
1990 2005 2020 2035 2050 2065 2080 2095
EJ
/yr
conventional oil unconventional oilcoal liquids coal liquids w/ ccs bio fuels gas liquidsgas coalelectricity hydrogenenergy reduction
0
10
20
30
40
50
60
70
80
90
1990 2005 2020 2035 2050 2065 2080 2095
EJ
/yr
conventional oil unconventional oilcoal liquids coal liquids w/ ccs bio fuels gas liquidsenergy reduction
0
2
4
6
8
10
12
1990 2005 2020 2035 2050 2065 2080 2095
GJ
/10
00
$ (
20
05
$)
0
50
100
150
200
250
300
350
Re
fere
nc
e G
DP
(T
rillio
n 2
00
5$
)
building
industry
transportation
total
reference GDP
0
10
20
30
40
50
60
70
80
1990 2005 2020 2035 2050 2065 2080 2095
GJ
/ca
pit
a
0
1
2
3
4
5
6
7
8
9
10
Po
pu
lati
on
(b
illio
n)
building
industry
transportation
total
population

Scenario: bioccs stab Page 63
Dedicated Energy Crops, Waste Biomass, and Municipal Solid Waste Consumption by Sector Land Use by Type
Biomass Production by Source CO2 Emissions by Sector
-125
-100
-75
-50
-25
0
25
50
75
100
125
150
175
200
225
250
1990 2005 2020 2035 2050 2065 2080 2095
EJ
/yr
energy reductionsynthetic gashydrogenrefined liquids: tran & bldgelectricityIndustrydirect buildings
0
2
4
6
8
10
12
14
16
1990 2005 2020 2035 2050 2065 2080 2095
Billio
n H
ec
tare
s
urban land cropspasture managed forestbioenergy crops unmanaged forestunmanaged land rock/ice/desert/tundra
-125
-100
-75
-50
-25
0
25
50
75
100
125
150
175
200
225
250
1990 2005 2020 2035 2050 2065 2080 2095
EJ
/yr
reduction in municipal solid wate
reduction in biomass crops
waste biomass
municipal solid waste
dedicated biomass crops
waste biomass
-5
0
5
10
15
20
25
1990 2005 2020 2035 2050 2065 2080 2095
GtC
/yr
buildings industry
transportation electricity
cement emissions reduction

Scenario: re stab Page 64
Final Energy Consumption
1990 2005 2020 2035 2050 2065 2080 2095 Units
building liquids 15.2 16.4 20.4 23.5 24.9 25.8 23.0 16.9 EJ/yr
building gas 18.7 26.7 29.1 30.5 29.8 26.2 21.8 14.6 EJ/yr
building coal 10.1 5.1 6.9 6.3 4.6 2.6 1.0 0.3 EJ/yr
building biomass 4.5 5.5 8.4 9.6 9.8 9.3 6.7 3.3 EJ/yr
building electricity 16.9 29.0 42.6 61.7 80.6 100.4 122.1 144.6 EJ/yr
building trad biomass 23.5 29.9 32.3 28.7 24.4 19.9 14.8 10.3 EJ/yr
building energy reduction 0.0 0.0 3.1 6.4 13.4 25.1 45.2 66.0 EJ/yr
total: w/o reduction 88.9 112.7 139.8 160.3 174.0 184.2 189.5 190.0 EJ/yr
industry liquids 22.4 21.2 20.2 23.5 26.6 29.7 24.6 15.0 EJ/yr
industry gas 26.6 30.5 32.9 37.2 34.1 25.9 19.1 11.0 EJ/yr
industry coal 31.4 35.8 49.7 55.0 46.0 25.9 10.4 2.6 EJ/yr
industry biomass 7.3 11.2 20.5 29.9 43.7 60.9 55.8 36.5 EJ/yr
industry electricity 18.1 24.8 34.2 49.3 65.3 81.7 101.1 130.0 EJ/yr
industry hydrogen 0.0 0.0 2.8 3.3 4.0 4.8 5.3 5.1 EJ/yr
industry energy reduction 0.0 0.0 7.5 18.5 36.5 61.6 95.7 128.7 EJ/yr
industry feedstocks 15.2 23.7 27.0 31.5 34.5 36.2 35.0 33.7 EJ/yr
total: w/o reduction 105.8 123.6 160.4 198.2 219.8 229.0 216.4 200.2 EJ/yr
transportation liquids 62.7 87.7 99.8 117.4 129.3 138.8 141.7 126.6 EJ/yr
transportation gas 2.2 3.0 6.3 11.9 16.9 20.1 23.5 23.5 EJ/yr
transportation coal 0.5 0.2 0.3 0.3 0.3 0.1 0.0 0.0 EJ/yr
transportation electricity 1.0 1.0 2.1 4.8 10.9 16.5 23.6 36.0 EJ/yr
transportation hydrogen 0.0 0.0 0.6 2.1 5.7 10.0 15.3 21.2 EJ/yr
transportation energy reduction 0.0 0.0 1.5 3.9 8.6 16.3 31.1 52.0 EJ/yr
total: w/o reduction 66.4 91.8 109.2 136.5 163.1 185.4 204.1 207.3 EJ/yr
total final energy buildings 88.9 112.7 139.8 160.3 174.0 184.2 189.5 190.0 EJ/yr
total final energy industry 105.8 123.6 160.4 198.2 219.8 229.0 216.4 200.2 EJ/yr
total final energy transportation 66.4 91.8 109.2 136.5 163.1 185.4 204.1 207.3 EJ/yr
total final energy energy reduction 0.0 0.0 12.1 28.8 58.5 102.9 171.9 246.6 EJ/yr
total: w/o reduction 261.1 328.1 409.3 495.0 556.9 598.6 610.0 597.6 EJ/yr

Scenario: re stab Page 65
Primary Energy w/CCS
1990 2005 2020 2035 2050 2065 2080 2095 Units
oil w/o ccs 135.6 167.5 180.4 197.4 203.0 207.2 181.7 120.8 EJ/yr
oil w/ ccs 0.0 0.0 0.0 0.0 0.0 0.0 0.0 0.0 EJ/yr
natural gas w/o ccs 69.9 97.5 126.1 168.2 201.2 200.7 196.4 140.7 EJ/yr
natural gas w/ ccs 0.0 0.0 0.0 0.0 0.0 0.0 0.0 0.0 EJ/yr
coal w/o ccs 91.2 119.1 156.6 183.1 172.8 147.6 75.0 18.2 EJ/yr
coal w/ ccs 0.0 0.0 0.0 0.0 0.0 0.0 0.0 0.0 EJ/yr
biomass w/o ccs 14.4 21.6 37.9 56.9 89.5 144.4 196.4 227.1 EJ/yr
biomass w/ ccs 0.0 0.0 0.0 0.0 0.0 0.0 0.0 0.0 EJ/yr
nuclear 21.0 26.0 23.5 21.6 18.8 17.9 16.0 15.0 EJ/yr
hydro 23.6 29.2 29.2 30.6 30.6 32.5 32.9 34.6 EJ/yr
wind 0.0 0.9 15.5 35.8 49.8 70.3 96.6 140.1 EJ/yr
solar 0.0 0.1 2.6 10.6 21.9 42.9 94.1 218.8 EJ/yr
geothermal 0.4 0.6 1.8 11.1 25.0 32.8 38.4 44.2 EJ/yr
energy reduction 0.0 0.0 19.2 46.4 104.2 173.8 291.5 413.3 EJ/yr
total: w/o reduction 356 463 574 715 813 896 928 960 EJ/yr
Electricity Production by Fuel
1990 2005 2020 2035 2050 2065 2080 2095 Units
oil 4.86 4.33 4.03 3.45 3.51 4.77 5.88 5.75 EJ/yr
oil w/ccs 0.00 0.00 0.00 0.00 0.00 0.00 0.00 0.00 EJ/yr
gas 6.07 12.82 23.15 35.74 49.02 55.16 61.02 41.03 EJ/yr
gas w/ccs 0.00 0.00 0.00 0.00 0.00 0.00 0.00 0.00 EJ/yr
coal 16.06 26.35 34.81 43.69 47.80 49.65 29.31 6.70 EJ/yr
coal w/ccs 0.00 0.00 0.00 0.00 0.00 0.00 0.00 0.00 EJ/yr
biomass 0.43 0.71 1.29 2.73 6.00 10.41 16.56 16.94 EJ/yr
biomass w/ccs 0.00 0.00 0.00 0.00 0.00 0.00 0.00 0.00 EJ/yr
nuclear 7.36 9.97 9.95 9.95 9.95 9.95 9.95 9.95 EJ/yr
hydro 7.82 10.44 12.13 13.99 15.85 17.70 19.56 21.42 EJ/yr
wind w/backup 0.01 0.36 4.86 10.67 14.53 19.49 26.63 36.04 EJ/yr
wind w/storage 0.00 0.00 1.55 5.51 10.74 18.62 30.63 50.63 EJ/yr
CSP w/backup 0.00 0.00 0.54 0.99 1.11 1.90 4.31 11.72 EJ/yr
CSP w/storage 0.00 0.00 0.42 3.45 7.93 13.88 30.70 81.48 EJ/yr
PV w/backup 0.00 0.04 0.06 0.17 1.13 4.12 10.48 16.42 EJ/yr
PV w/storage 0.00 0.00 0.01 0.09 0.55 2.11 6.47 18.26 EJ/yr
rooftop PV w/backup 0.00 0.00 0.76 2.43 5.11 8.33 12.85 15.08 EJ/yr
geothermal 0.15 0.23 0.75 5.05 13.00 18.19 23.75 28.39 EJ/yr
energy reduction 0.00 0.00 4.35 11.95 32.47 51.35 90.42 148.72 EJ/yr
total: w/o reduction 42.8 65.2 94.3 137.9 186.2 234.3 288.1 359.8 EJ/yr

Scenario: re stab Page 66
Transportation Fuels Production by Fuel
1990 2005 2020 2035 2050 2065 2080 2095 Units
conventional oil 62.5 86.8 94.3 101.2 97.1 93.6 83.1 58.2 EJ/yr
unconventional oil 0.0 0.0 1.5 5.6 13.7 18.9 18.9 11.8 EJ/yr
coal liquids 0.0 0.0 0.9 2.2 2.8 1.8 0.0 0.0 EJ/yr
coal liquids w/ ccs 0.0 0.0 0.0 0.0 0.0 0.0 0.0 0.0 EJ/yr
bio fuels 0.2 0.9 1.8 3.4 7.2 16.8 34.1 53.8 EJ/yr
gas liquids 0.0 0.0 1.4 5.0 8.6 7.7 5.6 2.8 EJ/yr
gas 2.2 3.0 6.3 11.9 16.9 20.1 23.5 23.5 EJ/yr
coal 0.5 0.2 0.3 0.3 0.3 0.1 0.0 0.0 EJ/yr
electricity 1.0 1.0 2.1 4.8 10.9 16.5 23.6 36.0 EJ/yr
hydrogen 0.0 0.0 0.6 2.1 5.7 10.0 15.3 21.2 EJ/yr
energy reduction 0.0 0.0 1.5 3.9 8.6 16.3 31.1 52.0 EJ/yr
total: w/o reduction 66.4 91.8 109.2 136.5 163.1 185.4 204.1 207.3 EJ/yr
Industrial Liquids Production by Fuel
1990 2005 2020 2035 2050 2065 2080 2095 Units
conventional oil 36.59 43.88 45.09 49.66 50.14 50.43 41.11 26.81 EJ/yr
unconventional oil 0.00 0.00 0.36 1.67 4.84 6.78 5.55 0.52 EJ/yr
coal liquids 0.00 0.00 0.21 0.49 0.63 0.39 0.00 0.00 EJ/yr
coal liquids w/ ccs 0.00 0.00 0.00 0.00 0.00 0.00 0.00 0.00 EJ/yr
bio fuels 0.01 0.05 0.24 0.65 1.82 5.16 10.73 20.08 EJ/yr
gas liquids 0.00 0.00 0.36 1.52 2.64 2.22 1.40 0.56 EJ/yr
energy reduction 0.0 0.0 1.0 2.5 4.9 12.9 24.6 33.0 EJ/yr
total: w/o reduction 36.6 43.9 46.2 54.0 60.1 65.0 58.8 48.0 EJ/yr
Hydrogen Production by Fuel
1990 2005 2020 2035 2050 2065 2080 2095 Units
gas 0.00 0.00 2.48 4.03 7.32 10.94 14.69 15.27 EJ/yr
gas w/ccs 0.00 0.00 0.00 0.00 0.00 0.00 0.00 0.00 EJ/yr
coal 0.00 0.00 0.49 0.69 1.09 1.26 1.03 0.68 EJ/yr
coal w/ccs 0.00 0.00 0.00 0.00 0.00 0.00 0.00 0.00 EJ/yr
biomass 0.00 0.00 0.20 0.33 0.71 1.36 2.09 2.58 EJ/yr
biomass w/ccs 0.00 0.00 0.00 0.00 0.00 0.00 0.00 0.00 EJ/yr
nuclear 0.00 0.00 0.00 0.00 0.00 0.00 0.00 0.00 EJ/yr
bulk electricity 0.00 0.00 0.08 0.16 0.34 0.63 1.08 1.96 EJ/yr
wind 0.00 0.00 0.07 0.06 0.11 0.21 0.43 1.08 EJ/yr
solar 0.00 0.00 0.06 0.10 0.21 0.45 1.31 4.76 EJ/yr
energy reduction 0.00 0.00 -0.13 -0.13 -0.41 -0.60 -0.66 1.39 EJ/yr
total: w/o reduction 0.00 0.00 3.38 5.37 9.78 14.85 20.64 26.33 EJ/yr

Scenario: re stab Page 67
Dedicated Bioenergy Crops, Crop Residues, and Municipal Solid Waste Consumption by Sector
1990 2005 2020 2035 2050 2065 2080 2095 Units
direct buildings 4.5 5.5 8.4 9.6 9.8 9.3 6.7 3.3 EJ/yr
Industry 7.4 11.3 21.0 31.2 47.3 70.7 75.6 72.5 EJ/yr
electricity 2.1 2.5 3.7 7.0 14.1 23.7 36.7 36.5 EJ/yr
refined liquids: tran & bldg 0.5 2.2 4.4 8.3 16.8 37.9 73.1 109.6 EJ/yr
hydrogen 0.0 0.0 0.4 0.7 1.5 2.8 4.2 5.1 EJ/yr
synthetic gas 0.0 0.0 0.0 0.0 0.0 0.1 0.1 0.1 EJ/yr
energy reduction 0.0 0.0 -5.8 -13.1 -29.2 -60.8 -95.1 -97.0 EJ/yr
total: w/o reduction 14.4 21.6 37.9 56.9 89.5 144.4 196.4 227.1 EJ/yr
Biomass Production
1990 2005 2020 2035 2050 2065 2080 2095 Units
waste biomass 14.4 21.5 23.9 28.9 42.0 64.4 84.6 86.8 EJ
dedicated biomass crops 0.0 0.0 14.0 27.9 46.3 64.1 82.4 101.2 EJ
municipal solid waste 0.0 0.1 0.1 0.2 1.2 16.0 30.3 39.0 EJ
waste biomass 0.0 0.0 7.8 8.9 -0.3 -19.0 -37.5 -37.5 EJ
reduction in biomass crops 0.0 0.0 -14.0 -22.9 -29.5 -29.3 -33.7 -30.8 EJ
reduction in municipal solid wate0.0 0.0 0.4 0.9 0.6 -12.6 -24.8 -28.7 EJ
total: w/o reduction 14.4 21.6 31.7 43.0 59.7 96.2 126.1 158.8 EJ
Arable Land Use by Type
1990 2005 2020 2035 2050 2065 2080 2095 Units
urban land 0.05 0.05 0.05 0.05 0.05 0.05 0.05 0.05 billion Ha
crops 1.20 1.21 0.93 0.82 0.69 0.58 0.48 0.39 billion Ha
pasture 0.70 0.73 0.76 0.76 0.73 0.71 0.70 0.69 billion Ha
managed forest 0.69 0.74 0.83 0.92 1.00 1.03 1.03 1.00 billion Ha
bioenergy crops 0.00 0.00 0.05 0.11 0.20 0.29 0.37 0.45 billion Ha
unmanaged forest 3.32 3.25 3.94 3.91 3.89 3.88 3.89 3.93 billion Ha
unmanaged land 4.58 4.58 3.99 3.97 3.99 4.01 4.03 4.04 billion Ha
rock/ice/desert/tundra 2.62 2.62 2.62 2.62 2.62 2.62 2.62 2.62 billion Ha
total 10.50 10.50 10.50 10.50 10.50 10.50 10.50 10.50 billion Ha

Scenario: re stab Page 68
Population, GDP, and Energy Indicators
1990 2005 2020 2035 2050 2065 2080 2095 Units
Economic Activity reference GDP $26.1 $39.4 $58.3 $83.7 $118.5 $166.1 $230.0 $310.0 trillion 2005$
Final Energy Intensity building 3.41 2.86 2.40 1.91 1.47 1.11 0.82 0.61 GJ/1000$ (2005$)
Final Energy Intensity industry 4.06 3.14 2.75 2.37 1.86 1.38 0.94 0.65 GJ/1000$ (2005$)
Final Energy Intensity transportation 2.55 2.33 1.87 1.63 1.38 1.12 0.89 0.67 GJ/1000$ (2005$)
Final Energy Intensity total 10.01 8.33 7.03 5.91 4.70 3.60 2.65 1.93 GJ/1000$ (2005$)
Population population 5.2 6.4 7.5 8.3 8.8 9.1 9.0 8.7 billion
Final Energy per Capita building 16.9 17.5 18.6 19.2 19.7 20.3 21.0 21.7 GJ/capita
Final Energy per Capita industry 20.2 19.2 21.3 23.8 24.9 25.3 24.0 22.9 GJ/capita
Final Energy per Capita transportation 12.7 14.3 14.5 16.4 18.5 20.5 22.7 23.7 GJ/capita
Final Energy per Capita total 49.7 51.0 54.4 59.3 63.2 66.1 67.7 68.3 GJ/capita
Long-Term Equilibrium Energy Producer Prices
1990 2005 2020 2035 2050 2065 2080 2095 Units
global oil (w/o carbon charge) $27.6 $32.5 $39.7 $41.9 $44.8 $46.3 $47.1 $46.3 $/barrel (2005$)
global oil (w/ carbon charge) $27.6 $32.5 $41.9 $46.4 $54.5 $66.6 $89.6 $133.3 $/barrel (2005$)
domestic natural gas (w/o carbon charge) $3.3 $3.8 $4.4 $4.1 $4.4 $5.3 $5.4 $5.3 $/mmBTU (2005$)
domestic natural gas (w/ carbon charge) $3.3 $3.8 $4.6 $4.6 $5.6 $7.7 $10.3 $15.6 $/mmBTU (2005$)
domestic coal (w/o carbon charge) $1.7 $1.7 $1.7 $1.7 $1.7 $1.7 $1.6 $1.5 $/GJ (2005$)
domestic coal (w/ carbon charge) $1.7 $1.7 $2.2 $2.7 $3.8 $6.1 $10.6 $20.3 $/GJ (2005$)
domestic electricity (w/ carbon charge) 6.21 5.74 6.03 5.79 6.09 6.72 7.49 8.26 cents/kWh (2005$)
carbon price 0.0 0.0 17.8 36.9 76.8 159.7 332.0 690.2 $/tC (2005$)
Crop Prices
1990 2005 2020 2035 2050 2065 2080 2095 Units
global corn 33 33 36 38 41 47 56 68 $/Gcal (2005$)
global rice 32 32 36 37 41 46 54 64 $/Gcal (2005$)
global wheat 27 27 32 34 38 44 55 70 $/Gcal (2005$)
Emissions by Sectors
1990 2005 2020 2035 2050 2065 2080 2095 Units
buildings 0.858 0.860 1.031 1.102 1.065 0.930 0.703 0.416 GtC/yr
industry 1.623 1.706 2.039 2.261 2.110 1.617 0.922 0.191 GtC/yr
transportation 1.354 1.863 2.205 2.704 3.044 3.098 2.814 2.080 GtC/yr
electricity 1.909 2.848 3.487 4.193 4.362 4.477 3.240 1.502 GtC/yr
cement 0.261 0.483 0.813 1.057 1.022 0.770 0.573 0.421 GtC/yr
emissions reduction 0.000 0.000 0.693 1.947 4.522 8.045 13.361 19.689 GtC/yr
total: w/o reduction 6.005 7.759 9.573 11.317 11.602 10.891 8.254 4.610 GtC/yr

Scenario: re stab Page 69
Final Energy Consumption: Buildings Final Energy Consumption: Industry (Does not Include Feedstocks)
Final Energy Consumption: Transportation Final Energy Consumption by Sector
0
50
100
150
200
250
300
1990 2005 2020 2035 2050 2065 2080 2095
EJ
/yr
liquids gascoal biomasselectricity trad biomassenergy reduction
0
50
100
150
200
250
300
350
400
1990 2005 2020 2035 2050 2065 2080 2095
EJ
/yr
liquids gas
coal biomass
electricity hydrogen
energy reduction feedstocks
0
50
100
150
200
250
300
1990 2005 2020 2035 2050 2065 2080 2095
EJ
/yr
liquids gas
coal electricity
hydrogen energy reduction
0
100
200
300
400
500
600
700
800
900
1990 2005 2020 2035 2050 2065 2080 2095
EJ
/yr
buildings industry
transportation energy reduction

Scenario: re stab Page 70
Primary Energy Consumption Electricity Production by Fuel: CCS Focus
Hydrogen Production by Fuel Electricity Production by Fuel: Renewable Focus
-50
0
50
100
150
200
250
300
350
400
1990 2005 2020 2035 2050 2065 2080 2095
EJ
/yr
liquids liquids w/CCS
gas gas w/ccs
coal coal w/ccs
biomass biomass w/ccs
nuclear hydro
wind solar
geothermal energy reduction
-50
-40
-30
-20
-10
0
10
20
30
40
50
60
70
80
1990 2005 2020 2035 2050 2065 2080 2095
EJ
/yr
gas gas w/ccs
coal coal w/ccs
biomass biomass w/ccs
nuclear bulk electricity
wind solar
energy reduction
-50
0
50
100
150
200
250
300
350
400
1990 2005 2020 2035 2050 2065 2080 2095
EJ
/yr
liquids gascoal biomassnuclear hydrowind w/ backup wind w/ storagecsp w/ backup csp w/ storagepv w/ backup pv w/ storagerooftop solar w/ backup geothermalenergy reduction
0
200
400
600
800
1,000
1,200
1,400
1,600
1990 2005 2020 2035 2050 2065 2080 2095
EJ
/yr
oil w/o ccs oil w/ ccsnatural gas w/o ccs natural gas w/ ccscoal w/o ccs coal w/ ccsbiomass w/o ccs biomass w/ ccsnuclear hydrowind solargeothermal energy reduction

Scenario: re stab Page 71
Industrial Liquids Production by Fuel (Feedstocks and Fuel) Transportation Fuels Composition
Final Energy Intensity Final Energy per Capita
0
50
100
150
200
250
300
1990 2005 2020 2035 2050 2065 2080 2095
EJ
/yr
conventional oil unconventional oilcoal liquids coal liquids w/ ccs bio fuels gas liquidsgas coalelectricity hydrogenenergy reduction
0
10
20
30
40
50
60
70
80
90
1990 2005 2020 2035 2050 2065 2080 2095
EJ
/yr
conventional oil unconventional oilcoal liquids coal liquids w/ ccs bio fuels gas liquidsenergy reduction
0
2
4
6
8
10
12
1990 2005 2020 2035 2050 2065 2080 2095
GJ
/10
00
$ (
20
05
$)
0
50
100
150
200
250
300
350
Re
fere
nc
e G
DP
(T
rillio
n 2
00
5$
)
building
industry
transportation
total
reference GDP
0
10
20
30
40
50
60
70
80
1990 2005 2020 2035 2050 2065 2080 2095
GJ
/ca
pit
a
0
1
2
3
4
5
6
7
8
9
10
Po
pu
lati
on
(b
illio
n)
building
industry
transportation
total
population

Scenario: re stab Page 72
Dedicated Energy Crops, Waste Biomass, and Municipal Solid Waste Consumption by Sector Land Use by Type
Biomass Production by Source CO2 Emissions by Sector
-125
-100
-75
-50
-25
0
25
50
75
100
125
150
175
200
225
250
1990 2005 2020 2035 2050 2065 2080 2095
EJ
/yr
energy reductionsynthetic gashydrogenrefined liquids: tran & bldgelectricityIndustrydirect buildings
0
2
4
6
8
10
12
14
16
1990 2005 2020 2035 2050 2065 2080 2095
Billio
n H
ec
tare
s
urban land cropspasture managed forestbioenergy crops unmanaged forestunmanaged land rock/ice/desert/tundra
-125
-100
-75
-50
-25
0
25
50
75
100
125
150
175
200
225
250
1990 2005 2020 2035 2050 2065 2080 2095
EJ
/yr
reduction in municipal solid wate
reduction in biomass crops
waste biomass
municipal solid waste
dedicated biomass crops
waste biomass
-5
0
5
10
15
20
25
1990 2005 2020 2035 2050 2065 2080 2095
GtC
/yr
buildings industry
transportation electricity
cement emissions reduction

Scenario: ee stab Page 73
Final Energy Consumption
1990 2005 2020 2035 2050 2065 2080 2095 Units
building liquids 15.2 16.4 19.5 19.6 19.2 19.2 17.1 13.6 EJ/yr
building gas 18.7 26.7 27.5 24.8 22.6 19.4 15.8 11.3 EJ/yr
building coal 10.1 5.1 6.9 5.6 4.0 2.5 1.2 0.4 EJ/yr
building biomass 4.5 5.5 7.8 7.6 7.3 6.7 5.6 3.4 EJ/yr
building electricity 16.9 29.0 42.0 52.7 63.4 71.4 77.6 78.8 EJ/yr
building trad biomass 23.5 29.9 31.4 25.1 19.7 14.3 9.5 6.1 EJ/yr
building energy reduction 0.0 0.0 7.8 31.4 51.1 75.8 108.0 142.3 EJ/yr
total: w/o reduction 88.9 112.7 135.0 135.3 136.2 133.4 126.7 113.7 EJ/yr
industry liquids 22.4 21.2 18.6 21.3 24.4 30.1 28.1 24.6 EJ/yr
industry gas 26.6 30.5 31.7 35.8 33.6 29.0 23.5 16.9 EJ/yr
industry coal 31.4 35.8 49.5 55.4 53.0 38.5 19.5 7.8 EJ/yr
industry biomass 7.3 11.2 18.1 24.5 35.1 52.4 66.3 58.6 EJ/yr
industry electricity 18.1 24.8 33.4 45.9 59.6 69.0 77.0 86.5 EJ/yr
industry hydrogen 0.0 0.0 2.5 2.7 3.3 4.1 4.8 5.5 EJ/yr
industry energy reduction 0.0 0.0 14.1 31.1 47.4 67.5 92.8 129.0 EJ/yr
industry feedstocks 15.2 23.7 26.5 30.8 33.7 35.9 35.1 32.2 EJ/yr
total: w/o reduction 105.8 123.6 153.8 185.6 208.9 223.1 219.3 199.9 EJ/yr
transportation liquids 62.7 87.6 92.2 86.2 82.7 77.9 72.3 65.7 EJ/yr
transportation gas 2.3 3.0 6.0 8.3 9.9 10.4 10.5 9.4 EJ/yr
transportation coal 0.5 0.2 0.3 0.3 0.2 0.1 0.0 0.0 EJ/yr
transportation electricity 1.0 1.0 2.9 7.9 12.4 15.7 18.2 19.5 EJ/yr
transportation hydrogen 0.0 0.0 1.0 6.5 12.8 19.7 26.3 31.1 EJ/yr
transportation energy reduction 0.0 0.0 8.3 31.2 53.7 77.8 107.8 133.5 EJ/yr
total: w/o reduction 66.5 91.9 102.3 109.2 118.0 123.9 127.4 125.8 EJ/yr
total final energy buildings 88.9 112.7 135.0 135.3 136.2 133.4 126.7 113.7 EJ/yr
total final energy industry 105.8 123.6 153.8 185.6 208.9 223.1 219.3 199.9 EJ/yr
total final energy transportation 66.5 91.9 102.3 109.2 118.0 123.9 127.4 125.8 EJ/yr
total final energy energy reduction 0.0 0.0 30.2 93.6 152.3 221.1 308.5 404.9 EJ/yr
total: w/o reduction 261.2 328.2 391.2 430.1 463.2 480.4 473.4 439.4 EJ/yr

Scenario: ee stab Page 74
Primary Energy w/CCS
1990 2005 2020 2035 2050 2065 2080 2095 Units
oil w/o ccs 135.6 167.5 170.0 162.5 155.9 157.4 137.6 98.8 EJ/yr
oil w/ ccs 0.0 0.0 0.0 0.0 0.0 0.0 0.0 0.0 EJ/yr
natural gas w/o ccs 70.0 97.6 123.3 157.3 181.9 184.8 177.9 161.2 EJ/yr
natural gas w/ ccs 0.0 0.0 0.0 0.0 0.0 0.0 0.0 0.0 EJ/yr
coal w/o ccs 91.2 119.1 158.1 184.9 191.7 175.9 141.5 59.8 EJ/yr
coal w/ ccs 0.0 0.0 0.0 0.0 0.0 0.0 0.0 0.0 EJ/yr
biomass w/o ccs 14.4 21.6 33.7 44.5 65.5 97.6 144.4 195.9 EJ/yr
biomass w/ ccs 0.0 0.0 0.0 0.0 0.0 0.0 0.0 0.0 EJ/yr
nuclear 21.0 26.1 23.4 21.8 18.9 18.1 17.3 15.4 EJ/yr
hydro 23.6 29.2 29.2 30.8 30.8 32.7 34.6 35.1 EJ/yr
wind 0.0 0.9 14.3 29.0 36.3 44.8 54.9 77.9 EJ/yr
solar 0.0 0.1 1.2 3.2 5.7 9.5 16.4 39.7 EJ/yr
geothermal 0.4 0.5 1.3 4.8 7.6 7.7 7.4 6.9 EJ/yr
energy reduction 0.0 0.0 38.3 123.0 222.6 341.9 487.0 682.0 EJ/yr
total: w/o reduction 356 463 554 639 694 728 732 691 EJ/yr
Electricity Production by Fuel
1990 2005 2020 2035 2050 2065 2080 2095 Units
oil 4.86 4.33 4.08 3.30 3.46 4.41 4.80 6.05 EJ/yr
oil w/ccs 0.00 0.00 0.00 0.00 0.00 0.00 0.00 0.00 EJ/yr
gas 6.07 12.82 23.58 35.64 48.23 53.90 56.83 58.11 EJ/yr
gas w/ccs 0.00 0.00 0.00 0.00 0.00 0.00 0.00 0.00 EJ/yr
coal 16.06 26.35 35.42 44.49 52.30 55.18 52.41 23.78 EJ/yr
coal w/ccs 0.00 0.00 0.00 0.00 0.00 0.00 0.00 0.00 EJ/yr
biomass 0.43 0.71 1.26 2.44 5.27 8.25 12.27 17.94 EJ/yr
biomass w/ccs 0.00 0.00 0.00 0.00 0.00 0.00 0.00 0.00 EJ/yr
nuclear 7.36 9.97 9.95 9.95 9.95 9.95 9.95 9.95 EJ/yr
hydro 7.82 10.44 12.13 13.99 15.85 17.70 19.56 21.42 EJ/yr
wind w/backup 0.01 0.36 4.73 9.60 12.45 15.49 18.57 25.58 EJ/yr
wind w/storage 0.00 0.00 1.20 3.37 5.67 8.28 11.67 20.69 EJ/yr
CSP w/backup 0.00 0.00 0.31 0.52 0.56 0.86 1.44 3.72 EJ/yr
CSP w/storage 0.00 0.00 0.11 0.76 1.78 2.83 4.66 11.95 EJ/yr
PV w/backup 0.00 0.04 0.05 0.04 0.19 0.56 1.25 3.15 EJ/yr
PV w/storage 0.00 0.00 0.00 0.03 0.10 0.26 0.56 1.45 EJ/yr
rooftop PV w/backup 0.00 0.00 0.28 0.70 1.47 2.97 4.28 5.98 EJ/yr
geothermal 0.13 0.21 0.56 2.25 4.03 4.30 4.33 4.40 EJ/yr
energy reduction 0.00 0.00 4.01 15.36 37.24 64.98 106.75 161.66 EJ/yr
total: w/o reduction 42.7 65.2 93.7 127.1 161.3 184.9 202.6 214.2 EJ/yr

Scenario: ee stab Page 75
Transportation Fuels Production by Fuel
1990 2005 2020 2035 2050 2065 2080 2095 Units
conventional oil 62.5 86.7 87.3 76.5 64.5 56.5 47.3 34.0 EJ/yr
unconventional oil 0.0 0.0 1.3 3.2 7.7 10.1 9.6 6.2 EJ/yr
coal liquids 0.0 0.0 1.0 1.7 2.6 1.9 1.0 0.0 EJ/yr
coal liquids w/ ccs 0.0 0.0 0.0 0.0 0.0 0.0 0.0 0.0 EJ/yr
bio fuels 0.2 0.9 1.4 1.7 2.8 4.9 11.2 23.8 EJ/yr
gas liquids 0.0 0.0 1.2 3.1 5.1 4.5 3.2 1.7 EJ/yr
gas 2.3 3.0 6.0 8.3 9.9 10.4 10.5 9.4 EJ/yr
coal 0.5 0.2 0.3 0.3 0.2 0.1 0.0 0.0 EJ/yr
electricity 1.0 1.0 2.9 7.9 12.4 15.7 18.2 19.5 EJ/yr
hydrogen 0.0 0.0 1.0 6.5 12.8 19.7 26.3 31.1 EJ/yr
energy reduction 0.0 0.0 8.3 31.2 53.7 77.8 107.8 133.5 EJ/yr
total: w/o reduction 66.5 91.9 102.3 109.2 118.0 123.9 127.4 125.8 EJ/yr
Industrial Liquids Production by Fuel
1990 2005 2020 2035 2050 2065 2080 2095 Units
conventional oil 36.59 43.88 43.04 47.46 48.85 53.96 48.18 35.16 EJ/yr
unconventional oil 0.00 0.00 0.34 1.30 4.12 6.14 5.70 0.78 EJ/yr
coal liquids 0.00 0.00 0.24 0.58 0.96 0.72 0.03 0.00 EJ/yr
coal liquids w/ ccs 0.00 0.00 0.00 0.00 0.00 0.00 0.00 0.00 EJ/yr
bio fuels 0.01 0.05 0.17 0.38 0.94 2.21 7.14 19.57 EJ/yr
gas liquids 0.00 0.00 0.34 1.39 2.38 2.17 1.48 0.71 EJ/yr
energy reduction 0.0 0.0 3.1 5.4 7.8 12.7 20.9 24.7 EJ/yr
total: w/o reduction 36.6 43.9 44.1 51.1 57.2 65.2 62.5 56.2 EJ/yr
Hydrogen Production by Fuel
1990 2005 2020 2035 2050 2065 2080 2095 Units
gas 0.00 0.00 2.60 6.91 11.99 17.82 22.64 24.94 EJ/yr
gas w/ccs 0.00 0.00 0.00 0.00 0.00 0.00 0.00 0.00 EJ/yr
coal 0.00 0.00 0.53 1.22 2.05 2.56 2.24 1.45 EJ/yr
coal w/ccs 0.00 0.00 0.00 0.00 0.00 0.00 0.00 0.00 EJ/yr
biomass 0.00 0.00 0.19 0.50 1.00 1.82 3.17 4.19 EJ/yr
biomass w/ccs 0.00 0.00 0.00 0.00 0.00 0.00 0.00 0.00 EJ/yr
nuclear 0.00 0.00 0.00 0.00 0.00 0.00 0.00 0.00 EJ/yr
bulk electricity 0.00 0.00 0.09 0.26 0.52 0.87 1.24 1.65 EJ/yr
wind 0.00 0.00 0.07 0.11 0.18 0.31 0.62 1.20 EJ/yr
solar 0.00 0.00 0.06 0.15 0.28 0.51 1.19 3.21 EJ/yr
energy reduction 0.00 0.00 -0.29 -3.90 -6.67 -9.64 -11.12 -8.93 EJ/yr
total: w/o reduction 0.00 0.00 3.54 9.14 16.04 23.89 31.10 36.65 EJ/yr

Scenario: ee stab Page 76
Dedicated Bioenergy Crops, Crop Residues, and Municipal Solid Waste Consumption by Sector
1990 2005 2020 2035 2050 2065 2080 2095 Units
direct buildings 4.5 5.5 7.8 7.6 7.3 6.7 5.6 3.4 EJ/yr
Industry 7.4 11.3 18.5 25.3 37.0 56.6 79.4 93.5 EJ/yr
electricity 2.1 2.5 3.6 6.3 12.4 18.8 27.3 39.2 EJ/yr
refined liquids: tran & bldg 0.5 2.2 3.4 4.2 6.8 11.7 25.6 51.4 EJ/yr
hydrogen 0.0 0.0 0.4 1.1 2.1 3.7 6.3 8.2 EJ/yr
synthetic gas 0.0 0.0 0.0 0.0 0.0 0.1 0.1 0.1 EJ/yr
energy reduction 0.0 0.0 -1.6 -0.6 -5.3 -14.0 -43.1 -65.9 EJ/yr
total: w/o reduction 14.4 21.6 33.7 44.5 65.5 97.6 144.4 195.9 EJ/yr
Biomass Production
1990 2005 2020 2035 2050 2065 2080 2095 Units
waste biomass 14.4 21.5 25.7 28.3 35.3 49.0 63.8 81.9 EJ
dedicated biomass crops 0.0 0.0 7.8 16.0 29.7 44.4 58.2 74.9 EJ
municipal solid waste 0.0 0.1 0.1 0.2 0.5 4.1 22.5 39.1 EJ
waste biomass 0.0 0.0 5.9 9.6 6.4 -3.6 -16.7 -32.5 EJ
reduction in biomass crops 0.0 0.0 -7.8 -11.1 -13.0 -9.6 -9.5 -4.6 EJ
reduction in municipal solid wate0.0 0.0 0.3 0.9 1.3 -0.7 -17.0 -28.8 EJ
total: w/o reduction 14.4 21.6 31.8 43.0 59.0 84.3 118.3 158.8 EJ
Arable Land Use by Type
1990 2005 2020 2035 2050 2065 2080 2095 Units
urban land 0.05 0.05 0.05 0.05 0.05 0.05 0.05 0.05 billion Ha
crops 1.20 1.21 1.09 1.04 0.90 0.77 0.64 0.53 billion Ha
pasture 0.70 0.73 0.77 0.78 0.75 0.72 0.71 0.69 billion Ha
managed forest 0.69 0.74 0.82 0.91 0.99 1.03 1.05 1.04 billion Ha
bioenergy crops 0.00 0.00 0.03 0.06 0.13 0.20 0.26 0.34 billion Ha
unmanaged forest 3.32 3.25 3.86 3.83 3.82 3.83 3.85 3.88 billion Ha
unmanaged land 4.58 4.58 3.93 3.89 3.91 3.95 3.99 4.02 billion Ha
rock/ice/desert/tundra 2.62 2.62 2.62 2.62 2.62 2.62 2.62 2.62 billion Ha
total 10.50 10.50 10.50 10.50 10.50 10.50 10.50 10.50 billion Ha

Scenario: ee stab Page 77
Population, GDP, and Energy Indicators
1990 2005 2020 2035 2050 2065 2080 2095 Units
Economic Activity reference GDP $26.1 $39.4 $58.4 $84.0 $118.9 $166.7 $231.0 $311.1 trillion 2005$
Final Energy Intensity building 3.41 2.86 2.31 1.61 1.15 0.80 0.55 0.37 GJ/1000$ (2005$)
Final Energy Intensity industry 4.06 3.14 2.63 2.21 1.76 1.34 0.95 0.64 GJ/1000$ (2005$)
Final Energy Intensity transportation 2.55 2.33 1.75 1.30 0.99 0.74 0.55 0.40 GJ/1000$ (2005$)
Final Energy Intensity total 10.02 8.33 6.70 5.12 3.90 2.88 2.05 1.41 GJ/1000$ (2005$)
Population population 5.2 6.4 7.5 8.3 8.8 9.1 9.0 8.7 billion
Final Energy per Capita building 16.9 17.5 17.9 16.2 15.5 14.7 14.1 13.0 GJ/capita
Final Energy per Capita industry 20.2 19.2 20.4 22.3 23.7 24.6 24.3 22.8 GJ/capita
Final Energy per Capita transportation 12.7 14.3 13.6 13.1 13.4 13.7 14.1 14.4 GJ/capita
Final Energy per Capita total 49.8 51.0 52.0 51.6 52.5 53.0 52.6 50.2 GJ/capita
Long-Term Equilibrium Energy Producer Prices
1990 2005 2020 2035 2050 2065 2080 2095 Units
global oil (w/o carbon charge) $27.6 $32.5 $39.6 $40.4 $43.1 $43.7 $44.2 $43.1 $/barrel (2005$)
global oil (w/ carbon charge) $27.6 $32.5 $40.9 $43.1 $48.7 $55.7 $69.1 $93.9 $/barrel (2005$)
domestic natural gas (w/o carbon charge) $3.3 $3.8 $4.3 $4.0 $4.3 $5.0 $5.2 $5.2 $/mmBTU (2005$)
domestic natural gas (w/ carbon charge) $3.3 $3.8 $4.5 $4.3 $5.0 $6.4 $8.1 $11.3 $/mmBTU (2005$)
domestic coal (w/o carbon charge) $1.7 $1.7 $1.7 $1.7 $1.7 $1.7 $1.6 $1.6 $/GJ (2005$)
domestic coal (w/ carbon charge) $1.7 $1.7 $2.0 $2.3 $2.9 $4.3 $7.0 $12.7 $/GJ (2005$)
domestic electricity (w/ carbon charge) 6.21 5.75 5.89 5.69 5.97 6.63 7.33 8.94 cents/kWh (2005$)
carbon price 0.0 0.0 10.6 21.9 45.4 94.6 196.6 408.7 $/tC (2005$)
Crop Prices
1990 2005 2020 2035 2050 2065 2080 2095 Units
global corn 33 33 36 38 41 47 55 67 $/Gcal (2005$)
global rice 32 32 35 37 41 48 56 68 $/Gcal (2005$)
global wheat 27 27 31 34 38 45 55 72 $/Gcal (2005$)
Emissions by Sectors
1990 2005 2020 2035 2050 2065 2080 2095 Units
buildings 0.858 0.860 0.991 0.923 0.845 0.736 0.565 0.352 GtC/yr
industry 1.623 1.706 1.978 2.208 2.202 1.980 1.366 0.641 GtC/yr
transportation 1.355 1.863 2.059 2.104 2.182 2.113 1.882 1.420 GtC/yr
electricity 1.909 2.849 3.542 4.257 4.624 4.770 4.538 2.804 GtC/yr
cement 0.261 0.483 0.816 1.058 1.114 0.911 0.651 0.488 GtC/yr
emissions reduction 0.000 0.000 0.879 2.714 5.158 8.427 12.614 18.594 GtC/yr
total: w/o reduction 6.007 7.761 9.386 10.550 10.967 10.510 9.001 5.704 GtC/yr

Scenario: ee stab Page 78
Final Energy Consumption: Buildings Final Energy Consumption: Industry (Does not Include Feedstocks)
Final Energy Consumption: Transportation Final Energy Consumption by Sector
0
50
100
150
200
250
300
1990 2005 2020 2035 2050 2065 2080 2095
EJ
/yr
liquids gascoal biomasselectricity trad biomassenergy reduction
0
50
100
150
200
250
300
350
400
1990 2005 2020 2035 2050 2065 2080 2095
EJ
/yr
liquids gas
coal biomass
electricity hydrogen
energy reduction feedstocks
0
50
100
150
200
250
300
1990 2005 2020 2035 2050 2065 2080 2095
EJ
/yr
liquids gas
coal electricity
hydrogen energy reduction
0
100
200
300
400
500
600
700
800
900
1990 2005 2020 2035 2050 2065 2080 2095
EJ
/yr
buildings industry
transportation energy reduction

Scenario: ee stab Page 79
Primary Energy Consumption Electricity Production by Fuel: CCS Focus
Hydrogen Production by Fuel Electricity Production by Fuel: Renewable Focus
-50
0
50
100
150
200
250
300
350
400
1990 2005 2020 2035 2050 2065 2080 2095
EJ
/yr
liquids liquids w/CCS
gas gas w/ccs
coal coal w/ccs
biomass biomass w/ccs
nuclear hydro
wind solar
geothermal energy reduction
-50
-40
-30
-20
-10
0
10
20
30
40
50
60
70
80
1990 2005 2020 2035 2050 2065 2080 2095
EJ
/yr
gas gas w/ccs
coal coal w/ccs
biomass biomass w/ccs
nuclear bulk electricity
wind solar
energy reduction
-50
0
50
100
150
200
250
300
350
400
1990 2005 2020 2035 2050 2065 2080 2095
EJ
/yr
liquids gascoal biomassnuclear hydrowind w/ backup wind w/ storagecsp w/ backup csp w/ storagepv w/ backup pv w/ storagerooftop solar w/ backup geothermalenergy reduction
0
200
400
600
800
1,000
1,200
1,400
1,600
1990 2005 2020 2035 2050 2065 2080 2095
EJ
/yr
oil w/o ccs oil w/ ccsnatural gas w/o ccs natural gas w/ ccscoal w/o ccs coal w/ ccsbiomass w/o ccs biomass w/ ccsnuclear hydrowind solargeothermal energy reduction

Scenario: ee stab Page 80
Industrial Liquids Production by Fuel (Feedstocks and Fuel) Transportation Fuels Composition
Final Energy Intensity Final Energy per Capita
0
50
100
150
200
250
300
1990 2005 2020 2035 2050 2065 2080 2095
EJ
/yr
conventional oil unconventional oilcoal liquids coal liquids w/ ccs bio fuels gas liquidsgas coalelectricity hydrogenenergy reduction
0
10
20
30
40
50
60
70
80
90
1990 2005 2020 2035 2050 2065 2080 2095
EJ
/yr
conventional oil unconventional oilcoal liquids coal liquids w/ ccs bio fuels gas liquidsenergy reduction
0
2
4
6
8
10
12
1990 2005 2020 2035 2050 2065 2080 2095
GJ
/10
00
$ (
20
05
$)
0
50
100
150
200
250
300
350
Re
fere
nc
e G
DP
(T
rillio
n 2
00
5$
)
building
industry
transportation
total
reference GDP
0
10
20
30
40
50
60
1990 2005 2020 2035 2050 2065 2080 2095
GJ
/ca
pit
a
0
1
2
3
4
5
6
7
8
9
10
Po
pu
lati
on
(b
illio
n)
building
industry
transportation
total
population

Scenario: ee stab Page 81
Dedicated Energy Crops, Waste Biomass, and Municipal Solid Waste Consumption by Sector Land Use by Type
Biomass Production by Source CO2 Emissions by Sector
-125
-100
-75
-50
-25
0
25
50
75
100
125
150
175
200
225
250
1990 2005 2020 2035 2050 2065 2080 2095
EJ
/yr
energy reductionsynthetic gashydrogenrefined liquids: tran & bldgelectricityIndustrydirect buildings
0
2
4
6
8
10
12
14
16
1990 2005 2020 2035 2050 2065 2080 2095
Billio
n H
ec
tare
s
urban land cropspasture managed forestbioenergy crops unmanaged forestunmanaged land rock/ice/desert/tundra
-125
-100
-75
-50
-25
0
25
50
75
100
125
150
175
200
225
250
1990 2005 2020 2035 2050 2065 2080 2095
EJ
/yr
reduction in municipal solid wate
reduction in biomass crops
waste biomass
municipal solid waste
dedicated biomass crops
waste biomass
-5
0
5
10
15
20
25
1990 2005 2020 2035 2050 2065 2080 2095
GtC
/yr
buildings industry
transportation electricity
cement emissions reduction

Scenario: eere stab Page 82
Final Energy Consumption
1990 2005 2020 2035 2050 2065 2080 2095 Units
building liquids 15.2 16.4 19.8 19.9 19.6 19.5 17.6 14.7 EJ/yr
building gas 18.7 26.7 27.9 25.2 23.1 20.0 16.5 12.2 EJ/yr
building coal 10.1 5.1 7.2 5.9 4.5 2.9 1.5 0.6 EJ/yr
building biomass 4.5 5.5 7.8 7.7 7.5 7.0 5.9 4.3 EJ/yr
building electricity 16.9 29.0 41.8 52.9 64.3 74.0 82.0 85.9 EJ/yr
building trad biomass 23.5 29.9 31.5 25.1 19.6 13.8 8.9 5.5 EJ/yr
building energy reduction 0.0 0.0 6.9 29.9 48.8 71.9 102.2 132.8 EJ/yr
total: w/o reduction 88.9 112.7 136.0 136.7 138.6 137.3 132.5 123.1 EJ/yr
industry liquids 22.4 21.2 18.6 20.9 23.7 28.8 27.6 24.3 EJ/yr
industry gas 26.6 30.5 32.1 36.1 34.0 30.0 24.4 16.9 EJ/yr
industry coal 31.4 35.8 50.9 58.0 58.7 45.9 25.3 9.9 EJ/yr
industry biomass 7.3 11.2 17.7 23.8 34.1 49.6 62.7 63.7 EJ/yr
industry electricity 18.1 24.8 33.3 47.1 61.7 74.9 87.3 102.5 EJ/yr
industry hydrogen 0.0 0.0 2.5 2.6 3.1 3.9 4.3 4.6 EJ/yr
industry energy reduction 0.0 0.0 12.7 28.2 41.0 57.5 80.4 107.1 EJ/yr
industry feedstocks 15.2 23.7 26.7 31.2 34.6 37.4 37.1 35.6 EJ/yr
total: w/o reduction 105.8 123.6 155.2 188.5 215.3 233.0 231.6 221.8 EJ/yr
transportation liquids 62.7 87.6 92.5 86.6 83.3 78.8 74.0 69.1 EJ/yr
transportation gas 2.3 3.0 6.0 8.4 10.1 10.7 10.8 9.6 EJ/yr
transportation coal 0.5 0.2 0.3 0.3 0.3 0.1 0.0 0.0 EJ/yr
transportation electricity 1.0 1.0 2.8 8.1 12.8 16.6 19.8 22.3 EJ/yr
transportation hydrogen 0.0 0.0 1.0 6.5 12.8 19.8 26.0 30.3 EJ/yr
transportation energy reduction 0.0 0.0 8.0 30.6 52.5 75.8 104.6 128.2 EJ/yr
total: w/o reduction 66.5 91.9 102.7 109.8 119.2 126.0 130.7 131.2 EJ/yr
total final energy buildings 88.9 112.7 136.0 136.7 138.6 137.3 132.5 123.1 EJ/yr
total final energy industry 105.8 123.6 155.2 188.5 215.3 233.0 231.6 221.8 EJ/yr
total final energy transportation 66.5 91.9 102.7 109.8 119.2 126.0 130.7 131.2 EJ/yr
total final energy energy reduction 0.0 0.0 27.6 88.7 142.2 205.2 287.1 368.1 EJ/yr
total: w/o reduction 261.1 328.2 393.8 435.0 473.2 496.3 494.8 476.1 EJ/yr

Scenario: eere stab Page 83
Primary Energy w/CCS
1990 2005 2020 2035 2050 2065 2080 2095 Units
oil w/o ccs 135.6 167.5 170.4 162.3 154.5 155.7 141.6 99.5 EJ/yr
oil w/ ccs 0.0 0.0 0.0 0.0 0.0 0.0 0.0 0.0 EJ/yr
natural gas w/o ccs 70.0 97.6 122.9 155.1 176.4 179.7 172.5 151.3 EJ/yr
natural gas w/ ccs 0.0 0.0 0.0 0.0 0.0 0.0 0.0 0.0 EJ/yr
coal w/o ccs 91.2 119.1 158.5 184.0 188.3 176.5 145.7 68.1 EJ/yr
coal w/ ccs 0.0 0.0 0.0 0.0 0.0 0.0 0.0 0.0 EJ/yr
biomass w/o ccs 14.4 21.6 33.0 43.0 62.3 91.1 128.1 200.6 EJ/yr
biomass w/ ccs 0.0 0.0 0.0 0.0 0.0 0.0 0.0 0.0 EJ/yr
nuclear 21.0 26.0 23.5 21.9 19.0 18.2 17.4 15.5 EJ/yr
hydro 23.6 29.2 29.3 30.9 30.9 32.8 34.8 35.5 EJ/yr
wind 0.0 0.9 14.3 30.4 39.2 50.5 62.2 80.5 EJ/yr
solar 0.0 0.1 2.3 8.3 14.9 24.0 38.0 71.4 EJ/yr
geothermal 0.4 0.6 1.7 9.3 20.9 25.5 27.8 33.4 EJ/yr
energy reduction 0.0 0.0 36.8 116.6 210.4 316.3 450.9 616.9 EJ/yr
total: w/o reduction 356 463 556 645 706 754 768 756 EJ/yr
Electricity Production by Fuel
1990 2005 2020 2035 2050 2065 2080 2095 Units
oil 4.86 4.33 3.96 3.09 2.92 3.79 4.10 4.71 EJ/yr
oil w/ccs 0.00 0.00 0.00 0.00 0.00 0.00 0.00 0.00 EJ/yr
gas 6.07 12.82 22.86 33.86 43.86 48.62 51.10 50.83 EJ/yr
gas w/ccs 0.00 0.00 0.00 0.00 0.00 0.00 0.00 0.00 EJ/yr
coal 16.05 26.35 34.75 42.49 46.91 50.45 49.83 26.12 EJ/yr
coal w/ccs 0.00 0.00 0.00 0.00 0.00 0.00 0.00 0.00 EJ/yr
biomass 0.43 0.71 1.19 2.20 4.33 6.81 9.83 14.29 EJ/yr
biomass w/ccs 0.00 0.00 0.00 0.00 0.00 0.00 0.00 0.00 EJ/yr
nuclear 7.36 9.97 9.95 9.95 9.95 9.95 9.95 9.95 EJ/yr
hydro 7.82 10.44 12.13 13.99 15.85 17.70 19.56 21.42 EJ/yr
wind w/backup 0.01 0.36 4.53 9.18 11.66 14.54 17.14 21.89 EJ/yr
wind w/storage 0.00 0.00 1.38 4.40 7.97 12.47 17.47 26.22 EJ/yr
CSP w/backup 0.00 0.00 0.49 0.82 0.75 1.04 1.59 3.36 EJ/yr
CSP w/storage 0.00 0.00 0.38 2.58 5.32 7.56 11.34 23.31 EJ/yr
PV w/backup 0.00 0.04 0.06 0.14 0.74 2.38 4.49 7.36 EJ/yr
PV w/storage 0.00 0.00 0.01 0.07 0.36 1.11 2.29 5.08 EJ/yr
rooftop PV w/backup 0.00 0.00 0.71 1.90 3.63 5.57 7.24 8.77 EJ/yr
geothermal 0.15 0.23 0.71 4.20 10.71 13.83 15.85 21.03 EJ/yr
energy reduction 0.00 0.00 5.41 18.69 46.78 73.63 113.68 170.11 EJ/yr
total: w/o reduction 42.8 65.2 93.1 128.9 165.0 195.8 221.8 244.4 EJ/yr

Scenario: eere stab Page 84
Transportation Fuels Production by Fuel
1990 2005 2020 2035 2050 2065 2080 2095 Units
conventional oil 62.5 86.7 87.5 76.5 63.9 55.2 47.8 34.1 EJ/yr
unconventional oil 0.0 0.0 1.3 3.4 8.2 11.2 11.6 8.1 EJ/yr
coal liquids 0.0 0.0 1.1 2.0 3.2 2.6 1.5 0.0 EJ/yr
coal liquids w/ ccs 0.0 0.0 0.0 0.0 0.0 0.0 0.0 0.0 EJ/yr
bio fuels 0.2 0.9 1.3 1.6 2.7 4.7 9.4 24.8 EJ/yr
gas liquids 0.0 0.0 1.3 3.1 5.3 4.9 3.7 2.0 EJ/yr
gas 2.3 3.0 6.0 8.4 10.1 10.7 10.8 9.6 EJ/yr
coal 0.5 0.2 0.3 0.3 0.3 0.1 0.0 0.0 EJ/yr
electricity 1.0 1.0 2.8 8.1 12.8 16.6 19.8 22.3 EJ/yr
hydrogen 0.0 0.0 1.0 6.5 12.8 19.8 26.0 30.3 EJ/yr
energy reduction 0.0 0.0 8.0 30.6 52.5 75.8 104.6 128.2 EJ/yr
total: w/o reduction 66.5 91.9 102.7 109.8 119.2 126.0 130.7 131.2 EJ/yr
Industrial Liquids Production by Fuel
1990 2005 2020 2035 2050 2065 2080 2095 Units
conventional oil 36.59 43.88 43.17 47.29 48.29 52.74 48.60 35.41 EJ/yr
unconventional oil 0.00 0.00 0.35 1.39 4.46 7.08 7.64 1.42 EJ/yr
coal liquids 0.00 0.00 0.26 0.69 1.31 1.12 0.62 0.00 EJ/yr
coal liquids w/ ccs 0.00 0.00 0.00 0.00 0.00 0.00 0.00 0.00 EJ/yr
bio fuels 0.01 0.05 0.16 0.35 0.92 2.11 5.45 21.58 EJ/yr
gas liquids 0.00 0.00 0.35 1.42 2.49 2.40 1.73 0.88 EJ/yr
energy reduction 0.0 0.0 3.0 5.4 7.5 12.4 19.4 21.7 EJ/yr
total: w/o reduction 36.6 43.9 44.3 51.1 57.5 65.4 64.0 59.3 EJ/yr
Hydrogen Production by Fuel
1990 2005 2020 2035 2050 2065 2080 2095 Units
gas 0.00 0.00 2.62 6.85 11.85 17.47 21.91 23.56 EJ/yr
gas w/ccs 0.00 0.00 0.00 0.00 0.00 0.00 0.00 0.00 EJ/yr
coal 0.00 0.00 0.55 1.25 2.18 2.83 2.74 1.85 EJ/yr
coal w/ccs 0.00 0.00 0.00 0.00 0.00 0.00 0.00 0.00 EJ/yr
biomass 0.00 0.00 0.19 0.48 0.97 1.72 2.95 4.58 EJ/yr
biomass w/ccs 0.00 0.00 0.00 0.00 0.00 0.00 0.00 0.00 EJ/yr
nuclear 0.00 0.00 0.00 0.00 0.00 0.00 0.00 0.00 EJ/yr
bulk electricity 0.00 0.00 0.08 0.26 0.53 0.89 1.32 1.85 EJ/yr
wind 0.00 0.00 0.07 0.10 0.16 0.25 0.46 0.84 EJ/yr
solar 0.00 0.00 0.06 0.14 0.26 0.43 0.94 2.18 EJ/yr
energy reduction 0.00 0.00 -0.33 -3.86 -6.59 -9.35 -10.34 -7.14 EJ/yr
total: w/o reduction 0.00 0.00 3.58 9.09 15.95 23.60 30.32 34.86 EJ/yr
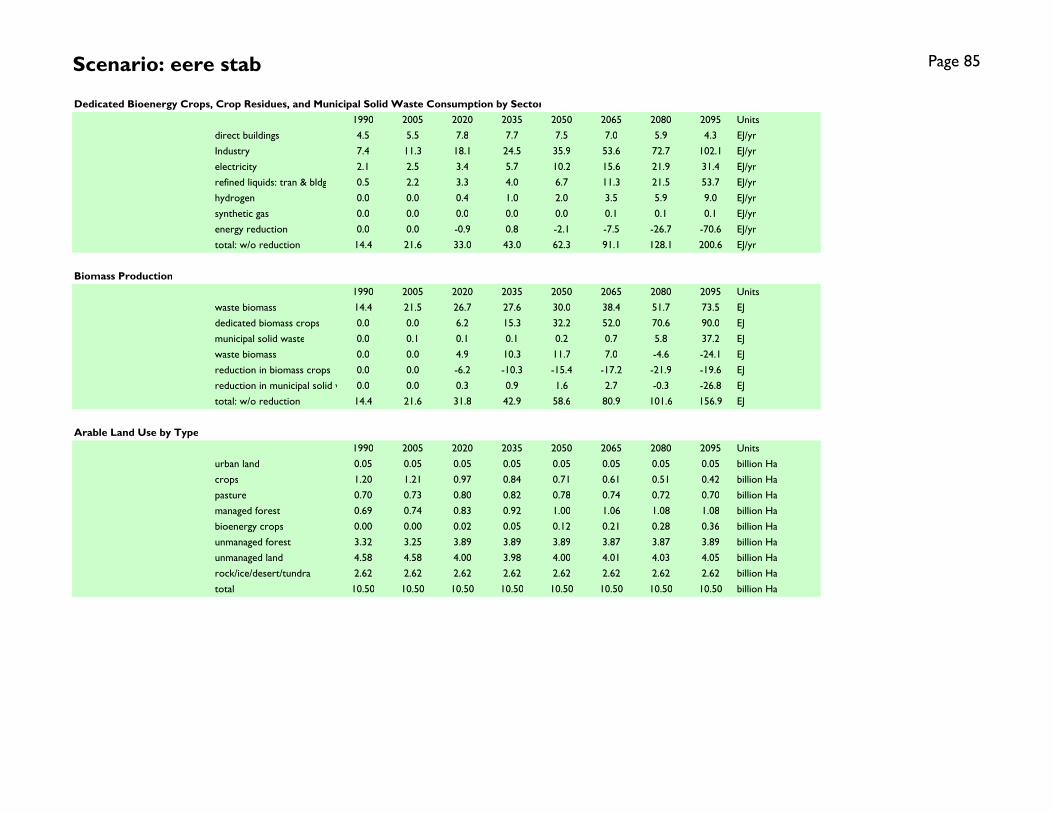
Scenario: eere stab Page 85
Dedicated Bioenergy Crops, Crop Residues, and Municipal Solid Waste Consumption by Sector
1990 2005 2020 2035 2050 2065 2080 2095 Units
direct buildings 4.5 5.5 7.8 7.7 7.5 7.0 5.9 4.3 EJ/yr
Industry 7.4 11.3 18.1 24.5 35.9 53.6 72.7 102.1 EJ/yr
electricity 2.1 2.5 3.4 5.7 10.2 15.6 21.9 31.4 EJ/yr
refined liquids: tran & bldg 0.5 2.2 3.3 4.0 6.7 11.3 21.5 53.7 EJ/yr
hydrogen 0.0 0.0 0.4 1.0 2.0 3.5 5.9 9.0 EJ/yr
synthetic gas 0.0 0.0 0.0 0.0 0.0 0.1 0.1 0.1 EJ/yr
energy reduction 0.0 0.0 -0.9 0.8 -2.1 -7.5 -26.7 -70.6 EJ/yr
total: w/o reduction 14.4 21.6 33.0 43.0 62.3 91.1 128.1 200.6 EJ/yr
Biomass Production
1990 2005 2020 2035 2050 2065 2080 2095 Units
waste biomass 14.4 21.5 26.7 27.6 30.0 38.4 51.7 73.5 EJ
dedicated biomass crops 0.0 0.0 6.2 15.3 32.2 52.0 70.6 90.0 EJ
municipal solid waste 0.0 0.1 0.1 0.1 0.2 0.7 5.8 37.2 EJ
waste biomass 0.0 0.0 4.9 10.3 11.7 7.0 -4.6 -24.1 EJ
reduction in biomass crops 0.0 0.0 -6.2 -10.3 -15.4 -17.2 -21.9 -19.6 EJ
reduction in municipal solid wate0.0 0.0 0.3 0.9 1.6 2.7 -0.3 -26.8 EJ
total: w/o reduction 14.4 21.6 31.8 42.9 58.6 80.9 101.6 156.9 EJ
Arable Land Use by Type
1990 2005 2020 2035 2050 2065 2080 2095 Units
urban land 0.05 0.05 0.05 0.05 0.05 0.05 0.05 0.05 billion Ha
crops 1.20 1.21 0.97 0.84 0.71 0.61 0.51 0.42 billion Ha
pasture 0.70 0.73 0.80 0.82 0.78 0.74 0.72 0.70 billion Ha
managed forest 0.69 0.74 0.83 0.92 1.00 1.06 1.08 1.08 billion Ha
bioenergy crops 0.00 0.00 0.02 0.05 0.12 0.21 0.28 0.36 billion Ha
unmanaged forest 3.32 3.25 3.89 3.89 3.89 3.87 3.87 3.89 billion Ha
unmanaged land 4.58 4.58 4.00 3.98 4.00 4.01 4.03 4.05 billion Ha
rock/ice/desert/tundra 2.62 2.62 2.62 2.62 2.62 2.62 2.62 2.62 billion Ha
total 10.50 10.50 10.50 10.50 10.50 10.50 10.50 10.50 billion Ha

Scenario: eere stab Page 86
Population, GDP, and Energy Indicators
1990 2005 2020 2035 2050 2065 2080 2095 Units
Economic Activity reference GDP $26.1 $39.4 $58.6 $84.5 $120.0 $168.8 $234.6 $317.2 trillion 2005$
Final Energy Intensity building 3.41 2.86 2.32 1.62 1.15 0.81 0.56 0.39 GJ/1000$ (2005$)
Final Energy Intensity industry 4.06 3.14 2.65 2.23 1.79 1.38 0.99 0.70 GJ/1000$ (2005$)
Final Energy Intensity transportation 2.55 2.33 1.75 1.30 0.99 0.75 0.56 0.41 GJ/1000$ (2005$)
Final Energy Intensity total 10.02 8.33 6.73 5.15 3.94 2.94 2.11 1.50 GJ/1000$ (2005$)
Population population 5.2 6.4 7.5 8.3 8.8 9.1 9.0 8.7 billion
Final Energy per Capita building 16.9 17.5 18.1 16.4 15.7 15.2 14.7 14.1 GJ/capita
Final Energy per Capita industry 20.2 19.2 20.6 22.6 24.4 25.7 25.7 25.3 GJ/capita
Final Energy per Capita transportation 12.7 14.3 13.6 13.2 13.5 13.9 14.5 15.0 GJ/capita
Final Energy per Capita total 49.8 51.0 52.3 52.2 53.7 54.8 54.9 54.4 GJ/capita
Long-Term Equilibrium Energy Producer Prices
1990 2005 2020 2035 2050 2065 2080 2095 Units
global oil (w/o carbon charge) $27.6 $32.4 $39.6 $40.4 $43.0 $43.7 $44.1 $43.1 $/barrel (2005$)
global oil (w/ carbon charge) $27.6 $32.4 $40.5 $42.4 $47.2 $52.4 $62.4 $80.4 $/barrel (2005$)
domestic natural gas (w/o carbon charge) $3.3 $3.8 $4.3 $4.0 $4.3 $4.8 $5.0 $5.1 $/mmBTU (2005$)
domestic natural gas (w/ carbon charge) $3.3 $3.8 $4.4 $4.2 $4.8 $5.8 $7.2 $9.5 $/mmBTU (2005$)
domestic coal (w/o carbon charge) $1.7 $1.7 $1.7 $1.7 $1.7 $1.7 $1.6 $1.6 $/GJ (2005$)
domestic coal (w/ carbon charge) $1.7 $1.7 $2.0 $2.2 $2.6 $3.6 $5.5 $9.6 $/GJ (2005$)
domestic electricity (w/ carbon charge) 6.21 5.74 5.85 5.47 5.54 5.85 6.09 6.85 cents/kWh (2005$)
carbon price 0.0 0.0 7.6 15.8 32.9 68.4 142.3 295.7 $/tC (2005$)
Crop Prices
1990 2005 2020 2035 2050 2065 2080 2095 Units
global corn 33 33 34 35 36 39 42 48 $/Gcal (2005$)
global rice 32 32 33 33 34 36 38 40 $/Gcal (2005$)
global wheat 27 27 28 29 30 32 36 41 $/Gcal (2005$)
Emissions by Sectors
1990 2005 2020 2035 2050 2065 2080 2095 Units
buildings 0.858 0.860 1.012 0.947 0.880 0.774 0.612 0.385 GtC/yr
industry 1.623 1.706 2.018 2.260 2.324 2.122 1.546 0.643 GtC/yr
transportation 1.355 1.863 2.071 2.126 2.230 2.181 1.997 1.479 GtC/yr
electricity 1.909 2.848 3.473 4.072 4.164 4.340 4.237 2.743 GtC/yr
cement 0.261 0.483 0.828 1.092 1.180 1.014 0.728 0.535 GtC/yr
emissions reduction 0.000 0.000 0.864 2.766 5.346 8.505 12.495 18.513 GtC/yr
total: w/o reduction 6.006 7.760 9.402 10.497 10.779 10.431 9.119 5.786 GtC/yr
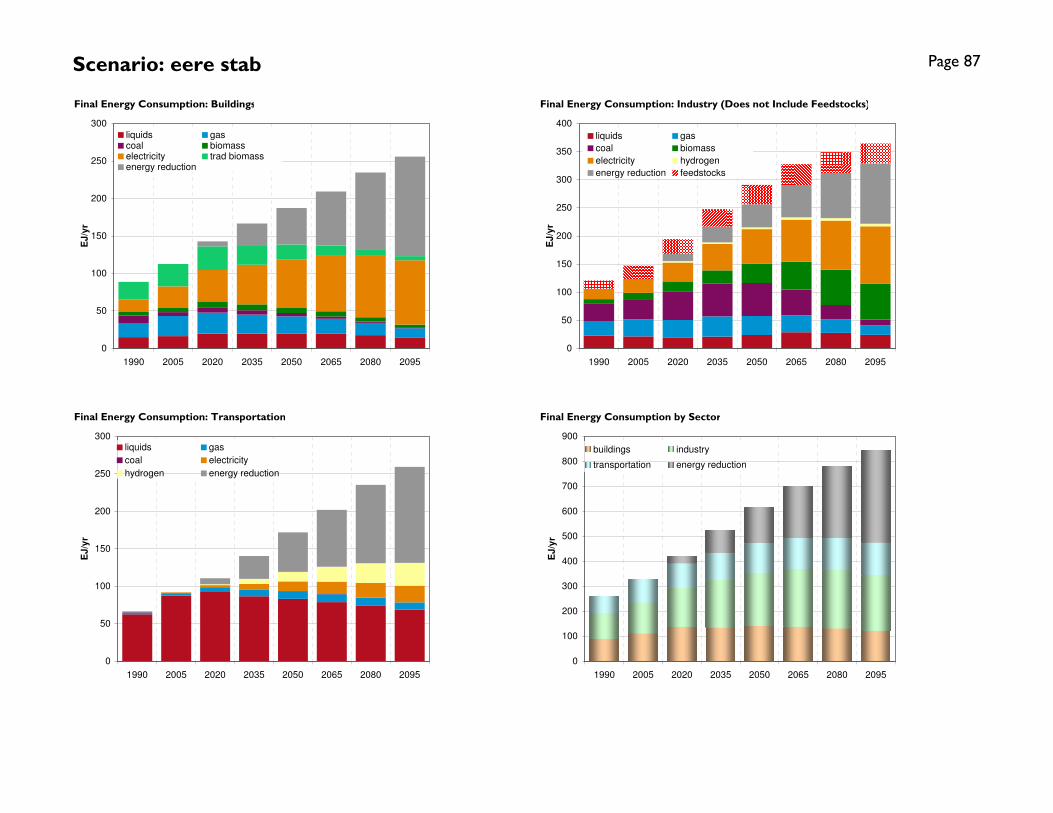
Scenario: eere stab Page 87
Final Energy Consumption: Buildings Final Energy Consumption: Industry (Does not Include Feedstocks)
Final Energy Consumption: Transportation Final Energy Consumption by Sector
0
50
100
150
200
250
300
1990 2005 2020 2035 2050 2065 2080 2095
EJ
/yr
liquids gascoal biomasselectricity trad biomassenergy reduction
0
50
100
150
200
250
300
350
400
1990 2005 2020 2035 2050 2065 2080 2095
EJ
/yr
liquids gas
coal biomass
electricity hydrogen
energy reduction feedstocks
0
50
100
150
200
250
300
1990 2005 2020 2035 2050 2065 2080 2095
EJ
/yr
liquids gas
coal electricity
hydrogen energy reduction
0
100
200
300
400
500
600
700
800
900
1990 2005 2020 2035 2050 2065 2080 2095
EJ
/yr
buildings industry
transportation energy reduction

Scenario: eere stab Page 88
Primary Energy Consumption Electricity Production by Fuel: CCS Focus
Hydrogen Production by Fuel Electricity Production by Fuel: Renewable Focus
-50
0
50
100
150
200
250
300
350
400
1990 2005 2020 2035 2050 2065 2080 2095
EJ
/yr
liquids liquids w/CCS
gas gas w/ccs
coal coal w/ccs
biomass biomass w/ccs
nuclear hydro
wind solar
geothermal energy reduction
-50
-40
-30
-20
-10
0
10
20
30
40
50
60
70
80
1990 2005 2020 2035 2050 2065 2080 2095
EJ
/yr
gas gas w/ccs
coal coal w/ccs
biomass biomass w/ccs
nuclear bulk electricity
wind solar
energy reduction
-50
0
50
100
150
200
250
300
350
400
1990 2005 2020 2035 2050 2065 2080 2095
EJ
/yr
liquids gascoal biomassnuclear hydrowind w/ backup wind w/ storagecsp w/ backup csp w/ storagepv w/ backup pv w/ storagerooftop solar w/ backup geothermalenergy reduction
0
200
400
600
800
1,000
1,200
1,400
1,600
1990 2005 2020 2035 2050 2065 2080 2095
EJ
/yr
oil w/o ccs oil w/ ccsnatural gas w/o ccs natural gas w/ ccscoal w/o ccs coal w/ ccsbiomass w/o ccs biomass w/ ccsnuclear hydrowind solargeothermal energy reduction
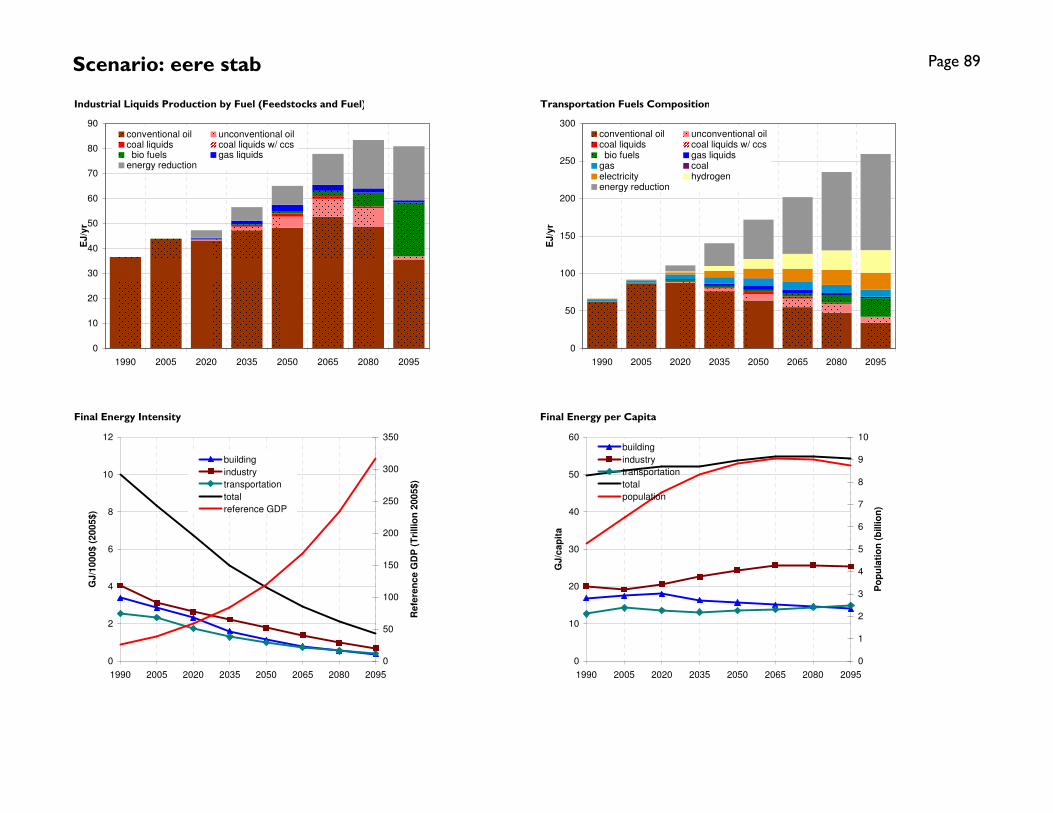
Scenario: eere stab Page 89
Industrial Liquids Production by Fuel (Feedstocks and Fuel) Transportation Fuels Composition
Final Energy Intensity Final Energy per Capita
0
50
100
150
200
250
300
1990 2005 2020 2035 2050 2065 2080 2095
EJ
/yr
conventional oil unconventional oilcoal liquids coal liquids w/ ccs bio fuels gas liquidsgas coalelectricity hydrogenenergy reduction
0
10
20
30
40
50
60
70
80
90
1990 2005 2020 2035 2050 2065 2080 2095
EJ
/yr
conventional oil unconventional oilcoal liquids coal liquids w/ ccs bio fuels gas liquidsenergy reduction
0
2
4
6
8
10
12
1990 2005 2020 2035 2050 2065 2080 2095
GJ
/10
00
$ (
20
05
$)
0
50
100
150
200
250
300
350
Re
fere
nc
e G
DP
(T
rillio
n 2
00
5$
)
building
industry
transportation
total
reference GDP
0
10
20
30
40
50
60
1990 2005 2020 2035 2050 2065 2080 2095
GJ
/ca
pit
a
0
1
2
3
4
5
6
7
8
9
10
Po
pu
lati
on
(b
illio
n)
building
industry
transportation
total
population

Scenario: eere stab Page 90
Dedicated Energy Crops, Waste Biomass, and Municipal Solid Waste Consumption by Sector Land Use by Type
Biomass Production by Source CO2 Emissions by Sector
-125
-100
-75
-50
-25
0
25
50
75
100
125
150
175
200
225
250
1990 2005 2020 2035 2050 2065 2080 2095
EJ
/yr
energy reductionsynthetic gashydrogenrefined liquids: tran & bldgelectricityIndustrydirect buildings
0
2
4
6
8
10
12
14
16
1990 2005 2020 2035 2050 2065 2080 2095
Billio
n H
ec
tare
s
urban land cropspasture managed forestbioenergy crops unmanaged forestunmanaged land rock/ice/desert/tundra
-125
-100
-75
-50
-25
0
25
50
75
100
125
150
175
200
225
250
1990 2005 2020 2035 2050 2065 2080 2095
EJ
/yr
reduction in municipal solid wate
reduction in biomass crops
waste biomass
municipal solid waste
dedicated biomass crops
waste biomass
-5
0
5
10
15
20
25
1990 2005 2020 2035 2050 2065 2080 2095
GtC
/yr
buildings industry
transportation electricity
cement emissions reduction

Scenario: supply stab Page 91
Final Energy Consumption
1990 2005 2020 2035 2050 2065 2080 2095 Units
building liquids 15.2 16.4 20.7 24.3 26.1 28.1 27.2 23.5 EJ/yr
building gas 18.7 26.7 29.3 31.1 31.2 28.4 25.8 20.6 EJ/yr
building coal 10.1 5.1 7.5 7.4 6.1 4.3 2.4 1.0 EJ/yr
building biomass 4.5 5.5 8.2 9.5 10.0 10.0 9.1 6.3 EJ/yr
building electricity 16.9 29.0 43.4 63.0 83.9 107.2 134.4 162.6 EJ/yr
building trad biomass 23.5 29.9 32.2 28.3 23.7 18.8 13.3 8.9 EJ/yr
building energy reduction 0.0 0.0 1.5 3.1 6.4 12.3 22.4 33.0 EJ/yr
total: w/o reduction 88.9 112.7 141.3 163.5 180.9 196.9 212.2 223.0 EJ/yr
industry liquids 22.4 21.2 20.2 23.7 26.9 32.5 29.7 22.4 EJ/yr
industry gas 26.6 30.5 33.8 38.4 37.1 30.1 25.5 17.7 EJ/yr
industry coal 31.4 35.8 54.8 66.2 66.4 50.3 25.1 8.8 EJ/yr
industry biomass 7.3 11.2 18.7 26.6 37.7 54.0 65.9 57.9 EJ/yr
industry electricity 18.1 24.8 34.4 48.3 64.7 83.1 103.5 134.4 EJ/yr
industry hydrogen 0.0 0.0 2.5 4.2 4.9 5.6 6.4 8.3 EJ/yr
industry energy reduction 0.0 0.0 3.5 9.2 18.5 35.1 56.0 79.6 EJ/yr
industry feedstocks 15.2 23.7 27.5 32.6 36.7 39.5 40.0 39.9 EJ/yr
total: w/o reduction 105.8 123.6 164.5 207.4 237.8 255.5 256.1 249.4 EJ/yr
transportation liquids 62.7 87.7 99.7 106.0 108.6 109.6 106.7 95.8 EJ/yr
transportation gas 2.2 3.0 6.5 10.6 14.0 14.9 16.1 14.4 EJ/yr
transportation coal 0.5 0.2 0.3 0.4 0.4 0.2 0.1 0.0 EJ/yr
transportation electricity 1.0 1.0 2.1 4.2 8.6 11.6 14.7 18.0 EJ/yr
transportation hydrogen 0.0 0.0 1.1 11.3 23.2 35.6 49.8 64.9 EJ/yr
transportation energy reduction 0.0 0.0 1.0 8.0 17.0 29.8 48.0 66.2 EJ/yr
total: w/o reduction 66.4 91.8 109.6 132.5 154.7 172.0 187.3 193.1 EJ/yr
total final energy buildings 88.9 112.7 141.3 163.5 180.9 196.9 212.2 223.0 EJ/yr
total final energy industry 105.8 123.6 164.5 207.4 237.8 255.5 256.1 249.4 EJ/yr
total final energy transportation 66.4 91.8 109.6 132.5 154.7 172.0 187.3 193.1 EJ/yr
total final energy energy reduction 0.0 0.0 6.1 20.3 42.0 77.1 126.3 178.8 EJ/yr
total: w/o reduction 261.1 328.1 415.4 503.4 573.4 624.4 655.6 665.4 EJ/yr
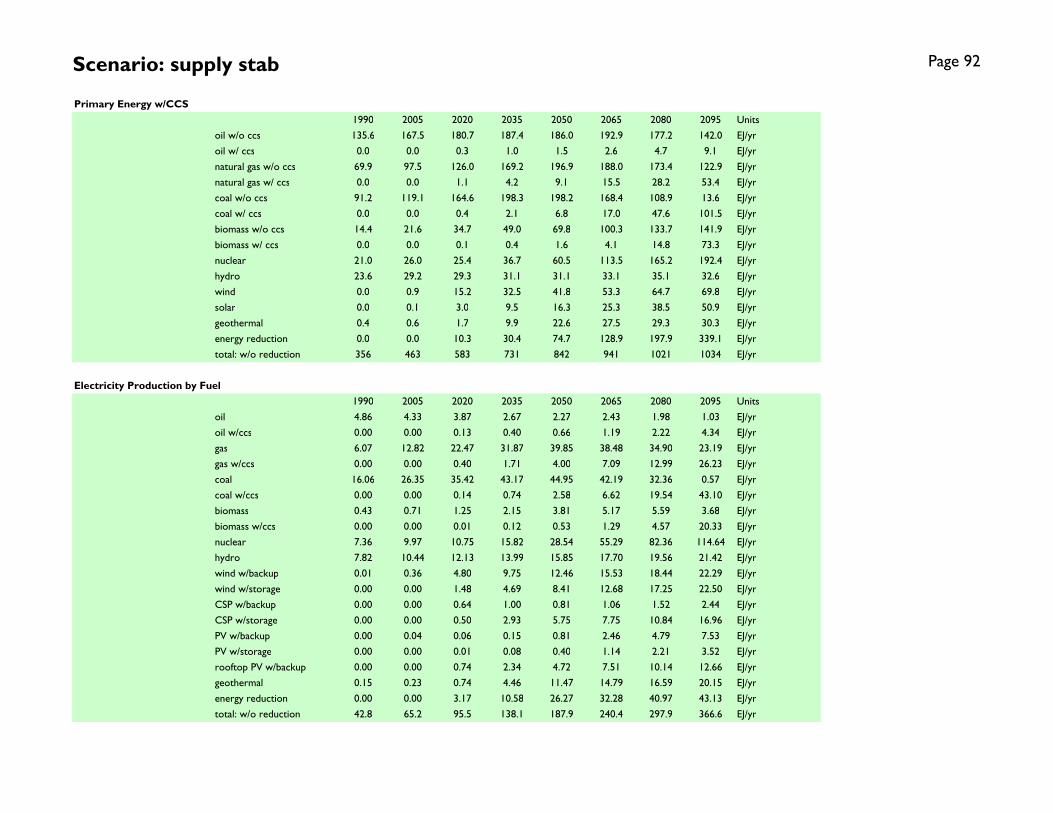
Scenario: supply stab Page 92
Primary Energy w/CCS
1990 2005 2020 2035 2050 2065 2080 2095 Units
oil w/o ccs 135.6 167.5 180.7 187.4 186.0 192.9 177.2 142.0 EJ/yr
oil w/ ccs 0.0 0.0 0.3 1.0 1.5 2.6 4.7 9.1 EJ/yr
natural gas w/o ccs 69.9 97.5 126.0 169.2 196.9 188.0 173.4 122.9 EJ/yr
natural gas w/ ccs 0.0 0.0 1.1 4.2 9.1 15.5 28.2 53.4 EJ/yr
coal w/o ccs 91.2 119.1 164.6 198.3 198.2 168.4 108.9 13.6 EJ/yr
coal w/ ccs 0.0 0.0 0.4 2.1 6.8 17.0 47.6 101.5 EJ/yr
biomass w/o ccs 14.4 21.6 34.7 49.0 69.8 100.3 133.7 141.9 EJ/yr
biomass w/ ccs 0.0 0.0 0.1 0.4 1.6 4.1 14.8 73.3 EJ/yr
nuclear 21.0 26.0 25.4 36.7 60.5 113.5 165.2 192.4 EJ/yr
hydro 23.6 29.2 29.3 31.1 31.1 33.1 35.1 32.6 EJ/yr
wind 0.0 0.9 15.2 32.5 41.8 53.3 64.7 69.8 EJ/yr
solar 0.0 0.1 3.0 9.5 16.3 25.3 38.5 50.9 EJ/yr
geothermal 0.4 0.6 1.7 9.9 22.6 27.5 29.3 30.3 EJ/yr
energy reduction 0.0 0.0 10.3 30.4 74.7 128.9 197.9 339.1 EJ/yr
total: w/o reduction 356 463 583 731 842 941 1021 1034 EJ/yr
Electricity Production by Fuel
1990 2005 2020 2035 2050 2065 2080 2095 Units
oil 4.86 4.33 3.87 2.67 2.27 2.43 1.98 1.03 EJ/yr
oil w/ccs 0.00 0.00 0.13 0.40 0.66 1.19 2.22 4.34 EJ/yr
gas 6.07 12.82 22.47 31.87 39.85 38.48 34.90 23.19 EJ/yr
gas w/ccs 0.00 0.00 0.40 1.71 4.00 7.09 12.99 26.23 EJ/yr
coal 16.06 26.35 35.42 43.17 44.95 42.19 32.36 0.57 EJ/yr
coal w/ccs 0.00 0.00 0.14 0.74 2.58 6.62 19.54 43.10 EJ/yr
biomass 0.43 0.71 1.25 2.15 3.81 5.17 5.59 3.68 EJ/yr
biomass w/ccs 0.00 0.00 0.01 0.12 0.53 1.29 4.57 20.33 EJ/yr
nuclear 7.36 9.97 10.75 15.82 28.54 55.29 82.36 114.64 EJ/yr
hydro 7.82 10.44 12.13 13.99 15.85 17.70 19.56 21.42 EJ/yr
wind w/backup 0.01 0.36 4.80 9.75 12.46 15.53 18.44 22.29 EJ/yr
wind w/storage 0.00 0.00 1.48 4.69 8.41 12.68 17.25 22.50 EJ/yr
CSP w/backup 0.00 0.00 0.64 1.00 0.81 1.06 1.52 2.44 EJ/yr
CSP w/storage 0.00 0.00 0.50 2.93 5.75 7.75 10.84 16.96 EJ/yr
PV w/backup 0.00 0.04 0.06 0.15 0.81 2.46 4.79 7.53 EJ/yr
PV w/storage 0.00 0.00 0.01 0.08 0.40 1.14 2.21 3.52 EJ/yr
rooftop PV w/backup 0.00 0.00 0.74 2.34 4.72 7.51 10.14 12.66 EJ/yr
geothermal 0.15 0.23 0.74 4.46 11.47 14.79 16.59 20.15 EJ/yr
energy reduction 0.00 0.00 3.17 10.58 26.27 32.28 40.97 43.13 EJ/yr
total: w/o reduction 42.8 65.2 95.5 138.1 187.9 240.4 297.9 366.6 EJ/yr
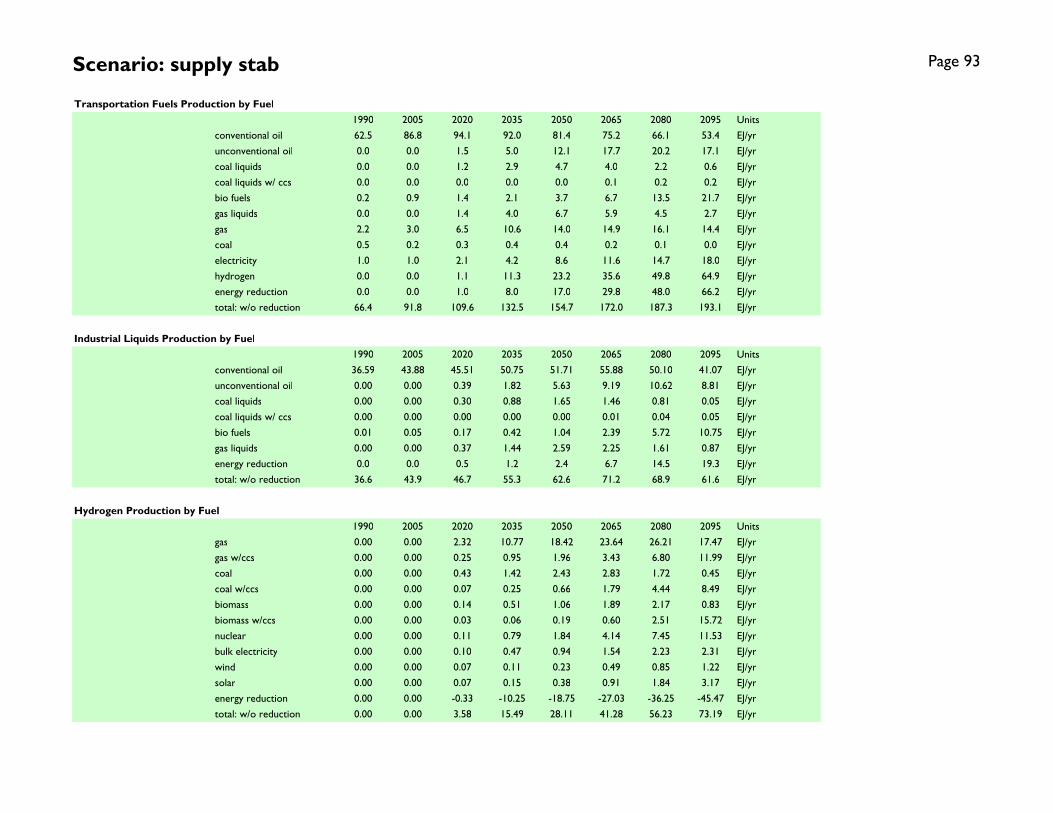
Scenario: supply stab Page 93
Transportation Fuels Production by Fuel
1990 2005 2020 2035 2050 2065 2080 2095 Units
conventional oil 62.5 86.8 94.1 92.0 81.4 75.2 66.1 53.4 EJ/yr
unconventional oil 0.0 0.0 1.5 5.0 12.1 17.7 20.2 17.1 EJ/yr
coal liquids 0.0 0.0 1.2 2.9 4.7 4.0 2.2 0.6 EJ/yr
coal liquids w/ ccs 0.0 0.0 0.0 0.0 0.0 0.1 0.2 0.2 EJ/yr
bio fuels 0.2 0.9 1.4 2.1 3.7 6.7 13.5 21.7 EJ/yr
gas liquids 0.0 0.0 1.4 4.0 6.7 5.9 4.5 2.7 EJ/yr
gas 2.2 3.0 6.5 10.6 14.0 14.9 16.1 14.4 EJ/yr
coal 0.5 0.2 0.3 0.4 0.4 0.2 0.1 0.0 EJ/yr
electricity 1.0 1.0 2.1 4.2 8.6 11.6 14.7 18.0 EJ/yr
hydrogen 0.0 0.0 1.1 11.3 23.2 35.6 49.8 64.9 EJ/yr
energy reduction 0.0 0.0 1.0 8.0 17.0 29.8 48.0 66.2 EJ/yr
total: w/o reduction 66.4 91.8 109.6 132.5 154.7 172.0 187.3 193.1 EJ/yr
Industrial Liquids Production by Fuel
1990 2005 2020 2035 2050 2065 2080 2095 Units
conventional oil 36.59 43.88 45.51 50.75 51.71 55.88 50.10 41.07 EJ/yr
unconventional oil 0.00 0.00 0.39 1.82 5.63 9.19 10.62 8.81 EJ/yr
coal liquids 0.00 0.00 0.30 0.88 1.65 1.46 0.81 0.05 EJ/yr
coal liquids w/ ccs 0.00 0.00 0.00 0.00 0.00 0.01 0.04 0.05 EJ/yr
bio fuels 0.01 0.05 0.17 0.42 1.04 2.39 5.72 10.75 EJ/yr
gas liquids 0.00 0.00 0.37 1.44 2.59 2.25 1.61 0.87 EJ/yr
energy reduction 0.0 0.0 0.5 1.2 2.4 6.7 14.5 19.3 EJ/yr
total: w/o reduction 36.6 43.9 46.7 55.3 62.6 71.2 68.9 61.6 EJ/yr
Hydrogen Production by Fuel
1990 2005 2020 2035 2050 2065 2080 2095 Units
gas 0.00 0.00 2.32 10.77 18.42 23.64 26.21 17.47 EJ/yr
gas w/ccs 0.00 0.00 0.25 0.95 1.96 3.43 6.80 11.99 EJ/yr
coal 0.00 0.00 0.43 1.42 2.43 2.83 1.72 0.45 EJ/yr
coal w/ccs 0.00 0.00 0.07 0.25 0.66 1.79 4.44 8.49 EJ/yr
biomass 0.00 0.00 0.14 0.51 1.06 1.89 2.17 0.83 EJ/yr
biomass w/ccs 0.00 0.00 0.03 0.06 0.19 0.60 2.51 15.72 EJ/yr
nuclear 0.00 0.00 0.11 0.79 1.84 4.14 7.45 11.53 EJ/yr
bulk electricity 0.00 0.00 0.10 0.47 0.94 1.54 2.23 2.31 EJ/yr
wind 0.00 0.00 0.07 0.11 0.23 0.49 0.85 1.22 EJ/yr
solar 0.00 0.00 0.07 0.15 0.38 0.91 1.84 3.17 EJ/yr
energy reduction 0.00 0.00 -0.33 -10.25 -18.75 -27.03 -36.25 -45.47 EJ/yr
total: w/o reduction 0.00 0.00 3.58 15.49 28.11 41.28 56.23 73.19 EJ/yr

Scenario: supply stab Page 94
Dedicated Bioenergy Crops, Crop Residues, and Municipal Solid Waste Consumption by Sector
1990 2005 2020 2035 2050 2065 2080 2095 Units
direct buildings 4.5 5.5 8.2 9.5 10.0 10.0 9.1 6.3 EJ/yr
Industry 7.4 11.3 19.1 27.5 39.7 58.5 76.5 77.1 EJ/yr
electricity 2.1 2.5 3.6 5.9 10.2 14.7 22.3 50.6 EJ/yr
refined liquids: tran & bldg 0.5 2.2 3.6 5.3 9.0 16.1 31.3 48.6 EJ/yr
hydrogen 0.0 0.0 0.4 1.2 2.5 4.9 9.2 32.4 EJ/yr
synthetic gas 0.0 0.0 0.0 0.0 0.0 0.1 0.1 0.1 EJ/yr
energy reduction 0.0 0.0 -2.7 -5.5 -11.1 -20.7 -47.2 -85.1 EJ/yr
total: w/o reduction 14.4 21.6 34.8 49.4 71.4 104.3 148.5 215.2 EJ/yr
Biomass Production
1990 2005 2020 2035 2050 2065 2080 2095 Units
waste biomass 14.4 21.5 27.4 30.6 35.2 46.7 60.5 82.2 EJ
dedicated biomass crops 0.0 0.0 7.2 18.6 35.8 55.2 72.9 93.5 EJ
municipal solid waste 0.0 0.1 0.1 0.2 0.4 2.4 15.1 39.4 EJ
waste biomass 0.0 0.0 4.2 7.3 6.6 -1.3 -13.5 -32.9 EJ
reduction in biomass crops 0.0 0.0 -7.2 -13.7 -19.0 -20.4 -24.1 -23.2 EJ
reduction in municipal solid wate0.0 0.0 0.3 0.8 1.4 1.0 -9.6 -29.1 EJ
total: w/o reduction 14.4 21.6 31.8 43.0 58.9 82.6 110.9 159.1 EJ
Arable Land Use by Type
1990 2005 2020 2035 2050 2065 2080 2095 Units
urban land 0.05 0.05 0.05 0.05 0.05 0.05 0.05 0.05 billion Ha
crops 1.20 1.21 0.97 0.86 0.72 0.62 0.52 0.43 billion Ha
pasture 0.70 0.73 0.80 0.81 0.78 0.74 0.72 0.70 billion Ha
managed forest 0.69 0.74 0.83 0.92 1.00 1.05 1.08 1.08 billion Ha
bioenergy crops 0.00 0.00 0.02 0.07 0.14 0.23 0.30 0.39 billion Ha
unmanaged forest 3.32 3.25 3.88 3.88 3.87 3.86 3.87 3.87 billion Ha
unmanaged land 4.58 4.58 4.00 3.97 3.99 4.00 4.02 4.04 billion Ha
rock/ice/desert/tundra 2.62 2.62 2.62 2.62 2.62 2.62 2.62 2.62 billion Ha
total 10.50 10.50 10.50 10.50 10.50 10.50 10.50 10.50 billion Ha

Scenario: supply stab Page 95
Population, GDP, and Energy Indicators
1990 2005 2020 2035 2050 2065 2080 2095 Units
Economic Activity reference GDP $26.1 $39.4 $58.5 $84.4 $119.8 $168.5 $234.1 $316.4 trillion 2005$
Final Energy Intensity building 3.41 2.86 2.41 1.94 1.51 1.17 0.91 0.70 GJ/1000$ (2005$)
Final Energy Intensity industry 4.06 3.14 2.81 2.46 1.98 1.52 1.09 0.79 GJ/1000$ (2005$)
Final Energy Intensity transportation 2.55 2.33 1.87 1.57 1.29 1.02 0.80 0.61 GJ/1000$ (2005$)
Final Energy Intensity total 10.01 8.33 7.10 5.97 4.79 3.71 2.80 2.10 GJ/1000$ (2005$)
Population population 5.2 6.4 7.5 8.3 8.8 9.1 9.0 8.7 billion
Final Energy per Capita building 16.9 17.5 18.8 19.6 20.5 21.7 23.6 25.5 GJ/capita
Final Energy per Capita industry 20.2 19.2 21.8 24.9 27.0 28.2 28.4 28.5 GJ/capita
Final Energy per Capita transportation 12.7 14.3 14.6 15.9 17.5 19.0 20.8 22.1 GJ/capita
Final Energy per Capita total 49.7 51.0 55.2 60.3 65.0 68.9 72.8 76.1 GJ/capita
Long-Term Equilibrium Energy Producer Prices
1990 2005 2020 2035 2050 2065 2080 2095 Units
global oil (w/o carbon charge) $27.6 $32.5 $39.7 $41.6 $44.3 $45.7 $46.5 $46.2 $/barrel (2005$)
global oil (w/ carbon charge) $27.6 $32.5 $40.7 $43.6 $48.6 $54.6 $65.4 $83.6 $/barrel (2005$)
domestic natural gas (w/o carbon charge) $3.3 $3.8 $4.4 $4.2 $4.4 $5.3 $5.4 $5.5 $/mmBTU (2005$)
domestic natural gas (w/ carbon charge) $3.3 $3.8 $4.5 $4.4 $4.9 $6.4 $7.6 $9.8 $/mmBTU (2005$)
domestic coal (w/o carbon charge) $1.7 $1.7 $1.8 $1.8 $1.7 $1.7 $1.7 $1.6 $/GJ (2005$)
domestic coal (w/ carbon charge) $1.7 $1.7 $2.0 $2.2 $2.6 $3.6 $5.6 $9.5 $/GJ (2005$)
domestic electricity (w/ carbon charge) 6.21 5.74 5.91 5.66 5.69 5.93 5.94 5.92 cents/kWh (2005$)
carbon price 0.0 0.0 7.8 16.2 33.5 69.6 144.7 287.3 $/tC (2005$)
Crop Prices
1990 2005 2020 2035 2050 2065 2080 2095 Units
global corn 33 33 34 35 36 39 43 49 $/Gcal (2005$)
global rice 32 32 33 33 35 37 39 43 $/Gcal (2005$)
global wheat 27 27 29 29 30 33 37 43 $/Gcal (2005$)
Emissions by Sectors
1990 2005 2020 2035 2050 2065 2080 2095 Units
buildings 0.858 0.860 1.060 1.170 1.185 1.115 0.950 0.704 GtC/yr
industry 1.623 1.706 2.152 2.536 2.601 2.265 1.554 0.710 GtC/yr
transportation 1.354 1.863 2.229 2.641 2.950 2.978 2.653 1.522 GtC/yr
electricity 1.909 2.848 3.506 4.055 3.925 3.548 2.666 -0.153 GtC/yr
cement 0.261 0.483 0.857 1.172 1.264 1.078 0.704 0.181 GtC/yr
emissions reduction 0.000 0.000 0.462 1.689 4.199 7.953 13.089 21.334 GtC/yr
total: w/o reduction 6.005 7.759 9.804 11.574 11.926 10.983 8.526 2.964 GtC/yr

Scenario: supply stab Page 96
Final Energy Consumption: Buildings Final Energy Consumption: Industry (Does not Include Feedstocks)
Final Energy Consumption: Transportation Final Energy Consumption by Sector
0
50
100
150
200
250
300
1990 2005 2020 2035 2050 2065 2080 2095
EJ
/yr
liquids gascoal biomasselectricity trad biomassenergy reduction
0
50
100
150
200
250
300
350
400
1990 2005 2020 2035 2050 2065 2080 2095
EJ
/yr
liquids gas
coal biomass
electricity hydrogen
energy reduction feedstocks
0
50
100
150
200
250
300
1990 2005 2020 2035 2050 2065 2080 2095
EJ
/yr
liquids gas
coal electricity
hydrogen energy reduction
0
100
200
300
400
500
600
700
800
900
1990 2005 2020 2035 2050 2065 2080 2095
EJ
/yr
buildings industry
transportation energy reduction

Scenario: supply stab Page 97
Primary Energy Consumption Electricity Production by Fuel: CCS Focus
Hydrogen Production by Fuel Electricity Production by Fuel: Renewable Focus
-50
0
50
100
150
200
250
300
350
400
1990 2005 2020 2035 2050 2065 2080 2095
EJ
/yr
liquids liquids w/CCS
gas gas w/ccs
coal coal w/ccs
biomass biomass w/ccs
nuclear hydro
wind solar
geothermal energy reduction
-50
-40
-30
-20
-10
0
10
20
30
40
50
60
70
80
1990 2005 2020 2035 2050 2065 2080 2095
EJ
/yr
gas gas w/ccs
coal coal w/ccs
biomass biomass w/ccs
nuclear bulk electricity
wind solar
energy reduction
-50
0
50
100
150
200
250
300
350
400
1990 2005 2020 2035 2050 2065 2080 2095
EJ
/yr
liquids gascoal biomassnuclear hydrowind w/ backup wind w/ storagecsp w/ backup csp w/ storagepv w/ backup pv w/ storagerooftop solar w/ backup geothermalenergy reduction
0
200
400
600
800
1,000
1,200
1,400
1,600
1990 2005 2020 2035 2050 2065 2080 2095
EJ
/yr
oil w/o ccs oil w/ ccsnatural gas w/o ccs natural gas w/ ccscoal w/o ccs coal w/ ccsbiomass w/o ccs biomass w/ ccsnuclear hydrowind solargeothermal energy reduction

Scenario: supply stab Page 98
Industrial Liquids Production by Fuel (Feedstocks and Fuel) Transportation Fuels Composition
Final Energy Intensity Final Energy per Capita
0
50
100
150
200
250
300
1990 2005 2020 2035 2050 2065 2080 2095
EJ
/yr
conventional oil unconventional oilcoal liquids coal liquids w/ ccs bio fuels gas liquidsgas coalelectricity hydrogenenergy reduction
0
10
20
30
40
50
60
70
80
90
1990 2005 2020 2035 2050 2065 2080 2095
EJ
/yr
conventional oil unconventional oilcoal liquids coal liquids w/ ccs bio fuels gas liquidsenergy reduction
0
2
4
6
8
10
12
1990 2005 2020 2035 2050 2065 2080 2095
GJ
/10
00
$ (
20
05
$)
0
50
100
150
200
250
300
350
Re
fere
nc
e G
DP
(T
rillio
n 2
00
5$
)
building
industry
transportation
total
reference GDP
0
10
20
30
40
50
60
70
80
1990 2005 2020 2035 2050 2065 2080 2095
GJ
/ca
pit
a
0
1
2
3
4
5
6
7
8
9
10
Po
pu
lati
on
(b
illio
n)
building
industry
transportation
total
population

Scenario: supply stab Page 99
Dedicated Energy Crops, Waste Biomass, and Municipal Solid Waste Consumption by Sector Land Use by Type
Biomass Production by Source CO2 Emissions by Sector
-125
-100
-75
-50
-25
0
25
50
75
100
125
150
175
200
225
250
1990 2005 2020 2035 2050 2065 2080 2095
EJ
/yr
energy reductionsynthetic gashydrogenrefined liquids: tran & bldgelectricityIndustrydirect buildings
0
2
4
6
8
10
12
14
16
1990 2005 2020 2035 2050 2065 2080 2095
Billio
n H
ec
tare
s
urban land cropspasture managed forestbioenergy crops unmanaged forestunmanaged land rock/ice/desert/tundra
-125
-100
-75
-50
-25
0
25
50
75
100
125
150
175
200
225
250
1990 2005 2020 2035 2050 2065 2080 2095
EJ
/yr
reduction in municipal solid wate
reduction in biomass crops
waste biomass
municipal solid waste
dedicated biomass crops
waste biomass
-5
0
5
10
15
20
25
1990 2005 2020 2035 2050 2065 2080 2095
GtC
/yr
buildings industry
transportation electricity
cement emissions reduction

Scenario: adv stab Page 100
Final Energy Consumption
1990 2005 2020 2035 2050 2065 2080 2095 Units
building liquids 15.2 16.4 20.0 20.2 20.1 20.3 19.0 16.3 EJ/yr
building gas 18.7 26.7 28.0 25.6 23.7 21.0 17.9 14.4 EJ/yr
building coal 10.1 5.1 7.4 6.3 5.1 3.7 2.4 1.2 EJ/yr
building biomass 4.5 5.5 7.7 7.6 7.4 7.1 6.3 5.1 EJ/yr
building electricity 16.9 29.0 42.1 53.3 65.1 75.9 85.2 90.6 EJ/yr
building trad biomass 23.5 29.9 31.5 25.0 19.4 13.4 8.5 5.1 EJ/yr
building energy reduction 0.0 0.0 6.2 28.8 46.5 67.7 95.4 123.3 EJ/yr
total: w/o reduction 88.9 112.7 136.6 137.9 140.8 141.6 139.3 132.7 EJ/yr
industry liquids 22.4 21.2 18.6 21.0 23.9 29.2 29.8 26.6 EJ/yr
industry gas 26.6 30.5 32.6 37.3 35.9 33.4 29.1 23.4 EJ/yr
industry coal 31.4 35.8 52.9 62.2 67.4 60.6 43.3 20.5 EJ/yr
industry biomass 7.3 11.2 17.0 22.2 31.1 44.1 56.3 65.6 EJ/yr
industry electricity 18.1 24.8 33.5 46.2 60.7 74.6 87.8 105.6 EJ/yr
industry hydrogen 0.0 0.0 2.3 3.5 4.0 4.7 5.2 6.0 EJ/yr
industry energy reduction 0.0 0.0 11.0 24.4 33.3 43.9 60.4 81.2 EJ/yr
industry feedstocks 15.2 23.7 26.9 31.6 35.6 39.2 39.8 39.1 EJ/yr
total: w/o reduction 105.8 123.6 156.9 192.3 223.0 246.6 251.6 247.8 EJ/yr
transportation liquids 62.7 87.6 92.8 85.6 82.3 78.5 74.8 69.5 EJ/yr
transportation gas 2.3 3.0 6.2 8.5 10.3 11.2 11.6 10.8 EJ/yr
transportation coal 0.5 0.2 0.3 0.3 0.3 0.2 0.1 0.0 EJ/yr
transportation electricity 1.0 1.0 2.8 7.8 12.3 16.3 19.5 22.1 EJ/yr
transportation hydrogen 0.0 0.0 1.0 8.0 15.0 22.0 28.5 34.2 EJ/yr
transportation energy reduction 0.0 0.0 7.6 30.2 51.6 73.7 100.8 122.6 EJ/yr
total: w/o reduction 66.5 91.9 103.1 110.2 120.2 128.1 134.5 136.7 EJ/yr
total final energy buildings 88.9 112.7 136.6 137.9 140.8 141.6 139.3 132.7 EJ/yr
total final energy industry 105.8 123.6 156.9 192.3 223.0 246.6 251.6 247.8 EJ/yr
total final energy transportation 66.5 91.9 103.1 110.2 120.2 128.1 134.5 136.7 EJ/yr
total final energy energy reduction 0.0 0.0 24.8 83.3 131.4 185.3 256.6 327.1 EJ/yr
total: w/o reduction 261.1 328.2 396.6 440.4 484.0 516.2 525.4 517.2 EJ/yr

Scenario: adv stab Page 101
Primary Energy w/CCS
1990 2005 2020 2035 2050 2065 2080 2095 Units
oil w/o ccs 135.6 167.5 170.7 160.5 151.8 153.6 148.1 127.1 EJ/yr
oil w/ ccs 0.0 0.0 0.3 0.8 1.0 1.4 2.1 3.7 EJ/yr
natural gas w/o ccs 70.0 97.6 121.9 152.0 168.3 165.1 153.8 125.9 EJ/yr
natural gas w/ ccs 0.0 0.0 1.0 3.2 6.2 9.3 13.4 22.7 EJ/yr
coal w/o ccs 91.2 119.1 161.2 186.3 191.9 179.4 146.5 82.4 EJ/yr
coal w/ ccs 0.0 0.0 0.4 1.4 3.7 6.7 14.0 34.9 EJ/yr
biomass w/o ccs 14.4 21.6 31.7 39.4 53.5 73.2 94.8 122.7 EJ/yr
biomass w/ ccs 0.0 0.0 0.1 0.3 0.9 1.7 3.6 12.4 EJ/yr
nuclear 21.0 26.0 24.5 31.7 46.6 79.0 107.4 137.1 EJ/yr
hydro 23.6 29.2 29.3 31.3 31.2 33.1 35.4 37.3 EJ/yr
wind 0.0 0.9 14.4 28.7 35.0 41.8 47.6 56.2 EJ/yr
solar 0.0 0.1 2.8 7.9 12.3 16.8 22.5 31.5 EJ/yr
geothermal 0.4 0.6 1.7 8.6 19.8 23.0 23.1 26.3 EJ/yr
energy reduction 0.0 0.0 32.9 109.7 194.9 286.0 406.8 552.6 EJ/yr
total: w/o reduction 356 463 560 652 722 784 812 820 EJ/yr
Electricity Production by Fuel
1990 2005 2020 2035 2050 2065 2080 2095 Units
oil 4.86 4.33 3.81 2.49 1.98 2.14 2.05 1.58 EJ/yr
oil w/ccs 0.00 0.00 0.12 0.31 0.46 0.67 1.00 1.74 EJ/yr
gas 6.07 12.82 22.20 30.56 37.14 36.73 35.60 28.63 EJ/yr
gas w/ccs 0.00 0.00 0.36 1.34 2.81 4.38 6.34 10.92 EJ/yr
coal 16.05 26.35 34.90 41.11 42.54 41.85 38.87 25.02 EJ/yr
coal w/ccs 0.00 0.00 0.12 0.50 1.41 2.60 5.62 14.52 EJ/yr
biomass 0.43 0.71 1.19 1.87 3.11 4.10 4.99 4.61 EJ/yr
biomass w/ccs 0.00 0.00 0.00 0.09 0.31 0.57 1.15 3.83 EJ/yr
nuclear 7.36 9.97 10.37 13.73 22.17 39.14 54.33 70.88 EJ/yr
hydro 7.82 10.44 12.13 13.99 15.85 17.70 19.56 21.42 EJ/yr
wind w/backup 0.01 0.36 4.57 8.71 10.57 12.49 13.90 16.25 EJ/yr
wind w/storage 0.00 0.00 1.37 4.01 6.86 9.66 12.27 15.64 EJ/yr
CSP w/backup 0.00 0.00 0.60 0.88 0.62 0.72 0.90 1.31 EJ/yr
CSP w/storage 0.00 0.00 0.47 2.39 4.38 5.25 6.41 9.10 EJ/yr
PV w/backup 0.00 0.04 0.06 0.13 0.61 1.64 2.85 4.07 EJ/yr
PV w/storage 0.00 0.00 0.01 0.07 0.30 0.76 1.30 1.86 EJ/yr
rooftop PV w/backup 0.00 0.00 0.71 1.89 3.53 5.22 6.58 7.70 EJ/yr
geothermal 0.15 0.23 0.72 3.86 10.00 12.28 12.86 15.25 EJ/yr
energy reduction 0.00 0.00 4.93 19.09 45.17 66.24 97.69 132.55 EJ/yr
total: w/o reduction 42.8 65.2 93.7 127.9 164.6 197.9 226.6 254.3 EJ/yr

Scenario: adv stab Page 102
Transportation Fuels Production by Fuel
1990 2005 2020 2035 2050 2065 2080 2095 Units
conventional oil 62.5 86.7 87.7 75.5 62.3 53.8 48.3 41.0 EJ/yr
unconventional oil 0.0 0.0 1.4 3.4 8.3 12.0 13.8 12.7 EJ/yr
coal liquids 0.0 0.0 1.2 2.3 4.4 4.4 3.2 1.3 EJ/yr
coal liquids w/ ccs 0.0 0.0 0.0 0.0 0.0 0.0 0.0 0.1 EJ/yr
bio fuels 0.2 0.9 1.2 1.3 2.0 3.2 5.4 11.5 EJ/yr
gas liquids 0.0 0.0 1.3 3.1 5.2 5.1 4.0 2.8 EJ/yr
gas 2.3 3.0 6.2 8.5 10.3 11.2 11.6 10.8 EJ/yr
coal 0.5 0.2 0.3 0.3 0.3 0.2 0.1 0.0 EJ/yr
electricity 1.0 1.0 2.8 7.8 12.3 16.3 19.5 22.1 EJ/yr
hydrogen 0.0 0.0 1.0 8.0 15.0 22.0 28.5 34.2 EJ/yr
energy reduction 0.0 0.0 7.6 30.2 51.6 73.7 100.8 122.6 EJ/yr
total: w/o reduction 66.5 91.9 103.1 110.2 120.2 128.1 134.5 136.7 EJ/yr
Industrial Liquids Production by Fuel
1990 2005 2020 2035 2050 2065 2080 2095 Units
conventional oil 36.59 43.88 43.39 47.55 48.51 53.40 52.36 46.19 EJ/yr
unconventional oil 0.00 0.00 0.36 1.49 4.77 8.09 10.14 9.34 EJ/yr
coal liquids 0.00 0.00 0.30 0.88 2.06 2.23 1.60 0.67 EJ/yr
coal liquids w/ ccs 0.00 0.00 0.00 0.00 0.00 0.00 0.01 0.03 EJ/yr
bio fuels 0.01 0.05 0.14 0.28 0.65 1.34 2.82 7.50 EJ/yr
gas liquids 0.00 0.00 0.35 1.45 2.57 2.62 2.04 1.36 EJ/yr
energy reduction 0.0 0.0 2.7 4.9 6.4 10.2 14.4 15.9 EJ/yr
total: w/o reduction 36.6 43.9 44.5 51.6 58.6 67.7 69.0 65.1 EJ/yr
Hydrogen Production by Fuel
1990 2005 2020 2035 2050 2065 2080 2095 Units
gas 0.00 0.00 2.14 8.10 12.67 16.42 18.64 17.61 EJ/yr
gas w/ccs 0.00 0.00 0.22 0.66 1.17 1.87 3.01 5.34 EJ/yr
coal 0.00 0.00 0.40 1.10 1.96 2.55 2.31 1.11 EJ/yr
coal w/ccs 0.00 0.00 0.06 0.16 0.35 0.73 1.53 3.31 EJ/yr
biomass 0.00 0.00 0.12 0.35 0.68 1.16 1.64 1.54 EJ/yr
biomass w/ccs 0.00 0.00 0.02 0.04 0.09 0.21 0.55 2.25 EJ/yr
nuclear 0.00 0.00 0.10 0.53 1.10 2.05 3.43 5.42 EJ/yr
bulk electricity 0.00 0.00 0.09 0.34 0.62 0.95 1.32 1.57 EJ/yr
wind 0.00 0.00 0.06 0.08 0.15 0.27 0.45 0.68 EJ/yr
solar 0.00 0.00 0.06 0.10 0.22 0.44 0.81 1.42 EJ/yr
energy reduction 0.00 0.00 -0.03 -6.22 -9.65 -12.41 -13.71 -12.53 EJ/yr
total: w/o reduction 0.00 0.00 3.27 11.45 19.01 26.66 33.69 40.25 EJ/yr

Scenario: adv stab Page 103
Dedicated Bioenergy Crops, Crop Residues, and Municipal Solid Waste Consumption by Sector
1990 2005 2020 2035 2050 2065 2080 2095 Units
direct buildings 4.5 5.5 7.7 7.6 7.4 7.1 6.3 5.1 EJ/yr
Industry 7.4 11.3 17.3 22.8 32.4 46.7 61.5 79.0 EJ/yr
electricity 2.1 2.5 3.4 5.1 8.0 10.7 13.6 18.2 EJ/yr
refined liquids: tran & bldg 0.5 2.2 3.0 3.3 5.0 7.7 12.5 25.4 EJ/yr
hydrogen 0.0 0.0 0.3 0.8 1.5 2.7 4.2 7.4 EJ/yr
synthetic gas 0.0 0.0 0.0 0.0 0.0 0.0 0.1 0.1 EJ/yr
energy reduction 0.0 0.0 0.4 4.2 5.9 8.7 3.0 -5.0 EJ/yr
total: w/o reduction 14.4 21.6 31.7 39.7 54.3 74.9 98.3 135.1 EJ/yr
Biomass Production
1990 2005 2020 2035 2050 2065 2080 2095 Units
waste biomass 14.4 21.5 29.1 30.8 31.7 33.5 36.9 48.3 EJ
dedicated biomass crops 0.0 0.0 2.5 8.6 22.4 41.0 60.7 81.9 EJ
municipal solid waste 0.0 0.1 0.2 0.2 0.2 0.3 0.7 4.9 EJ
waste biomass 0.0 0.0 2.6 7.0 10.0 11.9 10.2 1.0 EJ
reduction in biomass crops 0.0 0.0 -2.5 -3.7 -5.7 -6.2 -12.0 -11.5 EJ
reduction in municipal solid wate0.0 0.0 0.2 0.8 1.6 3.1 4.8 5.4 EJ
total: w/o reduction 14.4 21.6 31.9 43.0 58.7 80.5 96.5 124.6 EJ
Arable Land Use by Type
1990 2005 2020 2035 2050 2065 2080 2095 Units
urban land 0.05 0.05 0.05 0.05 0.05 0.05 0.05 0.05 billion Ha
crops 1.20 1.21 1.01 0.88 0.73 0.63 0.53 0.44 billion Ha
pasture 0.70 0.73 0.83 0.87 0.83 0.78 0.74 0.71 billion Ha
managed forest 0.69 0.74 0.82 0.91 1.00 1.06 1.11 1.13 billion Ha
bioenergy crops 0.00 0.00 0.01 0.02 0.07 0.14 0.22 0.30 billion Ha
unmanaged forest 3.32 3.25 3.81 3.84 3.87 3.87 3.86 3.86 billion Ha
unmanaged land 4.58 4.58 4.02 3.97 4.00 4.02 4.04 4.05 billion Ha
rock/ice/desert/tundra 2.62 2.62 2.62 2.62 2.62 2.62 2.62 2.62 billion Ha
total 10.50 10.50 10.50 10.50 10.50 10.50 10.50 10.50 billion Ha

Scenario: adv stab Page 104
Population, GDP, and Energy Indicators
1990 2005 2020 2035 2050 2065 2080 2095 Units
Economic Activity reference GDP $26.1 $39.4 $58.7 $84.8 $120.7 $170.3 $237.1 $321.2 trillion 2005$
Final Energy Intensity building 3.41 2.86 2.33 1.63 1.17 0.83 0.59 0.41 GJ/1000$ (2005$)
Final Energy Intensity industry 4.06 3.14 2.67 2.27 1.85 1.45 1.06 0.77 GJ/1000$ (2005$)
Final Energy Intensity transportation 2.55 2.33 1.76 1.30 1.00 0.75 0.57 0.43 GJ/1000$ (2005$)
Final Energy Intensity total 10.02 8.33 6.76 5.19 4.01 3.03 2.22 1.61 GJ/1000$ (2005$)
Population population 5.2 6.4 7.5 8.3 8.8 9.1 9.0 8.7 billion
Final Energy per Capita building 16.9 17.5 18.2 16.5 16.0 15.6 15.5 15.2 GJ/capita
Final Energy per Capita industry 20.2 19.2 20.8 23.0 25.3 27.2 27.9 28.3 GJ/capita
Final Energy per Capita transportation 12.7 14.3 13.7 13.2 13.6 14.1 14.9 15.6 GJ/capita
Final Energy per Capita total 49.8 51.0 52.7 52.8 54.9 57.0 58.3 59.1 GJ/capita
Long-Term Equilibrium Energy Producer Prices
1990 2005 2020 2035 2050 2065 2080 2095 Units
global oil (w/o carbon charge) $27.6 $32.4 $39.6 $40.4 $43.0 $43.6 $44.1 $44.0 $/barrel (2005$)
global oil (w/ carbon charge) $27.6 $32.4 $40.1 $41.4 $45.1 $48.0 $53.4 $63.2 $/barrel (2005$)
domestic natural gas (w/o carbon charge) $3.3 $3.8 $4.3 $4.0 $4.3 $4.7 $5.0 $5.0 $/mmBTU (2005$)
domestic natural gas (w/ carbon charge) $3.3 $3.8 $4.4 $4.1 $4.5 $5.2 $6.1 $7.2 $/mmBTU (2005$)
domestic coal (w/o carbon charge) $1.7 $1.7 $1.8 $1.7 $1.7 $1.7 $1.7 $1.6 $/GJ (2005$)
domestic coal (w/ carbon charge) $1.7 $1.7 $1.9 $2.0 $2.1 $2.7 $3.6 $5.6 $/GJ (2005$)
domestic electricity (w/ carbon charge) 6.21 5.74 5.83 5.49 5.45 5.55 5.57 5.72 cents/kWh (2005$)
carbon price 0.0 0.0 3.8 7.9 16.4 34.2 71.1 147.9 $/tC (2005$)
Crop Prices
1990 2005 2020 2035 2050 2065 2080 2095 Units
global corn 33 33 34 34 34 35 37 40 $/Gcal (2005$)
global rice 32 32 32 32 32 33 33 34 $/Gcal (2005$)
global wheat 27 27 27 27 27 28 30 32 $/Gcal (2005$)
Emissions by Sectors
1990 2005 2020 2035 2050 2065 2080 2095 Units
buildings 0.858 0.860 1.024 0.975 0.930 0.852 0.718 0.530 GtC/yr
industry 1.623 1.706 2.060 2.382 2.573 2.513 2.072 1.323 GtC/yr
transportation 1.355 1.863 2.083 2.123 2.251 2.231 2.076 1.638 GtC/yr
electricity 1.909 2.848 3.461 3.880 3.698 3.484 3.161 2.038 GtC/yr
cement 0.261 0.483 0.845 1.133 1.271 1.192 0.953 0.627 GtC/yr
emissions reduction 0.000 0.000 0.793 2.772 5.401 8.665 12.636 18.142 GtC/yr
total: w/o reduction 6.006 7.760 9.473 10.492 10.724 10.272 8.979 6.156 GtC/yr

Scenario: adv stab Page 105
Final Energy Consumption: Buildings Final Energy Consumption: Industry (Does not Include Feedstocks)
Final Energy Consumption: Transportation Final Energy Consumption by Sector
0
50
100
150
200
250
300
1990 2005 2020 2035 2050 2065 2080 2095
EJ
/yr
liquids gascoal biomasselectricity trad biomassenergy reduction
0
50
100
150
200
250
300
350
400
1990 2005 2020 2035 2050 2065 2080 2095
EJ
/yr
liquids gas
coal biomass
electricity hydrogen
energy reduction feedstocks
0
50
100
150
200
250
300
1990 2005 2020 2035 2050 2065 2080 2095
EJ
/yr
liquids gas
coal electricity
hydrogen energy reduction
0
100
200
300
400
500
600
700
800
900
1990 2005 2020 2035 2050 2065 2080 2095
EJ
/yr
buildings industry
transportation energy reduction

Scenario: adv stab Page 106
Primary Energy Consumption Electricity Production by Fuel: CCS Focus
Hydrogen Production by Fuel Electricity Production by Fuel: Renewable Focus
-50
0
50
100
150
200
250
300
350
400
1990 2005 2020 2035 2050 2065 2080 2095
EJ
/yr
liquids liquids w/CCS
gas gas w/ccs
coal coal w/ccs
biomass biomass w/ccs
nuclear hydro
wind solar
geothermal energy reduction
-50
-40
-30
-20
-10
0
10
20
30
40
50
60
70
80
1990 2005 2020 2035 2050 2065 2080 2095
EJ
/yr
gas gas w/ccs
coal coal w/ccs
biomass biomass w/ccs
nuclear bulk electricity
wind solar
energy reduction
-50
0
50
100
150
200
250
300
350
400
1990 2005 2020 2035 2050 2065 2080 2095
EJ
/yr
liquids gascoal biomassnuclear hydrowind w/ backup wind w/ storagecsp w/ backup csp w/ storagepv w/ backup pv w/ storagerooftop solar w/ backup geothermalenergy reduction
0
200
400
600
800
1,000
1,200
1,400
1,600
1990 2005 2020 2035 2050 2065 2080 2095
EJ
/yr
oil w/o ccs oil w/ ccsnatural gas w/o ccs natural gas w/ ccscoal w/o ccs coal w/ ccsbiomass w/o ccs biomass w/ ccsnuclear hydrowind solargeothermal energy reduction

Scenario: adv stab Page 107
Industrial Liquids Production by Fuel (Feedstocks and Fuel) Transportation Fuels Composition
Final Energy Intensity Final Energy per Capita
0
50
100
150
200
250
300
1990 2005 2020 2035 2050 2065 2080 2095
EJ
/yr
conventional oil unconventional oilcoal liquids coal liquids w/ ccs bio fuels gas liquidsgas coalelectricity hydrogenenergy reduction
0
10
20
30
40
50
60
70
80
90
1990 2005 2020 2035 2050 2065 2080 2095
EJ
/yr
conventional oil unconventional oilcoal liquids coal liquids w/ ccs bio fuels gas liquidsenergy reduction
0
2
4
6
8
10
12
1990 2005 2020 2035 2050 2065 2080 2095
GJ
/10
00
$ (
20
05
$)
0
50
100
150
200
250
300
350
Re
fere
nc
e G
DP
(T
rillio
n 2
00
5$
)
building
industry
transportation
total
reference GDP
0
10
20
30
40
50
60
70
1990 2005 2020 2035 2050 2065 2080 2095
GJ
/ca
pit
a
0
1
2
3
4
5
6
7
8
9
10
Po
pu
lati
on
(b
illio
n)
building
industry
transportation
total
population

Scenario: adv stab Page 108
Dedicated Energy Crops, Waste Biomass, and Municipal Solid Waste Consumption by Sector Land Use by Type
Biomass Production by Source CO2 Emissions by Sector
-125
-100
-75
-50
-25
0
25
50
75
100
125
150
175
200
225
250
1990 2005 2020 2035 2050 2065 2080 2095
EJ
/yr
energy reductionsynthetic gashydrogenrefined liquids: tran & bldgelectricityIndustrydirect buildings
0
2
4
6
8
10
12
14
16
1990 2005 2020 2035 2050 2065 2080 2095
Billio
n H
ec
tare
s
urban land cropspasture managed forestbioenergy crops unmanaged forestunmanaged land rock/ice/desert/tundra
-125
-100
-75
-50
-25
0
25
50
75
100
125
150
175
200
225
250
1990 2005 2020 2035 2050 2065 2080 2095
EJ
/yr
reduction in municipal solid wate
reduction in biomass crops
waste biomass
municipal solid waste
dedicated biomass crops
waste biomass
-5
0
5
10
15
20
25
1990 2005 2020 2035 2050 2065 2080 2095
GtC
/yr
buildings industry
transportation electricity
cement emissions reduction

Carbon Prices and Costs Page 109
Global Carbon Price: 2005-2095 Annual Undiscounted Policy Cost: 2005-2095
Global Carbon Price: 2005-2050 Annual Undiscounted Policy Cost: 2005-2050
0
100
200
300
400
500
600
700
800
900
1000
2005 2020 2035 2050 2065 2080 2095
$/tC 2005$
ReferenceRenewable EnergyNuclear RefNuclear AdvEnd UseEnd Use & RenewablesCCSBio & CCSSupply & HydrogenAdvanced
0
1000
2000
3000
4000
5000
6000
2005 2020 2035 2050 2065 2080 2095
billion $ (2005$)
ReferenceNuclear RefNuclear AdvRenewable EnergyEnd UseEnd Use & RenewablesCCSBio & CCSSupply & HydrogenAdvanced
0
20
40
60
80
100
120
2005 2020 2035 2050
$/tC 2005$
ReferenceRenewable EnergyNuclear RefNuclear AdvEnd UseEnd Use & RenewablesCCSBio & CCSSupply & HydrogenAdvanced
0
50
100
150
200
250
2005 2020 2035 2050
billion $ (2005$)
ReferenceNuclear RefNuclear AdvRenewable EnergyEnd UseEnd Use & RenewablesCCSBio & CCSSupply & HydrogenAdvanced

Carbon Prices and Costs Page 110
Reference 2.5 trillion 2005$
Renewable Energy 1.6 trillion 2005$
Nuclear Ref 1.5 trillion 2005$
Nuclear Adv 1.4 trillion 2005$
End Use 0.6 trillion 2005$
End Use & Renewables 0.4 trillion 2005$
CCS 1.3 trillion 2005$
Bio & CCS 1.3 trillion 2005$
Supply & Hydrogen 0.6 trillion 2005$
Advanced 0.1 trillion 2005$
Total Discounted Policy Cost 2005 through 2095
(5% Discount Rate)
Note that these costs assume comprehensive
international action and allocations of permits among
countries so that the U.S. neither buys nor sells
permits.