Cmpe 589 Spring 2006. PROCESS ASSESSMENT Definitions and motivation Software process models SEI...
49
Cmpe 589 Spring 2006
-
Upload
beatrix-liliana-floyd -
Category
Documents
-
view
224 -
download
0
Transcript of Cmpe 589 Spring 2006. PROCESS ASSESSMENT Definitions and motivation Software process models SEI...
Cmpe 589
Spring 2006
PROCESS ASSESSMENT
• Definitions and motivation
• Software process models
• SEI capability maturity model
• Maturity assessment process
• Experience

MOTIVATION
• Risk reduction
• Quality improvement
• Productivity increase
Capability Maturity Model (CMM)
• Developed by the Software Engineering Institute (SEI) with DoD funding
• Designed for large organizations doing routine development – Assessment AND evaluation
• What's the difference?
• Five levels of maturity
• Key processes
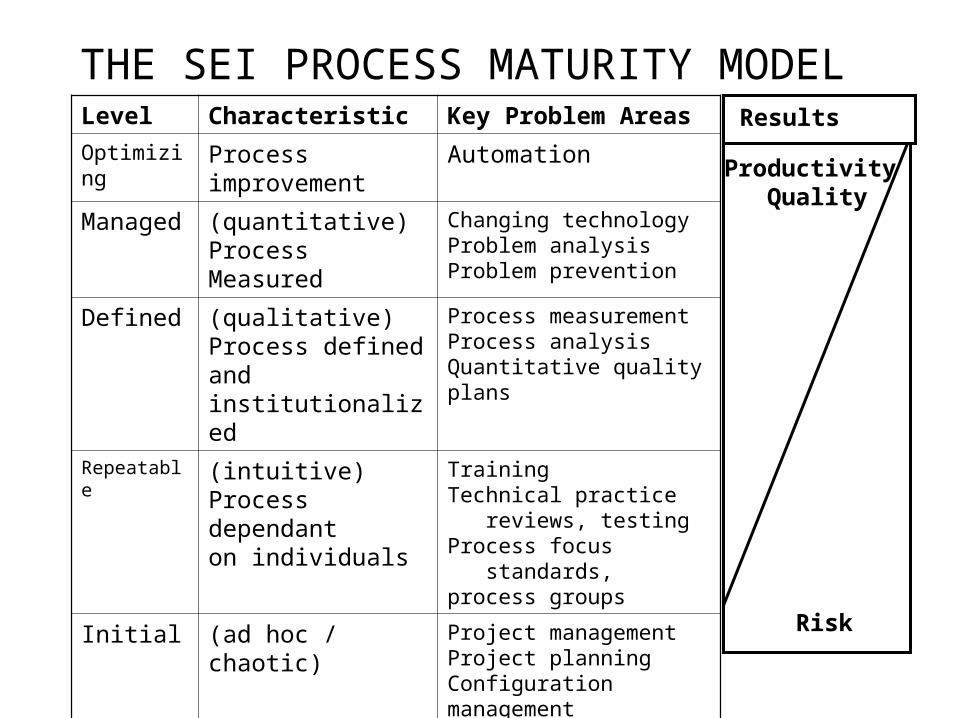
THE SEI PROCESS MATURITY MODEL Level Characteristic Key Problem Areas
Optimizing Process improvement
Automation
Managed (quantitative) Process Measured
Changing technology Problem analysis Problem prevention
Defined (qualitative) Process defined and institutionalized
Process measurement Process analysis Quantitative quality plans
Repeatable (intuitive) Process dependant on individuals
Training Technical practice reviews, testing Process focus standards, process groups
Initial (ad hoc / chaotic) Project management Project planning Configuration management Software quality assurance
Results
Productivity Quality
Risk
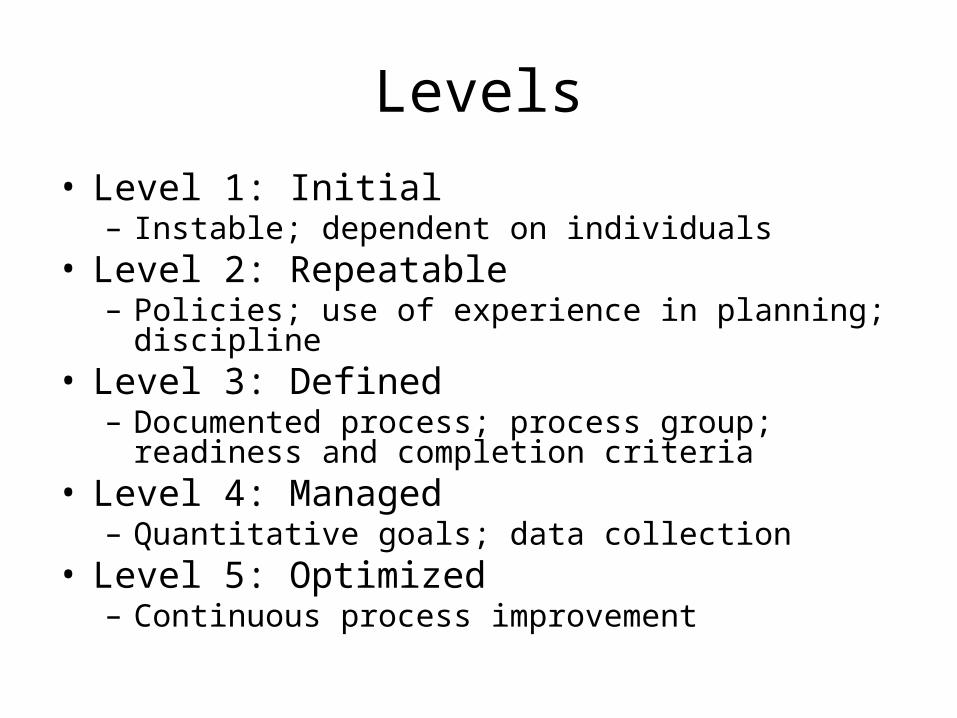
Levels
• Level 1: Initial – Instable; dependent on individuals
• Level 2: Repeatable – Policies; use of experience in planning; discipline
• Level 3: Defined – Documented process; process group; readiness and
completion criteria • Level 4: Managed
– Quantitative goals; data collection • Level 5: Optimized
– Continuous process improvement

LEVEL 1: Initial Process
• Ill-defined inputs; cost and schedule overruns
• Undefined process; no repeatability
• Simple metrics of size, staff effort
• Baseline for later comparison
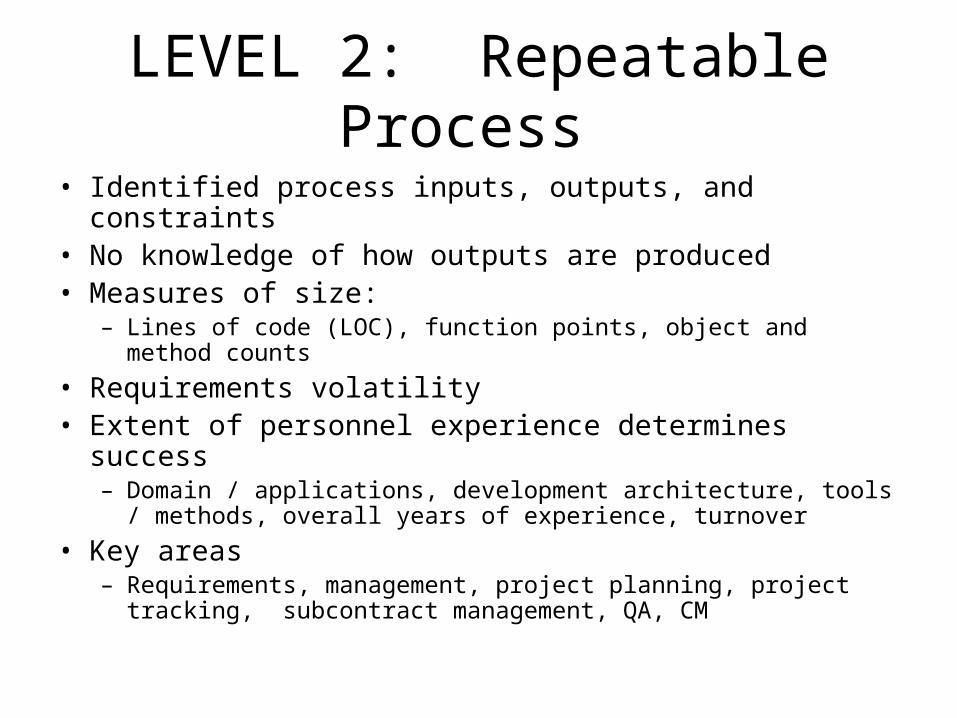
LEVEL 2: Repeatable Process
• Identified process inputs, outputs, and constraints • No knowledge of how outputs are produced • Measures of size:
– Lines of code (LOC), function points, object and method counts
• Requirements volatility • Extent of personnel experience determines success
– Domain / applications, development architecture, tools / methods, overall years of experience, turnover
• Key areas – Requirements, management, project planning, project tracking,
subcontract management, QA, CM
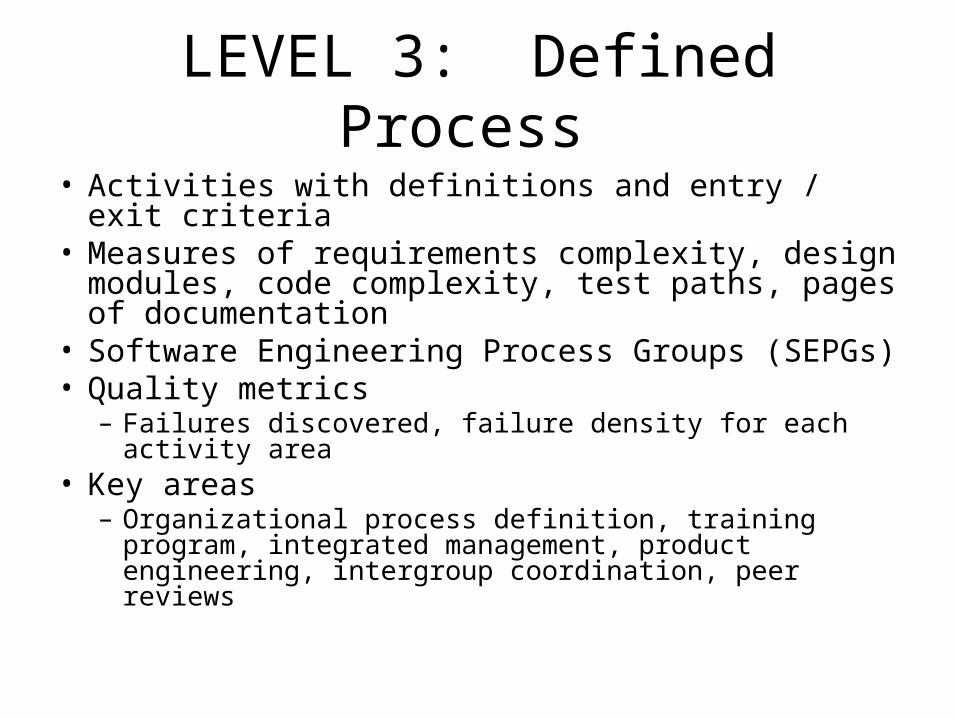
LEVEL 3: Defined Process
• Activities with definitions and entry / exit criteria • Measures of requirements complexity, design
modules, code complexity, test paths, pages of documentation
• Software Engineering Process Groups (SEPGs) • Quality metrics
– Failures discovered, failure density for each activity area
• Key areas – Organizational process definition, training program,
integrated management, product engineering, intergroup coordination, peer reviews
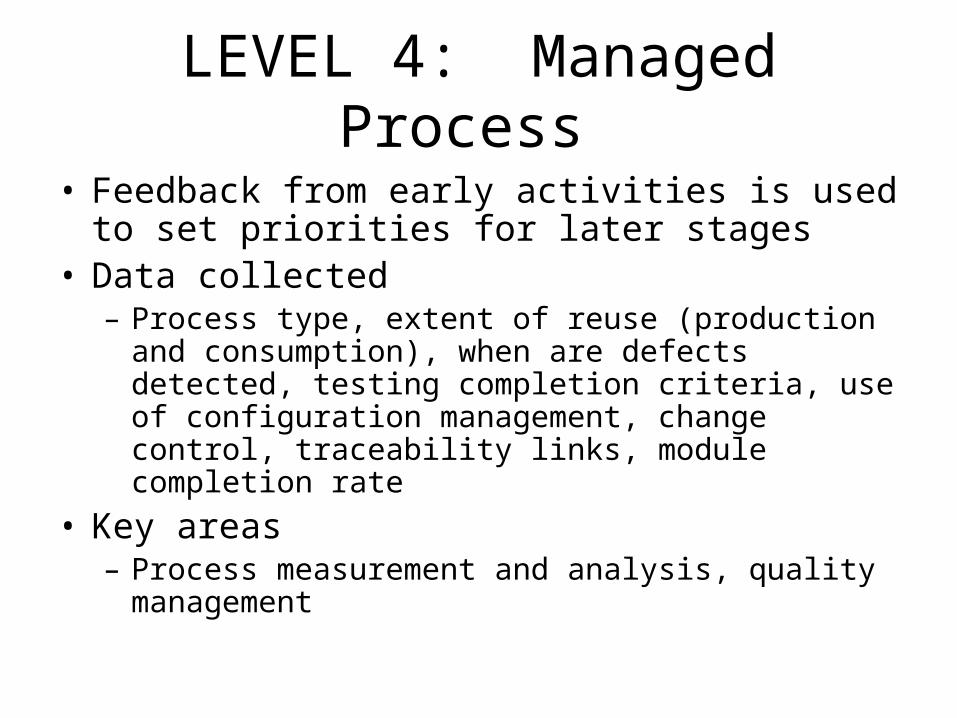
LEVEL 4: Managed Process
• Feedback from early activities is used to set priorities for later stages
• Data collected – Process type, extent of reuse (production and
consumption), when are defects detected, testing completion criteria, use of configuration management, change control, traceability links, module completion rate
• Key areas – Process measurement and analysis, quality
management
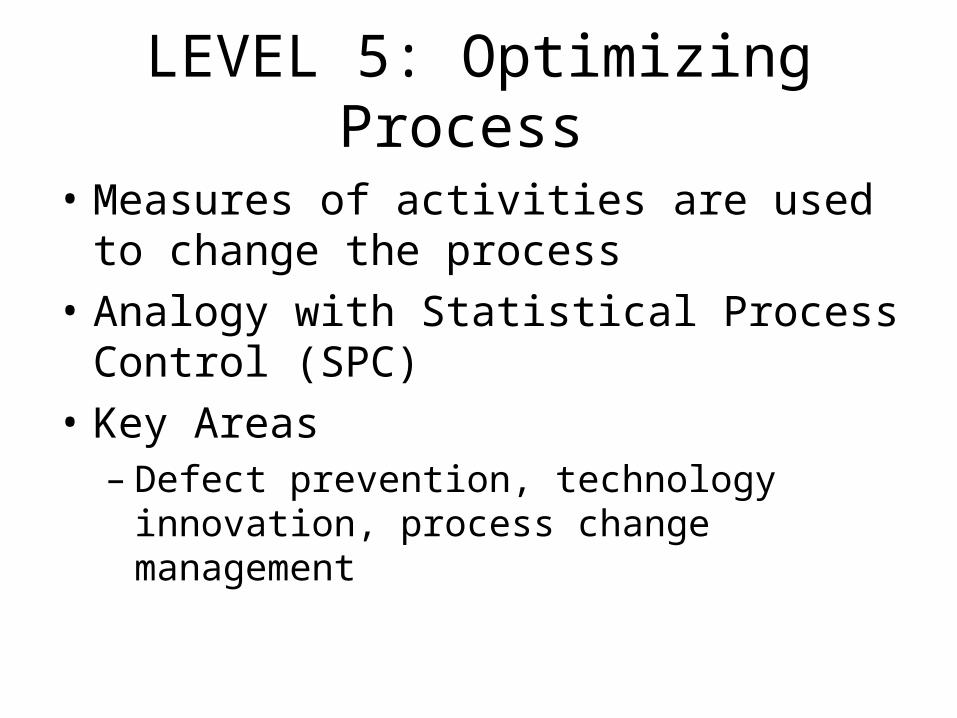
LEVEL 5: Optimizing Process
• Measures of activities are used to change the process
• Analogy with Statistical Process Control (SPC)
• Key Areas – Defect prevention, technology innovation,
process change management
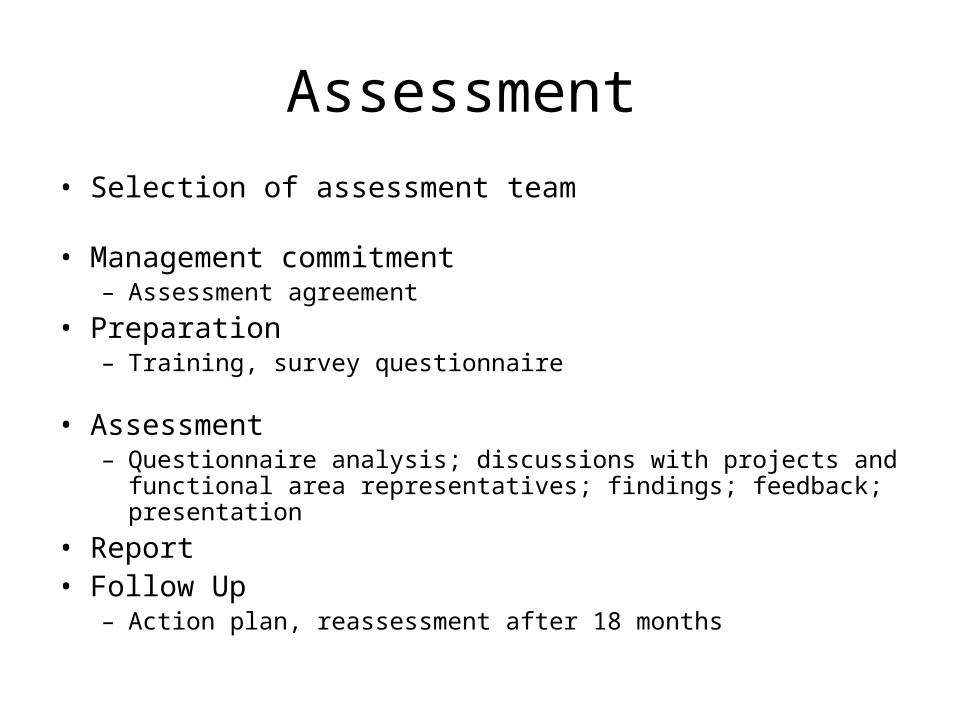
Assessment
• Selection of assessment team • Management commitment
– Assessment agreement
• Preparation – Training, survey questionnaire
• Assessment – Questionnaire analysis; discussions with projects and functional
area representatives; findings; feedback; presentation
• Report • Follow Up
– Action plan, reassessment after 18 months
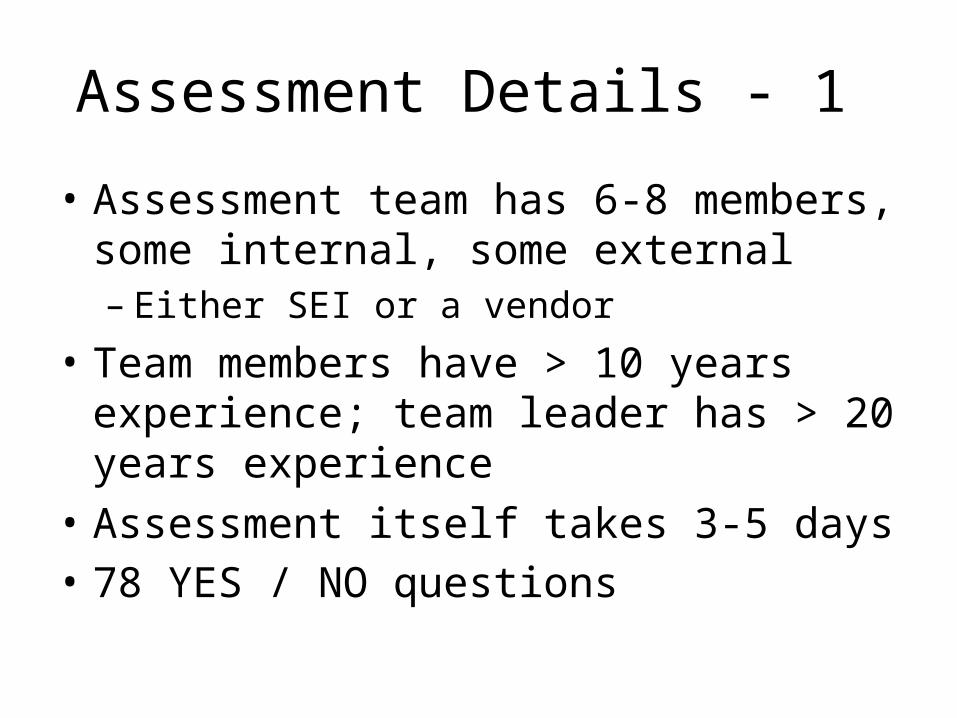
Assessment Details - 1
• Assessment team has 6-8 members, some internal, some external – Either SEI or a vendor
• Team members have > 10 years experience; team leader has > 20 years experience
• Assessment itself takes 3-5 days • 78 YES / NO questions
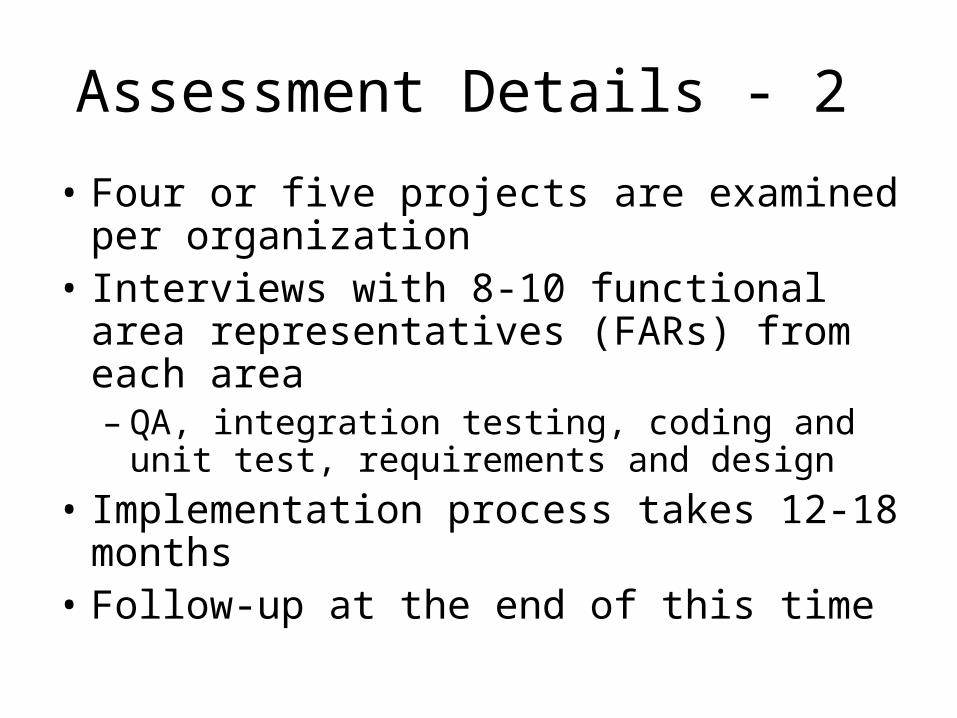
Assessment Details - 2
• Four or five projects are examined per organization
• Interviews with 8-10 functional area representatives (FARs) from each area – QA, integration testing, coding and unit test,
requirements and design
• Implementation process takes 12-18 months
• Follow-up at the end of this time
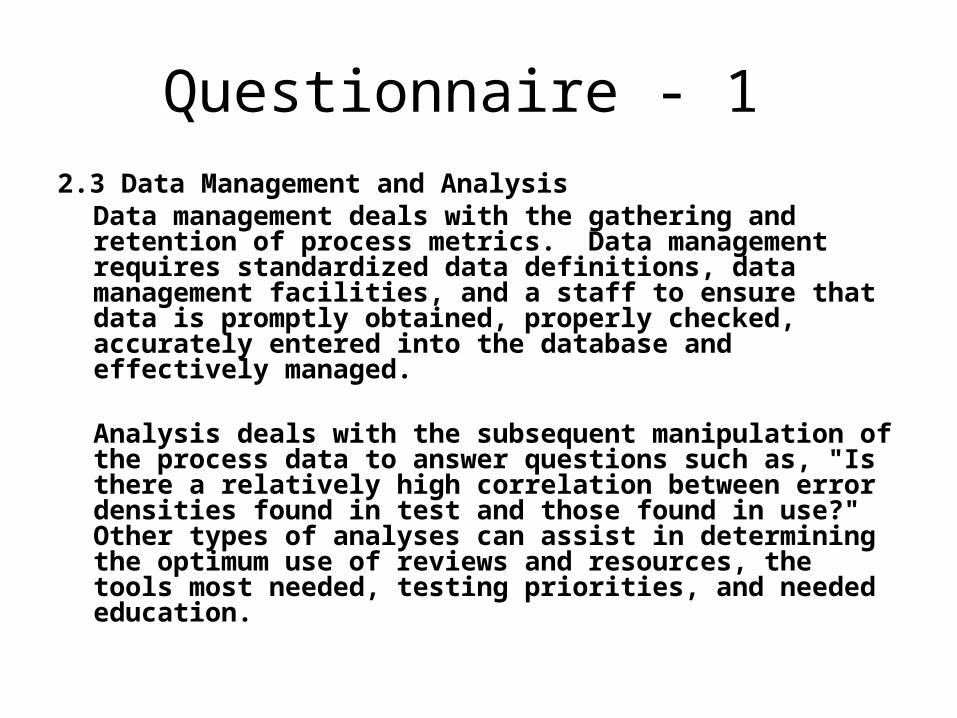
Questionnaire - 1 2.3 Data Management and Analysis
Data management deals with the gathering and retention of process metrics. Data management requires standardized data definitions, data management facilities, and a staff to ensure that data is promptly obtained, properly checked, accurately entered into the database and effectively managed.
Analysis deals with the subsequent manipulation of the process data to answer questions such as, "Is there a relatively high correlation between error densities found in test and those found in use?" Other types of analyses can assist in determining the optimum use of reviews and resources, the tools most needed, testing priorities, and needed education.
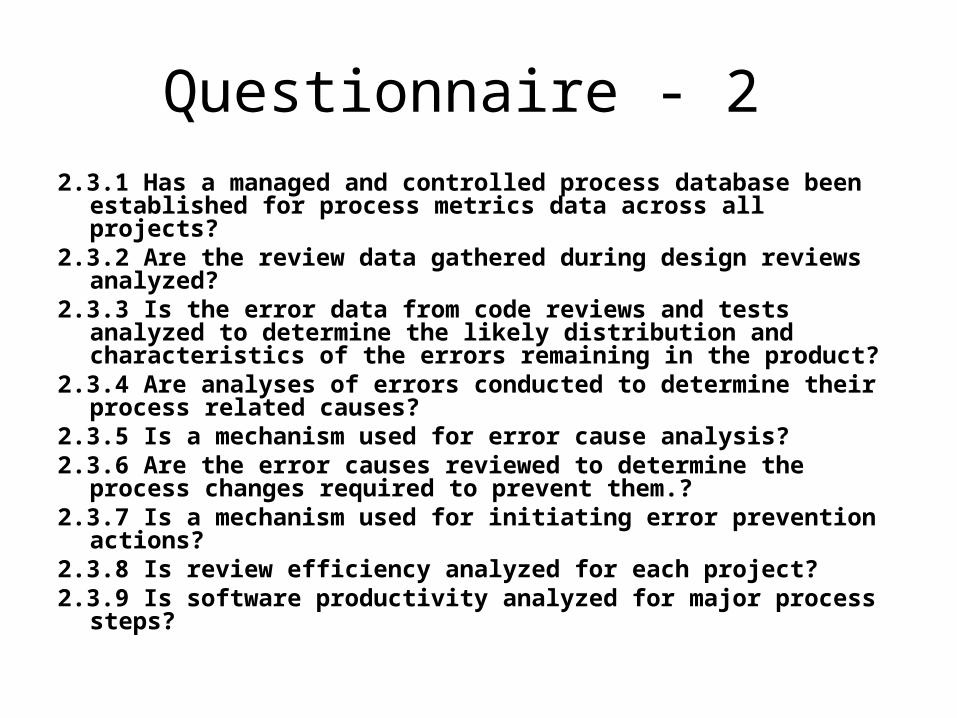
Questionnaire - 2 2.3.1 Has a managed and controlled process database been
established for process metrics data across all projects? 2.3.2 Are the review data gathered during design reviews
analyzed? 2.3.3 Is the error data from code reviews and tests analyzed to
determine the likely distribution and characteristics of the errors remaining in the product?
2.3.4 Are analyses of errors conducted to determine their process related causes?
2.3.5 Is a mechanism used for error cause analysis? 2.3.6 Are the error causes reviewed to determine the process
changes required to prevent them.? 2.3.7 Is a mechanism used for initiating error prevention actions? 2.3.8 Is review efficiency analyzed for each project? 2.3.9 Is software productivity analyzed for major process steps?
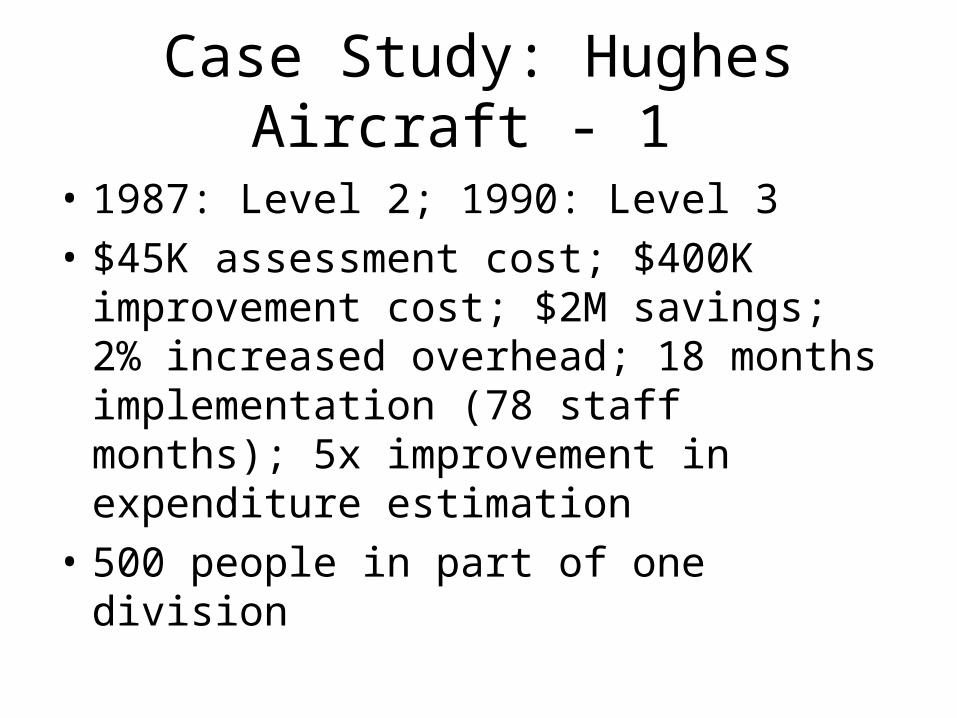
Case Study: Hughes Aircraft - 1
• 1987: Level 2; 1990: Level 3
• $45K assessment cost; $400K improvement cost; $2M savings; 2% increased overhead; 18 months implementation (78 staff months); 5x improvement in expenditure estimation
• 500 people in part of one division
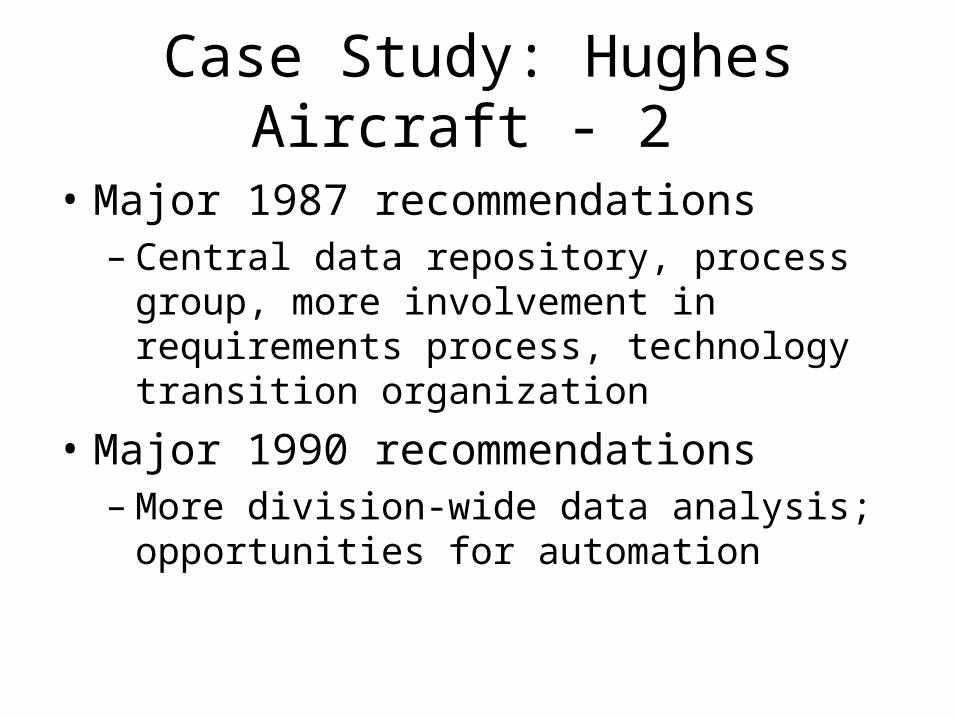
Case Study: Hughes Aircraft - 2
• Major 1987 recommendations – Central data repository, process group, more
involvement in requirements process, technology transition organization
• Major 1990 recommendations – More division-wide data analysis;
opportunities for automation
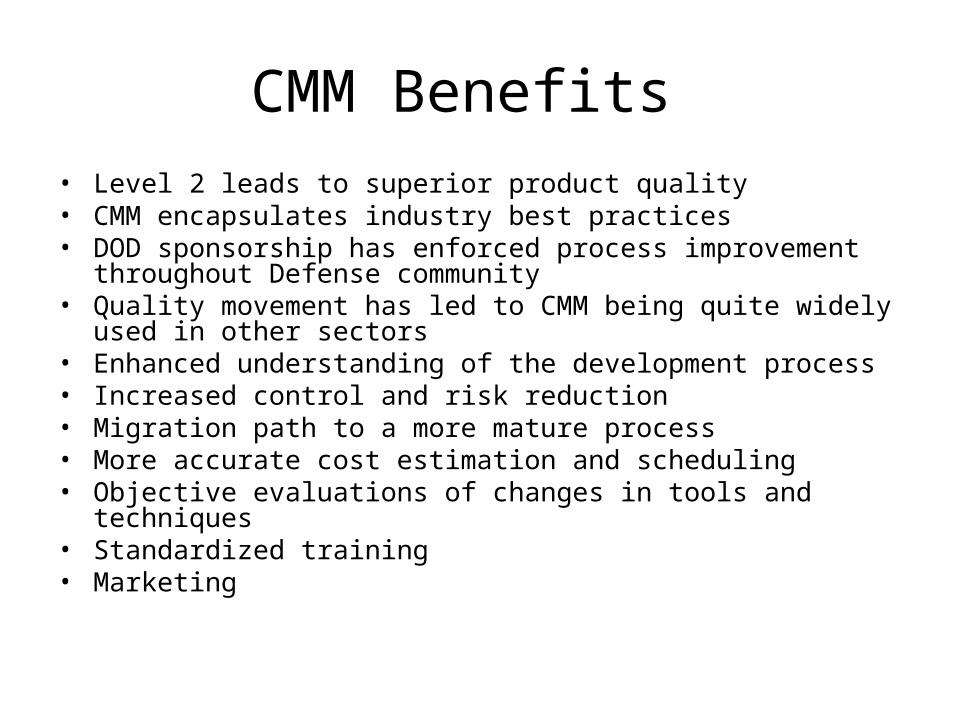
CMM Benefits • Level 2 leads to superior product quality • CMM encapsulates industry best practices • DOD sponsorship has enforced process improvement throughout
Defense community • Quality movement has led to CMM being quite widely used in other
sectors • Enhanced understanding of the development process • Increased control and risk reduction • Migration path to a more mature process • More accurate cost estimation and scheduling • Objective evaluations of changes in tools and techniques • Standardized training • Marketing
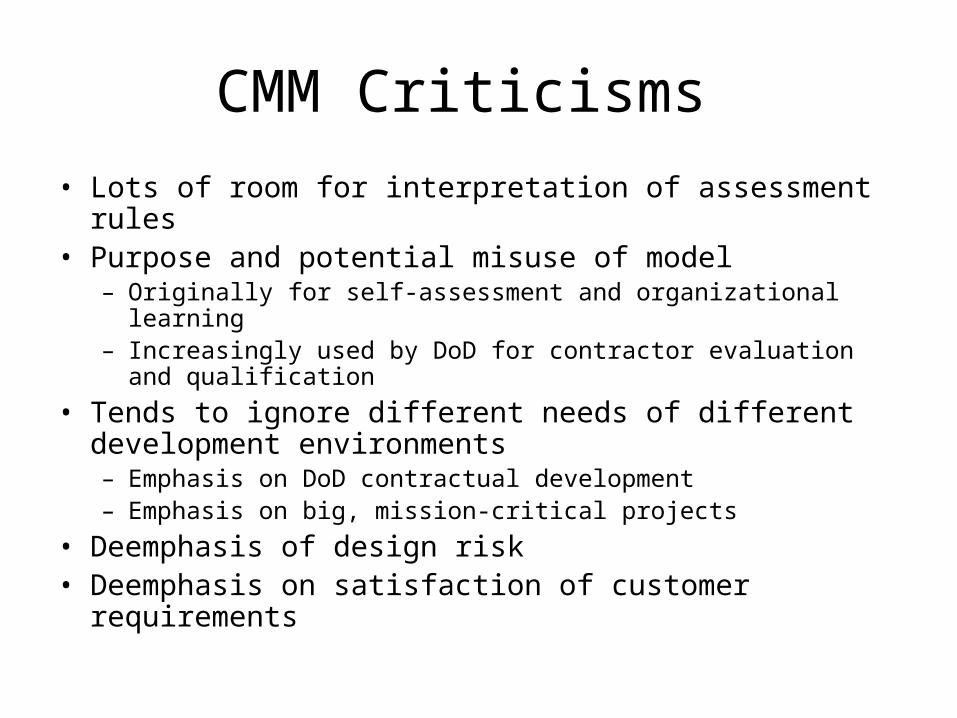
CMM Criticisms
• Lots of room for interpretation of assessment rules • Purpose and potential misuse of model
– Originally for self-assessment and organizational learning – Increasingly used by DoD for contractor evaluation and
qualification
• Tends to ignore different needs of different development environments – Emphasis on DoD contractual development – Emphasis on big, mission-critical projects
• Deemphasis of design risk • Deemphasis on satisfaction of customer requirements
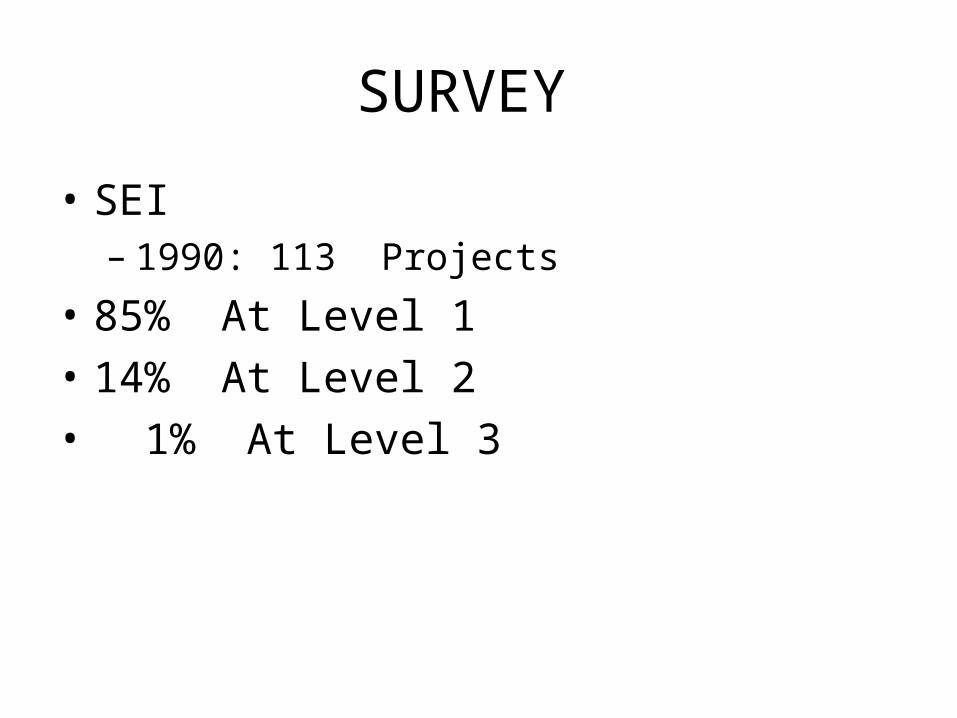
SURVEY
• SEI – 1990: 113 Projects
• 85% At Level 1
• 14% At Level 2
• 1% At Level 3
Process Improvement

Process Mistakes(McConnell)
• Overly optimistic schedules
• Insufficient risk management
• Contractor failure
• Insufficient planning
• Abandonment of planning under pressure
• Wasted time during fuzzy front end
• Short-changed upstream activities

More Process Mistakes
• Inadequate design
• Short changes quality assurance
• Insufficient management controls
• Premature or overly frequent convergence
• Omitting necessary tasks from estimates
• Planning to catch up later
• "Code-like-hell" programming
McConnell Fixes
• Identify and fix classical mistakes • Miniature milestones • Milestone-based schedule • Track schedule meticulously • Record reasons for missed milestones • Recalibrate early and often • Don't commit to a new schedule until you can do
so meaningfully Manage risks painstakingly

Process Improvement(Shewart Cycle)
• Plan– What and why?
• Do– How, when, and how much?
• Check– How will you know it worked?
• Act– How do you plan to fully adopt?
Act Plan
Check Do
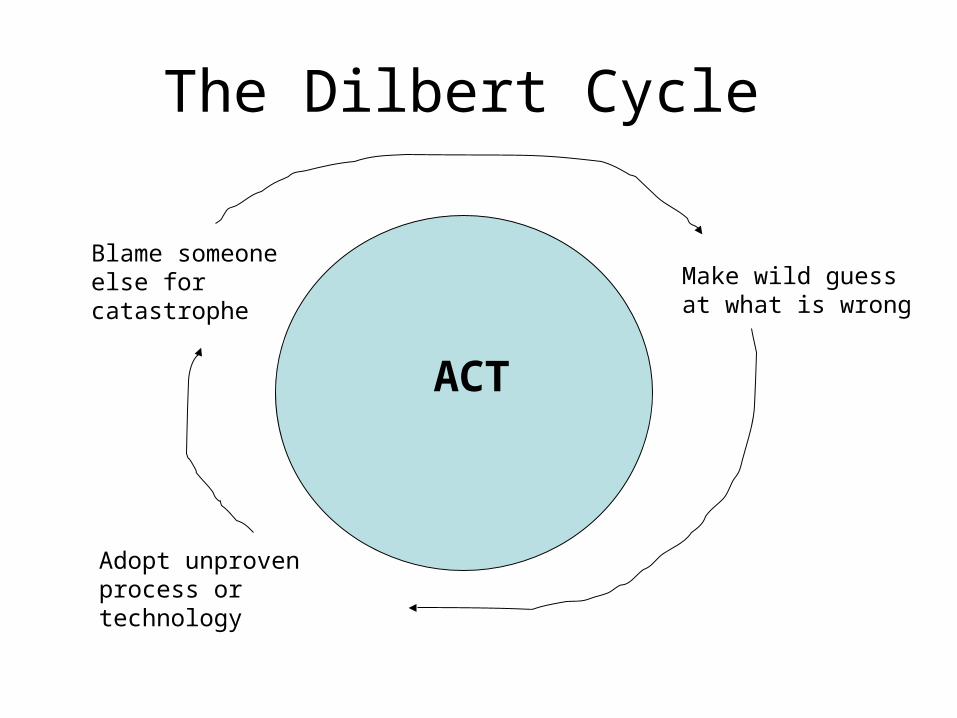
The Dilbert Cycle
ACT
Blame someone else for catastrophe
Adopt unproven process or technology
Make wild guess at what is wrong
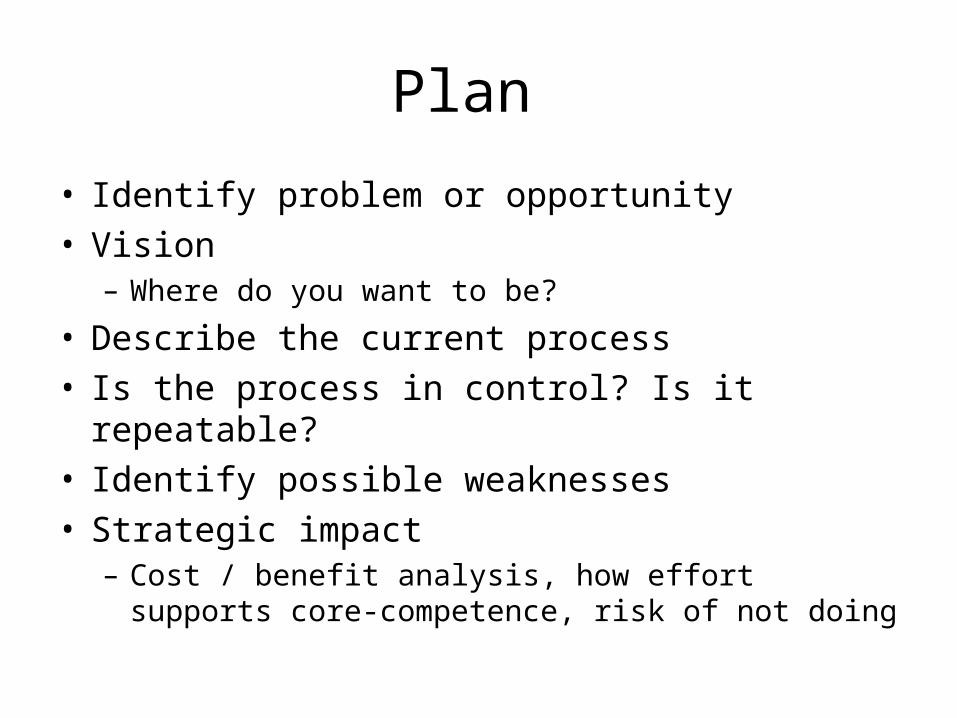
Plan
• Identify problem or opportunity • Vision
– Where do you want to be?
• Describe the current process • Is the process in control? Is it repeatable? • Identify possible weaknesses • Strategic impact
– Cost / benefit analysis, how effort supports core-competence, risk of not doing
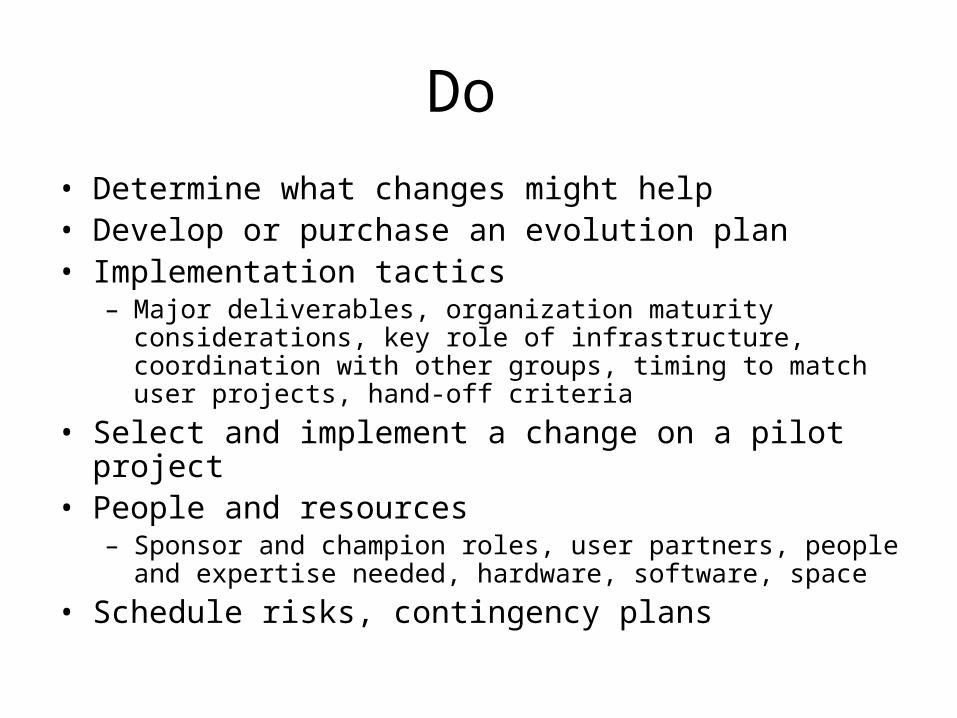
Do
• Determine what changes might help • Develop or purchase an evolution plan • Implementation tactics
– Major deliverables, organization maturity considerations, key role of infrastructure, coordination with other groups, timing to match user projects, hand-off criteria
• Select and implement a change on a pilot project • People and resources
– Sponsor and champion roles, user partners, people and expertise needed, hardware, software, space
• Schedule risks, contingency plans
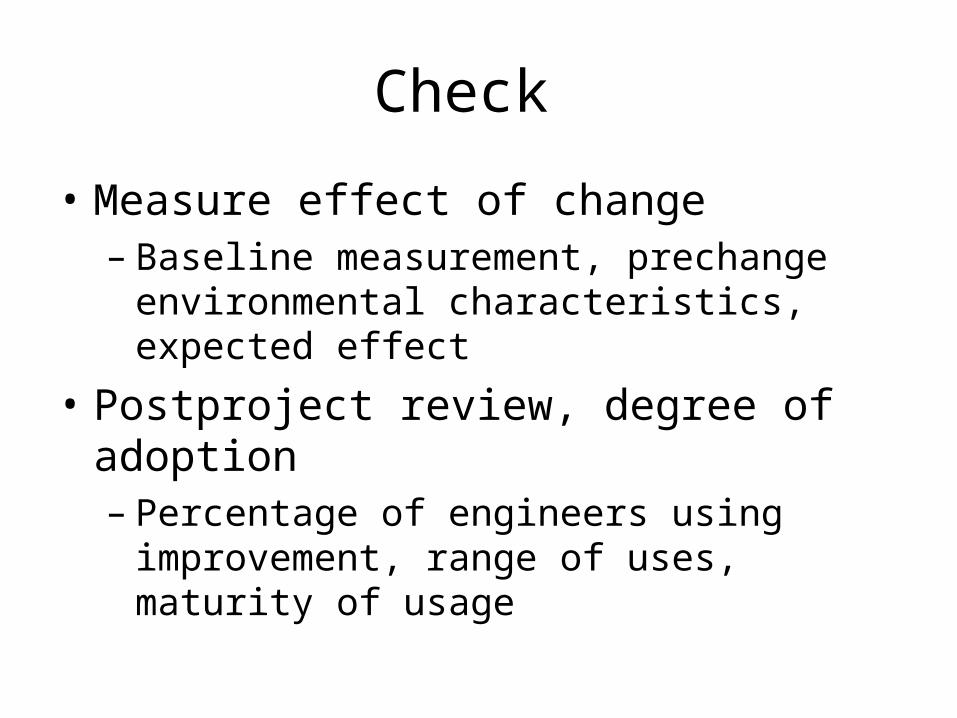
Check
• Measure effect of change – Baseline measurement, prechange
environmental characteristics, expected effect
• Postproject review, degree of adoption – Percentage of engineers using improvement,
range of uses, maturity of usage
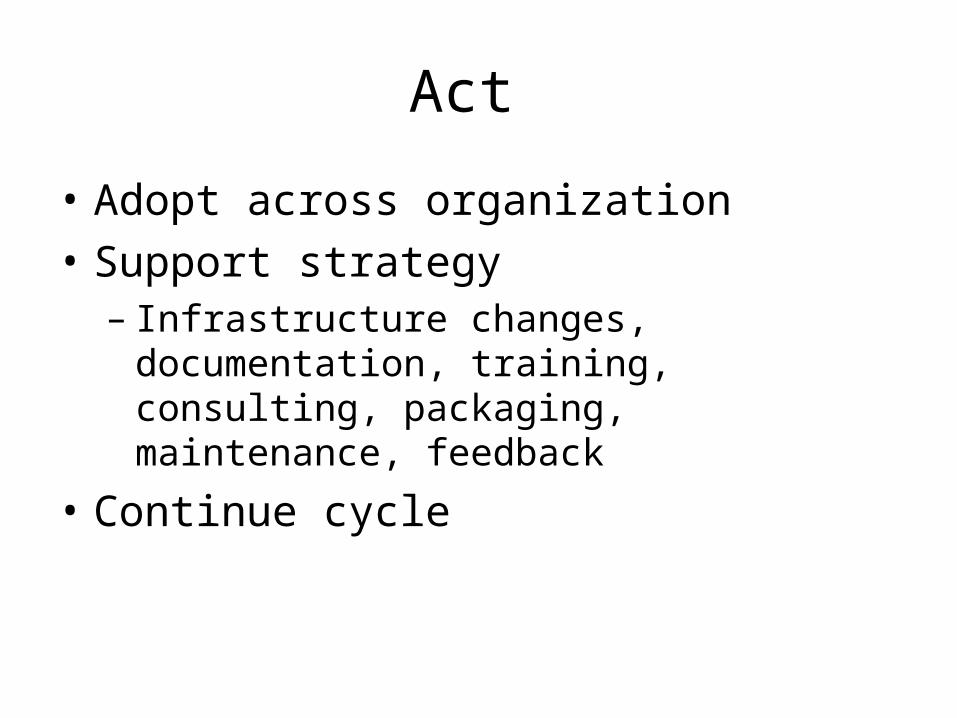
Act
• Adopt across organization
• Support strategy – Infrastructure changes, documentation,
training, consulting, packaging, maintenance, feedback
• Continue cycle
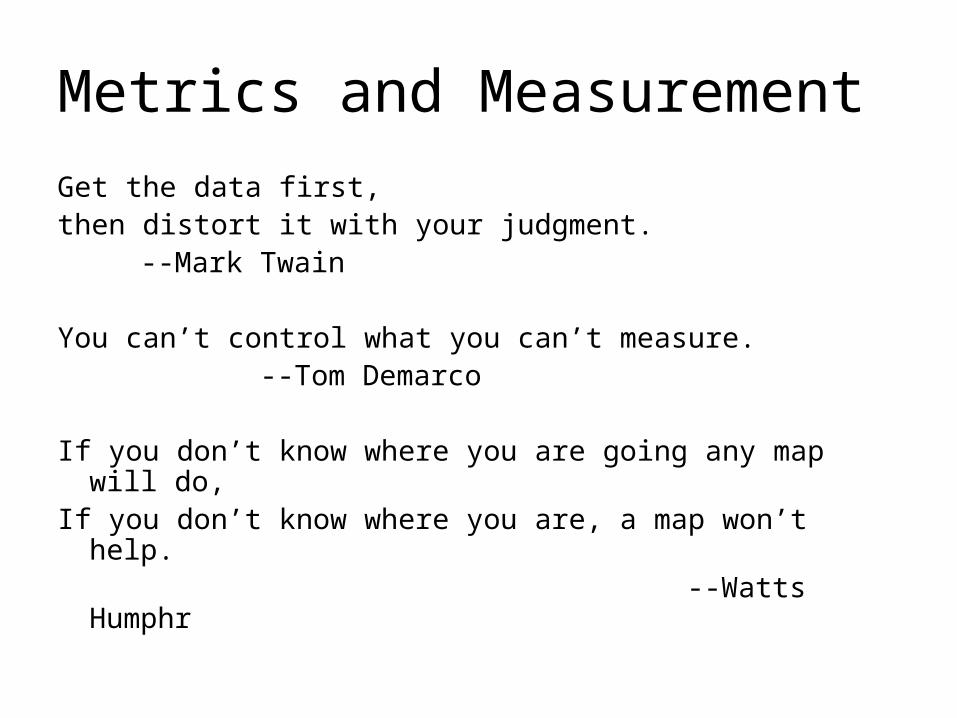
Metrics and Measurement
Get the data first, then distort it with your judgment.
--Mark Twain
You can’t control what you can’t measure. --Tom Demarco
If you don’t know where you are going any map will do, If you don’t know where you are, a map won’t help.
--Watts Humphr
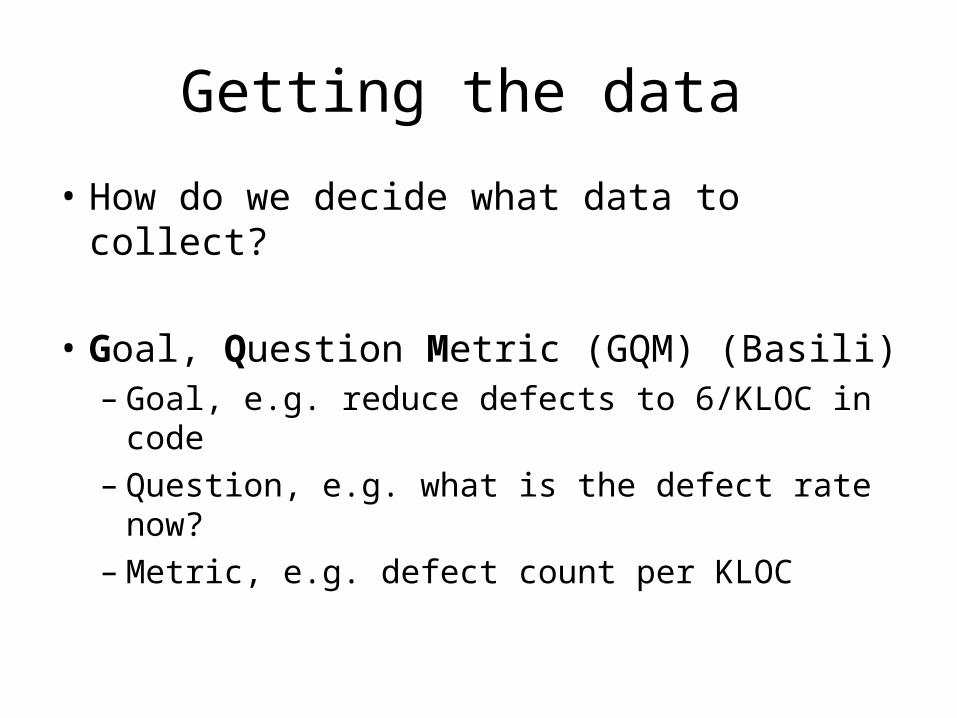
Getting the data
• How do we decide what data to collect?
• Goal, Question Metric (GQM) (Basili) – Goal, e.g. reduce defects to 6/KLOC in code – Question, e.g. what is the defect rate now? – Metric, e.g. defect count per KLOC
Key Metrics
• Lines of code
• Staff months
• Calendar months
• Defects
Defect Analysis
• Origin (where) – Requirements / specification, design, code,
environment support, documentation
• Type (what)
• Mode (why) – Missing, unclear, wrong, changed, better way

Defect Types
• Requirement / analysis: functionality • Specification / design: HW / SW / User
interfaces, functional description • Design: Communication, data definition, module
design, logic description, error checking, standards
• Code: Logic, computation, data handling, module interface implementation, standards
• Environment: Test SW, Test HW, development tools, integration SW
Root Cause Analysis
• Determination of the underlying process deficiency that causes a class of product defects – Collect defect data – Determine causes – Organizational buy-in (tie to business goals) – Assign responsibility
• Variations – One-shot, postproject, continuous
One-Shot Root Cause Analysis(Requires prior defect data collection but no
prior causal analysis)
• Train on defect analysis; indicate goals • Select 50-75 defects randomly • Classify; pie chart • Pick top two defect types; fishbone diagram • Improvement recommendations • Present results; assign responsibility; implement
change
Postproject Root Cause Analysis
(Prior understanding of defect patterns)
• Premeeting – Identify primary business goal – Data analysis (champion and facilitator) – Select two defect types for brainstorming
• Invitations to engineers • Bring examples of their faults (in selected
categories) • Guess at root cause • Suggested prevention mechanism
Meeting
• State meeting goal and rules • Select issues • Review defects/causes/solutions brought
to meetings Analyze defects (fishbone diagram)
• Brainstorm solutions • Assure organizational commitment • Plan for change (responsibilities and
dates)
Postmeeting
• Champion and facilitator review meeting – Prepare meeting summary
• Champion captures process baseline data – Before and after process description and data
Fishbone Diagram(Cause and Effect Diagram)
• Write suggested causes of a class of defects on note cards
• Organize into affinity groups
• Use lines to indicate "is a cause of" or "is a prerequisite of"
• Spine is major defect class
• Major branches are affinity groups
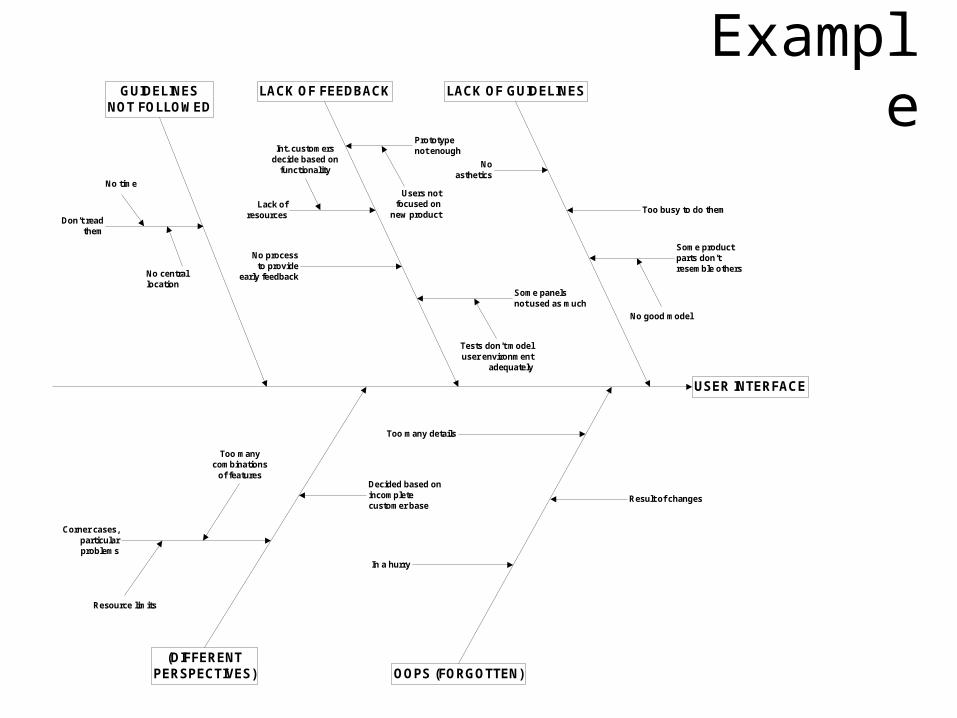
Example
USER INTERFACE
LACK OF FEEDBACK LACK OF GUIDELINES
(DIFFERENTPERSPECTIVES) OOPS (FORGOTTEN)
GUIDELINESNOT FOLLOWED
Too busy to do them
Some productparts don’tresemble others
Noasthetics
No good model
Prototypenot enough
Users notfocused on
new product
Some panelsnot used as much
Tests don’t modeluser environment
adequately
No processto provide
early feedback
Lack ofresources
Int. customersdecide based on
functionality
Result of changes
Too many details
In a hurry
Decided based onincompletecustomer base
Corner cases,particularproblems
Resource limits
Too manycombinations
of features
Don’t readthem
No time
No centrallocation
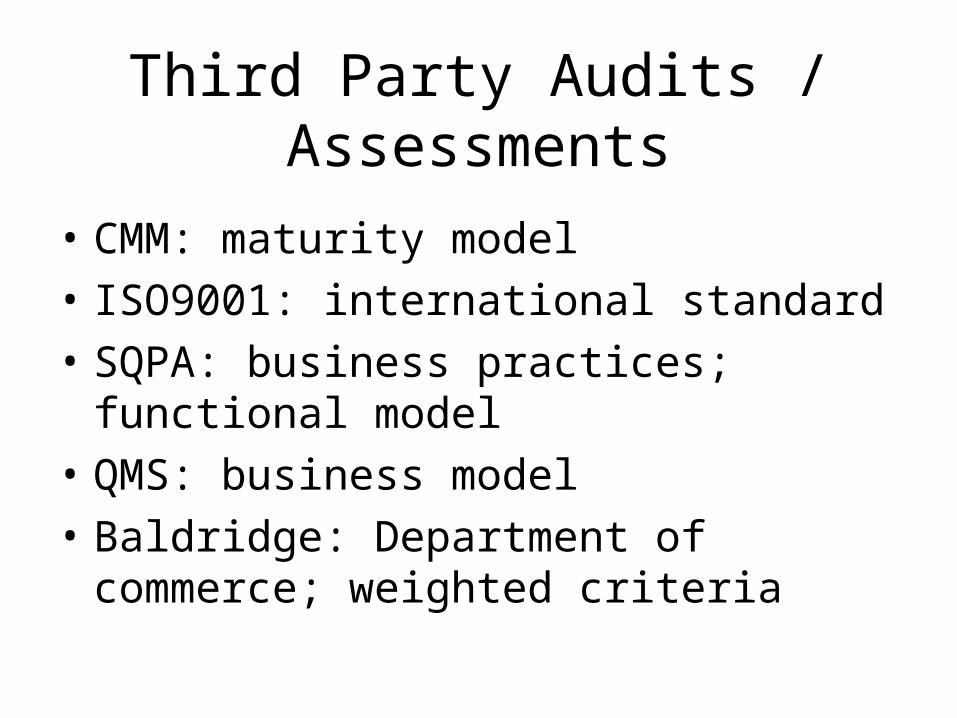
Third Party Audits / Assessments
• CMM: maturity model
• ISO9001: international standard
• SQPA: business practices; functional model
• QMS: business model
• Baldridge: Department of commerce; weighted criteria
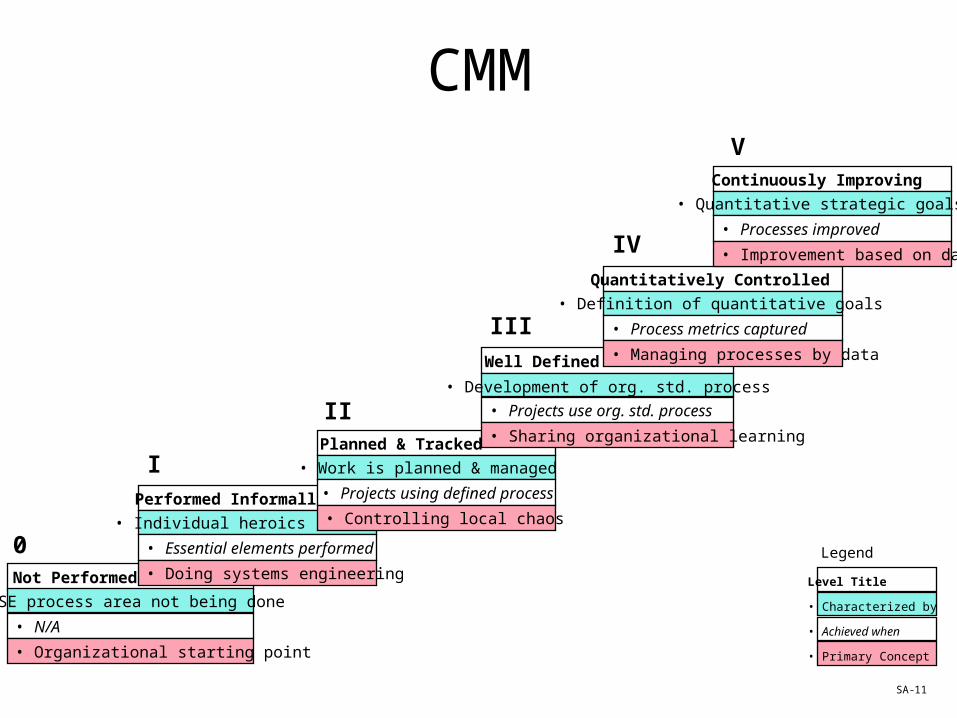
CMM
Legend:
Level Title
• Characterized by
• Achieved when
• Primary Concept
• N/A
• Organizational starting point
Not Performed
• SE process area not being done
• Essential elements performed
• Doing systems engineering
Performed Informally
• Individual heroics
• Projects using defined process
• Controlling local chaos
Planned & Tracked
• Work is planned & managed
• Projects use org. std. process
• Sharing organizational learning
Well Defined
• Development of org. std. process
• Process metrics captured
• Managing processes by data
Quantitatively Controlled
• Definition of quantitative goals
• Processes improved
• Improvement based on data
Continuously Improving
• Quantitative strategic goals
0
I
II
III
IV
V
11SA-
ISO 9000 Series• Actually a series of specifications that allow companies
to be “certified” • Doesn’t focus on improvement—just current state • Addresses minimum criteria for a quality system • Strongly paper-trail oriented • Checklist assessment • Generic—not software specific • Principle: Every important process should be
documented
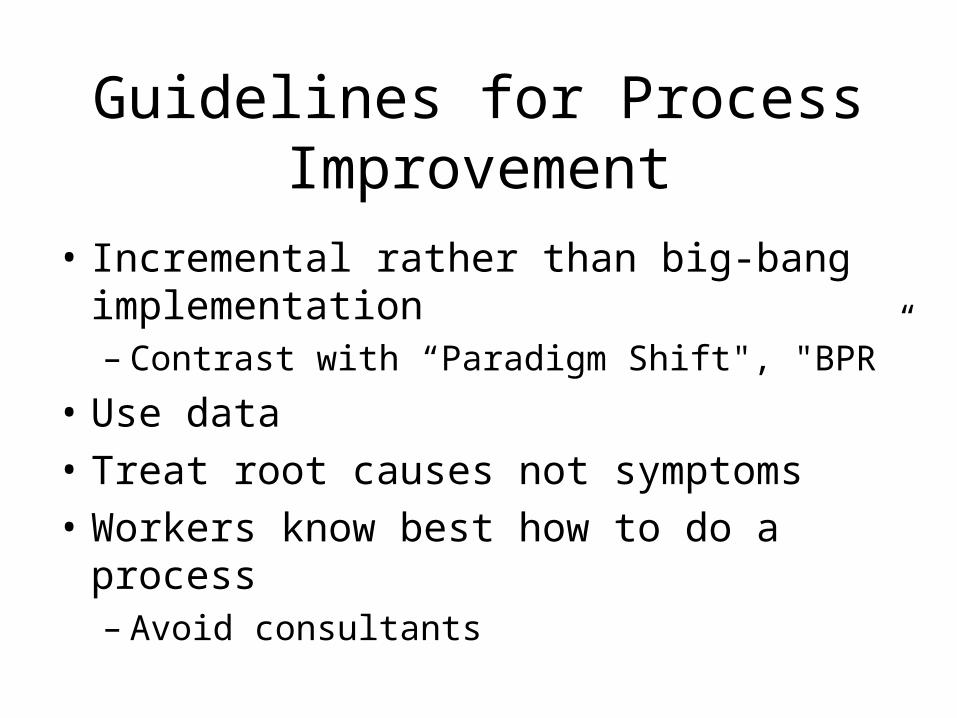
Guidelines for Process Improvement
• Incremental rather than big-bang implementation – Contrast with “Paradigm Shift", "BPR”
• Use data
• Treat root causes not symptoms
• Workers know best how to do a process – Avoid consultants
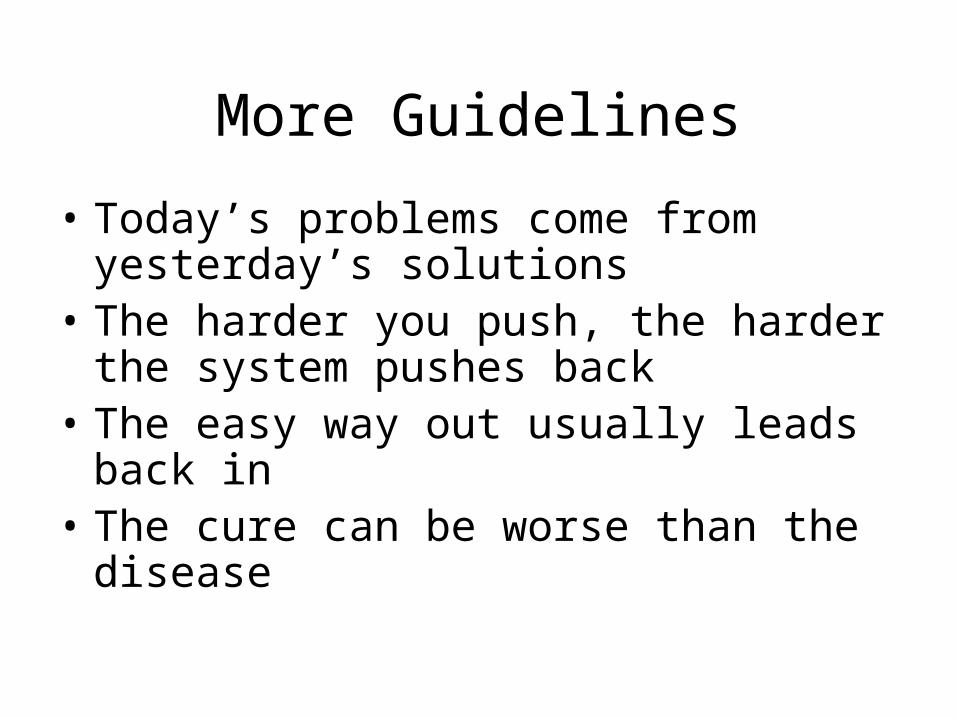
More Guidelines
• Today’s problems come from yesterday’s solutions
• The harder you push, the harder the system pushes back
• The easy way out usually leads back in • The cure can be worse than the disease
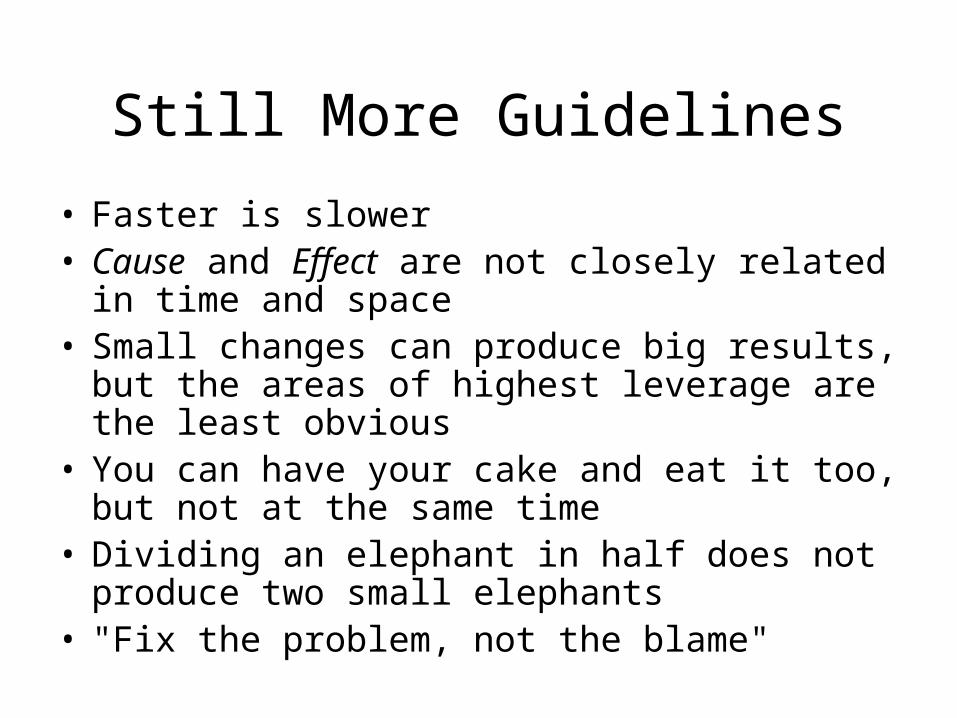
Still More Guidelines
• Faster is slower • Cause and Effect are not closely related in time
and space • Small changes can produce big results, but the
areas of highest leverage are the least obvious • You can have your cake and eat it too, but not at
the same time • Dividing an elephant in half does not produce
two small elephants • "Fix the problem, not the blame"