Business Process Management Value Map - essay.utwente.nl Rick Leunissen v1.3.pdf · business...
88
1 Business Process Management Value Map Rick Leunissen Student Master Business Information Technology University of Twente Student number: s0086231
Transcript of Business Process Management Value Map - essay.utwente.nl Rick Leunissen v1.3.pdf · business...

1
Business Process Management Value Map
Rick Leunissen
Student Master Business Information Technology
University of Twente
Student number: s0086231

2
Master thesis Name: Rick Leunissen Student number: s0086231 Tel: 06-83339467 Mail: [email protected]
Graduation committee Supervisors
Name: Dr. Luís Ferreira Pires University of Twente Tel: 053 489 3843 Mail: [email protected]
Name: Dr. Maria-Eugenia Iacob University of Twente Tel: 053 489 4134 Mail: [email protected]
Name: Edward van Meeuwen Deloitte Consulting Tel: 06 20 25 23 73 Mail: [email protected]

3
Preface
This thesis marks the end of my studies at the Twente University where I have studied for the past
years. A period that was highly educational, very enjoyable and extremely interesting. During my
thesis I had the pleasure to sink my teeth into the world of Business Process Management, a world
where I will also continue my further career. I have been guided, supported and motivated by
several people who I would sincerely like to thank.
First of all I would like to thank my supervisors at Twente University, Luís Ferreira Pires and Maria-
Eugenia Iacob. They have supported me through the entire thesis process, providing me with their
insights and guiding me in the right direction.
I have carried out my research at Deloitte Consulting. I would like to thank Edward van Meeuwen for
his support, feedback and insights. We have had several discussions helping me to structure my
thesis, guided me in the right direction and fill in the details. I would also like to thank all the
colleague´s at Deloitte who have always been available for questions, feedback and discussion.
Apart from my direct supervisors I also want to thank my family and friends for their support. Special
thanks go out to my parents who have supported me throughout my entire student life and thesis in
particular.
Rick Leunissen
4
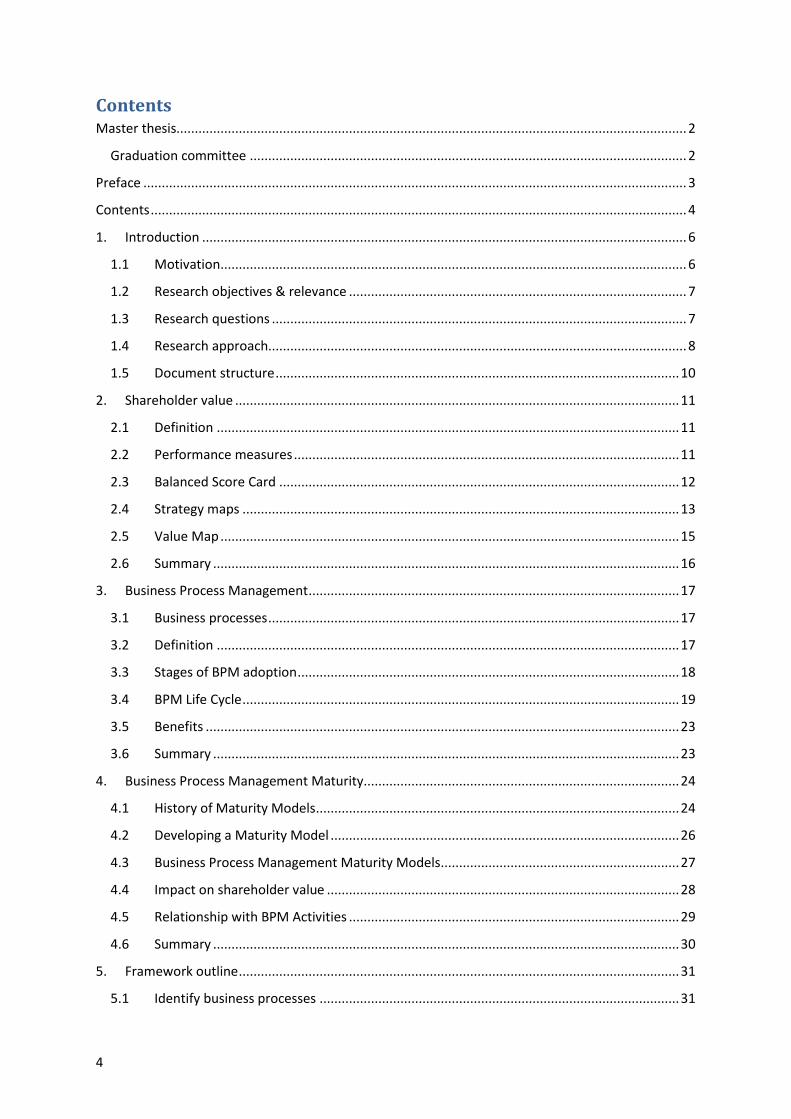
Contents Master thesis........................................................................................................................................... 2
Graduation committee ....................................................................................................................... 2
Preface .................................................................................................................................................... 3
Contents .................................................................................................................................................. 4
1. Introduction .................................................................................................................................... 6
1.1 Motivation ............................................................................................................................... 6
1.2 Research objectives & relevance ............................................................................................ 7
1.3 Research questions ................................................................................................................. 7
1.4 Research approach.................................................................................................................. 8
1.5 Document structure .............................................................................................................. 10
2. Shareholder value ......................................................................................................................... 11
2.1 Definition .............................................................................................................................. 11
2.2 Performance measures ......................................................................................................... 11
2.3 Balanced Score Card ............................................................................................................. 12
2.4 Strategy maps ....................................................................................................................... 13
2.5 Value Map ............................................................................................................................. 15
2.6 Summary ............................................................................................................................... 16
3. Business Process Management ..................................................................................................... 17
3.1 Business processes ................................................................................................................ 17
3.2 Definition .............................................................................................................................. 17
3.3 Stages of BPM adoption ........................................................................................................ 18
3.4 BPM Life Cycle ....................................................................................................................... 19
3.5 Benefits ................................................................................................................................. 23
3.6 Summary ............................................................................................................................... 23
4. Business Process Management Maturity...................................................................................... 24
4.1 History of Maturity Models ................................................................................................... 24
4.2 Developing a Maturity Model ............................................................................................... 26
4.3 Business Process Management Maturity Models ................................................................. 27
4.4 Impact on shareholder value ................................................................................................ 28
4.5 Relationship with BPM Activities .......................................................................................... 29
4.6 Summary ............................................................................................................................... 30
5. Framework outline ........................................................................................................................ 31
5.1 Identify business processes .................................................................................................. 31

5
5.2 Identify possible BPM opportunities .................................................................................... 31
5.3 Relate business processes to shareholder value .................................................................. 32
5.4 Relate business processes to organizational capability ........................................................ 37
5.5 Summary ............................................................................................................................... 39
6. Reference framework ................................................................................................................... 40
6.1 Reference value drivers ........................................................................................................ 40
6.2 Reference business processes .............................................................................................. 45
6.3 Relationship improvement levers and business processes .................................................. 46
6.4 Reference framework ........................................................................................................... 47
6.5 Summary ............................................................................................................................... 47
7. Application of the framework ....................................................................................................... 48
7.1 Example organization ............................................................................................................ 48
7.2 Adapt value map to business context ................................................................................... 49
7.3 Identify and relate business processes ................................................................................. 51
7.4 Analyze business process management maturity................................................................. 52
7.5 Identify possible improvement actions ................................................................................ 53
7.6 Develop business case for improvement actions ................................................................. 55
7.7 Map improvement actions .................................................................................................... 57
7.8 Prioritize improvement actions ............................................................................................ 58
7.9 Summary ............................................................................................................................... 59
8. Validation of the framework ......................................................................................................... 60
8.1 Validation interviews ............................................................................................................ 60
8.2 Case study ............................................................................................................................. 67
8.3 Findings Validation ................................................................................................................ 77
9. Conclusion ..................................................................................................................................... 78
9.1 Answers to the research questions....................................................................................... 78
9.2 Limitations............................................................................................................................. 81
9.3 Further research ................................................................................................................... 81
References ............................................................................................................................................ 83
Glossary ................................................................................................................................................. 86
List of figures ......................................................................................................................................... 86
Appendices ............................................................................................................................................ 88
Appendix A: Enterprise Value Map base .......................................................................................... 88

6
1. Introduction This chapter presents the motivation, objectives, relevance and research approach of this thesis.
This chapter is structured as follows:
Section 1.1 presents the motivation of this thesis
Section 1.2 presents the objective and relevance of this thesis
Section 1.3 presents the research questions of this thesis
Section 1.4 presents the research approach of this thesis
Section 1.5 presents the document structure
1.1 Motivation The main objective of most organizations is to maximize their shareholder value over time
(McTaggart, Kontes, & Mankins, 1994).To achieve this objective organizations are engaged in
assessing ways in which their processes can be improved (Elzinga, Horak, lee, & Bruner, 1995). For
six years in a row Gartner identifies the improvement of business processes as the most important
issue for CIO’s and Business Process Management (BPM) is the latest thinking on how to best
achieve improving business processes (Michele Cantara, 2010).
To optimize the shareholder value through process optimization, organizations adopt BPM as a
holistic approach. The typical adoption process starts with the awareness of organizations that BPM
can improve shareholder value and their desire to adopt BPM to improve their shareholder value.
After some individual projects have proven the success of BPM, organizations capture the BPM
projects in a more centralized BPM program (Rosemann, 2008).
Instead of streamlining one process and unknowingly sub optimizing others, organizations are
looking for a way to structure and prioritize their BPM projects to relate their BPM activities in a
BPM roadmap. This process is also known as BPM portfolio management. In this portfolio
management process the challenge is to provide a consolidating view of the complete business
process landscape of the organization (Rosemann, Process Portfolio Management, 2006). By relating
the BPM life cycle to the business process landscape organizations can identify possible BPM
improvement opportunities.
To discuss and prioritize these BPM improvement opportunities, organizations position the
opportunities in a portfolio with two dimensions. The first dimension is the impact the BPM
improvement opportunity has on shareholder value. The second dimension is the capability of the
organization to achieve the BPM improvement opportunity (Rosemann, 2008). The capability of an
organization to achieve a BPM improvement opportunity can be related to the BPM Maturity of the
organization. (Lee, Lee, & Kang, 2007). However this method doesn’t provide the consolidated view
of the BPM improvement opportunities and does not take the relationships between these
opportunities into account.
This can be solved by applying a framework that contains all possible BPM improvement
opportunities and directly relates them to shareholder value and organizational capability. Such a
framework would help organizations to identify, discuss and prioritize all possible BPM improvement
opportunities to develop their BPM Roadmap.

7
1.2 Research objectives & relevance The main objective of this thesis is “to develop a framework to identify, discuss and prioritize possible
BPM improvement opportunities related to shareholder value and organizational capability to
support organizations in their BPM portfolio management process” . This framework is based on
relevant literature in the field of shareholder value, BPM and BPM maturity models.
The scientific relevance of this thesis entails the proposed framework for identifying, discussing and
prioritizing possible BPM activities based on organizational capability and shareholder value. As
described in the motivation there is no scientific method that consolidates all possible BPM
improvement opportunities related to shareholder value and organizational capability. This thesis
provided such a scientific method and established a starting point for further research.
The thesis is relevant in practice as it helps organizations in their BPM portfolio management process
by providing a tool to identify, discuss and prioritize their possible BPM improvement opportunities.
This results in a better BPM roadmap and improves the value creation of the organization.
Scientist, practitioners and vendors have no common body of language (Olding, 2007) and this also
reflects in the way organizations apply BPM (Elzinga, Horak, lee, & Bruner, 1995). Relating the BPM
theory and application of BPM to BPM improvement opportunities organizations helps organizations
to better understand BPM. By relating the same BPM theory to shareholder value and organizational
capability the framework also helps in becoming more aware of the potential benefits of BPM.
1.3 Research questions To reach the objective of the thesis the following research question is answered:
How can organizations identify, discuss and prioritize all possible BPM opportunities in a single
framework based on shareholder value and organizational capability?
The research question is divided into the following sub-questions:
Q1: What is shareholder value?
Q2: What is Business Process Management?
Q3: What is Business Process Management Maturity?
Q4: How can we relate Business Process Management, Business Process Management Maturity and
shareholder value in a framework?
Q5: How can we populate the framework?
Q6: How can organizations apply the framework in practice?
Q7: How can we validate the framework?

8
1.4 Research approach The approach used in this research is shown in Figure 1. The research approach is based on the
design science framework for IS research (Hevner, March, Park, & Ram, 2004) which uses both input
from the knowledge base (green blocks) and the business environment (blue blocks) of the research
field. The research approach describes how the research questions and sub-questions are answered.
Figure 1: Research approach
Q1: “What is shareholder value?” is answered by performing a literature study on shareholder value.
Based on the literature a definition of shareholder value and a method to measure shareholder
value is presented.
Q2: “What is Business Process Management?” is answered by performing a literature study on
Business Process Management. Based on the literature study the history, definition and application
of BPM is presented.
Q3: “What is Business Process Management Maturity?” is answered by performing a literature study
on Business Process Management Maturity. Based on the literature study the history of maturity and
business process maturity model is presented and a number of business process management
maturity models are compared to select an appropriate maturity model.
Q4:” How can we relate Business Process Management, Business Process Management Maturity and
shareholder value in a framework?” is answered by relating the findings of the literature studies in
the first three sub-questions. This relation resulted in a framework outline that relates shareholder
value, BPM and BPM maturity.
Q5: “How can we populate the framework” is answered by applying a reference business process
model from the business environment to the framework outline and performing expert interviews to
relate business processes to the BPM life cycle. Experts for the interviews are selected on their BPM
and/or process expertise.
Q6: “How can organizations apply the framework in practice? “is answered by performing expert
interviews. Based on the framework and the expert interviews a methodology to use the framework
is described.

9
Q7: “How can we validate the framework” is answered by performing a case study at an
organization. The goal of the case study is to validate the applicability of the framework in practice.
Finally the research question is answered by concluding the findings of this thesis.

10
1.5 Document structure This report is further structured as follows:
Chapter 2 (Shareholder value) answers the first research question by giving a definition of
shareholder value and value drivers
Chapter 3 (Business Process Management) answers the second research questions by giving a
definition of BPM and an overview of BPM activities
Chapter 4 (Business Process Management Maturity) answers the third research question by giving a
definition of BPMM and describing relationship between BPMM and BPM activities
Chapter 5 (Framework outline) answers the fourth research question by defining the outlines of the
framework used to relate shareholder value and BPM activities
Chapter 6 (Populated framework) answers the fifth research question by populating the framework
Chapter 7 (Application of the framework), answers the sixth research question by describing how the
framework can be applied in practice
Chapter 8 (Validation of the framework), answers the seventh research question by validating the
framework
Chapter 9 (Conclusion) answers the research question by evaluating the results of the thesis. This
chapter also gives suggestions for further research.

11
2. Shareholder value This chapter presents a definition of shareholder value, discusses different generations of
performance measures used to balance short- and long term investment and describes a
methodology to relate improvement actions directly to shareholder value.
This chapter is structured as follows:
Section 2.1 presents a definition of shareholder value
Section 2.2 presents performance measures
Section 2.3 presents the balanced score card
Section 2.4 presents the strategy map
Section 2.5 presents the value map
Section 2.6 summarizes the chapter
2.1 Definition After the market exuberance of the dotcom bubble in the late 90’s, the burst brought a renewed
interest in the concept of shareholder value. Since then, all kinds of companies have been publicly
proclaiming their commitment to increasing long-term value for their stakeholders. The philosophy
of managing for shareholder value is also knows as value-based management (VBM). Like other
management concepts, VBM has been adapted by companies to suit their circumstances and there
is no best practice model (Starovic, Cooper, & Davis, 2004).
McTaggart defines VBM as “a formal systematic approach to managing companies to achieve the
objective of maximizing value creation and shareholder value over time” (McTaggart, Kontes, &
Mankins, 1994).
A measure for Shareholder Value from an investor’s perspective is the Total Shareholder Return
(TSR). TSR can be calculated as followed, TSR = ((Share Price EndofPeriod - Share Price
BeginOfPeriod) + Dividents) / Share Price BeginOfPeriod).
Creating shareholder value is not about applying a set of tools or processes but about creating
competitive advantage as part of an organizations strategy. Understanding value drivers and their
interactions is one of the difficulties of developing strategy. A management survey found that 69% of
executives reported that they had attempted to demonstrate empirical cause-effect relations
between the different categories of value drivers and value creation and future financial results.
However less than one third felt they had successfully completed this task (DiPiazza & Eccles, 2002).
To optimize shareholder value organizations apply performance measures to balance short and long-
term investments. (Kaplan & Norton, 1996).
2.2 Performance measures Organizations use performance measures to assess their business performance. Performance can be
referred to as “A general term applied to part or all of the conduct or activities of an organization
over a period of time, often with a reference to some standard such as past or project costs, an
efficiency base, management responsibility or accountability, or the like” (Kohler, 1985).
Performance is measured based on efficiency and effectiveness. Efficiency means “doing things
right” and refers to the ability to get things done in the right manner. Effectiveness means “doing
the right things” (Drucker, 1981).

12
Traditional performance measures focus entirely on cost efficiency and effectiveness. Examples of
such measures are the Earning per Share (EPS), Return on Capital employed (ROCE), return on net
worth, net profit margin etc. The concept of Shareholder Value has changed the performance
appraisal criteria of organizations from cost efficiency and effectiveness to new value based
performance measures. These new performance measures measure both tangible and intangible
value. Examples of new performance measures are Market value Added, Economic Value Added,
Cash Value Added, Total Quality management and the Balanced Score Card (BSC) (Agarwal &
Agarwal, 2003). The main difference between traditional performance measures and value based
performance measures is that traditional performance measures focus on short-term performance
whereas value based performance also take long-term performance into account.
As the BSC not only balances financial and non-financial measures but also links performance to
rewards and gives recognition to the diversity of organizational goals, it also links performance to
the organizations strategy.
2.3 Balanced Score Card The balanced score card is “an approach which provides information to the management and assist
them in formulation of organization’s mission and strategy” (Arveson, 1998). The purpose of a BSC is
to provide the management with information which reveals all relevant areas of performance in an
objective and unbiased way. It assists organizations to assess overall performance, improve
operational processes and enable organizations to formulate plans for improvement.
The BSC generally has four perspectives to measure an organizations performance. These four
perspectives are (Agarwal & Agarwal, 2003) (Kaplan & Norton, 1996).
1. Customer perspective
This perspective focuses on customer satisfaction and the customer perspective of the organization
2. Internal business perspective
This perspective focuses on the key internal processes driving the organization
3. Learning and growth perspective
This perspective focuses on the potential future improvements
4. Financial perspective
This perspective focuses on the result the organization delivers to its stakeholders
The balanced scorecard relies on four processes to bind short-term activities to long-term objectives,
as depicted in Figure 2:
1. Translating the vision
2. Communicating and linking
3. Business planning
4. Feedback and learning

13
Figure 2: Four processes of the Balanced Score Card
2.4 Strategy maps To facilitate discussion among executives, the creators of the BSC have created a general
representation of the four perspectives in a so-called strategy map. This is a visual representation of
the linked components of an organization’s strategy and can serve as a checklist. If an organizations
strategy is missing a perspective it is likely its strategy is flawed. The BSC strategy map is shown in
Figure 3.
Figure 3: Balanced Score Card strategy map

14
The BSC strategy map is based on five principles: 1. Strategy balances contradictory forces
The starting point in describing the strategy is to balance the short-term financial objectives for cost
reduction and long-term objectives for profitable growth.
2. Strategy is based on differentiated customer value proposition The value proposition is the most important dimension in strategy as it is essential to attract and
retain customers.
3. Value is created through internal business processes Processes drive the strategy as they describe how the organization will implement the strategy.
Effective and aligned processes determine how value is created. The BSC identifies internal
processes into four clusters:
I. Operations management
II. Customer management
III. Innovation
IV. Regulatory and social
4. Strategy consists of simultaneous complementary themes By enhancing processes in all the four clusters organizations realise sustainable growth
5. Strategic alignment determines the value of intangible assets The fourth perspective of the BSC strategy map, learning and growth, describes the intangible assets
of an organisation. The BSC distinguishes three categories:
I. Human capital
II. Information capital
III. Organizational capital
The strategy map framework enables human, information and organizational capital to be
represented as assets that eventually get converted into cash through higher sales and lower
spending.

15
2.5 Value Map The Enterprise Value Map (EVM) is a tool developed by Deloitte Consulting, based on the strategy
map, which enables organizations to relate shareholder value and the steps companies can take to
improve their operations. The structure of the EVM is shown in Figure 4 and contains the following
three levels:
1. Shareholder value
Shareholder value is the top of the EVM and refers to the ultimate goal of organizations to optimize
shareholder value. Shareholder value is driven by the lower-level value drivers.
2. Value drivers
Deloitte distinguishes four main value drivers that drive Shareholder value. These value drivers are
revenue growth, operating margin, asset efficiency and expectations as shown in Appendix A.
Typically this means that if three value drivers are held constant and one driver improves this will
result in increased shareholder value. However according to the first principle of strategy maps
these drivers will have substantial influence on each another and a balance should be found.
Three of the value drivers are related to the four financial perspectives of the BSC strategy map.
Revenue growth is derived from the expand revenue opportunities perspective and enhance
customer value perspective
Operating margin is derived from the improve cost structure perspective
Asset efficiency is derived from the improve asset utilization perspective
These three value drivers relate to the dividend part of the definition of shareholder value. However
shareholder value is also based on the share price, which results in a fourth value driver
“expectations”. According to the EVM expectations, which is the confidence of shareholders and
analysis in the organizations ability to perform well in the future, is the key driver for share price.
To relate the value drivers to level-lever improvement levers the value drivers are broken down into
sub-value drivers.
3. Improvement levers
Improvement levers are high level steps an organization can take to improve value driver
performance. These improvement levers are based on the customer perspective; internal process
perspective and learning and growth perspective form the strategy map. These improvement levers
have been optimized by Deloitte internal shareholder value experts, analytical framework, stock
analysts and CFO’s of Deloitte’s clients to the current framework.
The EVM enables organizations to relate shareholder value and the steps companies can take to
improve their operations. These steps are referred to as improvement actions, which are related to
the different improvement levers.

16
Figure 4: Enterprise Value Map structure
2.6 Summary After the market exuberance of the dotcom bubble in the late 90’s, the burst brought a renewed
interest in the concept of shareholder value. Since then organizations started with value based
management, which is defined as “a formal systematic approach to managing companies to achieve
the objective of maximizing value creation and shareholder value over time” (McTaggart, Kontes, &
Mankins, 1994). However, less than one third of the managers felt they had successfully related
cause-effect relations between value drivers, value creation and future results.
To optimize shareholder value organizations can apply performance measures to assess the business
performance. The first performance measures focused on cost efficiency and effectiveness. The next
generations of new performance measures also measure both tangible and intangible value. The
balanced score card does not only balance financial and non-financial measures but also links
performance to organization goals.
Based on the balanced score cards strategy maps are created to facilitate discussion among
management. This is a visual representation of the components of an organization and can serve as
a checklist. The Deloitte Enterprise Value Map, which is based on the BSC strategy map, enables
organizations to relate shareholder value and the steps companies can take to improve their
operations.

17
3. Business Process Management This chapter presents the history, definition and characteristics of business processes and Business
Process Management. After the concept of BPM is presented the chapter describes how
organizations typically apply BPM and why organizations should apply BPM.
This chapter is structured as follows:
Section 3.1 presents a definition of business processes
Section 3.2 presents a definition of BPM
Section 3.3 presents the stages of BPM adoption
Section 3.4 presents the BPM life-cycle
Section 3.5 presents the benefits of BPM
Section 3.6 summarizes the chapter
3.1 Business processes Before we can define Business Process Management it is important to agree on the term “business
process”. There is no precise and commonly agreed definition about business processes that can
ground them as a unique research area (Vergidis, 2008). This does not mean there is no common
ground on the subject.
A definition of business processes that is shared by a large number of authors and is precise enough
to work with (Gulledge & Sommer, 2002) is the definition of Armistead & Machin. They define
business process as “concept of a series of interrelated activities, crossing functional boundaries,
with specific inputs and outputs” (Armistead & Machin, 1998). This definition of business processes
is used in this research, with the notion that business processes are dynamic (Gulledge & Sommer,
2002).
3.2 Definition Despite the fact that BPM is ranked as a top priority by organizations, there is no common
understanding of BPM (Bandara, Harmon, & Rosemann, 2010) and no commonly agreed definition is
available (Vergidis, 2008). Each definition might differ from the perspective of the stakeholder, for
instance practitioners might define BPM in a different way than academics (Lusk, Paley, & Spanyi,
2005).
A high-level and common used definition of BPM is the definition of Elzinga, Horak, Lee & Bruner
(1995) who define BPM as “A systematic, structured approach to analyze, improve, control and
manage processes with the aim of improving the quality of products and services”. This definition of
BPM is used in this research, with the notion that BPM is regarded as a holistic management
discipline (Michele Cantara, 2010) and is a continuous process (Zairi, 1997).
18
3.3 Stages of BPM adoption Organizations typically go through five stages when adopting Business Process Management
(Rosemann, 2008). This section describes these five phases.
1. Awareness
An awareness of the benefits and methodologies of BPM has to occur within the organization. In
many cases the adoption of BPM fails because of a lack of a deeper understanding of BPM
(Rosemann, The Service Portfolio of a BPM Center of Excellence, 2008). Lack of awareness is one of
the biggest barriers to success (Hill, Cantara, Olding, Rosser, & Sinur, 2010).
2. Desire
The awareness and understanding of BPM has to convert to the desire to adopt BPM. An
enthusiastic business sponsor is important in this stage of adoption as investing in organizational
readiness is a success factor for adopting BPM. (Hill, Cantara, Olding, Rosser, & Sinur, 2010). As BPM
has no classical home in an organization it remains an ongoing challenge to find a business sponsor
in the organization (Rosemann, 2008).
3. Individual BPM Projects
When there is awareness individual BPM projects have to be set up, executed, and monitored that
can then be used to market and expand the BPM ideas. In this phase the organization builds up BPM
capabilities and credibility.
4. BPM program
Assuming that individual BPM projects have been successful, organizations should shift from
multiple BPM projects to a governing and more centralized BPM program. In this stage an overall
BPM methodology needs to be designed.
5. BPM portfolio
After a centralized BPM group is formed a roadmap for BPM projects is required. All services offered
by the BPM group can be positioned in a portfolio with two dimensions, demand and capability.
Demand reflects the current organizational appetite for the BPM service and capability describes the
readiness of the BPM group to provide a certain service. In such a two-dimensional portfolio there
are four possible quadrants as shown in Figure 5.

19
Figure 5: Portfolio quadrants
3.4 BPM Life Cycle Now we have characterized BPM and described the stages of BPM adoption in organization we go
into the type BPM activities an organization can perform. Regarding the definition of business
processes and BPM we have already concluded that there is no common body of knowledge (Olding,
2007) . We also see the lack of common body of knowledge in the description of BPM services.
In the BPM literature a number of common BPM activities can be identified, referred to in a different
ways. Academics refer to these activities in a so called “BPM life-cycle”. (Aalst, Hofstede, & Weske,
2003) (Harrington, 1995) (Smith & Fingar, 2003). In this research we use the BPM life-cycle as shown
in figure 6 summarizing common used BPM life-cycles. This BPM life-cycle is shown in Figure 6. To
justify this choice we compare the life cycle with the life cycles of Aalst, Hofstede & Weske and
Smith & Fingar (Aalst, Hofstede, & Weske, 2003) (Smith & Fingar, 2003). After this justification we go
into the six phases described in the BPM life cycle.
Figure 6: BPM Life Cycle

20
The BPM life cycle of Aalst et al describes the various phases in support of operational business
processes as shown in Figure 7 (Aalst, Hofstede, & Weske, 2003).
Figure 7: BPM Life Cycle Aalst et al.
The four phases of the life cycle by Aalst et al. can be found in the proposed life-cycle.
Diagnosis: Business Process Analysis in the proposed life-cycle
Process design: Process modeling in the proposed life-cycle
System configuration: Implementation and execution in the proposed life-cycle
Process enactment: Monitoring in the proposed life-cycle
The difference between the proposed life cycle and the life cycle by Aalst et al is that the proposed
model contains redesign explicit in the life cycle where in the life cycle of Aalst et al this is implicit in
the life cycle.
Figure 8: BPM Life Cycle Smith and Fingar
The model of Smith and Fingar (Smith & Fingar, 2003) starts with a discovery phase and then
contains a cycle with five phases as shown in Figure 8. These five phases can also be found in the
proposed lifecycle.
Diagnosis
Process Design
System configuration
Process enactment

21
Discovery: Business Process Analysis in the proposed lifecycle
Design: Process Modeling in the proposed lifecycle
Deployment: Implementation in the proposed lifecycle
Operation: Execution in the proposed lifecycle
Analysis: Monitoring in the proposed lifecycle
Optimization: Redesign in the proposed lifecycle
3.4.1 Process analysis
The goal of the business process analysis phase is to get insights in the current business processes of
an organization. These business processes can be derived from the current work patterns of
employees and existing applications supporting or executing the business processes. Deriving the
business processes from current work is usually done manually and is also known as process
mapping. Deriving business processes from existing applications can be done automatically and is
also known as process mining.
After the business processes are derived by process mapping and/or process mining the
relationships between business processes has to be identified to represent the processes in process
architecture.
3.4.2 Process modeling
Business process modes represent the way organizations conduct their business processes. A
business process model typically describes in a graphical way at least the activities, event/states and
control flow logic that constitute a business processes. A process model might also include data,
resources and other artifacts such as external stakeholders, goals, risks and performance metrics
(Indulska, Recker, Rosemann, & Green, 2009).
To ensure that a process model is unambiguous a model is described in a formal language to
guarantee that alternative interpretations are ruled out. As business models can be quite complex it
is important that all stakeholders reach consensus on the process model. Business process models
are an important instrument for analysis of current processes and design of to be processes as they
represent the way an organization conducts their business processes and create their value. Figure
9 gives an example of a process model.
Figure 9: An example Business Process Model in BPMN (Muehlen & Recker, 2008)
22
3.4.3 Process implementation
In the implementation phases the business process model is translated into an executable business
process model. Some business process model languages can automatically be translated into an
executable business process model. Other business process models should be manually translated
into an executable business process model. In the implementation phases the user interfaces are
also created. BPM aims to integrate different systems from both inside and outside the
organizational, integrated these systems is also part of the implementation phase.
3.4.4 Process execution
In the execution phase the executable business process model becomes operational by transferring
the process definition to the workflow engine. This phase does not only contain process definition
data but also context data about the environment with which the BPM system interacts. This context
data is captured and related to the specific instances of the process.
3.4.5 Process monitoring
In this phases the business processes instances are monitored to be able to give feedback on the
status specific status of a business process instance and aggregate data to get insights in the
performance of the business processes. Mostly the monitoring phase uses key performance
indicators (KPI’s) to provide insights in the business processes performance. Information on
improvement points and bottlenecks can be used in the redesign phase.
3.4.6 Process redesign
In this phase the information of the monitoring phase is used to optimize the business process en
and BPM system. Weaknesses in the process are redesigned in the process model and implemented
and executed in the BPM system.
23
3.5 Benefits The common thought behind the benefits of BPM is that better processes produce lower costs,
higher revenues, motivated employees and happier customers. There are a number of companies
that have shown quite a dramatic improvement of economic value driven by process improvement.
Even without process redesign Gartner indicates that companies can still expect operational
improvement for any process by making the process explicit (Michele Cantara, 2010).
The basic value proposition of BPM is that an organization can process more work while improving
quality and reducing the effort. The business case for BPM can be based on three main benefits
(Rudden, 2007):
1. Efficiency
The BPM solution eliminates manual data entry, reduces process cycle time and reduces manual
analysis and routing.
2. Effectiveness
The BPM solution provides better and faster exception handling, supports in the decision making
process and ensures a consistent execution of processes
3. Agility
The BPM solution provides a platform to adapt to change faster and in a more controlled fashion
and support for new business models as they require new processes.
3.6 Summary Despite the fact that BPM is ranked as a top priority by organizations there is no common
understanding of BPM. In this research BPM is defined as “A systematic, structured approach to
analyze, improve, control and manage processes with the aim of improving the quality of products
and services” (Elzinga, Horak, lee, & Bruner, 1995) with the notion that BPM is a holistic
management discipline (Michele Cantara, 2010) and a continuous process (Zairi, 1997). A business
process is defined as “concept of a series of interrelated activities, crossing functional boundaries,
with specific inputs and outputs” (Armistead & Machin, 1998) with the notion that they are dynamic.
Organizations typically adopt BPM in a five stage starting with awareness of BPM, developing the
desire to apply BPM, starting individual BPM projects, shift to a BPM and eventually develop a BPM
portfolio. The business case for BPM is based on three main benefits; efficiency, effectiveness and
agility. When applying BPM to a business processes a BPM life-cycle can be applied. The BPM Life-
cycle used in this research contains the following six steps.
1. Business process analysis
2. Process modeling
3. Implementation
4. Execution
5. Monitoring
6. Redesign

24
4. Business Process Management Maturity This chapter presents the Business Process Management Maturity model by describing the history of
the maturity model, how a maturity model is developed and comparing a number of important
BPMM models. After the introduction of the BPMM model the chapter describes the relation
between BPMM and the BPM life cycle and the impact BPMM has on value creation.
This chapter is structured as follows:
Section 4.1 presents the history of Maturity Models
Section 4.2 presents how Maturity Models are developed
Section 4.3 presents a comparison of BPMM models
Section 4.4 presents the impact BPMM has on value creation
Section 4.5 presents the relationship between BPMM and the BPM Life cycle
Section 4.6 summarizes the chapter
4.1 History of Maturity Models Organizations are continually facing pressure to gain and retain competitive advantage. Therefore
identifying ways of cutting costs, improving quality, reducing time to market and so on have become
increasingly important. Maturity models have been developed to assist organizations in these goals
by assessing the organizations maturity of a selected domain based on a set of criteria. The most
popular way to represent the maturity is a five-point Likert scale (Bruin, Freeze, Kalkarni, &
Rosemann, 2005).
The concept of a maturity model has been introduced with the Capability Maturity Model (CMM) for
software from the Software Engineering Institute (SEI). The CMM provides software organizations
with guidance on how to gain control of their processes for developing and maintaining software
and how to evolve toward a culture of software engineering and management excellence (Paulk,
Paulk, Chrissis, & Weber, 1993).
According to the SEI continuous improvement is based on many, small evolutionary steps rather
than revolutionary innovations. The CMM provides a framework that organizes these steps into five
maturity levels that lay the foundation for continuous improvement. This framework defines an
ordinal scale for measuring the maturity of the software development process of an organization
and also helps an organization prioritize its improvement efforts. The five levels of software process
maturity are shown in Figure 10.

25
Figure 10: The five levels of software process maturity
In the CMM a maturity level is well-defined evolutionary stage toward achieving a more mature
software development process. Each level is decomposed into a number of key process areas an
organization should focus on to improve their software maturity. The goal of these key process areas
is to identify the issues that must be addressed to achieve the desired maturity level.Figure 11 shows
the structure of the maturity levels and key process areas.
Figure 11: Decomposition of maturity levels

26
4.2 Developing a Maturity Model Even though there are a high number of maturity assessment models in several domains there is
little documentation on how to develop such a maturity assessment model that is theoretically
sound and accepted. Bruin, Freeze, Kalkarni & Rosemann (Bruin, Freeze, Kalkarni, & Rosemann,
2005) introduce a development framework that summarizes the phases in developing a maturity
assessment model. This model is shown in Figure 12.
Figure 12: Phases in developing a maturity assessment model
1. Scope In the first phase the scope of the desired model is determined. The main criterion for determining
the scope is the focus of the model.
2. Design In the second phase the basis for the model is designed. The main criteria for the design are the
audience, the method of application, driver of application, respondents and the application. The
main aspect of this phase is to design the maturity stages of the model. In most cases these maturity
stages are similar to the CMM in Figure 10: The five levels of software process maturity.
3. Populate In the third phase the content of the model has to be established. To establish this it is necessary to
identify what needs to be measured (Key Process Area’s) in the maturity assessment and how this
can be measured (Goals). Identifying the right domain components is an essential step and can be
achieved through an extensive literature review.
4. Test In the fourth phase the model is tested for relevance and rigor. It is important to test both the
construct of the model and the instruments for validity, reliability and generalizability.
5. Deploy In the fifth phase the model must be made available for use and to verify the extent of the
generalizability of the model.
6. Maintain In the sixth phase the model has to be maintained. Evolution of a model will occurs as the domain
knowledge and model understanding broadens and deepens. To ensure the model remains relevant
it is important to continuously maintain the model.

27
4.3 Business Process Management Maturity Models A Business Process Maturity Model (BPMM) model is a maturity model designed to assess the
organizations Business Process Management maturity. There are a number of models to measure
the maturity of Business Process Management and the majority of these models are based on the
CMM described in section 4.1 (Rosemann & Bruin, 2005) (Fisher, 2004) (Smith & Fingar, 2003) (Sinur
& Hill) . However they tend to agree on the use of their BPMM models. They state organization
should use BPMM models to:
Provide a baseline for determining BPM maturity in your organization
Provide insights into areas of weakness
Identify opportunities for improvement
Benchmarking to organizations in industry
The different BPMM models use different criteria for assessing the BPMM of an organization. The
BPMM Model used in this research is the model of Bruin & Rosemann which extends and updates
earlier maturity models (Bruin & Rosemann, 2006). This maturity model uses six criteria to
determine five maturity levels and can be applied in organizational divisions at different points of
time. The five levels the maturity model distinguishes are:
1. Initial state 2. Defined 3. Repeated 4. Managed 5. Optimized
The six factors used to determine the maturity level of an organization are the factors Bruin &
Rosemann identify as critical success factors for BPM. Later these factors have also been introduced
as the six core factors of BPM (Rosemann & Brocke, 2010). The factors and the definition of
Rosemann & Brocke are:
1. Strategic Alignment:
Strategic alignment (or synchronization) is defined as the tight linkage of organizational priorities
and enterprise processes enabling continual and effective action to improve business performance.
Processes have to be designed, executed, managed, and measured according to strategic priorities
and specific strategic situations. In return, specific process capabilities (e.g., competitive advantage
in terms of time to execute or change a process) may offer opportunities to inform the strategy
design leading to process-enabled strategies.
2. Governance:
BPM governance establishes appropriate and transparent accountability in terms of roles and
responsibilities for different levels of BPM (portfolio, program, project, and operations). A further
focus is on the design of decision-making and reward processes to guide process-related actions.

28
3. Methods:
Methods in the context of BPM are defined as the set of tools and techniques that support and
enable activities along the process lifecycle and within enterprise-wide BPM initiatives. Examples are
methods that facilitate process modeling or process analysis and process improvement techniques.
4. Information Technology:
IT-based solutions are of significance for BPM initiatives. With a traditional focus on process analysis
and process modeling support, BPM-related IT solutions increasingly manifest themselves in the
form of process-aware information systems.
5. People:
People defined as individuals and groups who continually enhance and apply their process and
process management skills and knowledge in order to improve business performance. This factor
captures the BPM capabilities that are reflected in the human capital of an organization and its
ecosystem.
6. Culture:
BPM culture incorporates the collective values and beliefs in regards to the process-centered
organization. Culture is about creating a facilitating environment that complements the various BPM
initiatives. It however needs to be recognized that the impact of culture-related activities tends to
have a much longer time horizon than activities related to any of the other five factors.
4.4 Impact on shareholder value This section describes the impact the BPM maturity level has on shareholder value. From a Business
Process Management Maturity perspective the expectation is that an increase of maturity results in
an increase of organizational performance. Higher levels in maturity in any business process can
result in (McCormack, et al., 2009):
Better control of results
Improved forecasting of goals, costs and performance
Greater effectiveness in reaching defined goals
Improving management ability to propose new and higher targets for performance.
Even though higher levels in maturity results in the benefits described above the industry and
enterprise strategy determines if it is appropriate or desirable to attain the highest level of maturity.
It is a challenge to identify the most appropriate BPM maturity level based on context, objectives,
related constraints and possible business cases (Rosemann & Bruin, 2005). Another important aspect
of maturity is that it can vary across the organization at a single point in time (Sinur & Hill).
The limited available numbers of empirical research also suggests a correlation between BPM
maturity and performance (Batenburg & Versendaal, 2008) (Hoffman & Reiner, 2006) (Raschke &
Ingraham, 2010). The authors however state that further research is necessary to determine when
organization should try to improve their BPM maturity.

29
4.5 Relationship with BPM Activities One of the six aspects of the BPMM of Rosemann is methodology. It is possible to relate the BPM
activities with the methodology aspect in the BPMM and thereby linking the BPM activities to
maturity levels. Below we describe how these methodologies and BPM activities can be related.
1. Process Design & Modeling: Relates to Business Process Analysis and Process modeling in
the proposed life cycle
2. Process Implementation & Execution: Relates to Implementation and Execution in the
proposed life cycle
3. Process Monitoring & Control: Relates to monitoring in the proposed life cycle
4. Process Improvement & Innovation: Relates to Redesign in the proposed life cycle
5. Process program & project management: Relates to the continuous aspect of the proposed
life cycle.
This relationship is also identified by Forrester (Moore, 2008) in Figure 13 and Pesic (Pesic) but their
relationship shows minor differences. Pesic relates the Define, Measure, Analyze, Implement and
Control (DMAIC) cycle of six sigma to a five-level maturity model. Forrester maps process modeling,
execution, monitoring and optimization to both BPM adoption maturity and Value to shareholders.
Figure 13: Relationship between BPMM, BPM and Value according to Forrester
If we adopt the representation of Forrester and add the maturity levels of Rosemann we come to
the following model as shown in Figure 14.

30
Figure 14: Relationship between BPM and BPMM
Important to note is that a higher maturity level facilitates the opportunity to apply the BPM phases
mentioned in the model above. However only applying the BPM phases does not result in increasing
a higher maturity model as the other five aspects of the maturity model should also match the
maturity model of the applied method.
4.6 Summary Maturity models have been designed to assess the organizations maturity of a selected domain
based on a set of criteria. The most popular way to represent the maturity is a five-point Likert scale.
The concept of maturity model has been introduced with the Capability Maturity Model (CMM) for
software from the software engineering institute. There are six phase in developing a maturity
assessment model:
1. Scope
2. Design
3. Populate
4. Test
5. Deploy
6. Maintain
Business Process Maturity Models is a maturity model designed to assess the organizations BPM
maturity. These models are used to:
Provide a baseline for determining BPM maturity in an organization
Provide insights into areas of weakness
Identify improvement opportunities
Benchmark to organizations in the same industry
The BPMM used in this thesis uses six criteria to determine the five maturity levels. These criteria
are: Strategic alignment, governance, methods, information technology, people and culture. By
relating the methods from the BPMM to the BPM life cycle phase the maturity level can be related
to BPM activities.
From a BPMM perspective the expectation is that an increase of maturity results in an increase of
organizational performance. The limited available empirical research suggest a correlation between
BPM maturity and performance, however it is not clear whether organizations should strive to
achieve level five maturity or should be satisfied with a lower maturity level for some processes

31
5. Framework outline This chapter presents the framework outline, how it is constructed and how the framework outline
helps organizations to identify, discuss and prioritize all possible BPM opportunities in a single
framework based on shareholder value and organizational capability.
Section 5.1 presents the starting point of the framework
Section 5.2 presents how BPM opportunities can be identified
Section 5.3 presents how BPM opportunities can be related to shareholder value
Section 5.4 presents how BPM opportunities can be related to organizational capability
Section 5.5 presents summarizes the chapter en describes the framework outline to
identify, discuss and prioritize all possible BPM opportunities in a single framework based on
shareholder value and organizational capability
5.1 Identify business processes In order to increase shareholder value throughout business process management an organization
should adopt BPM as a holistic approach. To do so it is important that an organization has a holistic
view of their business processes. In order to achieve this holistic view an organization should identify
both their operational and supporting business processes. These business processes are the main
element of the framework as they can be related to BPM, BPMM and Shareholder value. The next
section describes these relationships.
5.2 Identify possible BPM opportunities As described in chapter 3 organizations can apply BPM to improve their business processes which
results in lower costs, higher revenues, motivated employees and satisfied customers. A business
process can be improved by applying the BPM-life cycle to this business process. Each step of the
BPM life cycle can be regarded as a possible BPM opportunity.
If an organization for instance wants to improve their sales processes, the organization can apply the
six steps from the BPM life cycle to the sales process. This results in six different improvement
opportunities, which are depicted in Figure 15.

32
Figure 15: Improvement opportunities Sales Process
Instead of streamlining one process and unknowingly sub optimize others, organizations need a
holistic view of their business processes and BPM opportunities. To identify all possible BPM
opportunities an organization relates the different business processes throughout the organization
to the BPM life cycle. These business processes can be both operational and supporting business
processes. Operational business processes are the core business of an organization, whereas
supporting business processes support these core processes. By relating all business processes to the
BPM life cycle an organization gets a holistic view of all possible BPM opportunities.
5.3 Relate business processes to shareholder value As described in chapter 2 shareholder value from an investor’s perspective is called Total
Shareholder Return and is based on the stock price appreciation and dividends of an organization.
Managing for value is also known as Value Based Management and is defined as “a formal
systematic approach to managing companies to achieve the objective of maximizing value creation
and shareholder value over time” and is concerned with understanding value drivers and their
interactions to develop an organizations strategy to achieve competitive advantage. To assess the
business performance, organizations use performance measures. Traditional performance measures
focus entirely on cost efficiency and effectiveness, however current performance measures balance
financial and non-financial measures and link performance to the organizations strategy (Kaplan &
Norton, 1996).

33
Deloitte has developed a framework to relate improvement actions to shareholder value and the
organizations strategy. This framework, the Enterprise Value Map (EVM), is a practical one-page
management framework that shows the relationship between shareholder value and business
operations. The original EVM helps organizations organize, discuss and prioritize improvement
opportunities that deliver maximum value in terms of revenue growth, operating margin, asset
efficiency and market expectations of future growth. The improvement actions defined by the
original EVM are divided in two types.
1. Change what you do The improvement actions within this category address strategic actions such as altering competitive strategies, changing the products and service portfolio and changing the assignment of operational processes to internal and external teams.
2. Do what you do best The improvement actions within this category address tactical actions for improving a company’s
process effectiveness and efficiency, asset productivity and underlying company capabilities.
To relate these improvement actions to shareholder value the EVM uses the following tree
structure:
1. Shareholder value Shareholder value is the top of the three and the goal of an organization.
2. Shareholder value drivers Shareholder value drivers are metrics by which shareholders, analysts and investors asses a
company’s performance. Shareholder value drivers are divided in main value drivers and sub value
drivers.
3. Improvement leaders Improvement leaders are high-level steps an organization can take to improve the performance for a
sub value driver. Sub improvement leaders describe the underlying processes, assets or
organizational capabilities that drive results for the improvement lever. The two types of
improvement levers are directly related to the improvement leaders.
Figure 16 shows the relationship between Shareholder value, value drivers, improvement leaders
and improvement actions and give an example of value drivers, improvement leaders and
improvement actions.

34
Figure 16: Enterprise Value Map structure example
The EVM does not claim to be a framework that is mutual exclusive and collectively exhausting, but
is a starting point and is intended to be improved and tailored to the needs of organizations and/or
technologies. The improved and/or tailored maps are also known as a derivative value maps and it is
suggested to maintain as much of the high-level structure and general look and feel of the original
map for the derivative value maps.
The framework and structure of the EVM can also be tailored to BPM opportunities. The identified
business processes can be related to the improvement leaders of the organization. As business
processes are cross-functional a specific business process can be related to multiple improvement
leaders. By relating the identified business processes to the improvement leaders and applying the
six steps of the BPM life cycle to these business processes all BPM opportunities are related to
improvement leaders. This direct relation between the BPM opportunity and one or more
improvement leaders indicates how this specific BPM opportunity can influence Shareholder value.
For example the sales process can be related to more than one improvement leaders and thereby
influencing shareholder value in a number of ways. Figure 17 shows an example of the improvement
leaders of the EVM the sales process could possibly be related to. Note that all improvement leaders
of the EVM that are not impacted by the sales process are removed in this example.

35
The previous example shows the relationship from a process perspective and shows how a specific
process can influence shareholder value. However the relationship between business process and
improvement leaders can also be applied the other way around. Figure 18 gives an example of the
improvement leader “Marketing & Sales” and the business process that can be related to this
specific improvement leader. The figure shows the first three steps of the BPM life cycle applied to
the business process to give an impression; however the next three steps of the BPM life cycle are
applied to the business process in the same way.
After an organization has related the business processes to the improvement leaders they influence
and related the BPM life cycle to these business processes an organization has a holistic overview of
all the BPM opportunities and the different ways they can influence shareholder value and can
discuss and prioritize BPM opportunities based on shareholder value.

36
Figure 18: improvement leader “Marketing & Sales” and related business process

37
5.4 Relate business processes to organizational capability Once the BPM opportunities are identified and related to shareholder value an organization can
discuss and prioritize their BPM opportunities based on shareholder value. However as described in
chapter 4 the activities of the BPM life cycle are related to the BPM maturity of an organization. As
maturity models suggest that improvement should be made steps of one maturity level and are
based on the current maturity of a process not all described BPM opportunities are possible.
To relate the BPM opportunities to the BPM maturity of the organization an organization has to
analyze the BPM maturity of all of the identified business processes. Identifying this maturity is
based on the following six factors and their corresponding capability areas which are described in
chapter 4.
1. Strategic alignment
2. Governance
3. Methods
4. Information Technology
5. People
6. Culture
Taking the example of an organization that wants to improve their sales process by monitoring the
process, the organization first needs to know their current maturity level of this business process. If
the organization only has a business model of the business process they first have to make two steps
(implement the business process and execute the business process) before they can make the step
to monitor the business process. The organization also has to make sure that while taking these
steps the corresponding capability areas are aligned with the maturity.
Analyzing the maturity of all the business processes and thereby also providing a holistic overview of
the maturity of the business processes can give an organization other insights. For example if an
organization wants to acquire new customers by improving their marketing and sales improvement
leader it can be interesting to have insight in the maturity of all the processes influencing this
improvement leader. Figure 19 again shows the marketing and sales improvement leader and the
related improvement actions (only life cycle steps one till three). The figure also indicates the
maturity of the business processes. The green text indicates that the organization has already
reached that specific maturity for the business process. The black text indicates that the organization
can perform this step to improve the maturity for the business process. The red text indicates that
the organization first has to perform other steps to reach the specific maturity for the business
process.
Based on this overview an organization can identify that the maturity levels of the marketing process
and IT management process are far lower than the other processes that influence the marketing and
sales improvement leader. Especially as the marketing process is an operational process that
influences this improvement leader an organization can decide that it has to improve the maturity of
this process which results in a project to model the marketing process.

38
Figure 19: Marketing & Sales business process maturity

39
5.5 Summary The framework shows all the business processes for an organization and relates these processes to
BPM, BPMM and shareholder value. Based on these relationships the possible BPM opportunities
are identified by capturing all the operational and supporting business processes of an organization
and relating these business processes to the BPM life cycle. This provides an organization with a
holistic overview of all BPM opportunities.
To relate these BPM opportunities to shareholder value the methodology of the EVM is used. This
methodology divides shareholder value into value drivers, which are influences by improvement
levers. The business processes (and thereby BPM opportunities) are related to these improvement
levers. This relation shows in what way a specific business process influences shareholder value, but
also shows which business processes influence a specific improvement lever and value driver.
To relate the BPM opportunities to organizational capability the process maturity of all the
operational and supporting business processes is identified. This analysis shows which BPM
opportunities already have been performed, which opportunities an organization can and cannot
perform based on the current maturity level of the business processes. An organization can use this
relation to see which steps to take to improve a specific process, but also which business processes
can be improved for a specific improvement lever and value driver.

40
6. Reference framework The framework outline can be applied to a specific organization by tailoring the top part of the
framework (the value drivers and improvement leaders) to the organizations strategy/context and
by relating the business processes of the organization to the improvement leaders. To get a general
impression of a populated framework this chapter will present a reference framework with
reference value drivers and reference processes based on the original Enterprise Value Map and the
Deloitte Industry Print processes.
Section 6.1 presents the reference value drivers and improvement levers
Section 6.2 presents the reference operational and supporting processes
Section 6.3 presents the relationship between the improvement levers and business
processes
Section 6.4 presents the reference framework
Section 6.5 summarizes the chapter
6.1 Reference value drivers According to the EVM shareholder value is driven by four basic value drivers: Revenue growth,
operating margin, asset efficiency and expectations. These value drivers are related to a number of
sub-value drivers and improvement levers. For the reference framework the standard value drivers,
sub-value drivers and improvement levers are used. This section describes the value driver, sub-
value drivers and improvement levers.
Revenue growth
Revenue growth involves increasing the revenue received from the sale of organizations products, services and assets and is seen as the key measure of an organizations operational effectiveness because it shows how well an organization is able to identify and fill a need within its chosen markets. Combined with operating margin it measures an organizations performance around its core operating activities over a particular period. An organization can increase revenue growth by increasing the volume of products or services sold and by maximizing the price of those products and services. As these two drivers are tightly linked the challenge for most companies is to make improvements that drive value improvement on the whole. The sub-value drivers and improvement levers of revenue growth are shown in Figure 20 An organization can increase the volume by acquiring new customers, retain and grow current customers and leverage income-generating assets. Acquiring new customers can be achieved by improving the effectiveness of the marketing and sales efforts of the organization and by broadening and improving product and service offerings. Retain and grow current customers can be achieved by improving the effectiveness of customer and account management processes, selling additional and higher-end products and services to current customers, retain customers by incentives and creating barriers to switching. Leverage income generating assets can be achieved by generating income from the investment, sale or licensing of organizations assets.

41
An organization can maximize the price of products and services by strengthening the price to the maximum a customer is willing to pay. Strengthening the price can be achieved by balancing the demand for products and services by managing supply of products and services and by aligning product and service prices with the true value delivered to targeted customers and segments.
Marketing & Sales
Account Management
Cross-Sell / Up-Sell
Retention
Demand & Supply
Management
Price Optimization
Product & Service
Innovation
Cash / Asset Management
Strengthen Pricing
Leverage Income-
Generating Assets
Acquire New Customers
Volume Price Realization
Revenue Growth
Product & Service
Innovation
Retain and Grow Current
Customers
Figure 20: Sub-value drivers and improvement levers of revenue growth
Operating margin
Operating margin is the difference between the revenues received from the sale of products and services, and the costs of providing those products and services and is seen as the key measure of an organizations operational efficiency as it reflects how an organization is able to turn the demand for its products and services into profits. Combined with revenue growth it measures the organizations performance around its core operating activities. An organization can increase their operating margin by decreasing their selling, general and administrative costs, by decreasing the costs of goods sold and by effectively manage income taxes. The sub-value drivers and improvement levers of operating margin are shown in Figure 21 An organization can decrease their selling and administrative costs by improving customer interaction efficiency and improve corporate and shared service efficiency. Improving customer interaction efficiency can be achieved by reducing the costs for marketing, sales, customer support and order fulfillment by improving the efficiency of these processes. Improving shared service efficiency can be achieved by reducing the costs for IT, real estate, human resource, procurement, business management and financial management by improving the efficiency of these processes.

42
An organization can decrease their costs of goods sold by decreasing the costs of product development, materials management, and manufacturing and production processes to reduce product costs. The costs of product development can be reduced by improving the efficiency of product and service development efforts. The costs of materials can be reduced by improving the efficiency of materials procurement and receipt operation and by reducing the price for materials. An organization can effectively manage income taxes by improving the incorporation of tax consequences and activities into business planning processes to utilize available opportunities and reduce tax liabilities. To achieve this, an organization should identify and manage tax consequences and opportunities.
Figure 21: Sub-value drivers and improvement levers of operating margin

43
Asset efficiency
Asset efficiency is the value of assets used in running the business relative to the current level of revenues and reflects the company’s investment efficiency by relating the invested resources to the revenues of the organization. Whereas revenue growth and operating margin are income concepts, asset efficiency is related to the balance sheet. However it does have ties to the income statement as asset efficiency is measured relative to the revenues and profit generated by the organizations assets. Asset efficiency is important as it reflects what investment is necessary to run the business. By minimizing the investment, an organization can reduce their need for debt and equity which results in a higher return for investors. An organization can increase their asset efficiency by efficiently handling property, plant and equipment, inventory and receivables and payables. The sub-value drivers and improvement levers of asset efficiency are shown in Figure 22: Sub-value drivers and improvement levers of Asset Efficiency. An organization can improve the efficiency of property, plant and equipment by improving the efficiency with which real estate, infrastructure, equipment and systems are used. Improving the efficiency for assets, infrastructure, equipment and systems can be achieved by reducing the costs of these assets and by divesting low utilization assets. An organization can improve the efficiency of their inventory by minimizing the level of inventory needed to run the business and thereby reducing working capital. This can be achieved by reducing the inventory levels required to support the business and by reducing the work in process and manufacturing materials levels required to support the business. An organization can improve the efficiency of their payables and receivables by improving the efficiency on interest receivable and interest payable. This can be achieved by shorting the period for which accounts, notes and interest receivable are outstanding and lengthening the period for which accounts, notes, and interest payables are outstanding.
Figure 22: Sub-value drivers and improvement levers of Asset Efficiency

44
Expectations
Expectations refer to the factor that influence an organizations ability to produce solid income statement and balance sheets in the future and is a measure for the confidence of shareholders for the organizations future prospects. Whereas revenue growth, operating margin and asset efficiency look backwards, expectations focus on the future. The expectations are influenced by both internal and external factors. There are two categories of internal factors; managerial capabilities which address the organizations management team and execution capabilities which address the broader organization. The sub-value drivers and improvement levers of expectations are shown in Figure 23 An organization can improve their management’s capabilities by effectively formulating business plans, monitor and manage current business operations and launch effective investment and improvement initiatives. This can be achieved by improving the ability of leaders to guide, monitor and control their organization, by improving the effectiveness of business planning activities, by improving the effectiveness of program planning and delivery activities and by improving the effectiveness of operational performance monitoring, management, and improvement activities. An organization can improve their execution capabilities by Improve the ability of the broader organization to effectively execute current and future business plans. This can be achieved by improving the effectiveness and efficiency of business processes throughout the organization, by improving the effectiveness and efficiency with which the organization is able to partner and collaborate with other organizations, by strengthening the organization's relationships with customers, employees, partners, the public, and other stakeholders, by improving the ability of the organization to effectively and quickly adapt to new opportunities, threats, and other factors that require substantial change and by acquiring, developing, and using the company's strategic tangible and intangible assets.
Figure 23: Sub-value drivers and improvement levers of expectations

45
6.2 Reference business processes As described in chapter 5 the framework outline relates business processes to the BPM life cycle and
the improvement levers. Within the EVM, Deloitte has already made the relation between business
processes and the improvement levers; however this relationship has never been explicitly used in a
value map.
The EVM is a high-level view that is not industry specific, these same goes for the business processes
related to the EVM. These business processes can be seen as a high level reference framework for
business processes throughout an organization. The EVM distinguishes the following business
processes.
Operational business processes
1. Develop, design and engineer new products and services
2. Market products and services
3. Sell products and services
4. Perform order management
5. Procure materials and services
6. Manufacture products
7. Manage inventory and logistics
8. Provide Customer service
9. Manage intellectual property
Supporting business processes
1. Purchase goods and services
2. Manage human resources
3. Manage support services
4. Manage Information Technology
5. Manage plant, equipment and facilities
6. Manage capital programs/projects
7. Manage accounting and control data
8. Manage payables and receivables
9. Manage capital and risk
10. Ensure regulatory compliance

46
Mar
ketin
g & Sa
les
Product
& Se
rvice
innova
tion
Account m
anage
ment
Cross
-sell/
up-s
ell
Retentio
n
Cash/a
sset
man
agem
ent
Deman
d & su
pply m
anag
emen
t
Price
optim
izatio
n
Mar
ketin
g & ad
verti
sing
Sale
scu
stom
er se
rvice
& su
pport
Order f
ulfillm
ent &
billi
ng
IT, T
eleco
m &
net
work
ing
Real Es
tate
Human
Res
ources
Procu
rem
ent
Business
Man
agem
ent
Finan
cial m
anag
emen
t
Product
deve
lopm
ent
Mat
erial
s
Product
ion
Logi
stics
& d
istrib
ution
mer
chad
ising
Syst
em d
elivery
Inco
me
tax
Real es
tate
& in
frast
ruct
ure
Equip
ment &
syst
ems
Finish
ed goods
Work
in p
roce
ss &
raw
mat
eria
ls
Accounts
, note
s & in
tere
st re
ceiva
ble
Accounts
, note
s & in
tere
st pay
able
Govern
ance
Business
plan
ning
progr
am d
elive
ry
Business
per
form
ance
mana
gem
ent
Operat
oinal
exce
llence
Partn
ership
& co
llabora
tion
Relatio
nship
stre
ngth
Agility
& Fl
exibili
ty
Stra
tegic
Ass
ets
1 x x x x x x x x x x
2 x x x x x x x x x x x x x x x x x x x
3 x x x x x x x x x x x x x x x x x x x
4 x x x x x x
5 x x x x x x x x x x x x
6 x x x x x x
7 x x x x x x x x x x x x x x x x x x
8 x x x x x x x x x x x x x x x x x
9 x x x
1 x x x x x x x
2 x x x x x x x x x x x x x x x x x x x x x x x x x x
3 x x x
4 x x x x x x x x x x x x x x x x x x x
5 x x x x x x
6 x x x x x x x x x x x x x
7 x x x x x x x x x x x
8 x x x x x x x x
9 x x x x x x x
10 x x x x
6.3 Relationship improvement levers and business processes The reference framework is based on the relation between the reference value drivers and
reference business processes. This relation is defined in the ValueLink application supporting the
EVM and is shown in Table 1. Based on this relationship the reference framework can be derived.
Table 1: Relationship improvement levers and business processes

47
6.4 Reference framework A high level overview of the reference framework is shown in Figure 24. The reference framework
can be used to explain the concept of the framework to organizations and can also be used as a
starting point for organizations to tailor their own Value Map.
Figure 24: Enterprise Value Map Reference Framework
As stated earlier this reference framework is a high-level industry independent framework, however
Deloitte has also developed a number of industry specific value maps with industry specific value
drivers. Even though there are reference business processes for some of these industry specific
value maps there is no relationship described between these industry specific value drivers and
business processes like the relationship described in Table 1.
To explain the concept of the framework to organization developing industry specific reference
frameworks might lead to a better understanding of the framework and a starting point to develop
an organization specific framework.
6.5 Summary Organizations can apply the framework outline to their specific organization by tailoring the value
drivers and business processes to their business context. However to give an impression of a
populated framework a set of high-level industry independent value drivers and business processes
have been used to populate a reference framework. This reference framework can be used to
explain the concept of the framework to organizations and as a starting point to tailor the
framework to the specific organization.
A next step would be to develop industry specific reference models which might lead to a better
understand of the framework for specific organizations and can be used as a better starting point ot
develop an organization specific framework.

48
7. Application of the framework To apply the framework in practice an organization has to apply seven steps. This section describes
the seven steps an organization has to apply to determine their BPM portfolio. To give an indication
how these steps are applied for each step an example is given based on a fictive organization.
Section 7.1 presents the fictive organization that is uses as an example throughout this
chapter
Section 7.2 presents how an organization can adapt value drivers and improvement levers to
the business context
Section 7.3 presents how an organization can link business processes to improvement levers
Section 7.4 presents how an organization can analyze business process management
maturity of business process groups
Section 7.5 presents how an organization can identify possible improvement actions
Section 7.6 presents how an organization can develop business case for improvement
actions
Section 7.7 presents how an organization can map improvement actions to improvement
levers
Section 7.8 presents how an organization can prioritize improvement actions based on value
and risk
Section 7.9 summarizes the chapter
7.1 Example organization
Lorum Ipsum is a Dutch Commercial Bank that operates throughout Europe. As a Commercial
bank the main business of Lorum Ipsum is divided into two categories:
1. Accepting deposits
2. Granting loans and advances
Beside the main business Lorum Ipsum also provides a number of other services
Issuing letters of credit, travellers cheques, circular notes etc.’
Undertaking safe custody of valuables, important documents, an securities by providing
safe deposit vaults or lockers
Providing customers with facilities of foreign exchange.
Transferring money from one place to another; and from one branch to another branch
of the bank.
Standing guarantee on behalf of its customers, for making payments for purchase of
goods, machinery, vehicles etc.
Collecting and supplying business information;
Issuing demand drafts and pay orders; and,
Providing reports on the credit worthiness of customers.
The operating expenses of Lorum Ipsum are lower than their competitors however their market
share is high enough, especially outside the Netherlands. Therefore Lorum Ipsum wants to use
Business Process Management to achieve the volume growth that is part of their newest strategy
to increase their operating income.

49
7.2 Adapt value map to business context The EVM is intended to be as industry generic as possible. However for most organizations the value
drivers driving shareholder value and the improvement levers to improve these value drivers will not
be aligned with the value drivers and improvement levers in the original EVM. To effectively apply
the framework an organization should start by adapting the value drivers and improvement levers to
their specific business context.
For the most common industries Deloitte has also developed so called “industry specific” value
maps. An organization can use the value drivers and improvement levers of such an industry specific
value map as a reference structure. Examples of industry specific value maps are the retail value
map, government performance map and the universal banking value map.
As a Commercial bank the value drivers and improvement levers of Lorum Ipsum are different to
the industry generic value drivers and improvement levers of the EVM. Especially the lack of
tangible physical assets and the nature of risk differentiate Lorum Ipsum as a commercial bank
from traditional industries.
In line with the top level value drivers of the EVM, Lorum Ipsum identifies four main value drivers:
1. Operating income
2. Operating expenses
3. Capital
4. Expectations
The strategy of Lorum Ipsum is to increase operating income through volume growth. According
to Lorum Ipsum operating income is based on:
1. Volume growth
2. Price realization
3. Credit risk management
4. Liquidity management
To increase volume growth Lorum Ipsum has identified two improvement levers:
1. New customers
2. Customer relationship management
An overview of all the value drivers and improvement levers for Lorum Ipsum is shown in Figure
25

50
Figure 25: Value drivers Lorum Ipsum

51
7.3 Identify and relate business processes Similar to the value drivers and improvement levers the business process are intended to be as
industry generic as possible. After an organization has identified their value drivers and
improvement levers they have to identify their main operational and supporting business process
groups. For the most common industries Deloitte has developed a reference framework that can
also be used as a reference for the operational and supporting business process groups. After an
organization has identified these business process groups they have to relate these business process
to the improvement levers they influence.
Based on their business context Lorum Ipsum identified the following operational and supporting
business processes:
Operational business processes Supporting business processes
Perform Trading Activities
Provide Cash Management Services
Develop Products and Services
Provide Purchasing Card (PCard) Services
Provide Trade Finance Services
Manage Investment Banking Needs
Manage Lending Needs
Market Products and Services
Manage Secondary Market Activities
Process and Clear Transactions
Manage Customer Relationships
Maintain Trust and Custody Operation
Service Institutional Customers
Manage Assets and Liabilities
Manage Capital Projects
Manage Accounting and Control Data
Provide Decision Support
Ensure Compliance
Manage Human Resources
Manage Information Technology
Plan and Manage the Business
Manage Risk
Procure Materials and Services
Manage Support Services
As Lorum Ipsum focuses on improving their volume growth, this example will only relate the business
processes to the two related improvement levers. The relationship between the business processes
and the related improvement levers is shown below.
New customers Customer relationship management
Market products and services
Manage secondary market activities
Manage human resources
Manage Information Technology
Manage support services
Market products and services
Manage secondary market activities
Manage customer relationships
Service institutional customers
Ensure Compliance
Manage human resources
Manage Information Technology
Manage support services
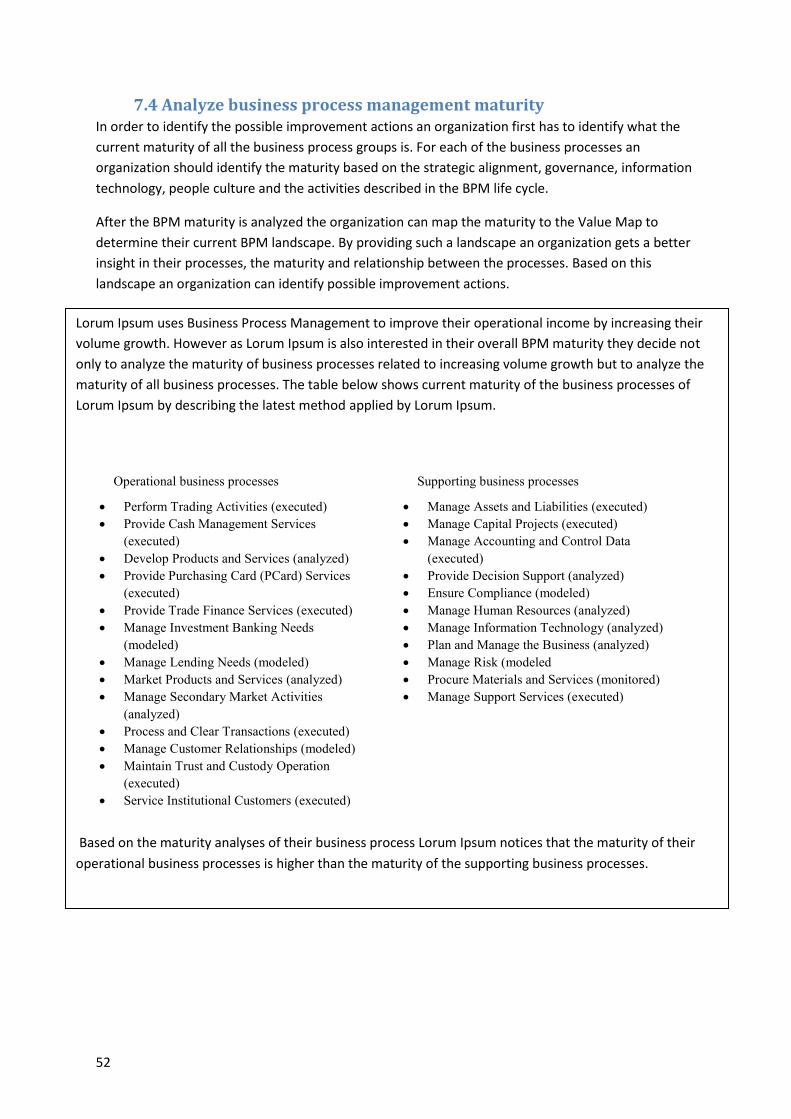
52
7.4 Analyze business process management maturity In order to identify the possible improvement actions an organization first has to identify what the
current maturity of all the business process groups is. For each of the business processes an
organization should identify the maturity based on the strategic alignment, governance, information
technology, people culture and the activities described in the BPM life cycle.
After the BPM maturity is analyzed the organization can map the maturity to the Value Map to
determine their current BPM landscape. By providing such a landscape an organization gets a better
insight in their processes, the maturity and relationship between the processes. Based on this
landscape an organization can identify possible improvement actions.
Lorum Ipsum uses Business Process Management to improve their operational income by increasing their
volume growth. However as Lorum Ipsum is also interested in their overall BPM maturity they decide not
only to analyze the maturity of business processes related to increasing volume growth but to analyze the
maturity of all business processes. The table below shows current maturity of the business processes of
Lorum Ipsum by describing the latest method applied by Lorum Ipsum.
Operational business processes Supporting business processes
Perform Trading Activities (executed)
Provide Cash Management Services
(executed)
Develop Products and Services (analyzed)
Provide Purchasing Card (PCard) Services
(executed)
Provide Trade Finance Services (executed)
Manage Investment Banking Needs
(modeled)
Manage Lending Needs (modeled)
Market Products and Services (analyzed)
Manage Secondary Market Activities
(analyzed)
Process and Clear Transactions (executed)
Manage Customer Relationships (modeled)
Maintain Trust and Custody Operation
(executed)
Service Institutional Customers (executed)
Manage Assets and Liabilities (executed)
Manage Capital Projects (executed)
Manage Accounting and Control Data
(executed)
Provide Decision Support (analyzed)
Ensure Compliance (modeled)
Manage Human Resources (analyzed)
Manage Information Technology (analyzed)
Plan and Manage the Business (analyzed)
Manage Risk (modeled
Procure Materials and Services (monitored)
Manage Support Services (executed)
Based on the maturity analyses of their business process Lorum Ipsum notices that the maturity of their
operational business processes is higher than the maturity of the supporting business processes.

53
7.5 Identify possible improvement actions There are two approaches to identify the possible improvement actions for your organization.
1. Top-down approach
In this approach the Value Map is used to identify improvement actions aligned with the
organizations strategy. By focusing at the top of the map and working your way down an
organization should ask themselves how we will enable this strategy with BPM projects. By selecting
the possible improvement actions that are aligned with the organizations strategy an organization
can identify a short list of possible improvement actions.
2. Bottom-up approach
In this approach the Value map is used to relate improving the maturity of a specific process impacts
shareholder value of the organization. By focusing at the individual processes and relating them to
improvement levers, value drivers and shareholder value an organization can identify if improving
the maturity of the process is beneficial for the organization.
The result of both approaches is a short list with improvement actions an organization wants to
perform as indicated in Figure 26.
Figure 26: overview of possible improvement actions

54
Based on the results of the maturity analysis of the business processes of Lorum Ipsum they decide to use both
the top-down and bottom-up approach to determine their shortlist of BPM opportunities. First the top-down
approach is described, followed by the bottom-up approach.
Top-down approach
As Lorum Ipsum wants to improve their operating income through volume growth the top-down approach of
Lorum Ipsum focuses on the improvement levers of volume growth (new customers and customer relationship
management). Based on the maturity of these business processes the following improvement actions are
possible that influence the volume growth:
Model market products and services process
Model secondary market activities management process
Implement manage customer relationships process
Monitor service institutional customers process
Implement ensure compliance process
Model manage human resources process
Model manage Information Technology
Monitor manage support services
Based on the difference in maturity of the related business processes Lorum Ipsum decided they want to start
with improving the maturity of the business processes with the lowest maturity. Therefore the short list of
improvement actions based on the top-down approach is:
Model market products and services process
Model secondary market activities management process
Model manage human resources process
Model manage Information Technology
Bottom-up approach
After the analysis of the maturity of their business processes Lorum Ipsum noticed that the maturity of their
supporting business processes is lower than the maturity of their operating processes. As the supporting
business processes also influence the operating processes they decide they want to improve the maturity of
the supporting business processes. Based on the maturity of these business processes the following
improvement actions are possible for the supporting business processes
Monitor manage Assets and Liabilities process
Monitor manage Capital Projects process
Monitor manage Accounting and Control Data process
Model provide Decision Support process
Implement ensure Compliance process
Model manage Human Resources process
Model manage Information Technology process
Model plan and Manage the Business process
Implement manage Risk process
Redesign procure Materials and Services process
Monitor manage Support Services process

55
7.6 Develop business case for improvement actions After the organization has developed a short list with improvement actions it is necessary to analyze
what the impact of the improvement action on shareholder value will be. For each improvement
action on the short list a business case has to be developed to show the financial impact of the
improvement of the business process. To support the business case development processes Deloitte
provides financial impact templates. These templates provide a formula that shows the impact of
changes in the process and also performs a sensitivity analysis. Figure 27 shows an example of such a
template.
Lorum Ipsum decides they want at least a business model for each of the supporting business processes. Based on
this decision they decide they want to perform the following improvement actions:
Model provide Decision Support process
Model manage Human Resources process
Model manage Information Technology process
Model plan and Manage the Business process
Short list
Based on the combination of the top-down and bottom-up approach Lorum Ipsum has developed the following
short list of improvement actions.
Model market products and services process
Model secondary market activities management process
Model provide decision support process
Model manage human resources process
Model manage Information Technology
Model plan and manage the business process

56
Figure 27: Financial impact template
Based on the KPI’s of the business processes and the influence the business processes have on improvement levers
Lorum Ipsum developed a business case for each of the business processes on the short list. Lorum Ipsum uses Cash
Flow for their business case. The Cash Flow for each of the improvement actions is shown below.
Improvement actions Cash Flow
Model market products and services process
Model secondary market activities management process
Model provide decision support process
Model manage human resources process
Model manage Information Technology process
Model plan and manage the business process
€1.000.000
€ 150.000
€ 100.000
€ 300.000
€ 500.000
€ 200.000

57
7.7 Map improvement actions
Figure 28: Improvement action mapping
After the financial impact of the improvement actions have been calculated in the business case the
financial impact can be mapped to the improvement levers of the Value Map as shown in Figure 28.
By mapping these improvement actions an organization gets an even better insight in the impact the
specific improvement actions have on shareholder value and specific value drivers. This also helps
organizations to better align the improvement actions to their organizational strategy.
Based on the business cases for each of the improvement actions Lorum Ipsum maps the financial results
of the improvement actions to the related improvement levers. It shows that the improvement actions for
the operational processes mainly influence operational income by customer growth, which is in line with
the organizations strategy. The influence of the supporting business processes is divided among a number
of improvement levers and leads to a higher operational income as well as lower operating costs and
increased asset efficiency.

58
7.8 Prioritize improvement actions To develop a roadmap for the BPM projects the financial impact and strategic alignment of the
improvement actions are important to prioritize the improvement actions. Not all improvement
actions are without any risk. Therefore organizations should also assess the risk of performing each
individual improvement action and map it against the financial impact. In this relationship an
organization can determine both a risk and a value threshold and determine which improvement
actions should be part of the BPM roadmap. Figure 29 presents an example of an prioritization
matrix.
Figure 29: Prioritization matrix
To prioritize their BPM improvement actions Lorum Ipsum has performed a risk analyses to analyze the risk of performing the improvement actions. Based on the risk assessment they have decided they have to reassess the model provide decision support process. All the other improvement actions have a low risk. Based on the value of the improvement actions Lorum Ipsum has prioritized the improvement actions as followed:
1. Model market products and services process 2. Model manage information technology process 3. Model manage human resource process 4. Model plan and manage the business process 5. Model secondary market activities management process 6. Model provide decision support process

59
7.9 Summary To apply the framework in practice an organization has to apply sevens steps to determine their
BPM roadmap. These steps are:
1. Adapt value drivers and improvement levers to the business context
In this step the organization tailors identifies the performance measures of the organization and
tailors the value drivers and improvement levers to their own performance measures, core
processes and assets.
2. Link business process groups to improvement levers
In this step the organization identifies both their operational and business processes and relates
them to the improvement levers which are developed in the previous step. This step shows the
cross-relationship of the business processes as well as the impact business processes have on
shareholder value.
3. Analyze business process management maturity of business process
In this step the maturity of the business processes is identified to analyze which steps of the BPM life
cycle an organization can take.
4. Identify possible improvement actions
In this step the organization develops a long list of improvement actions an organization wants to
take based on the possible opportunities. This analysis can be both top-down (based on the business
strategy) or bottom-up (based on the impact of the improvement action). The result of this step is a
long list of improvement actions
5. Develop business case for improvement actions
In this step the organization the organization develops a business case for the improvement actions
on the long list. These business cases are based on the KPI’s of the business processes and are used
as input for the prioritization.
6. Map improvement actions to improvement levers
In this step the costs and revenue of the improvement actions are mapped to the improvement
levers to get a better insight in the financial impact of the improvement actions
7. Prioritize improvement actions based on value and risk
Based on the value of the business cases and the risks of the improvement actions the organizations
prioritizes the improvement actions which leads to a BPM roadmap.

60
8. Validation of the framework The framework is based on research literature, input by BPM experts of Deloitte Consulting and
expert session at Deloitte Consulting. To validate the framework two interviews at external
organizations and a case study were performed. This chapter describes the interview setup, the
questions used throughout the interviews and the results of the interviews as well as the case study.
Finally the findings of the validation, the expert interview and the expert session at Deloitte
Consulting and the case study are presented
Section 8.1 presents the validation interviews
Section 8.2 presents the case study
Section 8.3 presents the findings of the validation
8.1 Validation interviews
8.1.1 Interview setup
The described BPM value map method has primarily been based on the literature study and the
existing knowledge base. Although some scenario study results and expert opinions have been
considered this does not give insights in the suitability of the framework in practice. This chapter
assesses the suitability of the framework.
To validate the BPM value map a qualitative approach has been chosen. The most rigorous
validation method for the BPM value map would have been a case study. However, it was not
possible to perform such a case study in the limited time available for the research. Therefore a
number of interviews have been performed to assess the suitability of the framework.
In the interviews BPM managers of two organizations were asked to answer questions from the
question list described in the next section. To attain more feedback supplementary questions were
asked to prevent vague or incomplete answers. The questions are based on the application steps
described in chapter 7 as these steps describe how to apply the framework. Before attaining the
face-to-face interviews the reference framework of chapter 6 and the application steps of chapter 7
were explained.

61
8.1.2 Questions list
For the interviews a semi-structured approach has been chosen, addressing the seven steps to apply
the framework which are described in chapter 7. Additional questions have been posed to assess the
overall methodology. As the interviews are semi-structured and focused on the seven steps to apply
the framework the answers will also be summarized per step.
1. Adapt value drivers and improvement levers to the business context
a. Do you relate current process improvement projects to shareholder value?
b. Do you understand the concept to relate improvement actions to shareholder value
using value drivers and improvement levers?
c. Would you be able to identify the value drivers and improvement levers based on
your business context?
d. Do you think using value drivers and improvement levers offers added value for your
organization?
2. Link business process groups to improvement levers
a. Do you have an overview of all your operational in supporting business processes?
b. Is it possible to relate your business processes to improvement levers?
c. Does relating business processes to improvement levers offer new insights?
3. Analyze business process management maturity of business processes
a. Do you have insights in the current maturity of your business processes?
b. Do you think it is possible to measure the maturity of your business processes?
c. Do you think measuring the maturity of business processes adds value?
4. Identify possible improvement actions
a. How do you identify current process improvement projects?
b. Do you think it is possible to identify possible improvement actions using the top-
down approach from framework?
c. Do you think it is possible to identify possible improvement actions using the
bottom-up approach from the framework?
d. Does the framework offer benefits in identifying possible improvement actions?
5. Develop business case for improvement actions
a. How do you develop the business case for current process improvement projects?
b. Can you use a similar approach to develop a business case for improvement actions
identified using the framework?
c. Do the improvement levers and value drivers help developing the business case?
6. Map improvement actions to improvement levers
a. Does mapping the actions to improvement levers help prioritizing the improvement
actions?
7. Prioritize improvement actions based on value and risk
a. How do you currently prioritize improvement actions?
b. Is it possible to identify the risk of an improvement action?
c. Would you use the prioritizing methodology?

62
8.1.3 Interview results
Heineken International
Background
Heineken is one of the world’s largest brewers and is committed to growth and remaining
independent. The brand that bears the founder’s family name – Heineken – is available in almost
every country on the globe and is the world’s most valuable international premium beer brand.
Their aim is to be a leading brewer in each of the markets in which they operate and to have the
world’s most valuable brand portfolio. Their principal international brand is Heineken®, but the
Group brews and sells more than 200 international premium, regional, local and specialty beers and
ciders. They have the widest presence of all international brewers, thanks to their global network of
distributors and over 125 breweries in more than 70 countries in 2009. Marketing excellence and
innovation are key components of their growth strategy. In everything they do, it is the consumers
and their changing needs that are at the heart of their efforts. The goal of Heineken is to grow the
business in a sustainable and consistent manner, while constantly improving profitability. The four
priorities for action include:
1. to accelerate sustainable top-line growth 2. to accelerate efficiency and cost reduction 3. to speed up implementation 4. to focus on those markets where they believe they can win
Adapt value drivers and improvement levers to the business context
Heineken International BPM managers states they currently do not relate all process improvement
projects to shareholder value. The main driver for process improvement projects are cost reductions
in specific departments based on the budgets determined by top management. They understand the
concept to relate improvement actions to value drivers and improvement levers. They state that
because of their organizational size and multiple divisions it would be difficult to develop a holistic
concept for their value drivers and improvement levers. However they also state this methodology
could be used for a specific division and would use it to relate business process improvement
projects but also other projects to identify their impact.
Link business process groups to improvement levers
Heineken International has insights in their business processes and has a business model of each of
their business processes. They state that it would take quite some work to relate the business
processes to the improvement levers as some of their business processes are very cross functional,
but they also state that the insight it offers is worth the investment. By relating the business
processes to the different improvement levers this cross functionality and the impact it has on
shareholder value is made explicit, whereas in the current situation this isn’t. Heineken International
is very curious what impact this new insights might have on their selection of improvement actions.

63
Analyze business process management maturity of business processes
Heineken International currently only has assessed a limited number of business processes for their
BPM maturity. These processes have been benchmarked with competitors from their industry;
however despite this benchmark Heineken International did not use the maturity assessment or
benchmark in further project plans. They have experience in assessing the BPM maturity of business
processes and state the insight of the balance of maturity levels between different business
processes offer a new insight compared to their current situation. Even though they state that they
do not strive for a perfect balance between maturity levels and that not all business processes need
to have a high maturity level they do think insight in maturity might show possibilities to reduce
costs and accelerate efficiency.
Identify possible improvement actions
As described earlier by Heineken International the main driver for process improvement projects are
cost reductions in specific departments based on the budgets determined by top management.
Therefore they identify improvement actions by analyzing the KPI’s of the core processes of a
department. Because they already reduce costs in the departments that need cost reduction
Heineken International states that the bottom-up methodology isn’t very beneficial to their BPM
practice as they already have their own methodology. Considering the top-down approach they
state that this is a good methodology to analyze what process to optimize in order to gain
competitive advantage. They main benefit they see is that beside the core processes for a specific
improvement lever are made explicit but also other processes that might influence these core
processes. In the current situation such processes are not likely to be identified as improvement
actions for the competitive advantage.
Develop business case for improvement actions
For their current improvement actions Heineken International has their own methodology to
develop their business case based on KPI’s identified in the business processes. They state that using
this methodology for identified improvement actions from the framework would not work as the
added value of the framework is the cross functionality and the KPI’s are not developed for the cross
functionality. They state that the financial impact templates of Deloitte can be used as reference
templates for their business case, however by defining KPI’s for each improvement lever in the first
step would improve the process of this step.
Map improvement actions to improvement levers
Heineken International states that mapping the improvement actions to improvement levers does
not specifically help prioritizing improvement actions as the financial result stays the same. They
state that mapping both the costs and revenues of an improvement action to the improvement
levers could help Heineken International in determining which department has to pay for a specific
improvement action as the improvement levers could be related to specific assets/departments. In
the current situation only one department is responsible for paying for a specific project.

64
Prioritize improvement actions based on value and risk
Heineken International already prioritizes their improvement actions based on value and risk.
However with the use of the BPM Value map it is possible to define the value in a structured
process. However they state that the framework lacks a methodology to identify the risk of an
improvement action.
MEE Zuid-Limburg
Background
MEE Nederland offers information, advice and support for individuals with an intellectual, physical
or sensorial condition, individuals with a chronicle disease and autistic behavior regardless of their
age or condition. MEE is experience with questions and problems regarding all kinds of conditions
and know the possibilities for all facilities. MEE exist of 22 regional organizations offering easy
accessible, independent advice for 100.000 clients. The interview was performed ad MEE Zuid-
limburg, 1 of the 22 regional organizations.
Adapt value drivers and improvement levers to the business context
MEE does not gain income from treating their clients, but their income is based on grants. Therefore
their main focus is not on increasing income but decreasing their costs and increasing their
efficiency. However at the moment they only have limited insights in their cost structure. They state
that using the methodology to determine their value drivers and improvement levers is a mainly
process to create consensus and insights in their cost structure and is beneficial not only for process
improvement projects. The focus of adapting the value drivers and improvement levers will
therefore be on the operating margin and asset efficiency. These value drivers and improvement
levers will be adapted for MEE Zuid-limburg, but can also be used for other regional organizations of
MEE Nederland. MEE Zuid-Limburg also noticed that by adapting improvement levers to their value
drivers they gain a better insight in their overall costs.
Link business process groups to improvement levers
Last year MEE Zuid-Limburg started identifying their business processes in order to start with
process optimization. However in this identifying process they only identified and modeled their
operational processes and did not take the supporting business processes into account. They state
that by identifying all the business processes, including the supporting business processes, the
organization will become more aware of their processes. By relating the business processes to
improvement levers the impact of the business processes will increase this awareness of the
organization. In the current situation the supporting business processes are not identified as
important, by making their impact explicit the importance of the supporting business processes will
be noticed by employees of MEE.
Analyze business process management maturity of business process groups
MEE Zuid Limburg has only recently started optimizing their business processes. They state that they
have not performed an assessment of their business processes as they are aware that the maturity
of their processes is low. However they state that they would want to know what maturity would be
advised in their industry as a benchmark.

65
Identify possible improvement actions
MEE Zuid Limburg has limited resources to perform process improvement; therefore they state it is
important to compare all possible projects to prioritize the projects based on the shareholder value
they will deliver. For this reason they state the bottom-up approach is most suitable for MEE Zuid-
Limburg to get an overview of all the possible projects. Based on the business case for these
improvement actions they will distribute their limited resources. As MEE Zuid Limburg does not have
any competitors they do not have to gain competitive advantage, reducing costs is more important
to their overall strategy. Therefore they state that it is not likely they will use the top-down
approach.
Develop business case for improvement actions
MEE Zuid Limburg does not have a standard methodology to develop a business case for their
business process improvement projects. They state that the financial impact templates of Deloitte
are a good starting point that describes how to develop the business case; however they have to
define the KPI’s in order to apply the financial impact template.
Map improvement actions to improvement levers
MEE Zuid-Limburg state that mapping the improvement actions to improvement levers can help
them in the previous step, developing the business case for improvement actions as KPI’s can be
related to processes as well as to improvement levers. They state that relating the costs to
improvement levers can be interesting, but is not a prerequisite as the costs for the projects are paid
by a central budget.
Prioritize improvement actions based on value and risk
As stated earlier MEE Zuid-Limburg wants to prioritize the possible improvement opportunities
based on the cost reduction of these opportunities. They think it is logical to prioritize the
improvement actions both and value and risk. However they also state it is difficult for them to
identify the risks for the improvement opportunities.
8.1.4 Findings interviews
The interview results have described the attitude of the two organizations towards the steps to
apply the framework and the overall framework. In this section the overall findings are described for
each step of the framework. These overall findings are based on the interviews with two
organizations and interviews with BPM experts at Deloitte Consulting .
Adapt value drivers and improvement levers to the business context
For the most organizations it is possible to adapt value drivers and improvement levers to the
business context, however having a reference model for a specific industry makes it easier to adapt
value drivers and improvement levers to the specific business context. Large organization, such as
Heineken International, might choose not to adapt value drivers and improvement levers to the
holistic organization but instead adapt value drivers and improvement levers for a large department.
Most organizations might have insight in their main value drivers; however the impact of specific
assets or processes is not always as clear. By relating the assets and processes using improvement

66
levers organizations can get a new insight in their cost en revenue structure. Another advantage of
adapting value drivers and improvement levers to the business context is that the strategy can be
mapped to these improvement levers to align strategy with improvement actions. Only by adapting
the value drivers and improvement levers to the business context organizations can gain insights
that can be used for portfolio management.
Link business process groups to improvement levers
As shown in the case of MEE Zuid-Limburg not all organizations have insights in their business
processes. By identifying and defining the business processes, organizations can attain this insight
which is prerequisite to perform BPM as a holistic approach. The validation also showed that the two
organizations did not exactly know how business processes impact their shareholder value. By
explicitly relating the business processes to improvement levers organizations become aware of this
impact. Organizations especially get insight in the cross functionality of business processes and the
relationship between supporting processes and operational processes.
Analyze business process management maturity of business process groups
Even though not all organizations strive to have maximum maturity for all business processes and a
perfect balance might not be necessary the analysis of the current maturity is the main step to
establish the base from which the portfolio management process starts. By determining the current
maturity an organization can identify which process might lack maturity compared to other
processes. This analysis can also be used to benchmark the maturity of the organization to peers. As
organizations have limited experience with assessing the maturity they might need advice to assess
their maturity.
Identify possible improvement actions
As described in the application of the framework an organization can identify the improvement
actions in a top-down and bottom-up approach. The interview with Heineken International showed
that organizations will choose to use the top-down approach if they want to gain competitive
advantage with BPM. The interview with MEE Zuid-Limburg showed that if the goal of BPM is to
reduce overall costs and increase efficiency the bottom-up approach is most suitable. The holistic
approach of the framework is mentioned as a key benefit in both approaches. In the top-down
approach not only the core processes are addressed, but other business processes that might
influence an improvement lever are also made explicit. In the bottom-up approach the holistic view
is even more important as all the business processes and their improvement actions are compared.
Develop business case for improvement actions
To develop a business case for improvement actions is seen as a logical step by both Heineken as
MEE Zuid-limburg. The financial impact templates of Deloitte Consulting or existing methodologies
within their own organization are a good reference point how to develop a business case. However
the framework would work even more effectively if there were reference KPI’s for each industry that
organizations could use to develop their business case.

67
Map improvement actions to improvement levers
Mapping the improvement actions to improvement levers does not add value in all cases for an
organization. Only if an organization wants to allocate their costs and benefits to the value drivers or
improvement levers, this step helps organizations prioritize their improvement actions. If they only
want to know the overall costs and benefits organizations can skip this step.
Prioritize improvement actions based on value and risk
The representatives of the two organizations state that it is a logical step to assess the risk of the
improvement actions and relate both value and risk in a matrix. However they state that the
framework would improve if there was a clear methodology to determine the risk of an
improvement action. They also state that risk is a precondition and the main prioritization will still be
based on the value of the improvement actions.
8.2 Case study The previous chapters described the framework developed in this thesis. This chapter describes a
case study of the framework. For this case study the framework has been developed in a Business
Process Management Tool to support usage of the framework. The tool used is Industry Print 5, the
Deloitte’s Business Process Management modeling conventions of ARIS. The first section describes
the tooling, the second section describes the case study and third section describes the overall
findings of the case study.
8.2.1 Modeling framework in Industry print 5
In Industry Print 5 the following diagram are used to model the framework in a BPM tool:
Objective tree to model the value drivers of an organization in the Enterprise Value Map
KPI allocation diagram to model the KPI’s of an organization and a hierarchy of these KPI’s.
Process map to model the Processes of an organization
The relationship between the processes, value drivers and KPI’s are modeled in a “Function
Allocation Diagram”. The following sections will describe how diagrams and functional allocation
diagram are used to support the framework.
Objective tree
In Industry Print 5 value drivers can be modeled in an objective tree. In this model the hierarchy of
value drivers can be modeled similar to the Enterprise Value Map. Modeling these value drivers
creates an object that can be associated to process objects and KPI objects.
Figure 30: Enterprise Value Map IP5 shows an overview of the left side of the reference Enterprise
Value Map. This starts with Shareholder value on top following revenue growth value drivers and
improvement levers.

68
Figure 30: Enterprise Value Map IP5
KPI allocation diagram
In Industry Print 5 KPI’s can be modeled in a KPI allocation diagram. In this model it is also possible to
define the hierarchy of KPIs. KPI’s can also be imported from an excel document and created in a KPI
allocation diagram.
By modeling the KPI’s in a KPI Allocation diagram and creating the hierarchy of KPI’s this hierarchy
will also be applicable when associating the KPI’s to Value Drivers and processes.
Figure 31: KPI allocation diagram shows an example of the hierarchy of KPI’s and the association
with the Value Drivers.

69
Figure 31: KPI allocation diagram
Process Diagram
In Industry Print 5 processes can be modeled in a process diagram. In this model there are five levels
of Process. Figure 32: IndustryPrint 5 Process Diagram shows the five levels used in Industry Print 5
and the level of detailed related to these levels.
Figure 32: IndustryPrint 5 Process Diagram
The Level 1 (process group diagram) processes are the processes used in the framework to link
processes to Improvement Levers. Additionally the lower level processes can be modeled in Industry
Print 5 to provide a deeper level of detail. These processes and sub processes can also be linked to
Improvement Levers to apply the framework on a more detailed level.

70
Figure 33: Reference processes shows how the reference processes form the reference framework
are modeled in Industry Print 5.
Figure 33: Reference processes
Relating objects in Industry Print 5
In Industry Print 5 the following relationships between objects can be modeled:
Relationship between Value Drivers and KPI’s
Relationship between business processes and Value Drivers
Relationship between business processes and KPI’s
The relationship between value drivers and KPI’s can be created in the KPI allocation diagram. By
creating this relationship it shows that the KPI is applicable to a specific Value driver. When
reviewing this Value Driver these KPI’s need to be taken into account. Figure 34: KPI Allocation
diagram including value driver shows the KPI allocation diagram including the link to the Value
Driver.

71
Figure 34: KPI Allocation diagram including value driver
The relationship between processes and KPI/Value drivers can be modeled in a “Function Allocation
Diagram” (FAD). A FAD in IndustryPrint 5 is typically used to model the relationship of processes
with:
Requirements & other
Applications & Software
Leading Practices, KPI’s and Data
People (Roles & Responsibilities)
For the Framework the FAD is used to model the relationship between the business process with the
KPI’s and Value Drivers. The business process object is modeled in the center of the model. The KPI
object is included in the left lower corner (used for Leading Practices, KPI’s and Data). The Value
Driver object is included in the left upper corner (used for requirements & other).
By creating this association between business processes, Value Drivers and KPI’s the tool provides
information of each association of an object. For instance if we would like to know which business
processes and value drivers are linked to a specific KPI we can select this KPI object in the tools
library and get an overview of all occurrences and links. This overview is highlighted in Figure 35:
Industry Print 5 associations

72
Figure 35: Industry Print 5 associations
8.2.2 Merck case study
To validate the way the framework is modeled we have used a case study. This case study is based
on a Deloitte project where the Enterprise Value Map has been used to define a customized Value
Map. As part of the projects also KPI’s have been identified and linked to the Value Drivers. As part
of the case study we have included the link with business processes based on the reference
processes for this industry.
Background
Merck is an international health care company dedicated to providing leading innovations and
solutions for tomorrow. Their mission is to discover, develop and provide innovative products and
services that save and improve lives around the world. An ambitious market growth strategy and
recent acquisitions forced Merck Animal Health to optimize commercial processes and commercial
intelligence. The necessity to align commercial KPI’s with their strategy was apparent as this would
ensure the right corrective and stimulating actions from sales management.
Merck Enterprise Value Map
Based on the Deloitte Enterprise Value Map for the pharmaceutical sector and input from multiple workshops with Merck a customized Value Map has been proposed. The focus of this customized Value map is on the commercial margin and value driver impacting the commercial margin. Figure 36: Enterprise Value Map Merck shows the Enterprise Value Map of Merck
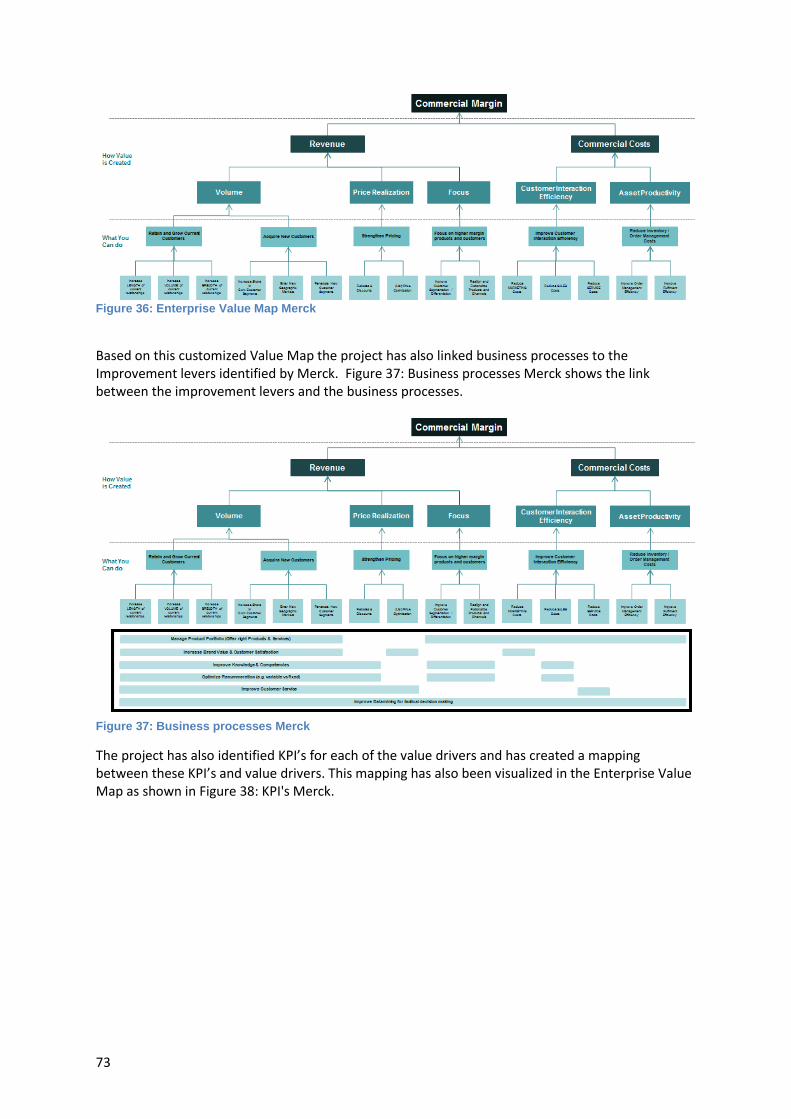
73
Figure 36: Enterprise Value Map Merck
Based on this customized Value Map the project has also linked business processes to the Improvement levers identified by Merck. Figure 37: Business processes Merck shows the link between the improvement levers and the business processes.
Figure 37: Business processes Merck
The project has also identified KPI’s for each of the value drivers and has created a mapping between these KPI’s and value drivers. This mapping has also been visualized in the Enterprise Value Map as shown in Figure 38: KPI's Merck.

74
Figure 38: KPI's Merck
Finally the project has also mapped the same KPI’s to the identified business processes. This
mapping has been visualized in a similar way as shown in Figure 39: KPI and business process
mapping Merck.
Figure 39: KPI and business process mapping Merck
Merck Value Map in Industry Print 5
As part of the case study the customized Value Map, KPI’s and business processes
developed/identified by the Merck project team has been created in Industry Print 5.
As described in the previous section the Value Map can be created in an Objective tree diagram.
Figure 40: Merck Value Map Industry Print 5 shows Industry Print 5 model of the initial version of the
Pharmaceutical Value Map, on which Merck based the Value map.
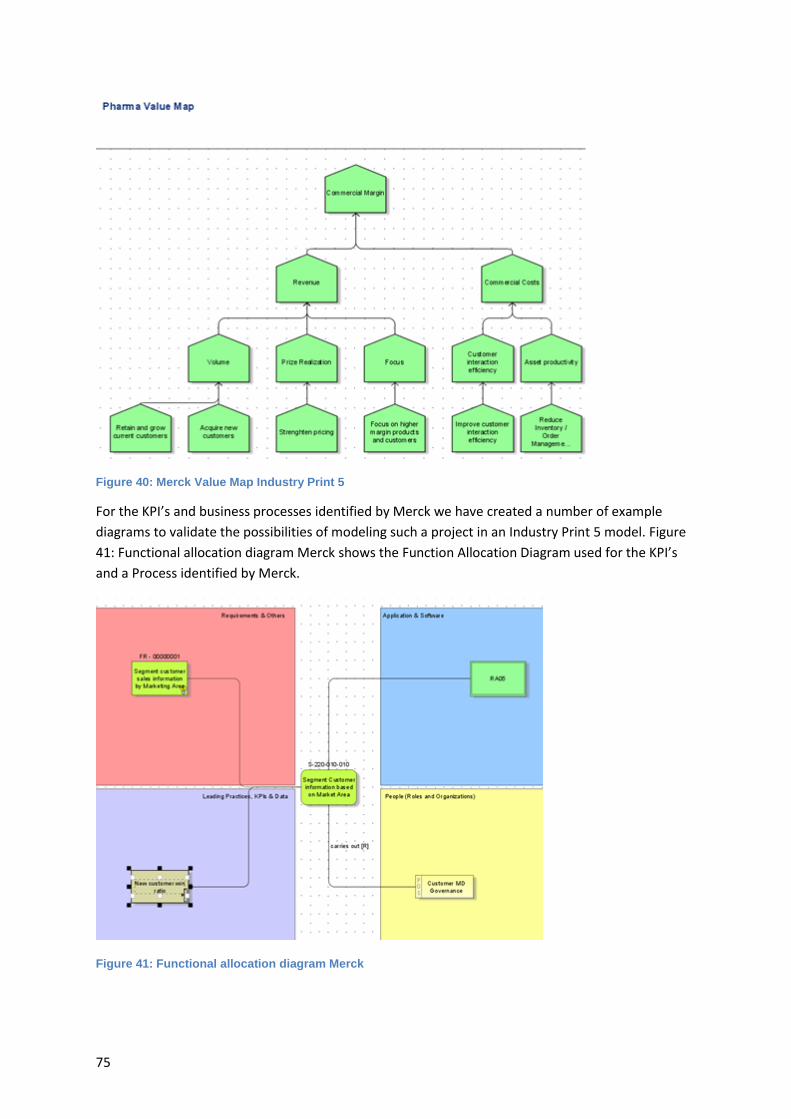
75
Figure 40: Merck Value Map Industry Print 5
For the KPI’s and business processes identified by Merck we have created a number of example
diagrams to validate the possibilities of modeling such a project in an Industry Print 5 model. Figure
41: Functional allocation diagram Merck shows the Function Allocation Diagram used for the KPI’s
and a Process identified by Merck.
Figure 41: Functional allocation diagram Merck

76
KPI Dashboard
As part of the Business Intelligence & Analytics group within Deloitte a set of reference KPI’s have
been included in a “KPI dashboard”. This KPI dashboard includes a set of 3000+ KPI’s. For each of the
KPI’s the following relationships are part of the KPI dashboard:
Industry
Business processes
Value Driver
The KPI’s from the KPI dashboard are available in the KPI dashboard (web application) as well as an
excel document. As part of the tooling for the BPM Value Map these KPI’s including all details have
been imported to Industry Print 5. Figure 42: KPI Dashboard shows an overview of all these KPI’s in
the KPI Allocation diagram for the KPI Dashboard. These KPI’s has been used in step 5 of the
framework “Develop business case for improvement actions” to build the business case for
improvement actions.
Figure 42: KPI Dashboard
8.2.3Findings case study
In the case study we found that it is possible to model the Enterprise Value Map created by Merck in
the Objective tree as described in the previous section. Additionally the KPI’s and Business processes
can be linked to the value drivers following the KPI allocation diagram and FAD.
We found that in the project no hierarchy has been used for KPI’s. Therefore this part of the tooling
has not been used in the case study. Additionally we have not been able to assess the maturity of
the processes of Merck which would be the next steps to determine improvement opportunities.
The case study has shown it is possible to develop a company specific Business Process Management
Value map. This validates the basic concept of the framework. As creating the framework only is part
77
of the application of the framework we have not been able to validate the complete application of
the framework.
8.3 Findings Validation The interviews with two organizations has shown that organizations can and would apply the
framework in practise . Both organizations indicated it is possible to complete all steps to apply the
framework. They both indicated that by setting up the framework itself would already provide them
useful information
However the interviews also showed that the way organizations apply the framework might be
catered to their characteristics. Heineken has indicated they would apply the framework for a large
department instead of the holistic organizations Additionally some organizations already know their
business processes, however MEE showed that some organizations first need to identify their
business process groups before mapping them to improvement levers.
The case study has shown the framework can be applied to a real organizations and that it is
possible to include the value drivers, processes and KPI’s in the framework. Unfortunately not all
steps of applying the framework have been addressed in the case study.
Overall the interviews and case study have shown it is possible to model the framework in practice
and organizations see both the benefit and feasibility of the application of the framework.

78
9. Conclusion In the previous chapters this research introduced a framework to support the portfolio management
process for BPM projects of organizations. This framework is based on literature, interviews with
experts and an expert session at Deloitte Consulting and validated with two organization interviews
and a case study. Based on the validation it is concluded that organizations would use the
framework in practice. It thereby reached the goal of this research:
“To develop a framework to identify, discuss and prioritize possible BPM improvement opportunities
related to shareholder value and organizational capability to support organizations in their BPM
portfolio management process”
This chapter will present the answers to the research questions, the limitations of the research and
give suggestions for further research.
Section 9.1 presents the answers to the research questions
Section9.2 presents the limitations of the research
Section 9.3 presents suggestions for further research
9.1 Answers to the research questions The main research questions of this research was “How can organizations identify, discuss and
prioritize all possible BPM opportunities in a single framework based on shareholder value and
organizational capability?”
This research questions is answered by answering a number of sub-questions. The sub-questions and
their answers are presented below.
Sub-question 1: What is shareholder value?
As described in chapter 2 shareholder value from an investor’s perspective is called Total
Shareholder Return and is based on the stock price appreciation and dividends of an organization.
Managing for value is also known as Value Based Management and is defined as “a formal
systematic approach to managing companies to achieve the objective of maximizing value creation
and shareholder value over time” and is concerned with understanding value drivers and their
interactions to develop an organizations strategy to achieve competitive advantage. Organizations
can relate improvement actions to shareholder value by dividing value drivers into so-called
improvement levers and relating the improvement actions to specific improvement levers.
Sub-question 2: What is Business Process Management?
Despite the fact that BPM is ranked as a top priority by organizations there is no common
understanding and definition of BPM. In this research BPM is broadly referred to as “Managing,
coordinating, prioritizing and monitoring an organization’s process change resources and
undertakings”. The main benefits of BPM are increasing efficiency, effectiveness and agility which
results in lowers costs and higher revenues. BPM is typically applied using the BPM life-cycle which
has the following six steps.

79
1. Analysis
2. Modeling
3. Implementation
4. Execution
5. Monitoring
6. Redesign
Sub-question 3: What is business process management maturity?
Maturity models are designed to assess the organizations maturity of a selected domain based on a
set of criteria. Business Process Maturity models are maturity models designed to assess the
organizations BPM maturity and are used to provide a base lining for determining BPM maturity in
an organization, provide insights into areas of weakness, identify improvement opportunities and
benchmark to organizations in the same industry. From a BPM maturity perspective the expectation
is that an increase of maturity results in an increase of organizational performance. However it is not
clear if organizations should strive to achieve the maximum maturity at all aspects.
The maturity model used in this research assesses the maturity of BPM using six criteria.
1. Strategic alignment
2. Governance
3. Methods
4. Information technology
5. People
6. Culture
Sub-questions 4: How can we relate BPM, BPMM and shareholder value in a framework?
To relate BPM, BPMM and shareholder value in a framework an organization has to relate their
business processes to all three aspects. For each business process an organization can perform the
six steps of the BPM life-cycle. However the maturity of the business process determines which
steps have already been take, which steps can be taken en which steps cannot be taken yet based on
the current maturity. To relate the possible steps to shareholder value the business processes have
to be related to the improvement levers of the organization.
Sub-question 5: How can we populate the framework?
As each organization has its own value drivers, improvement levers and business processes it is not
possible to develop one single framework for all organizations, instead all organizations have to
populate their own framework. How this is done is answered by sub-question 6. To develop a single
framework that can be used as a reference framework, reference value drivers, improvement levers
and business processes are needed. Based on the standard value drivers and improvement levers of
the Enterprise value Map of Deloitte and the reference business processes from Deloitte’s value link
a reference framework is populated be relating the business processes to the improvement levers
and BPM life-cycle steps.

80
Sub-question 6: How can organizations apply the framework in practice?
Each organization has its own value drivers, improvement levers and business processes. Therefore
the first two steps to apply the framework are:
1. Adapt value drivers and improvement levers to the business context
2. Link business process groups to improvement levers
To analyze which improvement actions are possible, an organization has to identify the BPM
maturity of each business process, which results in the third step:
3. Analyze business process management maturity of business process groups
Based on the improvement actions that are possible an organization has to develop a long-list with
improvement actions they want to perform. This long-list can be developed in two different ways,
top-down and bottom-up. By using the top-down approach the focus is on improvement actions
related to a specific value driver of improvement lever. By using the bottom-up approach the focus is
on business processes and the framework shows how they impact shareholder value. These two
approaches are part of the fourth step.
4. Identify possible improvement actions
Once the long-list has been developed, an organization has to reduce this long-list to a short list. This
is done by calculating the business case for the improvement actions on the long list in fifth step.
5. Develop business case for improvement actions
To distribute the costs and revenues of the improvement actions to the related improvement levers
they have to be mapped in the sixth step.
6. Map improvement actions to improvement levers
Based on the business case and the impact on value drivers the improvement actions have to be
prioritized. However the risk of performing the improvement actions also has to be taken into
account. This results in the seventh step which leads to a list of projects that will be performed.
7. Prioritize improvement actions based on value and risk
Sub-question 7: How can we validate the framework?
The framework is mainly based on a literature study, expert interviews at Deloitte Consulting and an
expert session at Deloitte Consulting. To validate the framework a qualitative approach has been
chosen, using interviews at organizations to assess the applicability and added value of the
framework and a case study to further validate the usability of the framework. Based on the results
of the interviews and case study we can assume that the framework can be applied by organizations
and adds value for these organizations.

81
9.2 Limitations Every research has its limitations and so has this research. First of all the most rigorous validation
method for the framework would have been a more detailed case study including all steps to apply
the framework. Also the number of organizations that are interviewed is limited and only gives an
indication of the applicability and added value of the framework.
Second, the research has developed a reference framework for organizations based on reference
value drivers, improvement levers and business processes. This reference framework is a high-level,
industry independent framework and cannot be used for all industries and organizations. It is
possible to develop reference frameworks for specific industries such as the public sector, by
determining reference value drivers, improvement levers and business processes for these
industries.
Third, even though the research describes a process to identify and prioritize BPM improvement
opportunities the main focus of the research has been on the identification of the BPM
improvement opportunities. The research describes a process how to prioritize BPM improvement
opportunities by developing a business case and prioritizing the BPM improvement on value and
risks. However as noticed in the validation the framework would work more effective if it would
determine reference KPI’s for improvement levers and/or business processes. The same goes for a
methodology to determine the risk of a BPM improvement opportunity.
Finally, the focus in identifying the organizational capability using a BPM maturity model is mainly
focused on increasing the methods, which are related to the BPM life cycle. The research does not
describe how an organization should increase the maturity based on strategic alignment,
governance, information technology, people and culture.
9.3 Further research Further research can improve the framework by further researching concepts of this research or
performing research to additional aspects of the framework.
First, as described in the research there is no common understanding of BPM. By developing a body
of knowledge of BPM and a agreed BPM life cycle practitioners and researchers will come to a
common understanding of BPM. This agreed BPM life cycle can be applied to business processes the
same way as the BPM life cycle used throughout this research.
Second, there are numerous BPM maturity models. Alike BPM there is no commonly agreed model
for BPM maturity and even less agreement on how to measure BPM maturity. By determining a
commonly agree model and measurement methodology and relating this to the business processes
benchmarking would be easier to perform.
Third, as stated in the previous section there is only a high-level reference model and no industry
specific reference models. By performing research to the value drivers, improvement levers and
business processes in a specific industry such industry specific reference frameworks can be
developed. The reference model also does not include reference KPI’s that can be used to develop
the business case for an improvement action. By identifying the KPI’s for the general reference
framework or industry specific frameworks organizations can develop better business cases.

82
Fourth, the research does not describe a method to identify the risk of a BPM improvement action.
Research to develop or identify such an method would make the steps to apply the framework more
complete.
Finally, further validation of the research would give better insights in the applicability and the
added value of the framework. Further validation could be achieved by performing a case study or
interviewing more organizations. By further validating the research improvement opportunities for
the framework can also be identified.

83
References Aalst, W. v., Hofstede, A. t., & Weske, M. (2003). Business Process Management: A Survey.
Conference on Business Process Management: On the Application of Formal Methods to
Process-Aware Information Systems (pp. 1-12). Eindhoven: Springer Lecture Notes in
Computer Science.
Agarwal, & Agarwal. (2003). Value balanced score card - a tool of performance appraisal. The
chartered accountant.
Armistead, & Machin. (1998). Business process management: implications for productivity in multi-
stage service networks. International Journal of Service Industry Management. .
Arveson, P. (1998). What is the balanced scorecard?
Bandara, W., Harmon, P., & Rosemann, M. (2010). Professionalizing Business Process Management:
Towards a Common Body of Knowledge for BPM. Wasana Bandara, Paul Harmon, Michael
Rosemann.
Batenburg, & Versendaal. (2008). Maturity Matters: Performance determinants of the procurement
business. Proceedings of the 16th European Conference on Information Systems. Galway.
Bruin, T. d., & Rosemann, M. (2006). Towards Understanding Strategic Alignment of Business Process
Management. ACIS 2006.
Bruin, T. d., Freeze, R., Kalkarni, U., & Rosemann, M. (2005). Understanding the Main Phases of
Developing a Maturity Assessment model. Australasian Conference on Information Systems.
Davenport, & Short. (1990). The New Industrial Engineering: Information Technology and Business
Process Redesign. Sloan Management Review.
DiPiazza, S., & Eccles, R. (2002). Building Public Trust. New York: John Wiley & Sons.
Drucker, P. F. (1981). Behind Japan's Succes. Harvard Business Review.
Elzinga, J., Horak, T., lee, C.-Y., & Bruner, C. (1995). Business Process Management: Survey and
Methodology. IEEE Transactions on Engineering Management , 119-128.
Fisher, D. M. (2004). The Business Process Maturity Model - A practical approach for identifying
opportunities for optimization. BPTrends, 1-7.
Gartner. (2010). Top Questions About Business Process Improvement. 29 January 2010.
Gulledge, & Sommer. (2002). Business process management: public sector implications. Business
Process Management Journal.
Harmon. (2003). Business process change: a manager's guide to improving, redesigning, and
automating processes. San Fransisco: Elsevier.
Harrington. (1995). Total Improvement Management – The Next Generation in Performance. New
York: McGraw-Hill.

84
Hevner, A., March, S., Park, J., & Ram, S. (2004). Design Science in Information Systems Research.
MIS Quarterly.
Hill, J., Cantara, M., Olding, e., Rosser, B., & Sinur, J. (2010). Top Questions About Business Process
Improvement. Gartner.
Hoffman, & Reiner. (2006). Drivers for improving supply chain performance: an empirical study.
International Journal of Integrated Supply Management, Hoffman, P., and G. Reiner.
Hung. (2006). Business process management as competitive advantage: a review and empirical study
. Total Quality Management & Business Excellence.
Indulska, M., Recker, J. C., Rosemann, M., & Green, P. (2009). Business process modeling : current
issues and future challenges. The 21st International Conference on Advanced Information
Systems.
Kaplan, & Norton. (1996). Using the balanced scorecard as a strategic management tool. Harvard
Business Review.
Kohler, E. L. (1985). A Dictionary for Accountants. New Delhi: Prentice Hall of India Private.
Lee, J., Lee, D., & Kang, S. (2007). An Overview of the Business Process Maturity Model.
PWeb/WAIM.
Lin, F.-R., Yang, M.-C., & Pai, Y.-H. (2002). A generic structure for business process modelling.
Business Process Management Journal, Fu-Ren Lin, Meng-Chyn Yang and Yu-Hua Pai.
Lusk, S., Paley, S., & Spanyi, A. (2005). The Evolution of Business Process Management as a
Professional Discipline. BPTrends, Sandra Lusk, Staci Paley, and Andrew Spanyi.
McCormack, K., Willems, J., Bergh, J. v., Deschoolmeester, D., Willaert, P., Stemberger, M. I., et al.
(2009). A global investigation of key turning points in business process maturity. Business
Process Management Journal, 792 - 815.
McTaggart, J. M., Kontes, P. w., & Mankins, M. c. (1994). The value imperative: Managing for
superior shareholder returns . New York: Free press.
Michele Cantara, J. D. (2010). Research Index: A Guide to Principles of Business Process
Management, Update. Gartner.
Moore, C. (2008). Drive BPM Initiatives To Higher Business Value. BPTrends.
Muehlen, M., & Recker, J. C. (2008). How Much Language is Enough? Theoretical and Practical Use of
the Business Language is Enough? Theoretical and Practical Use of the Business. Springer.
Olding. (2007). Three Examples of BPM Worst Practices and How to Avoid Them. Garnter.
O'Niell, & Sohal. (1999). Business Process Reengineering - A review of recent literature.
Technovation.

85
Paulk, M. C., Paulk, M. C., Chrissis, M. B., & Weber, C. V. (1993). Capability Maturity Model for
Software - version 1.1. Software Engineering Institute.
Pesic. (sd). Business Process Management Maturity Model and Six Sigma: An integrated approach for
easier networking.
Raschke, & Ingraham. (2010). Business Process Maturity’s Effect on Performance. Americas
Conference on Information Systems.
Rosemann. (2006). Process Portfolio Management. BPTrends.
Rosemann. (2008). The Service Portfolio of a BPM Center of Excellence. BPTrends.
Rosemann, M., & Brocke, J. v. (2010). The Six Core Elements of Business Process Management. In M.
Rosemann, & J. v. Brocke, The Six Core Elements of Business Process Management (pp. 107 -
122).
Rosemann, M., & Bruin, T. d. (sd). Towards a Business Process Management Maturity Model.
Rudden, J. (2007). Making the Case for BPM: A Benefits Checklist. BPTrends.
Sinur, J., & Hill, J. (sd). ITScore Overview for Business Process Management. Gartner 2010, Jim Sinur,
Janelle B. Hill.
Smart, & Maull, M. (2009). Understanding Business Process Management Implications for Theory
and Practice. British journal of management, P. A. Smart, H. Maddern and R. S. Maull.
Smith, & Fingar. (2003). Business Process Management - The Third Wave. Tampa: Meghan-Kiffer
Press.
Starovic, D., Cooper, S., & Davis, M. (2004). Maximising Shareholder Value. The chartered institute of
management accountants.
Vergidis, K. (2008). Business process perspectives: Theoretical developments vs. real-world practice.
International Journal of Production Economics, 91-104.
Zairi. (1997). Business process management - a boundaryless approach to modern competitiveness.
Business Process Management.

86
Glossary BPM Business Process Management
BPMM Business Process Management Maturity
EV Enterprise Value
EVM Enterprise Value Map
List of figures
Figure 1: Research approach.................................................................................................................. 8
Figure 2: Four processes of the Balanced Score Card ......................................................................... 13
Figure 3: Balanced Score Card strategy map ....................................................................................... 13
Figure 4: Enterprise Value Map structure ............................................................................................. 16
Figure 5: Portfolio quadrants ................................................................................................................. 19
Figure 6: BPM Life Cycle ...................................................................................................................... 19
Figure 7: BPM Life Cycle Aalst et al. .................................................................................................... 20
Figure 8: BPM Life Cycle Smith and Fingar .......................................................................................... 20
Figure 9: An example Business Process Model in BPMN (Muehlen & Recker, 2008) ......................... 21
Figure 10: The five levels of software process maturity ........................................................................ 25
Figure 11: Decomposition of maturity levels ......................................................................................... 25
Figure 12: Phases in developing a maturity assessment model........................................................... 26
Figure 13: Relationship between BPMM, BPM and Value according to Forrester ............................... 29
Figure 14: Relationship between BPM and BPMM ............................................................................... 30
Figure 15: Improvement opportunities Sales Process .......................................................................... 32
Figure 16: Enterprise Value Map structure example ............................................................................ 34
Figure 17: Improvement levers Sales Process ..................................................................................... 34
Figure 18: improvement leader “Marketing & Sales” and related business process ............................ 36
Figure 19: Marketing & Sales business process maturity ..................................................................... 38
Figure 20: Sub-value drivers and improvement levers of revenue growth ........................................... 41
Figure 21: Sub-value drivers and improvement levers of operating margin ......................................... 42
Figure 22: Sub-value drivers and improvement levers of Asset Efficiency ........................................... 43
Figure 23: Sub-value drivers and improvement levers of expectations ................................................ 44
Figure 24: Enterprise Value Map Reference Framework ..................................................................... 47
Figure 25: Value drivers Lorum Ipsum .................................................................................................. 50
Figure 26: overview of possible improvement actions .......................................................................... 53
Figure 27: Financial impact template .................................................................................................... 56
Figure 28: Improvement action mapping .............................................................................................. 57
Figure 29: Prioritization matrix .............................................................................................................. 58
Figure 30: Enterprise Value Map IP5 .................................................................................................... 68
Figure 31: KPI allocation diagram ......................................................................................................... 69
Figure 32: IndustryPrint 5 Process Diagram ......................................................................................... 69
Figure 33: Reference processes ........................................................................................................... 70
Figure 34: KPI Allocation diagram including value driver ..................................................................... 71
Figure 35: Industry Print 5 associations ................................................................................................ 72
Figure 36: Enterprise Value Map Merck ............................................................................................... 73
Figure 37: Business processes Merck .................................................................................................. 73

87
Figure 38: KPI's Merck .......................................................................................................................... 74
Figure 39: KPI and business process mapping Merck ......................................................................... 74
Figure 40: Merck Value Map Industry Print 5 ........................................................................................ 75
Figure 41: Functional allocation diagram Merck ................................................................................... 75
Figure 42: KPI Dashboard..................................................................................................................... 76

88
Appendices
Appendix A: Enterprise Value Map base