CLN 1.0 Progress Report_print
77
The Conservation Lands Network CLN 1.0 PROGRESS REPORT Think Big. Connect More. www.bayarealands.org
-
Upload
crystal-simons -
Category
Documents
-
view
58 -
download
0
Transcript of CLN 1.0 Progress Report_print
The Conservation Lands Network
CLN 1.0 Progress rePorT
Think Big. Connect More.www.bayarealands.org
Table of Contents
CitationThis document should be cited as follows:
Bay Area Open Space Council. 2014. The Conservation Lands Network 1.0 Progress Report. Berkeley, CA.
Additional Copies and More InformationThis report, the original Conservation Lands Network 1.0 Report, accompanying technical documents, and related tools for conservation practitioners are available online at www.bayarealands.org.
The Bay Area Open Space Council is a collaborative of member organizations actively involved in permanently protecting and stewarding important parks, trails and working lands in the ten-county San Francisco Bay Area.
2150 Allston Way, Suite 320, Berkeley, CA 94704 510.809.8009 • openspacecouncil.org
Foreword ................................................................................. i
1 The Conservation Lands Network ..................................1
2 CLN 1.0 Progress Report ..................................................9
3 Protected Lands ..............................................................15
4 Biodiversity and Habitat ................................................28
5 Water Resources .............................................................38
6 People and Conservation ...............................................49
7 Next Steps for the Conservation Lands Network .......66
References ...........................................................................70
Cover Photo by Stuart Weiss
Conservation Lands Network 1.0 Progress Report | Foreword i
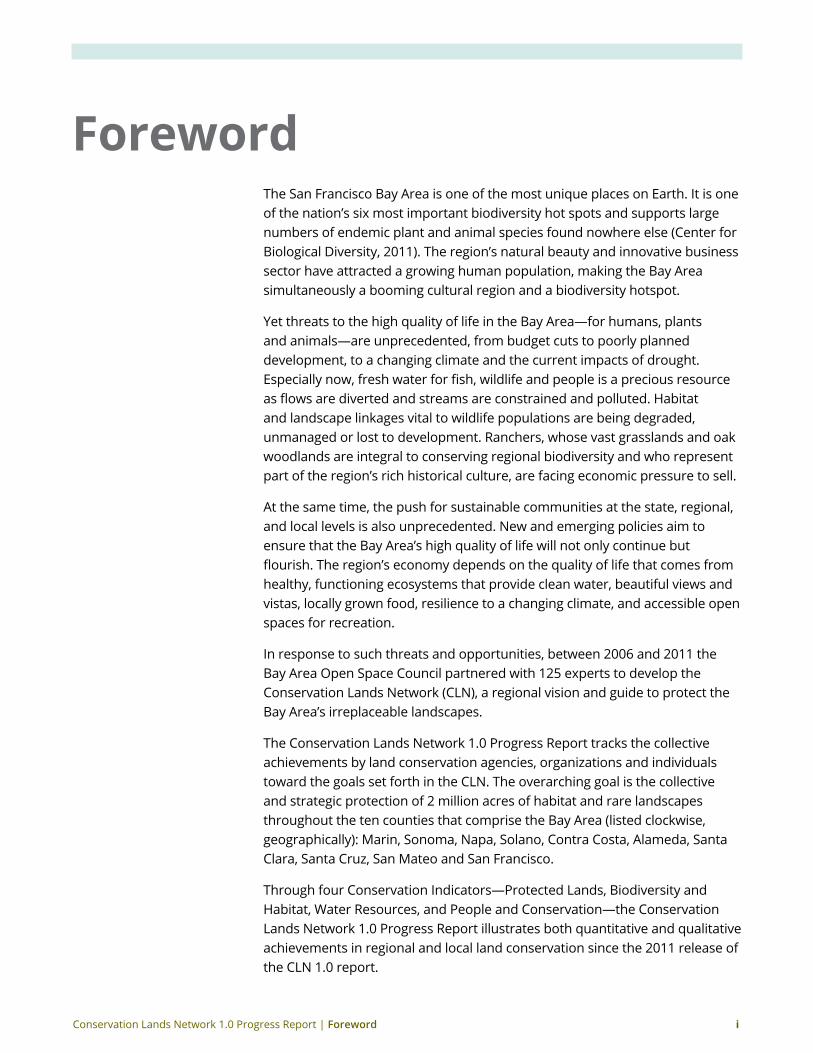
ForewordThe San Francisco Bay Area is one of the most unique places on Earth. It is one of the nation’s six most important biodiversity hot spots and supports large numbers of endemic plant and animal species found nowhere else (Center for Biological Diversity, 2011). The region’s natural beauty and innovative business sector have attracted a growing human population, making the Bay Area simultaneously a booming cultural region and a biodiversity hotspot.
Yet threats to the high quality of life in the Bay Area—for humans, plants and animals—are unprecedented, from budget cuts to poorly planned development, to a changing climate and the current impacts of drought. Especially now, fresh water for fish, wildlife and people is a precious resource as flows are diverted and streams are constrained and polluted. Habitat and landscape linkages vital to wildlife populations are being degraded, unmanaged or lost to development. Ranchers, whose vast grasslands and oak woodlands are integral to conserving regional biodiversity and who represent part of the region’s rich historical culture, are facing economic pressure to sell.
At the same time, the push for sustainable communities at the state, regional, and local levels is also unprecedented. New and emerging policies aim to ensure that the Bay Area’s high quality of life will not only continue but flourish. The region’s economy depends on the quality of life that comes from healthy, functioning ecosystems that provide clean water, beautiful views and vistas, locally grown food, resilience to a changing climate, and accessible open spaces for recreation.
In response to such threats and opportunities, between 2006 and 2011 the Bay Area Open Space Council partnered with 125 experts to develop the Conservation Lands Network (CLN), a regional vision and guide to protect the Bay Area’s irreplaceable landscapes.
The Conservation Lands Network 1.0 Progress Report tracks the collective achievements by land conservation agencies, organizations and individuals toward the goals set forth in the CLN. The overarching goal is the collective and strategic protection of 2 million acres of habitat and rare landscapes throughout the ten counties that comprise the Bay Area (listed clockwise, geographically): Marin, Sonoma, Napa, Solano, Contra Costa, Alameda, Santa Clara, Santa Cruz, San Mateo and San Francisco.
Through four Conservation Indicators—Protected Lands, Biodiversity and Habitat, Water Resources, and People and Conservation—the Conservation Lands Network 1.0 Progress Report illustrates both quantitative and qualitative achievements in regional and local land conservation since the 2011 release of the CLN 1.0 report.
Conservation Lands Network 1.0 Progress Report | Foreword ii
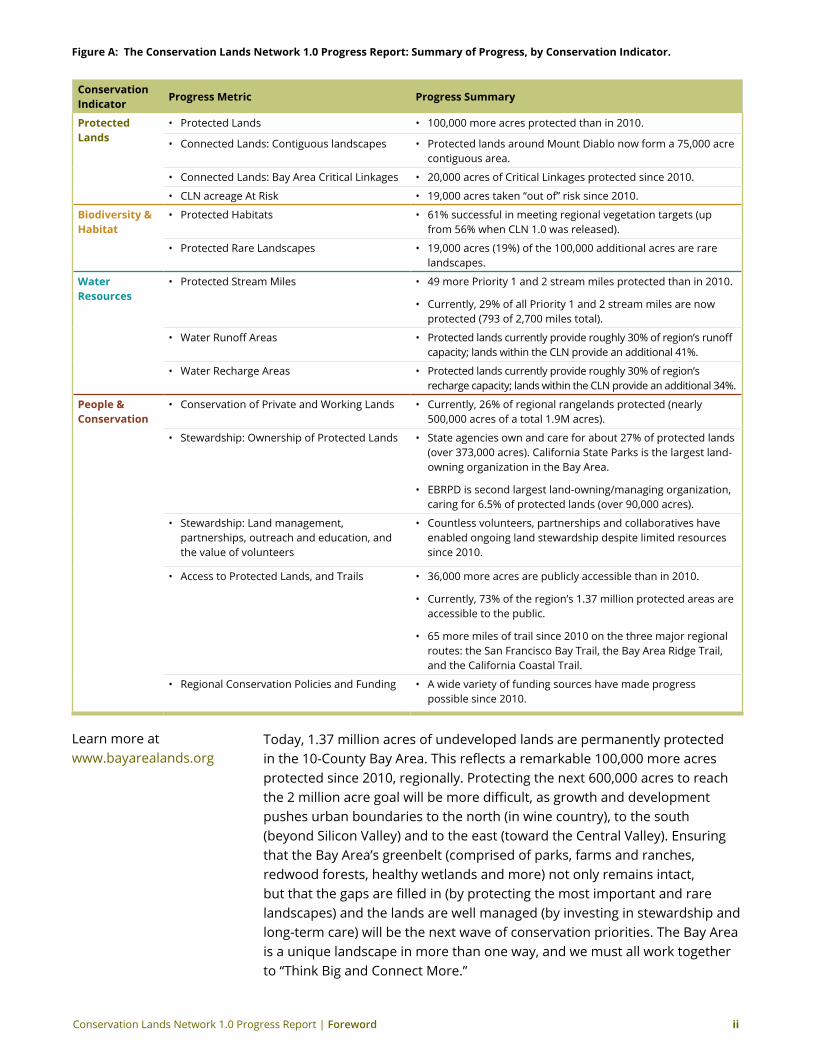
Figure A: The Conservation Lands Network 1.0 Progress report: summary of Progress, by Conservation Indicator.
Conservation Indicator
Progress Metric Progress summary
Protected Lands
• Protected Lands • 100,000 more acres protected than in 2010.
• Connected Lands: Contiguous landscapes • Protected lands around Mount Diablo now form a 75,000 acre contiguous area.
• Connected Lands: Bay Area Critical Linkages • 20,000 acres of Critical Linkages protected since 2010.
• CLN acreage At Risk • 19,000 acres taken “out of” risk since 2010.
Biodiversity & Habitat
• Protected Habitats • 61% successful in meeting regional vegetation targets (up from 56% when CLN 1.0 was released).
• Protected Rare Landscapes • 19,000 acres (19%) of the 100,000 additional acres are rare landscapes.
Water resources
• Protected Stream Miles • 49 more Priority 1 and 2 stream miles protected than in 2010.
• Currently, 29% of all Priority 1 and 2 stream miles are now protected (793 of 2,700 miles total).
• Water Runoff Areas • Protected lands currently provide roughly 30% of region’s runoff capacity; lands within the CLN provide an additional 41%.
• Water Recharge Areas • Protected lands currently provide roughly 30% of region’s recharge capacity; lands within the CLN provide an additional 34%.
People & Conservation
• Conservation of Private and Working Lands • Currently, 26% of regional rangelands protected (nearly 500,000 acres of a total 1.9M acres).
• Stewardship: Ownership of Protected Lands • State agencies own and care for about 27% of protected lands (over 373,000 acres). California State Parks is the largest land-owning organization in the Bay Area.
• EBRPD is second largest land-owning/managing organization, caring for 6.5% of protected lands (over 90,000 acres).
• Stewardship: Land management, partnerships, outreach and education, and the value of volunteers
• Countless volunteers, partnerships and collaboratives have enabled ongoing land stewardship despite limited resources since 2010.
• Access to Protected Lands, and Trails • 36,000 more acres are publicly accessible than in 2010.
• Currently, 73% of the region’s 1.37 million protected areas are accessible to the public.
• 65 more miles of trail since 2010 on the three major regional routes: the San Francisco Bay Trail, the Bay Area Ridge Trail, and the California Coastal Trail.
• Regional Conservation Policies and Funding • A wide variety of funding sources have made progress possible since 2010.
Today, 1.37 million acres of undeveloped lands are permanently protected in the 10-County Bay Area. This reflects a remarkable 100,000 more acres protected since 2010, regionally. Protecting the next 600,000 acres to reach the 2 million acre goal will be more difficult, as growth and development pushes urban boundaries to the north (in wine country), to the south (beyond Silicon Valley) and to the east (toward the Central Valley). Ensuring that the Bay Area’s greenbelt (comprised of parks, farms and ranches, redwood forests, healthy wetlands and more) not only remains intact, but that the gaps are filled in (by protecting the most important and rare landscapes) and the lands are well managed (by investing in stewardship and long-term care) will be the next wave of conservation priorities. The Bay Area is a unique landscape in more than one way, and we must all work together to “Think Big and Connect More.”
Learn more at www.bayarealands.org
Conservation Lands Network 1.0 Progress Report | Foreword iii
Project FundingFunding for the Conservation Lands Network 1.0 Progress Report has been generously provided by the Gordon and Betty Moore Foundation and the California State Coastal Conservancy. Visit our funders at www.moore.org and www.scc.ca.gov.
Project TeamThe CLN 1.0 Progress Report is a project by the Bay Area Open Space Council and was a collaborative effort by the following:
Project Manager and Conservation Planner Crystal Simons, Bay Area Open Space Council
Science Advisor and Conservation Planner Stuart B. Weiss, Ph.D., Creekside Center for Earth Observation
Data analysis, GIS and Cartography GreenInfo Network (Amanda Recinos, Laura Daly), Stuart Weiss, Crystal Simons, Ryan Branciforte
Report Authors Crystal Simons, with Stuart Weiss, Annie Burke, Jenn Fox, and Angel Hertslet.
Report Design Kathy Switky, Switky Communications Group
Web Design and Graphics Lilli Keinanen, Keinanen Graphic Design
Web Development of www.bayarealands.org GreenInfo Network (Tim Sinnott)
Bay Area Open Space Council Staff Jenn Fox, Executive Director Annie Burke, Deputy Director Crystal Simons, (Protecting Land) Program Manager Angel Hertslet, (Protecting Land) Program Intern
Visit Us: Bay Area Open Space Council: www.openspacecouncil.org GreenInfo Network: www.greeninfo.org Creekside Center for Earth Observation: www.creeksidescience.com Switky Communications Group: www.switky.org Keinaenen Graphic Design: www.keinaenen.com
report reviewRon Brown, Wendy Eliot, Adam Garcia, Matt Gerhart, Meredith Hendricks, Amanda Recinos, Paul Ringgold, Nancy Schaefer, and Jamison Watts.
Conservation Lands Network 1.0 Progress Report | Chapter 1: The Conservation Lands Network 1
1 The Conservation Lands Network
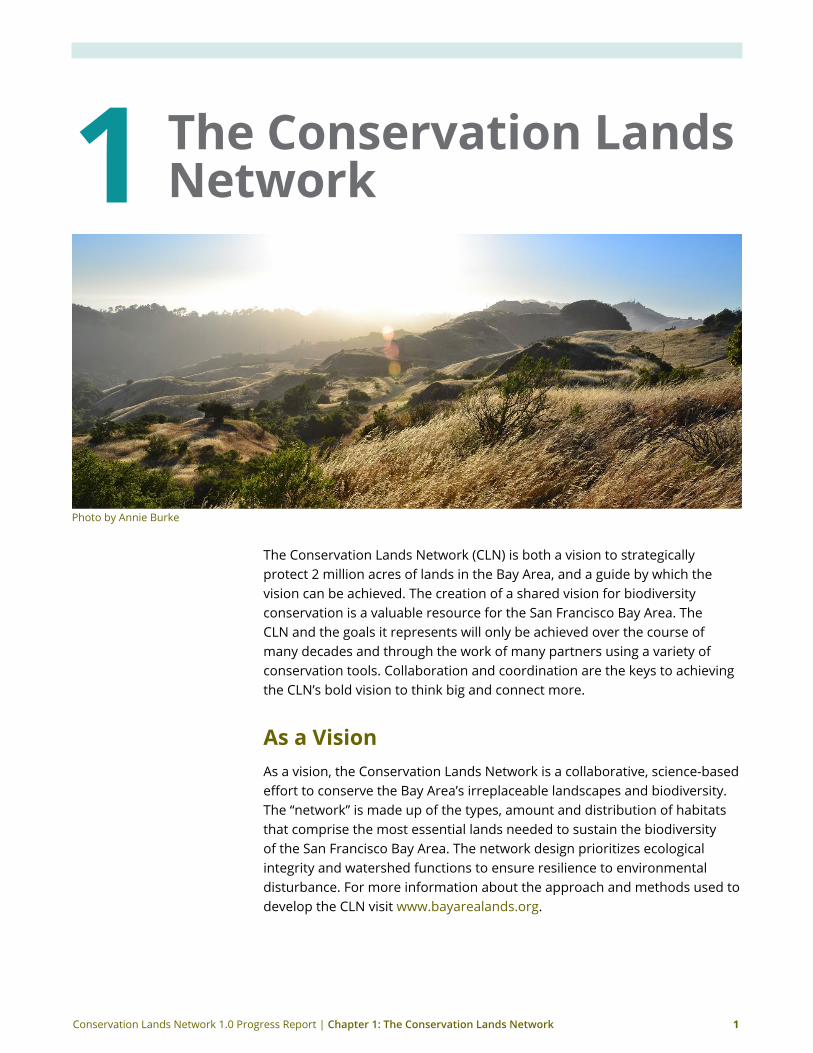
Photo by Annie Burke
The Conservation Lands Network (CLN) is both a vision to strategically protect 2 million acres of lands in the Bay Area, and a guide by which the vision can be achieved. The creation of a shared vision for biodiversity conservation is a valuable resource for the San Francisco Bay Area. The CLN and the goals it represents will only be achieved over the course of many decades and through the work of many partners using a variety of conservation tools. Collaboration and coordination are the keys to achieving the CLN’s bold vision to think big and connect more.
As a VisionAs a vision, the Conservation Lands Network is a collaborative, science-based effort to conserve the Bay Area’s irreplaceable landscapes and biodiversity. The “network” is made up of the types, amount and distribution of habitats that comprise the most essential lands needed to sustain the biodiversity of the San Francisco Bay Area. The network design prioritizes ecological integrity and watershed functions to ensure resilience to environmental disturbance. For more information about the approach and methods used to develop the CLN visit www.bayarealands.org.
Conservation Lands Network 1.0 Progress Report | Chapter 1: The Conservation Lands Network 2
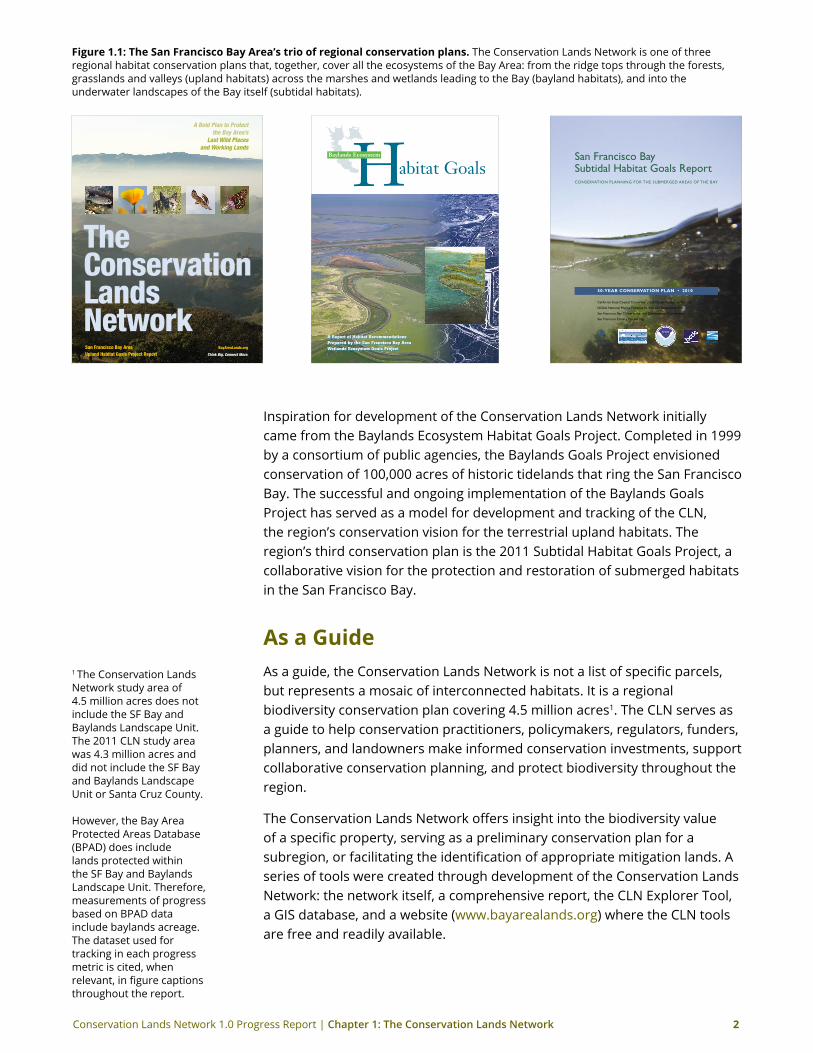
Figure 1.1: The san Francisco Bay Area’s trio of regional conservation plans. The Conservation Lands Network is one of three regional habitat conservation plans that, together, cover all the ecosystems of the Bay Area: from the ridge tops through the forests, grasslands and valleys (upland habitats) across the marshes and wetlands leading to the Bay (bayland habitats), and into the underwater landscapes of the Bay itself (subtidal habitats).
Habitat GoalsBaylands Ecosystem
Baylands E
cosystemH
abitat Goals
Habitat G
oals
A Report of Habitat Recommendations Prepared by the San Francisco Bay Area Wetlands Ecosystem Goals Project
A Report of Habitat Recommendations Prepared by the San Francisco Bay Area Wetlands Ecosystem Goals Project
Teams of Bay Area environmental scientists have assessedthe past and present conditions of the baylands ecosystem and recommended ways to improve its ecological health. This report presents the Baylands Ecosystem Goals.
The Conservation Lands Network
A Bold Plan to Protectthe Bay Area’s
Last Wild Placesand Working Lands
San Francisco Bay Area Upland Habitat Goals Project Report
BayAreaLands.org
Think Big. Connect More.
San Francisco Bay Subtidal Habitat Goals ReportConSeRvation PlanninG FoR tHe SuBmeRGed aReaS oF tHe Bay
50-Year Conservation Plan • 2010
California State Coastal Conservancy and ocean Protection Council
noaa national marine Fisheries Service and Restoration Center
San Francisco Bay Conservation and development Commission
San Francisco estuary Partnership
Inspiration for development of the Conservation Lands Network initially came from the Baylands Ecosystem Habitat Goals Project. Completed in 1999 by a consortium of public agencies, the Baylands Goals Project envisioned conservation of 100,000 acres of historic tidelands that ring the San Francisco Bay. The successful and ongoing implementation of the Baylands Goals Project has served as a model for development and tracking of the CLN, the region’s conservation vision for the terrestrial upland habitats. The region’s third conservation plan is the 2011 Subtidal Habitat Goals Project, a collaborative vision for the protection and restoration of submerged habitats in the San Francisco Bay.
As a guideAs a guide, the Conservation Lands Network is not a list of specific parcels, but represents a mosaic of interconnected habitats. It is a regional biodiversity conservation plan covering 4.5 million acres1. The CLN serves as a guide to help conservation practitioners, policymakers, regulators, funders, planners, and landowners make informed conservation investments, support collaborative conservation planning, and protect biodiversity throughout the region.
The Conservation Lands Network offers insight into the biodiversity value of a specific property, serving as a preliminary conservation plan for a subregion, or facilitating the identification of appropriate mitigation lands. A series of tools were created through development of the Conservation Lands Network: the network itself, a comprehensive report, the CLN Explorer Tool, a GIS database, and a website (www.bayarealands.org) where the CLN tools are free and readily available.
1 The Conservation Lands Network study area of 4.5 million acres does not include the SF Bay and Baylands Landscape Unit. The 2011 CLN study area was 4.3 million acres and did not include the SF Bay and Baylands Landscape Unit or Santa Cruz County. However, the Bay Area Protected Areas Database (BPAD) does include lands protected within the SF Bay and Baylands Landscape Unit. Therefore, measurements of progress based on BPAD data include baylands acreage. The dataset used for tracking in each progress metric is cited, when relevant, in figure captions throughout the report.
Conservation Lands Network 1.0 Progress Report | Chapter 1: The Conservation Lands Network 3
Tools: Conservation Lands Network• CLN 1.0 Report. Published in 2011, the Conservation Lands Network
1.0 report documents the project data, methodology, conclusions and recommendations for implementation and continued progress tracking of the CLN.
• CLN Explorer Tool. The Conservation Lands Network Explorer is an interactive online mapping tool that makes the maps and underlying data of the CLN readily available. Through the CLN Explorer, a user can analyze the conservation value of any landscape in the Bay Area, and print comprehensive Biodiversity and Climate Profile reports, without requiring GIS software or capabilities.
• CLN GIS Database. All publicly available datasets used for the analysis and development of each version of the Conservation Lands Network.
• Website: www.bayarealands.org is the home base for the CLN. All tools, datasets, reports and steps to take action toward protecting land can be found at www.bayarealands.org. First launched in 2011 with the CLN 1.0 report, the website has been updated in conjunction with the release of the CLN 1.0 Progress Report.
Versions and releasesThe first version of the CLN, version 1.0, was released in 2011. The full report and supporting documents and data can be downloaded at www.bayarealands.org. The Bay Area Open Space Council is currently planning for CLN 2.0, anticipated for release in 2016. With each updated version of the CLN, the network will be re-delineated to represent the most accurate configuration of habitats essential for conserving the Bay Area’s biodiversity. As new lands are protected—and as others are converted to urban or cultivated croplands—the configuration of the CLN will shift to account for the values those protected lands provide. Thus, the CLN is a dynamic and ever-evolving vision and guide.
Progress reports, like this one, will be released periodically to highlight regional and local achievements toward the vision and guide set by CLN 1.0. Details about the CLN Progress Report analysis and methodology can be found in the CLN 1.0 Progress Report Appendix at www.bayarealands.org.
Dates and data for progress reporting The first version of the CLN, version 1.0, was released in 2011 but the geographic and spatial data used in its development were from 2010. Therefore, unless otherwise noted, all progress measurements reported in the CLN 1.0 Progress Report are a measure of change from 2010 to 2013.
Conservation Lands Network 1.0 Progress Report | Chapter 1: The Conservation Lands Network 4
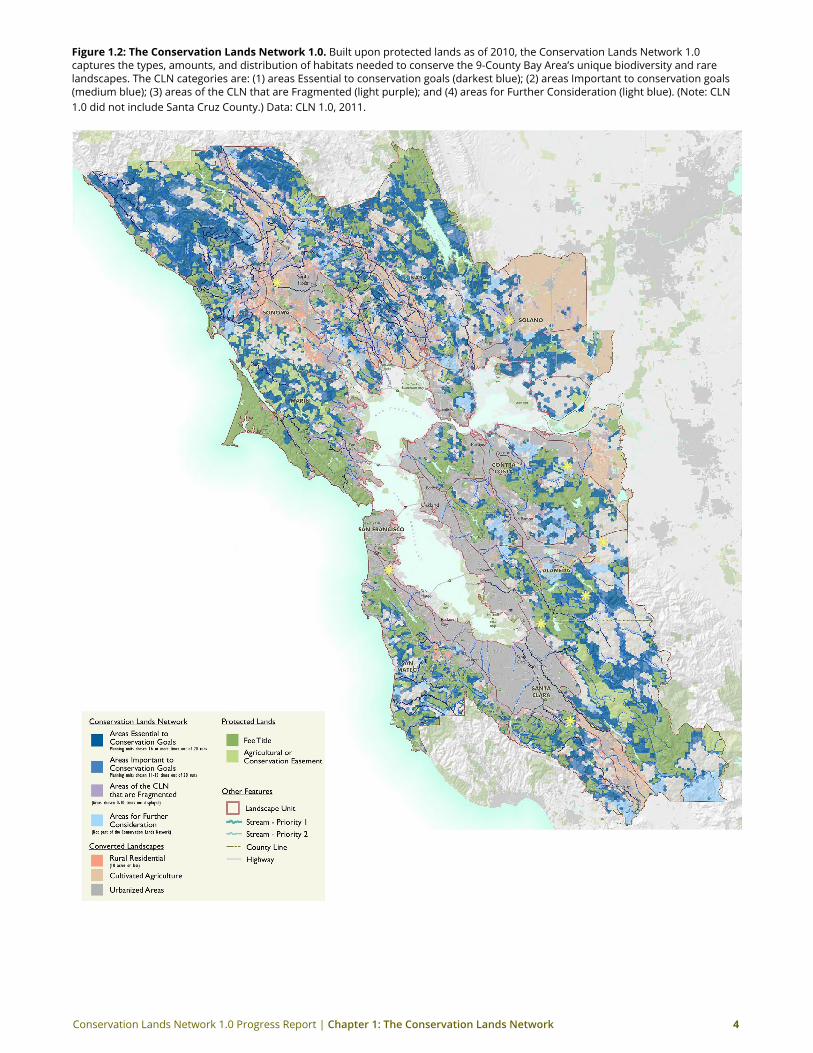
Figure 1.2: The Conservation Lands Network 1.0. Built upon protected lands as of 2010, the Conservation Lands Network 1.0 captures the types, amounts, and distribution of habitats needed to conserve the 9-County Bay Area’s unique biodiversity and rare landscapes. The CLN categories are: (1) areas Essential to conservation goals (darkest blue); (2) areas Important to conservation goals (medium blue); (3) areas of the CLN that are Fragmented (light purple); and (4) areas for Further Consideration (light blue). (Note: CLN 1.0 did not include Santa Cruz County.) Data: CLN 1.0, 2011.
Conservation Lands Network 1.0 Progress Report | Chapter 1: The Conservation Lands Network 5
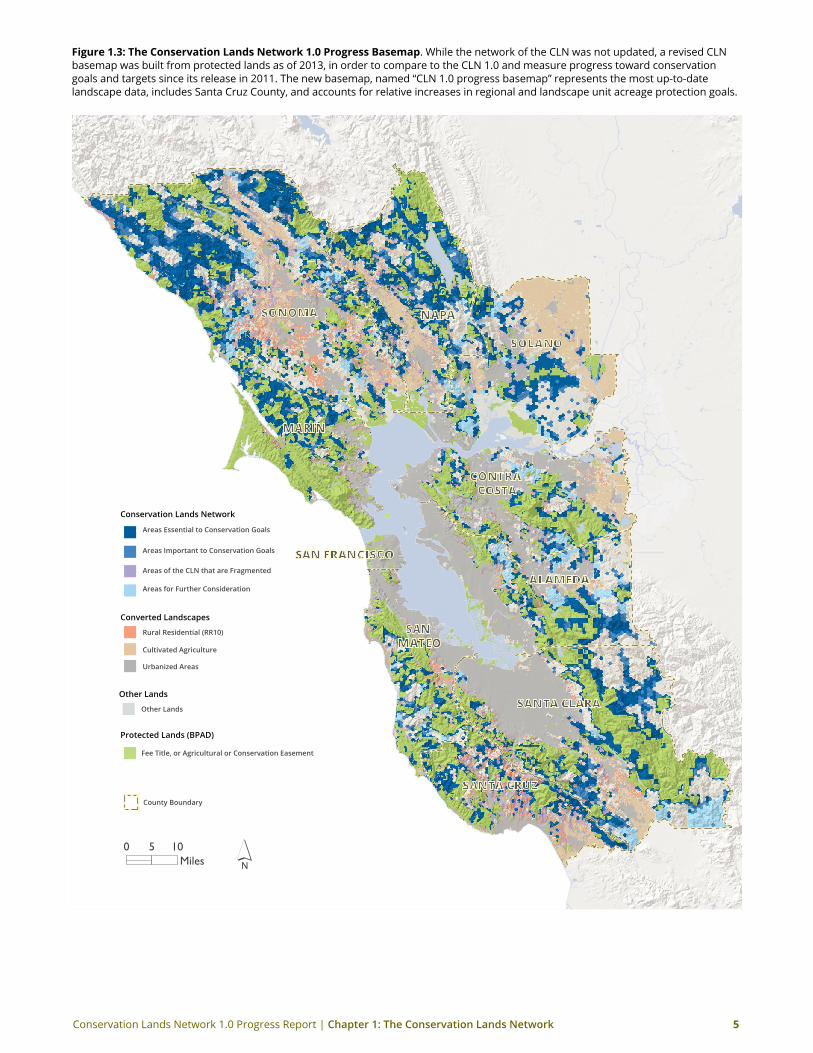
Figure 1.3: The Conservation Lands Network 1.0 Progress Basemap. While the network of the CLN was not updated, a revised CLN basemap was built from protected lands as of 2013, in order to compare to the CLN 1.0 and measure progress toward conservation goals and targets since its release in 2011. The new basemap, named “CLN 1.0 progress basemap” represents the most up-to-date landscape data, includes Santa Cruz County, and accounts for relative increases in regional and landscape unit acreage protection goals.
NAPA
SANTA CRUZ
SONOMA
CONTRA COSTA
ALAMEDA
SAN FRANCISCO
MARIN
SOLANO
SAN MATEO
SANTA CLARA
0 5 10Miles
Protected Lands (BPAD)
Conservation Lands Network
Converted Landscapes
Urbanized Areas
Cultivated Agriculture
Rural Residential (RR10)
Areas for Further Consideration
Areas of the CLN that are Fragmented
Areas Essential to Conservation Goals
Areas Important to Conservation Goals
Fee Title, or Agricultural or Conservation Easement
Other Lands
Other Lands
County Boundary
Conservation Lands Network 1.0 Progress Report | Chapter 1: The Conservation Lands Network 6
CLN 1.0 Conservation goals The Conservation Lands Network 1.0 represents much of what is currently known about the distribution of biodiversity (key habitats for target species, rare landscapes, and unique lands) in the San Francisco Bay Area. The study area for the CLN 1.0 was the nine-county Bay Area (Alameda, Contra Costa, Marin, Napa, San Francisco, San Mateo, Santa Clara, Solano, and Sonoma).
The conservation goals, targets and recommendations set forth in the Conservation Lands Network 1.0 are the goals, targets and measures to which the CLN 1.0 Progress Report tracks achievements.
regional Acreage Protection goal
Strategically protect 2 million acres of Bay Area upland habitat and rare landscapes.
The Conservation Lands Network encompasses roughly 2.2 million acres of the region’s total land. In other words, approximately half of the land in the Bay Area is essential to conserve if we are to protect the region’s unique lands and ecosystems—not to mention the ability of these lands to continue to provide a high quality of life. This includes habitats and rare landscapes on both private and public lands, protected through fee and conservation easements.
Habitat and rare Landscape Protection goals
Protect key habitats and rare landscapes.
The Conservation Lands Network identifies acreage protection goals for each of the 52 vegetation types found throughout the Bay Area. Vegetation types are an indicator for habitat; rare vegetation types are synonymous to rare landscapes.
Conservation of habitats and rare landscapes provide multiple benefits for realization of other conservation and quality of life goals including recreation, local food production, healthy watershed function and more.
Fish and riparian Habitat goals
Save our streams and the ecological processes they rely upon.
Streams are integral to ecosystem health and provide habitat for fish, mammals, birds and vital ecosystem services to humans. Riparian areas offering cool, shady areas are especially important in a changing climate. Watershed-scale planning is proving to be a key tool for restoring riparian ecosystems across both upland and bayland landscapes.
Conservation goals for Fish and Riparian Habitat were set in CLN 1.0. Logically, hydrologic watershed boundaries were used for conservation goal development, rather than the CLN landscape units used for other fine filter targets. Due to the linearity of streams, stream health and the quality of riparian and fish habitat is impacted by the land uses in the entire
Conservation Lands Network 1.0 Progress Report | Chapter 1: The Conservation Lands Network 7
watershed. For this reason, stream corridors in urban areas are included in the Conservation Lands Network.
CLN Implementation goals
Supporting efforts, partnerships, incentives and targets for protecting and managing 2 million acres of Bay Area lands.
While counting acres is the quantitative measure from which we track land conservation progress, many other collaborations, partnerships, incentives, targets, policies and efforts are necessary for the successful and collective strategic protection of 2 million acres. Accordingly, the following qualitative implementation goals were identified in CLN 1.0:
Private LandsThe Conservation Lands Network includes both public and private lands, as habitats and rare landscapes span property boundaries and fence lines. Working lands, in particular, are important for implementation of the CLN, and incentives to keep working lands in production are needed2.
stewardshipIn addition to conserving land, adaptive management, monitoring and stewardship of protected and open lands are essential to maintain and restore the ecological processes upon which biodiversity and quality of life in the Bay Area depends.
Public PolicyThe adoption and enforcement of strong federal, state and local policies, regulations, incentives and collaborative programs to conserve and maintain biodiversity is necessary.
outreach and education Spread the word to policy makers and funders, and collaborate with regional partners to communicate the values and goals of the Conservation Lands Network, and form new partnerships to reach the goals.
Funding for ConservationTo make the Conservation Lands Network a reality, it is imperative to use existing resources effectively, and to increase the amount of funding available for land and watershed protection and long-term stewardship.
2 The Bay Area Open Space Council recognizes the conservation value of working and agricultural landscapes in the implementation of any regional conservation vision. Yet, the CLN is focused on habitats and rare landscapes with biodiversity value. Thefore, in the CLN 1.0, the land cover type “cultivated croplands” was categorized as a converted landscape, along with urban. Therefore, in the CLN 1.0 Progress Report, some progress metrics do not fully represent the value agricultural lands contribute to regional quality of life, greenbelt protection, or even land conservation values. In future updates of the CLN, the role agricultural lands play toward achieving the 2 million acres protected goal will be considered carefully.
Conservation Lands Network 1.0 Progress Report | Chapter 1: The Conservation Lands Network 8
Tracking regional conservation progressGood decision-making requires good information. The Conservation Lands Network provides conservation practitioners, public officials, scientists, decision makers, and others with important insight into the diversity, integrity and connectivity of habitats, landscapes and ecosystems throughout the Bay Area. The goals set forth for protecting these important lands are sourced from the physical and geographic condition of the landscapes themselves. By tracking progress, we ensure that as a region we are indeed strategic, collaborative and coordinated in our efforts to strategically protect the next 600,000 acres in order to reach the 2 million acre goal.
More reasons to track conservation progress regionally include:
• The Bay Area is a biodiversity hotspot—a region with high biological diversity coupled with extensive habitat loss. Bay Area biodiversity is threatened by the region’s economic prosperity and rate of growth. Tracking our progress is an important step in successful protection and stewardship of the diverse habitats and rare landscapes that make the Bay Area unique.
• The health of the Bay Area is linked to the health of the land, tidelands, and baylands. The Conservation Lands Network is one piece of a larger effort to conserve valuable habitats, rare landscapes and ecosystem functions in the Bay Area. It complements two other ecosystems—the estuarine tidelands of the Baylands Ecosystem Habitat Goals Project and the submerged habitats of the San Francisco Bay Subtidal Habitat Goals Project. Progress on each individual effort supports the success of the other two. Additionally, the Critical Linkages: Bay Area and Beyond (2013) report identifies important connections to landscapes and regions outside of the Bay Area.
• Our efforts to track progress result in more progress. As a region, it is important to know how we are doing toward achieving our stated goals. It allows us to better collaborate and coordinate toward the collective goal of strategically protecting 2 million acres—and enables us to celebrate the victories along the way.
• The whole is greater than the sum of its parts. The strength of the CLN grows each year as more protected landscapes link together to create large, connected open spaces that are critical to species viability and ecological processes that support the wildlife, ecology, iconic landscapes and quality of life so unique to our region.
Conservation Lands Network 1.0 Progress Report | Chapter 2: The CLN 1.0 Progress Report 9
2 CLN 1.0 Progress report
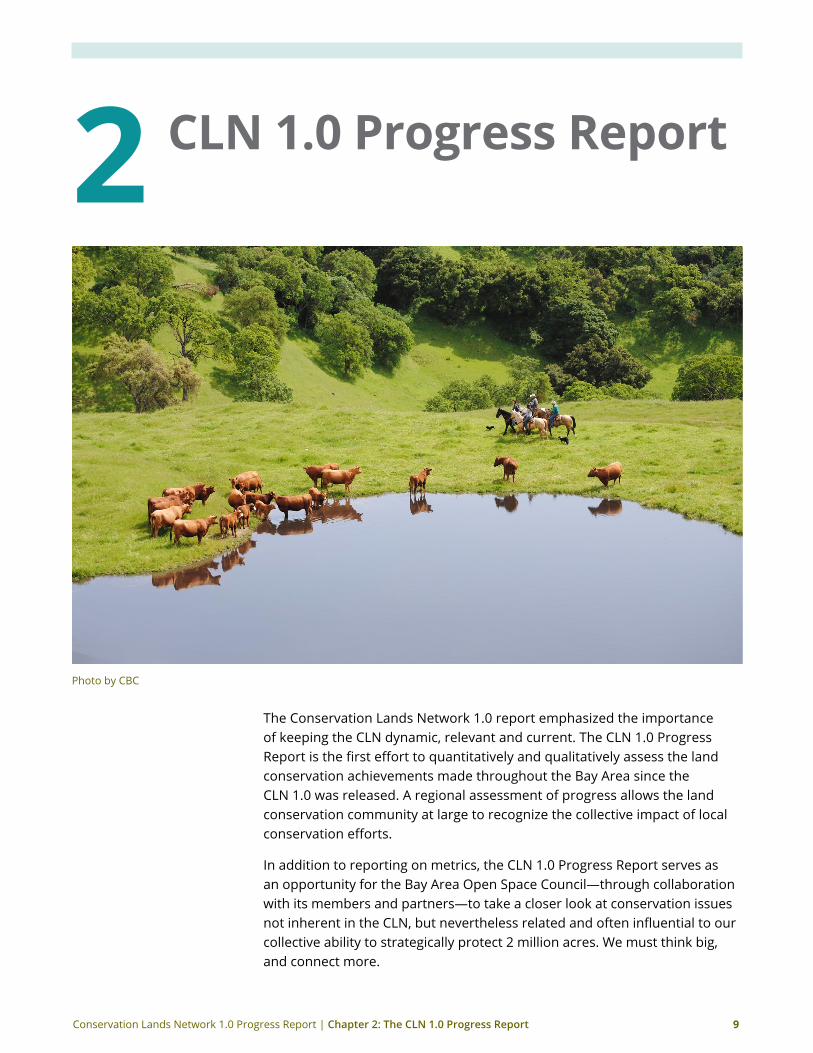
Photo by CBC
The Conservation Lands Network 1.0 report emphasized the importance of keeping the CLN dynamic, relevant and current. The CLN 1.0 Progress Report is the first effort to quantitatively and qualitatively assess the land conservation achievements made throughout the Bay Area since the CLN 1.0 was released. A regional assessment of progress allows the land conservation community at large to recognize the collective impact of local conservation efforts.
In addition to reporting on metrics, the CLN 1.0 Progress Report serves as an opportunity for the Bay Area Open Space Council—through collaboration with its members and partners—to take a closer look at conservation issues not inherent in the CLN, but nevertheless related and often influential to our collective ability to strategically protect 2 million acres. We must think big, and connect more.
Conservation Lands Network 1.0 Progress Report | Chapter 2: The CLN 1.0 Progress Report 10
The opportunities and objectives of the CLN 1.0 Progress Report include:
• Analyze progress made and look ahead to what is next. Although thee CLN 1.0 was released in 2011, the original data for the CLN 1.0 is from 2010, and sets the baseline from which we begin tracking progress. Progress is tracked through 2013, and an assessment of where the Conservation Lands Network remains in each county and for the region as a whole is considered. Steps to take in order to continue implementing and tracking the Conservation Lands Network are recommended.
• Connect regional to local; local to regional. The CLN is a regional conservation vision and plan, derived from data assessed at the landscape unit scale (see Figure 4.2: Landscape Unit Map). While critical to the conservation planning approach and the scientific integrity of the CLN, the landscape unit geography is unfamiliar to a general audience, despite the fact that conceptually most people understand the physical differences between the hills and the valley. On the other hand, the political county boundary is a commonly understood geography. The CLN 1.0 Progress Report therefore leverages county level reporting as an unconventional entry to the CLN, granting new audiences exposure to the CLN and its related data from a familiar starting point.
• Broaden the audience for the Conservation Lands Network. The CLN 1.0 Progress Report is not a report that will sit on a shelf. Progress and achievements are shared widely online, through an updated user experience at www.bayarealands.org. Visually compelling presentation, interactive mapping, county level reporting, and human-scale story telling engages a new generation of CLN users and conservation supporters. Beyond the traditional land conservation community of practitioners, landowners, land managers and volunteers, the audience for the CLN 1.0 Progress Report include elected officials and legislators, county and city planners, universities and researchers, and individuals and groups interested in and advocating for the Bay Area’s network of parks, open spaces and natural landscapes.
• Celebrate achievements and inspire next steps. Not all progress can be quantified. The CLN 1.0 Progress Report highlights the people and projects that have contributed to the on-the-ground success of the Conservation Lands Network. We aim to remind the conservation community to “Think Big and Connect More” by promoting the continued investment in Bay Area land conservation, and by keeping the Conservation Lands Network dynamic and relevant.
Conservation Lands Network 1.0 Progress Report | Chapter 2: The CLN 1.0 Progress Report 11
CLN 1.0 Progress report ApproachThe Conservation Lands Network 1.0 Progress Report tracks the achievements toward the regional goal to strategically protect 2 million acres of lands and rare landscapes throughout the ten counties that comprise the Bay Area (listed clockwise, geographically): Marin, Sonoma, Napa, Solano, Contra Costa, Alameda, Santa Clara, Santa Cruz, San Mateo and San Francisco.
The first version of the CLN, version 1.0, was released in 2011 but reports on geographic and spatial data from 2010. Therefore unless otherwise noted, all progress measurements reported in the CLN 1.0 Progress Report are a measure of change from 2010 to 2013.
Creating a 10-County Vision and guide: Incorporation of santa Cruz CountyThe Conservation Lands Network 1.0 did not include Santa Cruz County. However, the Land Trust of Santa Cruz County replicated the CLN methodology in their Conservation Blueprint of Santa Cruz County (2011), which highlights the biological and quality of life values Santa Cruz County provides to all of the Bay Area. Their analysis enabled the incorporation of Santa Cruz into the CLN 1.0 Progress Report. The addition of a tenth county in the Conservation Lands Network meant that the project team had to account for relative increases in acreage accounting from the CLN 1.0 datasets and conclusions. As such, acreage changes due to the incorporation of Santa Cruz are noted wherever they were necessary throughout the CLN 1.0 Progress Report. More information on methods for incorporation can be found in the Appendix, available at www.bayarealands.org.
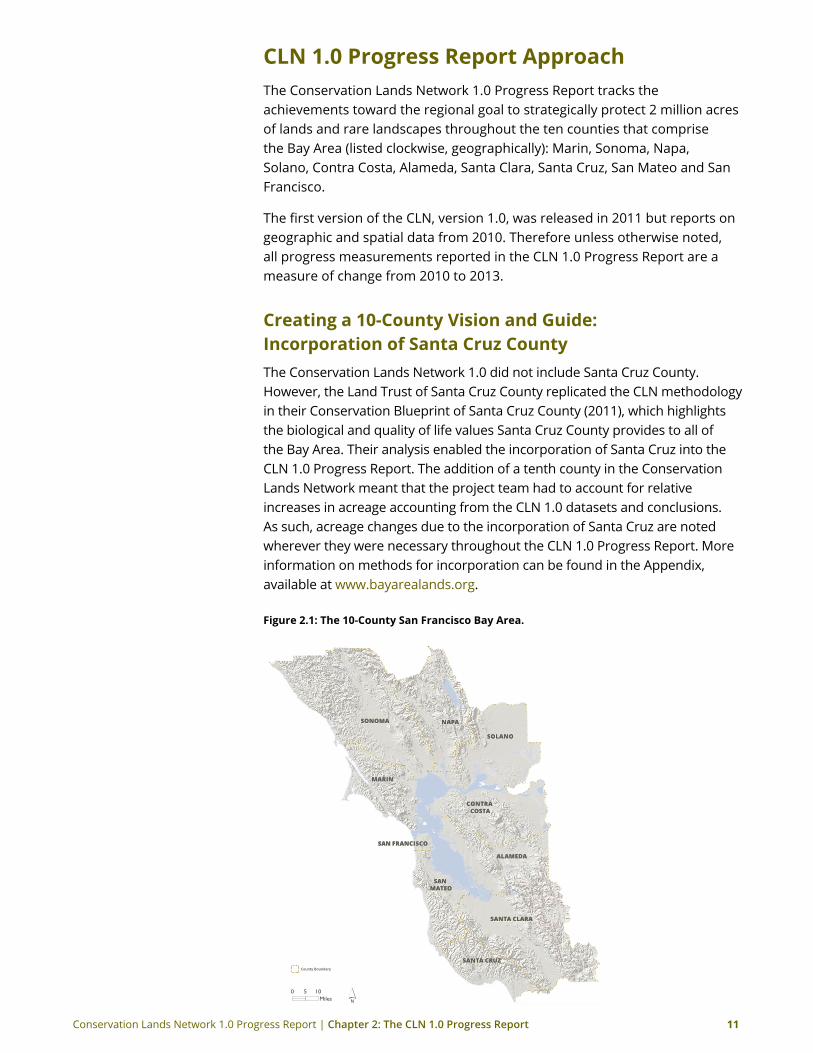
Figure 2.1: The 10-County san Francisco Bay Area.
NAPA
SANTA CRUZ
SONOMA
CONTRA COSTA
ALAMEDA
SAN FRANCISCO
MARIN
SOLANO
SAN MATEO
SANTA CLARA
NAPA
SANTA CRUZ
SONOMA
CONTRA COSTA
ALAMEDA
SAN FRANCISCO
MARIN
SOLANO
SAN MATEO
SANTA CLARA
0 5 10Miles
County Boundary
Conservation Lands Network 1.0 Progress Report | Chapter 2: The CLN 1.0 Progress Report 12
Conservation Indicators and Progress MetricsProgress is reported on fifteen metrics, organized into four conservation indicator categories: three inherent in the CLN 1.0 (Protected Lands, Biodiversity and Habitat, and People and Conservation) and one included due to its cultural and geographic relevance especially at this point in time: Water Resources.
Each of the four conservation indicators speaks to an important aspect of land conservation in the Bay Area and allows for progress reporting across an array of metrics in a multi-dimensional, multi-functional way.
Protected Lands Protected lands are defined as landscapes and open spaces owned in fee title or protected through an agricultural or conservation easement (see “Defining Protected Land” Sidebar). In contrast, converted lands are landscapes that are no longer considered open spaces or suitable for biodiversity conservation values because they have been developed or cultivated for other uses.
Protected Lands Progress Metrics span three categories of understanding a landscape’s status:
1. Protected lands (areas protected and whether or not those areas are accessible to the public);
2. Connected lands (areas where protected lands are adjacent to one another and therefore create a large landscape mosaic, and areas identified through the Critical Linkages: Bay Area and Beyond project); and
3. Lands at risk (areas at risk of being developed due to regional population and growth trends).
Biodiversity and Habitat Biodiversity is defined as “the complex of living organisms, their physical environment, the interactions among these organisms, and how they array themselves in the physical environment” (Noss 1990, Redford and Richter 1999). The Conservation Lands Network uses habitat and rare landscapes—specifically the location and rarity of vegetation types—as indicators for biodiversity viability in the Bay Area.
Biodiversity and Habitat Progress Metrics include additional acres protected of habitats and rare landscapes, as counted toward the 52 individual vegetation type acreage targets set forth in the CLN 1.0.
Conservation Lands Network 1.0 Progress Report | Chapter 2: The CLN 1.0 Progress Report 13
Defining“ProtectedLand”Protected Lands, as defined in the Conservation Lands Network and the Bay Area Protected Areas Database (BPAD), are designated in one of two ways: either by purchasing or acquiring a “conservation easement” to a privately owned property, or by purchasing a property outright for conservation purposes. Protected lands can be parks, preserves, ranches, farms, forests, small, large, publicly accessible, and not publicly accessible. An array of public and private Bay Area agencies and organizations own conservation lands and open spaces, and hold conservation easements. See the full list in Figure 6.3.
Fee Title
The purchase of all the rights associated with a property is a “fee title” acquisition, and allows the landowner to manage the property to preserve and protect its conservation values. Typically fee title conservation lands are purchased by or donated to land trusts, government agencies or other conservation organizations who may retain ownership of the property as a permanent preserve or transfer the property to a suitable owner (often a government agency). In some cases, the land is sold to a private owner, subject to a conservation easement held by the land trust. (Definition from California Council of Land Trusts.)
Easements
The most traditional tool for conserving private land is a “conservation easement.” A conservation easement is a legal agreement between a landowner and a land trust or government agency, and permanently protects a property’s conservation values by limiting uses of the land. It allows landowners to continue to own and use their land, and sell it or pass it on to heirs. (Definition from Land Trust Alliance.)
Water resources The water systems above and below ground—streams, rivers, ponds, vernal pools, lakes and reservoirs, ground water basins and watersheds—are the veins of life support for the upland habitats and rare landscapes that comprise the Conservation Lands Network. The CLN 1.0 recognized that a whole watershed (in-channel, basin, riparian corridor and floodplain) approach is necessary for the successful conservation of riparian and fish habitat. Therefore, Water Resources are defined in the CLN 1.0 Progress Report as the important streams, riparian habitat, and associated upland areas that support healthy native fish populations and ensure watershed functionality.
Water Resource Progress Metrics include additional stream miles of protected aquatic and riparian habitat, and watershed functions measured by rates of recharge and runoff flows.
People and Conservation Land conservation is not possible without on-going effort, collaboration, coordination and investment by people in both the public and private sectors. Successful implementation of the Conservation Lands Network and progress toward the Regional Acreage Protection Goal and Habitat and Rare Landscape Protection Goals cannot be made without the, committed efforts made by the Bay Area’s land owners and land managers, conservation
Conservation Lands Network 1.0 Progress Report | Chapter 2: The CLN 1.0 Progress Report 14
volunteers, policy makers, recreation and trail advocates, scientists and researchers, and the voting public.
People and Conservation Progress Metrics explore the progress and values for conservation of private lands and working landscapes; stewardship of protected lands, and the vital partnerships, programs and volunteers that make conservation happen; accessible lands and trails; and regional conservation policies, plans and funding programs.
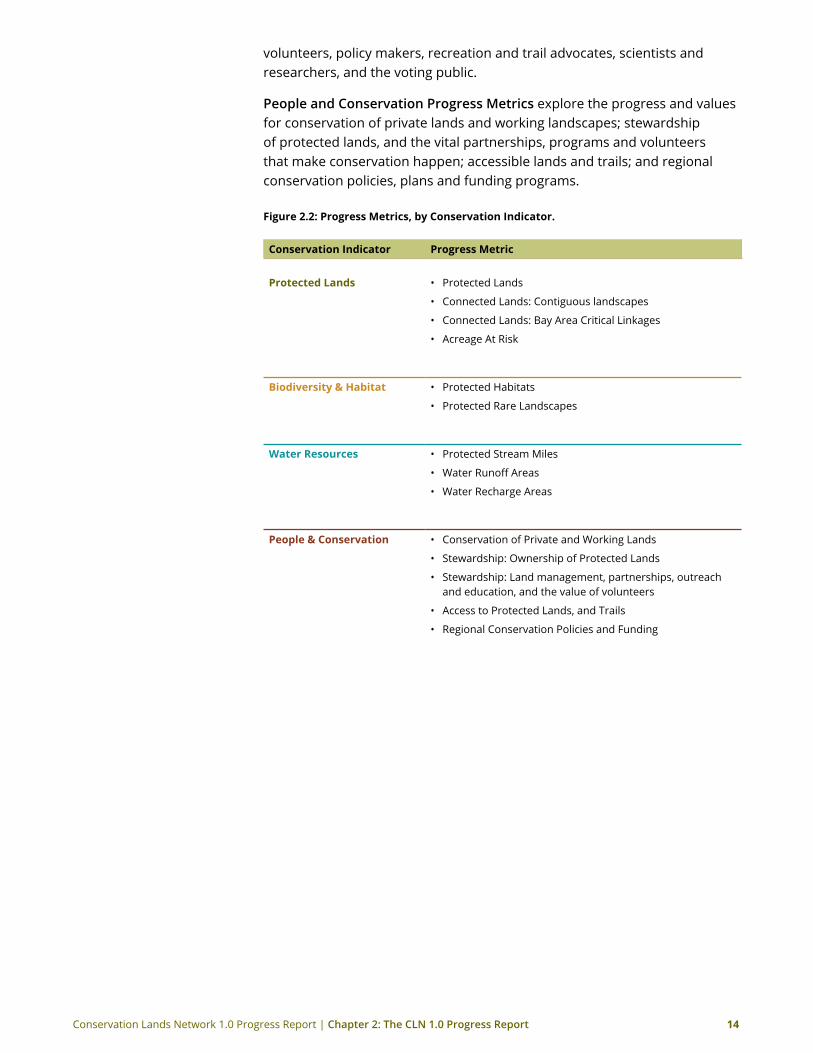
Figure 2.2: Progress Metrics, by Conservation Indicator.
Conservation Indicator Progress Metric
Protected Lands • Protected Lands
• Connected Lands: Contiguous landscapes
• Connected Lands: Bay Area Critical Linkages
• Acreage At Risk
Biodiversity & Habitat • Protected Habitats
• Protected Rare Landscapes
Water resources • Protected Stream Miles
• Water Runoff Areas
• Water Recharge Areas
People & Conservation • Conservation of Private and Working Lands
• Stewardship: Ownership of Protected Lands
• Stewardship: Land management, partnerships, outreach and education, and the value of volunteers
• Access to Protected Lands, and Trails
• Regional Conservation Policies and Funding
Conservation Lands Network 1.0 Progress Report | Chapter 3: Protected Lands 15
3 Protected Lands
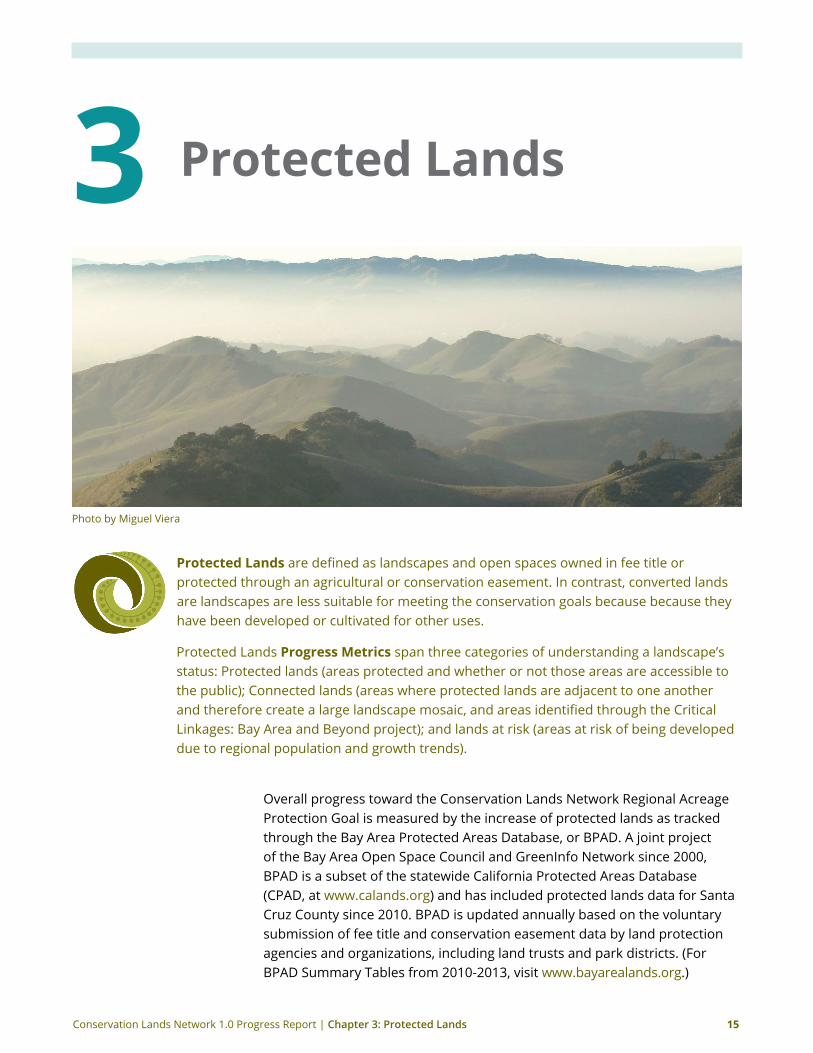
Photo by Miguel Viera
Protected Lands are defined as landscapes and open spaces owned in fee title or protected through an agricultural or conservation easement. In contrast, converted lands are landscapes are less suitable for meeting the conservation goals because because they have been developed or cultivated for other uses.
Protected Lands Progress Metrics span three categories of understanding a landscape’s status: Protected lands (areas protected and whether or not those areas are accessible to the public); Connected lands (areas where protected lands are adjacent to one another and therefore create a large landscape mosaic, and areas identified through the Critical Linkages: Bay Area and Beyond project); and lands at risk (areas at risk of being developed due to regional population and growth trends).
Overall progress toward the Conservation Lands Network Regional Acreage Protection Goal is measured by the increase of protected lands as tracked through the Bay Area Protected Areas Database, or BPAD. A joint project of the Bay Area Open Space Council and GreenInfo Network since 2000, BPAD is a subset of the statewide California Protected Areas Database (CPAD, at www.calands.org) and has included protected lands data for Santa Cruz County since 2010. BPAD is updated annually based on the voluntary submission of fee title and conservation easement data by land protection agencies and organizations, including land trusts and park districts. (For BPAD Summary Tables from 2010-2013, visit www.bayarealands.org.)
Conservation Lands Network 1.0 Progress Report | Chapter 3: Protected Lands 16
BPAD is the backbone of the Conservation Lands Network. Indeed, a major part of understanding the regional conservation landscape comes from knowing where the existing protected lands are and who owns and manages those lands. This information allows us to assess regional goals, assist in planning for new areas to conserve, identify where people are in relation to parks and, simply but perhaps most powerfully, visualize the system of regional protected lands.
Watch the historical progression of the Bay Area’s public parks and open spaces in GreenInfo Network’s animation of land protection from 1850 to 2012. The video is also available at www.openspacecouncil.org.
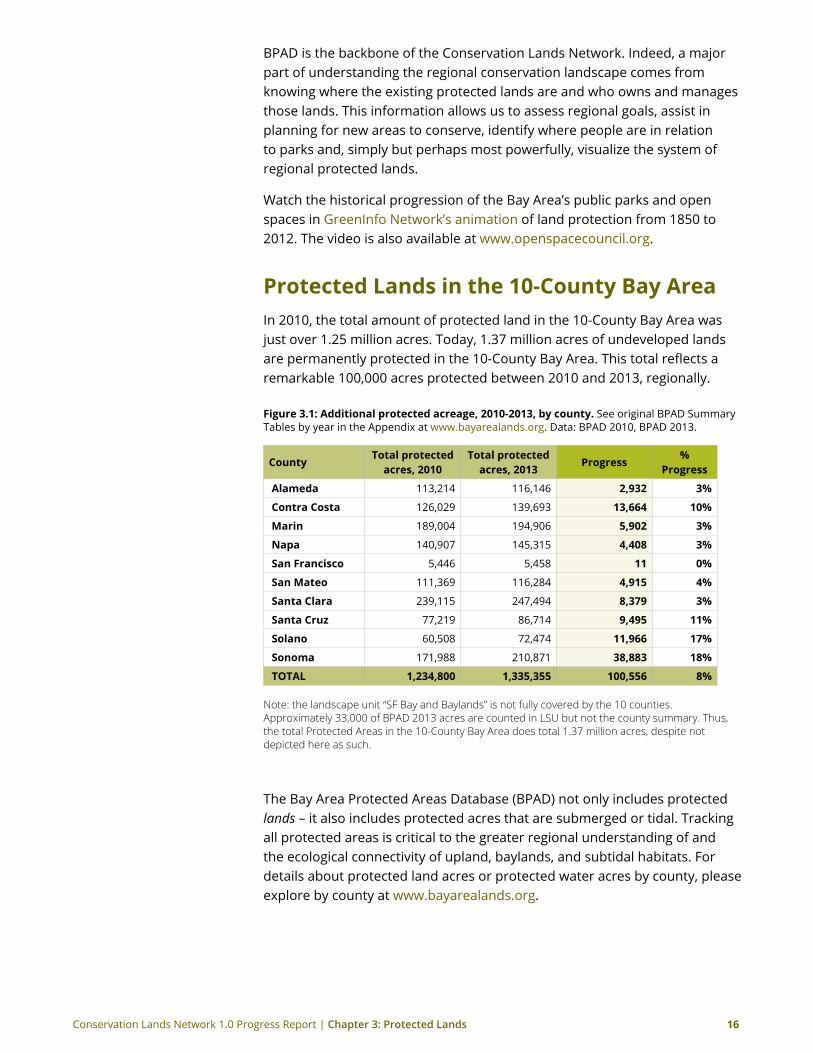
Protected Lands in the 10-County Bay Area In 2010, the total amount of protected land in the 10-County Bay Area was just over 1.25 million acres. Today, 1.37 million acres of undeveloped lands are permanently protected in the 10-County Bay Area. This total reflects a remarkable 100,000 acres protected between 2010 and 2013, regionally.
Figure 3.1: Additional protected acreage, 2010-2013, by county. See original BPAD Summary Tables by year in the Appendix at www.bayarealands.org. Data: BPAD 2010, BPAD 2013.
CountyTotal protected
acres, 2010Total protected
acres, 2013Progress
% Progress
Alameda 113,214 116,146 2,932 3%
Contra Costa 126,029 139,693 13,664 10%
Marin 189,004 194,906 5,902 3%
Napa 140,907 145,315 4,408 3%
san Francisco 5,446 5,458 11 0%
san Mateo 111,369 116,284 4,915 4%
santa Clara 239,115 247,494 8,379 3%
santa Cruz 77,219 86,714 9,495 11%
solano 60,508 72,474 11,966 17%
sonoma 171,988 210,871 38,883 18%
ToTAL 1,234,800 1,335,355 100,556 8%
Note: the landscape unit “SF Bay and Baylands” is not fully covered by the 10 counties. Approximately 33,000 of BPAD 2013 acres are counted in LSU but not the county summary. Thus, the total Protected Areas in the 10-County Bay Area does total 1.37 million acres, despite not depicted here as such.
The Bay Area Protected Areas Database (BPAD) not only includes protected lands – it also includes protected acres that are submerged or tidal. Tracking all protected areas is critical to the greater regional understanding of and the ecological connectivity of upland, baylands, and subtidal habitats. For details about protected land acres or protected water acres by county, please explore by county at www.bayarealands.org.
Conservation Lands Network 1.0 Progress Report | Chapter 3: Protected Lands 17
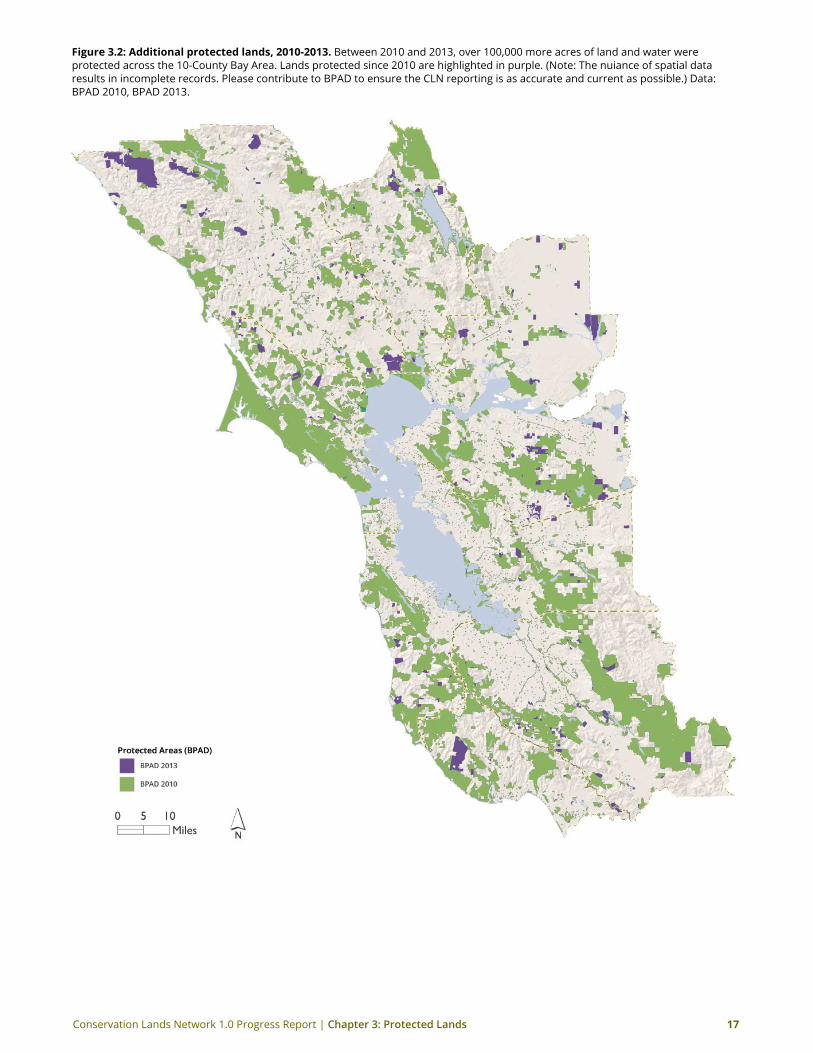
Figure 3.2: Additional protected lands, 2010-2013. Between 2010 and 2013, over 100,000 more acres of land and water were protected across the 10-County Bay Area. Lands protected since 2010 are highlighted in purple. (Note: The nuiance of spatial data results in incomplete records. Please contribute to BPAD to ensure the CLN reporting is as accurate and current as possible.) Data: BPAD 2010, BPAD 2013.
Conservation Lands Network 1.0 Progress Report | Chapter 3: Protected Lands 18
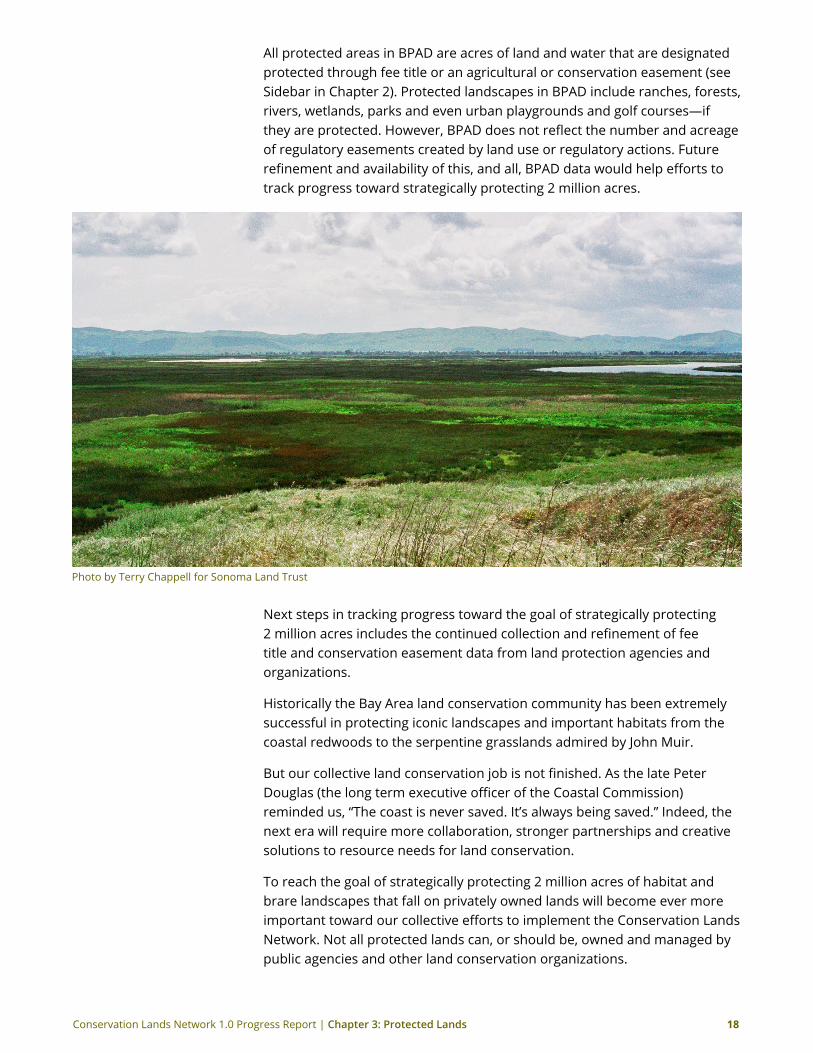
All protected areas in BPAD are acres of land and water that are designated protected through fee title or an agricultural or conservation easement (see Sidebar in Chapter 2). Protected landscapes in BPAD include ranches, forests, rivers, wetlands, parks and even urban playgrounds and golf courses—if they are protected. However, BPAD does not reflect the number and acreage of regulatory easements created by land use or regulatory actions. Future refinement and availability of this, and all, BPAD data would help efforts to track progress toward strategically protecting 2 million acres.
Photo by Terry Chappell for Sonoma Land Trust
Next steps in tracking progress toward the goal of strategically protecting 2 million acres includes the continued collection and refinement of fee title and conservation easement data from land protection agencies and organizations.
Historically the Bay Area land conservation community has been extremely successful in protecting iconic landscapes and important habitats from the coastal redwoods to the serpentine grasslands admired by John Muir.
But our collective land conservation job is not finished. As the late Peter Douglas (the long term executive officer of the Coastal Commission) reminded us, “The coast is never saved. It’s always being saved.” Indeed, the next era will require more collaboration, stronger partnerships and creative solutions to resource needs for land conservation.
To reach the goal of strategically protecting 2 million acres of habitat and brare landscapes that fall on privately owned lands will become ever more important toward our collective efforts to implement the Conservation Lands Network. Not all protected lands can, or should be, owned and managed by public agencies and other land conservation organizations.
Conservation Lands Network 1.0 Progress Report | Chapter 3: Protected Lands 19
Private landowners often are the best land stewards, and working lands—rangelands, sustainable forests, well managed farms and more—are a vital asset to the quality of life in the Bay Area and their health is critical for meeting the goals of the Conservation Lands Network.
As discussed, the Conservation Lands Network offers a vision and guide for considering where to look next for land conservation. However, the mosaic of lands “available” for protection are not all within the Conservation Lands Network because the CLN focuses on habitats and rare landscapes essential and important for the protection of regional biodiversity. Indeed, acquisition of a small property that does not have development value may prove easier than that of a large, productive landscape with a productive timber operation. Both landscapes are “available” for conservation from a mapping perspective.
Understanding Land Cover TypesWhen looking at the CLN in context of all the land cover types present in the Bay Area (see Figure 1.7), categories of land range from open lands—effectively those “accessible” for conservation, including much of the CLN—to converted lands.
Converted lands are landscapes that are no longer considered open spaces or suitable for biodiversity conservation values because they have been developed or cultivated for other uses, In the CLN, converted land cover types include urban, rural residential and cultivated areas. (Note: cultivated areas and “other lands” often have conservation value, but within the scope of the CLN, are not considered to have high biodiversity conservation value.)
Figure 3.3: Land cover types in the Conservation Lands Network. The CLN land cover categories are: (1) areas essential to conservation goals (darkest blue); (2) areas important to conservation goals (medium blue); (3) areas of the CLN that are fragmented (light purple); and (4) areas for further consideration (light blue). The landscapes not identified as converted, and also not identified within the CLN, are considered “other lands.”
other Lands“Other lands” are undeveloped landscapes, or open spaces that are not urban, rural residential (parcels of 10 acres or less), cultivated agriculture or croplands, and were not selected by the model that delineated the Conservation Lands Network. While other lands may not be home to a
Conservation Lands Network 1.0 Progress Report | Chapter 3: Protected Lands 20
rare habitat or may not neighbor an already protected landscape, they nonetheless have value as open spaces. Whereas protection of lands comprising the Conservation Lands Network counts toward meeting a regional goal to protect the Bay Area’s biodiversity, protection of other lands can meet other goals at many scales, for example recreation, watershed conservation, vista protection and more.
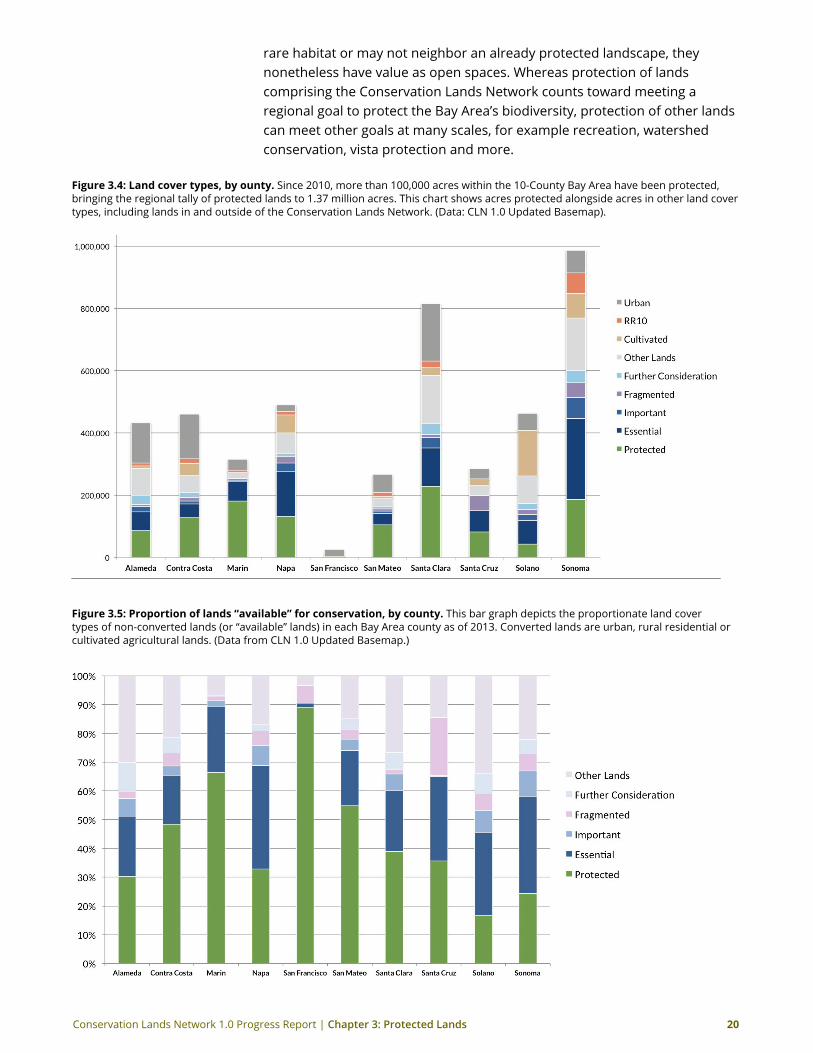
Figure 3.4: Land cover types, by ounty. Since 2010, more than 100,000 acres within the 10-County Bay Area have been protected, bringing the regional tally of protected lands to 1.37 million acres. This chart shows acres protected alongside acres in other land cover types, including lands in and outside of the Conservation Lands Network. (Data: CLN 1.0 Updated Basemap).
Figure3.5:Proportionoflands“available”forconservation,bycounty.This bar graph depicts the proportionate land cover types of non-converted lands (or “available” lands) in each Bay Area county as of 2013. Converted lands are urban, rural residential or cultivated agricultural lands. (Data from CLN 1.0 Updated Basemap.)
Conservation Lands Network 1.0 Progress Report | Chapter 3: Protected Lands 21
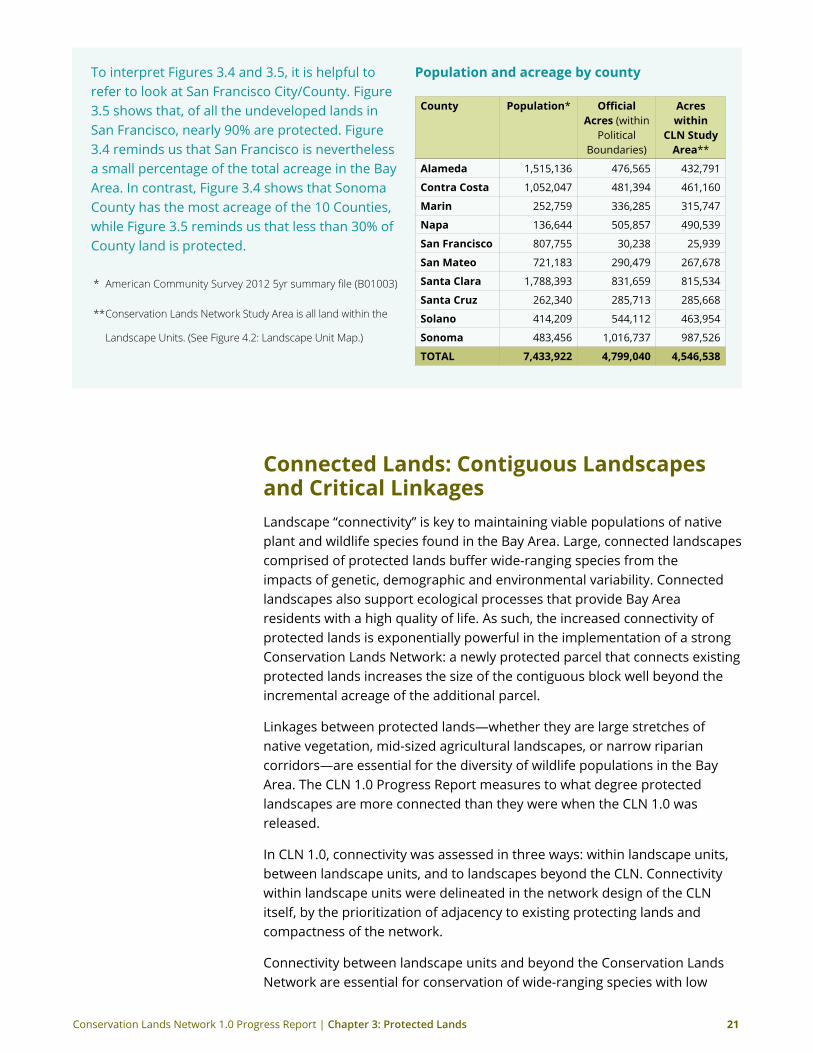
To interpret Figures 3.4 and 3.5, it is helpful to refer to look at San Francisco City/County. Figure 3.5 shows that, of all the undeveloped lands in San Francisco, nearly 90% are protected. Figure 3.4 reminds us that San Francisco is nevertheless a small percentage of the total acreage in the Bay Area. In contrast, Figure 3.4 shows that Sonoma County has the most acreage of the 10 Counties, while Figure 3.5 reminds us that less than 30% of County land is protected.
* AmericanCommunitySurvey20125yrsummaryfile(B01003)
** Conservation Lands Network Study Area is all land within the
LandscapeUnits.(SeeFigure4.2:LandscapeUnitMap.)
Population and acreage by county
County Population* OfficialAcres (within
Political Boundaries)
Acres within
CLN study Area**
Alameda 1,515,136 476,565 432,791
Contra Costa 1,052,047 481,394 461,160
Marin 252,759 336,285 315,747
Napa 136,644 505,857 490,539
san Francisco 807,755 30,238 25,939
san Mateo 721,183 290,479 267,678
santa Clara 1,788,393 831,659 815,534
santa Cruz 262,340 285,713 285,668
solano 414,209 544,112 463,954
sonoma 483,456 1,016,737 987,526
ToTAL 7,433,922 4,799,040 4,546,538
Connected Lands: Contiguous Landscapes and Critical LinkagesLandscape “connectivity” is key to maintaining viable populations of native plant and wildlife species found in the Bay Area. Large, connected landscapes comprised of protected lands buffer wide-ranging species from the impacts of genetic, demographic and environmental variability. Connected landscapes also support ecological processes that provide Bay Area residents with a high quality of life. As such, the increased connectivity of protected lands is exponentially powerful in the implementation of a strong Conservation Lands Network: a newly protected parcel that connects existing protected lands increases the size of the contiguous block well beyond the incremental acreage of the additional parcel.
Linkages between protected lands—whether they are large stretches of native vegetation, mid-sized agricultural landscapes, or narrow riparian corridors—are essential for the diversity of wildlife populations in the Bay Area. The CLN 1.0 Progress Report measures to what degree protected landscapes are more connected than they were when the CLN 1.0 was released.
In CLN 1.0, connectivity was assessed in three ways: within landscape units, between landscape units, and to landscapes beyond the CLN. Connectivity within landscape units were delineated in the network design of the CLN itself, by the prioritization of adjacency to existing protecting lands and compactness of the network.
Connectivity between landscape units and beyond the Conservation Lands Network are essential for conservation of wide-ranging species with low
Conservation Lands Network 1.0 Progress Report | Chapter 3: Protected Lands 22
population densities, like mountain lions and the American badger. Linkage opportunities for these species are found in connected native vegetation, agricultural landscapes, in narrow riparian corridors running through urban areas, and in some highway underpasses.
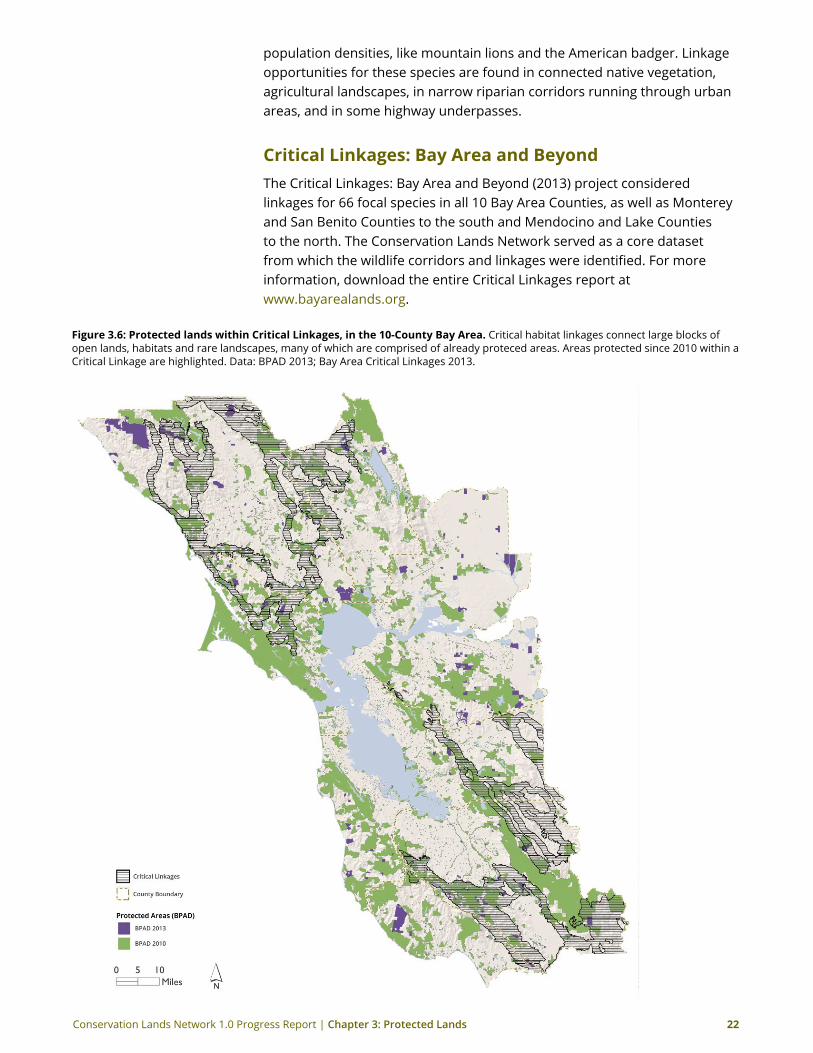
Critical Linkages: Bay Area and BeyondThe Critical Linkages: Bay Area and Beyond (2013) project considered linkages for 66 focal species in all 10 Bay Area Counties, as well as Monterey and San Benito Counties to the south and Mendocino and Lake Counties to the north. The Conservation Lands Network served as a core dataset from which the wildlife corridors and linkages were identified. For more information, download the entire Critical Linkages report at www.bayarealands.org.
Figure 3.6: Protected lands within Critical Linkages, in the 10-County Bay Area. Critical habitat linkages connect large blocks of open lands, habitats and rare landscapes, many of which are comprised of already proteced areas. Areas protected since 2010 within a Critical Linkage are highlighted. Data: BPAD 2013; Bay Area Critical Linkages 2013.
Conservation Lands Network 1.0 Progress Report | Chapter 3: Protected Lands 23
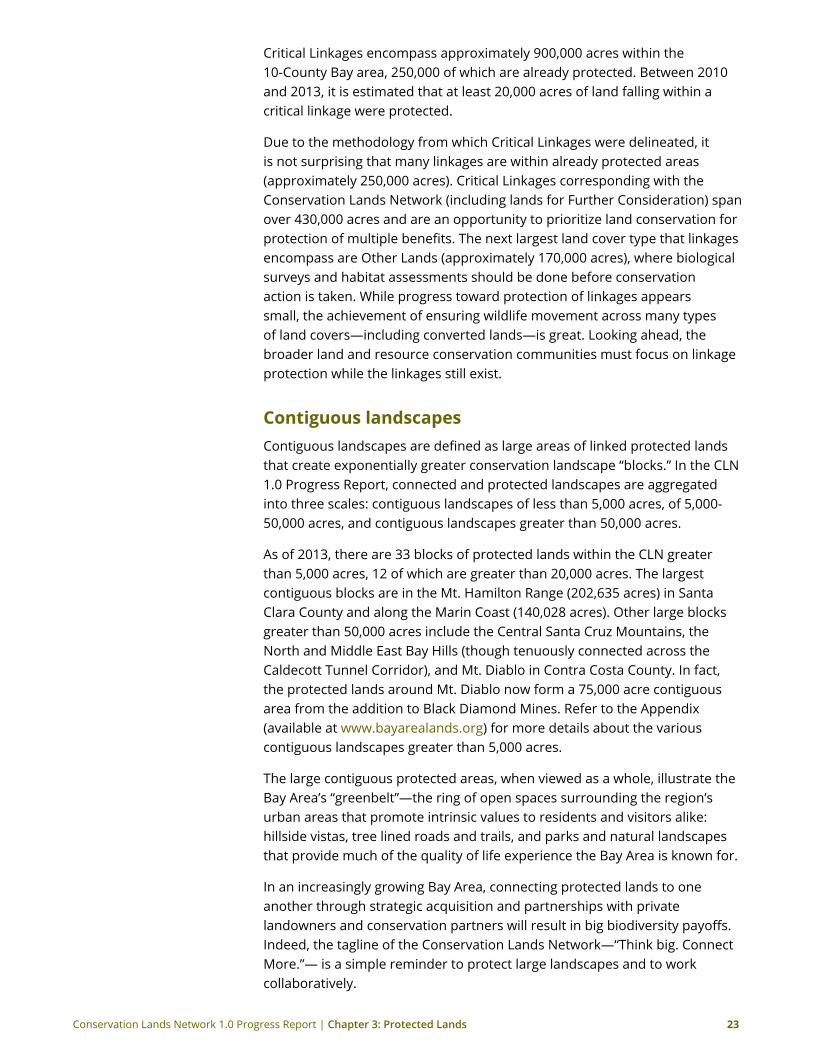
Critical Linkages encompass approximately 900,000 acres within the 10-County Bay area, 250,000 of which are already protected. Between 2010 and 2013, it is estimated that at least 20,000 acres of land falling within a critical linkage were protected.
Due to the methodology from which Critical Linkages were delineated, it is not surprising that many linkages are within already protected areas (approximately 250,000 acres). Critical Linkages corresponding with the Conservation Lands Network (including lands for Further Consideration) span over 430,000 acres and are an opportunity to prioritize land conservation for protection of multiple benefits. The next largest land cover type that linkages encompass are Other Lands (approximately 170,000 acres), where biological surveys and habitat assessments should be done before conservation action is taken. While progress toward protection of linkages appears small, the achievement of ensuring wildlife movement across many types of land covers—including converted lands—is great. Looking ahead, the broader land and resource conservation communities must focus on linkage protection while the linkages still exist.
Contiguous landscapesContiguous landscapes are defined as large areas of linked protected lands that create exponentially greater conservation landscape “blocks.” In the CLN 1.0 Progress Report, connected and protected landscapes are aggregated into three scales: contiguous landscapes of less than 5,000 acres, of 5,000-50,000 acres, and contiguous landscapes greater than 50,000 acres.
As of 2013, there are 33 blocks of protected lands within the CLN greater than 5,000 acres, 12 of which are greater than 20,000 acres. The largest contiguous blocks are in the Mt. Hamilton Range (202,635 acres) in Santa Clara County and along the Marin Coast (140,028 acres). Other large blocks greater than 50,000 acres include the Central Santa Cruz Mountains, the North and Middle East Bay Hills (though tenuously connected across the Caldecott Tunnel Corridor), and Mt. Diablo in Contra Costa County. In fact, the protected lands around Mt. Diablo now form a 75,000 acre contiguous area from the addition to Black Diamond Mines. Refer to the Appendix (available at www.bayarealands.org) for more details about the various contiguous landscapes greater than 5,000 acres.
The large contiguous protected areas, when viewed as a whole, illustrate the Bay Area’s “greenbelt”—the ring of open spaces surrounding the region’s urban areas that promote intrinsic values to residents and visitors alike: hillside vistas, tree lined roads and trails, and parks and natural landscapes that provide much of the quality of life experience the Bay Area is known for.
In an increasingly growing Bay Area, connecting protected lands to one another through strategic acquisition and partnerships with private landowners and conservation partners will result in big biodiversity payoffs. Indeed, the tagline of the Conservation Lands Network—“Think big. Connect More.”— is a simple reminder to protect large landscapes and to work collaboratively.
Conservation Lands Network 1.0 Progress Report | Chapter 3: Protected Lands 24
Figure 3.7: Contiguous protected areas. The CLN study area includes 33 blocks of protected lands greater than 5,000 acres. Data from BPAD 2013.

Conservation Lands Network 1.0 Progress Report | Chapter 3: Protected Lands 25
Photo by Annie Burke
Acreage At riskThe population in the Bay Area is projected to grow by an additional 1 million people over the next 40 years (California Department of Finance, 2014), requiring new housing, new commercial space, new industrial facilities, and more. Development—in all forms—is a significant cause of habitat fragmentation. Roads are paved, buildings are constructed with parking lots, fences are put up, pesticides are applied, and water is diverted from streams.
The Greenbelt Alliance, a non-profit organization advocating for the Bay Area to “grow smart,” is an important conservation partner to the Bay Area Open Space Council and its members. Greenbelt Alliance’s Greenbelt Mapper is an interactive resource that shows, among other layers, lands at risk of development in the next thirty years. Greenbelt’s “At Risk” map serves as a reminder that development pressure can, in some landscapes, be a significant threat to regional conservation goals.
The 2006 At Risk map identified just over 400,000 acres in the 9-County Bay Area that were at high or medium threat of development—or “at risk”—through the year 2036. The most recent version of Greenbelt Alliance’s At Risk map was released in 2012 and identified over 320,000 acres at high or medium threat of development through the year 2042. See Figure 3.8.
The CLN 1.0 Progress Report further analyzed the At Risk data in order to project how many at risk acres were taken “out of risk” through land protection efforts during 2013. In total, we estimate that more than 19,000 acres that were considered at high and medium risk in 2012 have since been taken out of risk, many through protection.

Conservation Lands Network 1.0 Progress Report | Chapter 3: Protected Lands 26
Figure3.8:Landstaken“outofrisk”in2013.Lands taken out of risk were estimated by overlaying At Risk 2012 data with the CLN 1.0 Updated Basemap, and effectively “erasing” all lands that were protected in 2013. It is estimated that 19,670 acres were taken out of risk in 2013. Data: At Risk 2006, 2012; CLN 1.0 Updated Basemap.
High risk Medium risk High + Medium risk
At risk 2006 125,200 276,200 401,400
At risk 2012 77,300 245,500 322,800
CLN 1.0 Updated Basemap overlay with At risk 2013
72,108 231,022 303,130
Progress 2012-2013 -5,192 -14,478 -19,670
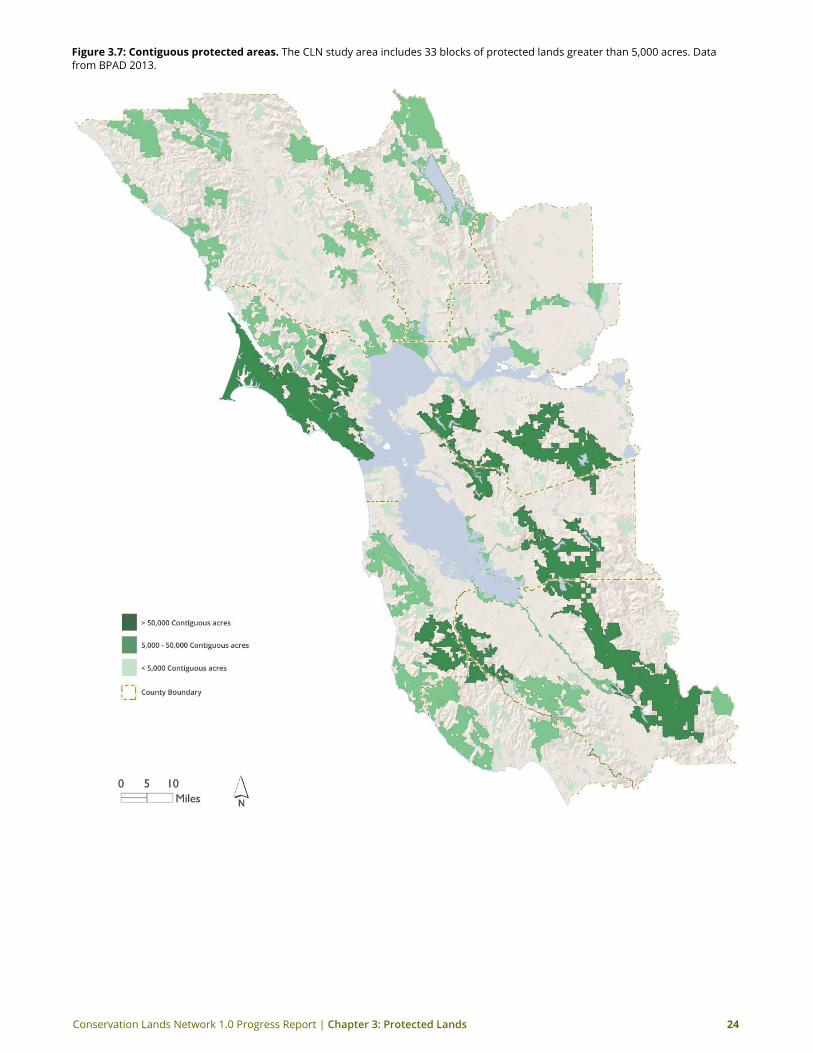
In order to more deeply understand the threat that development has on our collective ability to strategically protect 2 million acres, the CLN 1.0 Progress Report identifies those areas that are both At Risk and in the Conservation Lands Network in 2013. An estimated 72,000 acres remain at high risk and another 230,000 acres remain at medium risk of development.
Figure 3.9: Acres At risk in 2013. Based on our analysis in the CLN 1.0 Progress Report, roughly 72,000 acres remain at high risk, and another 230,000 acres remain at medium risk of development as of 2013. Protected lands are, by definition, not At Risk. (Note: This analysis does not include Santa Cruz County.) Data: CLN 1.0 Updated Basemap.
Land cover type (CLN 1.0 Updated Basemap)
High risk Medium risk Total At risk
CLN Essential 8,389 30,753 39,141
CLN Important 1,119 5,799 6,918
CLN Fragmented 6,961 26,303 33,264
CLN Further Consideration 4,840 10,357 15,198
Other Lands 25,934 67,197 93,131
Cultivated 13,364 29,261 42,625
RR10 11,502 61,352 72,854
Total acreage At risk in 2013 72,108 231,022 303,130
Total CLN land cover types At risk 21,308 73,212 94,521
The CLN land categories of Essential, Important, and Fragmented encompass an estimated 20,000 acres of High Risk areas yet to be protected, and roughly 73,000 acres of Medium Risk areas yet to be protected. (Fragmented CLN Lands are well represented in the risk categories, as they are already adjacent to developed areas.) Interestingly, Low Risk lands identified by the At Risk map generally coincide with the CLN, and therefore are excellent opportunity lands for conservation.
These findings represent the early analysis of what could be a larger study to target prioritized lands for conservation throughout the Bay Area. In such a study, the biological value of overlapping CLN and At Risk lands should be assessed prior to taking conservation action.
Conservation Lands Network 1.0 Progress Report | Chapter 3: Protected Lands 27
Figure 3.10: At risk overlay with CLN. This map shows lands that are both at high (red) or medium (orange) risk and in the CLN (where they are considered essential for habitat and rare landscape conservation). Because the At Risk map was last updated in 2012, the CLN 1.0 project team created a modified At Risk layer that updated any previously At Risk lands that had, in 2012 and 2013, become protected. Then, At Risk was compared with the Conservation Lands Network 1.0 Updated Basemap. (Note: This analysis does not include Santa Cruz County.) It is estimated that 19,670 acres were taken out of risk by land protection efforts in 2013.
Conservation Lands Network 1.0 Progress Report | Chapter 4: Biodiversity and Habitat 28
4 Biodiversity and Habitat
Photo by Annie Burke
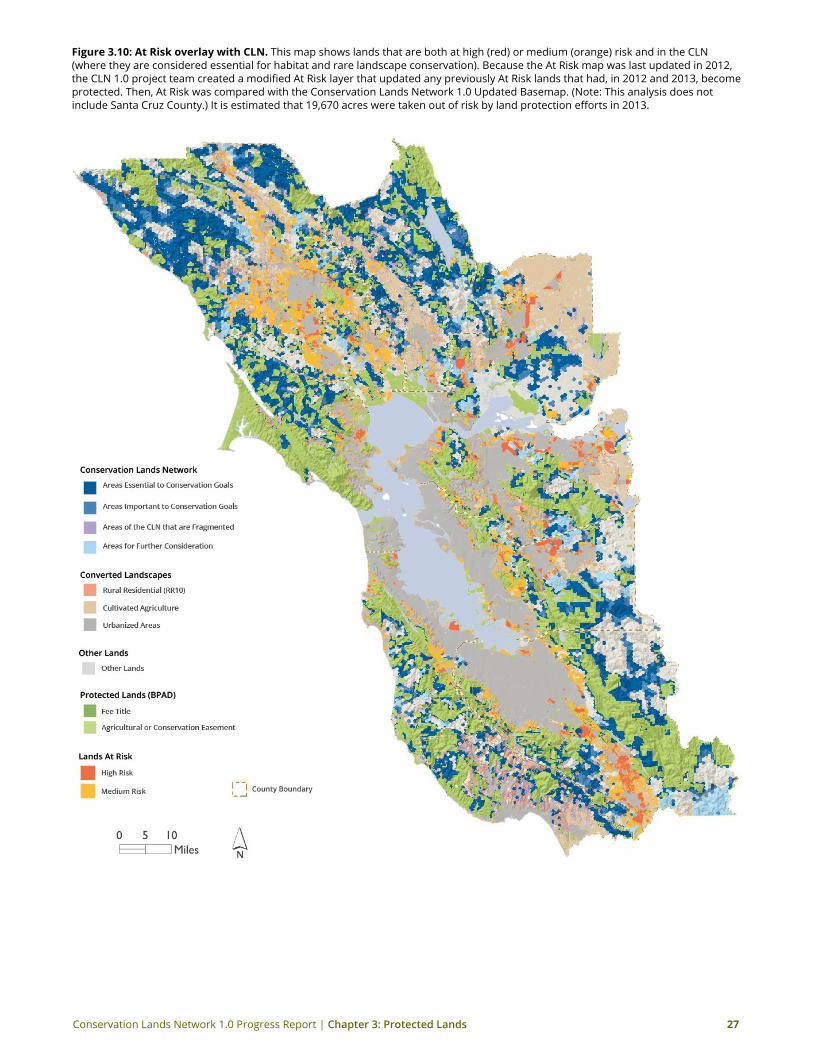
Biodiversity is defined as “the complex of living organisms, their physical environment, the interactions among these organisms, and how they array themselves in the physical environment” (Noss 1990, Redford and Richter 1999). The Conservation Lands Network uses habitat and rare landscapes—specifically the location and rarity of vegetation types—as indicators for biodiversity viability in the Bay Area.
Biodiversity and Habitat Progress Metrics include additional acres protected of habitats and rare landscapes, as counted toward the 52 individual vegetation type acreage targets set forth in the CLN 1.0.
From towering redwood and Douglas-fir forests, to evergreen hardwood forests, rolling oak woodlands, impenetrable hillsides of chaparral, semi-desert grasslands on the fringe of the Central Valley, and unique specialized habitats such as vernal pools, serpentine grasslands, and closed-cone conifer forests, the exceptional variety of the Bay Area’s vegetation is a regional treasure. Indeed, more than 3,000 plant species occupy the varied landscapes of the Bay Area (Jepson Manual Hickman 1993), and are loosely organized into communities comprised of countless local combinations of species (Sawyer et al. 2009; Thorne et al. 2009).

Conservation Lands Network 1.0 Progress Report | Chapter 4: Biodiversity and Habitat 29
In addition to this richness, the Bay Area is home to numerous endemic species with limited geographic ranges—sometimes only a few square miles or less. The spatially complex and dynamic vegetation mosaic is the foundation of Bay Area biodiversity, and is central to the conception and design of the Conservation Lands Network. Thus, protection of habitat and rare landscapes is central to meeting the CLN Regional Acreage Protection Goal.
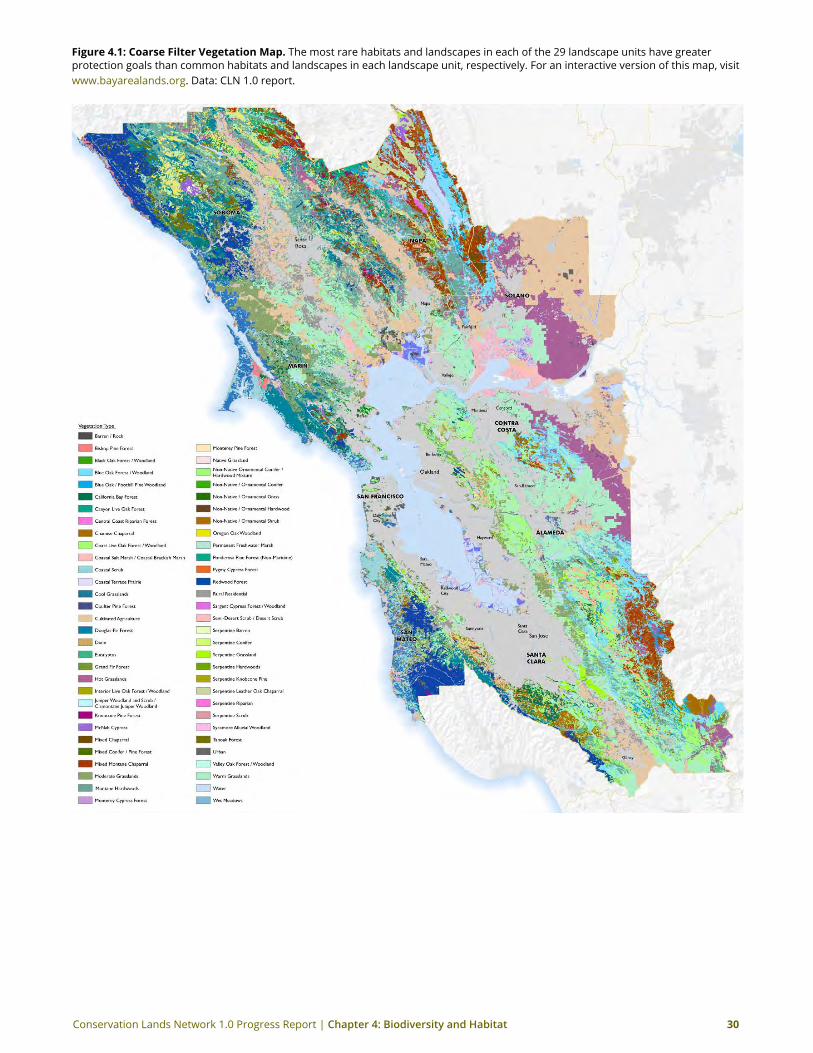
Protection of habitat and rare landscapes Habitat and Rare Landscape Protection Goals were established through the coarse filter vegetation analysis in the CLN 1.0 that (1) inventoried all natural vegetation types in each of the 29 landscape units across the Bay Area; (2) identified rare landscapes within each landscape unit, including ponds, unique soil types, streams and riparian areas, and rare vegetation types; and (3) fine-tuned acreage protection targets for each vegetation type based on the habitat needs of nearly 500 target plant, mammal, fish, amphibian, reptile and invertebrate species. (Details on the coarse filter methodology can be found in Chapter 4 of the CLN 1.0 report, at www.bayarealands.org.)
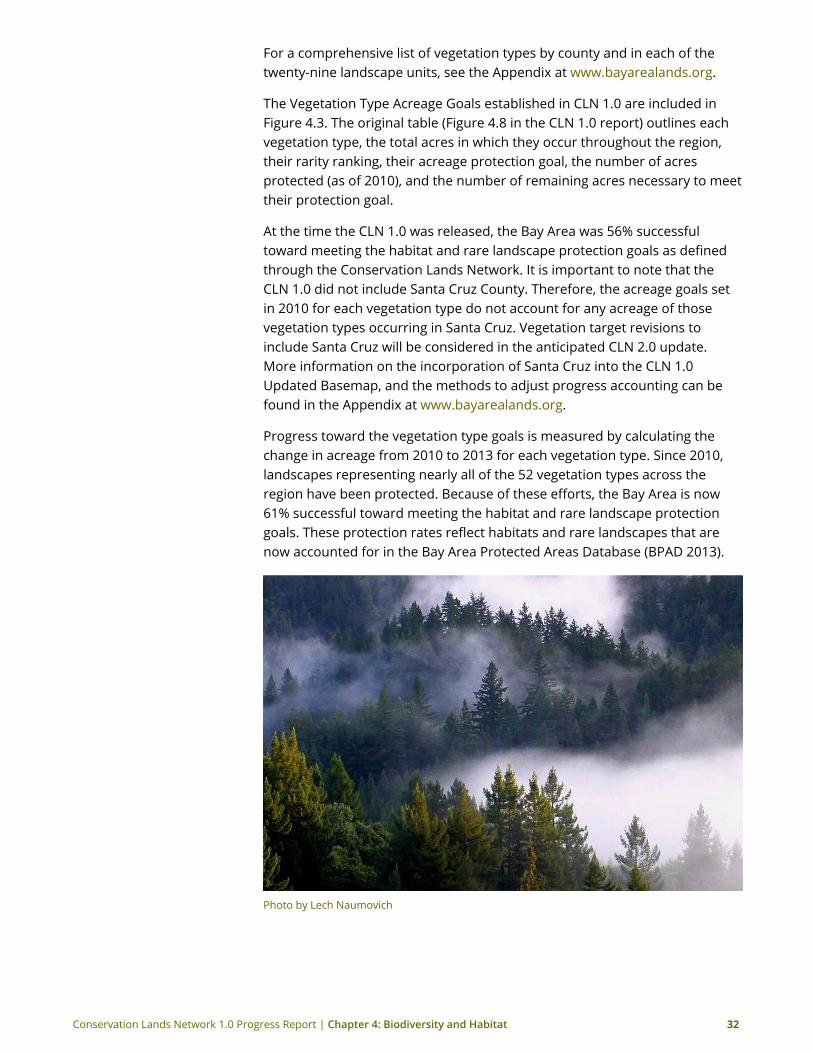
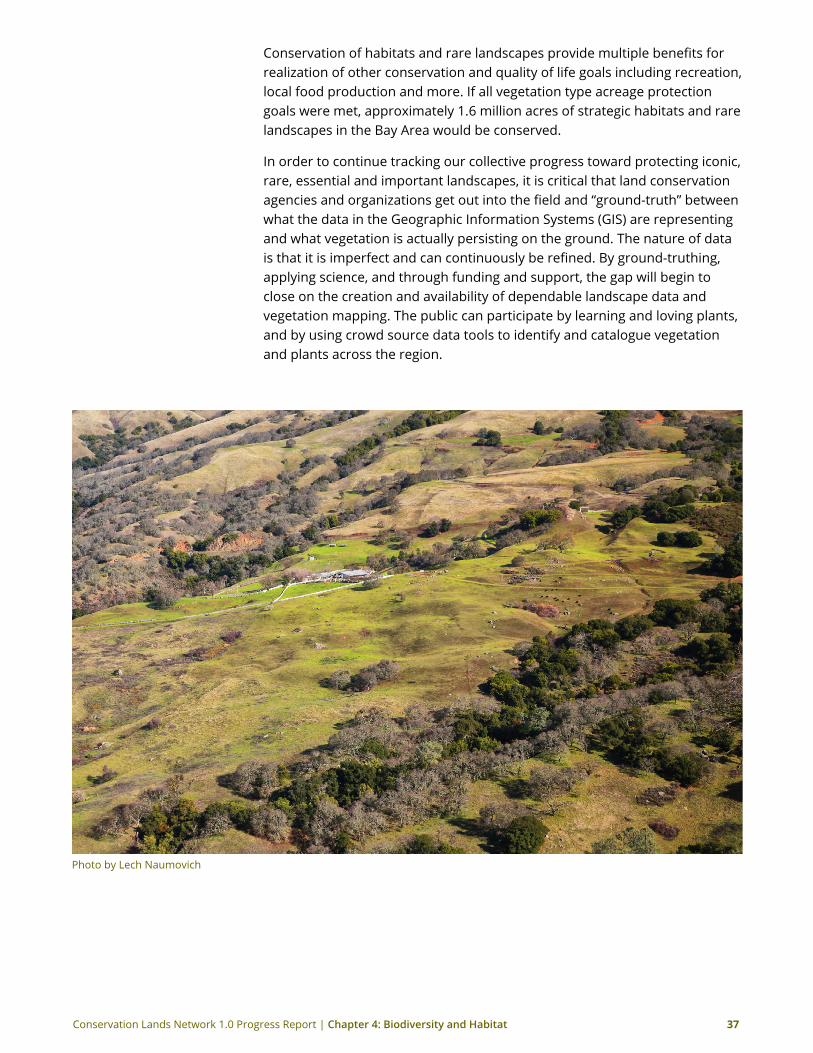
Photo by Lech Naumovich
Conservation Lands Network 1.0 Progress Report | Chapter 4: Biodiversity and Habitat 30
Figure 4.1: Coarse Filter Vegetation Map. The most rare habitats and landscapes in each of the 29 landscape units have greater protection goals than common habitats and landscapes in each landscape unit, respectively. For an interactive version of this map, visit www.bayarealands.org. Data: CLN 1.0 report.
Conservation Lands Network 1.0 Progress Report | Chapter 4: Biodiversity and Habitat 31
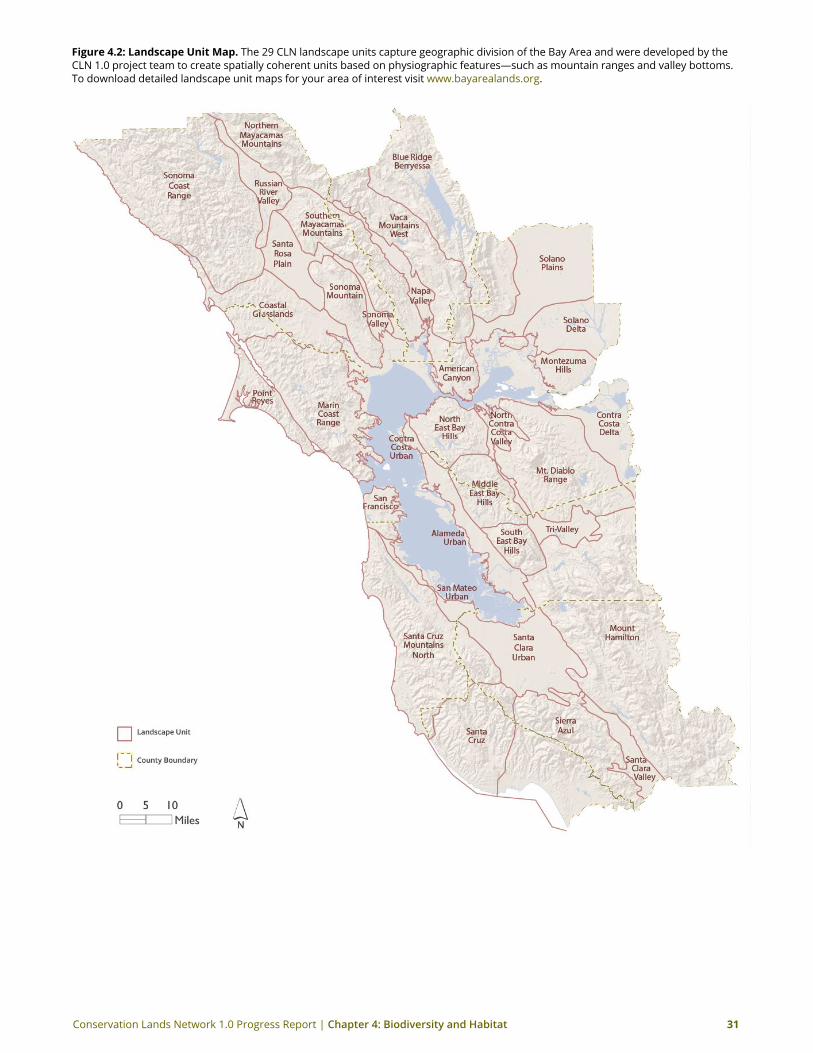
Figure 4.2: Landscape Unit Map. The 29 CLN landscape units capture geographic division of the Bay Area and were developed by the CLN 1.0 project team to create spatially coherent units based on physiographic features—such as mountain ranges and valley bottoms. To download detailed landscape unit maps for your area of interest visit www.bayarealands.org.
Conservation Lands Network 1.0 Progress Report | Chapter 4: Biodiversity and Habitat 32
For a comprehensive list of vegetation types by county and in each of the twenty-nine landscape units, see the Appendix at www.bayarealands.org.
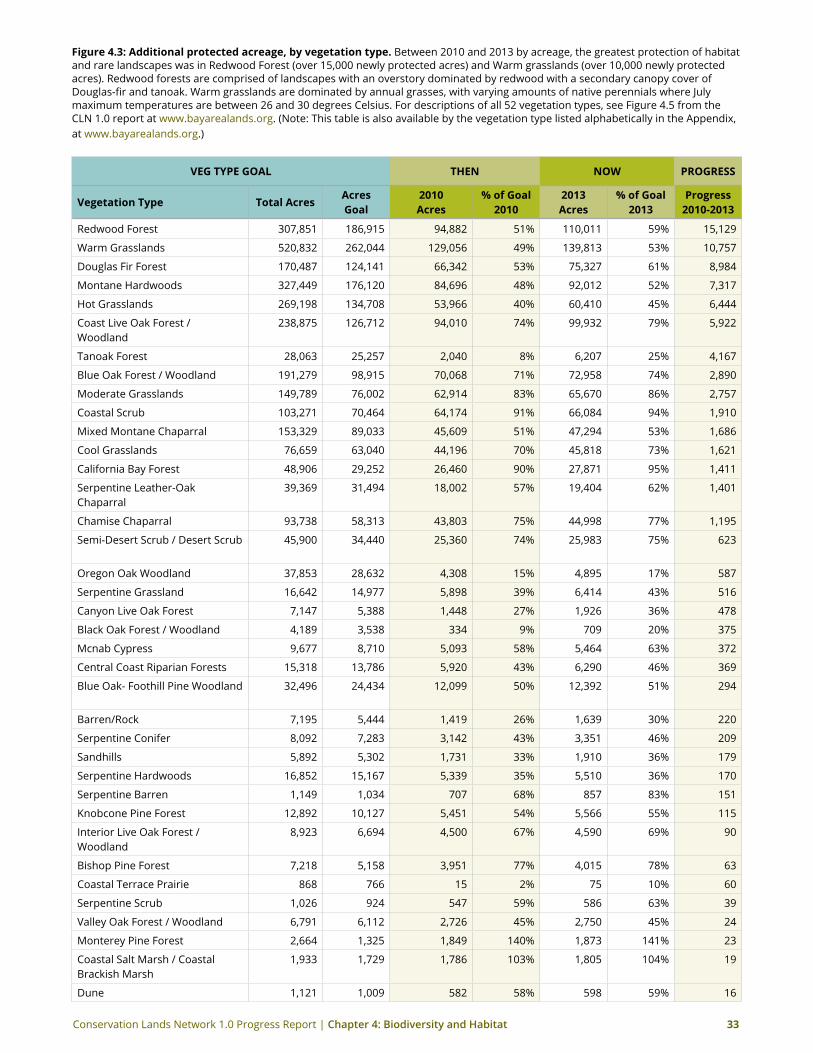
The Vegetation Type Acreage Goals established in CLN 1.0 are included in Figure 4.3. The original table (Figure 4.8 in the CLN 1.0 report) outlines each vegetation type, the total acres in which they occur throughout the region, their rarity ranking, their acreage protection goal, the number of acres protected (as of 2010), and the number of remaining acres necessary to meet their protection goal.
At the time the CLN 1.0 was released, the Bay Area was 56% successful toward meeting the habitat and rare landscape protection goals as defined through the Conservation Lands Network. It is important to note that the CLN 1.0 did not include Santa Cruz County. Therefore, the acreage goals set in 2010 for each vegetation type do not account for any acreage of those vegetation types occurring in Santa Cruz. Vegetation target revisions to include Santa Cruz will be considered in the anticipated CLN 2.0 update. More information on the incorporation of Santa Cruz into the CLN 1.0 Updated Basemap, and the methods to adjust progress accounting can be found in the Appendix at www.bayarealands.org.
Progress toward the vegetation type goals is measured by calculating the change in acreage from 2010 to 2013 for each vegetation type. Since 2010, landscapes representing nearly all of the 52 vegetation types across the region have been protected. Because of these efforts, the Bay Area is now 61% successful toward meeting the habitat and rare landscape protection goals. These protection rates reflect habitats and rare landscapes that are now accounted for in the Bay Area Protected Areas Database (BPAD 2013).
Photo by Lech Naumovich
Conservation Lands Network 1.0 Progress Report | Chapter 4: Biodiversity and Habitat 33
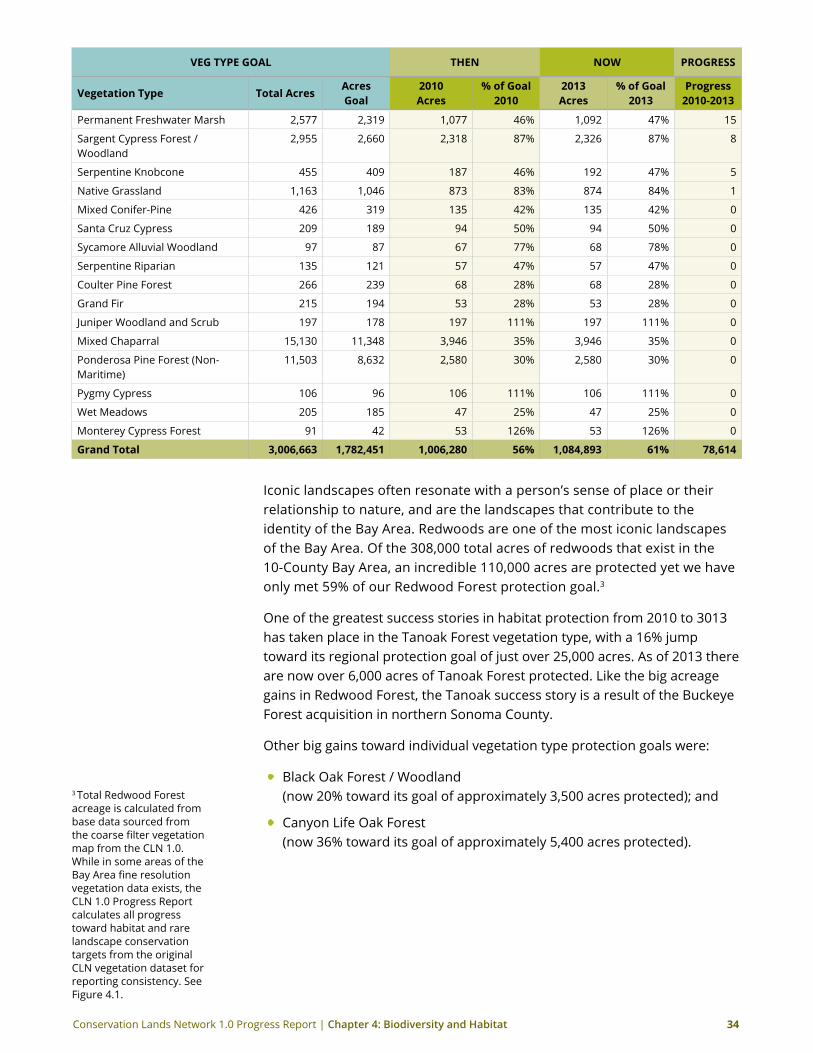
Figure 4.3: Additional protected acreage, by vegetation type. Between 2010 and 2013 by acreage, the greatest protection of habitat and rare landscapes was in Redwood Forest (over 15,000 newly protected acres) and Warm grasslands (over 10,000 newly protected acres). Redwood forests are comprised of landscapes with an overstory dominated by redwood with a secondary canopy cover of Douglas-fir and tanoak. Warm grasslands are dominated by annual grasses, with varying amounts of native perennials where July maximum temperatures are between 26 and 30 degrees Celsius. For descriptions of all 52 vegetation types, see Figure 4.5 from the CLN 1.0 report at www.bayarealands.org. (Note: This table is also available by the vegetation type listed alphabetically in the Appendix, at www.bayarealands.org.)
Veg TYPe goAL THeN NoW Progress
Vegetation Type Total AcresAcres goal
2010 Acres
% of goal 2010
2013 Acres
% of goal 2013
Progress 2010-2013
Redwood Forest 307,851 186,915 94,882 51% 110,011 59% 15,129
Warm Grasslands 520,832 262,044 129,056 49% 139,813 53% 10,757
Douglas Fir Forest 170,487 124,141 66,342 53% 75,327 61% 8,984
Montane Hardwoods 327,449 176,120 84,696 48% 92,012 52% 7,317
Hot Grasslands 269,198 134,708 53,966 40% 60,410 45% 6,444
Coast Live Oak Forest / Woodland
238,875 126,712 94,010 74% 99,932 79% 5,922
Tanoak Forest 28,063 25,257 2,040 8% 6,207 25% 4,167
Blue Oak Forest / Woodland 191,279 98,915 70,068 71% 72,958 74% 2,890
Moderate Grasslands 149,789 76,002 62,914 83% 65,670 86% 2,757
Coastal Scrub 103,271 70,464 64,174 91% 66,084 94% 1,910
Mixed Montane Chaparral 153,329 89,033 45,609 51% 47,294 53% 1,686
Cool Grasslands 76,659 63,040 44,196 70% 45,818 73% 1,621
California Bay Forest 48,906 29,252 26,460 90% 27,871 95% 1,411
Serpentine Leather-Oak Chaparral
39,369 31,494 18,002 57% 19,404 62% 1,401
Chamise Chaparral 93,738 58,313 43,803 75% 44,998 77% 1,195
Semi-Desert Scrub / Desert Scrub 45,900 34,440 25,360 74% 25,983 75% 623
Oregon Oak Woodland 37,853 28,632 4,308 15% 4,895 17% 587
Serpentine Grassland 16,642 14,977 5,898 39% 6,414 43% 516
Canyon Live Oak Forest 7,147 5,388 1,448 27% 1,926 36% 478
Black Oak Forest / Woodland 4,189 3,538 334 9% 709 20% 375
Mcnab Cypress 9,677 8,710 5,093 58% 5,464 63% 372
Central Coast Riparian Forests 15,318 13,786 5,920 43% 6,290 46% 369
Blue Oak- Foothill Pine Woodland 32,496 24,434 12,099 50% 12,392 51% 294
Barren/Rock 7,195 5,444 1,419 26% 1,639 30% 220
Serpentine Conifer 8,092 7,283 3,142 43% 3,351 46% 209
Sandhills 5,892 5,302 1,731 33% 1,910 36% 179
Serpentine Hardwoods 16,852 15,167 5,339 35% 5,510 36% 170
Serpentine Barren 1,149 1,034 707 68% 857 83% 151
Knobcone Pine Forest 12,892 10,127 5,451 54% 5,566 55% 115
Interior Live Oak Forest / Woodland
8,923 6,694 4,500 67% 4,590 69% 90
Bishop Pine Forest 7,218 5,158 3,951 77% 4,015 78% 63
Coastal Terrace Prairie 868 766 15 2% 75 10% 60
Serpentine Scrub 1,026 924 547 59% 586 63% 39
Valley Oak Forest / Woodland 6,791 6,112 2,726 45% 2,750 45% 24
Monterey Pine Forest 2,664 1,325 1,849 140% 1,873 141% 23
Coastal Salt Marsh / Coastal Brackish Marsh
1,933 1,729 1,786 103% 1,805 104% 19
Dune 1,121 1,009 582 58% 598 59% 16
Conservation Lands Network 1.0 Progress Report | Chapter 4: Biodiversity and Habitat 34
Veg TYPe goAL THeN NoW Progress
Vegetation Type Total AcresAcres goal
2010 Acres
% of goal 2010
2013 Acres
% of goal 2013
Progress 2010-2013
Permanent Freshwater Marsh 2,577 2,319 1,077 46% 1,092 47% 15
Sargent Cypress Forest / Woodland
2,955 2,660 2,318 87% 2,326 87% 8
Serpentine Knobcone 455 409 187 46% 192 47% 5
Native Grassland 1,163 1,046 873 83% 874 84% 1
Mixed Conifer-Pine 426 319 135 42% 135 42% 0
Santa Cruz Cypress 209 189 94 50% 94 50% 0
Sycamore Alluvial Woodland 97 87 67 77% 68 78% 0
Serpentine Riparian 135 121 57 47% 57 47% 0
Coulter Pine Forest 266 239 68 28% 68 28% 0
Grand Fir 215 194 53 28% 53 28% 0
Juniper Woodland and Scrub 197 178 197 111% 197 111% 0
Mixed Chaparral 15,130 11,348 3,946 35% 3,946 35% 0
Ponderosa Pine Forest (Non-Maritime)
11,503 8,632 2,580 30% 2,580 30% 0
Pygmy Cypress 106 96 106 111% 106 111% 0
Wet Meadows 205 185 47 25% 47 25% 0
Monterey Cypress Forest 91 42 53 126% 53 126% 0
grand Total 3,006,663 1,782,451 1,006,280 56% 1,084,893 61% 78,614
Iconic landscapes often resonate with a person’s sense of place or their relationship to nature, and are the landscapes that contribute to the identity of the Bay Area. Redwoods are one of the most iconic landscapes of the Bay Area. Of the 308,000 total acres of redwoods that exist in the 10-County Bay Area, an incredible 110,000 acres are protected yet we have only met 59% of our Redwood Forest protection goal.3
One of the greatest success stories in habitat protection from 2010 to 3013 has taken place in the Tanoak Forest vegetation type, with a 16% jump toward its regional protection goal of just over 25,000 acres. As of 2013 there are now over 6,000 acres of Tanoak Forest protected. Like the big acreage gains in Redwood Forest, the Tanoak success story is a result of the Buckeye Forest acquisition in northern Sonoma County.
Other big gains toward individual vegetation type protection goals were:
• Black Oak Forest / Woodland (now 20% toward its goal of approximately 3,500 acres protected); and
• Canyon Life Oak Forest (now 36% toward its goal of approximately 5,400 acres protected).
3 Total Redwood Forest acreage is calculated from base data sourced from the coarse filter vegetation map from the CLN 1.0. While in some areas of the Bay Area fine resolution vegetation data exists, the CLN 1.0 Progress Report calculates all progress toward habitat and rare landscape conservation targets from the original CLN vegetation dataset for reporting consistency. See Figure 4.1.
Conservation Lands Network 1.0 Progress Report | Chapter 4: Biodiversity and Habitat 35
Protection of rare LandscapesRarity, as defined in the Conservation Lands Network, is a classification of commonness of a vegetation type within each of the twenty-nine landscape units. For example, if a single Redwood Forest stand existed in eastern Contra Costa County (or more specifically the Contra Costa Delta Landscape Unit), it would be rare, because there are no other Redwood Stands in that landscape unit. Rarity ranking of each of the 52 vegetation types within each of the 29 landscape units is the function used to set higher or lower conservation goals for each of the vegetation types.
Rarity rankings are defined in the Conservation Lands Network:
rarity 1 (CLN conservation goal of 95%) Globally unique or highest priority locally rare vegetation types.
Examples: Old-growth Redwood, Serpentine Grasslands, Valley Oak Forest/Woodland, Redwood Forest east of Napa Valley.
rarity 2 (CLN 1.0 conservation goal of 75%) Locally rare vegetation types comprising 5% or less of a landscape unit.
Examples: Blue Oak/Foothill Pine Woodland in the Mt. Hamilton Landscape Unit (in Alameda and Contra Costa Counties), Douglas-Fir Forest in the Russian River Valley Landscape Unit (in Sonoma County), Montane Hardwoods in the Blue Ridge Berryessa Landscape Unit (in Napa and Solano Counties).
rarity 3 (CLN 1.0 conservation goal of 50%) Locally and globally common vegetation types comprising more than 5% of a landscape unit.
Examples: Blue Oak Forest/Woodland in the Mt. Hamilton Landscape Unit (in Alameda and Contra Costa Counties), and Hot Grasslands in the Blue Ridge Berryessa Landscape Unit (in Napa and Solano Counties).
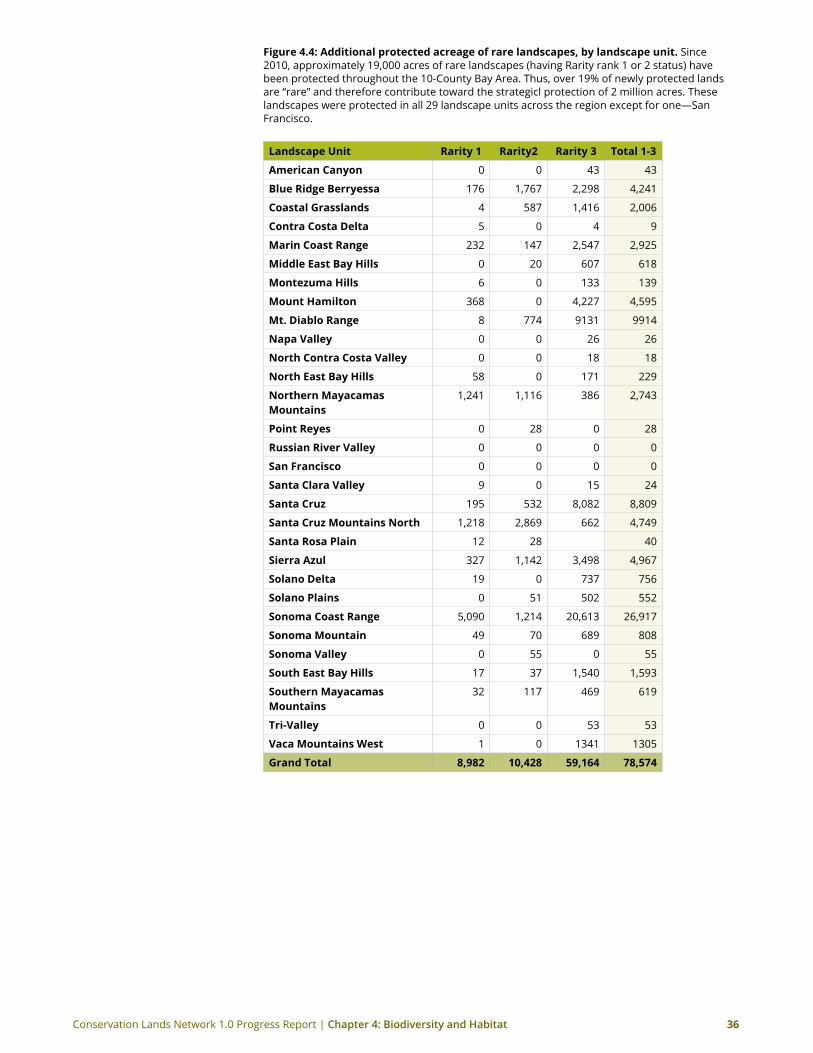
By tracking progress of additional protected acres of vegetation by rarity in each of the 29 landscape units, we ascertain how many total acres of rare landscapes throughout the Bay Area have been protected between 2010 and 2013. The landscape units (or regions) with the greatest progress with regard to protecting rare landscapes are the Sonoma Coast Range (in Sonoma County), the Mt. Diablo Range (in Contra Costa and Alameda Counties), and the Santa Cruz landscape unit (in Santa Cruz County).
Conservation Lands Network 1.0 Progress Report | Chapter 4: Biodiversity and Habitat 36
Figure 4.4: Additional protected acreage of rare landscapes, by landscape unit. Since 2010, approximately 19,000 acres of rare landscapes (having Rarity rank 1 or 2 status) have been protected throughout the 10-County Bay Area. Thus, over 19% of newly protected lands are “rare” and therefore contribute toward the strategicl protection of 2 million acres. These landscapes were protected in all 29 landscape units across the region except for one—San Francisco.
Landscape Unit rarity 1 rarity2 rarity 3 Total 1-3
American Canyon 0 0 43 43
Blue ridge Berryessa 176 1,767 2,298 4,241
Coastal grasslands 4 587 1,416 2,006
Contra Costa Delta 5 0 4 9
Marin Coast range 232 147 2,547 2,925
Middle east Bay Hills 0 20 607 618
Montezuma Hills 6 0 133 139
Mount Hamilton 368 0 4,227 4,595
Mt. Diablo range 8 774 9131 9914
Napa Valley 0 0 26 26
North Contra Costa Valley 0 0 18 18
North east Bay Hills 58 0 171 229
Northern Mayacamas Mountains
1,241 1,116 386 2,743
Point reyes 0 28 0 28
russian river Valley 0 0 0 0
san Francisco 0 0 0 0
santa Clara Valley 9 0 15 24
santa Cruz 195 532 8,082 8,809
santa Cruz Mountains North 1,218 2,869 662 4,749
santa rosa Plain 12 28 40
sierra Azul 327 1,142 3,498 4,967
solano Delta 19 0 737 756
solano Plains 0 51 502 552
sonoma Coast range 5,090 1,214 20,613 26,917
sonoma Mountain 49 70 689 808
sonoma Valley 0 55 0 55
south east Bay Hills 17 37 1,540 1,593
southern Mayacamas Mountains
32 117 469 619
Tri-Valley 0 0 53 53
Vaca Mountains West 1 0 1341 1305
grand Total 8,982 10,428 59,164 78,574
Conservation Lands Network 1.0 Progress Report | Chapter 4: Biodiversity and Habitat 37
Conservation of habitats and rare landscapes provide multiple benefits for realization of other conservation and quality of life goals including recreation, local food production and more. If all vegetation type acreage protection goals were met, approximately 1.6 million acres of strategic habitats and rare landscapes in the Bay Area would be conserved.
In order to continue tracking our collective progress toward protecting iconic, rare, essential and important landscapes, it is critical that land conservation agencies and organizations get out into the field and “ground-truth” between what the data in the Geographic Information Systems (GIS) are representing and what vegetation is actually persisting on the ground. The nature of data is that it is imperfect and can continuously be refined. By ground-truthing, applying science, and through funding and support, the gap will begin to close on the creation and availability of dependable landscape data and vegetation mapping. The public can participate by learning and loving plants, and by using crowd source data tools to identify and catalogue vegetation and plants across the region.
Photo by Lech Naumovich
Conservation Lands Network 1.0 Progress Report | Chapter 5: Water Resources 38
5 Water resources
Photo by Cait Hutnik
The water resources above and below ground—streams, rivers, ponds, vernal pools, lakes and reservoirs, groundwater basins and watersheds—are the veins of life support for the upland habitats and rare landscapes that comprise the Conservation Lands Network. The CLN 1.0 recognized that a whole-watershed is necessary for the successful conservation of riparian and fish habitat. Therefore, Water Resources are defined in the CLN 1.0 Progress Report as the important streams, riparian habitat, and associated upland areas that support healthy native fish populations and ensure watershed functionality.
Water resource Progress Metrics include additional stream miles of protected aquatic and riparian habitat, and watershed functions measured by rates of recharge and runoff flows.
Water is life—literally. Neither the people or the plants, animals and birds that live in or migrate to and from the Bay Area can thrive without fresh, clean water—and plenty of it. Clean water comes to the Bay Area in a number of ways, but the sources are always the same: from precipitation, groundwater and snowmelt. Conservation of upland habitats helps to protect the Bay Area’s reliable water quantity and storage sources, from healthy soils that soak up the rain to ground water basins and above ground lakes and reservoirs that store it for the long term.
Conservation Lands Network 1.0 Progress Report | Chapter 5: Water Resources 39
Water quality is as important as water quantity. Consistent and reliable stream flows are vital to native fish populations and other animals, birds and insects that depend on healthy riparian habitats. Sound stewardship of upland habitats, landscapes and watersheds protects reservoirs and streams from pollutants.
There is an increased need for watershed-wide land protection in a changing climate. Indeed, the Conservation Lands Network is “climate smart” (Heller 2013). The Terrestrial Biodiversity Climate Change Collaborative (TBC3) conducted a test of the likely resilience of the CLN to climate change based on ecological theory that greater climatic diversity provides greater options for populations to respond and adapt. Findings show that the CLN captures the diversity of climate space in the region similarly to a model network designed on climatic diversity as the conservation target. As such, comprehensive watershed protection and management are fundamental for climate change adaptation and resiliency. (See the Appendix at www.bayarealands.org for the an examination of how weather—in the context of longer-term variability—highlights the multiple values of functioning watersheds and the stewardship challenges to keep those watersheds functioning.)
The California Drought Beginning in 2013, California has experienced a “severe” to “exceptional” drought (National Drought Mitigation Center 2014). Across the state, rangeland conditions remain 70% very poor to poor due to lack of water resources. Similarly, topsoil moisture is 80% short and subsoil moisture is 85% short, leaving plants and residual matter excessively dry and susceptible to wildfires. While droughts are a natural part of climate, the Bay Area’s “exceptional” drought situation is stressing our resources and making the protection of land and water resources all the more important, to ensure local supply and storage of water as well as healthy habitats.
The Conservation Lands Network (CLN) reinforces the value of comprehensive watershed planning. Thoughtful landscape scale conservation and land protection are necessary to ensure the Bay Area’s watersheds are healthy so that the working components which provide water quality and water quantity—the watershed’s streams, riparian areas, and water storage basins and reservoirs—are healthy as well.
Protected stream miles and riparian habitatThe CLN 1.0 reported that, astonishingly, 95% of riparian habitat has been lost due to disruption of natural stream flows, urban development, and water diversion (CCMP 2007). Therefore, protection and stewardship of riparian zones is a fundamental conservation goal in the Conservation Lands Network. Because all streams and riparian zones have high ecological value, all perennial streams from the 1:24,000 National Hydrography Data set stream coverage are considered part of the CLN. Nonetheless, some streams are more immediately important than others.
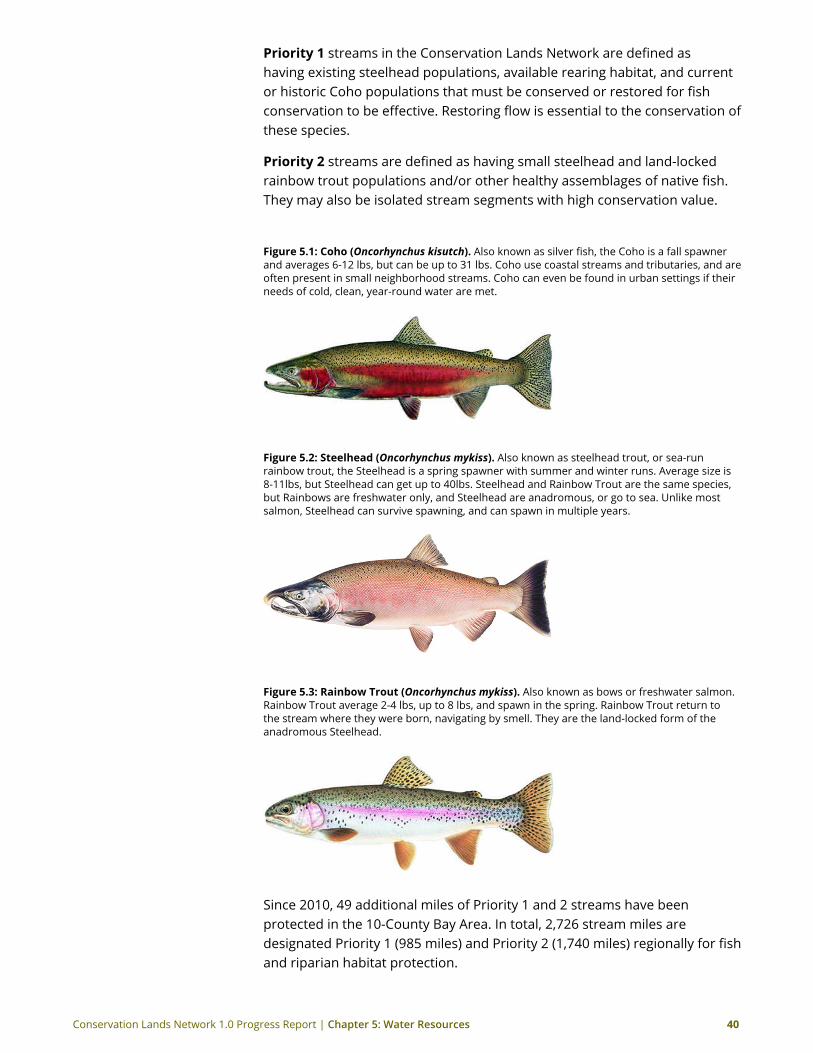
Conservation Lands Network 1.0 Progress Report | Chapter 5: Water Resources 40
Priority 1 streams in the Conservation Lands Network are defined as having existing steelhead populations, available rearing habitat, and current or historic Coho populations that must be conserved or restored for fish conservation to be effective. Restoring flow is essential to the conservation of these species.
Priority 2 streams are defined as having small steelhead and land-locked rainbow trout populations and/or other healthy assemblages of native fish. They may also be isolated stream segments with high conservation value.
Figure 5.1: Coho (Oncorhynchus kisutch). Also known as silver fish, the Coho is a fall spawner and averages 6-12 lbs, but can be up to 31 lbs. Coho use coastal streams and tributaries, and are often present in small neighborhood streams. Coho can even be found in urban settings if their needs of cold, clean, year-round water are met.
Figure 5.2: steelhead (Oncorhynchus mykiss). Also known as steelhead trout, or sea-run rainbow trout, the Steelhead is a spring spawner with summer and winter runs. Average size is 8-11lbs, but Steelhead can get up to 40lbs. Steelhead and Rainbow Trout are the same species, but Rainbows are freshwater only, and Steelhead are anadromous, or go to sea. Unlike most salmon, Steelhead can survive spawning, and can spawn in multiple years.
Figure 5.3: rainbow Trout (Oncorhynchus mykiss). Also known as bows or freshwater salmon. Rainbow Trout average 2-4 lbs, up to 8 lbs, and spawn in the spring. Rainbow Trout return to the stream where they were born, navigating by smell. They are the land-locked form of the anadromous Steelhead.
Since 2010, 49 additional miles of Priority 1 and 2 streams have been protected in the 10-County Bay Area. In total, 2,726 stream miles are designated Priority 1 (985 miles) and Priority 2 (1,740 miles) regionally for fish and riparian habitat protection.
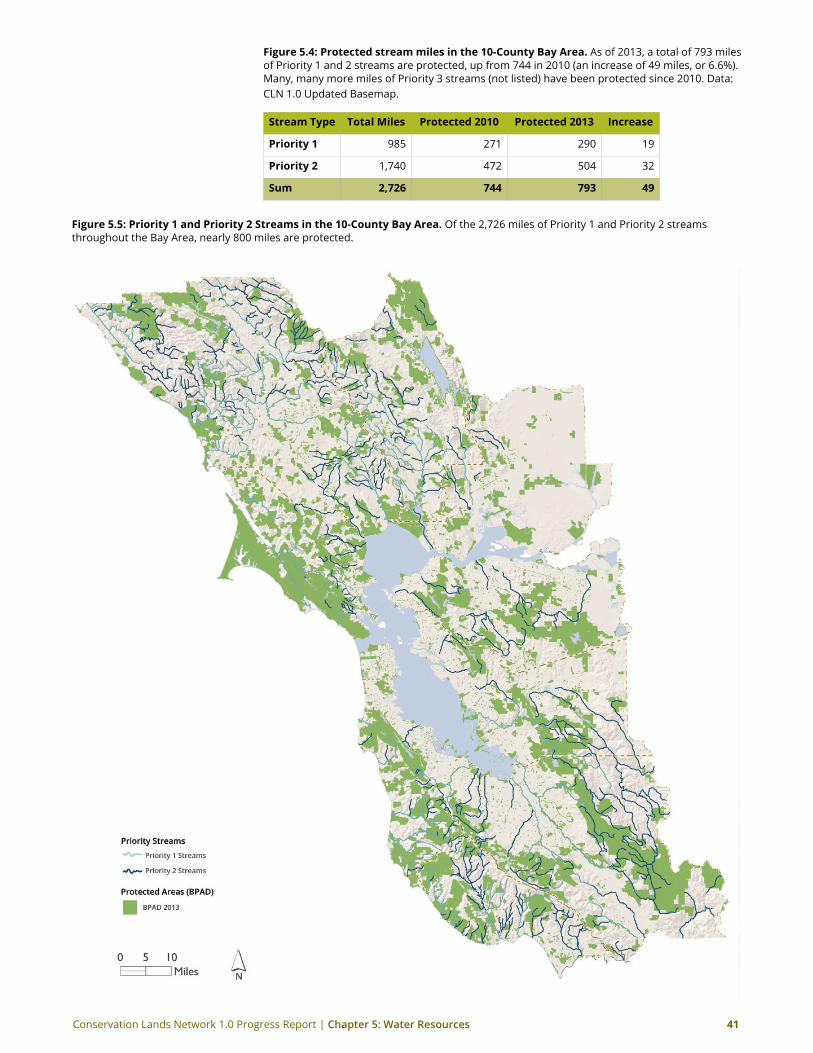
Conservation Lands Network 1.0 Progress Report | Chapter 5: Water Resources 41
Figure 5.4: Protected stream miles in the 10-County Bay Area. As of 2013, a total of 793 miles of Priority 1 and 2 streams are protected, up from 744 in 2010 (an increase of 49 miles, or 6.6%). Many, many more miles of Priority 3 streams (not listed) have been protected since 2010. Data: CLN 1.0 Updated Basemap.
stream Type Total Miles Protected 2010 Protected 2013 Increase
Priority 1 985 271 290 19
Priority 2 1,740 472 504 32
sum 2,726 744 793 49
Figure 5.5: Priority 1 and Priority 2 streams in the 10-County Bay Area. Of the 2,726 miles of Priority 1 and Priority 2 streams throughout the Bay Area, nearly 800 miles are protected.
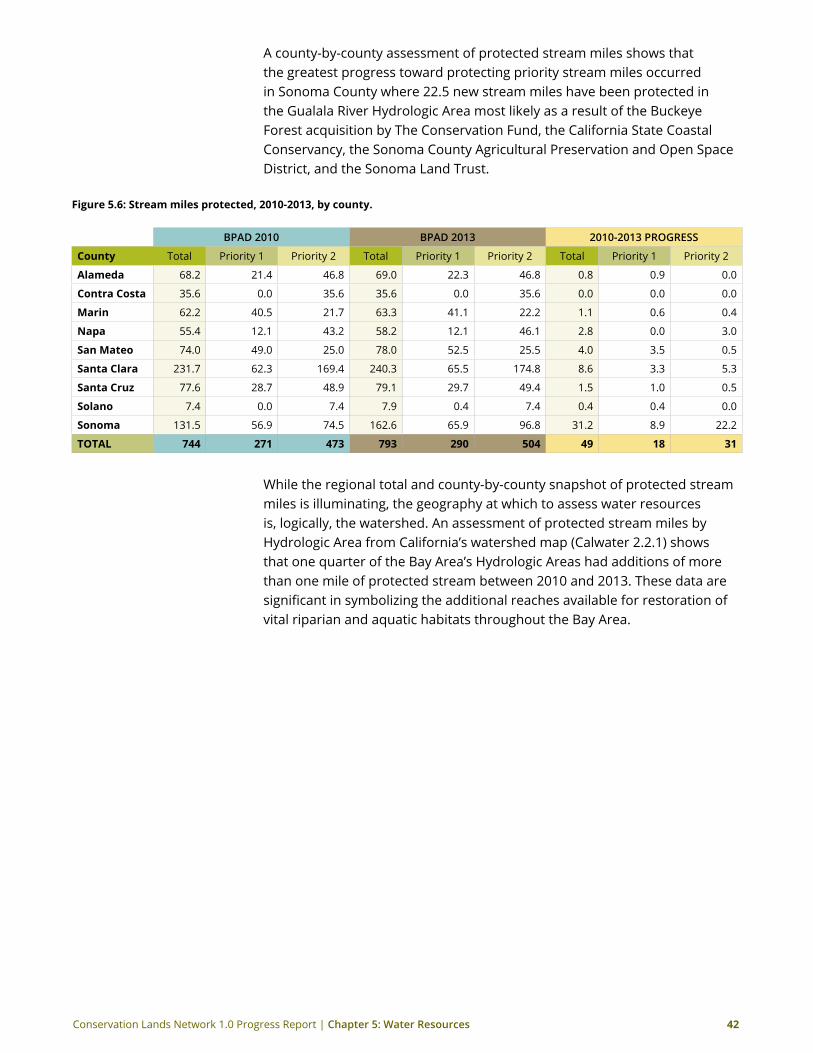
Conservation Lands Network 1.0 Progress Report | Chapter 5: Water Resources 42
A county-by-county assessment of protected stream miles shows that the greatest progress toward protecting priority stream miles occurred in Sonoma County where 22.5 new stream miles have been protected in the Gualala River Hydrologic Area most likely as a result of the Buckeye Forest acquisition by The Conservation Fund, the California State Coastal Conservancy, the Sonoma County Agricultural Preservation and Open Space District, and the Sonoma Land Trust.
Figure 5.6: stream miles protected, 2010-2013, by county.
BPAD 2010 BPAD 2013 2010-2013 PROGRESS
County Total Priority 1 Priority 2 Total Priority 1 Priority 2 Total Priority 1 Priority 2
Alameda 68.2 21.4 46.8 69.0 22.3 46.8 0.8 0.9 0.0
Contra Costa 35.6 0.0 35.6 35.6 0.0 35.6 0.0 0.0 0.0
Marin 62.2 40.5 21.7 63.3 41.1 22.2 1.1 0.6 0.4
Napa 55.4 12.1 43.2 58.2 12.1 46.1 2.8 0.0 3.0
san Mateo 74.0 49.0 25.0 78.0 52.5 25.5 4.0 3.5 0.5
santa Clara 231.7 62.3 169.4 240.3 65.5 174.8 8.6 3.3 5.3
santa Cruz 77.6 28.7 48.9 79.1 29.7 49.4 1.5 1.0 0.5
solano 7.4 0.0 7.4 7.9 0.4 7.4 0.4 0.4 0.0
sonoma 131.5 56.9 74.5 162.6 65.9 96.8 31.2 8.9 22.2
ToTAL 744 271 473 793 290 504 49 18 31
While the regional total and county-by-county snapshot of protected stream miles is illuminating, the geography at which to assess water resources is, logically, the watershed. An assessment of protected stream miles by Hydrologic Area from California’s watershed map (Calwater 2.2.1) shows that one quarter of the Bay Area’s Hydrologic Areas had additions of more than one mile of protected stream between 2010 and 2013. These data are significant in symbolizing the additional reaches available for restoration of vital riparian and aquatic habitats throughout the Bay Area.
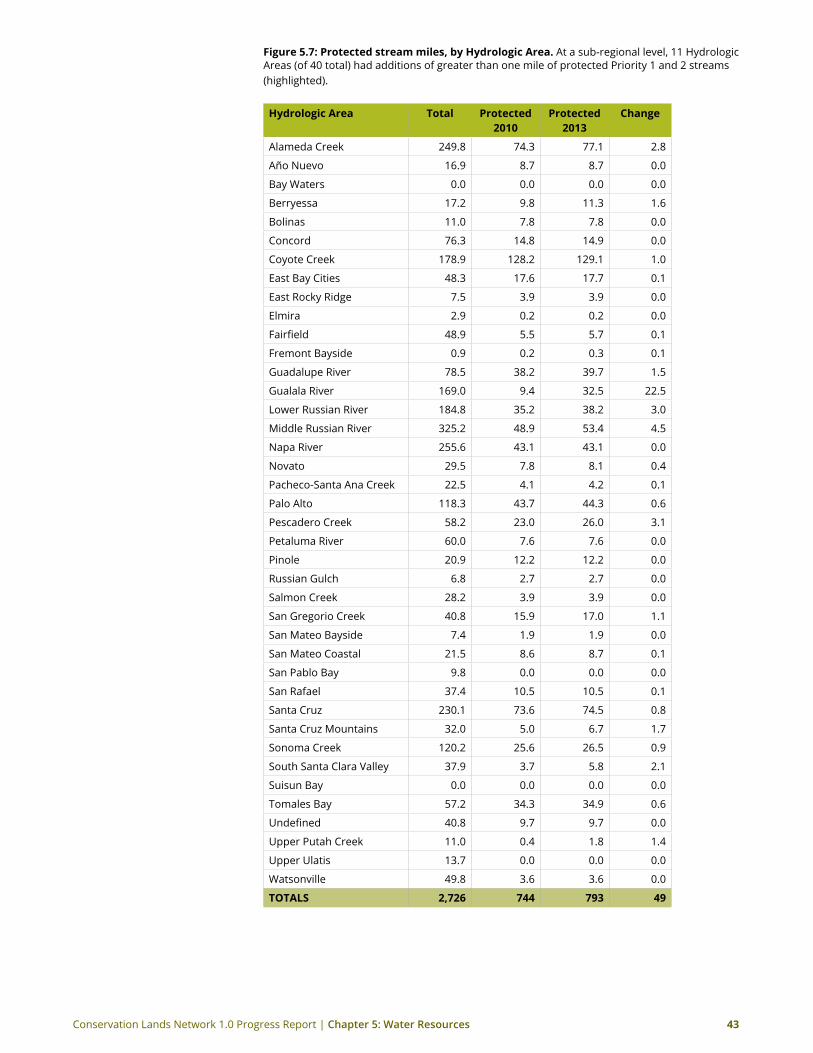
Conservation Lands Network 1.0 Progress Report | Chapter 5: Water Resources 43
Figure 5.7: Protected stream miles, by Hydrologic Area. At a sub-regional level, 11 Hydrologic Areas (of 40 total) had additions of greater than one mile of protected Priority 1 and 2 streams (highlighted).
Hydrologic Area Total Protected 2010
Protected 2013
Change
Alameda Creek 249.8 74.3 77.1 2.8
Año Nuevo 16.9 8.7 8.7 0.0
Bay Waters 0.0 0.0 0.0 0.0
Berryessa 17.2 9.8 11.3 1.6
Bolinas 11.0 7.8 7.8 0.0
Concord 76.3 14.8 14.9 0.0
Coyote Creek 178.9 128.2 129.1 1.0
East Bay Cities 48.3 17.6 17.7 0.1
East Rocky Ridge 7.5 3.9 3.9 0.0
Elmira 2.9 0.2 0.2 0.0
Fairfield 48.9 5.5 5.7 0.1
Fremont Bayside 0.9 0.2 0.3 0.1
Guadalupe River 78.5 38.2 39.7 1.5
Gualala River 169.0 9.4 32.5 22.5
Lower Russian River 184.8 35.2 38.2 3.0
Middle Russian River 325.2 48.9 53.4 4.5
Napa River 255.6 43.1 43.1 0.0
Novato 29.5 7.8 8.1 0.4
Pacheco-Santa Ana Creek 22.5 4.1 4.2 0.1
Palo Alto 118.3 43.7 44.3 0.6
Pescadero Creek 58.2 23.0 26.0 3.1
Petaluma River 60.0 7.6 7.6 0.0
Pinole 20.9 12.2 12.2 0.0
Russian Gulch 6.8 2.7 2.7 0.0
Salmon Creek 28.2 3.9 3.9 0.0
San Gregorio Creek 40.8 15.9 17.0 1.1
San Mateo Bayside 7.4 1.9 1.9 0.0
San Mateo Coastal 21.5 8.6 8.7 0.1
San Pablo Bay 9.8 0.0 0.0 0.0
San Rafael 37.4 10.5 10.5 0.1
Santa Cruz 230.1 73.6 74.5 0.8
Santa Cruz Mountains 32.0 5.0 6.7 1.7
Sonoma Creek 120.2 25.6 26.5 0.9
South Santa Clara Valley 37.9 3.7 5.8 2.1
Suisun Bay 0.0 0.0 0.0 0.0
Tomales Bay 57.2 34.3 34.9 0.6
Undefined 40.8 9.7 9.7 0.0
Upper Putah Creek 11.0 0.4 1.8 1.4
Upper Ulatis 13.7 0.0 0.0 0.0
Watsonville 49.8 3.6 3.6 0.0
ToTALs 2,726 744 793 49
Conservation Lands Network 1.0 Progress Report | Chapter 5: Water Resources 44
Riparian zones in protected lands tend to be more intact with larger buffers and floodplains and there may be greater restoration potential where they are degraded. Riparian zones in converted lands are highly altered and degraded, but the streams themselves may still support important native fishes and riparian habitat, and provide fish passage to intact upper watersheds.
Just as it applies to large, connected landscapes, “Think big, connect more” applies to stream mile protection, too. Think big by imagining natural flows are restored and habitat is accessible. Connect more fish habitat by removing barriers, planting trees for shade and in-stream temperature control, and more.
Streamflowandgroundwater:RunoffandRechargeareas One way of assessing the health of a watershed is through the hydrologic response of the landscape, which is a function of precipitation, temperature, topography, soil depth/texture, and bedrock permeability. Naturally, not all open lands have equal ability to soak up the precipitation that falls on its surface, but for those that can, the retention of water helps store vital resources for the drier days and thirsty cities and agricultural fields where we grow our food. Only after sufficient precipitation over the course of the water year (October-September) can saturated soils produce groundwater recharge and surface runoff. And total stream discharge (or “flow”) is a combination of immediate runoff and the slower release of shallow groundwater. (See the Appendix for a description of the Annual Hydrologic Cycle. See also the CLN Explorer tool at www.bayarealands.org.)
“Recharge” is water that permeates the surface, drains below the rooting zone and becomes shallow and deep groundwater. Recharge is precious in our climate, and is an obvious benefit of conservation lands and other open space. Maximum rates of recharge are determined by bedrock permeability. Shallow recharge is the sole natural source of stream flow during the dry season, and many Bay Area communities depend on deep well water. When land is developed, recharge decreases and runoff increases as impervious surfaces and hydrologic modifications divert potential recharge.
“Runoff” is short-term surface stream flow, and occurs during storms when the soils are at water capacity. (Imagine a sponge, when it is full of water.) Runoff occurs on shallower soils more rapidly than on deeper soils. Large runoff events fill reservoirs and flood creeks. Impervious surfaces and stormwater infrastructure create flashier runoff with downstream consequences.
RegionalAnalysisofRechargeandRunoffOn local scales, recharge and runoff are nearly mirror images across bands of permeable and impermeable bedrock, and from deep valley to shallow mountain soils. The Terrestrial Biodiversity Climate Change Collaborative (TBC3) project produced fine-scale maps of 30-year average recharge and runoff for the recent (1981-2010) time period, shown in Figure 5.8 and 5.9.
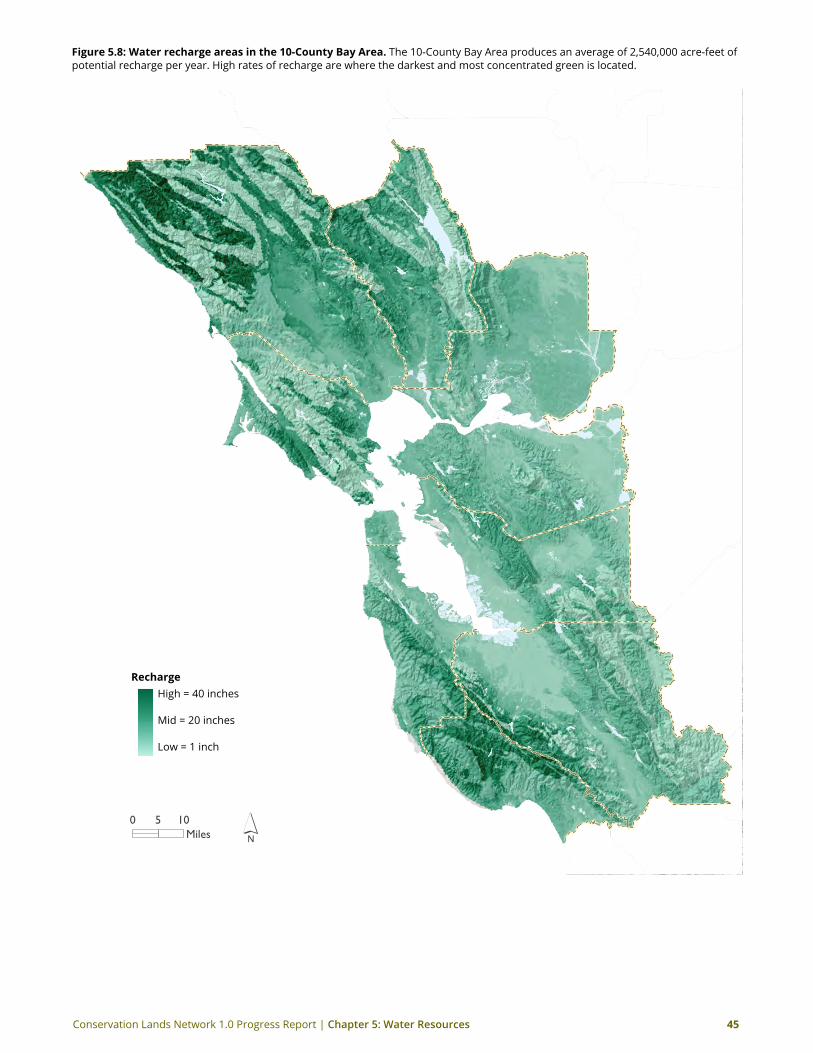
Conservation Lands Network 1.0 Progress Report | Chapter 5: Water Resources 45
Figure 5.8: Water recharge areas in the 10-County Bay Area. The 10-County Bay Area produces an average of 2,540,000 acre-feet of potential recharge per year. High rates of recharge are where the darkest and most concentrated green is located.
Runoff
Low
High
0 5 10Miles
High = 40 inches Mid = 20 inches Low = 1 inch
recharge
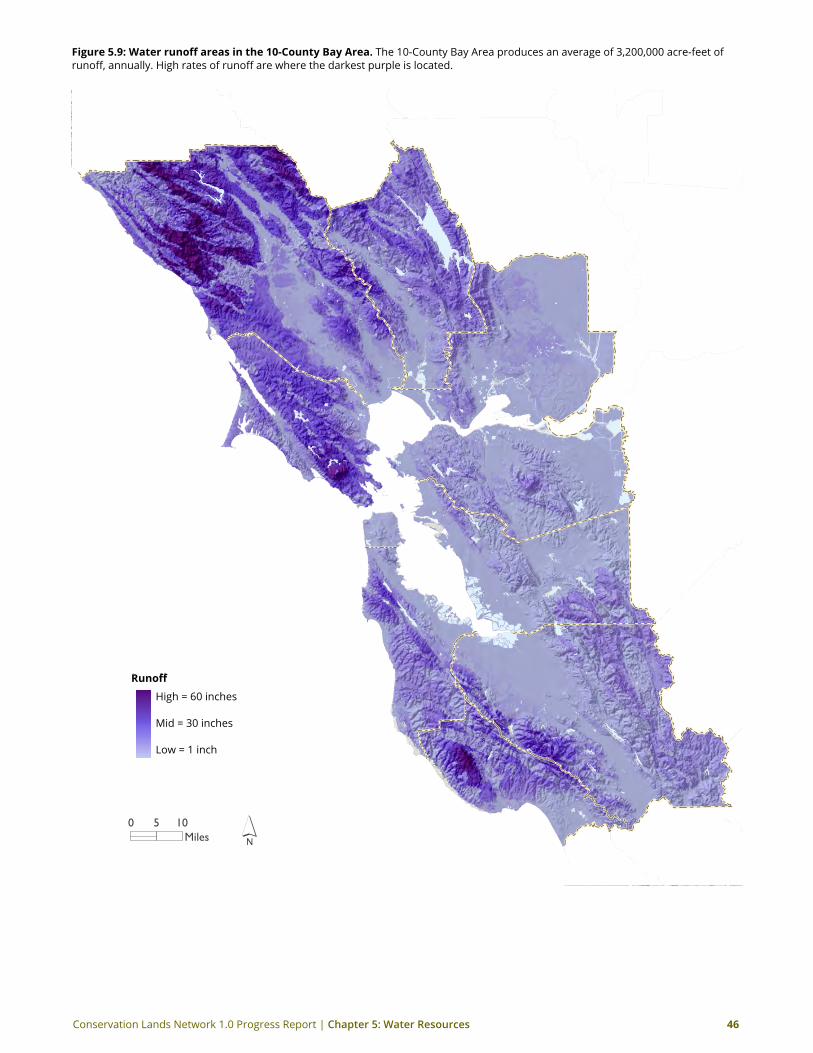
Conservation Lands Network 1.0 Progress Report | Chapter 5: Water Resources 46
Figure5.9:Waterrunoffareasinthe10-CountyBayArea. The 10-County Bay Area produces an average of 3,200,000 acre-feet of runoff, annually. High rates of runoff are where the darkest purple is located.
Runoff
Low
High
0 5 10Miles
Runoff
High = 60 inches Mid = 30 inches Low = 1 inch
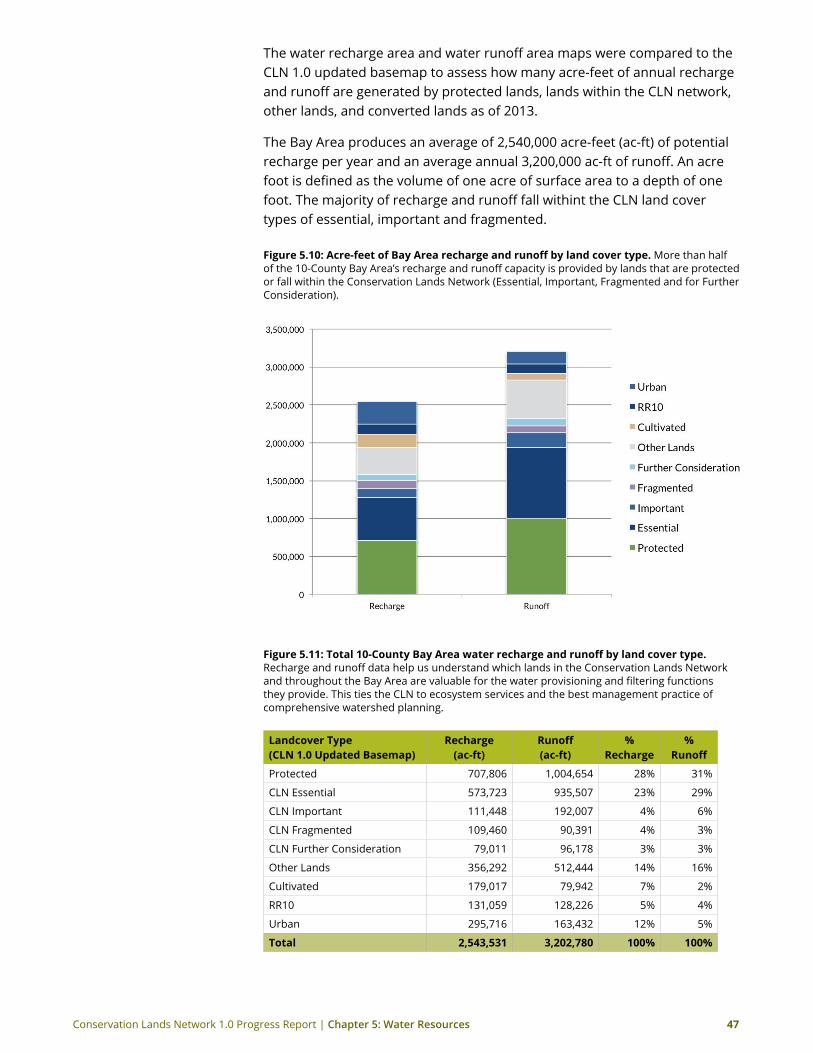
Conservation Lands Network 1.0 Progress Report | Chapter 5: Water Resources 47
The water recharge area and water runoff area maps were compared to the CLN 1.0 updated basemap to assess how many acre-feet of annual recharge and runoff are generated by protected lands, lands within the CLN network, other lands, and converted lands as of 2013.
The Bay Area produces an average of 2,540,000 acre-feet (ac-ft) of potential recharge per year and an average annual 3,200,000 ac-ft of runoff. An acre foot is defined as the volume of one acre of surface area to a depth of one foot. The majority of recharge and runoff fall withint the CLN land cover types of essential, important and fragmented.
Figure5.10:Acre-feetofBayArearechargeandrunoffbylandcovertype.More than half of the 10-County Bay Area’s recharge and runoff capacity is provided by lands that are protected or fall within the Conservation Lands Network (Essential, Important, Fragmented and for Further Consideration).
Figure5.11:Total10-CountyBayAreawaterrechargeandrunoffbylandcovertype. Recharge and runoff data help us understand which lands in the Conservation Lands Network and throughout the Bay Area are valuable for the water provisioning and filtering functions they provide. This ties the CLN to ecosystem services and the best management practice of comprehensive watershed planning.
Landcover Type (CLN 1.0 Updated Basemap)
recharge (ac-ft)
Runoff (ac-ft)
% recharge
% Runoff
Protected 707,806 1,004,654 28% 31%
CLN Essential 573,723 935,507 23% 29%
CLN Important 111,448 192,007 4% 6%
CLN Fragmented 109,460 90,391 4% 3%
CLN Further Consideration 79,011 96,178 3% 3%
Other Lands 356,292 512,444 14% 16%
Cultivated 179,017 79,942 7% 2%
RR10 131,059 128,226 5% 4%
Urban 295,716 163,432 12% 5%
Total 2,543,531 3,202,780 100% 100%
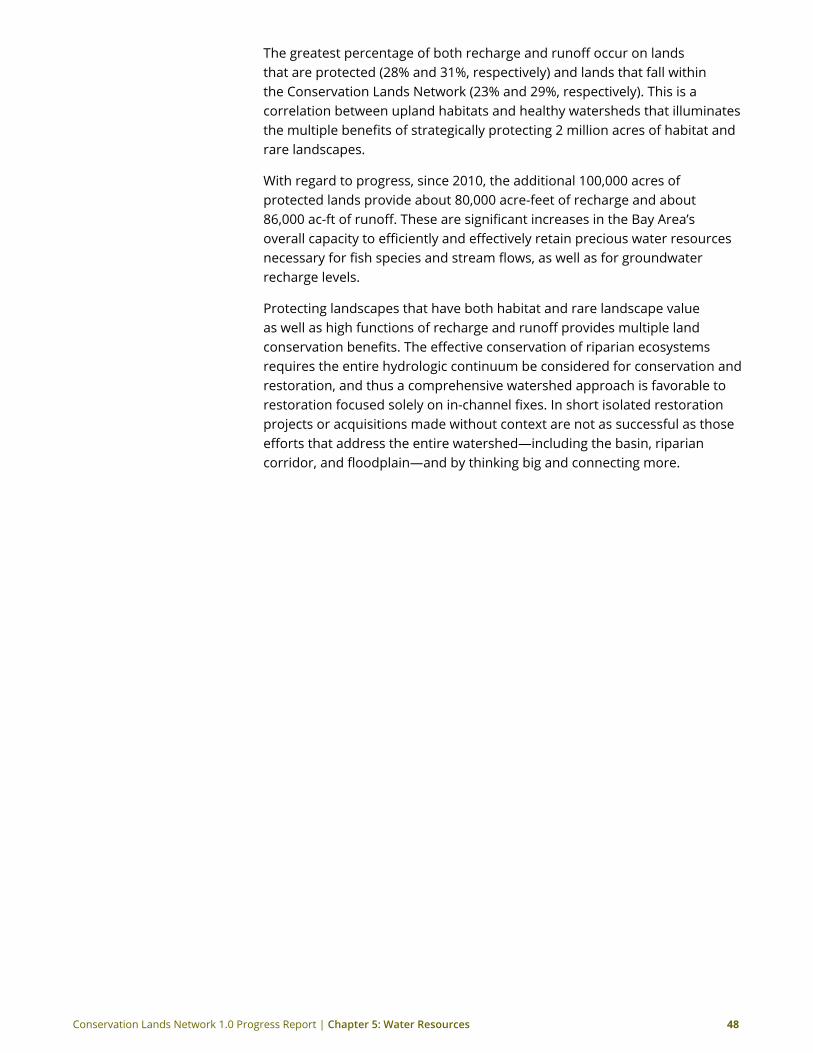
Conservation Lands Network 1.0 Progress Report | Chapter 5: Water Resources 48
The greatest percentage of both recharge and runoff occur on lands that are protected (28% and 31%, respectively) and lands that fall within the Conservation Lands Network (23% and 29%, respectively). This is a correlation between upland habitats and healthy watersheds that illuminates the multiple benefits of strategically protecting 2 million acres of habitat and rare landscapes.
With regard to progress, since 2010, the additional 100,000 acres of protected lands provide about 80,000 acre-feet of recharge and about 86,000 ac-ft of runoff. These are significant increases in the Bay Area’s overall capacity to efficiently and effectively retain precious water resources necessary for fish species and stream flows, as well as for groundwater recharge levels.
Protecting landscapes that have both habitat and rare landscape value as well as high functions of recharge and runoff provides multiple land conservation benefits. The effective conservation of riparian ecosystems requires the entire hydrologic continuum be considered for conservation and restoration, and thus a comprehensive watershed approach is favorable to restoration focused solely on in-channel fixes. In short isolated restoration projects or acquisitions made without context are not as successful as those efforts that address the entire watershed—including the basin, riparian corridor, and floodplain—and by thinking big and connecting more.
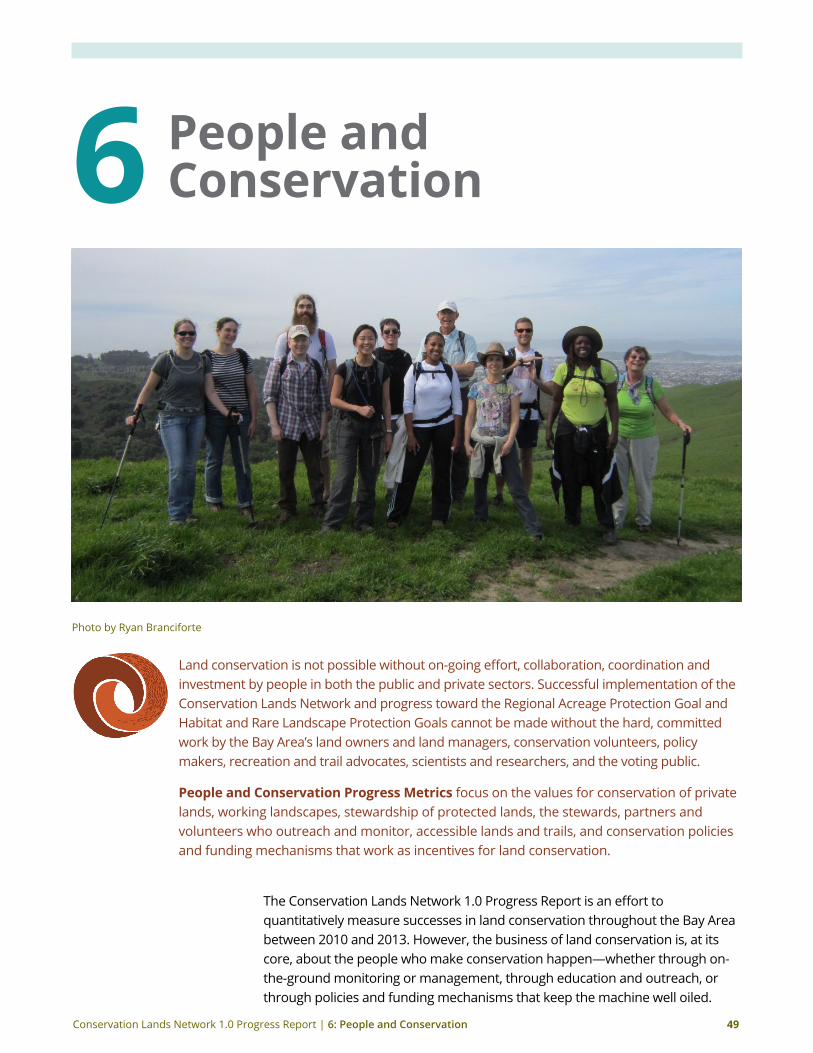
Conservation Lands Network 1.0 Progress Report | 6: People and Conservation 49
6 People and Conservation
Photo by Ryan Branciforte
Land conservation is not possible without on-going effort, collaboration, coordination and investment by people in both the public and private sectors. Successful implementation of the Conservation Lands Network and progress toward the Regional Acreage Protection Goal and Habitat and Rare Landscape Protection Goals cannot be made without the hard, committed work by the Bay Area’s land owners and land managers, conservation volunteers, policy makers, recreation and trail advocates, scientists and researchers, and the voting public.
People and Conservation Progress Metrics focus on the values for conservation of private lands, working landscapes, stewardship of protected lands, the stewards, partners and volunteers who outreach and monitor, accessible lands and trails, and conservation policies and funding mechanisms that work as incentives for land conservation.
The Conservation Lands Network 1.0 Progress Report is an effort to quantitatively measure successes in land conservation throughout the Bay Area between 2010 and 2013. However, the business of land conservation is, at its core, about the people who make conservation happen—whether through on-the-ground monitoring or management, through education and outreach, or through policies and funding mechanisms that keep the machine well oiled.
Conservation Lands Network 1.0 Progress Report | 6: People and Conservation 50
The valuable people and partnerships that make land conservation in the Bay Area so successful were highlighted in the CLN 1.0 report as important implementers of the CLN goals. All the data, mapping and planning for land conservation is superfluous without the people who care for the land and work to protect the benefits it gives back to us all. The Open Space Council is “thinking big and connecting more” in our efforts to expand the audience for land conservation and connect our shared values of quality of life to taking action toward helping protect more land.
Conservation of private and working landsThe Conservation Lands Network is composed of both public and private lands. Working lands support habitat and biodiversity and are an important component of the CLN. It is essential to work to keep these lands in production.
The sale of conservation easements by range and forestland owners can ensure operational viability while the lands continue to support invaluable habitat and provide landscape functions and services. Other voluntary programs offer technical and financial resource assistance to improve the health of private lands. Supporting and expanding programs offered by the Natural Resources Conservation Service, US Fish and Wildlife Service, CAL FIRE, and the California Department of Fish and Game—as well as property tax relief programs like the Williamson Act—are vital tools for regional land conservation success.
Currently 1.37 million acres are protected in the Bay Area, of which nearly a quarter of a million acres are protected through conservation or agricultural easement. Indeed, private lands are central and private landowners are critical partners to protecting the remaining 600,000 acres necessary to reach the Conservation Lands Network goal of strategically protecting 2 million acres throughout the Bay Area.
rangelandsAs of 2012, the California Rangeland Trust (CRT) has estimated that the Bay Area has 1.9 million acres of rangelands, of which approximately 500,000 acres are protected in fee or through conservation easement. Progress of protected rangeland can be measured upon the anticipated release of the Bay Area Rangeland Map update.
In addition to the 500,000 acres of rangeland protected, another 850,000 acres of rangeland are within the Conservation Lands Network. As such, ranchers and the lands, watersheds, habitats and soils they manage are a critical component of implementing the Conservation Lands Network—and for maintaining the visual identity of the Bay Area. As one drives on Interstate 80 from San Francisco toward Sacramento, most of what is seen on the rolling hillsides is rangeland. Similarly to the north and south: the landscapes that so many find beautiful in the Bay Area are grass, oak woodlands, and shrublands that are grazed.
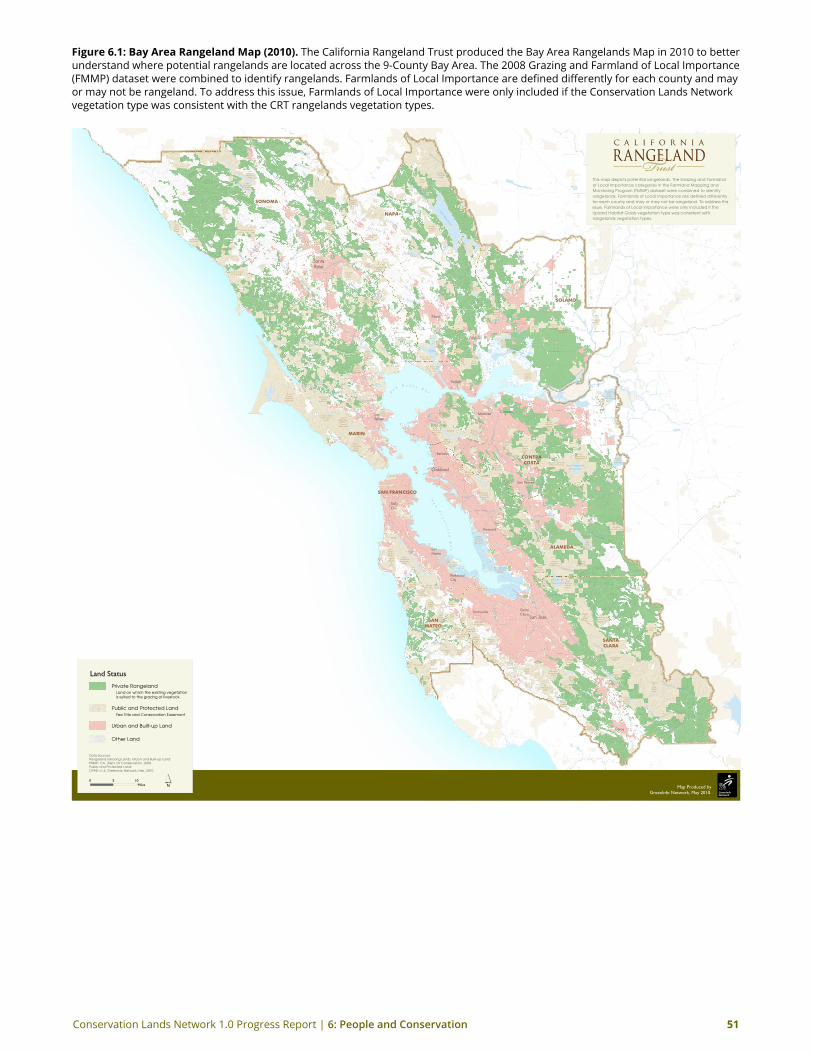
Conservation Lands Network 1.0 Progress Report | 6: People and Conservation 51
Figure 6.1: Bay Area rangeland Map (2010). The California Rangeland Trust produced the Bay Area Rangelands Map in 2010 to better understand where potential rangelands are located across the 9-County Bay Area. The 2008 Grazing and Farmland of Local Importance (FMMP) dataset were combined to identify rangelands. Farmlands of Local Importance are defined differently for each county and may or may not be rangeland. To address this issue, Farmlands of Local Importance were only included if the Conservation Lands Network vegetation type was consistent with the CRT rangelands vegetation types.
Gilroy
San Jose
SantaClara
Sunnyvale
DalyCity
SanMateo
RedwoodCity
Hayward
San Ramon
Oakland
Berkeley
ConcordMartinez
Fairfield
Vallejo
Napa
SanRafael
SantaRosa
YubaCity
Lakeport
Sa
n
Fr
an
ci
sc
o
Ba
y
Fe
ath
er
Riv
er
ClearLake
Napa River
Lake Berryessa
R ussi
an R
Sacramento R
Russian R
Los G
atos Cr
Dry Cr
Conn Cr
Arro y o Valle
Es
tero De San Antonio
Can ad a De Los Osos
Gre en Valley Cr
Fairfax Cr
San Leandro Cr
L aguna De Santa Rosa
Estero A mericano
Sage Cr
N icasio Cr
Matanzas Cr
Wal
n ut C
r
San Gregorio Cr
Union Cr
Maa
ca ma Cr
Guadalupe R
San Loren zo Cr
Pach e co Cr, N Fk
Lo
bi tos C
r
Mill
ik
en Cr
Warm Springs
P ilarci
t os C
r
Arroyo Leon
Maxwell Cr
Dee r Cr
Arroyo Hondo
Purisi m
a
Cr
San Pablo Cr
Halleck Cr
Berr y essa Cr
Salmon Cr
Los G
atos C
r
Chi leno Cr
Colorado Cr
San Anto n io Cr
Cap
ell Cr
Cherry Cr
Le dgew
ood Cr
Laurel Cr
Thompson Cr
Pach
e co
Cr
Sinbad Cr
San Ramon Cr
Br ushy Cr
L it t le
Sulphur CrSausal C
r Hunting Cr
Adob
e Cr
Ma rsh Cr
Novato Cr
Moore Cr
L a gunitas Cr
Redw ood Cr
Tolay Cr
M il ler Cr
Sa n Felipe Cr
Carneros Cr
Crow C
r
Alam
o
Cr
Conn Cr
Big Su lphur Cr
Petaluma R
Russ
ian R
Ar royo Seco
Arroyo Valle
Sacra
mento R
Eticuera Cr
Ste ve ns Cr
P ope Cr
Tass
a jar
a C
r
Franz Cr
Walker Cr
But
ano Cr
U vas Cr
Pescadero Cr
Isabel Cr
Sand Cr
Llagas Cr
M i l l Cr
Santa Rosa Cr
Smith Cr
Suisun Cr
Mar
k W
est Cr
San Joaqui n R
Austin Cr
Sonoma Cr
Vlati s Cr
Arroyo Mocho
Co yote Cr
Old R
A lameda Cr
Napa R
Sa
n P a b l o B a y
Los VaquerosReservoir
CalaverasReservoir
-̄ 1]
%P
1k
-¬
-²
I}
%R
-y
I}
0O
%V
%L
-÷
-ø
-¼
SONOMA
NAPA
SANTACLARA
SOLANO
MARIN
ALAMEDA
CONTRACOSTA
SANMATEO
SAN FRANCISCO
PointRe y es
Na ti on alSea sh ore
SanFran c is c o
Wat erDi s tr i ct
Co wel l Ra nc h SP
Ca rq uine zStra it
Re gion alPark
Tr av i s A i r Fo r c e Ba s e
Ce da rRo ug hsACEC
Bot he- Nap aVal le y
Sta te Par k
BLM Lan ds
Ja ck L on do nSta te Par k
Na pa -So no maMa rsh es
GG NRA
Ro be rtLou i s
Ste ve ns onSta tePark
She llRidg eRe c .Area
Ra nc h oCo ra l
deTie rra
Mt.Burd el lOp enSpa ce
Pres er ve
Dr y C ree kPio ne er
Re gl . Par k
Bol in asLag oo n
Up pe rSte ve ns
Cr ee kPark
AnoNu ev oSta tePark
Re dwo odRe gion al
Park
LaHo nd aCr ee kOSP
Ca lh ou n CutEco lo gi c al
Re s erv e
Ind ia nVal le yOp enSpa ce
Ra nc h oCa na dadel O ro
OSP
Ple as an to nRidg e
Re gion alPark
Ja sp erRidg e
Re s erv e
SanPed roVal le yPark
S ie rraAzu lOSP
Go ld en G at e Par k
Na pa -So no maMa rsh es
Gri z zl yIs la nd
Wildl if eArea
Burl ei ghMu rrayRa nc h
BolsaPoint
Farm s
Pet alum aMa rsh
Wildl if eArea
Sky l in e R idg eOp en Sp ac e
Je ps onPrai r i e
Pres er ve
Pep pe rwoo dRa nc hNa tu ral
Pres er ve
ElSere no
OSP
BigRo c k
Ra nc h
Fort Ro ssSta te Par k
Ch in aCa mpSta tePark
Miss ionPea k
Re gion alPres er ve
Ste ve nsCr ee k
Bay la nd sPres er ve
Wildc atCa ny o n
Re gion alPark
Ra nc h oSan An ton io
OSP
Sam ue l P .Tay lor
Sta te Par k
LasTram p asRe gion al
Wil de rn es s
Ca rn eg ieSta te Rec . Area
Ed.R.
Lev inPark
Win dyHi l l
OSP
Uv a sCa ny o n
Ru s sianRidg eOSP
Ly nc hCa ny o n
Serp asRa nc h
Til de nRe gion al
Park
Ho odMo un tain
San taTere s a
Park
Ca s ca deRa nc h SP
Nic as ioRe s erv oi r
Bai r I sl an dEco lo gi c al
Re s erv e
Ru s hRa nc hOp enSpa ce
Bla ckDiam o nd
Mine sRe gion alRe s erv e
Cl i fto nCo ur t
Fore ba y
Foo th il lsPark
Puri s im aCr ee k
Op en Sp ac e
Mo rga n Ter r it oryRe gl . Pre se rv e
San bo rn-
Sky l in ePark
Li ckOb se rv at ory
UCSC
Son om a Co as tSta te Bea c h
Kin gRa nc h
Mt.Um un hu m
Area
Sug arl oa fRidg e
Sta te Par k
Port ol aSta tePark
San Pa blo BayNa tl . W il d li fe
Re fu ge
Alm ad enQu ic k si lv e r
ParkCa le roCo un ty
Park
Aus ti n C ree kSta te Rec . Area
De lVal le
Re gion alPark
Ant hon yCh ab ot
Re gion alPark
But anoSta tePark
Lak eSon om aWildl if e
Area
Lon gRidg eOSP
Go ld en G at eNa tl . Rec . Area
Lak eSon om a
Re c rea ti onArea
And ers onLak e
Mo un tTam alpa is
Sta tePark
Sal tPointSta tePark
Pres idi o
Pes ca de roCr ee kPark
Mo un tMa do nn a
Ann ad elSta tePark
Brio ne sRe gion al
Park
Sun olRe gion al
Wil de rn es s
Ca na daDe L os O s os
Eco lo gi c alRe s erv e
Fran k 'sTrac tSta te
Re c . Ar ea
Wil c oxRa nc h
Oh lo neRe gion al
Wil de rn es s
Pros pe c tIs la nd
Go ld en G at eNa tl . Rec .
Area
San Fe li peRa nc h
Co y oteLak e
Co un tyPark
Jo se phD.
Gra ntPark
Ma rinMu ni ci pa l
Wat erDi s tr i ct
Wat ers he d
SanFran c is c o
Wat erDi s tr i ct
Do n Edwa rd sNt l. W i l dl if e
Re fu ge
Clov e rda le
BLM
EBMUD
LosVaq ue ros
Wat ers he d
SanFran c is c oWat ers he d
Lan ds
Mo un tDiab loSta tePark
EBMUD
He nr yW.
Co eSta tePark
Shi lo hRa nc h
Kno xv il l eWil dl if e
Area
Ede nLan din g
Eco lo gi c alRe s erv e
Mo nte Be l loOp en Sp ac e
San An ton ioVal le y
Lak eCu rry
BLM
THE CONSERVATION LANDS NETWORKTHE CONSERVATION LANDS NETWORK
Map Produced byGreenInfo Network, May 2010.
Bay Area Rangelands
Land Status
´0 5 10Miles
Data Sources: Rangeland (Grazing Land), Urban and Built-up Land:FMMP, CA. Dept. Of Conservation, 2008. Public and Protected Land:CPAD v1.4, GreenInfo Network, Feb. 2010.
Public and Protected LandFee Title and Conservation Easement
Other Land
Urban and Built-up Land
Private RangelandLand on which the existing vegetationis suited to the grazing of livestock.
This map depicts potential rangelands. The Grazing and Farmlandof Local Importance categories in the Farmland Mapping andMonitoring Program (FMMP) dataset were combined to identifyrangelands. Farmlands of Local Importance are defined differentlyfor each county and may or may not be rangeland. To address this issue, Farmlands of Local Importance were only included if the Upland Habitat Goals vegetation type was consistent withrangelands vegetation types.
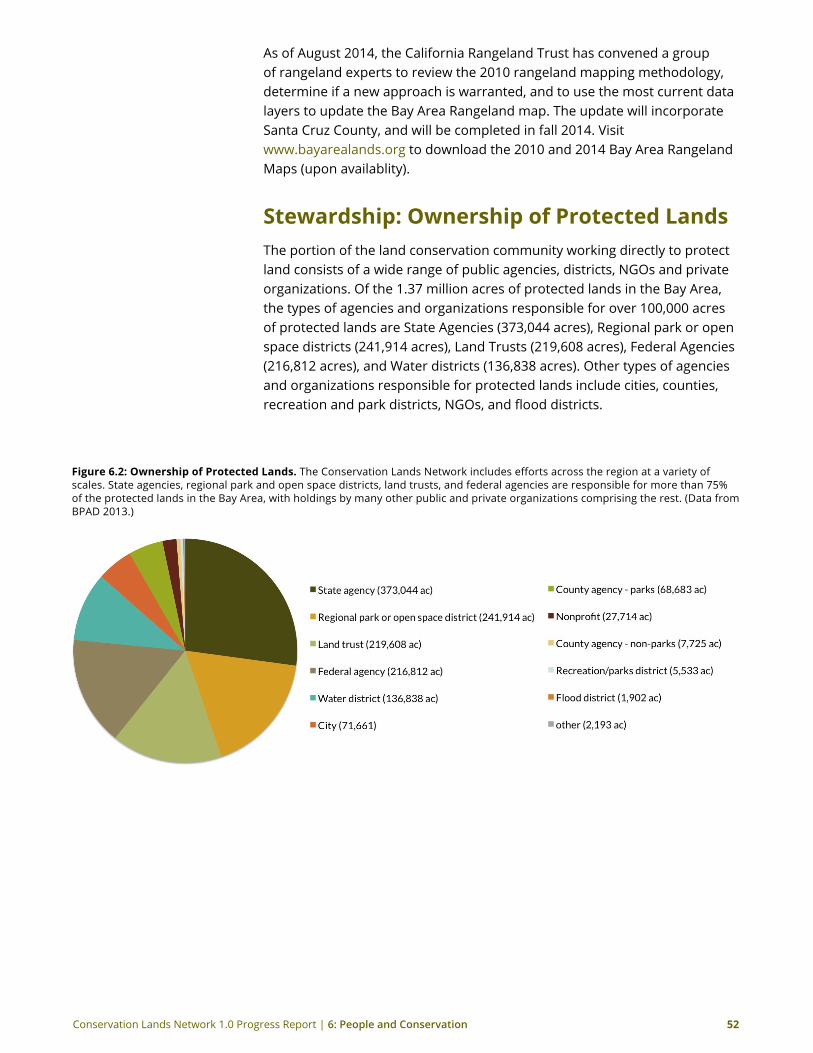
Conservation Lands Network 1.0 Progress Report | 6: People and Conservation 52
As of August 2014, the California Rangeland Trust has convened a group of rangeland experts to review the 2010 rangeland mapping methodology, determine if a new approach is warranted, and to use the most current data layers to update the Bay Area Rangeland map. The update will incorporate Santa Cruz County, and will be completed in fall 2014. Visit www.bayarealands.org to download the 2010 and 2014 Bay Area Rangeland Maps (upon availablity).
stewardship: ownership of Protected LandsThe portion of the land conservation community working directly to protect land consists of a wide range of public agencies, districts, NGOs and private organizations. Of the 1.37 million acres of protected lands in the Bay Area, the types of agencies and organizations responsible for over 100,000 acres of protected lands are State Agencies (373,044 acres), Regional park or open space districts (241,914 acres), Land Trusts (219,608 acres), Federal Agencies (216,812 acres), and Water districts (136,838 acres). Other types of agencies and organizations responsible for protected lands include cities, counties, recreation and park districts, NGOs, and flood districts.
Figure 6.2: ownership of Protected Lands. The Conservation Lands Network includes efforts across the region at a variety of scales. State agencies, regional park and open space districts, land trusts, and federal agencies are responsible for more than 75% of the protected lands in the Bay Area, with holdings by many other public and private organizations comprising the rest. (Data from BPAD 2013.)
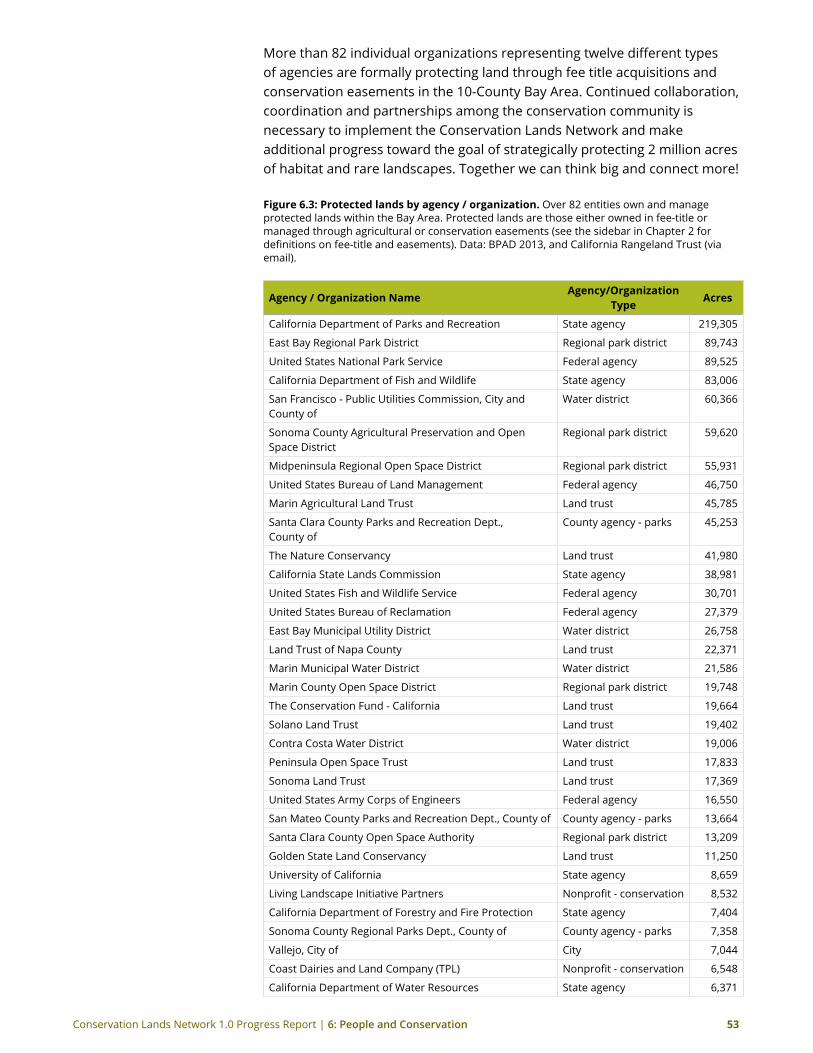
Conservation Lands Network 1.0 Progress Report | 6: People and Conservation 53
More than 82 individual organizations representing twelve different types of agencies are formally protecting land through fee title acquisitions and conservation easements in the 10-County Bay Area. Continued collaboration, coordination and partnerships among the conservation community is necessary to implement the Conservation Lands Network and make additional progress toward the goal of strategically protecting 2 million acres of habitat and rare landscapes. Together we can think big and connect more!
Figure 6.3: Protected lands by agency / organization. Over 82 entities own and manage protected lands within the Bay Area. Protected lands are those either owned in fee-title or managed through agricultural or conservation easements (see the sidebar in Chapter 2 for definitions on fee-title and easements). Data: BPAD 2013, and California Rangeland Trust (via email).
Agency / organization NameAgency/organization
Type Acres
California Department of Parks and Recreation State agency 219,305
East Bay Regional Park District Regional park district 89,743
United States National Park Service Federal agency 89,525
California Department of Fish and Wildlife State agency 83,006
San Francisco - Public Utilities Commission, City and County of
Water district 60,366
Sonoma County Agricultural Preservation and Open Space District
Regional park district 59,620
Midpeninsula Regional Open Space District Regional park district 55,931
United States Bureau of Land Management Federal agency 46,750
Marin Agricultural Land Trust Land trust 45,785
Santa Clara County Parks and Recreation Dept., County of
County agency - parks 45,253
The Nature Conservancy Land trust 41,980
California State Lands Commission State agency 38,981
United States Fish and Wildlife Service Federal agency 30,701
United States Bureau of Reclamation Federal agency 27,379
East Bay Municipal Utility District Water district 26,758
Land Trust of Napa County Land trust 22,371
Marin Municipal Water District Water district 21,586
Marin County Open Space District Regional park district 19,748
The Conservation Fund - California Land trust 19,664
Solano Land Trust Land trust 19,402
Contra Costa Water District Water district 19,006
Peninsula Open Space Trust Land trust 17,833
Sonoma Land Trust Land trust 17,369
United States Army Corps of Engineers Federal agency 16,550
San Mateo County Parks and Recreation Dept., County of County agency - parks 13,664
Santa Clara County Open Space Authority Regional park district 13,209
Golden State Land Conservancy Land trust 11,250
University of California State agency 8,659
Living Landscape Initiative Partners Nonprofit - conservation 8,532
California Department of Forestry and Fire Protection State agency 7,404
Sonoma County Regional Parks Dept., County of County agency - parks 7,358
Vallejo, City of City 7,044
Coast Dairies and Land Company (TPL) Nonprofit - conservation 6,548
California Department of Water Resources State agency 6,371
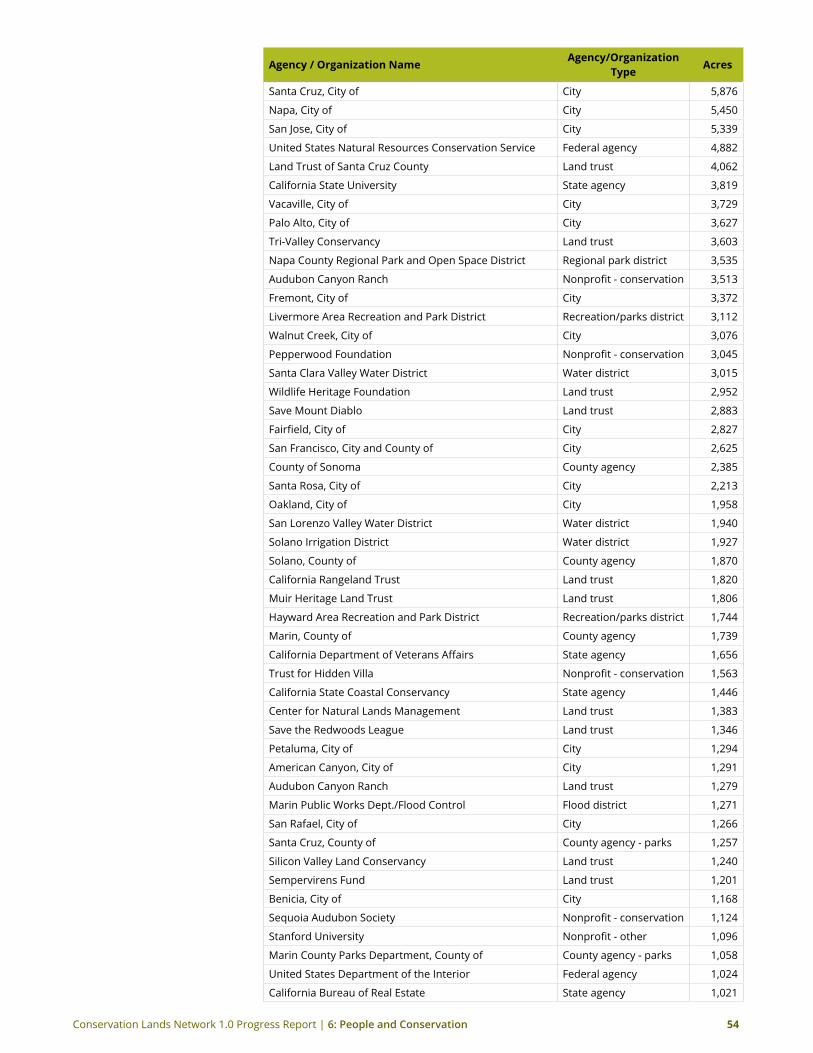
Conservation Lands Network 1.0 Progress Report | 6: People and Conservation 54
Agency / organization NameAgency/organization
Type Acres
Santa Cruz, City of City 5,876
Napa, City of City 5,450
San Jose, City of City 5,339
United States Natural Resources Conservation Service Federal agency 4,882
Land Trust of Santa Cruz County Land trust 4,062
California State University State agency 3,819
Vacaville, City of City 3,729
Palo Alto, City of City 3,627
Tri-Valley Conservancy Land trust 3,603
Napa County Regional Park and Open Space District Regional park district 3,535
Audubon Canyon Ranch Nonprofit - conservation 3,513
Fremont, City of City 3,372
Livermore Area Recreation and Park District Recreation/parks district 3,112
Walnut Creek, City of City 3,076
Pepperwood Foundation Nonprofit - conservation 3,045
Santa Clara Valley Water District Water district 3,015
Wildlife Heritage Foundation Land trust 2,952
Save Mount Diablo Land trust 2,883
Fairfield, City of City 2,827
San Francisco, City and County of City 2,625
County of Sonoma County agency 2,385
Santa Rosa, City of City 2,213
Oakland, City of City 1,958
San Lorenzo Valley Water District Water district 1,940
Solano Irrigation District Water district 1,927
Solano, County of County agency 1,870
California Rangeland Trust Land trust 1,820
Muir Heritage Land Trust Land trust 1,806
Hayward Area Recreation and Park District Recreation/parks district 1,744
Marin, County of County agency 1,739
California Department of Veterans Affairs State agency 1,656
Trust for Hidden Villa Nonprofit - conservation 1,563
California State Coastal Conservancy State agency 1,446
Center for Natural Lands Management Land trust 1,383
Save the Redwoods League Land trust 1,346
Petaluma, City of City 1,294
American Canyon, City of City 1,291
Audubon Canyon Ranch Land trust 1,279
Marin Public Works Dept./Flood Control Flood district 1,271
San Rafael, City of City 1,266
Santa Cruz, County of County agency - parks 1,257
Silicon Valley Land Conservancy Land trust 1,240
Sempervirens Fund Land trust 1,201
Benicia, City of City 1,168
Sequoia Audubon Society Nonprofit - conservation 1,124
Stanford University Nonprofit - other 1,096
Marin County Parks Department, County of County agency - parks 1,058
United States Department of the Interior Federal agency 1,024
California Bureau of Real Estate State agency 1,021
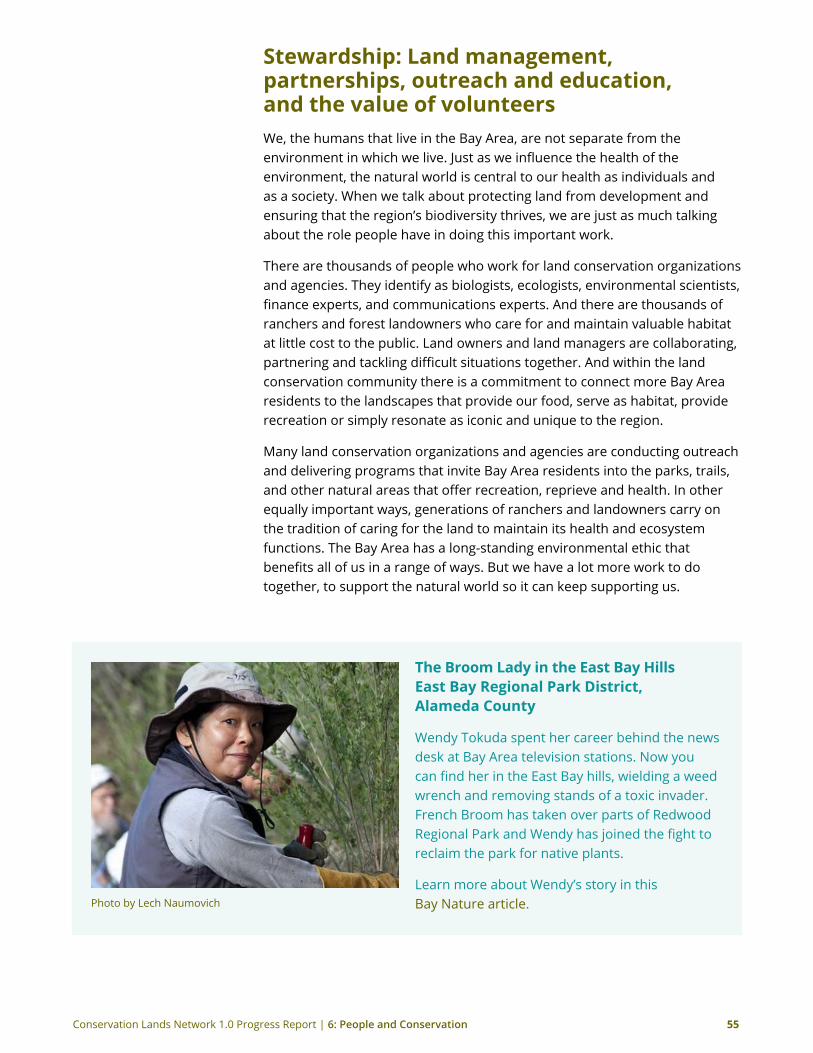
Conservation Lands Network 1.0 Progress Report | 6: People and Conservation 55
stewardship: Land management, partnerships, outreach and education, and the value of volunteersWe, the humans that live in the Bay Area, are not separate from the environment in which we live. Just as we influence the health of the environment, the natural world is central to our health as individuals and as a society. When we talk about protecting land from development and ensuring that the region’s biodiversity thrives, we are just as much talking about the role people have in doing this important work.
There are thousands of people who work for land conservation organizations and agencies. They identify as biologists, ecologists, environmental scientists, finance experts, and communications experts. And there are thousands of ranchers and forest landowners who care for and maintain valuable habitat at little cost to the public. Land owners and land managers are collaborating, partnering and tackling difficult situations together. And within the land conservation community there is a commitment to connect more Bay Area residents to the landscapes that provide our food, serve as habitat, provide recreation or simply resonate as iconic and unique to the region.
Many land conservation organizations and agencies are conducting outreach and delivering programs that invite Bay Area residents into the parks, trails, and other natural areas that offer recreation, reprieve and health. In other equally important ways, generations of ranchers and landowners carry on the tradition of caring for the land to maintain its health and ecosystem functions. The Bay Area has a long-standing environmental ethic that benefits all of us in a range of ways. But we have a lot more work to do together, to support the natural world so it can keep supporting us.
Photo by Lech Naumovich
The Broom Lady in the east Bay Hills east Bay regional Park District, Alameda County
Wendy Tokuda spent her career behind the news desk at Bay Area television stations. Now you can find her in the East Bay hills, wielding a weed wrench and removing stands of a toxic invader. French Broom has taken over parts of Redwood Regional Park and Wendy has joined the fight to reclaim the park for native plants.
Learn more about Wendy’s story in this Bay Nature article.
Conservation Lands Network 1.0 Progress Report | 6: People and Conservation 56
Land Management—for the long run
Caring for the land after it is protected is the long-term commitment implicit in any land conservation success story. But it is often the forgotten part of the story because maintenance does not make headlines. Land conservation is not solely about protecting 2 million acres of habitat and rare landscapes, but about ensuring those protected lands remain healthy and can keep providing the Bay Area with the high quality of life it is known for.
Aldo Leopold reminds us that “when we see land as a community to which we belong, we may begin to use it with love and respect” (Leopold 1949). Land lovers, managers and stewards are diverse because stewardship is a multi-faceted, ever changing commitment. Stewardship is the combination of direct management in response to ecosystem changes and the indirect work necessary to fund and staff the stewardship activities. Both efforts are critical to the Bay Area’s ability to successfully maintain the protected and healthy lands identified by the Conservation Lands Network.
A growing land conservation communityCollaborations and partnerships between multiple organizations exist at multiple levels and throughout the region. There is a culture of collaboration in the Bay Area that includes the sharing of information, resources, tasks, and successes. Examples of this growing community include:
• Collaborations: A book could be written on the number and achievements of collaborations throughout the Bay Area. Examples include the Living Landscape Initiative, Tamalpais Lands Collaborative, Bay Area Ridge Trail, San Francisco Bay Trail, and dozens of local partnerships between nonprofits and public agencies.
• Information sharing: The Conservation Lands Network datasets have been downloaded almost 700 times since 2011. The Bay Area Protected Areas Database has been downloaded almost 800 times. The data being created at the regional level by the Bay Area Open Space Council and GreenInfo Network are being used at the local level.
• Working groups: The Open Space Council has facilitated working groups over the years that bring together nonprofit and public agency leaders on a particular topic. These working groups have focused on land stewardship, transportation, and communications.
• open space Council gatherings and Conference: every year over 800 people gather to share best practices, network with colleagues, get ideas, and find inspiration. These events provide a venue to build relationships and launch projects.
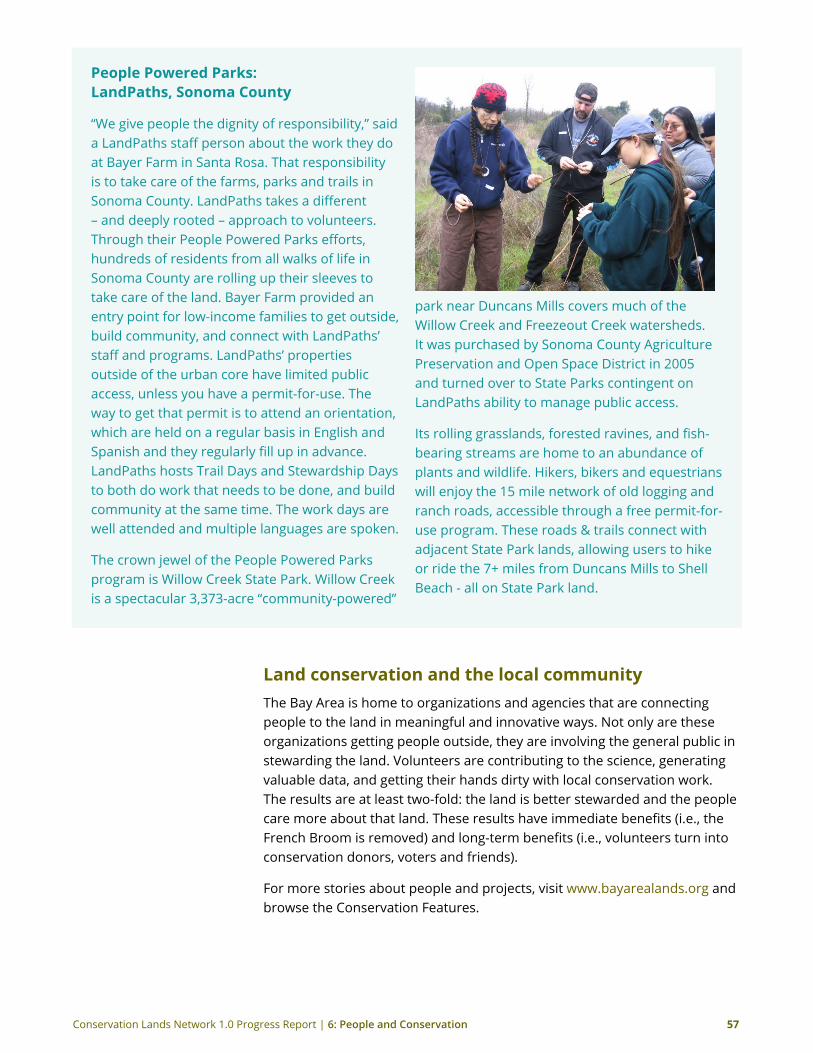
Conservation Lands Network 1.0 Progress Report | 6: People and Conservation 57
People Powered Parks: LandPaths, sonoma County
“We give people the dignity of responsibility,” said a LandPaths staff person about the work they do at Bayer Farm in Santa Rosa. That responsibility is to take care of the farms, parks and trails in Sonoma County. LandPaths takes a different – and deeply rooted – approach to volunteers. Through their People Powered Parks efforts, hundreds of residents from all walks of life in Sonoma County are rolling up their sleeves to take care of the land. Bayer Farm provided an entry point for low-income families to get outside, build community, and connect with LandPaths’ staff and programs. LandPaths’ properties outside of the urban core have limited public access, unless you have a permit-for-use. The way to get that permit is to attend an orientation, which are held on a regular basis in English and Spanish and they regularly fill up in advance. LandPaths hosts Trail Days and Stewardship Days to both do work that needs to be done, and build community at the same time. The work days are well attended and multiple languages are spoken.
The crown jewel of the People Powered Parks program is Willow Creek State Park. Willow Creek is a spectacular 3,373-acre “community-powered”
park near Duncans Mills covers much of the Willow Creek and Freezeout Creek watersheds. It was purchased by Sonoma County Agriculture Preservation and Open Space District in 2005 and turned over to State Parks contingent on LandPaths ability to manage public access.
Its rolling grasslands, forested ravines, and fish-bearing streams are home to an abundance of plants and wildlife. Hikers, bikers and equestrians will enjoy the 15 mile network of old logging and ranch roads, accessible through a free permit-for-use program. These roads & trails connect with adjacent State Park lands, allowing users to hike or ride the 7+ miles from Duncans Mills to Shell Beach - all on State Park land.
Land conservation and the local communityThe Bay Area is home to organizations and agencies that are connecting people to the land in meaningful and innovative ways. Not only are these organizations getting people outside, they are involving the general public in stewarding the land. Volunteers are contributing to the science, generating valuable data, and getting their hands dirty with local conservation work. The results are at least two-fold: the land is better stewarded and the people care more about that land. These results have immediate benefits (i.e., the French Broom is removed) and long-term benefits (i.e., volunteers turn into conservation donors, voters and friends).
For more stories about people and projects, visit www.bayarealands.org and browse the Conservation Features.
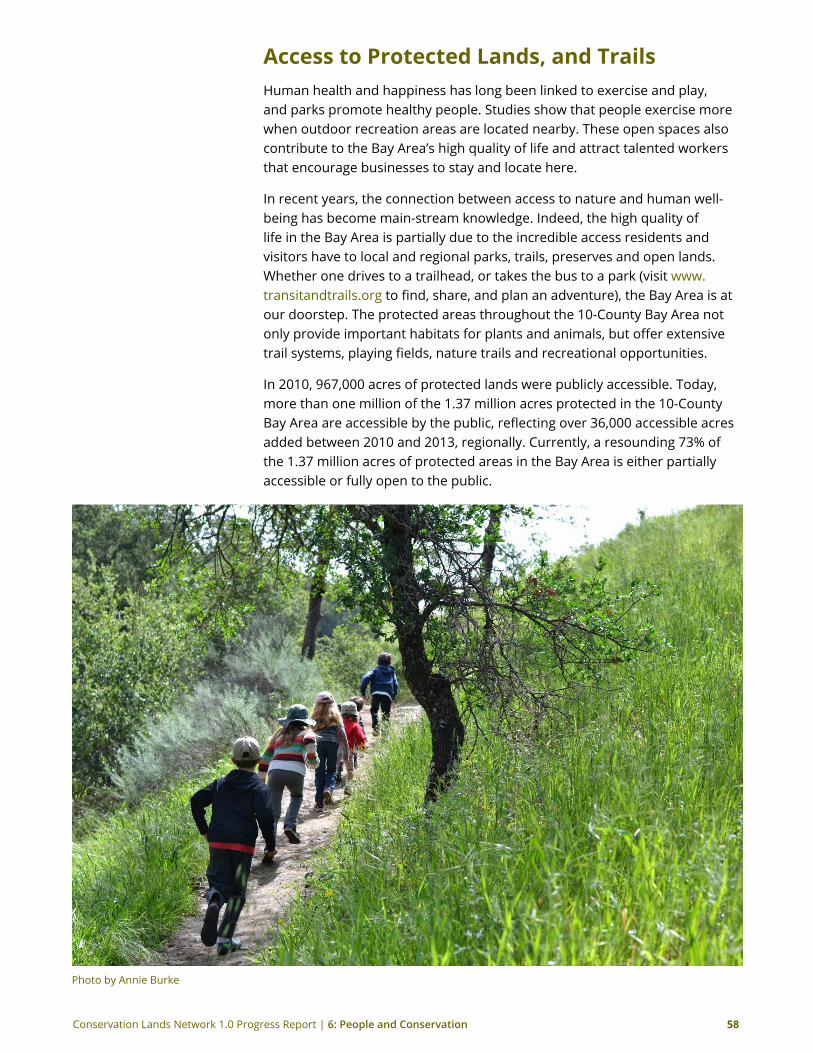
Conservation Lands Network 1.0 Progress Report | 6: People and Conservation 58
Access to Protected Lands, and TrailsHuman health and happiness has long been linked to exercise and play, and parks promote healthy people. Studies show that people exercise more when outdoor recreation areas are located nearby. These open spaces also contribute to the Bay Area’s high quality of life and attract talented workers that encourage businesses to stay and locate here.
In recent years, the connection between access to nature and human well-being has become main-stream knowledge. Indeed, the high quality of life in the Bay Area is partially due to the incredible access residents and visitors have to local and regional parks, trails, preserves and open lands. Whether one drives to a trailhead, or takes the bus to a park (visit www.transitandtrails.org to find, share, and plan an adventure), the Bay Area is at our doorstep. The protected areas throughout the 10-County Bay Area not only provide important habitats for plants and animals, but offer extensive trail systems, playing fields, nature trails and recreational opportunities.
In 2010, 967,000 acres of protected lands were publicly accessible. Today, more than one million of the 1.37 million acres protected in the 10-County Bay Area are accessible by the public, reflecting over 36,000 accessible acres added between 2010 and 2013, regionally. Currently, a resounding 73% of the 1.37 million acres of protected areas in the Bay Area is either partially accessible or fully open to the public.
Photo by Annie Burke
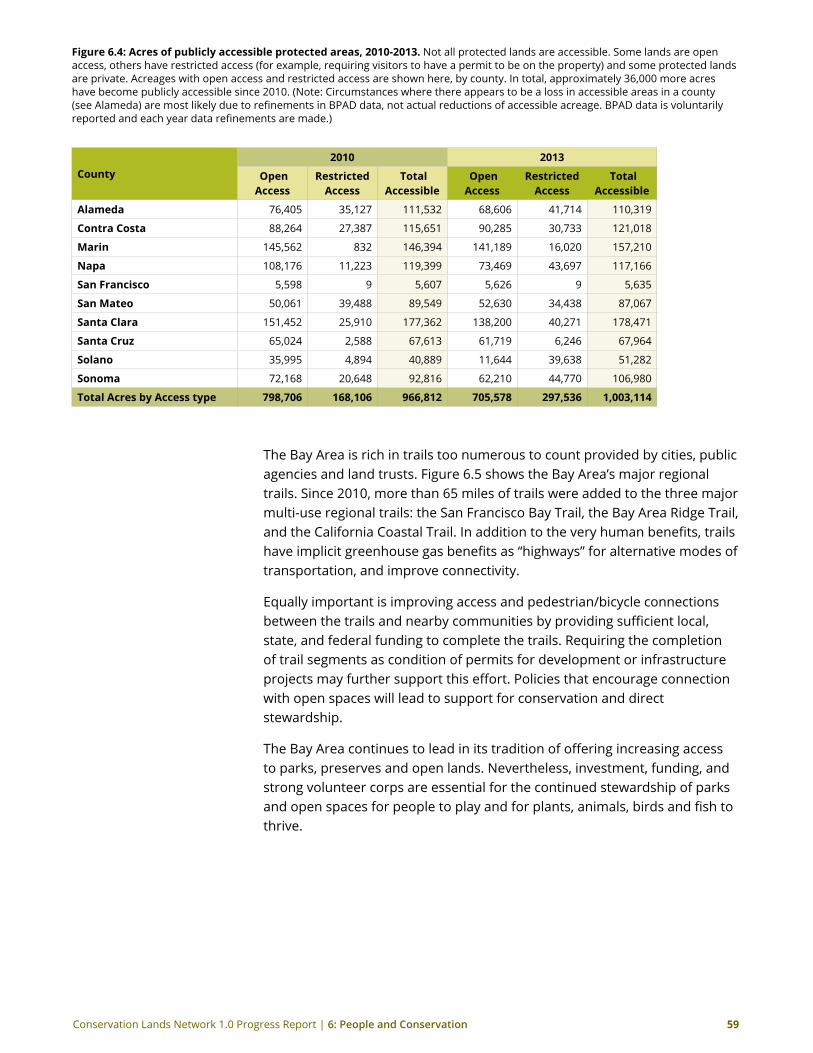
Conservation Lands Network 1.0 Progress Report | 6: People and Conservation 59
Figure 6.4: Acres of publicly accessible protected areas, 2010-2013. Not all protected lands are accessible. Some lands are open access, others have restricted access (for example, requiring visitors to have a permit to be on the property) and some protected lands are private. Acreages with open access and restricted access are shown here, by county. In total, approximately 36,000 more acres have become publicly accessible since 2010. (Note: Circumstances where there appears to be a loss in accessible areas in a county (see Alameda) are most likely due to refinements in BPAD data, not actual reductions of accessible acreage. BPAD data is voluntarily reported and each year data refinements are made.)
County 2010 2013
open Access
restricted Access
Total Accessible
open Access
restricted Access
Total Accessible
Alameda 76,405 35,127 111,532 68,606 41,714 110,319
Contra Costa 88,264 27,387 115,651 90,285 30,733 121,018
Marin 145,562 832 146,394 141,189 16,020 157,210
Napa 108,176 11,223 119,399 73,469 43,697 117,166
san Francisco 5,598 9 5,607 5,626 9 5,635
san Mateo 50,061 39,488 89,549 52,630 34,438 87,067
santa Clara 151,452 25,910 177,362 138,200 40,271 178,471
santa Cruz 65,024 2,588 67,613 61,719 6,246 67,964
solano 35,995 4,894 40,889 11,644 39,638 51,282
sonoma 72,168 20,648 92,816 62,210 44,770 106,980
Total Acres by Access type 798,706 168,106 966,812 705,578 297,536 1,003,114
The Bay Area is rich in trails too numerous to count provided by cities, public agencies and land trusts. Figure 6.5 shows the Bay Area’s major regional trails. Since 2010, more than 65 miles of trails were added to the three major multi-use regional trails: the San Francisco Bay Trail, the Bay Area Ridge Trail, and the California Coastal Trail. In addition to the very human benefits, trails have implicit greenhouse gas benefits as “highways” for alternative modes of transportation, and improve connectivity.
Equally important is improving access and pedestrian/bicycle connections between the trails and nearby communities by providing sufficient local, state, and federal funding to complete the trails. Requiring the completion of trail segments as condition of permits for development or infrastructure projects may further support this effort. Policies that encourage connection with open spaces will lead to support for conservation and direct stewardship.
The Bay Area continues to lead in its tradition of offering increasing access to parks, preserves and open lands. Nevertheless, investment, funding, and strong volunteer corps are essential for the continued stewardship of parks and open spaces for people to play and for plants, animals, birds and fish to thrive.
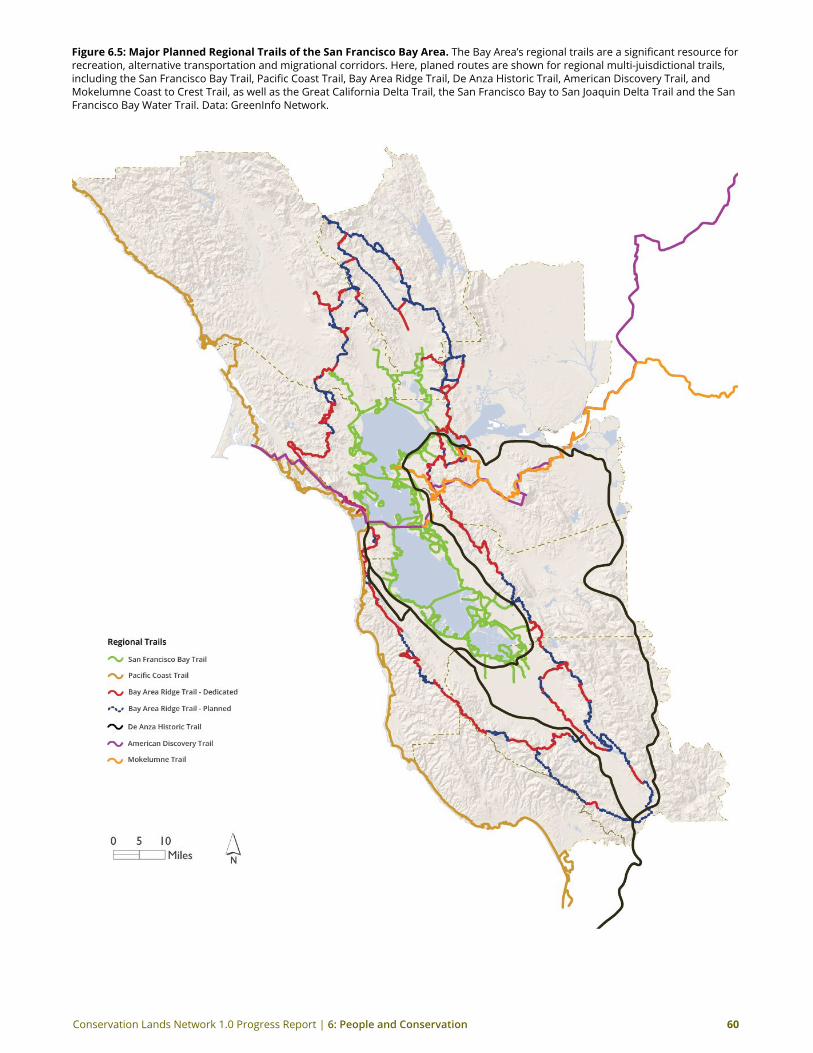
Conservation Lands Network 1.0 Progress Report | 6: People and Conservation 60
Figure 6.5: Major Planned regional Trails of the san Francisco Bay Area. The Bay Area’s regional trails are a significant resource for recreation, alternative transportation and migrational corridors. Here, planed routes are shown for regional multi-juisdictional trails, including the San Francisco Bay Trail, Pacific Coast Trail, Bay Area Ridge Trail, De Anza Historic Trail, American Discovery Trail, and Mokelumne Coast to Crest Trail, as well as the Great California Delta Trail, the San Francisco Bay to San Joaquin Delta Trail and the San Francisco Bay Water Trail. Data: GreenInfo Network.
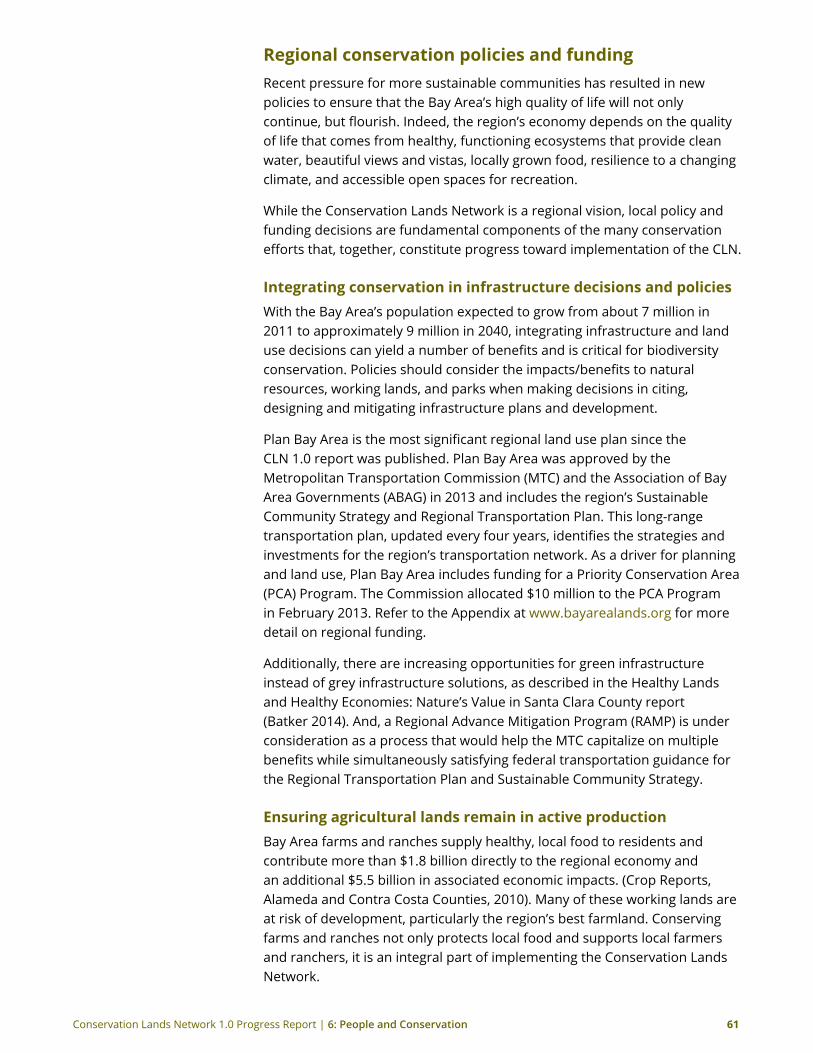
Conservation Lands Network 1.0 Progress Report | 6: People and Conservation 61
regional conservation policies and fundingRecent pressure for more sustainable communities has resulted in new policies to ensure that the Bay Area’s high quality of life will not only continue, but flourish. Indeed, the region’s economy depends on the quality of life that comes from healthy, functioning ecosystems that provide clean water, beautiful views and vistas, locally grown food, resilience to a changing climate, and accessible open spaces for recreation.
While the Conservation Lands Network is a regional vision, local policy and funding decisions are fundamental components of the many conservation efforts that, together, constitute progress toward implementation of the CLN.
Integrating conservation in infrastructure decisions and policiesWith the Bay Area’s population expected to grow from about 7 million in 2011 to approximately 9 million in 2040, integrating infrastructure and land use decisions can yield a number of benefits and is critical for biodiversity conservation. Policies should consider the impacts/benefits to natural resources, working lands, and parks when making decisions in citing, designing and mitigating infrastructure plans and development.
Plan Bay Area is the most significant regional land use plan since the CLN 1.0 report was published. Plan Bay Area was approved by the Metropolitan Transportation Commission (MTC) and the Association of Bay Area Governments (ABAG) in 2013 and includes the region’s Sustainable Community Strategy and Regional Transportation Plan. This long-range transportation plan, updated every four years, identifies the strategies and investments for the region’s transportation network. As a driver for planning and land use, Plan Bay Area includes funding for a Priority Conservation Area (PCA) Program. The Commission allocated $10 million to the PCA Program in February 2013. Refer to the Appendix at www.bayarealands.org for more detail on regional funding.
Additionally, there are increasing opportunities for green infrastructure instead of grey infrastructure solutions, as described in the Healthy Lands and Healthy Economies: Nature’s Value in Santa Clara County report (Batker 2014). And, a Regional Advance Mitigation Program (RAMP) is under consideration as a process that would help the MTC capitalize on multiple benefits while simultaneously satisfying federal transportation guidance for the Regional Transportation Plan and Sustainable Community Strategy.
ensuring agricultural lands remain in active productionBay Area farms and ranches supply healthy, local food to residents and contribute more than $1.8 billion directly to the regional economy and an additional $5.5 billion in associated economic impacts. (Crop Reports, Alameda and Contra Costa Counties, 2010). Many of these working lands are at risk of development, particularly the region’s best farmland. Conserving farms and ranches not only protects local food and supports local farmers and ranchers, it is an integral part of implementing the Conservation Lands Network.
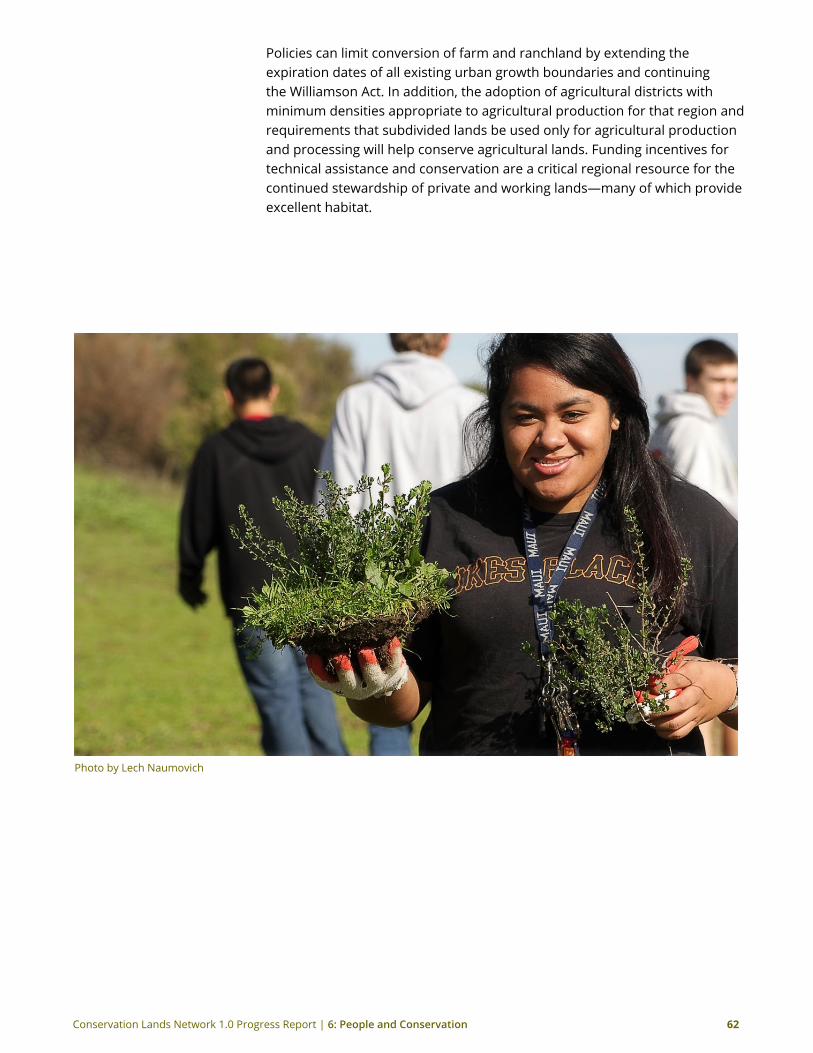
Conservation Lands Network 1.0 Progress Report | 6: People and Conservation 62
Policies can limit conversion of farm and ranchland by extending the expiration dates of all existing urban growth boundaries and continuing the Williamson Act. In addition, the adoption of agricultural districts with minimum densities appropriate to agricultural production for that region and requirements that subdivided lands be used only for agricultural production and processing will help conserve agricultural lands. Funding incentives for technical assistance and conservation are a critical regional resource for the continued stewardship of private and working lands—many of which provide excellent habitat.
Photo by Lech Naumovich
Conservation Lands Network 1.0 Progress Report | 6: People and Conservation 63
Funding —from a variety of sourcesSupport for work across the region has come from a variety of funders and has benefitted resources at a range of levels, from management of individual species to implementation of a broad habitat conservation plan.
Funding is central to the success of land conservation efforts. Indeed, all of the progress reported in the CLN 1.0 Progress Report has been achieved in great part by a range of funding sources including:
• Philanthropic donors and private foundations
• Local tax measures
• State bonds
• Regional sustainable communities funding
• Federal funding
• Individual donors
Funding from these sources is often used to purchase property outright for conservation values (fee title acquisition) or to purchase conservation easements. An alternative source of funding is mitigation requirements for public works and private development.
Specifically, funding from the San Francisco Bay Area Program of the Coastal Conservancy has been critical in the protection of land and water resources. During the progress report period, the Coastal Conservancy Bay Area program authorized approximately $25 million for habitat restoration, and public access around the nine Bay Area Counties. This investment has been more than doubled by matching funding for land acquisition, habitat restoration, climate change adaptation, and access trails and infrastructure.
safeguarding and restoring natural habitats Regional Habitat Conservation Plans (HCP) and Natural Community Conservation Plans establish a coordinated process for permitting and mitigating the incidental take of endangered species. The HCP process creates an alternative to the current project-by-project conservation approach. Regional HCPs in the Bay Area include the following:
• East Contra Costa County Habitat Conservation Plan (2000) http://www.co.contra-costa.ca.us/depart/cd/water/HCP
• Santa Clara Habitat Plan (2013) http://scv-habitatagency.org
• Solano County Habitat Conservation Plan (under development, 2014) http://www.scwa2.com/Conservation_Habitat_Info.aspx
• San Bruno Mountain Habitat Management Plan (2007; HCP in 1982) http://parks.smcgov.org/documents/san-bruno-mountain-habitat-conservation-plan-hcp
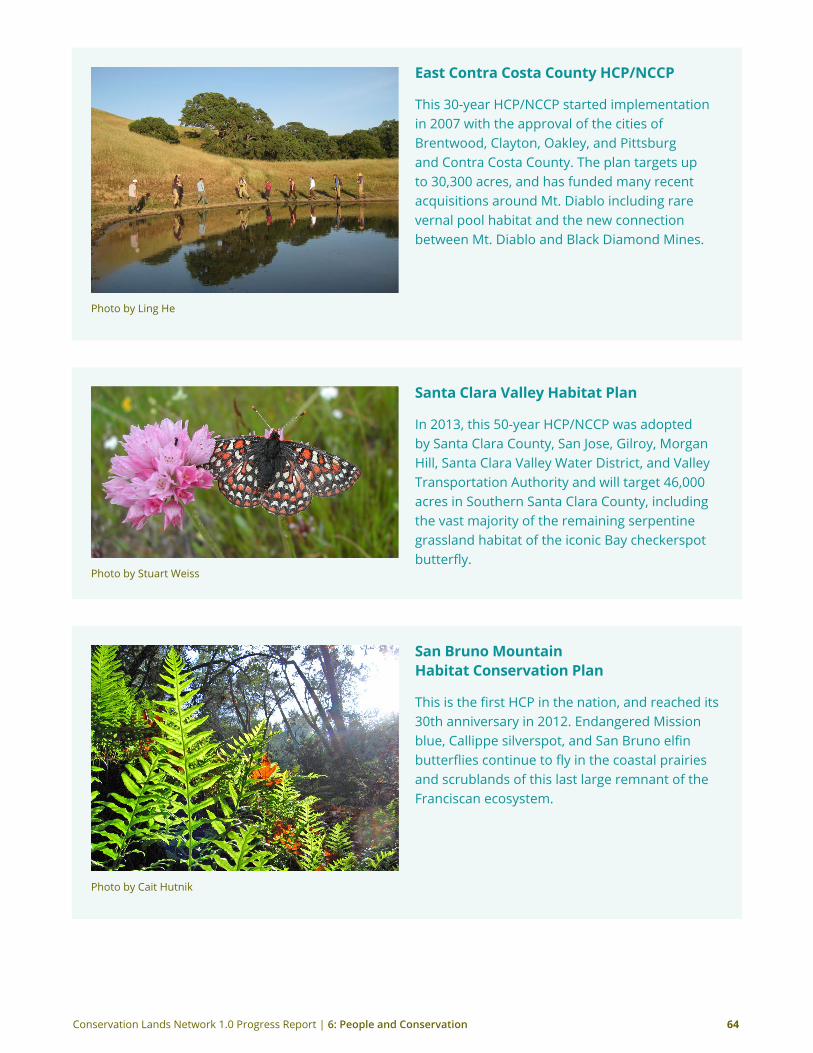
Conservation Lands Network 1.0 Progress Report | 6: People and Conservation 64
Photo by Ling He
east Contra Costa County HCP/NCCP
This 30-year HCP/NCCP started implementation in 2007 with the approval of the cities of Brentwood, Clayton, Oakley, and Pittsburg and Contra Costa County. The plan targets up to 30,300 acres, and has funded many recent acquisitions around Mt. Diablo including rare vernal pool habitat and the new connection between Mt. Diablo and Black Diamond Mines.
Photo by Stuart Weiss
santa Clara Valley Habitat Plan
In 2013, this 50-year HCP/NCCP was adopted by Santa Clara County, San Jose, Gilroy, Morgan Hill, Santa Clara Valley Water District, and Valley Transportation Authority and will target 46,000 acres in Southern Santa Clara County, including the vast majority of the remaining serpentine grassland habitat of the iconic Bay checkerspot butterfly.
Photo by Cait Hutnik
san Bruno Mountain Habitat Conservation Plan
This is the first HCP in the nation, and reached its 30th anniversary in 2012. Endangered Mission blue, Callippe silverspot, and San Bruno elfin butterflies continue to fly in the coastal prairies and scrublands of this last large remnant of the Franciscan ecosystem.
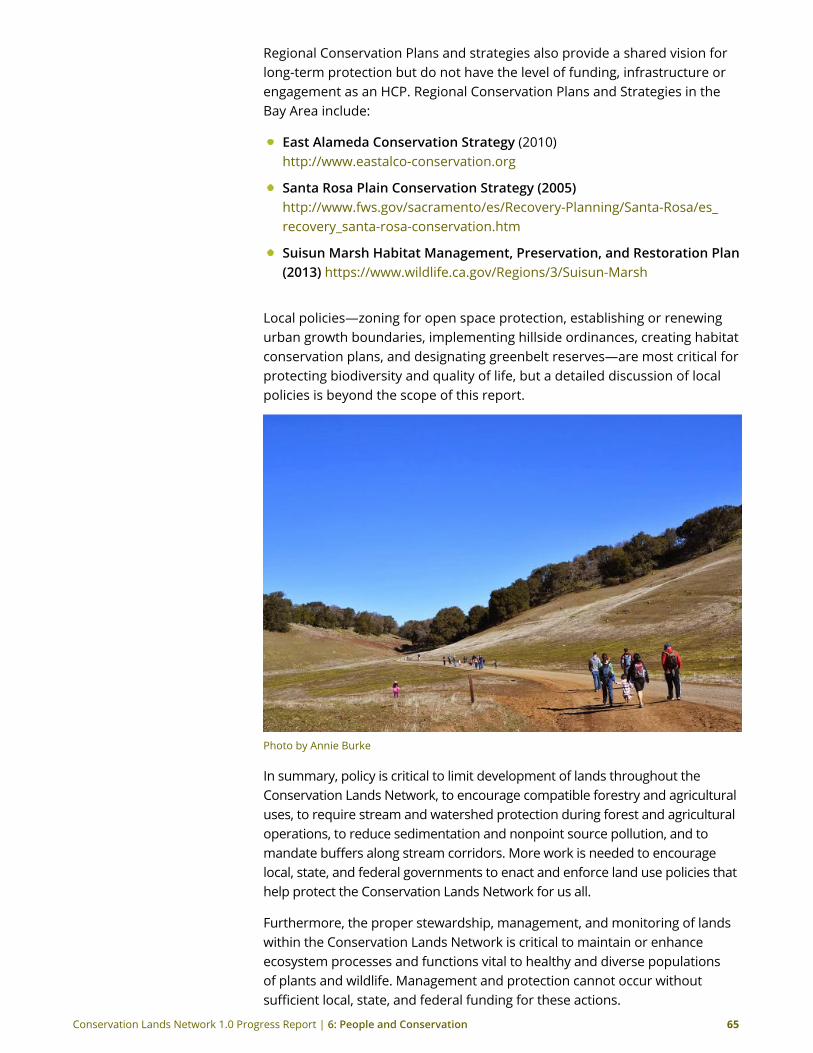
Conservation Lands Network 1.0 Progress Report | 6: People and Conservation 65
Regional Conservation Plans and strategies also provide a shared vision for long-term protection but do not have the level of funding, infrastructure or engagement as an HCP. Regional Conservation Plans and Strategies in the Bay Area include:
• East Alameda Conservation Strategy (2010) http://www.eastalco-conservation.org
• Santa Rosa Plain Conservation Strategy (2005) http://www.fws.gov/sacramento/es/Recovery-Planning/Santa-Rosa/es_recovery_santa-rosa-conservation.htm
• Suisun Marsh Habitat Management, Preservation, and Restoration Plan (2013) https://www.wildlife.ca.gov/Regions/3/Suisun-Marsh
Local policies—zoning for open space protection, establishing or renewing urban growth boundaries, implementing hillside ordinances, creating habitat conservation plans, and designating greenbelt reserves—are most critical for protecting biodiversity and quality of life, but a detailed discussion of local policies is beyond the scope of this report.
Photo by Annie Burke
In summary, policy is critical to limit development of lands throughout the Conservation Lands Network, to encourage compatible forestry and agricultural uses, to require stream and watershed protection during forest and agricultural operations, to reduce sedimentation and nonpoint source pollution, and to mandate buffers along stream corridors. More work is needed to encourage local, state, and federal governments to enact and enforce land use policies that help protect the Conservation Lands Network for us all.
Furthermore, the proper stewardship, management, and monitoring of lands within the Conservation Lands Network is critical to maintain or enhance ecosystem processes and functions vital to healthy and diverse populations of plants and wildlife. Management and protection cannot occur without sufficient local, state, and federal funding for these actions.

Conservation Lands Network 1.0 Progress Report | 7: Next Steps for the CLN 66
7 Next steps for the Conservation Lands Network
Photo by Stu Weiss
Collaborative Action: Implementation of the Conservation Lands NetworkProtection of lands comprising the Conservation Lands Network (see Figure 1.2) is a priority for meeting the regional conservation goal to collectively and strategically protect 2 million acres of Bay Area lands and rare landscapes. However, the business of land conservation is not as fast paced as selling a stock, or launching a new start-up business. Often, protection of a single property can take years of negotiation, relationships built on trust, and just the right alignment of priorities and goals. The lag time on conservation projects means that the network is inherently dynamic, as lands are protected, developed or converted in real time. Implementation of the Conservation Lands Network and making progress toward achieving our regional goal therefore also require a dynamic approach and continued investment.
Conservation Lands Network 1.0 Progress Report | 7: Next Steps for the CLN 67
Investment in protecting the lands inside the Conservation Lands Network is a priority, however lands outside the CLN may also have high conservation values. Surveys of a property of interest may reveal extraordinary biological resources not captured in the current CLN dataset. Therefore, ground-truthing is essential. Even the best available data is often inconsistent and incomplete; conservation decisions must include site visits and surveys.
Charting the Course for CLN ImplementationImplementing the CLN means continuing and expanding the extraordinary collaboration and coordination of conservation actions that have made the Bay Area a leader in open space protection. The CLN 1.0 Report lists steps that chart the course toward meeting the challenge of implementing the CLN:
1. Use the Conservation Lands Network as a guide.
2. Create incentives for landowners.
3. Support sound stewardship and adaptive management.
4. Save our streams.
5. Integrate the land conservation ethic into public policy.
6. Fund what works and create new funding sources.
7. Update and adapt: CLN 2.0
ongoing research Needs In addition to implementation, there are various research and data needs paramount to updating the CLN and measuring our collective progress toward reaching regional conservation goals. Outlined in more detail in Chapter 13 of the CLN 1.0 report, research needs include:
1. Up-to-date vegetation map
2. Species occurrence information
3. Historical baseline
4. Stewardship classification for the Bay Area Protected Areas Database (BPAD)
5. Site surveys and linkage analysis for the Areas for Further Consideration
6. Rangeland mapping
7. Rangeland sustainability indicators
8. Mapping of unpaved roads
9. Policy protection data layer
10. Development threat assessment
11. Regulatory and flood control easement assessment
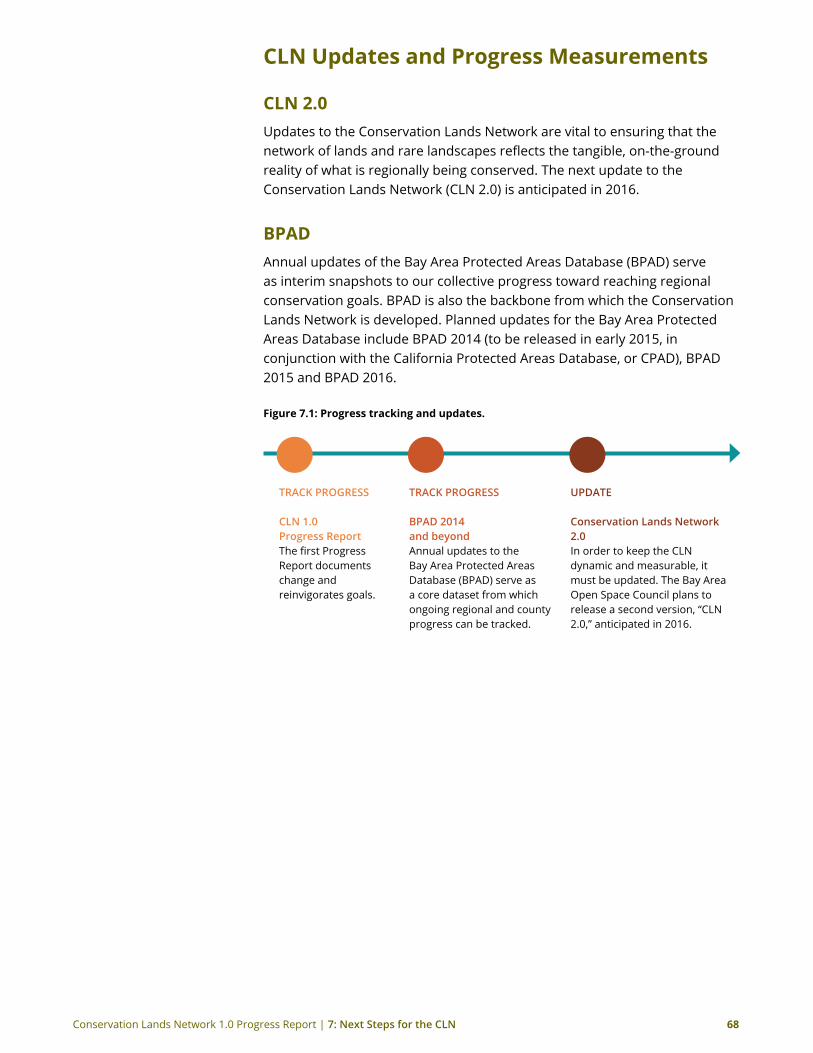
Conservation Lands Network 1.0 Progress Report | 7: Next Steps for the CLN 68
CLN Updates and Progress Measurements
CLN 2.0Updates to the Conservation Lands Network are vital to ensuring that the network of lands and rare landscapes reflects the tangible, on-the-ground reality of what is regionally being conserved. The next update to the Conservation Lands Network (CLN 2.0) is anticipated in 2016.
BPAD Annual updates of the Bay Area Protected Areas Database (BPAD) serve as interim snapshots to our collective progress toward reaching regional conservation goals. BPAD is also the backbone from which the Conservation Lands Network is developed. Planned updates for the Bay Area Protected Areas Database include BPAD 2014 (to be released in early 2015, in conjunction with the California Protected Areas Database, or CPAD), BPAD 2015 and BPAD 2016.
Figure 7.1: Progress tracking and updates.
UPDATE
Conservation Lands Network 2.0In order to keep the CLN dynamic and measurable, it must be updated. The Bay Area Open Space Council plans to release a second version, “CLN 2.0,” anticipated in 2016.
TRACk PROGRESS BPAD 2014 and beyondAnnual updates to the Bay Area Protected Areas Database (BPAD) serve as a core dataset from which ongoing regional and county progress can be tracked.
TRACk PROGRESS CLN 1.0 Progress Report The first Progress Report documents change and reinvigorates goals.
Conservation Lands Network 1.0 Progress Report | 7: Next Steps for the CLN 69
Individual Action
spread the word Visit www.bayarealands.org to view the interactive map of projects and people whose work has contributed to the Conservation Lands Network thus far. Learn about key projects and progress in your county. Share the Indicator badges with your social networks. Talk about the importance of protecting the Bay Area greenbelt and participate with your local land trust, park districts and vote environment.
explore Visit www.bayarealands.org and log-in to use the CLN Explorer Tool and discover conservation values for any property in the Bay Area.
Tell us what you thinkVisit www.bayarealands.org or email programs [at] openspacecouncil.org.
Create a success storyDo your part to support open spaces, be it via your profession, your pocketbook, or your personal time.
enjoy open spacesVisit a park, and play! Get outside and enjoy the great open spaces that make the Bay Area one of the most unique places to live and play in the world.
Conservation Lands Network 1.0 Progress Report | References 70
references Batker, D., Schwartz, A., Schmidt, R., Mackenzie, A., Smith, J., Robins, J. 2014.
Nature’s Value in Santa Clara County. Earth Economics, Tacoma, WA & the Santa Clara Valley Open Space Authority, San Jose, CA.
Bay Area Open Space Council. 2011. The Conservation Lands Network: San Francisco Bay Area Upland Habitat Goals Project Report. Berkeley. CA.
Bay Area Open Space Council. 2014. Conservation Lands Network Explorer Biodiversity Portfolio Reports. www.bayarealands.org/explorer.
Bay Area Protected Areas Database (BPAD): 2010, 2012, 2013, 2013. www.openspacecouncil.org.
California Air Resources Board (CARB). 2013. The California Almanac of Emissions and Air Quality. www.arb.ca.gov/aqd/almanac/almanac13/almanac13.htm
California Department of Finance. 2014. www.dof.ca.gov.
California Department of Water Resources. 2010. California’s drought of 2007-2009: An overview. http://www.water.ca.gov/waterconditions/drought/docs/DroughtReport2010.pdf.
California Interagency Watershed Mapping Committee. 2009. Watersheds, Calwater 2.2.1. http://gis.ca.gov/casil/gis.ca.gov/calwater.
Center for Biological Diversity. 2011. www.biologicaldiversity.org/campaigns.
County Crop Reports. 2010. Alameda and Contra Costa Counties. Online at http://www.acgov.org/cda/awm/resources/2010cropreport.pdf and http://www.co.contra-costa.ca.us/2207/Crop-Reports.
Dettinger MD, Ralph FM, Das T, Neiman PJ, Cayan DR. 2011. “Atmospheric rivers, floods and the water resources of California.” Water 3(2):445-478.
Fenn, ME, EB Allen, SB Weiss, S Jovan , LH Geiser, GS Tonnesen, RF Johnson, LE Rao, BS Gimeno, F Yuan, T Meixner, A Bytnerowicz. 2010. “Nitrogen critical loads and management alternatives for N-impacted ecosystems in California.” Journal of Environmental Management 91:2402-2423.
Flint LE, Flint AL. 2012b. “Downscaling future climate scenarios to fine scales for hydrologic and ecological modeling and analysis.” Ecol. Processes 1:2.
Goals Project. 1999. Baylands Ecosystem Habitat Goals. A report of habitat recommendations prepared by the San Francisco Bay Area Wetlands Ecosystem Goals Project. U.S. Environmental Protection Agency, San Francisco, CA./S.F. Bay Regional Water Quality Control Board, Oakland, CA.
Greenbelt Alliance. Greenbelt Mapper. http://www.greenbelt.org/ greenbelt-mapper.
Conservation Lands Network 1.0 Progress Report | References 71
Heller, N., J. Kreitler, S. Weiss, D. Ackerly, and E. Micheli. 2013.Targeting climate diversity to increase the resilience of the Conservation Lands Network to climate change. A technical report prepared by the Dwight Center for Conservation Science at Pepperwood, Santa Rosa, CA, for the Gordon and Betty Moore Foundation.
Hickman J, editor. 1993. The Jepson Manual: Higher Plants of California. Berkeley: University of California Press. 1424pp.
Mackenzie, A., J. McGraw, and M. Freeman. 2011. Conservation Blueprint for Santa Cruz County: An Assessment and Recommendations from the Land Trust of Santa Cruz County. Land Trust of Santa Cruz County. Santa Cruz, CA. Online at www.landtrustsantacruz.org/blueprint
Nash, M. 2009. “Bring in the cows: Grazing may be the best hope for a threatened butterfly.” High Country News May 18, 2009.
National Drought Mitigation Center. 2014. United States Drought Monitor website. http://droughtmonitor.unl.edu. Accessed August 5, 2014.
Noss RF. 1990. “Indicators for Monitoring Biodiversity: A Hierarchical Approach.” Conservation Biology 4:355-364.
Penrod, K, PE Garding, C Paulman, P Beier, S Weiss, N Schaefer, R Branciforte and K Gaffney. 2013. Critical Linkages: Bay Area & Beyond. Produced by Science & Collaboration for Connected Wildlands, Fair Oaks, CA (www.scwildlands.org) in collaboration with the Bay Area Open Space Council’s Conservation Lands Network.
Redford KH, Richter BD. 1999. “Conservation of Biodiversity in a World of Use.” Conservation Biology 13:1246-1256.
San Francisco Estuary Partnership. 2007. Comprehensive Conservation and Management Plan (CCMP). Oakland, CA.
San Francisco Bay Subtidal Habitat Goals Project. 2010. San Francisco Bay Subtidal Habitat Goals Report. www.sfbaysubtidal.org
Santa Clara County Habitat Conservation Plan. 2013. www.scv-habitatplan.org
Sawyer JO, Keeler-Wolf T, Evans J. 2009. Manual of California Vegetation. Second Edition. Sacramento: California Native Plant Society. 1312p.
Sulek, J. 2014. “California report: Bay Area population gains are strongest in state.” San Jose Mercury News. Retrieved 10 March 2014.
Thorne JH, Viers JR, Price J, Stoms DM. 2009. “Spatial Patterns of Endemic Plants in California.” Natural Areas Journal 29(4):344-366.
Tonnesen GZ, Wang MO, Chien CJ. 2007. “Assessment of Nitrogen Deposition: Modeling and Habitat Assessment.” California Energy Commission, PIER Energy-Related Environmental Research. CEC-500-2005-032.
US Drought Monitor. http://droughtmonitor.unl.edu/Home/StateDroughtMonitor.aspx?CA
US Fish and Wildlife Service (http://www.fs.usda.gov/detail/r6/plants-animals/fish/?cid=fsbdev2_027105)
USGS. 2013. National Hydrography Dataset 1:24000. http://nhd.usgs.gov.
Conservation Lands Network 1.0 Progress Report | References 72
Walker, R. 2007. The Country in the City: The Greening of the San Francisco Bay Area. University of Washington Press.
Weiss SB. 2006. “Impacts of Nitrogen Deposition on California Ecosystems and Biodiversity.” California Energy Commission, PIER Energy-Related Environmental Research. CEC-500-2005-165.
Weiss SB. 1999. “Cars, Cows, and Checkerspot Butterflies: Nitrogen Deposition and Management of Nutrient-Poor Grasslands for a Threatened Species.” Conservation Biology 13(6): 1476–148.