Climatically sensitive eolian and hemipelagic deposition in the ...
ICUC9 - 9th
International Conference on Urban Climate jointly with 12th
Symposium on the Urban Environment
Climatically Adapted Piloti Arrangement and Ratio of
Residential Blocks in a Subtropical Climate City
Zeng Zhou 1, Qinli Deng 2, Akashi Mochida 2
1 Wuhan University, China, [email protected] 2 Tohoku University, Japan
1. Introduction
In recent years, because of the urban heat island and extreme weather, the outdoor thermal environment is
becoming worse and worse, and outdoor thermal comfort is becoming an increasing concern for residents.
Many studies have been conducted to clarify the influences of green and water spaces on outdoor thermal
comfort in residential area. Uchida et al. 1)
carried out measurements in the summers of 2007 and 2008 in and
around a biotope, and clarified the thermal effects of a biotope with a pond and green space. Furthermore, a
questionnaire survey was conducted at the measurement site to look into the principal causes that affected human
thermal comfort. Hwang et al. 2)
carried out field comfort surveys of 3839 interviewees in tree-shaded spaces
throughout a year and aimed to obtain a better understanding of human thermal comfort response outdoors as well
as to propose an adaptive comfort model for tree-shaded spaces. Chen et al. 3)
investigated the actual situation of
the outdoors thermal environment in summer in an apartment block in Shenzhen City using field measurements,
and examined the effect of schemes to improve the outdoor thermal environment in this apartment block, such as
changing the building shapes, planting arrangements, etc. through simulations.
Relationships between outdoor environment and building density/arrangement also have been researched.
Kubota et al. 4)
carried out wind tunnel tests on the relationship between building density and pedestrian-level wind
velocity. The results of wind tunnel tests on 22 residential neighborhoods selected from actual Japanese cities
were presented. There was a strong relationship between the gross building coverage ratio and the mean wind
velocity ratio. The wind environment evaluation for case study areas was performed by using the wind tunnel
results and the climatic conditions of several major Japanese cities. The development method of guidelines for
realizing acceptable wind environment in residential neighborhoods using the gross building coverage ratio was
proposed. Xuan et al.5)
and Yang et al. 6)
studied climatically adapted building arrangement to maximize thermal
acceptability of outdoors at different Latitudes. The optimal ratio of building distance (D) to building height (H), D/H
from the viewpoints of urban ventilation and sun-shading in Sendai, Japan and Guangzhou, China was analyzed.
The results showed that the distributions of wind velocity around buildings became polarized as building distance
decreased and the proportion of low wind velocity grew larger which was the main cause of poor ventilation and
thermal discomfort. But on the other hand, the significant cooling effects of building shade were observed in closely
packed arrangements. The optimal values of D/H in Guangzhou and Sendai were around 0.24.
However, the research on piloti space, which is an important part of building in area with hot and humid summer
has not been studied sufficiently. Piloti space can improve wind environment and provide cooler activity space in
city with hot and humid summer. This study aims to propose climatically adapted piloti arrangement and ratio for
design of residential area. Through coupled simulations, the optimal piloti arrangement and relationships between
piloti ratio and outdoor thermal environment (wind, MRT, SET*) are discussed.
2. Analysis outline
2.1 the city of Wuhan
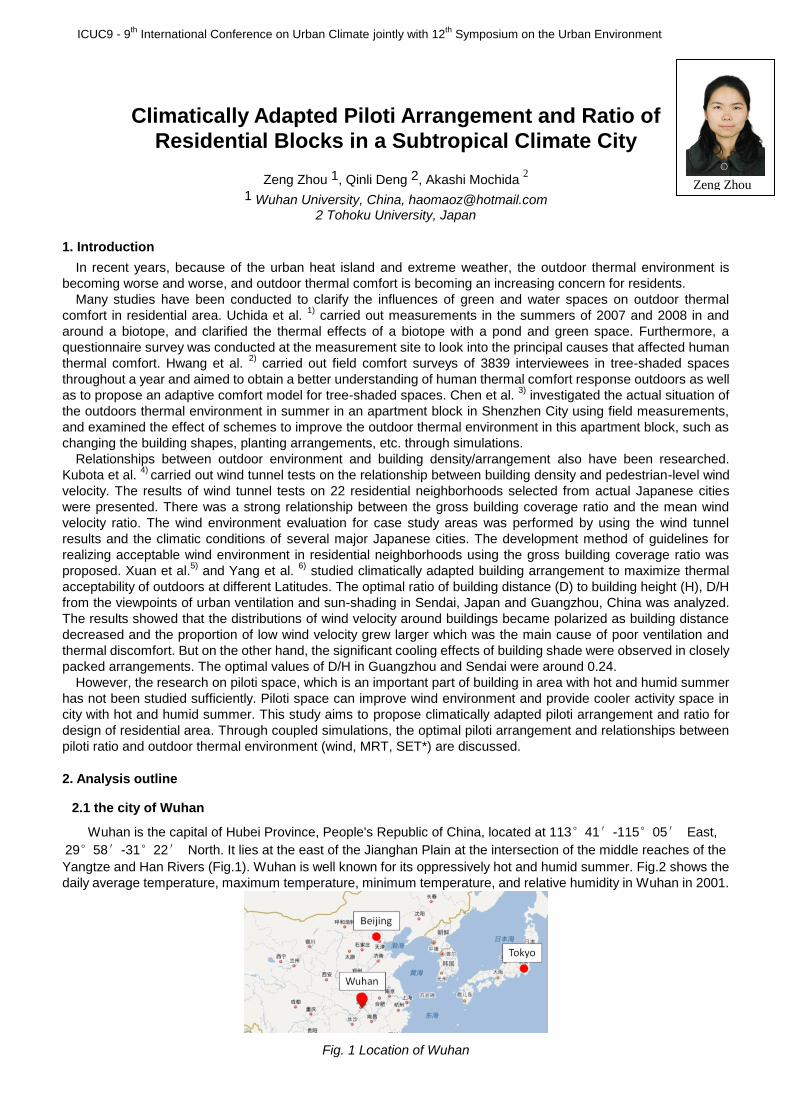
Wuhan is the capital of Hubei Province, People's Republic of China, located at 113°41′-115°05′ East,
29°58′-31°22′ North. It lies at the east of the Jianghan Plain at the intersection of the middle reaches of the
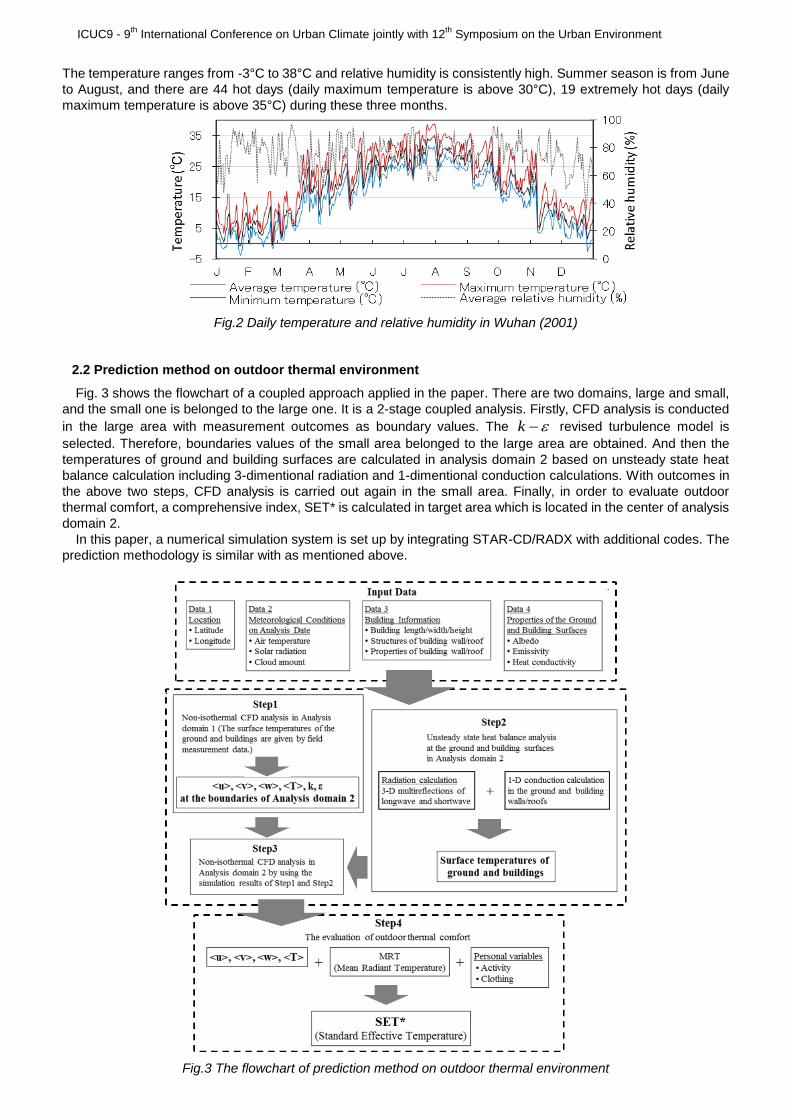
Yangtze and Han Rivers (Fig.1). Wuhan is well known for its oppressively hot and humid summer. Fig.2 shows the
daily average temperature, maximum temperature, minimum temperature, and relative humidity in Wuhan in 2001.
Fig. 1 Location of Wuhan
Zeng Zhou
ICUC9 - 9th
International Conference on Urban Climate jointly with 12th
Symposium on the Urban Environment
The temperature ranges from -3°C to 38°C and relative humidity is consistently high. Summer season is from June
to August, and there are 44 hot days (daily maximum temperature is above 30°C), 19 extremely hot days (daily
maximum temperature is above 35°C) during these three months.
Fig.2 Daily temperature and relative humidity in Wuhan (2001)
2.2 Prediction method on outdoor thermal environment
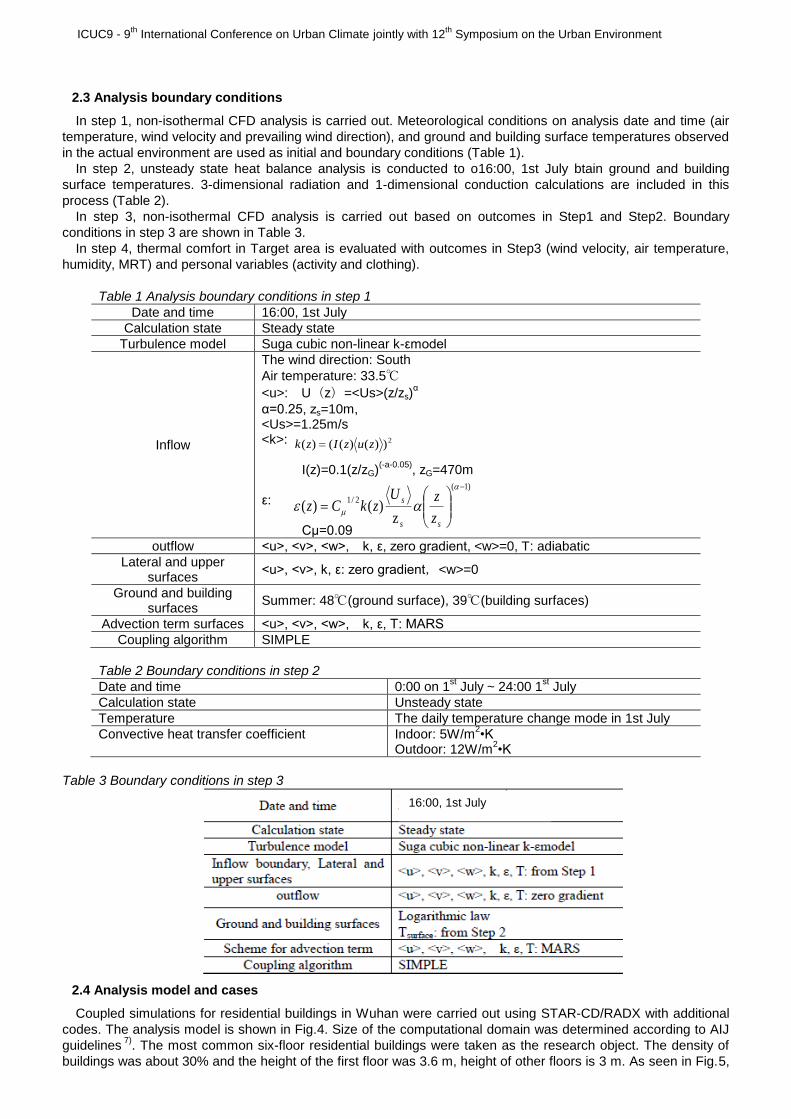
Fig. 3 shows the flowchart of a coupled approach applied in the paper. There are two domains, large and small,
and the small one is belonged to the large one. It is a 2-stage coupled analysis. Firstly, CFD analysis is conducted
in the large area with measurement outcomes as boundary values. The k revised turbulence model is
selected. Therefore, boundaries values of the small area belonged to the large area are obtained. And then the
temperatures of ground and building surfaces are calculated in analysis domain 2 based on unsteady state heat
balance calculation including 3-dimentional radiation and 1-dimentional conduction calculations. With outcomes in
the above two steps, CFD analysis is carried out again in the small area. Finally, in order to evaluate outdoor
thermal comfort, a comprehensive index, SET* is calculated in target area which is located in the center of analysis
domain 2.
In this paper, a numerical simulation system is set up by integrating STAR-CD/RADX with additional codes. The
prediction methodology is similar with as mentioned above.
Fig.3 The flowchart of prediction method on outdoor thermal environment
ICUC9 - 9th
International Conference on Urban Climate jointly with 12th
Symposium on the Urban Environment
2.3 Analysis boundary conditions
In step 1, non-isothermal CFD analysis is carried out. Meteorological conditions on analysis date and time (air
temperature, wind velocity and prevailing wind direction), and ground and building surface temperatures observed
in the actual environment are used as initial and boundary conditions (Table 1).
In step 2, unsteady state heat balance analysis is conducted to o16:00, 1st July btain ground and building
surface temperatures. 3-dimensional radiation and 1-dimensional conduction calculations are included in this
process (Table 2).
In step 3, non-isothermal CFD analysis is carried out based on outcomes in Step1 and Step2. Boundary
conditions in step 3 are shown in Table 3.
In step 4, thermal comfort in Target area is evaluated with outcomes in Step3 (wind velocity, air temperature,
humidity, MRT) and personal variables (activity and clothing).
Table 1 Analysis boundary conditions in step 1
Date and time 16:00, 1st July
Calculation state Steady state
Turbulence model Suga cubic non-linear k-εmodel
Inflow
The wind direction: South
Air temperature: 33.5℃
<u>: U(z)=<Us>(z/zs)α
α=0.25, zs=10m, <Us>=1.25m/s <k>: I(z)=0.1(z/zG)
(-a-0.05), zG=470m
ε: Cμ=0.09
outflow <u>, <v>, <w>, k, ε, zero gradient, <w>=0, T: adiabatic
Lateral and upper surfaces
<u>, <v>, k, ε: zero gradient,<w>=0
Ground and building surfaces
Summer: 48℃(ground surface), 39℃(building surfaces)
Advection term surfaces <u>, <v>, <w>, k, ε, T: MARS
Coupling algorithm SIMPLE
Table 2 Boundary conditions in step 2
Date and time 0:00 on 1st July ~ 24:00 1
st July
Calculation state Unsteady state
Temperature The daily temperature change mode in 1st July
Convective heat transfer coefficient Indoor: 5W/m2•K
Outdoor: 12W/m2•K
Table 3 Boundary conditions in step 3
2.4 Analysis model and cases
Coupled simulations for residential buildings in Wuhan were carried out using STAR-CD/RADX with additional
codes. The analysis model is shown in Fig.4. Size of the computational domain was determined according to AIJ
guidelines 7)
. The most common six-floor residential buildings were taken as the research object. The density of
buildings was about 30% and the height of the first floor was 3.6 m, height of other floors is 3 m. As seen in Fig.5,
2))()(()( zuzIzk
)1(
2/1
z)()(
ss
s
z
zUzkCz
16:00, 1st July
ICUC9 - 9th
International Conference on Urban Climate jointly with 12th
Symposium on the Urban Environment
four different piloti arrangements in the target area were considered in order to determine the optimal one. Then the
relationship between piloti ratio and wind environment was investigated based on the optimal piloti arrangement. All
the analysis cases are listed in Table 4. Piloti ratio of Case 1-S- Case 4-S was 40%. Case 4-20-S, Case 4-60-S and
Case 4-80-S were set with different piloti ratio based on the piloti arrangement of Case 4-S.
Fig.4 Analysis model
Fig.5 Different piloti arrangement in target area
Table 4. Analysis cases
Case name Analysis date
and time
Inflow wind velocity
(m/s)
Piloti
arrangement
Politi ratio
(%)
Case 0-S
7/1
16:00
1.25m/s
(at 10m,
prevailing wind direction:
South)
no piloti 0
Case 1-S in the east end of building 40
Case 2-S in the middle of building 40
Case 3-S in one end of building 40
Case 4-S
in the two ends of building
40
Case 4-20-S 20
Case 4-60-S 60
Case 4-80-S 80
3. Results and discussion
3.1 The optimal piloti arrangement
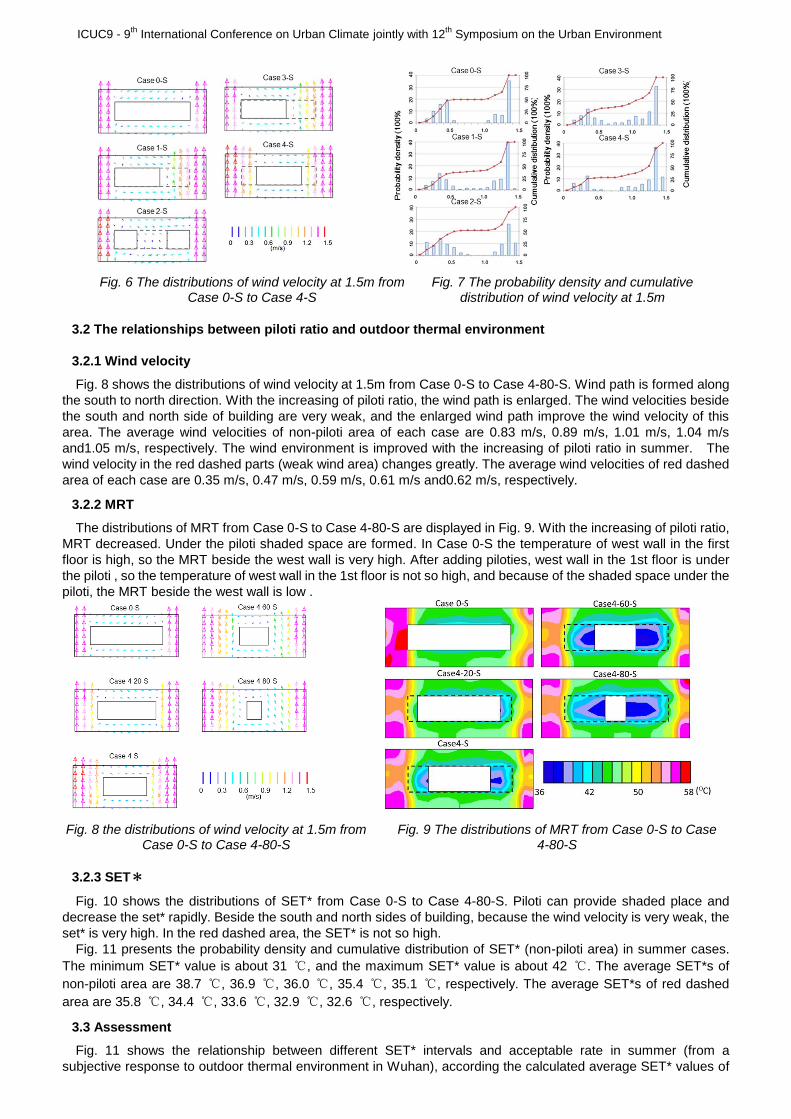
Fig.6 presents the distributions of wind velocity at 1.5m from Case 0-S to Case 4-S and Fig.7 indicates the
probability density and cumulative distribution of wind velocity from Case 0-S to Case 4-S in the evaluation area
shown in Fig.4. When piloti ratio is 0 (Case 0-S) or piloti is in the middle of building (Case 2-S), the portion of wind
velocity less than 0.5m/s occupies about half of the cumulative distribution. When piloti is in the two ends of building
(Case 4-S), wind velocity which is over 0.5m/s occupies over 75% of the cumulative distribution. Case 4-S can
improve the wind environment significantly. Therefore, it is concluded that piloti in the two ends of building is the
optimal piloti arrangement.
ICUC9 - 9th
International Conference on Urban Climate jointly with 12th
Symposium on the Urban Environment
Fig. 6 The distributions of wind velocity at 1.5m from Case 0-S to Case 4-S
Fig. 7 The probability density and cumulative distribution of wind velocity at 1.5m
3.2 The relationships between piloti ratio and outdoor thermal environment
3.2.1 Wind velocity
Fig. 8 shows the distributions of wind velocity at 1.5m from Case 0-S to Case 4-80-S. Wind path is formed along
the south to north direction. With the increasing of piloti ratio, the wind path is enlarged. The wind velocities beside
the south and north side of building are very weak, and the enlarged wind path improve the wind velocity of this
area. The average wind velocities of non-piloti area of each case are 0.83 m/s, 0.89 m/s, 1.01 m/s, 1.04 m/s
and1.05 m/s, respectively. The wind environment is improved with the increasing of piloti ratio in summer. The
wind velocity in the red dashed parts (weak wind area) changes greatly. The average wind velocities of red dashed
area of each case are 0.35 m/s, 0.47 m/s, 0.59 m/s, 0.61 m/s and0.62 m/s, respectively.
3.2.2 MRT
The distributions of MRT from Case 0-S to Case 4-80-S are displayed in Fig. 9. With the increasing of piloti ratio,
MRT decreased. Under the piloti shaded space are formed. In Case 0-S the temperature of west wall in the first
floor is high, so the MRT beside the west wall is very high. After adding piloties, west wall in the 1st floor is under
the piloti , so the temperature of west wall in the 1st floor is not so high, and because of the shaded space under the
piloti, the MRT beside the west wall is low .
Fig. 8 the distributions of wind velocity at 1.5m from Case 0-S to Case 4-80-S
Fig. 9 The distributions of MRT from Case 0-S to Case 4-80-S
3.2.3 SET*
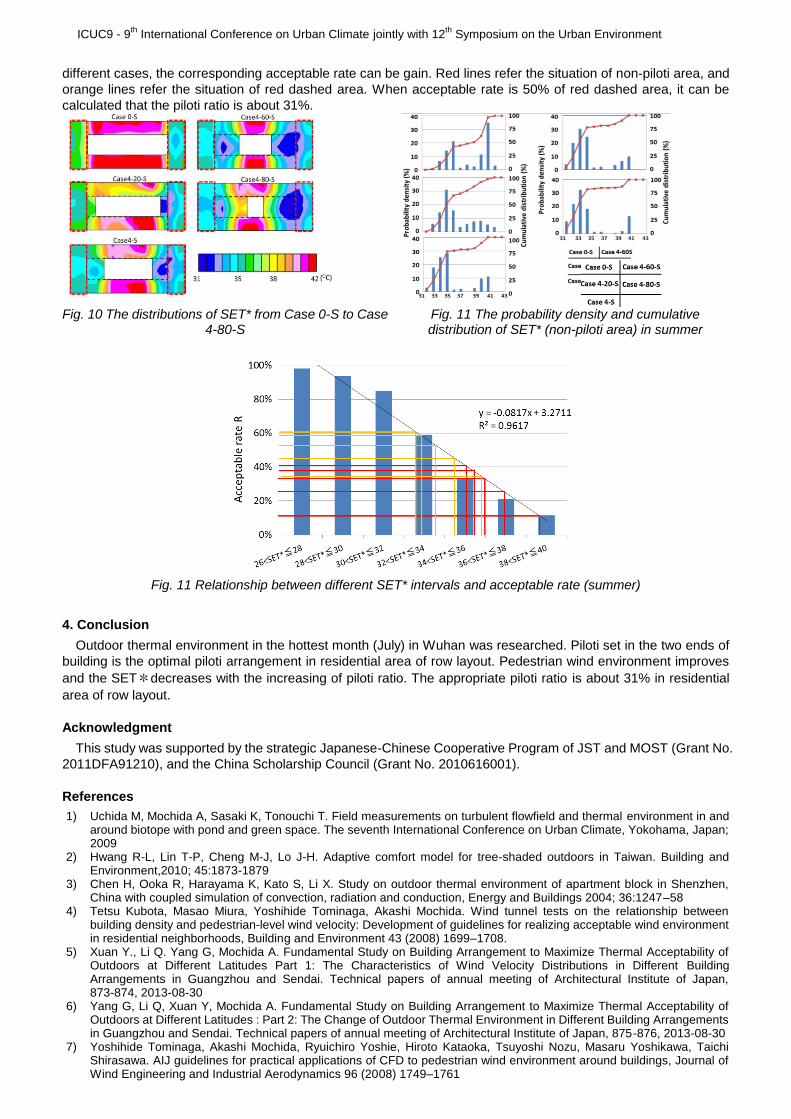
Fig. 10 shows the distributions of SET* from Case 0-S to Case 4-80-S. Piloti can provide shaded place and
decrease the set* rapidly. Beside the south and north sides of building, because the wind velocity is very weak, the
set* is very high. In the red dashed area, the SET* is not so high.
Fig. 11 presents the probability density and cumulative distribution of SET* (non-piloti area) in summer cases.
The minimum SET* value is about 31 ℃, and the maximum SET* value is about 42 ℃. The average SET*s of
non-piloti area are 38.7 ℃, 36.9 ℃, 36.0 ℃, 35.4 ℃, 35.1 ℃, respectively. The average SET*s of red dashed
area are 35.8 ℃, 34.4 ℃, 33.6 ℃, 32.9 ℃, 32.6 ℃, respectively.
3.3 Assessment
Fig. 11 shows the relationship between different SET* intervals and acceptable rate in summer (from a
subjective response to outdoor thermal environment in Wuhan), according the calculated average SET* values of
ICUC9 - 9th
International Conference on Urban Climate jointly with 12th
Symposium on the Urban Environment
different cases, the corresponding acceptable rate can be gain. Red lines refer the situation of non-piloti area, and
orange lines refer the situation of red dashed area. When acceptable rate is 50% of red dashed area, it can be
calculated that the piloti ratio is about 31%.
Fig. 10 The distributions of SET* from Case 0-S to Case 4-80-S
Fig. 11 The probability density and cumulative distribution of SET* (non-piloti area) in summer
Fig. 11 Relationship between different SET* intervals and acceptable rate (summer)
4. Conclusion
Outdoor thermal environment in the hottest month (July) in Wuhan was researched. Piloti set in the two ends of
building is the optimal piloti arrangement in residential area of row layout. Pedestrian wind environment improves
and the SET*decreases with the increasing of piloti ratio. The appropriate piloti ratio is about 31% in residential
area of row layout.
Acknowledgment
This study was supported by the strategic Japanese-Chinese Cooperative Program of JST and MOST (Grant No.
2011DFA91210), and the China Scholarship Council (Grant No. 2010616001).
References
1) Uchida M, Mochida A, Sasaki K, Tonouchi T. Field measurements on turbulent flowfield and thermal environment in and around biotope with pond and green space. The seventh International Conference on Urban Climate, Yokohama, Japan; 2009
2) Hwang R-L, Lin T-P, Cheng M-J, Lo J-H. Adaptive comfort model for tree-shaded outdoors in Taiwan. Building and Environment,2010; 45:1873-1879
3) Chen H, Ooka R, Harayama K, Kato S, Li X. Study on outdoor thermal environment of apartment block in Shenzhen, China with coupled simulation of convection, radiation and conduction, Energy and Buildings 2004; 36:1247–58
4) Tetsu Kubota, Masao Miura, Yoshihide Tominaga, Akashi Mochida. Wind tunnel tests on the relationship between building density and pedestrian-level wind velocity: Development of guidelines for realizing acceptable wind environment in residential neighborhoods, Building and Environment 43 (2008) 1699–1708.
5) Xuan Y., Li Q. Yang G, Mochida A. Fundamental Study on Building Arrangement to Maximize Thermal Acceptability of Outdoors at Different Latitudes Part 1: The Characteristics of Wind Velocity Distributions in Different Building Arrangements in Guangzhou and Sendai. Technical papers of annual meeting of Architectural Institute of Japan, 873-874, 2013-08-30
6) Yang G, Li Q, Xuan Y, Mochida A. Fundamental Study on Building Arrangement to Maximize Thermal Acceptability of Outdoors at Different Latitudes : Part 2: The Change of Outdoor Thermal Environment in Different Building Arrangements in Guangzhou and Sendai. Technical papers of annual meeting of Architectural Institute of Japan, 875-876, 2013-08-30
7) Yoshihide Tominaga, Akashi Mochida, Ryuichiro Yoshie, Hiroto Kataoka, Tsuyoshi Nozu, Masaru Yoshikawa, Taichi Shirasawa. AIJ guidelines for practical applications of CFD to pedestrian wind environment around buildings, Journal of Wind Engineering and Industrial Aerodynamics 96 (2008) 1749–1761