INVESTIGATING AND MODELLING EFFECTS OF CLIMATICALLY …
5
INVESTIGATING AND MODELLING EFFECTS OF CLIMATICALLY AND HYDROLOGICALLY INDICATORS ON THE URMIA LAKE COASTLINE CHANGES USING TIME SERIES ANALYSIS M. Ahmadijamal a , M. Hasanlou a * a School of Surveying and Geospatial Engineering, College of Engineering, University of Tehran, Tehran, Iran - (mitraahmadi, [email protected]) KEY WORDS: Modelling, Water level changes, Hydrological indicator, climatically indicator, Time series, Urmia Lake ABSTRACT: Study of hydrological parameters of lakes and examine the variation of water level to operate management on water resources are important. The purpose of this study is to investigate and model the Urmia Lake water level changes due to changes in climatically and hydrological indicators that affects in the process of level variation and area of this lake. For this purpose, Landsat satellite images, hydrological data, the daily precipitation, the daily surface evaporation and the daily discharge in total of the lake basin during the period of 2010-2016 have been used. Based on time-series analysis that is conducted on individual data independently with same procedure, to model variation of Urmia Lake level, we used polynomial regression technique and combined polynomial with periodic behavior. In the first scenario, we fit a multivariate linear polynomial to our datasets and determining RMSE, NRSME and R² value. We found that fourth degree polynomial can better fit to our datasets with lowest RMSE value about 9 cm. In the second scenario, we combine polynomial with periodic behavior for modeling. The second scenario has superiority comparing to the first one, by RMSE value about 3 cm. 1. INTRODUCTION Urmia Lake is one of the largest permanent lake in Middle East with a catchment area of 51,876 km², comprising 3% of the country area and 7% of total surface water in Iran (Eimanifar & Mohebbi, 2007). It is one of the largest salt lakes in the world in terms of surface area. This terminal lake is situated in the northwestern corner of Iran, near Turkey (Figure 1). It is located in the heart of two provinces of West Azerbaijan and East Azerbaijan at latitude 37°00' to 38°12' N, and longitude 44°40' to 45°50' E (UNESCO, 2001). The Urmia Lake catchment has a population of about two million (West Azerbaijan Regional Water Authority, 2012a). The lake is divided into southern and northern parts by Martyr Kalantari causeway constructed across the lake for facilitation of communication between east (Tabriz City) and west (Urmia City) of the lake (Figure 2). Naturally most important factors that affects to level of lake water is climatically and hydrological factors. For example, changes in temperature and precipitation can be one of the most important climatical factors that considered in this study. Predict of climatic parameters and examine the future trends in the management of water resources is important (Wang et al. 2000). Urmia Lake is one of the 610 biosphere reserves in 117 countries recognized in 1976 under UNESCO's Man and the Biosphere (MAB) program (UNESCO, 2012). Unfortunately, during the last 17 years, there has been a rapid decline of the lake’s water level (Figure 3). Figure 1. Lake Urmia drainage basin in the north west of Iran (Abbaspour et al. 2012) * Corresponding author Figure 2. The map above shows the location of Urmia Lake in Iran. The other presents the Urmia Lake’s general shape. The bold line in the middle of the lake is the Martyr Kalantari causeway and the vertical line over the lake is the border between two provinces of East and West Azerbaijan (Google Earth, 2012) Figure 3. Urmia Lake’s water level using various data (UNEP and GEAS, 2012). The International Archives of the Photogrammetry, Remote Sensing and Spatial Information Sciences, Volume XLII-4/W4, 2017 Tehran's Joint ISPRS Conferences of GI Research, SMPR and EOEC 2017, 7–10 October 2017, Tehran, Iran This contribution has been peer-reviewed. https://doi.org/10.5194/isprs-archives-XLII-4-W4-5-2017 | © Authors 2017. CC BY 4.0 License. 5
Transcript of INVESTIGATING AND MODELLING EFFECTS OF CLIMATICALLY …

INVESTIGATING AND MODELLING EFFECTS OF CLIMATICALLY AND
HYDROLOGICALLY INDICATORS ON THE URMIA LAKE COASTLINE CHANGES
USING TIME SERIES ANALYSIS
M. Ahmadijamal a, M. Hasanlou a*
a School of Surveying and Geospatial Engineering, College of Engineering,
University of Tehran, Tehran, Iran - (mitraahmadi, [email protected])
KEY WORDS: Modelling, Water level changes, Hydrological indicator, climatically indicator, Time series, Urmia Lake
ABSTRACT:
Study of hydrological parameters of lakes and examine the variation of water level to operate management on water resources are
important. The purpose of this study is to investigate and model the Urmia Lake water level changes due to changes in climatically
and hydrological indicators that affects in the process of level variation and area of this lake. For this purpose, Landsat satellite images,
hydrological data, the daily precipitation, the daily surface evaporation and the daily discharge in total of the lake basin during the
period of 2010-2016 have been used. Based on time-series analysis that is conducted on individual data independently with same
procedure, to model variation of Urmia Lake level, we used polynomial regression technique and combined polynomial with periodic
behavior. In the first scenario, we fit a multivariate linear polynomial to our datasets and determining RMSE, NRSME and R² value.
We found that fourth degree polynomial can better fit to our datasets with lowest RMSE value about 9 cm. In the second scenario, we
combine polynomial with periodic behavior for modeling. The second scenario has superiority comparing to the first one, by RMSE
value about 3 cm.
1. INTRODUCTION
Urmia Lake is one of the largest permanent lake in Middle East
with a catchment area of 51,876 km², comprising 3% of the
country area and 7% of total surface water in Iran (Eimanifar &
Mohebbi, 2007). It is one of the largest salt lakes in the world in
terms of surface area. This terminal lake is situated in the
northwestern corner of Iran, near Turkey (Figure 1). It is located
in the heart of two provinces of West Azerbaijan and East
Azerbaijan at latitude 37°00' to 38°12' N, and longitude 44°40' to
45°50' E (UNESCO, 2001). The Urmia Lake catchment has a
population of about two million (West Azerbaijan Regional
Water Authority, 2012a). The lake is divided into southern and
northern parts by Martyr Kalantari causeway constructed across
the lake for facilitation of communication between east (Tabriz
City) and west (Urmia City) of the lake (Figure 2). Naturally most
important factors that affects to level of lake water is climatically
and hydrological factors. For example, changes in temperature
and precipitation can be one of the most important climatical
factors that considered in this study. Predict of climatic
parameters and examine the future trends in the management of
water resources is important (Wang et al. 2000). Urmia Lake is
one of the 610 biosphere reserves in 117 countries recognized in
1976 under UNESCO's Man and the Biosphere (MAB) program
(UNESCO, 2012). Unfortunately, during the last 17 years, there
has been a rapid decline of the lake’s water level (Figure 3).
Figure 1. Lake Urmia drainage basin in the north west of Iran (Abbaspour et al. 2012)
* Corresponding author
Figure 2. The map above shows the location of Urmia Lake in Iran. The other presents the Urmia Lake’s general shape.
The bold line in the middle of the lake is the Martyr Kalantari
causeway and the vertical line over the lake is the border between
two provinces of East and West Azerbaijan (Google Earth, 2012)
Figure 3. Urmia Lake’s water level using various data (UNEP
and GEAS, 2012).
The International Archives of the Photogrammetry, Remote Sensing and Spatial Information Sciences, Volume XLII-4/W4, 2017 Tehran's Joint ISPRS Conferences of GI Research, SMPR and EOEC 2017, 7–10 October 2017, Tehran, Iran
This contribution has been peer-reviewed. https://doi.org/10.5194/isprs-archives-XLII-4-W4-5-2017 | © Authors 2017. CC BY 4.0 License.
5
Rasuli et al (2008), the Lake level fluctuations with satellite
images from 1976 and 2005 were examined. The researchers
showed that variations of the Lake in the period of the time that
has been studied, decreasing 23% of the level of the lake. In this
study the main factors is not mentioned the lake is drying. Hesari
and colleagues (2009), changes in the level of Lake Urmia and
similarity behaviors with Caspian Sea level changes and Lake
Van in Turkey's and climatic factors in area was examined.
Studies based on monthly data for Lake water level in Lake
Urmia during 1345-1388 showed clearly that the long-term trend
is up to 6 meters. The results of existence of procedure, existence
of the jump and the difference between mean and median from
1374 onwards and the process the lake. Level was not random
and was confirmed at a significance level of 1%. Lake Van
behavior and changes in ground water levels have match
conformity with the lake water level changes that was the
existence of high pressure on the region's groundwater. Abdollahi
and colleagues (2010) have noted that factors of declining in
Urmia lake water can be divided into two groups of up grand and
underground water factors. Surface factors have the greatest
impact and they are the amount of atmospheric rainfall, changes
in water flow and temperature change in the lake river Basin.
Also underground factors such as changes in groundwater flow
regime, due to changes in the lake bed of Lake causeway, salt
accumulation and the broad masses and the incomparable masses
in the bed of the lake and they are Effective in changing water
level of lake
2. STUDY AREA
Urmia Lake is located in north-west Iran (37º30’, N, 46 º 00' E,),
is the largest in Middle East and world’s sixth largest saline lake
with a surface area of approximately 4750- 6000 km2 Extending
140 km and 85 km in south-north and east-west direction
respectively during the historical period between 1965 and 2000
(Ghaheri, et al. 1999; Abbaspour et al. 2012; UNEP, 2012;
Abatzopoulos et al 2006; Waiser and Robarts, 2009). Lake
Urmia’s drainage basin has an area of 51876 km2 including the
lake. The lake’s total annual inflow of 6.900 km3 has been
estimated to be supplied from rivers by 4.9 km³ , flood waters by
0.5 km³ and direct precipitation over the lake by 1.5 km³
(Ghaheri, et al. 1999; Eimanifar and Mohebbi, 2007). The main
rivers of the LUDB are given in Table 1. The only known output
from the lake however, is direct evaporation from the lake surface
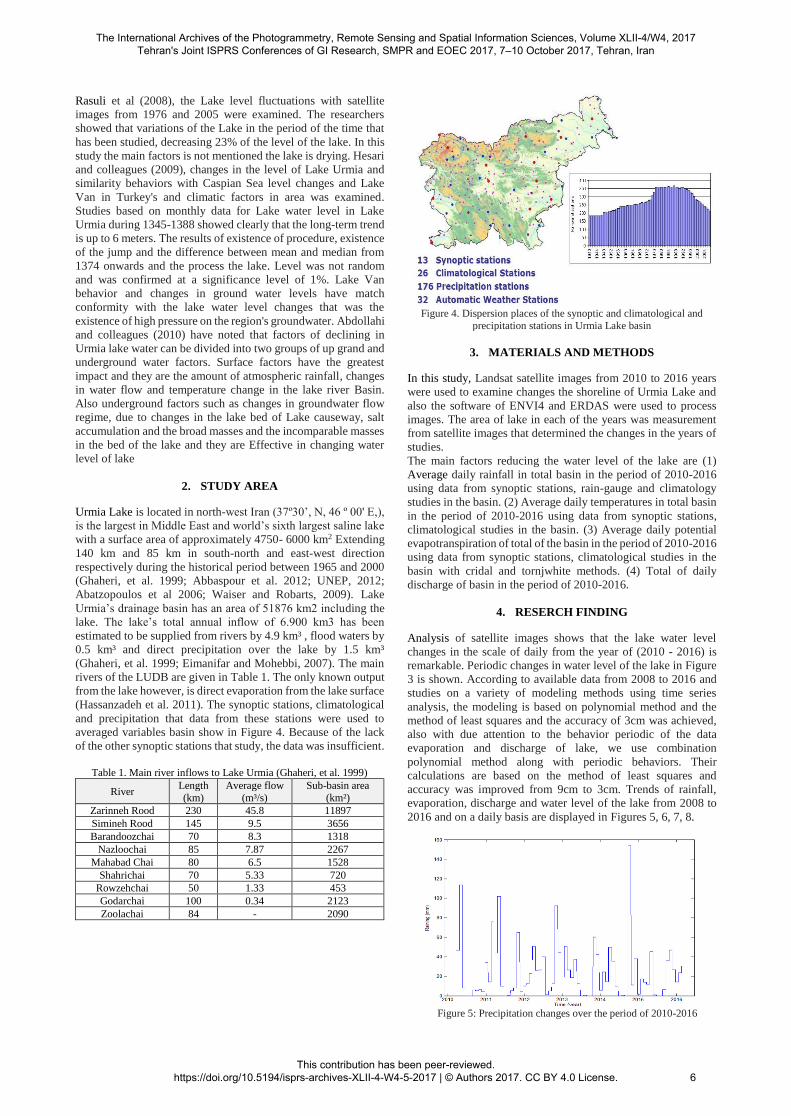
(Hassanzadeh et al. 2011). The synoptic stations, climatological
and precipitation that data from these stations were used to
averaged variables basin show in Figure 4. Because of the lack
of the other synoptic stations that study, the data was insufficient.
Table 1. Main river inflows to Lake Urmia (Ghaheri, et al. 1999)
River Length
(km)
Average flow
(m³/s)
Sub-basin area
(km²)
Zarinneh Rood 230 45.8 11897
Simineh Rood 145 9.5 3656
Barandoozchai 70 8.3 1318
Nazloochai 85 7.87 2267
Mahabad Chai 80 6.5 1528
Shahrichai 70 5.33 720
Rowzehchai 50 1.33 453
Godarchai 100 0.34 2123
Zoolachai 84 - 2090
Figure 4. Dispersion places of the synoptic and climatological and
precipitation stations in Urmia Lake basin
3. MATERIALS AND METHODS
In this study, Landsat satellite images from 2010 to 2016 years
were used to examine changes the shoreline of Urmia Lake and
also the software of ENVI4 and ERDAS were used to process
images. The area of lake in each of the years was measurement
from satellite images that determined the changes in the years of
studies.
The main factors reducing the water level of the lake are (1)
Average daily rainfall in total basin in the period of 2010-2016
using data from synoptic stations, rain-gauge and climatology
studies in the basin. (2) Average daily temperatures in total basin
in the period of 2010-2016 using data from synoptic stations,
climatological studies in the basin. (3) Average daily potential
evapotranspiration of total of the basin in the period of 2010-2016
using data from synoptic stations, climatological studies in the
basin with cridal and tornjwhite methods. (4) Total of daily
discharge of basin in the period of 2010-2016.
4. RESERCH FINDING
Analysis of satellite images shows that the lake water level
changes in the scale of daily from the year of (2010 - 2016) is
remarkable. Periodic changes in water level of the lake in Figure
3 is shown. According to available data from 2008 to 2016 and
studies on a variety of modeling methods using time series
analysis, the modeling is based on polynomial method and the
method of least squares and the accuracy of 3cm was achieved,
also with due attention to the behavior periodic of the data
evaporation and discharge of lake, we use combination
polynomial method along with periodic behaviors. Their
calculations are based on the method of least squares and
accuracy was improved from 9cm to 3cm. Trends of rainfall,
evaporation, discharge and water level of the lake from 2008 to
2016 and on a daily basis are displayed in Figures 5, 6, 7, 8.
Figure 5: Precipitation changes over the period of 2010-2016
The International Archives of the Photogrammetry, Remote Sensing and Spatial Information Sciences, Volume XLII-4/W4, 2017 Tehran's Joint ISPRS Conferences of GI Research, SMPR and EOEC 2017, 7–10 October 2017, Tehran, Iran
This contribution has been peer-reviewed. https://doi.org/10.5194/isprs-archives-XLII-4-W4-5-2017 | © Authors 2017. CC BY 4.0 License.
6
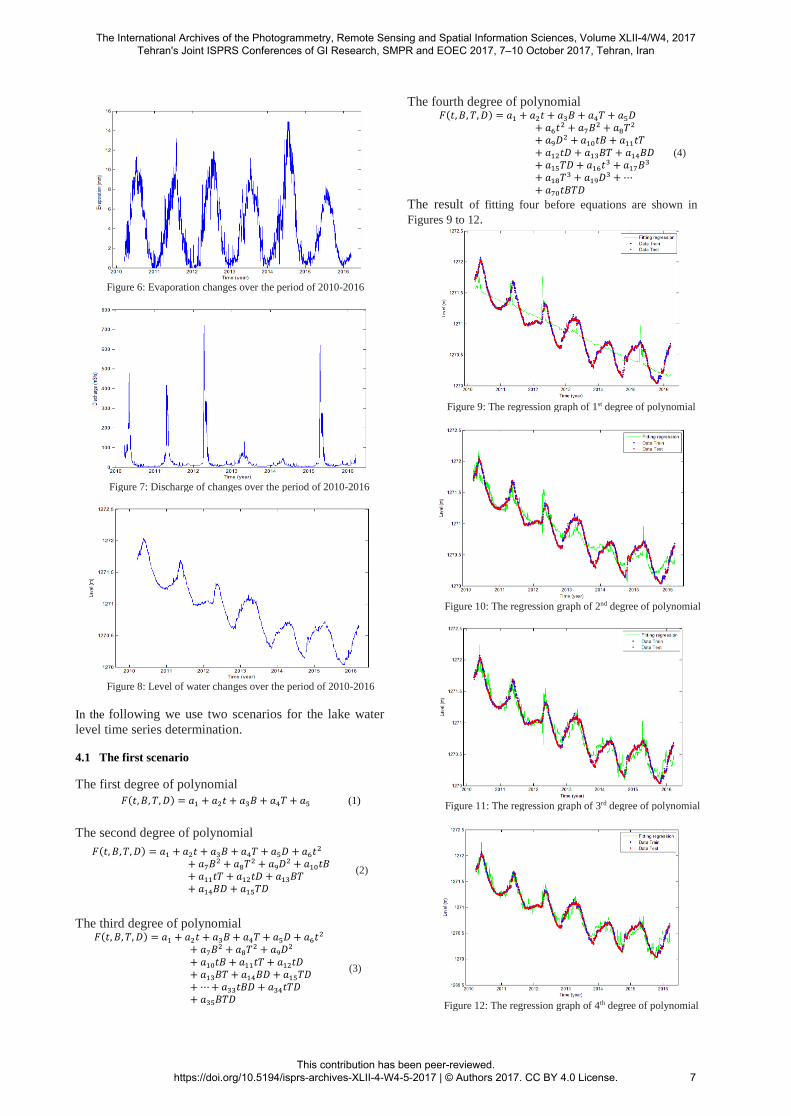
Figure 6: Evaporation changes over the period of 2010-2016
Figure 7: Discharge of changes over the period of 2010-2016
Figure 8: Level of water changes over the period of 2010-2016
In the following we use two scenarios for the lake water
level time series determination.
4.1 The first scenario
The first degree of polynomial
𝐹(𝑡, 𝐵, 𝑇, 𝐷) = 𝑎1 + 𝑎2𝑡 + 𝑎3𝐵 + 𝑎4𝑇 + 𝑎5 (1)
The second degree of polynomial
𝐹(𝑡, 𝐵, 𝑇, 𝐷) = 𝑎1 + 𝑎2𝑡 + 𝑎3𝐵 + 𝑎4𝑇 + 𝑎5𝐷 + 𝑎6𝑡2
+ 𝑎7𝐵2 + 𝑎8𝑇2 + 𝑎9𝐷2 + 𝑎10𝑡𝐵+ 𝑎11𝑡𝑇 + 𝑎12𝑡𝐷 + 𝑎13𝐵𝑇+ 𝑎14𝐵𝐷 + 𝑎15𝑇𝐷
(2)
The third degree of polynomial 𝐹(𝑡, 𝐵, 𝑇, 𝐷) = 𝑎1 + 𝑎2𝑡 + 𝑎3𝐵 + 𝑎4𝑇 + 𝑎5𝐷 + 𝑎6𝑡2
+ 𝑎7𝐵2 + 𝑎8𝑇2 + 𝑎9𝐷2
+ 𝑎10𝑡𝐵 + 𝑎11𝑡𝑇 + 𝑎12𝑡𝐷+ 𝑎13𝐵𝑇 + 𝑎14𝐵𝐷 + 𝑎15𝑇𝐷+ ⋯ + 𝑎33𝑡𝐵𝐷 + 𝑎34𝑡𝑇𝐷+ 𝑎35𝐵𝑇𝐷
(3)
The fourth degree of polynomial 𝐹(𝑡, 𝐵, 𝑇, 𝐷) = 𝑎1 + 𝑎2𝑡 + 𝑎3𝐵 + 𝑎4𝑇 + 𝑎5𝐷
+ 𝑎6𝑡2 + 𝑎7𝐵2 + 𝑎8𝑇2
+ 𝑎9𝐷2 + 𝑎10𝑡𝐵 + 𝑎11𝑡𝑇+ 𝑎12𝑡𝐷 + 𝑎13𝐵𝑇 + 𝑎14𝐵𝐷+ 𝑎15𝑇𝐷 + 𝑎16𝑡3 + 𝑎17𝐵3
+ 𝑎18𝑇3 + 𝑎19𝐷3 + ⋯+ 𝑎70𝑡𝐵𝑇𝐷
(4)
The result of fitting four before equations are shown in
Figures 9 to 12.
Figure 9: The regression graph of 1st degree of polynomial
Figure 10: The regression graph of 2nd degree of polynomial
Figure 11: The regression graph of 3rd degree of polynomial
Figure 12: The regression graph of 4th degree of polynomial
The International Archives of the Photogrammetry, Remote Sensing and Spatial Information Sciences, Volume XLII-4/W4, 2017 Tehran's Joint ISPRS Conferences of GI Research, SMPR and EOEC 2017, 7–10 October 2017, Tehran, Iran
This contribution has been peer-reviewed. https://doi.org/10.5194/isprs-archives-XLII-4-W4-5-2017 | © Authors 2017. CC BY 4.0 License.
7

For assessing the accuracy of two scenarios, we used the
index of root mean square error (RMSE), normalized root
mean square error (NRMSE) and the coefficient of
determination (R2) in accordance of 5 to 7.
RMSE = √∑ (𝑥𝑝−𝑥𝑜)𝑛
𝑖=12
𝑛 (5)
NRMSE = 𝑅𝑀𝑆𝐸
𝑥𝑜𝑏𝑠,𝑚𝑎𝑥−𝑥𝑜𝑏𝑠,𝑚𝑖𝑛 (6)
R2 = 𝑆𝑆𝑅
𝑆𝑆𝑇= 1 −
𝑆𝑆𝐸
𝑆𝑆𝑇
SSE = ∑ (𝑥𝑝 − 𝑥𝑜)𝑛𝑖=1
2
SST = ∑ (𝑥𝑖 − 𝑥𝑚𝑒𝑎𝑛)𝑛𝑖=1
2
(7)
Where Xp is estimated parameters, Xo is observational
parameters and n is the number of observations. By using the
parameters between the estimated values and the best model
observational values, the best model was selected. The values of
these parameters for these four methods were calculated and is
shown in Table2.
Table 2: Estimate accuracy of Lake water level model by using of
time, balance model using time, monthly average of rainfall,
evaporation and discharge of lake (polynomial)
degree of
polynomial
RMSE NRMSE R2
Train Test Train Test Train Test
1st 0.191 0.196 0.094 0.098 0.831 0.816
2nd 0.138 0.141 0.068 0.070 0.912 0.905
3rd 0.110 0.114 0.054 0.057 0.943 0.938
4th 0.098 0.100 0.048 0.050 0.955 0.952
4.2 The second scenario
In the second scenario for preparing the model of Lake water
level, we used combination of polynomial along with the periodic
behavior method that used from sum of polynomial of periodic
signal in the time series. In the next step, the same way as the first
method 30% of the data did not enter to the equation and the
remaining 70% of data was used to calculations and then after
obtaining the results, we used the remainder data and compared
the results.
The first degree of polynomial+periodic behavior 𝐹(𝑡, 𝐵, 𝑇, 𝐷) = 𝑎1 + 𝑎2𝑡 + 𝑎3𝐵 + 𝑎4𝑇 + 𝑎5𝐷
+ 𝑏1 sin(𝜋𝑡) + 𝑏2 cos(𝜋𝑡)+ 𝑏3 sin(2𝜋𝑡) + 𝑏4 cos(2𝜋𝑡)+ 𝑏5 sin(4𝜋𝑡) + 𝑏6 cos(4𝜋𝑡)+ ⋯ + 𝑏25 sin(24𝜋𝑡)+ 𝑏26 cos(24𝜋𝑡)
(8)
The second degree of polynomial+periodic behavior 𝐹(𝑡, 𝐵, 𝑇, 𝐷) = 𝑎1 + 𝑎2𝑡 + 𝑎3𝐵 + 𝑎4𝑇 + 𝑎5𝐷 + 𝑎6𝑡2
+ 𝑎7𝐵2 + 𝑎8𝑇2 + 𝑎9𝐷2
+ 𝑎10𝑡𝐵 + 𝑎11𝑡𝑇 + 𝑎12𝑡𝐷+ 𝑎13𝐵𝑇 + 𝑎14𝐵𝐷 + 𝑎15𝑇𝐷+ 𝑏1 sin(𝜋𝑡) + 𝑏2 cos(𝜋𝑡)+ 𝑏3 sin(2𝜋𝑡) + 𝑏4 cos(2𝜋𝑡)+ ⋯ + 𝑏25 sin(24𝜋𝑡)+ 𝑏26 cos(24𝜋𝑡)
(9)
The third degree of polynomial+periodic behavior 𝐹(𝑡, 𝐵, 𝑇, 𝐷) = 𝑎1 + 𝑎2𝑡 + 𝑎3𝐵 + 𝑎4𝑇 + 𝑎5𝐷
+ 𝑎6𝑡2 + 𝑎7𝐵2 + 𝑎8𝑇2
+ 𝑎9𝐷2 + 𝑎10𝑡𝐵 + 𝑎11𝑡𝑇+ 𝑎12𝑡𝐷 + 𝑎13𝐵𝑇 + 𝑎14𝐵𝐷+ 𝑎15𝑇𝐷 + 𝑏1 sin(𝜋𝑡)+ 𝑏2 cos(𝜋𝑡) + 𝑏3 sin(2𝜋𝑡)+ 𝑏4 cos(2𝜋𝑡) + ⋯+ 𝑏23 sin(22𝜋𝑡)+ 𝑏24 cos(22𝜋𝑡)+ 𝑏25 sin(24𝜋𝑡)+ 𝑏26 cos(24𝜋𝑡)
(10)
The forth degree of polynomial+periodic behavior 𝐹(𝑡, 𝐵, 𝑇, 𝐷) = 𝑎1 + 𝑎2𝑡 + 𝑎3𝐵 + 𝑎4𝑇 + 𝑎5𝐷
+ 𝑎6𝑡2 + 𝑎7𝐵2 + 𝑎8𝑇2
+ 𝑎9𝐷2 + 𝑎16𝑡3 + 𝑎17𝐵3
+ 𝑎18𝑇3 + 𝑎19𝐷3 + ⋯+ 𝑎69𝐵𝑇𝐷2 + 𝑎70𝑡𝐵𝑇𝐷+ 𝑏1 sin(𝜋𝑡) + 𝑏2 cos(𝜋𝑡)+ 𝑏3 sin(2𝜋𝑡) + 𝑏4 cos(2𝜋𝑡)+ 𝑏5 sin(4𝜋𝑡) + ⋯+ 𝑏25 sin(24𝜋𝑡)+ 𝑏26 cos(24𝜋𝑡)
(11)
Results of fitting of formula 8 through 11 respectively are
shown in Figures 13 to 16.
Figure 13: The regression graph of 1st degree polynomial +
periodic behavior
Figure 14: The regression graph of 2nd degree polynomial +
periodic behavior
Figure 15: The regression graph of 3rd degree polynomial +
periodic behavior
Figure 18: The regression graph of 4th degree polynomial +
periodic behavior
The International Archives of the Photogrammetry, Remote Sensing and Spatial Information Sciences, Volume XLII-4/W4, 2017 Tehran's Joint ISPRS Conferences of GI Research, SMPR and EOEC 2017, 7–10 October 2017, Tehran, Iran
This contribution has been peer-reviewed. https://doi.org/10.5194/isprs-archives-XLII-4-W4-5-2017 | © Authors 2017. CC BY 4.0 License.
8

The values of statistical parameters for second scenario were
shown in Table3.
Table 3: Estimate accuracy of Lake water level model by using of
time, balance model using time, monthly average of rainfall,
evaporation and discharge of lake (polynomial +periodic behavior)
degree of
polynomial
+ periodic behavior
RMSE NRMSE R2
Train Test Train Test Train Test
1st 0.07 0.07 0.03 0.03 0.97 0.97
2nd 0.04 0.043 0.02 0.02 0.99 0.99
3rd 0.03 0.03 0.01 0.01 0.99 0.99
4th 0.02 0.02 0.01 0.01 0.99 0.99
5. CONCLUSION
In order to increase the accuracy of estimate results of the time
series in different applications, approximation and the correct
analysis is the essential. In this study, a method called
multivariate analysis, for modeling the lake level changes due to
changing hydrological parameters affecting it were presented.
Since we already did not know the integrity of our data in real
time series, so to ensure that the method was correctness, we
render the number of data and used remaining observations data
on annual period and was used during the period of 1 years and
once again we used multivariate analysis and at the next time we
used combination of multivariate analysis along with periodic
behavior. At the first multivariate analysis was used to modeling
the changes of Lake water level and results were presented
separately for the four time series. At the next time we used the
combination method of multivariate analysis along with periodic
behaviour on observation data. The results of the calculations
show that the use of general two models of multivariate analysis
and combined with periodic behavior in all conditions listed,
using combination multivariate analysis with periodic behavior
was raised the accuracy of modeling. In the multivariate analysis
method, accuracy of modeling was accomplishment about 9cm
and with combination of multivariate analysis and periodic
behavior method, the accuracy was raised to 3cm. The main
objective of this study was to test multivariate analysis with
periodic behavior according to the results, the test was successful
and the results have been more complete.
6. REFERENCES
Abbaspour, M. & Nazaridoust, A., 2007. Determination of
environmental water requirement of Lake Urmia, Iran: an
ecological approach. International Journal of Environmental
Studies, Volume 64 (2), pp. 161-169.
Astushi, U., Masaki T. and Yoshio I., 2004. Lake – level changes
during the past 100000 Years at Lake Baikal, Southern Siberian,
Quaternary research, and 62: 214-222.
Beatly, T. Brower, DJ. & Schwab AK., 2002. An introduction to
coastal zone management. Second edition, Island Press: 1-329.
Carmen, CJ. Herrero, MA. Casterad, 2005. Landsat monitoring
of playa-lake in the Spanish Monegros desert, Journal of Arid
Environments 63:497-516.
Dolan, R., Fenster, M.S., Holme, S.J., 1991. Temporal analysis
of shoreline recession and accretion. Journal of Coast research
7(3): 723-744.
Douglas, B.C., Crowell, M., 2000. Long- term shoreline position
prediction and error propagation. Journal of Coast research 16(1):
145-152.
Emamifar, A., & Mohebbi, F., 2007. Urmia Lake (Northwest
Iran): a brief review. Saline Systems, 3(5).
Ebdon, D., 1985. Statistics in Geography: a practical approach,
second edition, BlackwellPublishing: 1-230.
Ecersin, E., Ormeci, C., 2010. Evaluates climate change effects
on water and salt resources in salt lake, Turkey using
multitemporal SPOT imagery, Environ Monit Assess, 163: 361-
368.
Google Earth, 2012. [Online] Urmia Lake 37°00' to 38°12' N,
44°40' to 45°50'E Available at:
http://maps.google.se/maps?hl=sv&bav=on.2,or.r_gc.r_pw.r_qf.
&biw=1366&bih=673&wrapid
=tlif134902120274310&q=urmia+lake&um=1&ie=UTF-
8&hq=&hnear=0x401ab691484226e9:0xa3bcb751ad9dec7a,La
ke+Urmia&gl=se&sa=X&ei=IG
5oUM_AN7SK4gSkpoCoCA&ved=0CD0Q8gEwAw
[Accessed 20 September 2012].
Hassanzandeh, E., Zarghami, M. & Hassanzadeh, Y., 2011.
Determining the Main Factors in Declining the Urmia Lake Level
by Using Dynamics Modelling. Water Resources Management,
26(1), pp.129-145, doi: 10.1007/s11269-011-9909-8.
Ghaheri, M., Baghal-Vayjooee, M.H. & Naziri, J., 1999. Lake
Urmia, Iran: A summary Review. International Journal of Salt
Lake Research, 8, pp.19-22
Hesari, B., Tayefeh, N.N. 2010. Investigation of Urmia Lake
level changes and its relation with Caspian Sea level changes and
Van Lakes in Turkey and area climate factors, the secondary of
national congress environmental crisis of Urmia Lakes,
Naghadeh Payam Noor University: 1-14.
Johnson, RA. & Wichern Dean, W., 1988. Applied multivariate
statistical analysis, Prentice Hall International Inc.
Liu, H. Jezek, KC. 2004. Automated of coastline imagery by
integrating canny edgy detection and locally adaptive
thresholding methods. International journal remote Sensing
25(5):937-958.
Rasuli, AA., Abasian, Sh., Jahanbakhsh, S., 2008. Monitoring of
Urmia Lake level fluctuation by multispectral and multi temporal
satellite images process, Modarres Journal of human sciences, 2:
53-71
UNESCO, 2001. MAB Biosphere Reserves Directory, Lake
Oromeeh. [Online] Available at:
http://www.unesco.org/mabdb/br/brdir/directory/biores.asp?cod
e=IRA+07&mode=all [Accessed 18 September 2012].
UNESCO, 2012. Global list of Biosphere reserves. [Online]
Available at:
http://www.unesco.org/new/fileadmin/MULTIMEDIA/HQ/SC/
pdf/sc_mab_BR2012.pdf [Accessed 18 September 2012].
West Azerbaijan Regional Water Authority, 2012a. [Online]
Available at: http://www.agrw.ir/Farsi/AreaF.asp?Id=3
[Accessed 16 September 2012].
West Azerbaijan Regional Water Authority, 2012b. [Online]
Available at: http://www.agrw.ir/Farsi/UsageF.asp?Id=5
[Accessed 29 September 2012].
Waiser, M.J. and Robarts R.D., 2009. Saline Inland Waters, In
Encyclopedia of Inland Waters, edited by Gene E. Likens,
Academic Press, Oxford, Pages 634-644.
Comperhensive management plan for the Lake, 2010. Developed
in collaboration with government agencies, environmental
organizations and local communities: 1-75.
The International Archives of the Photogrammetry, Remote Sensing and Spatial Information Sciences, Volume XLII-4/W4, 2017 Tehran's Joint ISPRS Conferences of GI Research, SMPR and EOEC 2017, 7–10 October 2017, Tehran, Iran
This contribution has been peer-reviewed. https://doi.org/10.5194/isprs-archives-XLII-4-W4-5-2017 | © Authors 2017. CC BY 4.0 License.
9