Climate Extremes and Disaster Risk Reduction · PDF fileClimate Extremes and Disaster Risk...
51
Climate Extremes and Disaster Risk Reduction Joy Jacqueline Pereira 1 , Norhisham bin Kamarudin 2 & Mohd Ariff bin Baharom 2 1 Southeast Asia Disaster Prevention Research Initiative Universiti Kebangsaan Malaysia (SEADPRI-UKM) 2 National Security Council, Prime Minister’s Department
Transcript of Climate Extremes and Disaster Risk Reduction · PDF fileClimate Extremes and Disaster Risk...

Climate Extremes
and Disaster Risk Reduction
Joy Jacqueline Pereira1, Norhisham bin Kamarudin2
& Mohd Ariff bin Baharom2
1Southeast Asia Disaster Prevention Research Initiative
Universiti Kebangsaan Malaysia (SEADPRI-UKM)2National Security Council, Prime Minister’s Department
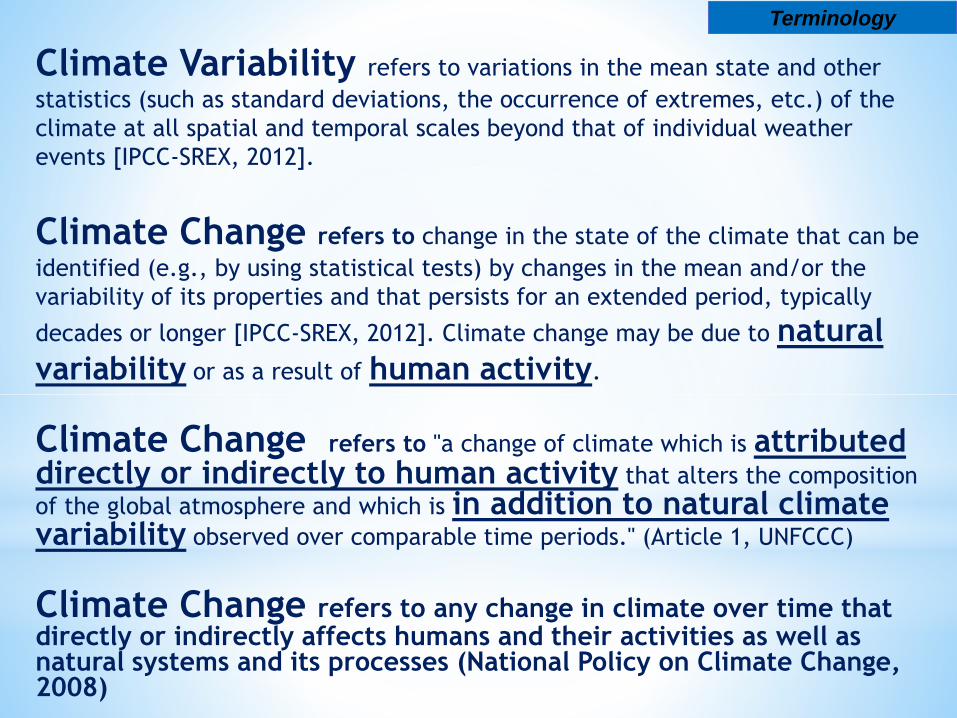
Climate Variability refers to variations in the mean state and other
statistics (such as standard deviations, the occurrence of extremes, etc.) of the
climate at all spatial and temporal scales beyond that of individual weather
events [IPCC-SREX, 2012].
Climate Change refers to change in the state of the climate that can be
identified (e.g., by using statistical tests) by changes in the mean and/or the
variability of its properties and that persists for an extended period, typically
decades or longer [IPCC-SREX, 2012]. Climate change may be due to natural
variability or as a result of human activity.
Climate Change refers to "a change of climate which is attributed directly or indirectly to human activity that alters the composition
of the global atmosphere and which is in addition to natural climate variability observed over comparable time periods." (Article 1, UNFCCC)
Climate Change refers to any change in climate over time that directly or indirectly affects humans and their activities as well as natural systems and its processes (National Policy on Climate Change, 2008)
Terminology
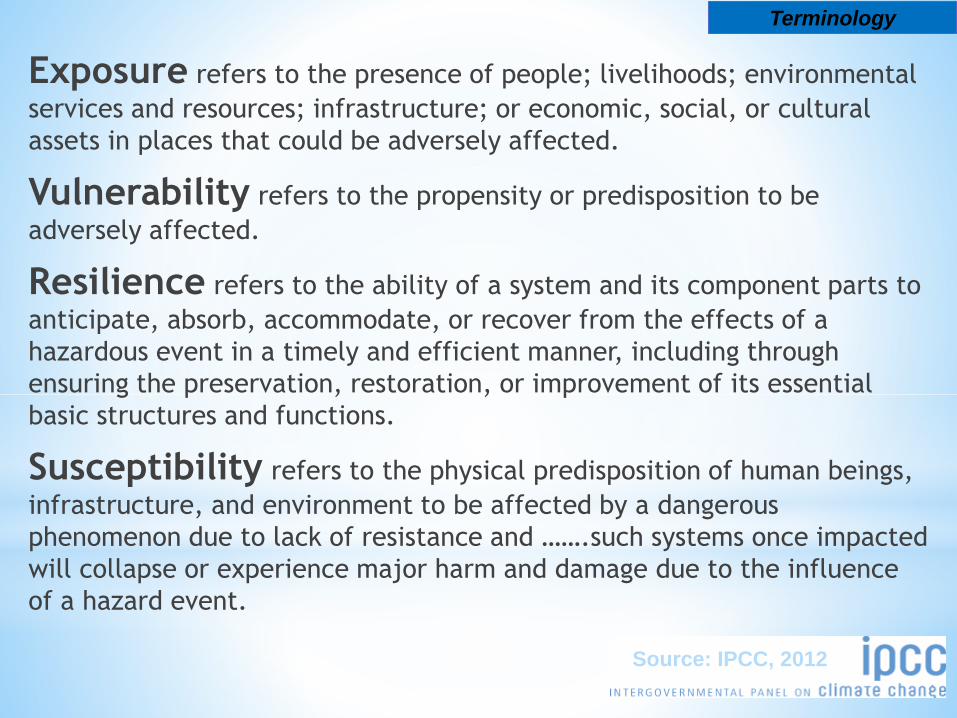
Exposure refers to the presence of people; livelihoods; environmental
services and resources; infrastructure; or economic, social, or cultural
assets in places that could be adversely affected.
Vulnerability refers to the propensity or predisposition to be
adversely affected.
Resilience refers to the ability of a system and its component parts to
anticipate, absorb, accommodate, or recover from the effects of a
hazardous event in a timely and efficient manner, including through
ensuring the preservation, restoration, or improvement of its essential
basic structures and functions.
Susceptibility refers to the physical predisposition of human beings,
infrastructure, and environment to be affected by a dangerous
phenomenon due to lack of resistance and …….such systems once impacted
will collapse or experience major harm and damage due to the influence
of a hazard event.
Terminology
Source: IPCC, 2012

There is evidence that some extremes have changed as a result of
anthropogenic influences, including increases in atmospheric concentrations of
greenhouse gases. It is likely that anthropogenic influences have led to
warming of extreme daily minimum and maximum temperatures at the global
scale. There is medium confidence that anthropogenic influences have contributed
to intensification of extreme precipitation at the global scale. It is likely that there
has been an anthropogenic influence on increasing extreme coastal
high water due to an increase in mean sea level. The uncertainties in the
historical tropical cyclone records, the incomplete understanding of the physical
mechanisms linking tropical cyclone metrics to climate change, and the degree of
tropical cyclone variability provide only low confidence for the attribution of any
detectable changes in tropical cyclone activity to anthropogenic influences.
Attribution of single extreme events to anthropogenic climate
change is challenging. [3.2.2, 3.3.1, 3.3.2, 3.4.4, 3.5.3, Table 3-1]
Attribution of Extreme Events
Source: IPCC, 2012
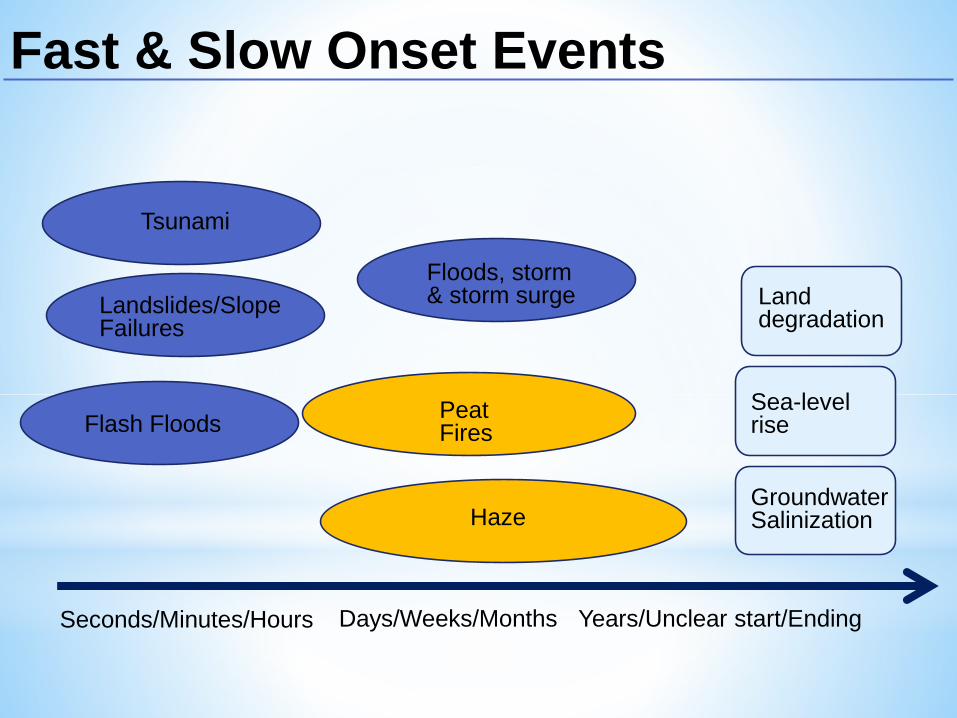
Tsunami
Groundwater Salinization
Land degradation
Sea-level rise
Landslides/Slope Failures
Flash Floods
Floods, storm& storm surge
Haze
Peat Fires
Seconds/Minutes/Hours Days/Weeks/Months Years/Unclear start/Ending
Fast & Slow Onset Events
6
7
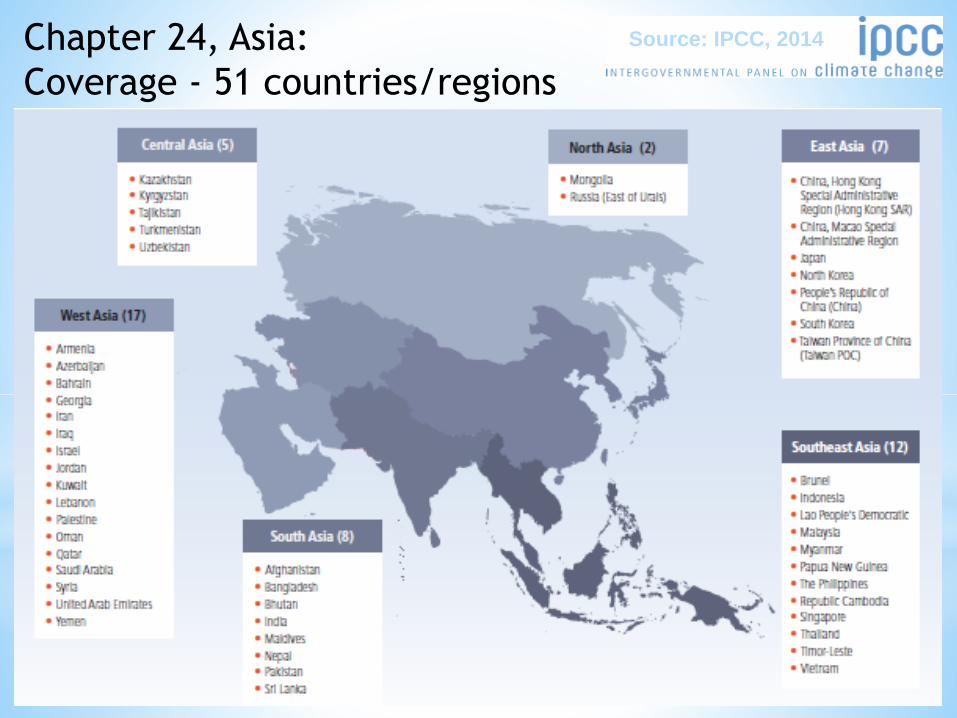
Chapter 24, Asia:
Coverage - 51 countries/regions
Source: IPCC, 2014

Source: IPCC, 2014Chapter 24, Asia:
Observed and projected changes
in annual average temperature in Asia
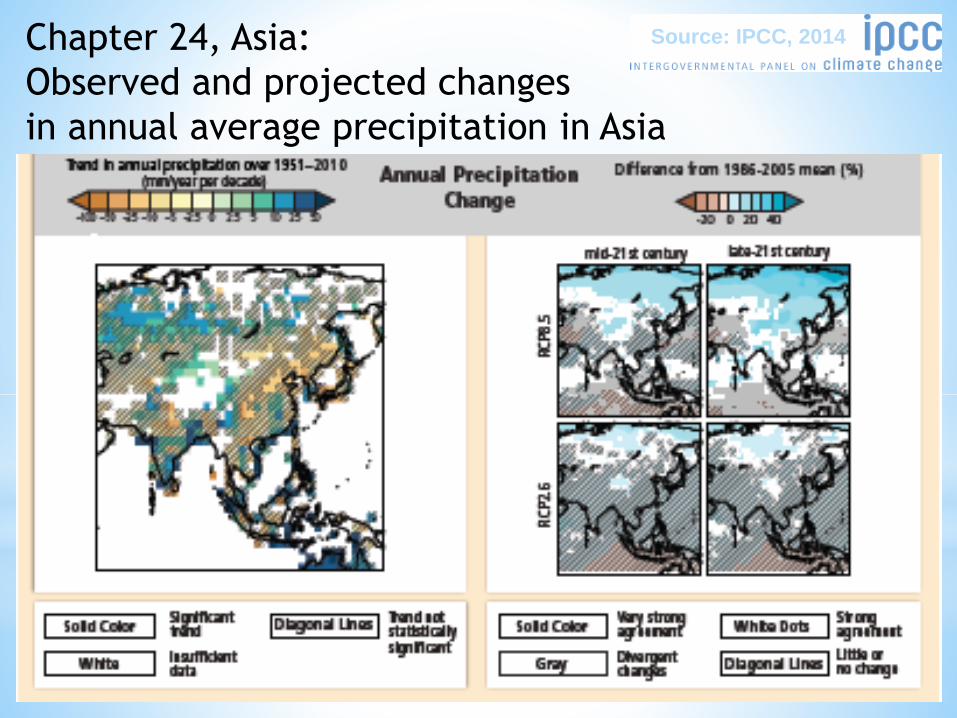
Source: IPCC, 2014Chapter 24, Asia:
Observed and projected changes
in annual average precipitation in Asia
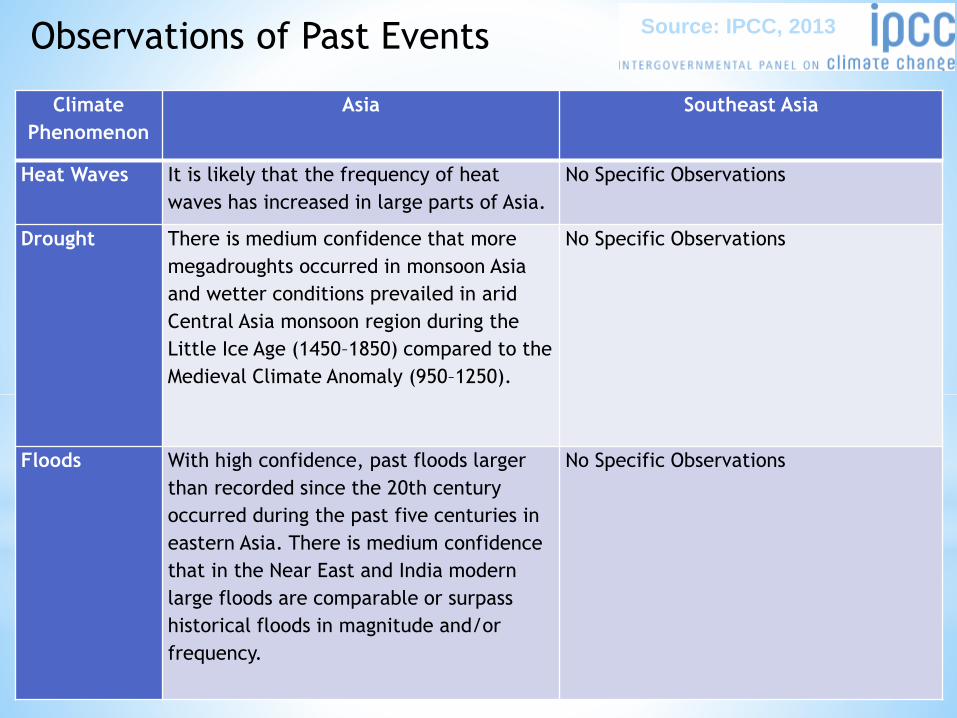
Climate
Phenomenon
Asia Southeast Asia
Heat Waves It is likely that the frequency of heat
waves has increased in large parts of Asia.
No Specific Observations
Drought There is medium confidence that more
megadroughts occurred in monsoon Asia
and wetter conditions prevailed in arid
Central Asia monsoon region during the
Little Ice Age (1450–1850) compared to the
Medieval Climate Anomaly (950–1250).
No Specific Observations
Floods With high confidence, past floods larger
than recorded since the 20th century
occurred during the past five centuries in
eastern Asia. There is medium confidence
that in the Near East and India modern
large floods are comparable or surpass
historical floods in magnitude and/or
frequency.
No Specific Observations
Observations of Past Events Source: IPCC, 2013
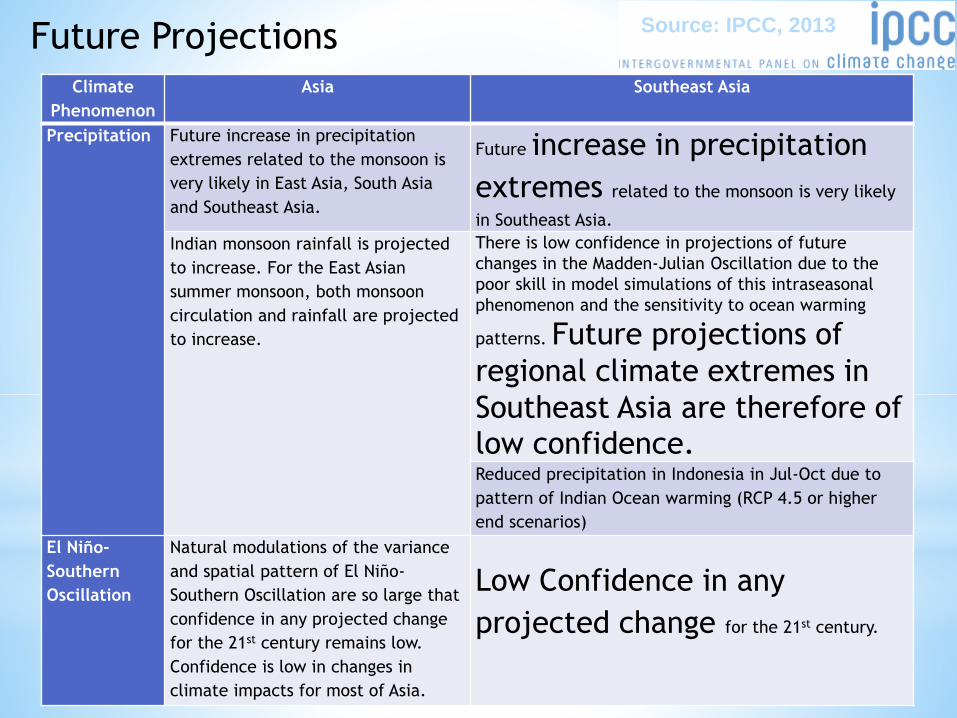
Climate
Phenomenon
Asia Southeast Asia
Precipitation Future increase in precipitation
extremes related to the monsoon is
very likely in East Asia, South Asia
and Southeast Asia.
Future increase in precipitation
extremes related to the monsoon is very likely
in Southeast Asia.
Indian monsoon rainfall is projected
to increase. For the East Asian
summer monsoon, both monsoon
circulation and rainfall are projected
to increase.
There is low confidence in projections of future
changes in the Madden-Julian Oscillation due to the
poor skill in model simulations of this intraseasonal
phenomenon and the sensitivity to ocean warming
patterns. Future projections of
regional climate extremes in
Southeast Asia are therefore of low confidence.Reduced precipitation in Indonesia in Jul-Oct due to
pattern of Indian Ocean warming (RCP 4.5 or higher
end scenarios)
El Niño-
Southern
Oscillation
Natural modulations of the variance
and spatial pattern of El Niño-
Southern Oscillation are so large that
confidence in any projected change
for the 21st century remains low.
Confidence is low in changes in
climate impacts for most of Asia.
Low Confidence in any
projected change for the 21st century.
Future Projections Source: IPCC, 2013
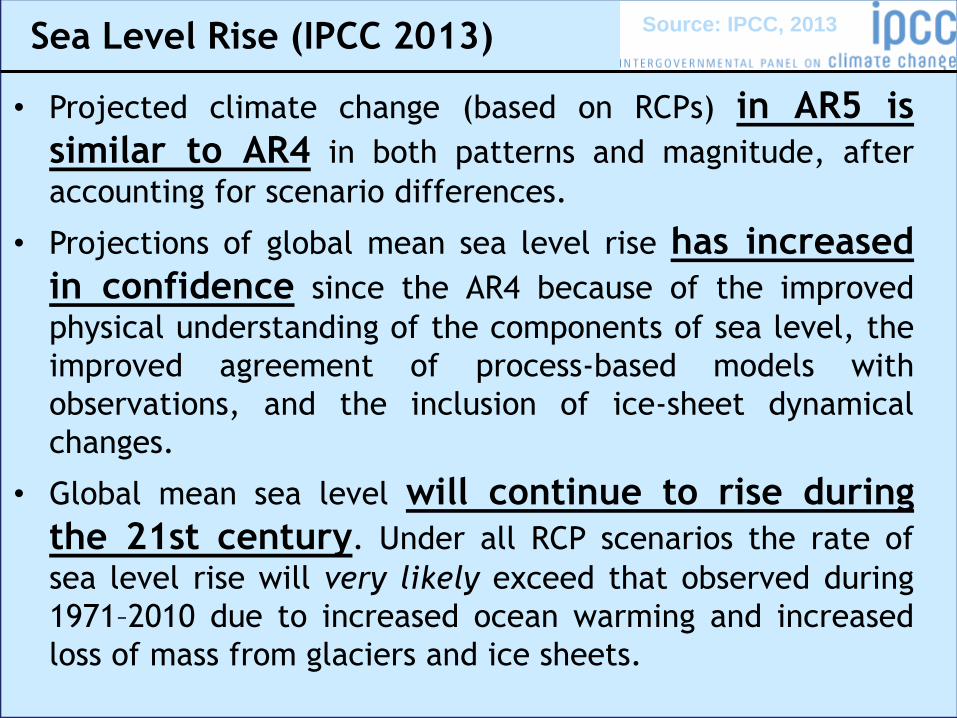
• Projected climate change (based on RCPs) in AR5 is
similar to AR4 in both patterns and magnitude, after
accounting for scenario differences.
• Projections of global mean sea level rise has increased
in confidence since the AR4 because of the improved
physical understanding of the components of sea level, the
improved agreement of process-based models with
observations, and the inclusion of ice-sheet dynamical
changes.
• Global mean sea level will continue to rise during
the 21st century. Under all RCP scenarios the rate of
sea level rise will very likely exceed that observed during
1971–2010 due to increased ocean warming and increased
loss of mass from glaciers and ice sheets.
Sea Level Rise (IPCC 2013) Source: IPCC, 2013
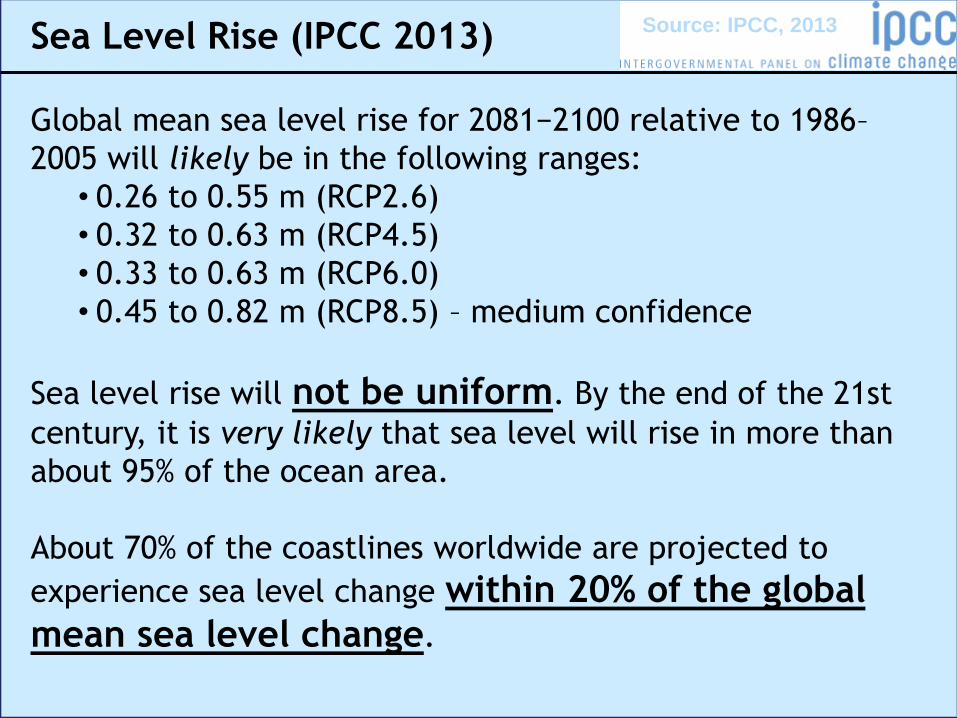
Global mean sea level rise for 2081−2100 relative to 1986–
2005 will likely be in the following ranges:
• 0.26 to 0.55 m (RCP2.6)
• 0.32 to 0.63 m (RCP4.5)
• 0.33 to 0.63 m (RCP6.0)
• 0.45 to 0.82 m (RCP8.5) – medium confidence
Sea level rise will not be uniform. By the end of the 21st
century, it is very likely that sea level will rise in more than
about 95% of the ocean area.
About 70% of the coastlines worldwide are projected to
experience sea level change within 20% of the global
mean sea level change.
Sea Level Rise (IPCC 2013) Source: IPCC, 2013
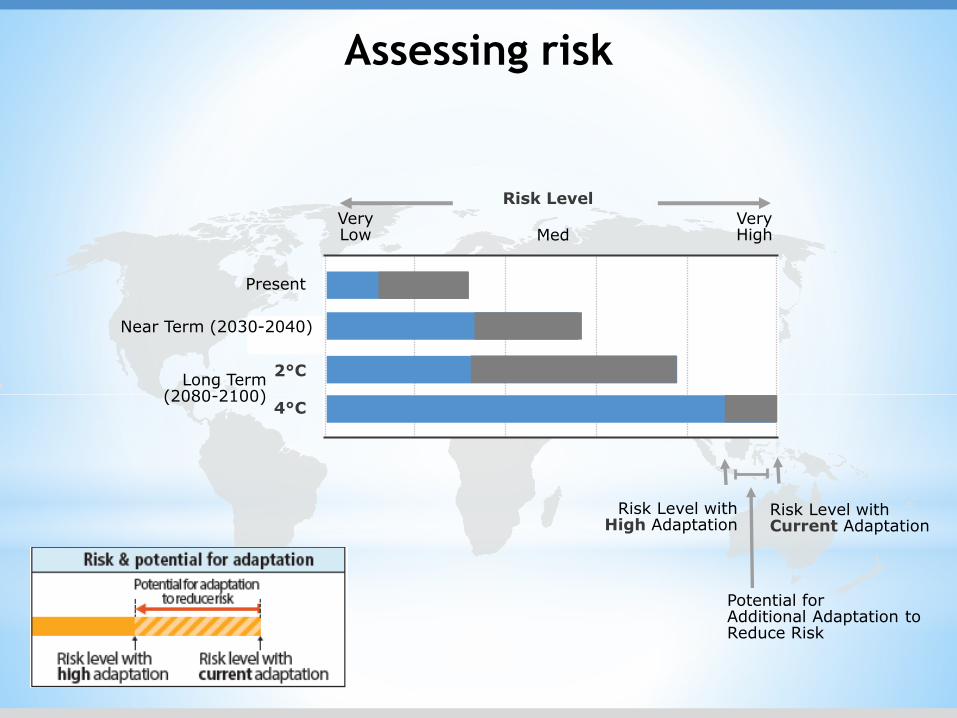
Risk Level withCurrent Adaptation
Risk Level
VeryLow Med
VeryHigh
4°C
2°C
Present
Long Term(2080-2100)
Near Term (2030-2040)
Assessing risk
Potential forAdditional Adaptation to Reduce Risk
Risk Level withHigh Adaptation
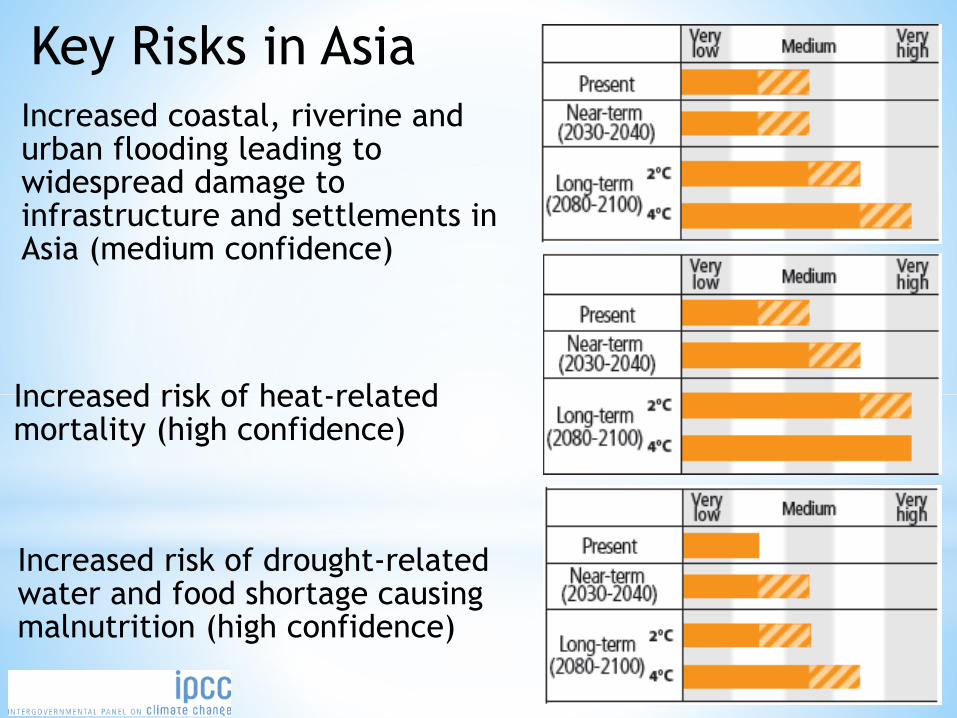
Increased coastal, riverine and urban flooding leading to widespread damage to infrastructure and settlements in Asia (medium confidence)
Increased risk of heat-related mortality (high confidence)
Increased risk of drought-related water and food shortage causing malnutrition (high confidence)
Key Risks in Asia
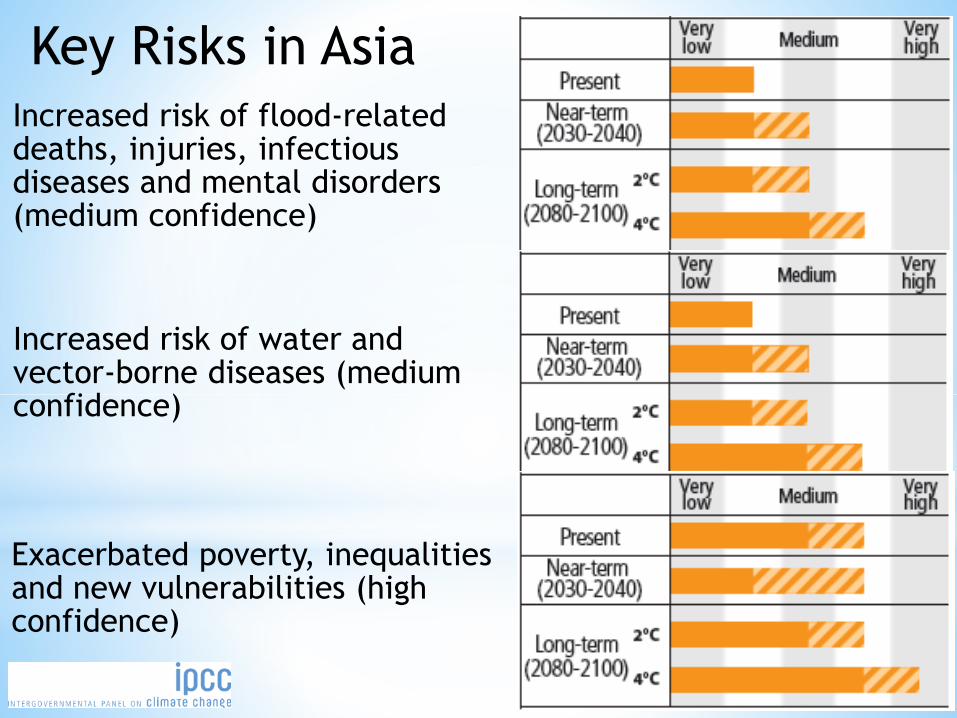
Exacerbated poverty, inequalities and new vulnerabilities (high confidence)
Increased risk of flood-related deaths, injuries, infectious diseases and mental disorders (medium confidence)
Increased risk of water and vector-borne diseases (medium confidence)
Key Risks in Asia
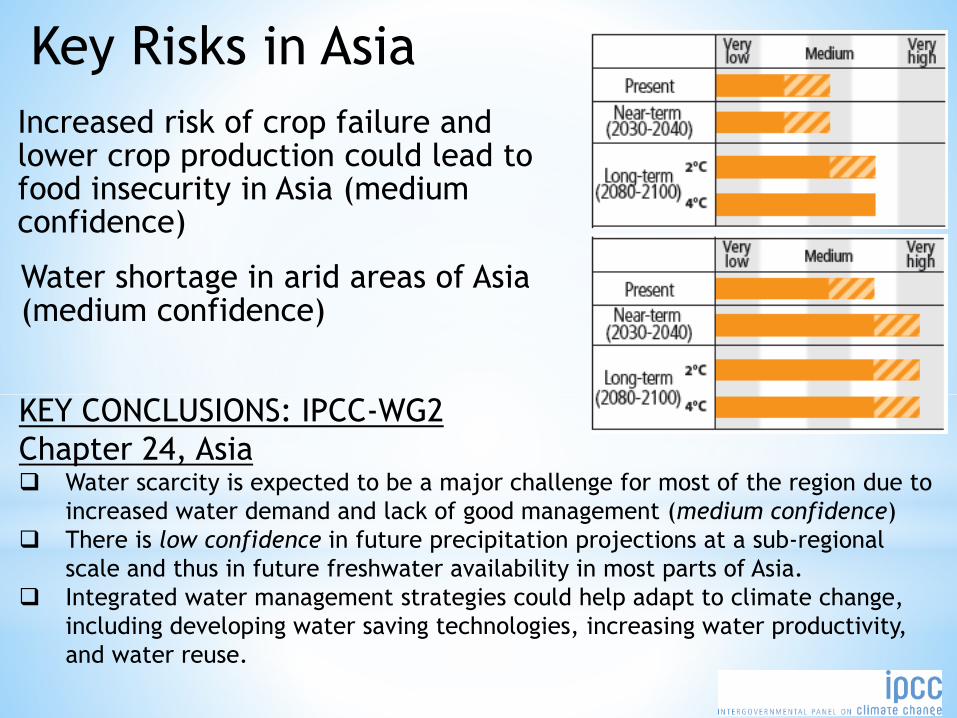
Increased risk of crop failure and lower crop production could lead to food insecurity in Asia (medium confidence)
Key Risks in Asia
Water shortage in arid areas of Asia (medium confidence)
KEY CONCLUSIONS: IPCC-WG2
Chapter 24, Asia Water scarcity is expected to be a major challenge for most of the region due to
increased water demand and lack of good management (medium confidence)
There is low confidence in future precipitation projections at a sub-regional
scale and thus in future freshwater availability in most parts of Asia.
Integrated water management strategies could help adapt to climate change,
including developing water saving technologies, increasing water productivity,
and water reuse.
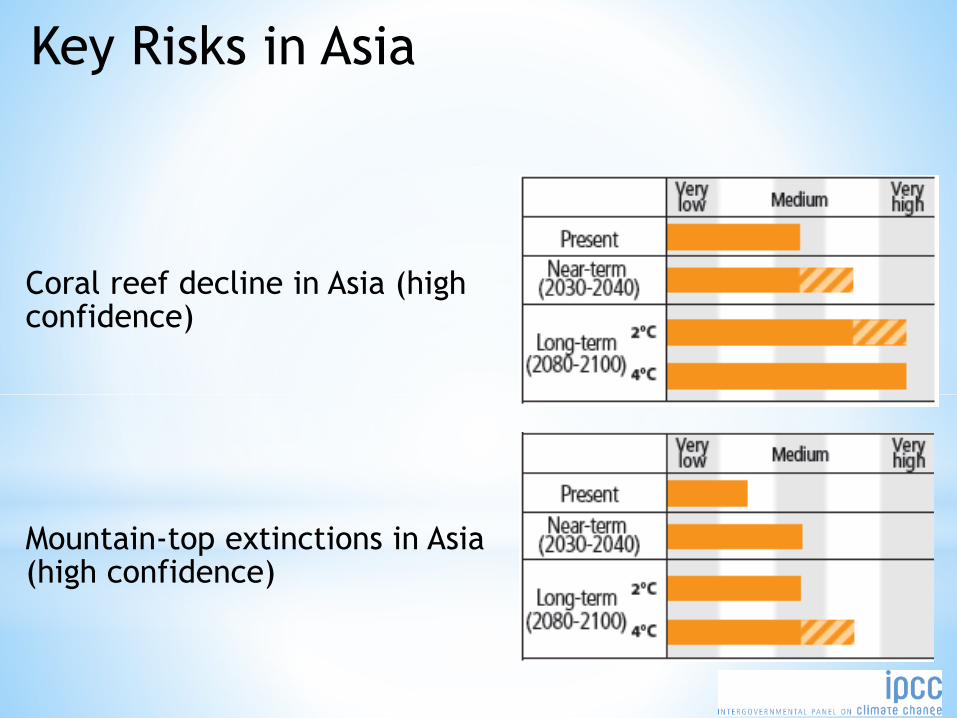
Mountain-top extinctions in Asia (high confidence)
Coral reef decline in Asia (high confidence)
Key Risks in Asia
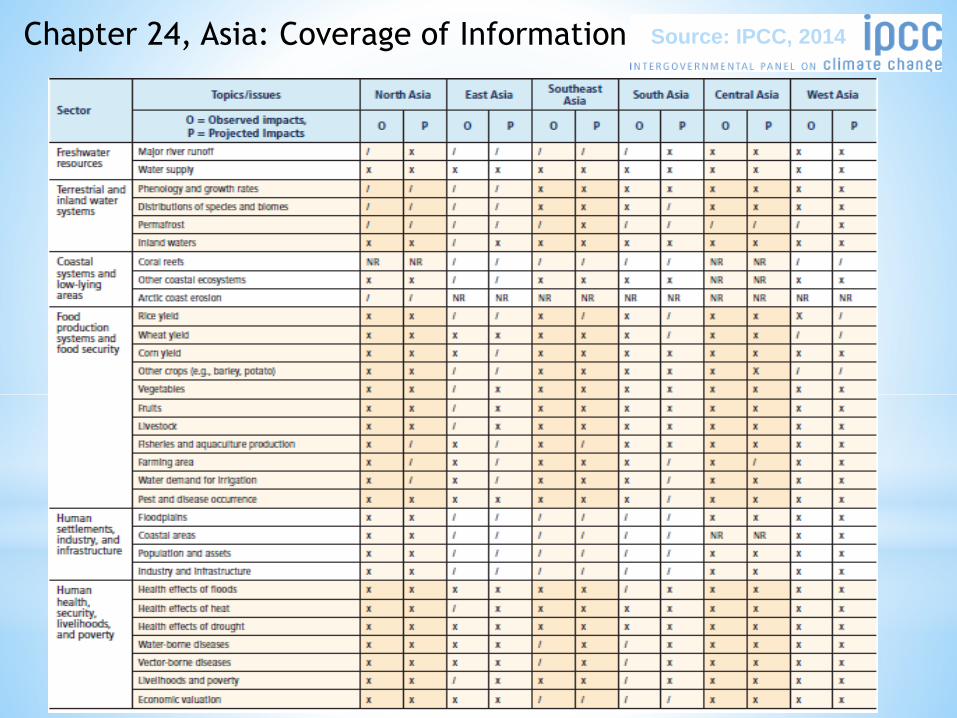
Chapter 24, Asia: Coverage of Information Source: IPCC, 2014
*
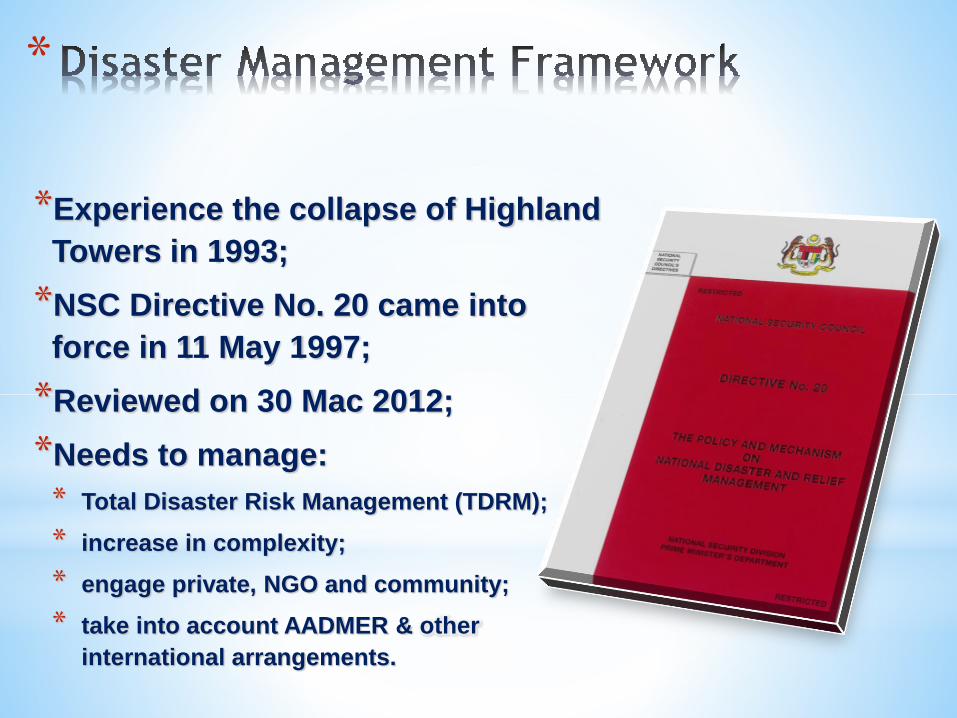
*Experience the collapse of Highland
Towers in 1993;
*NSC Directive No. 20 came into
force in 11 May 1997;
*Reviewed on 30 Mac 2012;
*Needs to manage:
* Total Disaster Risk Management (TDRM);
* increase in complexity;
* engage private, NGO and community;
* take into account AADMER & other
international arrangements.
*
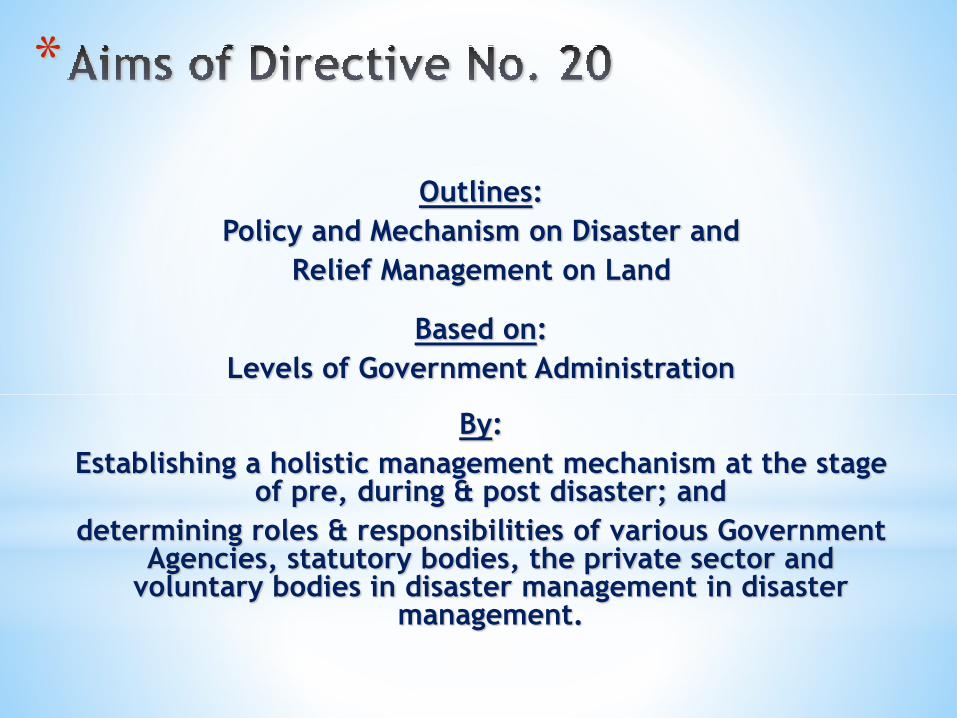
Outlines:
Policy and Mechanism on Disaster and
Relief Management on Land
Based on:
Levels of Government Administration
By:
Establishing a holistic management mechanism at the stage of pre, during & post disaster; and
determining roles & responsibilities of various Government Agencies, statutory bodies, the private sector and
voluntary bodies in disaster management in disaster management.

*
MAKING DISASTER RISK REDUCTION A PRIORITY
• Legal framework and policy
• Mainstreaming Disaster Risk Reduction into the Development Policy, Planning and Implementation
IDENTIFYING, ASSESSING AND MONITORING RISK AND ENHANCING EARLY WARNING
• Risk Mapping
•Early Warning and Disseminations
BUILDING A CULTURE OF RESILIENCE TO DISASTERS THROUGH AWARENESS, EDUCATION AND TRAINING
• Public Awareness Program
REDUCING RISK IN KEY SECTORS
• Environmental Management and Climate Change Adaptation
STRENGTHENING DISASTER PREPAREDNESS FOR EFFECTIVE RESPONSE
• Capacity Building and Assets Enhancement
*

* ASEAN AGREEMENT ON DISASTER MANAGEMENT
AND DISASTER RESPONSE (AADMER)
Signed in July 2005, ratified by all ten (10) ASEAN
Member Countries, entered into force on 24
December 2009
Objective: Reduce disaster losses in ASEANregion, and jointly respond to disasteremergencies
ASEAN Coordinating Centre for HumanitarianAssistance on disaster management (AHA Centre)as the operational coordination body and engineof AADMER
A legal framework for all ASEAN Member States
and serves as a common platform in responding
to disasters within ASEAN
ASEAN Agreement on Disaster Management and
Emergency Response
*Central and State Governments through their
respective agencies are responsible to allocate
funds for the purpose of Disaster management
and Disaster Risk Reduction;
*Donation drives for a specific disaster may
channel financial contribution to the National
Disaster Relief Trust Fund (NDRTF).
*RMK-11 – special allocation for DRR
adminsitered by the National Security Council
*
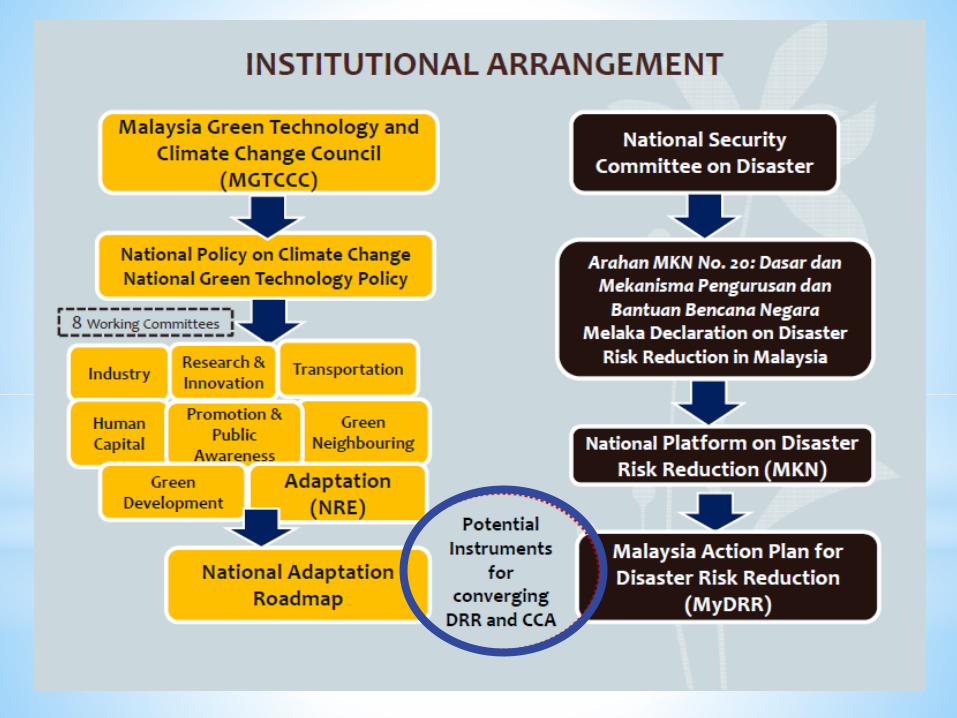
NATIONAL PLATFORM AND ACTION PLAN FOR
DISASTER RISK REDUCTION (MyDRR)
The National Security Council (MKN) of the Prime Minister’s Department is entrusted with the responsibility of ensuring the effectiveness of the disaster management mechanisms in the country as mandated by MKN Directive 20.
MKN is formalising existing arrangements for DRR and expanding the array of stakeholders through establishment of the National Platform on DRR, which was announced in 2013.
The National Action Plan for DRR (MyDRR) is now undergoing stakeholder consultation. Formal workshops have been held with government agencies, non-government organisations and the private sector.
GOALTowards Sustainable Development and Resilient Communities though Disaster Risk Reduction
OBJECTIVES Mainstreaming DRR in national development;
Enhancing capacity for holistic and effective disaster management at all levels;
Strengthening monitoring systems, early warning and information dissemination on disasters; and
Developing a culture of resilience to current and emerging hazards and disasters at the community level.
NATIONAL ACTION PLAN FOR DISASTER RISK
REDUCTION (MyDRR)

MyDRR – KEY ACTION AREAS
Formulation and implementation of laws related to disaster management;
Integration of risk reduction measures in the development agenda at all levels;
Assessment of hazards and risks
Infrastructure for disaster mitigation and early warning systems;
Disaster preparedness at all levels;
Disaster response mechanisms;
Disaster Recovery and Reconstruction

Natural HazardsMALAYSIA
Climatic Origins
Geological
Origins
DISASTER TYPES
FLOODS
LANDSLIDES
STORMS
STRONG WINDS
Disaster DateNo. Total AffectedPeople (1990-2013)
Flood 3/12/1965 300,000
Flood Jan-1967 243,000
Flood 26/12/1970 140,000
Flood 28/11/1986 25,000
Flood 12/11/1988 60,000
Flood 6/11/1988 40,000
Flood 23/11/2005 30,000
Flood 19/12/2006 100,000
Flood 11/1/2007 137,533
Flood 7/12/2007 29,000
Natural hazards in Malaysia
are influenced by climatic
factorsSource: http://www.emdat.be/result-country-profile
NATURAL HAZARDS IN MALAYSIA
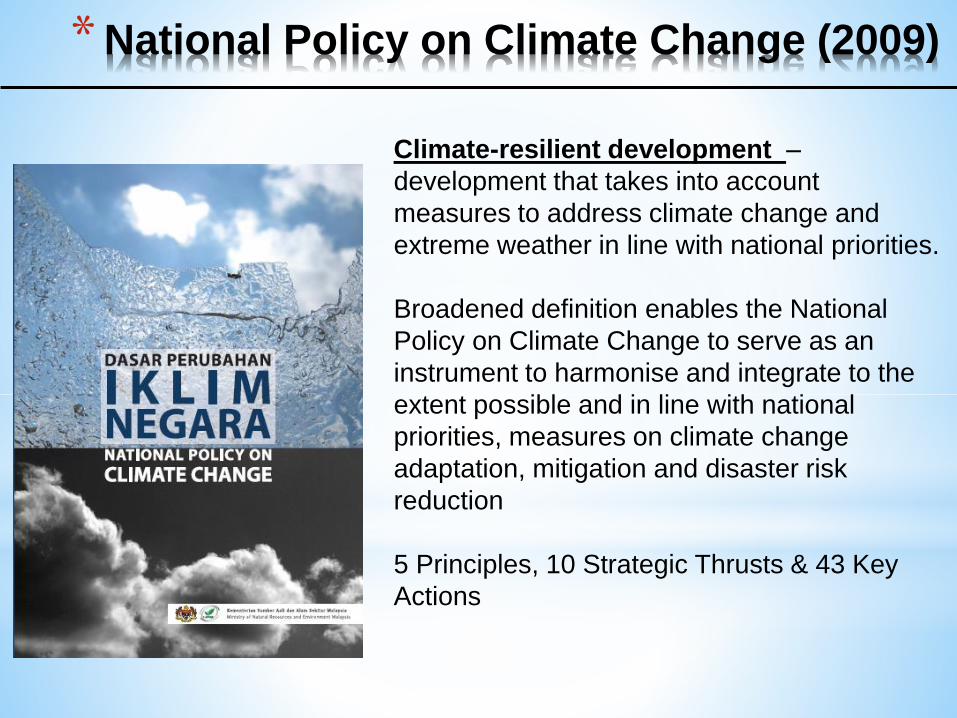
*National Policy on Climate Change (2009)
Climate-resilient development –
development that takes into account
measures to address climate change and
extreme weather in line with national priorities.
Broadened definition enables the National
Policy on Climate Change to serve as an
instrument to harmonise and integrate to the
extent possible and in line with national
priorities, measures on climate change
adaptation, mitigation and disaster risk
reduction
5 Principles, 10 Strategic Thrusts & 43 Key
Actions
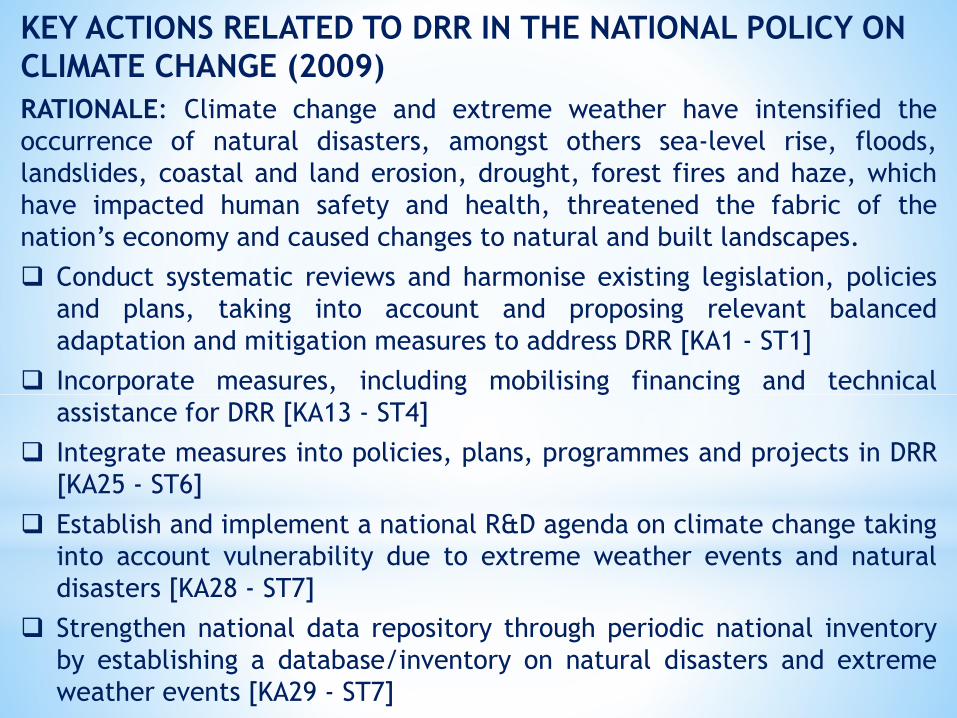
KEY ACTIONS RELATED TO DRR IN THE NATIONAL POLICY ON
CLIMATE CHANGE (2009)
RATIONALE: Climate change and extreme weather have intensified the
occurrence of natural disasters, amongst others sea-level rise, floods,
landslides, coastal and land erosion, drought, forest fires and haze, which
have impacted human safety and health, threatened the fabric of the
nation’s economy and caused changes to natural and built landscapes.
Conduct systematic reviews and harmonise existing legislation, policies
and plans, taking into account and proposing relevant balanced
adaptation and mitigation measures to address DRR [KA1 - ST1]
Incorporate measures, including mobilising financing and technical
assistance for DRR [KA13 - ST4]
Integrate measures into policies, plans, programmes and projects in DRR
[KA25 - ST6]
Establish and implement a national R&D agenda on climate change taking
into account vulnerability due to extreme weather events and natural
disasters [KA28 - ST7]
Strengthen national data repository through periodic national inventory
by establishing a database/inventory on natural disasters and extreme
weather events [KA29 - ST7]

*
Recognising the changing nature of disaster risk in the country due to climate variability and change
To promote the use of technology in support of early warning, multi-hazards risk assessment, and climate modelling and downscaling.
To strengthen local capacity to integrate climate and disaster risk into local development planning
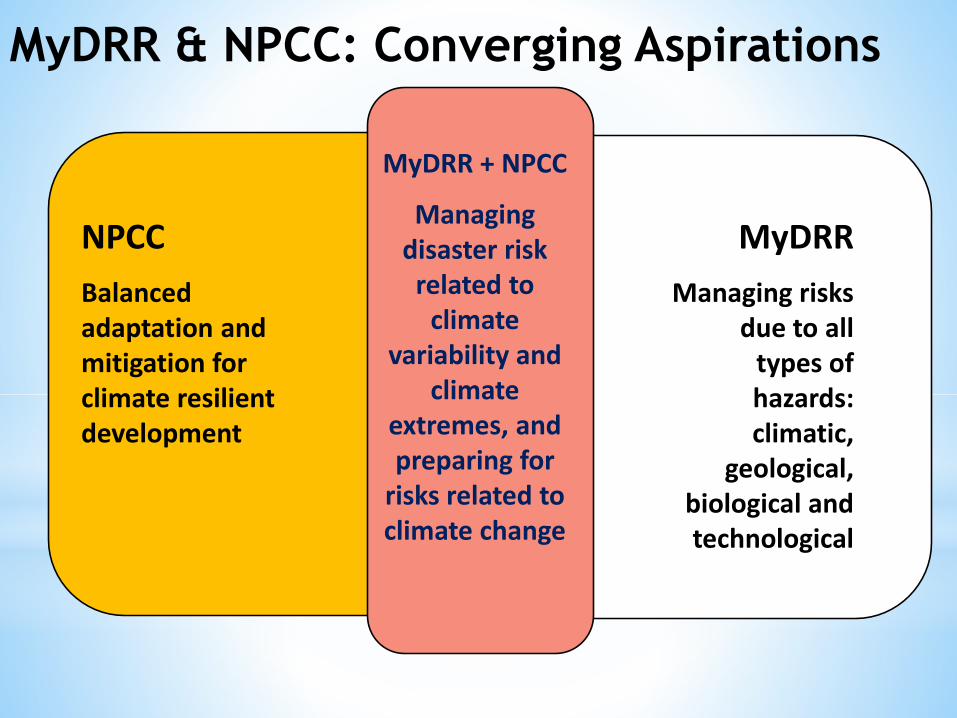
MyDRR
Managing risks due to all
types of hazards: climatic,
geological, biological and technological
NPCC
Balanced adaptation and mitigation for climate resilient development
MyDRR + NPCC
Managing disaster risk
related to climate
variability and climate
extremes, and preparing for
risks related to climate change
MyDRR & NPCC: Converging Aspirations
Integrating DRR, CCA and L+D
SEADPRI-UKM, IGES, IMHEN, RUPP & MCCW
0
2
4
6
8
10
12
14
16
18
20
Jan
Mac
May
July
Sept
Nov
Jan
Mac
May
July
Sept
Nov
Jan
Mac
May
July
Sept
Nov
Jan
Mac
May
July
Sept
Nov
Jan
Mac
May
July
Sept
Nov
Jan
Mac
May
July
Sept
Nov
Jan
Num
ber
of
Occure
nce
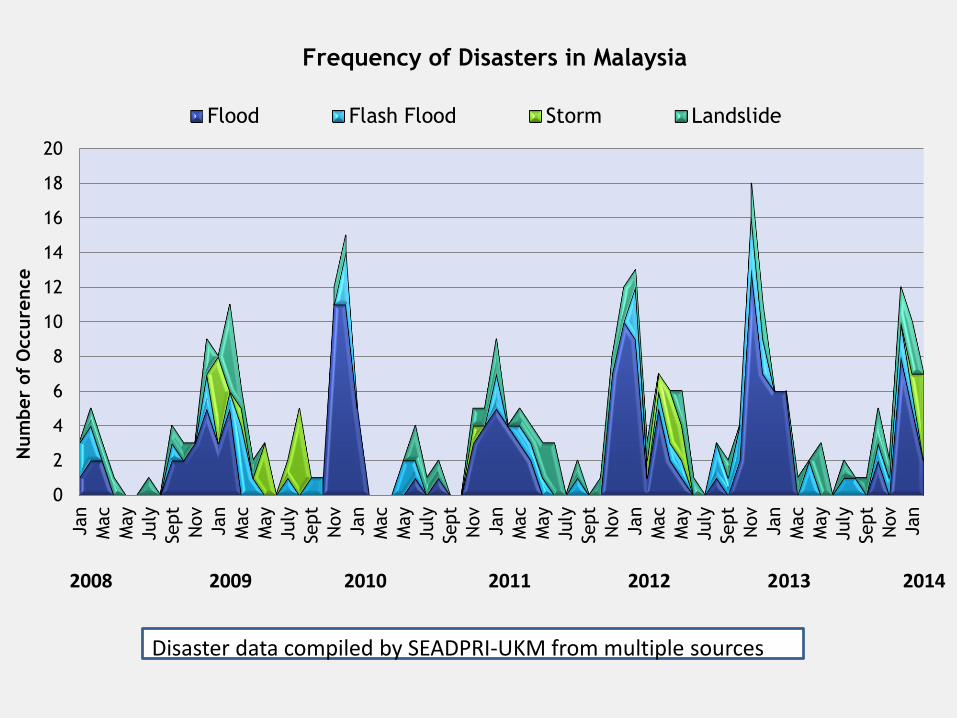
Frequency of Disasters in Malaysia
Flood Flash Flood Storm Landslide
2008 2009 2010 2011 2012 2013 2014
Disaster data compiled by SEADPRI-UKM from multiple sources
*
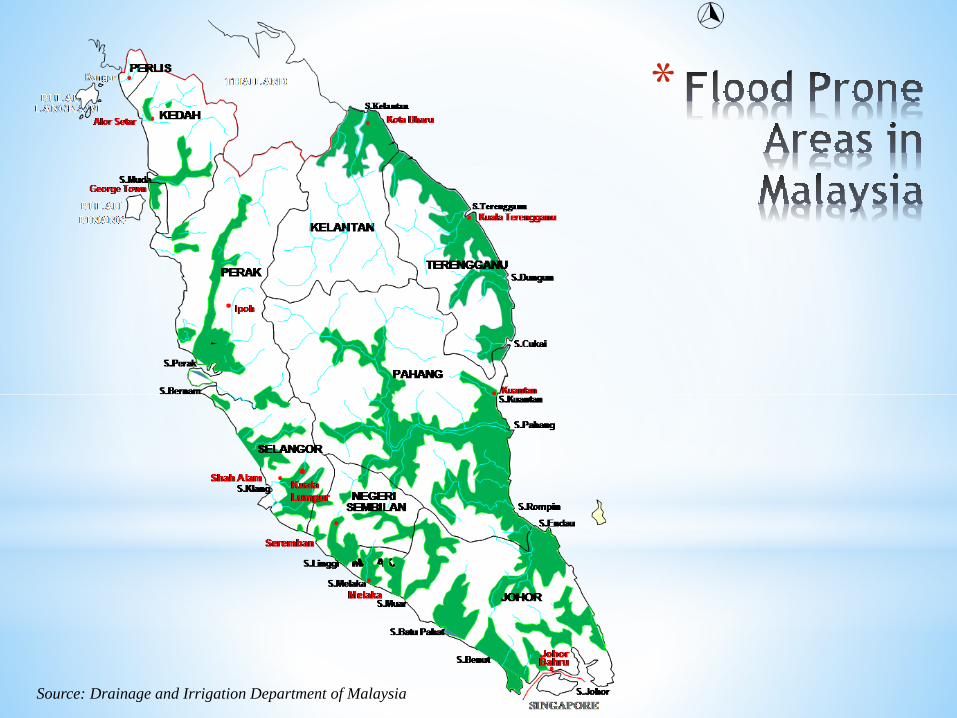
Source: Drainage and Irrigation Department of Malaysia

Flood prone area and 100-year flood map with identified active and
closed landfill sites in Selangor. (Sources: Flood map adapted from RFN-2
Report 2009, landfill sites from NAHRIM and NRE 2010) Source: Nurul, Lim and
Pereira 2013
Kundang
Kg. Sungai
Chinchin
Ampar
Tenang
Landfill Sites Exposed to Flooding:
•Number of sites located within
flood prone area: 4
•Number of sites located within 100-
year flood: 9
•Number of sites potentially
exposed to impacts from sea level
rise: 3
Cascading Risks
Kg. Sungai Chinchin
Emerging Hazards

Flood-prone areas (UN Guideline for Reducing Flood Losses, 1998)
(i) Floodway – no structures
(ii) Floodplain – generally defined as the extent of the 100-year event; requires flood protection and flood proofing, [JPS-Urban Stormwater Management Manual]
(iii) Areas beyond floodplain – generally defined as the extent of the 500-year event; may be subject to flooding, need to ensure flood proofing of “critical facilities” (hazardous material facilities, water & waste facilities, hospitals, schools, airports, emergency services, fire stations, major computer centres)
Weakness
(i) Prediction based on historical records
(ii) Changes in land use affects analysis
(iii) Changes in climate and extreme events affects analysis
(iv) Changes in sea-levels affects analysis in coastal areas
Floodplain – Issues Emerging Hazards
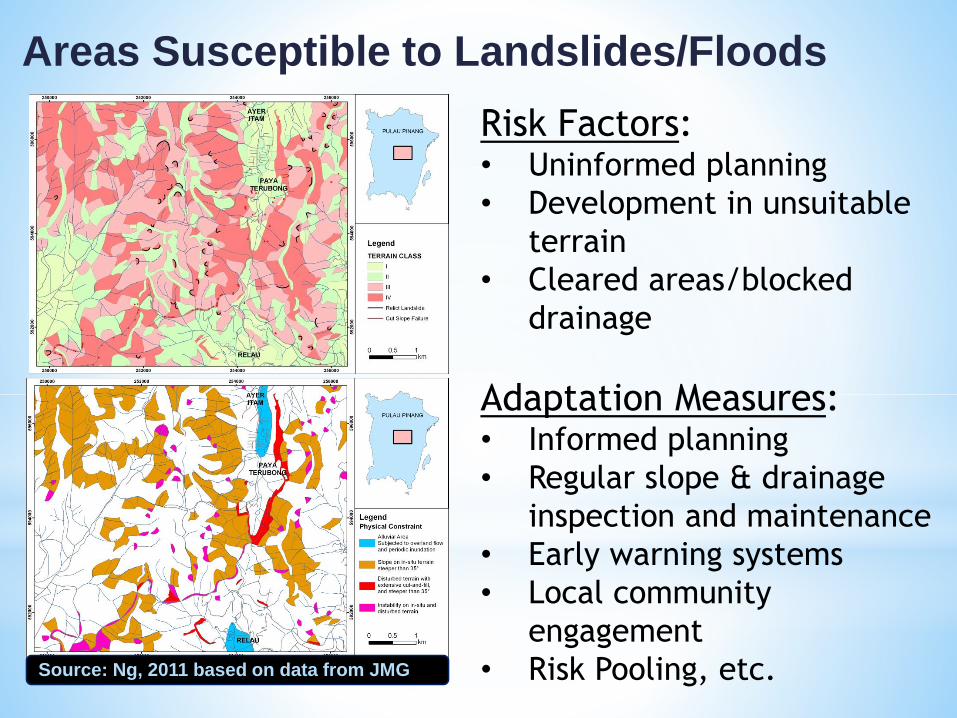
Risk Factors:• Uninformed planning
• Development in unsuitable
terrain
• Cleared areas/blocked
drainage
Adaptation Measures:• Informed planning
• Regular slope & drainage
inspection and maintenance
• Early warning systems
• Local community
engagement
• Risk Pooling, etc.
Areas Susceptible to Landslides/Floods
Source: Ng, 2011 based on data from JMG

Type of Flood Cause of flood Affected area
1. Flash floodHeavy rainfall event, dam or
levee failure
Destroy structures, down trees and wash
out roads
2. River floodOverflow the river banks, heavy
rainfall, snowmelt and ice jams
Extensive damage to residents living near
rivers and streams
3. Coastal flood
Hurricanes, tropical storms,
tsunamis, extremely high tides
and strong onshore winds.
Extensive damage to industry,
agricultural, residents living near coastal
area.
4. Urban floodFlash flooding, river flooding
and coastal flooding
High economic damages to businesses and
homes
5. Areal floodsHeavy rainfall and dangerous
inundation of low lying areas
Agricultural losses and breeding ground
for insects and disease.

Flood Event
(Year)Place Damage (USD million at 1996 prices) Deaths
No. of Victims
Evacuated
1991 Other Peninsular Malaysia NA 11 NA
1992 Peninsular Malaysia NA 12 NA
1993 Peninsular NA 22 17,000
1993 Sabah State 72.57 5 5,000
1995 Shah Alam/Kelang Valley 1.76 1 8,970
1995 Klang Selangor NA 3 0
1995 Other Peninsular Malaysia NA 4 14,900
June, 1996 Sahab >100 houses destroyed 1 9,000
29.8.1996 Pos Dipang, Perak 97.8 44 Hundreds
December, 1996 Sabah NA 241 23,000
30.12.1998 Kuala Lumpur NA 5 0
5-9.1.1999 Penampang, Sabah NA 6 4,481
11.1.1999 Sandakan Sabah NA 3 0
23.11.2000 Kg. La NA 6 0
Dec. 2001 Kelantan, Pahang,
Terengganu
Crop loss & property damage in millions
USD; USD 0.65 million texts destroyed6 >10,000
27.12.2001 Gunung Pulai, Johor Mudslide swept away 4 houses 5 4 families
31.12.2001 Benut Marang, Terengganu Crop loss & property damage 4 Thousands
Dec 2006 – Jan
2007
Johor State
Kelantan State
USD 489 million Property Damage
USD 17.28 Damage to Infrastructures18
110,000
2008 Johor State 65 (Relief Costs) 28 34,000
November 2010 Kedah & Perlis States Alor Setar Airport closed, railway line flooded,
USD 8.48 million padi crop damage4 50,000
Sources: Drainage and Irrigation Department Malaysia, Malaysian National Security Council and Chan, 2012.
Table: Last 20 years damage and losses by flood events in Malaysia

Date Place Damage and Losses
December, 2011 Sungai Jelok, KajangRM2.4 million in damages with 61 businesses recording
losses of between RM1,000 and RM250,000 each.

Date Place Damage and Losses
September, 2012 Serdang and Kajang
• About 100 vehicles were left stranded and 350
houses were in a metre of floodwaters.
• 600 students and teachers from two schools were
trapped.

*
* Communication: Floodwater can seriously disrupt public and personal transport by
cutting off roads and railway lines, as well as communication links when telephone
lines are damaged.
* Health: Floods disrupt normal drainage systems in cities, and sewage spills are
common, which represents a serious health hazard, along with standing water and
wet materials in the home. Bacteria, mould and viruses, cause disease, trigger
allergic reactions, and continue to damage materials long after a flood.
* Agricultural: Floods can distribute large amounts of water and suspended sediment
over vast areas, restocking valuable soil nutrients to agricultural lands. In contrast,
soil can be eroded by large amounts of fast flowing water, ruining crops, destroying
agricultural land / buildings and drowning farm animals.
* Personal property: Severe floods not only ruin homes / businesses and destroy
personal property, but the water left behind causes further damage to property and
contents.
* Environment: The environment and wildlife is also at risk when damage when
damage to businesses causes the accidental release of toxic materials like paints,
pesticides, gasoline etc.
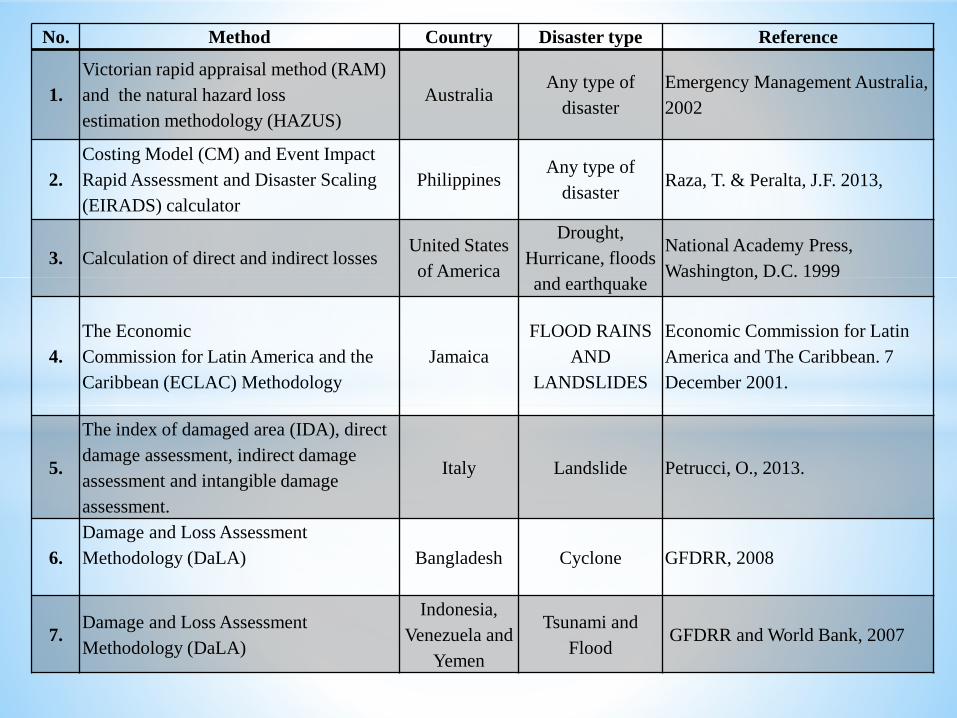
No. Method Country Disaster type Reference
1.
Victorian rapid appraisal method (RAM)
and the natural hazard loss
estimation methodology (HAZUS)
AustraliaAny type of
disaster
Emergency Management Australia,
2002
2.
Costing Model (CM) and Event Impact
Rapid Assessment and Disaster Scaling
(EIRADS) calculator
PhilippinesAny type of
disasterRaza, T. & Peralta, J.F. 2013,
3. Calculation of direct and indirect lossesUnited States
of America
Drought,
Hurricane, floods
and earthquake
National Academy Press,
Washington, D.C. 1999
4.
The Economic
Commission for Latin America and the
Caribbean (ECLAC) Methodology
Jamaica
FLOOD RAINS
AND
LANDSLIDES
Economic Commission for Latin
America and The Caribbean. 7
December 2001.
5.
The index of damaged area (IDA), direct
damage assessment, indirect damage
assessment and intangible damage
assessment.
Italy Landslide Petrucci, O., 2013.
6.
Damage and Loss Assessment
Methodology (DaLA) Bangladesh Cyclone GFDRR, 2008
7.Damage and Loss Assessment
Methodology (DaLA)
Indonesia,
Venezuela and
Yemen
Tsunami and
FloodGFDRR and World Bank, 2007

Assessment Process
Definition of Disaster Effects
Damage and Loss Assessment (DaLA)
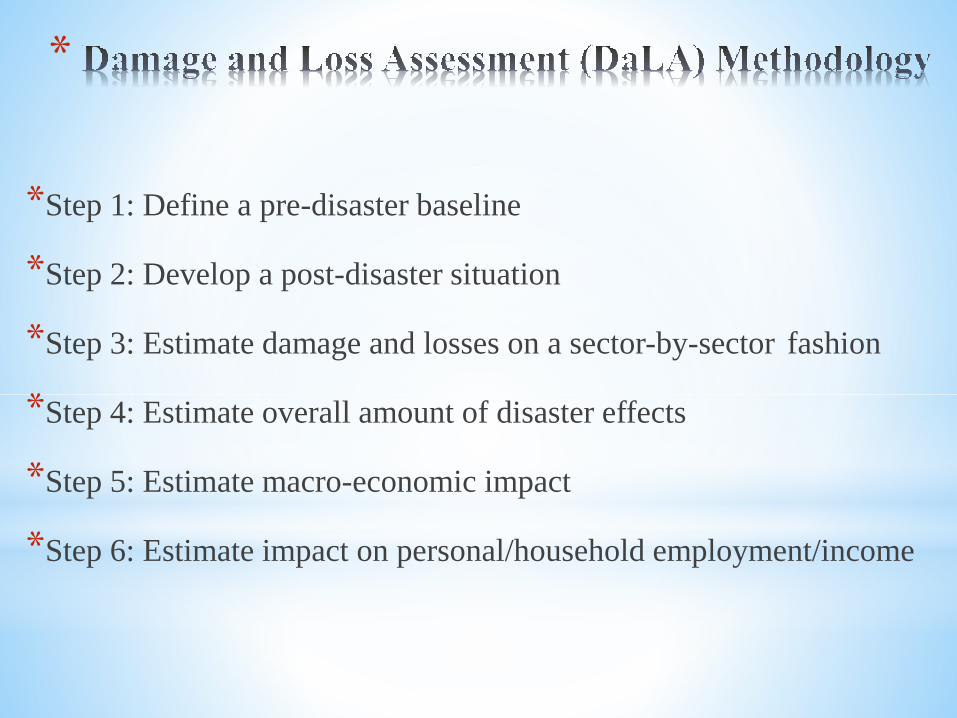
*
*Step 1: Define a pre-disaster baseline
*Step 2: Develop a post-disaster situation
*Step 3: Estimate damage and losses on a sector-by-sector fashion
*Step 4: Estimate overall amount of disaster effects
*Step 5: Estimate macro-economic impact
*Step 6: Estimate impact on personal/household employment/income
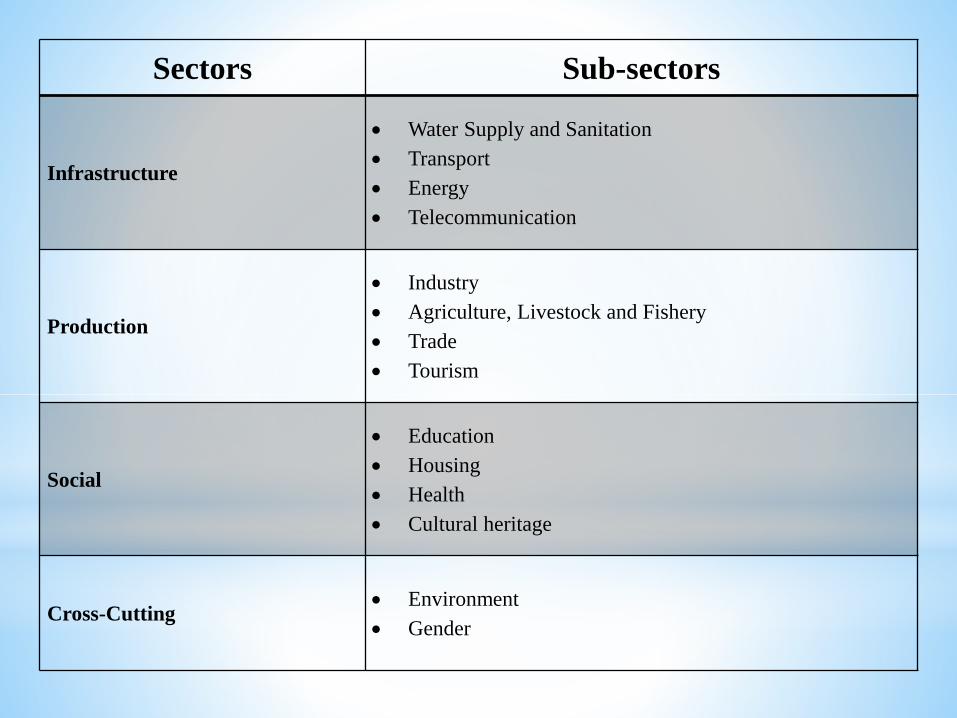
Sectors Sub-sectors
Infrastructure
Water Supply and Sanitation
Transport
Energy
Telecommunication
Production
Industry
Agriculture, Livestock and Fishery
Trade
Tourism
Social
Education
Housing
Health
Cultural heritage
Cross-Cutting Environment
Gender

• Recognition of cascading hazards and slow onset
hazards - persistent, insidious and long-term;
• Detection and attribution related to extreme
events;
• Identification of susceptible areas and spatial
distribution of exposed and vulnerable communities
therein;
• Data for assessment of loss and damage;
• Early warning and response systems
• New models for risk sharing / social protection
schemes
• Legal implications and future security challenges
Challenges in L+D Assessment

Concluding Remarks
DRR is central to adapt to climate extremes
MKN has the mandate and the experience to addresscurrent and emerging risks due to climate extremes
DRR and CCA are closely linked and need to beaddressed together to ensure sustainable development
Investing in enhanced capacity for disaster riskreduction, disaster preparedness and buildingresilience at all levels is a “no regret option” forclimate change adaptation.

Thank You!