Climate Change Threatens Marine Ecosystems— The Impact of...
20
E=mc2 High School Mathematical Science Journal Katelyn M. Boisvert 1 Climate Change Threatens Marine Ecosystems— The Impact of Rising Sea Surface Temperature and Altered Nutrient Availability on the Abundance and Growth Behavior of the Phytoplankton Thalassiosira i. Personal Statement I have always enjoyed math and science, getting an early start by attending Invention Camp every summer during elementary school. However, my interest in environmental science came about when I was in 7 th grade. I competed at our state science fair, AzSEF, with a project on the effects of acid rain and fertilizer run-off on Spirogyra algae. That was the first time I investigated problems relating to the environment, and I was eager to learn more. From that point on, I focused my scientific inquiries on issues impacting the environment: including, the study of water quality and contaminant removal using agricultural materials as alternative adsorption media; and the factors contributing to bleaching in coral reef ecosystems. I continued my interest in math and science, and will major in environmental science when I start college in the fall. My 7 th -grade science fair project did more than just spark my interest in environmental topics. At the AzSEF state fair, I won 1 st place in the Environmental Science category and several special awards, including one from the Arizona Association for Women in Science. Part of that award included spending a day at Arizona State University where students listened to speakers, toured labs, and did hands-on science activities. I toured the Neuer lab where PhDs led a talk on microscopy, and allowed students to view phytoplankton. I told them all about my work with algae, and I think they were impressed by my enthusiasm for research because they gave me their business card. They mentioned that it may be possible for older students to do research in their lab, and I never forgot that. I held onto that card, and contacted Dr. Susanne Neuer at Arizona State University in my freshman year to introduce myself, and to ask about conducting a
Transcript of Climate Change Threatens Marine Ecosystems— The Impact of...

E=mc2 High School Mathematical Science Journal Katelyn M. Boisvert
1
Climate Change Threatens Marine Ecosystems—
The Impact of Rising Sea Surface Temperature and Altered Nutrient Availability
on the Abundance and Growth Behavior of the Phytoplankton Thalassiosira
i. Personal Statement
I have always enjoyed math and science, getting an early start by attending Invention
Camp every summer during elementary school. However, my interest in environmental science
came about when I was in 7th grade. I competed at our state science fair, AzSEF, with a project
on the effects of acid rain and fertilizer run-off on Spirogyra algae. That was the first time I
investigated problems relating to the environment, and I was eager to learn more. From that point
on, I focused my scientific inquiries on issues impacting the environment: including, the study of
water quality and contaminant removal using agricultural materials as alternative adsorption
media; and the factors contributing to bleaching in coral reef ecosystems. I continued my interest
in math and science, and will major in environmental science when I start college in the fall.
My 7th-grade science fair project did more than just spark my interest in environmental
topics. At the AzSEF state fair, I won 1st place in the Environmental Science category and
several special awards, including one from the Arizona Association for Women in Science. Part
of that award included spending a day at Arizona State University where students listened to
speakers, toured labs, and did hands-on science activities. I toured the Neuer lab where PhDs led
a talk on microscopy, and allowed students to view phytoplankton. I told them all about my work
with algae, and I think they were impressed by my enthusiasm for research because they gave me
their business card. They mentioned that it may be possible for older students to do research in
their lab, and I never forgot that. I held onto that card, and contacted Dr. Susanne Neuer at
Arizona State University in my freshman year to introduce myself, and to ask about conducting a

E=mc2 High School Mathematical Science Journal Katelyn M. Boisvert
2
research project in her lab. We arranged a meeting, and although she had not worked with high
school students before, Dr. Neuer agreed to serve as my mentor and allow me to conduct
independent research in her lab. I submitted a research proposal that she approved, and the
project I submitted to Intel STS was born.
In doing this research project, I was exposed to advanced topics in oceanography, learned
to apply the scientific method, and gained skills working hands-on in a lab. I got to do real
science! I was rewarded with meaningful results, challenged when things seemed out of grasp,
and motivated by discussing my work with experts in the field. My interests stemmed from a
strong sense of wonder and depth of inquiry, but beyond scientific curiosity, I learned the
necessary skills to design a successful experiment. Throughout my project, I used mathematics
as a means to understand and enhance the science I was doing in the lab, and also to evaluate and
present my results in a meaningful way to communicate science with others. As I was only a
freshman when I started this project, my mathematics background was limited to algebra and
geometry; but there was more math required for my project that I had not yet learned. I sought
extra help from my geometry teacher to learn about logarithms and exponential functions, which
was necessary to model the growth rate of my phytoplankton samples. Statistics is not offered at
my school, but I wanted to better evaluate my data to demonstrate it was significant. So I taught
myself how to do a Student’s T-Test, even creating a program for it on my graphing calculator. I
have always enjoyed mathematics, but being able to apply it to science was twice as rewarding.
Overall, this project has been an amazing experience for me, and I hope that by sharing
my story it will encourage others to give it a try. It is always that first step that is most difficult—
finding an idea or question that intrigues you. Read, investigate, and do not be afraid to try new
things. When I began my project, I quickly realized that I did not have enough math experience

E=mc2 High School Mathematical Science Journal Katelyn M. Boisvert
3
to fully understand the topics but I did not let that stand in my way. My advice is to get out there
and try it! Put your passions about a topic into action through science and math.
ii. Abstract
Over the past fifty years, land temperatures have increased at a decadal rate almost twice
that compared to the past 100 years. Warming Earth’s atmosphere creates a rise in ocean heat
content, and alters wind patterns and storm systems that impact surface layer mixing and ocean
stratification, affecting nutrient availability. Changes in ocean temperatures and nutrient
conditions are expected to impact many organisms including phytoplankton, the ocean’s major
producer. To evaluate how climate change threatens marine ecosystems, this project studied the
impact of rising sea surface temperature and altered nutrient availability on the phytoplankton
Thalassiosira. Cultures were grown under conditions of normal IMR saltwater media at ambient
temperature 25ºC (control), elevated temperature 35ºC, and IMR with both elevated and depleted
nitrate concentration (64%). Replicate samples were collected over the lifecycle (14 days) for
multiple trials. Epifluorescence microscopy was used to count cells, in vivo fluorometry to
quantify chlorophyll a production, and a Multisizer to measure cell size. Data analysis included
peak magnitude, growth rate, peak bloom, fluorescence, and cell size. Results demonstrated
significant reductions in magnitude for both nutrient groups (elevated reduced by 52%-depleted
reduced 35%), while elevated temperature groups increased 164%; all experimental groups
experienced a shortened lifecycle. Cell size was not significantly impacted. Understanding
environmental influences on phytoplankton is important because disrupting their production
severely impacts the ocean’s food web causing loss of biodiversity, decreased human food
source with economic consequences, and a reduction in phytoplankton’s role in removing carbon
from the Earth’s atmosphere—further exacerbating climate change.

E=mc2 High School Mathematical Science Journal Katelyn M. Boisvert
4
iii. Research Report
INTRODUCTION
Satellite observations and shipboard measurements document a significant downward
trend in phytoplankton biomass noting, “… the average global phytoplankton concentration in
the upper ocean currently declines by about 1% per year. Since 1950 alone, algal biomass
decreased by around 40%, probably in response to ocean warming—and the decline has gathered
pace in recent years [1].” Considering the important role of phytoplankton in the ocean’s food
web, and also its ability to process atmospheric CO2, the greater concern is how harming
phytoplankton communities may impact humans and the Earth overall.
“Temperatures a few degrees warmer might not sound like much, but even a 3°C (5.4°F)
temperature rise will make the earth its warmest in 3 million years… [2].” Over the past 50
years, land temperatures have increased at a decadal rate almost twice that compared to the past
100 years [3]. These trends are also observed as a rise in ocean heat content. The
Intergovernmental Panel on Climate Change (IPCC) predicts this pattern will continue and
estimates an increase of ~6°C in sea surface temperature by the end of this century [3]. Rising
sea surface temperatures may directly affect phytoplankton because their primary role is to
perform photosynthesis and “… metabolic reactions proceed faster at higher temperatures… the
rule of thumb is most reactions occur twice as fast with a 10˚C rise in temperature [2].”
Mesocosm studies confirm that temperature and light impact phytoplankton response [4, 5, 6, 7].
Climate change also alters wind patterns and storm systems. These then affect ocean
forces such as stratification and ventilation, with resultant consequences on nutrient availability.
Warmer surface water temperature in the winter decreases the amount of overturn, an important
process that provides the nutrients phytoplankton need for photosynthesis. When increased

E=mc2 High School Mathematical Science Journal Katelyn M. Boisvert
5
frequency and intensity of storms create more mixing in the water column, phytoplankton lose
access to sunlight, thereby affecting their growth and abundance. Changes in wind patterns,
especially the trade winds, decrease the amount of upwelling, a necessary process to bring
nutrients from the deep ocean up to the surface making them accessible to phytoplankton [2, 8,
9]. These changes disrupt the normal patterns of ventilation (when water is transferred from the
surface-mixed layer to the interior ocean), and create greater ocean stratification, as well as cause
a shift in the amount of time it takes for nutrient cycling to be completed [10, 11, 12]. These
cumulative impacts on ocean forces could lead to zones of both elevated and depleted nutrient
conditions; as confirmed by researchers [11, 13] who predict that nitrate levels will be affected at
both ends of the range up to ~64% by the year 2100 due to changes in transit patterns.
Others [12, 14] agree after examining changes in deep ocean currents resulting from global
warming, finding that the age of water (referring to how mixed the water is and thus how many
FIGURE 1. Disruptions in Ocean Nutrient Cycles due to Climate Change. Diagram by Katelyn Boisvert from source information [2, 10, 11, 13, 14].

E=mc2 High School Mathematical Science Journal Katelyn M. Boisvert
6
nutrients are supplied to the surface) can be affected in two different ways: in some regions
ocean age will increase due to stratification slowing the process of ventilation, resulting in fewer
nutrients cycling to the surface and a longer time for the process to be completed in turn leading
to depleted conditions; while in other areas, ocean age will decrease as a result of more efficient
mixing allowing improved ventilation, thus refreshing surface nutrient supply more often and
leading to elevated conditions. Figure 1 summarizes these impacts due to climate change.
Life in the Photic Zone
The surface layer of the ocean (~the first 100-200m/330-660ft) mixed by wind, waves
and currents contains the photic zone, which is where all organisms that participate in
photosynthesis live as it provides access to natural sunlight [2]. In this zone live mostly
planktonic organisms, meaning that they do not swim but instead drift in the water carried by
currents. Because phytoplankton do not have a means of mobility so cannot migrate, and are not
able to regulate their own temperature, they are vulnerable to environmental influences being
unable to adapt to changing water temperatures, currents, wind/storm patterns, and nutrient
levels [16]. Phytoplankton are autotrophs and are the most important producers in marine
ecosystems performing ~95% of the photosynthesis in oceans. Phytoplankton need CO2, water,
and sunlight to perform photosynthesis; but they also depend on nutrients especially nitrate,
phosphate, silica, and iron [2].
There are many types of phytoplankton; one of the most common and well-studied is
diatoms. They are found in temperate as well as polar waters, and live both near the coast and in
the open ocean. Diatoms are unicellular, with a cell wall made mostly of silica having two halves
fit together into a flat rounded shape, and chloroplasts located around the sides [2, 17]. Diatoms
are good phytoplankton to study because they are sensitive to changes in their habitat but still

E=mc2 High School Mathematical Science Journal Katelyn M. Boisvert
7
have good tolerance, so “… diatoms are used extensively in environmental assessment and
monitoring [18].” Digital images from this project are in Results, and show the anatomy of the
diatom Thalassiosira which is the phytoplankton studied here. All plankton go through the
same phases of growth in their life cycle when a new culture is inoculated (Figure 2).
The first phase, the lag phase, is when
cells slowly begin to grow. After
multiplying for a few days, the growth
rate increases very quickly during the
exponential phase. Most growth occurs
during this phase, reaching a maximum
on the peak bloom day. The cells are
then fairly constant in a stationary
phase. After that is the die-off phase [19].
The growth and life cycle patterns of phytoplankton are important to understand because
as the primary producers in marine ecosystems, the success of that entire food web depends on
them; nd considering phytoplankton produce half of the world’s oxygen and process CO2 from
our atmosphere, the Earth and all its inhabitants rely on their contribution. Studying
environmental effects on phytoplankton helps us to understand how they will respond to changes
in our world. The question this project investigates is, “Do the climate-driven issues of elevated
sea surface temperature and altered nutrient availability affect the abundance and growth
behavior of the marine phytoplankton Thalassiosira?” The hypotheses state: for Phase I, that
exposure of Thalassiosira to increased temperature will affect its abundance and growth
behavior, demonstrated by changes in growth rate, peak bloom, peak magnitude, and cell size;
FIGURE 2. Life cycle phases of phytoplankton growth. Diagram by Katelyn Boisvert from source information [2, 15].
Key: Peak Bloom Day
E=mc2 High School Mathematical Science Journal Katelyn M. Boisvert
8
and for Phase II, that exposure of Thalassiosira to both elevated and depleted nitrate nutrient
levels will affect its abundance and growth behavior, demonstrated by changes in growth rate,
peak magnitude, fluorescence, and cell size.
RESULTS
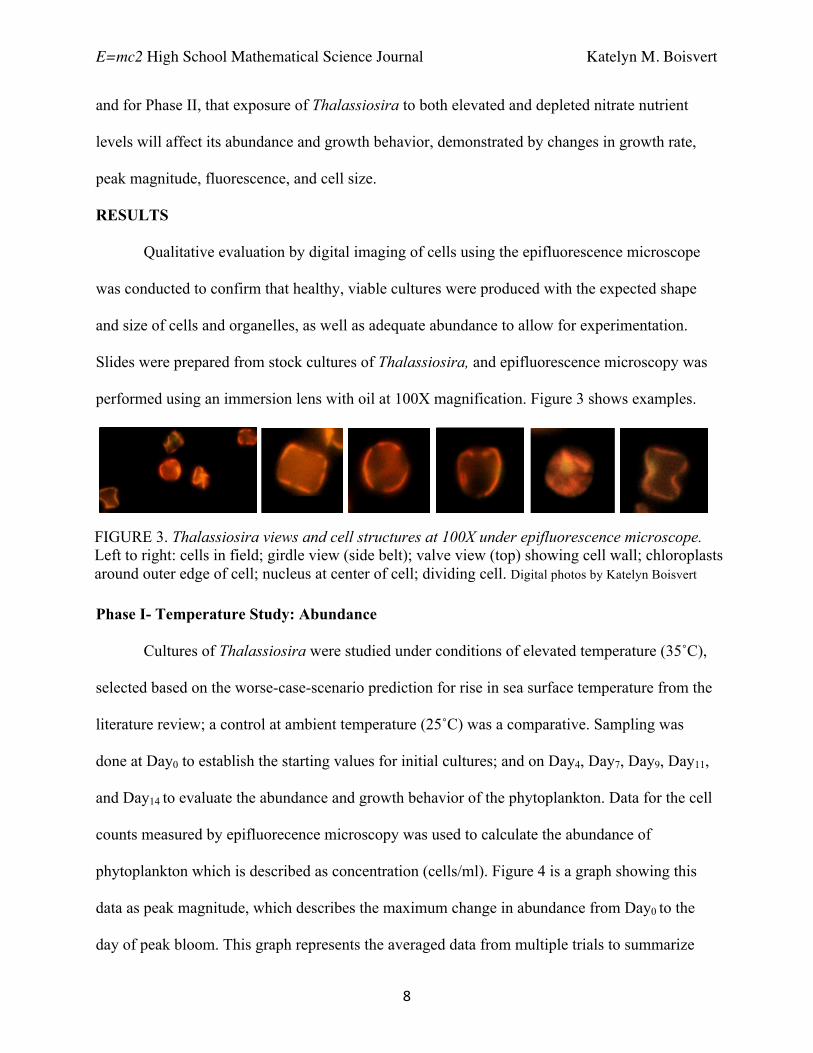
Qualitative evaluation by digital imaging of cells using the epifluorescence microscope
was conducted to confirm that healthy, viable cultures were produced with the expected shape
and size of cells and organelles, as well as adequate abundance to allow for experimentation.
Slides were prepared from stock cultures of Thalassiosira, and epifluorescence microscopy was
performed using an immersion lens with oil at 100X magnification. Figure 3 shows examples.
Phase I- Temperature Study: Abundance
Cultures of Thalassiosira were studied under conditions of elevated temperature (35˚C),
selected based on the worse-case-scenario prediction for rise in sea surface temperature from the
literature review; a control at ambient temperature (25˚C) was a comparative. Sampling was
done at Day0 to establish the starting values for initial cultures; and on Day4, Day7, Day9, Day11,
and Day14 to evaluate the abundance and growth behavior of the phytoplankton. Data for the cell
counts measured by epifluorecence microscopy was used to calculate the abundance of
phytoplankton which is described as concentration (cells/ml). Figure 4 is a graph showing this
data as peak magnitude, which describes the maximum change in abundance from Day0 to the
day of peak bloom. This graph represents the averaged data from multiple trials to summarize
FIGURE 3. Thalassiosira views and cell structures at 100X under epifluorescence microscope. Left to right: cells in field; girdle view (side belt); valve view (top) showing cell wall; chloroplasts around outer edge of cell; nucleus at center of cell; dividing cell. Digital photos by Katelyn Boisvert

E=mc2 High School Mathematical Science Journal Katelyn M. Boisvert
9
growth of cultures for each testing condition. Results demonstrated 164% increase in abundance
under the condition of elevated temperature as compared to the control, with results showing
good reliability between the replicates. A Two-Tailed Student T-test was used to analyse data,
and a statistically significant difference was shown between the control and elevated temperature
group (p=2.16X10⁻⁵) which was well below the set alpha of 0.01 demonstrating that abundance
of Thalassiosira varies significantly with the temperature of the culturing environment.
Growth Behavior
Patterns of growth for Thalassiosira were
also studied to understand the impact of temperature
on the life cycle of the organism. Figure 5 describes
cell abundance over the 14-day growing period to
visually show life cycle phases. From the graph you
can see that growth patterns for both testing
conditions display the expected behavior of
lag phase, exponential phase, stationary phase, and die-off (refer to Figure 2).
0
50000
100000
150000
200000
250000
300000
350000
400000
Abun
danc
e (c
ells
/mL)
Peak Magnitude of Thalassiosira
Control
Elevated Temperature
FIGURE 5. Abundance of Thalassiosira at elevated temperature over lifecycle (averaged trial data).
FIGURE 4. Peak magnitude of Thalassiosira at elevated temperature (averaged trial data).
* In a Two-Tailed Student T-Test results were statistically significant to well below the set alpha of 0.01: Elevated Temperature p=2.16X10⁻⁵
0
50000
100000
150000
200000
250000
300000
350000
400000
0 2 4 6 8 10 12 14 16
Abun
danc
e (c
ells
/mL)
Time (day)
Abundance of Thalassiosira
ControlElevated Temperature
0
50000
100000
150000
200000
250000
300000
350000
400000
0 2 4 6 8 10 12 14 16
Abun
danc
e (c
ells
/mL)
Time (day)
Abundance of Thalassiosira
ControlElevated Temperature
0
50000
100000
150000
200000
250000
300000
350000
400000
0 2 4 6 8 10 12 14 16
Abun
danc
e (c
ells
/mL)
Time (day)
Abundance of Thalassiosira
ControlElevated Temperature
*
±21773
±6172

E=mc2 High School Mathematical Science Journal Katelyn M. Boisvert
10
The growth rate describes the change in abundance during the phytoplankton’s growth
period (lag and exponential phases), and is calculated using the equation[15]:
K1 = Ln(N2/N1)/(t2-t1)
where N=abundance (cells/ml) at two corresponding times t1 and t2 ; while t1=Day0 and t2=peak
day of bloom [Day11 for Control, Day9 for experimental group]. Table 1 shows that growth rate
accelerated 40% compared to the control. Results for overall growth rate show good reliability
between the replicates; and a statistically significant difference was shown between the control
and the elevated temperature group (p=4.69X10⁻⁶) which was below the set alpha of 0.01,
demonstrating that the growth rate of Thalassiosira varies significantly with the temperature of
the culturing environment. Figure 6 presents this data as growth between sampling days to
evaluate the peak day of bloom and compare patterns of growth between the testing conditions.
This graph shows a faster growth rate for the elevated temperature group, at a consistently higher
amount than the control during the entire growth phase Days 0-9. Maximum growth was reached
earlier for cultures at elevated temperature, making the peak bloom time two days earlier (Day9
versus Day11 for the control). The elevated temperature group displayed a very short stationary
phase, and die-off began earlier and at a faster rate with a slightly shorter life cycle overall.
FIGURE 6. Periodic growth rate of Thalassiosira at elevated temperature over the life cycle (representing averaged trial data).
Table 1. Overall growth rate of Thalassiosira (K1) (Phase I) K1
Control 0.60 ±0.02 Elevated 0.84 ±0.02 Temperature *
* In a Two-Tailed Student T-Test results were statistically significant to well below the set alpha of 0.01: Elevated Temperature p=4.69X10⁻⁶
-‐0.200
0.000
0.200
0.400
0.600
0.800
1.000
1.200
Gro
wth
Rat
e (k
)
0 - 4 4 - 7 7 - 9 9 - 11 11 - 14
Time (day)
Periodic Growth Rate of Thalassiosira over Life Cycle
Control
Elevated Temperature
E=mc2 High School Mathematical Science Journal Katelyn M. Boisvert
11
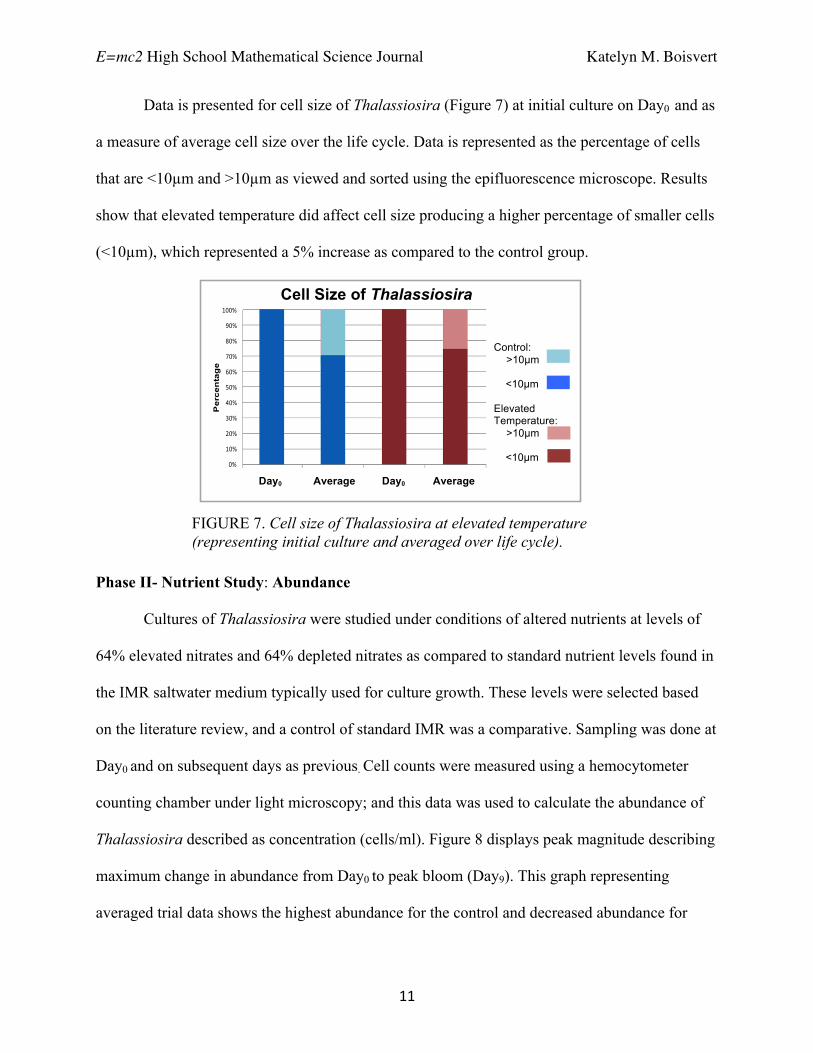
Data is presented for cell size of Thalassiosira (Figure 7) at initial culture on Day0 and as
a measure of average cell size over the life cycle. Data is represented as the percentage of cells
that are <10µm and >10µm as viewed and sorted using the epifluorescence microscope. Results
show that elevated temperature did affect cell size producing a higher percentage of smaller cells
(<10µm), which represented a 5% increase as compared to the control group.
Phase II- Nutrient Study: Abundance
Cultures of Thalassiosira were studied under conditions of altered nutrients at levels of
64% elevated nitrates and 64% depleted nitrates as compared to standard nutrient levels found in
the IMR saltwater medium typically used for culture growth. These levels were selected based
on the literature review, and a control of standard IMR was a comparative. Sampling was done at
Day0 and on subsequent days as previous. Cell counts were measured using a hemocytometer
counting chamber under light microscopy; and this data was used to calculate the abundance of
Thalassiosira described as concentration (cells/ml). Figure 8 displays peak magnitude describing
maximum change in abundance from Day0 to peak bloom (Day9). This graph representing
averaged trial data shows the highest abundance for the control and decreased abundance for
FIGURE 7. Cell size of Thalassiosira at elevated temperature (representing initial culture and averaged over life cycle).
0%
10%
20%
30%
40%
50%
60%
70%
80%
90%
100%
Initial Average over
lifetime
Initial Average over
lifetime
Control Experimental
Per
cen
tag
e
Body Size of ThalassiosiraAveraged over Life Cycle
>10:
<10:
Cell Size of Thalassiosira
Day0 Average Day0 Average
Control: >10µm
<10µm Elevated Temperature:
>10µm
<10µm

E=mc2 High School Mathematical Science Journal Katelyn M. Boisvert
12
both altered nutrient conditions (elevated nutrients reduced 35% and depleted nutrients reduced
52%). Results for peak magnitude showed good reliability between the replicates; and a
statistically significant difference was shown between the control and both the elevated nutrients
group (p=1.69X10⁻⁷) and depleted nutrients group (p=1.33X10⁻⁸), which was well below the set
alpha of 0.01 demonstrating that abundance of Thalassiosira varies significantly with the
nutrient condition of the culturing environment.
Figure 9 represents the averaged data
for fluorescence of Thalassiosira. This graph
describes chlorophyll a production over the
14-day life cycle, which correlates directly
with the amount of phytoplankton present [20].
This measure is a supporting documentation
of abundance, and reflects the amount of
photosynthetic activity by the cells. The
depleted nutrient group demonstrated the greatest loss of photosynthetic activity.
FIGURE 8. Peak magnitude of Thalassiosira under altered nutrient conditions (averaged trial data).
0
50000
100000
150000
200000
250000
300000
350000
400000
450000
500000
Abun
danc
e (c
ells
/mL)
Peak Magnitude of Thalassiosira
Control
Elevated Nutrients
Depleted Nutrients
* In a Two-Tailed Student T-Test results were statistically significant to well below the set alpha of 0.01: Elevated Nutrients p=1.69X10⁻⁷
Depleted Nutrients p=1.33X10⁻⁸
* *
±20826
±14661
±24091
0500
100015002000250030003500400045005000
0 2 4 6 8 10 12 14 16
Fluo
resc
ence
(FU
)
Time (Days)
Fluorescence of Thalassiosira
Control
Elevated Nutrients
Depleted Nutrients
FIGURE 9. Fluorescence of Thalassiosira under altered nutrient conditions (representing averaged trial data).
E=mc2 High School Mathematical Science Journal Katelyn M. Boisvert
13
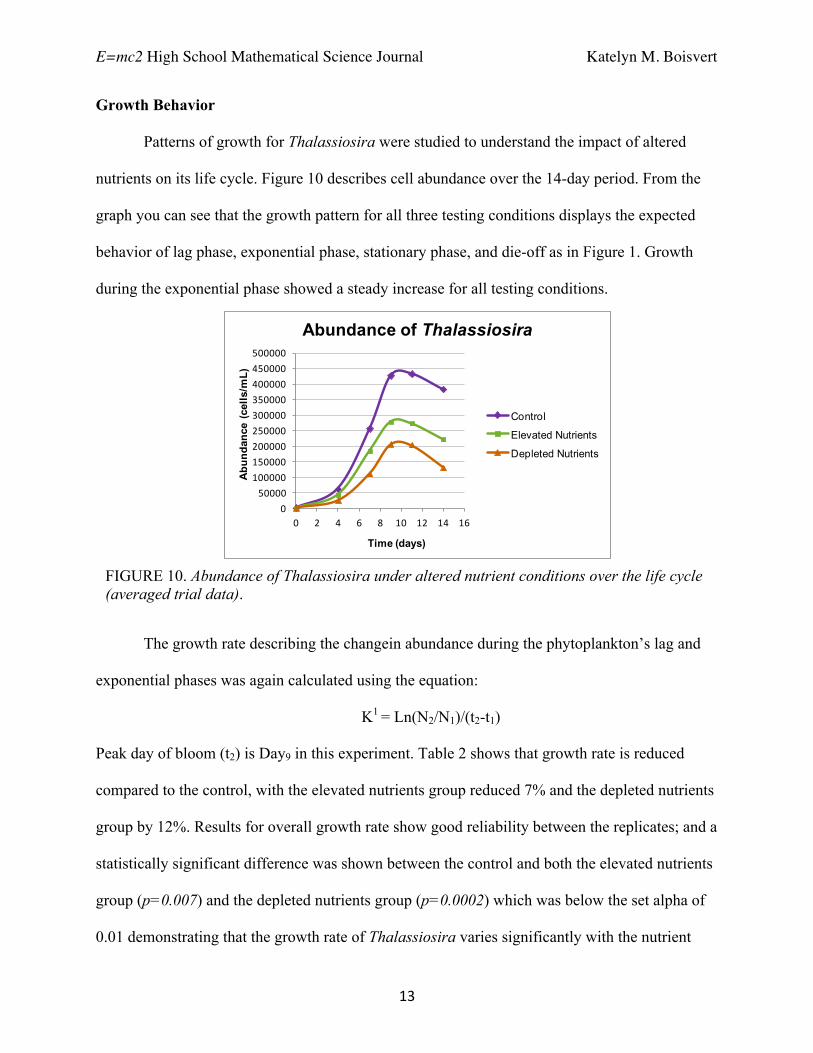
Growth Behavior
Patterns of growth for Thalassiosira were studied to understand the impact of altered
nutrients on its life cycle. Figure 10 describes cell abundance over the 14-day period. From the
graph you can see that the growth pattern for all three testing conditions displays the expected
behavior of lag phase, exponential phase, stationary phase, and die-off as in Figure 1. Growth
during the exponential phase showed a steady increase for all testing conditions.
The growth rate describing the changein abundance during the phytoplankton’s lag and
exponential phases was again calculated using the equation:
K1 = Ln(N2/N1)/(t2-t1)
Peak day of bloom (t2) is Day9 in this experiment. Table 2 shows that growth rate is reduced
compared to the control, with the elevated nutrients group reduced 7% and the depleted nutrients
group by 12%. Results for overall growth rate show good reliability between the replicates; and a
statistically significant difference was shown between the control and both the elevated nutrients
group (p=0.007) and the depleted nutrients group (p=0.0002) which was below the set alpha of
0.01 demonstrating that the growth rate of Thalassiosira varies significantly with the nutrient
FIGURE 10. Abundance of Thalassiosira under altered nutrient conditions over the life cycle (averaged trial data).
050000
100000150000200000250000300000350000400000450000500000
0 2 4 6 8 10 12 14 16
Abu
ndan
ce (
cells
/mL)
Time (days)
Abundance of Thalassiosira
Control
Elevated Nutrients
Depleted Nutrients

E=mc2 High School Mathematical Science Journal Katelyn M. Boisvert
14
condition of the culturing environment. Figure 11 presents this data as a periodic look at
Thalassiosira growth patterns during its life cycle. This graph shows a faster growth rate for the
control Days 0-4, but even rate between the three groups during Days 4-7. The depleted nutrients
group shows a delayed growth response with higher rates for Days 4-7 and 7-9; and also died off
faster than the other groups Days 11-14. The peak bloom day was calculated as Day9 from
abundance data; but periodic growth rate suggests that peak bloom may be half a day earlier for
the elevated nutrient group, and half a day later for the depleted group.
Figure 12 describes the distribution of cell size from the Multisizer data. The range
(6.961µm to 10.47µm) was selected based on known Thalassiosira size; the same range was
used for all samples. Table 3 displays the mean cell size with standard deviations for averaged
trial data. Results show that samples are similar in size, with elevated nutrient samples having
slightly larger cells (increased by 0.9%), and depleted samples having slightly smaller cells
(0.6%). The mean cell size showed variability between the replicates; results were not
statistically significant between the nutrient-altered conditions.
FIGURE 11. Periodic growth rate of Thalassiosira under altered nutrient conditions over the life cycle (averaged trial data).
Table 2. Overall growth rate of Thalassiosira (K1) (Phase II) K1
Control 0.68 ±0.03 Elevated 0.63 ±0.02 Nutrients * Depleted 0.60 ±0.02 Nutrients *
* In a Two-Tailed Student T-Test results were statistically significant to well below the set alpha of 0.01: Elevated Nutrients p=0.007
Depleted Nutrients p=0.0002
-‐0.200
0.000
0.200
0.400
0.600
0.800
1.000
1.200
Gro
wth
Rat
e (k
)
0 - 4 4 - 7 7 - 9 9 - 11 11 - 14
Time (day)
Periodic Growth Rate of Thalassiosira over Life Cycle
Control
Elevated Nutrients
Depleted Nutrients

E=mc2 High School Mathematical Science Journal Katelyn M. Boisvert
15
DISCUSSION
The spring bloom of phytoplankton, triggered by increased light and nutrients and lasting
until the end of summer, provides the food source for zooplankton who are their direct
consumers [2]. This food source is essential for zooplankton to properly reproduce; and that goes
all the way up the food chain. Therefore, the timing and abundance of the spring bloom is very
important. Metabolic processes occur more quickly in higher temperatures, and with the
expected rise in sea surface temperatures, reaction times for photosynthesis will be faster. The
growth rate of phytoplankton will increase and abundance will be higher, as demonstrated by
elevated temperature conditions in this project. The faster rate caused the peak bloom time to
occur earlier in the life cycle (Day9 versus Day11), which would mean an earlier spring bloom for
a phytoplankton community. In this scenario, nutrients are used up quickly and the
phytoplankton soon reach their carrying capacity. Being unable to maintain that accelerated
growth, they die-off faster demonstrating a shorter life cycle as observed in the data. In this
FIGURE 12. Distribution of Thalassiosira cell size under altered nutrient conditions (representing averaged trial data).
Table 3. Mean cell size (µm) of Thalassiosira (averaged trial data) Mean
Control 8.61 ±0.09 Elevated 8.69 ±0.22 Nutrients Depleted 8.56 ±0.10 Nutrients
^ In a Two-Tailed Student T-Test results were not statistically significant with an alpha level of 0.01: Elevated Nutrients p=0.45
Depleted Nutrients p=0.35
^
^
Control Elevated Depleted
Nutrient Condition
Cell Size of Thalassiosira C
ell S
ize
(µm
)

E=mc2 High School Mathematical Science Journal Katelyn M. Boisvert
16
project, because only one life cycle was studied, elevated temperature stimulated faster growth
and greater abundance; but with additional generations of phytoplankton and the cumulative
effect of a shorter life cycle, I expect abundance would reduce overall.
If climate-driven changes in available nutrients are considered, there are additional
impacts on phytoplankton. Conditions of both elevated and depleted nitrates, the most limiting
nutrient for growth, resulted in significantly reduced abundance. At first it may be expected that
abundance of Thalassiosira under elevated nutrient conditions would be greater than the control,
as in eutrophication and cases of problematic algal blooms. However, the observed abundance of
elevated nutrient samples was lower than the control. Eutrophication is usually seen along
coastline areas caused by nitrogen-based fertilizer runoff which is enhanced additionally with
phosphates and iron both of which stimulate phytoplankton growth. Because the fertilizer runoff
is “charged” it causes the wild increase in growth associated with algal blooms. This project
investigates fluxes in nitrate concentration from environmentally-influenced changes in ocean
systems (ex. upwelling and overturn), and considers how increased ocean stratification is
affecting nutrient levels. These effects will vary regionally based on climate and ocean factors.
Nutrient availability has a definite impact on phytoplankton abundance, and also
significantly affects the rate at which they grow. Overall growth rate was significantly different
between experimental groups caused by changes in nitrate concentration. Nutrient availability
can stress the cells, and growth can be slowed when cells are under stress caused by changes in
their typical environment[23]. Whether due to an elevated or depleted supply of nutrients,
phytoplankton will conserve resources when under this stressed condition; consequently, cell
growth rate is slower than average, and the ability to achieve maximum abundanceis reduced
because the carrying capacity of the phytoplankton is diminished.

E=mc2 High School Mathematical Science Journal Katelyn M. Boisvert
17
The cell size of Thalassiosira was only slightly influenced by temperature and nutrient
conditions, and differences were not significant. Diatoms display a natural reduction in size
during asexual cell division when they split their two valves apart to produce daughter cells [16].
The slight differences observed may have been due to how silica was utilized by the
phytoplankton, as that is an essential nutrient to build its cell wall. The cell size of the depleted
nutrients group was slightly smaller than the control, maybe because silica could not be well
utilized without sufficient nitrates available. As higher temperatures increased growth rate, more
cell divisions would occur which explains the higher percentage of smaller cells observed for
elevated temperature samples. Although results did not support significant change in cell size,
over many generations a more substantial reduction in cell size may occur or smaller-sized
diatom species may be favored over others; as noted by other researchers [6, 7].
When climate-driven issues of elevated sea surface temperature and altered nutrient
availability are considered together in a real-world case rather than individual laboratory
experiments, threats to phytoplankton sustainability are intensified as disruptions occur to both
abundance and growth behavior. Based on this research, the collective impact on phytoplankton
due to the environmental conditions of rising sea surface temperature and altered nutrient
availability are a loss of abundance, reduced growth rate, earlier peak bloom with a shortened
lifecycle, and a possible reduction in cell size which further reduces biomass.
Relevance
Phytoplankton are the primary producers forming the base of the entire marine food web.
Because they do not have any means of mobility and are unable to regulate their own
temperature, they are not able to adapt well to rising sea temperatures, nor can they migrate to
areas of best temperature or nutrient conditions. Research by Doney [8] and many others report

E=mc2 High School Mathematical Science Journal Katelyn M. Boisvert
18
that if climate change patterns continue, primary productivity will be affected to the point that it
will disrupt the “… geographical boundaries that separate specific marine ecosystems (the ocean
equivalents of forests, grasslands, and so on)” with resultant effects on all marine species. If
phytoplankton abundance and growth are harmed, the major food source of the ocean would be
reduced and this would decrease the biodiversity of all organisms above them in the food chain,
including marine mammals and sea birds. Consequently, decreased fish production would limit a
food source for humans, and create economic difficulty as well.
Carbon dioxide (CO2) from the atmosphere is taken into the ocean as part of the global
carbon cycle. In photosynthesis, primary producers like phytoplankton convert CO2 into organic
matter used as building blocks for consumers. “These microorganisms use light, carbon dioxide,
and nutrients to grow. Although phytoplankton are small, they flourish in every ocean,
consuming about half of the carbon dioxide emitted into the atmosphere… But warming oceans
may significantly limit their growth and diversity, with far-reaching implications for the global
carbon cycle [26].” Maintaining abundance and diversity of phytoplankton helps to maintain
balance in the carbon cycle. Reductions in phytoplankton may stress a system already burdened
by increasing atmospheric carbon levels. Without the benefit of a large phytoplankton
community, the condition of our atmosphere may significantly worsen [14, 24, 25].
The observations stressed in this research support the importance of studying abundance
and growth behavior of phytoplankton because they serve not only a valuable role in marine
ecosystems, but on Earth as a whole, including having an impact on human life.
CONCLUSIONS
1. Thalassiosira growth demonstrates expected life cycle stages during a 14-day culture period.
2. Altered environmental conditions affect the abundance and growth behavior of Thalassiosira:

E=mc2 High School Mathematical Science Journal Katelyn M. Boisvert
19
such that, both elevated and depleted nutrient availability significantly reduce peak magnitude
and growth rate; while elevated temperature creates a significant surge in peak magnitude and
growth rate.
3. Peak bloom time occurs earlier when Thalassiosira is exposed to conditions of elevated
temperature, while nutrient availability does not stimulate a significant advance in bloom
time.
4. Thalassiosira demonstrates a shorter life cycle due to the altered environmental conditions of
elevated temperature and depleted nutrient availability.
5. Cell size of Thalassiosira is minimally affected by elevated temperature and altered nutrient
conditions.
BIBLIOGRAPHY
[1] Schiermeier, Q. Nature News. Ocean greenery under warming stress. http://nature.com/news/2010/ 1-0728/full/news.2010.379.html (accessed Feb 2014). [2] Castro, P and Huber, M (2010) Marine Biology. McGraw-Hill, New York, NY.
[3] Easterling, D and Karl, T. National Oceanic and Atmospheric Administration. Global warming. http://ncdc.noaa.gov/cmb-faq/globalwarming.html (accessed Feb 2013).
[4] Winder, M et al (2012). Spring phenological responses of marine and freshwater plankton to changing temperature and light conditions. Marine Biology 159.11, 2491-2501.
[5] Sommer, U and Lengfellner, K (2008). Climate change and the timing, magnitude, and composition of the phytoplankton spring bloom. Global Change Biology 10.1111, 1-10.
[6] Ajani, PA et al (2014). A decadal decline in relative abundance and a shift in microphytoplankton composition at a long-term coastal station off southeast Australia. Limnology and Oceanography 59.2, 519-531. [7] ScienceDaily. Global warming likely to reduce phytoplankton size, thereby reducing ocean's capacity to remove carbon dioxide from air. http://sciencedailt.com/releases/2010/06/100609094357.htm ( accessed Jan 2013).
[8] Doney, SC (2006). Plankton in a warmer world. Nature 444, 695-696.
[9] Scripps Institute of Oceanography Geosciences Research Division. Earthguide. http://earthguide. uscd.edu/virtualmuseum/climatechange 1/11_2.shtml (accessed Jan 2013).
[10] PhysOrg. Deep ocean current may slow due to climate change. http://phys.org/news/2014-03-deep-ocean-current-due-climate.html (accessed April 2014).

E=mc2 High School Mathematical Science Journal Katelyn M. Boisvert
20
[11] Rykaczewski, R and Dunne, J (2010). Enhanced nutrient supply to the California Current Ecosystem with global warming and increased stratification in an earth system model. Geophysical Research Letters 37, 2-17. [12] Gnanadesikan, A et. al (2007). How does ocean ventilation change under global warming? Ocean Science 3, 43-53. [13] Dunne, JP. National Oceanic and Atmospheric Administration. The Future of Climate Modeling at GFDL, The Earth System Model. http://gfdl.noaa.gov/cms-filesystem-action/research/climate- ecosystems/esm_spotlight_article_final.pdf (accessed Feb 2014).
[14] Lavergne, C et al (2014). Cessation of deep convention in the Southern Ocean under anthropogenic climate change. Nature Climate Change 1038, 1-5.
[15] Commonwealth Scientific and Industrial Research Organization. Algal growth phases including determination of the growth rate and population doubling time. http://marine.csiro.au/microalgae/ methods/Growth rate.htm (accessed Feb 2013). [16] Stow, D (2006) OCEANS An Illustrated Reference. University of Chicago Press, Chicago, IL. [17] Olney, M. University College London Micropaleontology Unit. Diatoms. http://ucl.ac.uk/GeolSci/ micropal/diatom.html (accessed Feb 2013). [18] Spaulding, SA, Lubinski, DJ and Potapova, M. Diatoms of the United States. http://westerndiatoms.colorado.edu (accessed Feb 2013). [19] Widdel, F. University of Bremen. Theory and measurement of bacterial growth. http://www.mpi-bremen.de/Binary13037 /Wachstumsversuch.pdf (accessed Feb 2013). [20] National Science Foundation (2006). Counting Cells with a Hemacytometer Protocol. http://ruf. rice.edu/ ~bioslabs/methods/microscopy/cellcounting.html (Biochem/Biotech reprint from web source).
[21] California Cooperative Oceanic Fisheries. Fluorometry. calcofi.org (accessed June 2013).
[22] Beckman Coulter Multisizer 3 Counter handbook (2014).
[23] Inter Press Service News Agency. Climate change threatens crucial marine algae. http://ipsnews.net/2012/05/climate-change-threatens-crucial-marine-algae/ (accessed April 2014).
[24] Gao, K and Campbell, D (2014). Photophysiological responses of marine diatoms to elevated CO2 and decreased pH: a review. Functional Plant Biology 1071, A-K.
[25] PhysOrg. Ocean food web is key in the global carbon cycle. http://phys.org/news/2014-03-ocean-food-web-key-global.html (accessed April 2014).
[26] ScienceDaily. Warmer future oceans could cause phytoplankton to thrive near poles, shrink in tropics. http://sciencedaily.com/releases/2012/10/121025161747.htm (accessed Jan 2013).