CLIMATE CHANGE IN VIETNAM AND REGION Prof.Dr. Nguyen Duc Ngu Center for Hydrometeorology and...
25
CLIMATE CHANGE IN VIETNAM AND REGION Prof.Dr. Nguyen Duc Ngu Center for Hydrometeorology and Environment Prof. Dr. Nguyen Trong Hieu GEF/SGP Vietnam National Steering Committee
Transcript of CLIMATE CHANGE IN VIETNAM AND REGION Prof.Dr. Nguyen Duc Ngu Center for Hydrometeorology and...
CLIMATE CHANGE IN VIETNAM AND REGION
Prof.Dr. Nguyen Duc Ngu
Center for Hydrometeorology and EnvironmentProf. Dr. Nguyen Trong HieuGEF/SGP Vietnam National Steering Committee
1. OVERVIEW OF CLIMATE’S CHARACTERISTICS IN VIETNAM
2. CLIMATE CHANGE AND CLIMATE TRENDS OVER THE PAST 100 YEARS
3. CURRENT STATUS ON GREEN HOUSE GAS (GHGs) EMISSIONS IN VIETNAM
4. CLIMATE CHANGE SCENARIOS IN VIETNAM
5. IMPACTS OF CLIMATE CHANGE IN VIETNAM

1. OVERVIEW OF CLIMATE’S CHARACTERISTICS IN VIETNAM
1.1 Monsoon tropical climate in a penisular of a greate European – Asian continent
+ Internal tropic heat radiation+ Monsoon circle in South Eastern Asia+ Diverse patterns of humidity and temperature+ Much of natural disasters: hoarfrost. storms. typhoons. droughts…
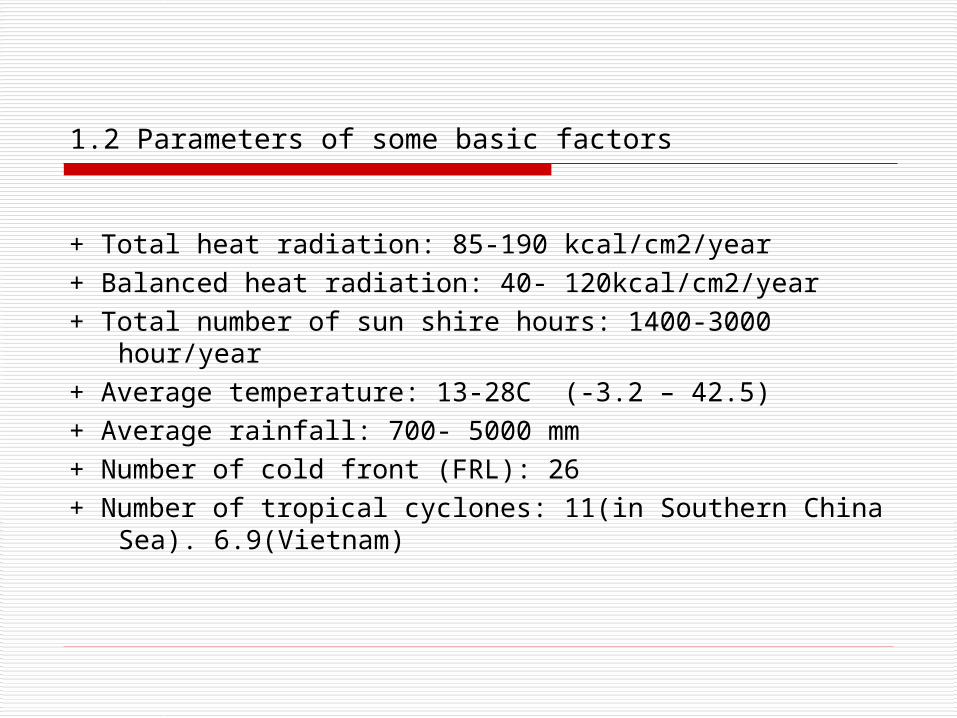
1.2 Parameters of some basic factors
+ Total heat radiation: 85-190 kcal/cm2/year
+ Balanced heat radiation: 40- 120kcal/cm2/year
+ Total number of sun shire hours: 1400-3000 hour/year
+ Average temperature: 13-28C (-3.2 – 42.5)
+ Average rainfall: 700- 5000 mm
+ Number of cold front (FRL): 26
+ Number of tropical cyclones: 11(in Southern China Sea). 6.9(Vietnam)
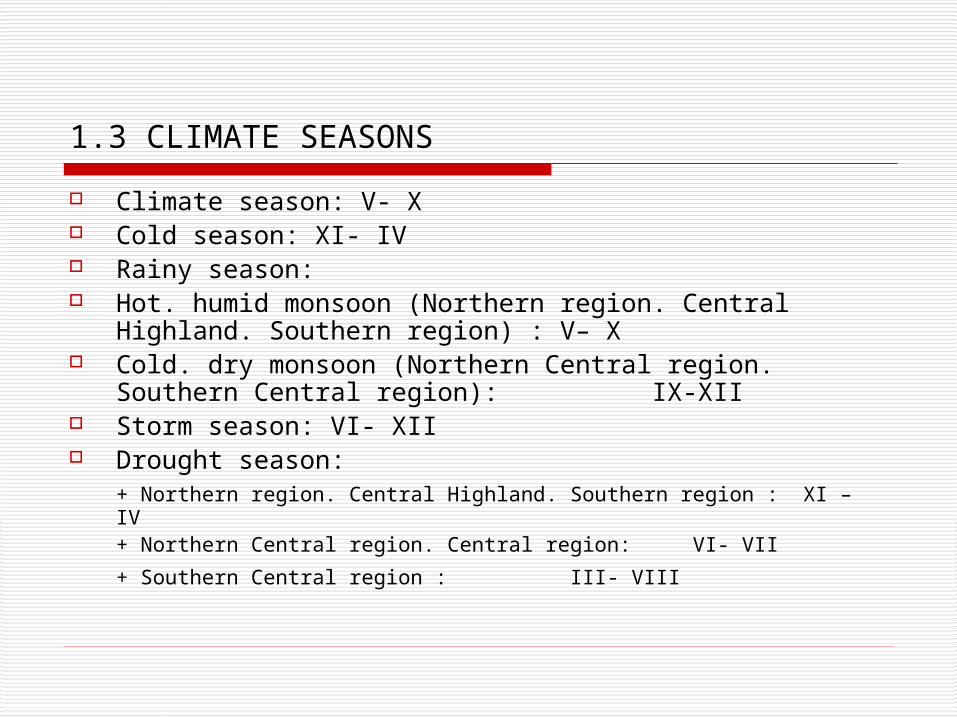
1.3 CLIMATE SEASONS
Climate season: V- X Cold season: XI- IV Rainy season: Hot. humid monsoon (Northern region. Central Highland.
Southern region) : V– X Cold. dry monsoon (Northern Central region. Southern Central
region): IX-XII Storm season: VI- XII Drought season:
+ Northern region. Central Highland. Southern region : XI – IV
+ Northern Central region. Central region: VI- VII
+ Southern Central region : III- VIII

1.4 Region-based climate classification
Figure 1: Climate region in Vietnam

2. CLIMATE CHANGE AND CLIMATE TRENDS OVER THE PAST 100 YEARS
Table 2.1: Standard variation and deviation of frequency FRL
Feature I II III IV V VI VII VII IX X XI XII year
Standard variati
on (time)
1.57 1.04 1.04 1.39 1.07 1.36 0.22 0.361.1
01.10 1.68 0.94 4.36
Deviation (%)
39.3 30.2 30.2 53.5 41.1 97.1220.
0180.
091.
745.8 46.7 27.6 16.0

2.2 Table 2.5: Frequency of tropical cyclones. start. mature and end
Season of tropical cyclones
Start Mature End
Feature N. of yearsPercentage
(%)N. of years
Percentage (%)
N. of yearsPercentage
(%)
III 1 2.5 0 0.0 0 0.0
IV 2 5.0 0 0.0 0 0.0
V 3 7.5 0 0.0 0 0.0
VI 18 45.0 1 2.5 0 0.0
VII 10 25.0 3 7.5 0 0.0
VIII 3 7.5 7 17.5 0 0.0
IX 1 2.5 14 35.0 5 12.5
X 2 5.0 12 30.0 7 17.5
XI 0 0.0 3 7.5 19 47.5
XII 0 0.0 0 0.0 8 20.0
I 0 0.0 0 0.0 0 0.0
II 0 0.0 0 0.0 1 2.5
Total 40 100.0 4.0 100.0 40 100.0

2.3 CHANGES IN TEMPERATURE Table 2.6: Standard variation of some features of temperature in some typical locations (0C).
LOcationMonitoring
station
Average temperatureHighest temperature in a
year
Lowest temperature in a yearI IV VII X Year
North West Lai Chau 1.0 0.9 0.5 0.8 0.3 1.33 2.45
North East Sa Pa 1.5 1.1 0.4 0.7 0.4 0.72 1.17
Red river delta Hanoi 1.4 1.2 0.5 0.9 0.5 1.07 1.46
Northern Central region
Vinh 1.4 1.3 0.7 0.7 0.5 0.82 1.37
Southern Central region
Da Nang 1.1 0.7 0.5 0.6 0.3 0.93 1.51
Highland Da Lat 0.7 0.6 0.3 0.4 0.3 1.29 1.72
Mekong River deltaTan Son
Nhat0.9 0.6 0.5 0.5 0.4 0.69 1.38
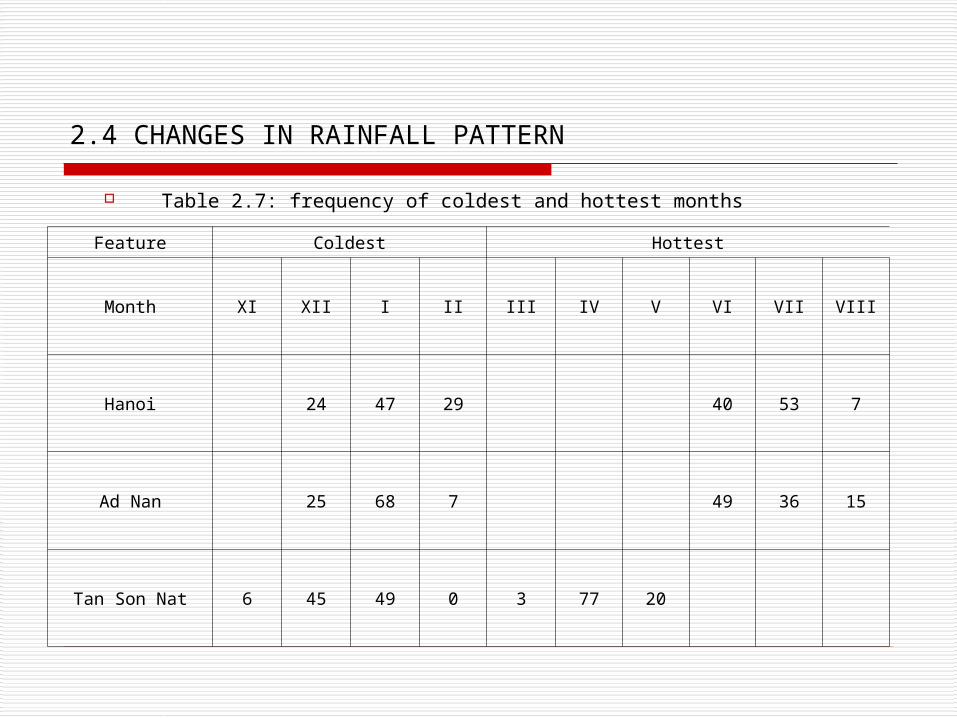
2.4 CHANGES IN RAINFALL PATTERN Table 2.7: frequency of coldest and hottest months
Feature Coldest Hottest
Month XI XII I II III IV V VI VII VIII
Hanoi 24 47 29 40 53 7
Ad Nan 25 68 7 49 36 15
Tan Son Nat 6 45 49 0 3 77 20
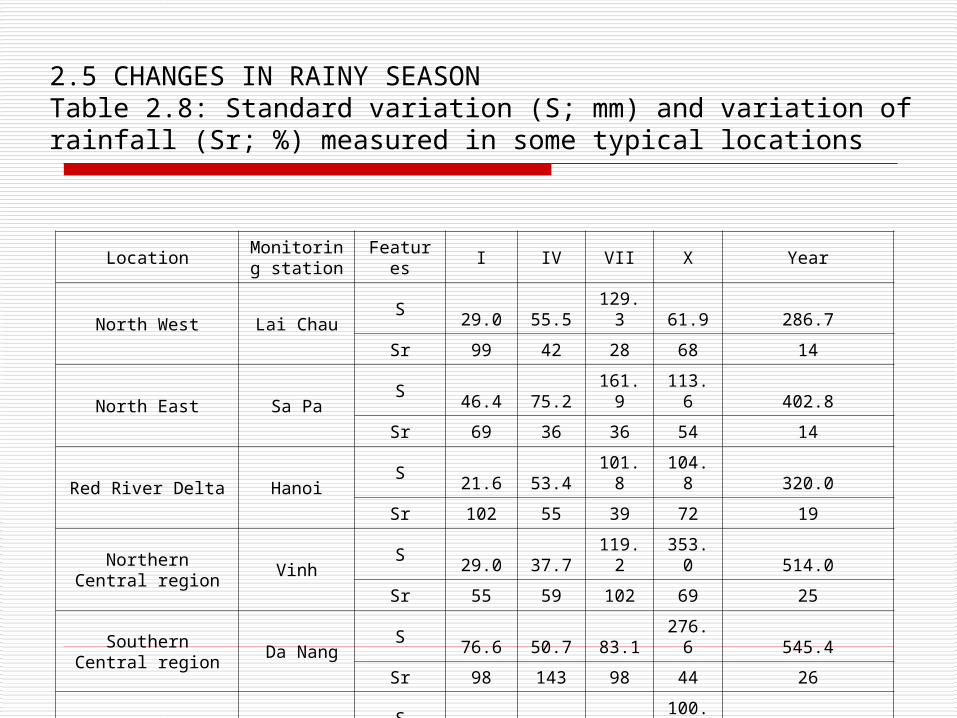
2.5 CHANGES IN RAINY SEASON Table 2.8: Standard variation (S; mm) and variation of rainfall (Sr; %) measured in some typical locations
LocationMonitoring
stationFeatures I IV VII X Year
North West Lai ChauS 29.0 55.5 129.3 61.9 286.7
Sr 99 42 28 68 14
North East Sa PaS 46.4 75.2 161.9 113.6 402.8
Sr 69 36 36 54 14
Red River Delta HanoiS 21.6 53.4 101.8 104.8 320.0
Sr 102 55 39 72 19
Northern Central region
VinhS 29.0 37.7 119.2 353.0 514.0
Sr 55 59 102 69 25
Southern Central region
Da NangS 76.6 50.7 83.1 276.6 545.4
Sr 98 143 98 44 26
Highland Da LatS 12.1 89.8 83.2 100.3 237.1
Sr 159 55 36 41 13
Mekong River DeltaTan Son
Nhat
S 19.3 50.7 93.5 91.8 284.9
Sr 140 101 32 34 15

biÕn t r ×nh nhiÒu n¨ mvµ xu t hÕ NhiÖt ®é k h«ng k hÝ
t r ung b×nh n¨ m t r ¹ m hµ né i
y = 0.0056x + 23.388
22.5
23.5
24.5
25.5
26.5
năm
T(0C)
biÕn t r ×nh nhiÒu n¨ m vµ xu t hÕ NhiÖt ®é k h«ng k hÝ
t r ung b×nh n¨ m t r ¹ m ®µ n½ng
y = 0.0038x + 25.565
24.5
25.0
25.5
26.0
26.5
27.0
năm
T(0C)
biÕn t r ×nh nhiÒu n¨ m vµ xu t hÕ NhiÖt ®é kh«ng khÝ t r ung b×nh n¨ m t r ¹ m t ©n s¬n nhÊt
y = 0.0104x + 26.789
25.5
26.0
26.5
27.0
27.5
28.0
28.5
29.0
năm
T(0C)
2.6 TRENDS IN CLIMATE CHANGE
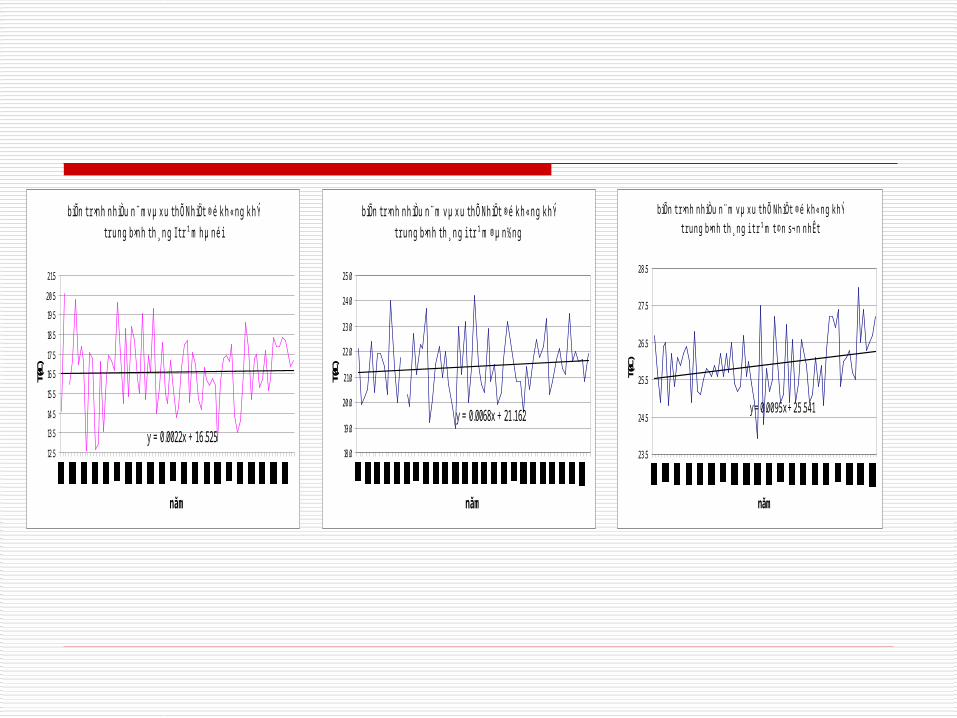
biÕn t r ×nh nhiÒu n¨ mvµ xu t hÕ NhiÖt ®é k h«ng k hÝ
t r ung b×nh t h¸ ng I t r ¹ m hµ né i
y = 0.0022x + 16.52512.5
13.5
14.5
15.5
16.5
17.5
18.5
19.5
20.5
21.5
năm
T(0C)
biÕn t r ×nh nhiÒu n¨ m vµ xu t hÕ NhiÖt ®é k h«ng k hÝ
t r ung b×nh t h¸ ng i t r ¹ m ®µ n½ng
y = 0.0068x + 21.162
18.0
19.0
20.0
21.0
22.0
23.0
24.0
25.0
năm
T(0C)
biÕn t r ×nh nhiÒu n¨ m vµ xu t hÕ NhiÖt ®é kh«ng khÝ t r ung b×nh t h¸ ng i t r ¹ m t ©n s¬n nhÊt
y = 0.0095x + 25.541
23.5
24.5
25.5
26.5
27.5
28.5
năm
T(0C)

biÕn t r ×nh nhiÒu n¨ mvµ xu t hÕ NhiÖt ®é k h«ng k hÝ
t r ung b×nh t h¸ ng VII t r ¹ m hµ né i
y = 0.0091x + 28.62
27.0
28.0
29.0
30.0
31.0
năm
T(0C)
biÕn t r ×nh nhiÒu n¨ m vµ xu t hÕ NhiÖt ®é k h«ng k hÝ
t r ung b×nh t h¸ ng VII t r ¹ m ®µ n½ng
y = 0.0054x + 28.919
27.0
28.0
29.0
30.0
31.0
năm
T(0C)
biÕn t r ×nh nhiÒu n¨ m vµ xu t hÕ NhiÖt ®é kh«ng khÝ t r ung b×nh t h¸ ng Vii t r ¹ m t ©n s¬n nhÊt
y = 0.0136x + 26.675
25.0
26.0
27.0
28.0
29.0
năm
T(0C)

biÕn t r ×nh nhiÒu n¨ m vµ xu thÕ l î ng m a n¨ m
t r ¹ m ®µ n½ng
y = 1.0261x + 1930.7500
1000
1500
2000
2500
3000
3500
4000
năm
R(mm)
biÕn t r ×nh nhiÒu n¨ m vµ xu thÕ l î ng m a n¨ m t r ¹ m
t©n s¬n nhÊt
y = 2.1373x + 1831.8
500
1000
1500
2000
2500
3000
năm
R(mm)
Variations in years and rainfall pattern in hanoi
y = 0.3391x + 1644.8
500
1000
1500
2000
2500
3000
n?m
R(mm)
Significant signs of Climate Change trends
Less dizzily rain Less mist Increased or decreased rainfall in centers Storms and tropical pressures tend to happen more at the end of
the season Increase in frequency and intensity of droughts

3. GHGs EMISSIONS IN VIETNAM3.1. GHG emission inventory in 1994Table 3.1 GHS emission of power-consuming sectors
Sector CO2 CH4
N2
ONOX CO
NMVOC
SO2
Power generation4115.07
0.109
0.045
11.759
0.8360.24
62.97
9
Industry and construction7671.17
0.433
0.081
22.061
5.1990.93
15.35
9
Transport3634.43
0.465
0.043
35.822
158.724
30.342
1.365
Services/ Commerce1974.69
0.242
0.022
2.421
19.198
1.964
1.118
Domestic use1806.04
118.777
1.545
40.011
1931.933
231.216
286.69
Agro-forestry and fishery887.73
0.098
0.007
14.537
12.355
2.446
0.511
Others1490.87
0.385
0.013
2.155
1.590.22
20.81
2
Total21580.0
120.589
1.756
128.763
2129.836
267.367
298.84
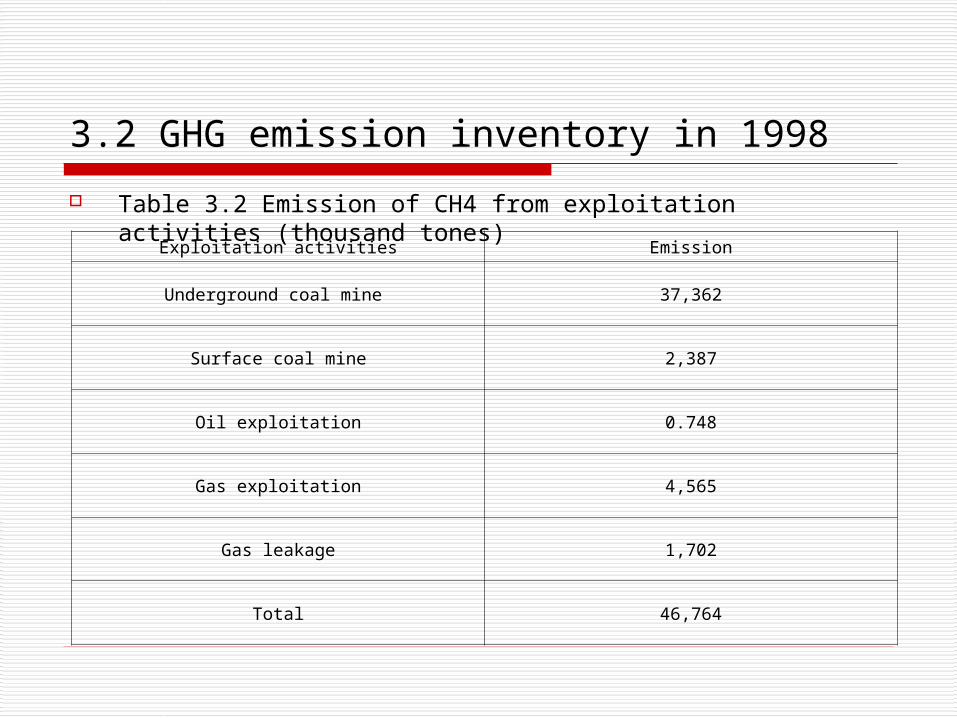
3.2 GHG emission inventory in 1998
Table 3.2 Emission of CH4 from exploitation activities (thousand tones)
Exploitation activities Emission
Underground coal mine 37,362
Surface coal mine 2,387
Oil exploitation 0.748
Gas exploitation 4,565
Gas leakage 1,702
Total 46,764

3.3 Projected emission for 2010 - 2028
Table 3.3 GHG emission from industrial production 1994 (thousand tones).Industrial production CO2 NOX CO SO2 NMVOC
Cement 2,677.24 1,611.18
Lime production 651.99
Natri carbonate production 0.52
Use of Natri carbonate 2.24
Steel production 475.2 0.011 0.012 0.008
Paper production 0.230 0.861 1.076 0.569
Wine and beer 0.136
Food 4.075
Total 3,807.19 0.241 0.861 1,612.266 4.788
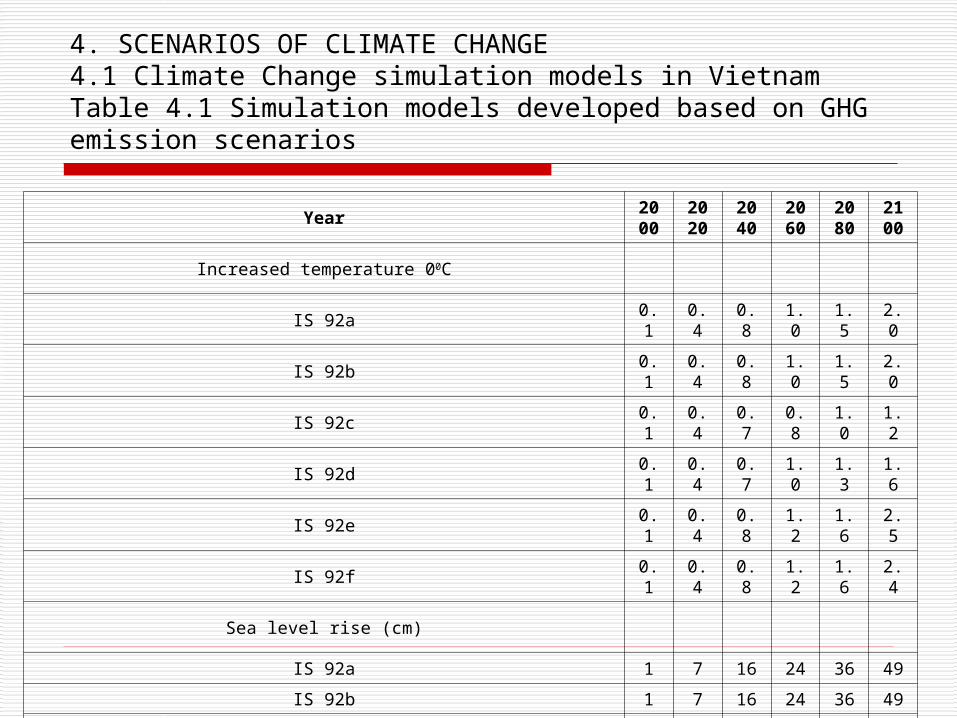
4. SCENARIOS OF CLIMATE CHANGE4.1 Climate Change simulation models in VietnamTable 4.1 Simulation models developed based on GHG emission scenarios
Year
2000
2020
2040
2060
2080
2100
Increased temperature 00C
IS 92a 0.1 0.4 0.8 1.0 1.5 2.0
IS 92b 0.1 0.4 0.8 1.0 1.5 2.0
IS 92c 0.1 0.4 0.7 0.8 1.0 1.2
IS 92d 0.1 0.4 0.7 1.0 1.3 1.6
IS 92e 0.1 0.4 0.8 1.2 1.6 2.5
IS 92f 0.1 0.4 0.8 1.2 1.6 2.4
Sea level rise (cm)
IS 92a 1 7 16 24 36 49
IS 92b 1 7 16 24 36 49
IS 92c 1 7 15 23 31 38
IS 92d 1 7 15 23 31 42
IS 92e 1 7 17 25 38 55
IS 92f 1 7 17 25 38 54

4.2 Predictions on Climate Change scenarios
Significantly increased temperature North West, North East, and Central Highland
Significantly increased rainfall in rainy season in Northern Central and Southern Central regions
Rainfall in dry season:
+ Increased rainfall in Northern Central and Southern Central regions
+ Both increased and decreased rainfall in some other regions
Significant Sea level rise in the second half of 21st century
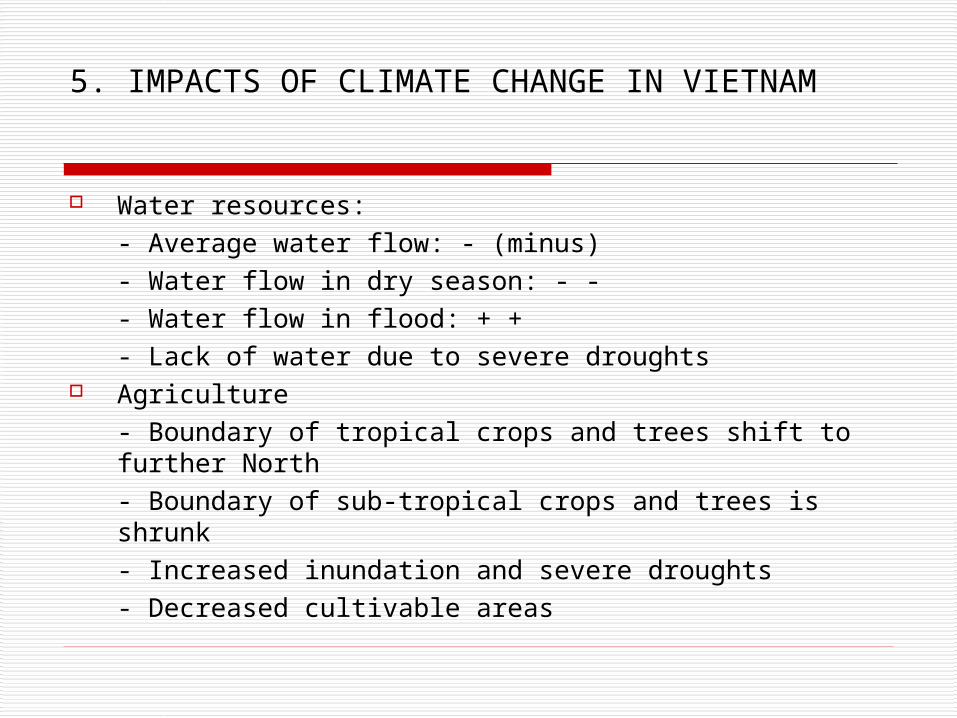
5. IMPACTS OF CLIMATE CHANGE IN VIETNAM
Water resources:
- Average water flow: - (minus)
- Water flow in dry season: - -
- Water flow in flood: + +
- Lack of water due to severe droughts Agriculture
- Boundary of tropical crops and trees shift to further North
- Boundary of sub-tropical crops and trees is shrunk
- Increased inundation and severe droughts
- Decreased cultivable areas
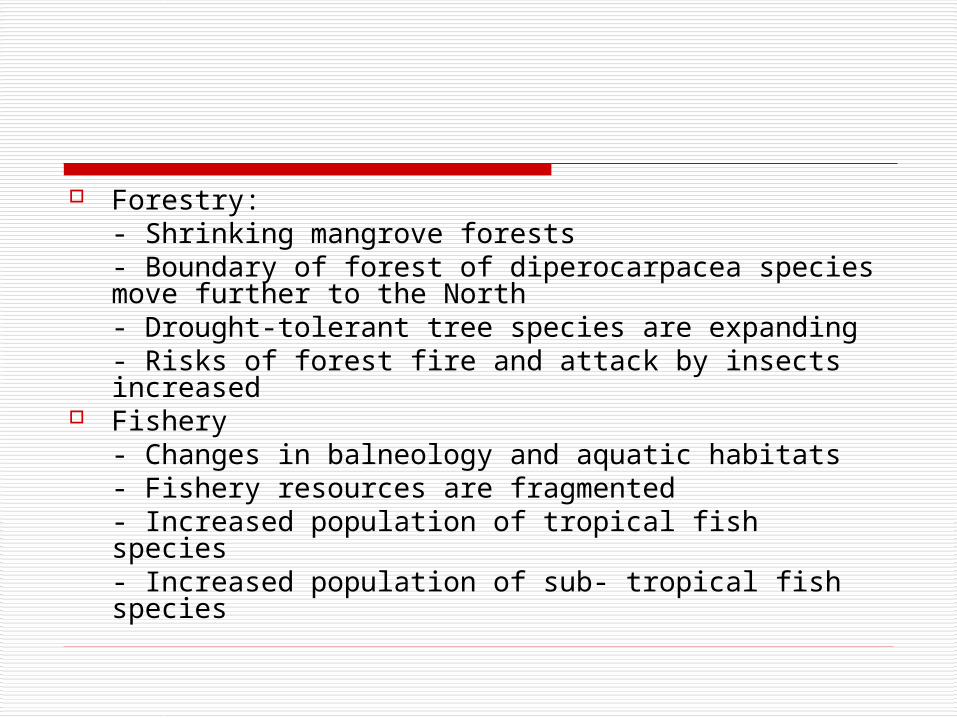
Forestry:- Shrinking mangrove forests- Boundary of forest of diperocarpacea species move further to the North- Drought-tolerant tree species are expanding- Risks of forest fire and attack by insects increased
Fishery- Changes in balneology and aquatic habitats- Fishery resources are fragmented- Increased population of tropical fish species- Increased population of sub- tropical fish species

Impacts on transport and energy Impacts on: Oil exploration facilities in sea Railways in coastal areas Power consumption for domestic use Water flows in rivers and water reservoirs for power generation Impacts on health Negative effects on elder’s health Cardiovascular diseases. tropical diseases…

THANK YOU !


![Vietnam at a glance [Minh Nguyen]](https://static.fdocuments.us/doc/165x107/548bdc37b47959e96d8b4811/vietnam-at-a-glance-minh-nguyen.jpg)


![[Quang nguyen] Continuous Integration XP Day 2015 Vietnam Danang](https://static.fdocuments.us/doc/165x107/55b6e648bb61eb69688b46c6/quang-nguyen-continuous-integration-xp-day-2015-vietnam-danang.jpg)