Climate Change and Crop Production in Nigeria: An …International Journal of Energy Economics and...
15
International Journal of Energy Economics and Policy Vol. 4, No. 2, 2014, pp.297-311 ISSN: 2146-4553 www.econjournals.com 297 Climate Change and Crop Production in Nigeria: An Error Correction Modelling Approach P.B. Eregha Department of Economics, University of Lagos, Akoka, Lagos,Nigeria. Email: [email protected] J.S. Babatolu Department of Geography, Adeyemi College of Education, Ondo, Nigeria. Email: [email protected] R.T. Akinnubi Department of Physics, Adeyemi College of Education, Ondo, Nigeria. Email: [email protected] ABSTRACT: Climate change is termed as one of the greatest challenges of the 21 st century and this has posed threat to agricultural dependent economies. In fact report had it that developing economies are at disadvantage as they stand to experience some of the severe effects from climate change. It is against this backdrop that this paper examines the impact of climate change on crop production in Nigeria. Ten crops were selected and three climatic variables were used for the study. Data for the study were extracted from the Food and Agricultural Organisation database, World Development Indicator and the CBN Statistical Bulletin and the data covers the period 1970-2009. Analysis of data was done with cointegration approach. The study revealed that the effect of climatic variables on crop production varies depending on the type of crop and seasonal properties and length of days of the crop. In general, climate change effect was found to be pronounced on the output of the crops. It is therefore recommended that various adaptation strategies necessary for increased output of these crops be adopted by farmers and this can better be achieved with proper enlightenment programmes for the farmers. Keywords: climate change; global warming; crop production; error correction model JEL Classifications: Q54; Q56 1. Introduction The Intergovernmental Panel on Climate Change (IPCC) stated that climate change is emerging as one of cardinal challenges of the 21 st century (APF, 2007). Human-induced climate change resulting from increase in the concentration of greenhouse gases (GHGs) in the atmosphere and food insecurity are two closely related threats facing mankind in the 21 st century. IPCC observed that unrelenting emission of greenhouse gases into the atmosphere between 1970 and 2004 led to a 70% increase of greenhouse gases into the atmosphere (Omojolaibi, 2011). The gases emitted into the atmosphere include Carbon Dioxide (CO 2 ), methane (CH 4 ), Nitrous Oxide (N 2 O), Hydroflourocarbons (HFCs), Perflorocarbons (PFCs) and Carbon hexafluoride (CF 6 ). All these gases were unambiguously articulated in the Kyoto Protocol. CO 2 among these gases increased over the per capita income and population and thereby contributes to over 40% of the total emission of the GHGs (Odingo, 2009). Climate change due to anthropogenic factors has shown that the globe is warming (Odingo, 2009; IPCC, 2007). Scientific accounts on global warming have indicated that the average global temperature has increased by around 0.7 0 C (1.3 0 F) since the advent of the industrial era (Asafu- Adjaye, 2008). Studies have shown that the trend is accelerating such that the average temperature is rising at 0.2 0 C every decade (IPCC, 2007; Ofori-Boateng, 2012). With the rising level in temperature globally, local rainfall patterns are changing, ecological zones are shifting, the seas are warming and ice caps are melting (IPCC, 2007). African countries and other developing countries have been termed to have been at disadvantage as the tropical areas stand to experience some of the most severe effects
Transcript of Climate Change and Crop Production in Nigeria: An …International Journal of Energy Economics and...

International Journal of Energy Economics and Policy
Vol. 4, No. 2, 2014, pp.297-311
ISSN: 2146-4553
www.econjournals.com
297
Climate Change and Crop Production in Nigeria: An Error Correction
Modelling Approach
P.B. Eregha
Department of Economics, University of Lagos,
Akoka, Lagos,Nigeria. Email: [email protected]
J.S. Babatolu
Department of Geography, Adeyemi College of Education,
Ondo, Nigeria. Email: [email protected]
R.T. Akinnubi
Department of Physics, Adeyemi College of Education,
Ondo, Nigeria. Email: [email protected]
ABSTRACT: Climate change is termed as one of the greatest challenges of the 21st century and this
has posed threat to agricultural dependent economies. In fact report had it that developing economies
are at disadvantage as they stand to experience some of the severe effects from climate change. It is
against this backdrop that this paper examines the impact of climate change on crop production in
Nigeria. Ten crops were selected and three climatic variables were used for the study. Data for the
study were extracted from the Food and Agricultural Organisation database, World Development
Indicator and the CBN Statistical Bulletin and the data covers the period 1970-2009. Analysis of data
was done with cointegration approach. The study revealed that the effect of climatic variables on crop
production varies depending on the type of crop and seasonal properties and length of days of the crop.
In general, climate change effect was found to be pronounced on the output of the crops. It is therefore
recommended that various adaptation strategies necessary for increased output of these crops be
adopted by farmers and this can better be achieved with proper enlightenment programmes for the
farmers.
Keywords: climate change; global warming; crop production; error correction model
JEL Classifications: Q54; Q56
1. Introduction
The Intergovernmental Panel on Climate Change (IPCC) stated that climate change is
emerging as one of cardinal challenges of the 21st century (APF, 2007). Human-induced climate
change resulting from increase in the concentration of greenhouse gases (GHGs) in the atmosphere
and food insecurity are two closely related threats facing mankind in the 21st century. IPCC observed
that unrelenting emission of greenhouse gases into the atmosphere between 1970 and 2004 led to a
70% increase of greenhouse gases into the atmosphere (Omojolaibi, 2011). The gases emitted into the
atmosphere include Carbon Dioxide (CO2), methane (CH4), Nitrous Oxide (N2O), Hydroflourocarbons
(HFCs), Perflorocarbons (PFCs) and Carbon hexafluoride (CF6). All these gases were unambiguously
articulated in the Kyoto Protocol. CO2 among these gases increased over the per capita income and
population and thereby contributes to over 40% of the total emission of the GHGs (Odingo, 2009).
Climate change due to anthropogenic factors has shown that the globe is warming (Odingo,
2009; IPCC, 2007). Scientific accounts on global warming have indicated that the average global
temperature has increased by around 0.70C (1.3
0F) since the advent of the industrial era (Asafu-
Adjaye, 2008). Studies have shown that the trend is accelerating such that the average temperature is
rising at 0.20C every decade (IPCC, 2007; Ofori-Boateng, 2012). With the rising level in temperature
globally, local rainfall patterns are changing, ecological zones are shifting, the seas are warming and
ice caps are melting (IPCC, 2007). African countries and other developing countries have been termed
to have been at disadvantage as the tropical areas stand to experience some of the most severe effects

International Journal of Energy Economics and Policy, Vol. 4, No. 2, 2014, pp.297-311
298
from climate change and agriculture which takes a significant part of employment and food provision
in Africa is the most sensitive to climate variability.
The challenges of climate change became so pronounced that in 1992, at the Rio Earth
Summit Agenda, the United Nations Framework Convention on Climate Change (UNFCCC) was
signed as the first commitment of the world to control the emission of GHGs (Redgwell, 2008;
Oniemola, 2011). The UNFCCC constitutes the crucial global discussion forum on climate change as
to the scope and timing of a potential agreement to combat climate change issues globally.
Consequently, the Kyoto Protocol to the UNFCCC concretise the commitment of the world to bring
the emission under control by officially setting the standards for GHGs emission in developed
countries specifically at least 5.2 below the 1990’s level for the 2008-2012 period (Redgwell, 2008).
The Kyoto Protocol sets up four mechanisms which Annex 1 parties (developed countries) may use in
complying with part of their GHGs emission reduction commitments. These include Carbon Balance,
Market for Pollution Permit (Emission Trading), Joint Implementation and Clean Development
Mechanism (Glazewski, 2008).
Reports opined that increasing global temperature is likely to boost agricultural production in
the temperate regions; it is expected to reduce yields in the tropical regions of the world (WTO -UNEP
2009). It is projected that many African regions will suffer from drought and floods with greater
frequency and intensity in the nearest future (IPCC, 2007). The report further observed that the rise in
average temperature between 1980/1999 and 2080/2099 would be in the range of 3-40C across the
entire African continent which is 1.5 times more than the global level. The report continued that
Africa’s Mediterranean region will experience a decrease in precipitations during the century. These
dry conditions would affect the northern boundary of Sahara and West African coast where Nigeria
lies.
Agriculture remains the mainstay of the majority of households in Nigeria and is a significant
sector in Nigeria’s economy. The significance of the agricultural sector to Nigeria’s economy cannot
be overemphasized as it is catalyst for food provision, contribution to the gross domestic product,
provision of employment, provision of raw materials for agro-allied industries, and generation of
foreign earnings. A sectoral analysis in 2006 of the real GDP indicated that the agricultural sector
contributed to about 42 percent of the GDP compared with 41.2 percent in 2005 (CBN, 2011). The
growth rate of the contribution of the agricultural sector to the GDP at 1990 constant basic prices grew
from 4.2 percent in 2002 to 7.2 percent in 2006. The agricultural sector also employed over 60 percent
of the total labor force in Nigeria in 1999.
Crop production takes a significant aspect of agricultural production and exports in Nigeria.
Generally, there are many factors influencing crop production and these include soil, relief, climate
and diseases among others. In relation to climate, rainfall is one of the dominant controlling variables
in tropical agriculture since it supplies soil moisture for crops. Nigeria's wide range of climate
variation allows it to produce a wide variety of food and cash crops (Tunde et. al., 2011). Climate is an
important resource to crop production in Nigeria especially in the rainforest zone of Nigeria as farmers
depend largely on rain for agriculture (Onyeneke, 2010). Studies indicate that Africa’s agriculture is
negatively affected by climate change (Pearce et al., 1996; McCarthy et al., 2001; Onyeneke, 2010)
and that adaptation is one of the policy options for reducing the negative impact of climate change
(Adger et al., 2003; Kurukulasuriya and Mendelsohn, 2006).
However, food production could not keep pace with population increase. Food shortage is
therefore linked with climate change. Today, climate change and food insecurity are twin devils that
have been identified as urgent world problems. This is because food security which is mainly from
agriculture threatened by the emergence of climate variability as agriculture serves as one of the
sensitive sectors to this threat. Over 60% of the Nigerian populace depends so much on agriculturally
related activities for sustenance and crop production takes significant aspect of agricultural related
activities in Nigeria. For instance, crop production contributes more than 80% of Agricultural GDP
and more than 48% of total non-oil GDP in Nigeria (CBN, 2011). Ayinde et al. (2011) opined that
climatic fluctuation is putting Nigeria’s agriculture system under serious threat and stress. This implies
that rural sustenance and food security in Nigeria is under serious threat as crop production takes
significant aspect of agricultural activities in Nigeria. It is against this backdrop that this present study
examines the impact of climate change on different varieties of crops in Nigeria.

Climate Change and Crop Production in Nigeria: An Error Correction Modelling Approach
299
This study is therefore justified on the basis that empirical studies on the impacts of climate
change on long-run crop production in Nigeria are scanty. Few studies that are available never
considered econometric methodology and modelling approaches that first consider theoretical link
between climatic variables and crop output. The time coverage of these studies is small besides the
exclusion of other main climate variables that affect crop production like carbon emission (CO2) in the
atmosphere. Thus, the study bridges these gaps by adopting and applying a coherent and consistent
model that explains the relationship between climate change variables and varieties of crops produced
in Nigeria.
2. Background Issues
2.1 The Issue of Global Emission and the Nigerian Ecosystem
An understanding of the issue of global emission or climate change issue is germane to the
robustness of this paper; hence it is briefly discussed here. At the global level, a country may generate
global warming through the emission of industrial pollutants and destroys the ozone layer which might
affect other countries that might not be emitting as the emission leads to accumulation of GHGs in the
atmosphere that creates concern for the globe. Such pollution is termed trans boundary externality
(IPCC, 2000).
In a global context, externalities are specified in terms of distinction between polluting and
victim countries. However, the main problem here in the issue of global emission is how to internalize
the externality that is the implementation of polluter pays principle, at the global level. This is a case
of multilateral externality. This is because global emission involves several polluters and several
victims, uncertain on the source and the direction of externalities. This makes it a global concern as
each country is termed a polluter and a victim (Odingo, 2009).
In the model of social optimum with externalities, which is the standard model of
environmental policy, general equilibrium implies that global emission is the cumulated sum of
unitary emissions, independent of the origin and the nature of each unit of emission (Asafu-Adjaye,
2005). The underlying hypothesis is termed uniformly mixing pollutants. This hypothesis is therefore
plausible only for the global warming case, as contribution of a unit of CO2 to the accumulation of
GHGs in the atmosphere is the same wherever it was produced. For instance, a unit of CO2 generated
in the polar area or in a tropical area will contribute to same extent to the global warming, but the polar
agriculture will benefit from the global warming whereas the African agriculture will likely suffer
from it. However, acid rain impacts will differ from one country to another, depending on the soils
characteristics, distance from the source of pollution, and the direction of the dominant winds (IPCC,
2000).
Nigeria contains six ecological zones, ranging from a belt of mangrove swamps and tropical
forests along the coast to open woodland and savanna on the low plateau which extends though much
of the central part of the country, to the semi-arid plains in the north and highlands to the east. The
principal food crops are yams, cassava, and maize to the south, and millet, sorghum, and cowpeas in
the drier north. Cocoa, rubber, oil palm, groundnuts, and cotton are the main crops which are generally
destined for export. Between the arid north and the moist south lies a Guinea Savanna Zone sometimes
referred to as the middle belt. This area produces staples such as yams, sorghum, millet, cassava,
cowpeas, and corn, with rice an important crop in some places. The middle belt's southern edge
represents the lower limits of the northern grain-dominated economy. The most significant commercial
crop of the middle belt is sesame (or benniseed).
Rainfall is heaviest in the south, where the rain forests and woodlands benefit from abundant
precipitation and relatively short dry seasons. Root crops are the staples in the south, including
cassava, yams, taro (cocoyams), and sweet potatoes. The cash crops in the south are tree crops, which
in general are grown on large plantations that include cacao, oil palm, and rubber. However, almost 85
percent of Nigeria’s current palm oil production is from unorganized wild groves. The northern third
of Nigeria experiences a dry season of five to seven months, and lies mostly in the Sudan and Sahel
Savanna zones. Staples in the north are millet, cowpeas, and a drought-resistant variety of sorghum
known as guinea corn. Sorghum is Nigeria’s most widely cultivated grain, accounting for more than
45 percent of the total area. Sorghum cultivation spans from the north to the middle belt where
precipitation and soil moisture levels are low. Corn is also cultivated, as well as rice in suitable
lowland areas. Wheat is a fadama (lowland) crop, irrigated along broad valley bottoms in the north,

International Journal of Energy Economics and Policy, Vol. 4, No. 2, 2014, pp.297-311
300
especially in the Lake Chad basin. The north's principal commercial crops are cotton and groundnuts
(USDA, 2000).
2.2 Agriculture and the Nigerian Economy
2.2.1 Agricultural Production in Nigeria
A trend analysis of Central Bank of Nigeria statistical data (2007) as shown in Figure 1 indicates
that percentage of agricultural contribution to GDP (agGDP) falls below 40% in the early 80s but
however, increased to above 40% between 1986 and 1989 but fell to less than 30% in 1990. The
agricultural contribution to GDP was above 50% between 1993 and 1994.
The period 1986-1994 was the Structural Adjustment Programme (SAP) period and a closer
look at this Figure shows that the programme never had a meaningful impact on the agricultural sector
as the contribution to GDP in the post SAP period average just little above 40%. However, agricultural
contribution to total non oil GDP (agNGDP) as shown in Figure 1 was less than 50% contribution in
1981-1982 but the contribution increase above 50% from 1983 till 1990 when it fell below 40%
contribution. It later bounced back to above 50% contribution from 1991 till date. The advent of oil in
the early 1970s made Nigeria highly dependent on oil revenue, with the performance of the
agricultural sector adversely affected over years. Though the growth rate in the agricultural sector in
Nigeria increased from an average of about 3 percent in the 1990s to about 7 percent in mid 2000, the
food security/sufficiency status of Nigerians continued to decline. (CBN Bulletin, 2007).The dismal
performance of the agricultural sector in terms of its contribution to Nigeria’s yearly total revenue in
the last three decades prompted the government to initiate several agricultural schemes and programs
to enhance agricultural productivity in Nigeria.
2.2.2 Crop Production in Nigeria
Using same data sources as in Figures 1 and 2, the percentage contribution of crop production
to total agricultural production (crpAG) in Nigeria can be shown. It is evident from the figure that
crops production to agricultural output takes a significant aspect. This is revealed from the figure that
crop production takes above 80% of agricultural output in Nigeria.
This invariably means that Nigeria’s agricultural sector is predominantly dominated by crop
production. It implies that any adverse effect on crop production will alter the contribution of
agriculture to GDP in Nigeria.
Figure 3 shows the percentage contribution of selected crops production to total crop output in
Nigeria. The figure indicates that cassava production takes the lead in its production contribution to
total crop output in Nigeria. Though, it is evident in the early 80s that cassava production contribution
was insignificant as it fell below 2% but increased to above 15% contribution and above 20%
contribution in the year 1986 and 1991-1994 respectively. It maintained its lead all through. This is
followed by yam and sorghum production respectively. Besides sorghum production that takes the
third position in terms of contribution to total crop output in Nigeria, the remaining crops take less
than 5% percentage contribution to total crop output. This is also confirmed by Figure 4 that shows
the output of the selected crops in Nigeria.

Climate Change and Crop Production in Nigeria: An Error Correction Modelling Approach
301
Figure 4 indicates that the output of cassava was insignificant from 1970-1984 but takes the lead
from 1985 to date. This is followed by the output of yam production.
2.3 Climatic Condition and Agricultural Production
2.3.1 Climatic Condition in Nigeria
Figure 5 reports trend analysis of Nigeria’s temperature and rainfall situations. The graph indicates
that temperature in Nigeria is rising overtime. It is evident from the graph that Nigeria has had a fair

International Journal of Energy Economics and Policy, Vol. 4, No. 2, 2014, pp.297-311
302
distribution of temperature except for the early part of the 1970’s and 2000’s. This implies that
temperature in Nigeria experienced a dwindling and fluctuating trend in the early 70’s and 2000’s.
And this recent fluctuating trend might have detrimental effect on agricultural production.
In terms of rainfall as shown in Figure 5, there has been declining trend throughout the study
period. The rainfall trend shows fluctuating trend throughout the period besides being on a decline
trend.
Note: Rainfall (mm); temperature (
oC).
2.3.2 Carbon Emission in Nigeria
As earlier stated, among the gases emitted to the atmosphere contributing to GHGs, CO2 emission
contributes more than 40%. It is on this basis that we examine the trend of CO2 emission in Nigeria in
comparison with South Africa being termed as the highest contributor to CO2 emission in Africa.
Table 1 shows CO2 emission for Nigeria, South Africa, Sub-Saharan Africa and the World.
Table 1: Carbon Emission (Co2) Emission in Nigeria, South Africa (SA) and Sub
Saharan Africa (SSA) and the World
Year Nigeria (Kt) SA (Kt) SSA (kt) World (Kt)
1971-1975 46,594 175153 284546 16340552
1976-1980 58511 208506 337314 18702774
1981-1985 66202 294102 436688 18990602
1986-1990 58282 335511 478023 21474350
1991-1995 50354 345225 484647 22694215
1996-2000 48953 368366 520595 24239605
2001-2008 94037 398569 623816 28787784 Source: World Development Indicator Database, 2012.
It is evident from the table that Nigeria’s CO2 emission is less than half of the emission by
South Africa. This is confirmed by the fact that Nigeria’s average CO2 emission for the period 1971-
1975 was 46,594 kt compared to South Africa with CO2 emission of 175,153 kt. Between 1976-1980
the average CO2 emission for Nigeria and South Africa were 58511kt and 208506kt respectively. The
trend of the differences in the two countries remained the same as South Africa proved to emit more
than twice the emission of Nigeria. Though, the population of Nigeria is far beyond that of South
Africa, it is evident that population increase is not the reason behind the huge differences between
these countries emission rate. It is not far from the fact that South Africa engages in more industrial
activities than Nigeria and uses more carbon emitting energy than Nigeria.
For instance, Figure 6 shows the trend of the percentages of Nigeria (NigSSA) and South
Africa(saSSA) CO2 emission in total Sub-Saharan African (SSA) CO2 emission in the world. It
evident from this graph that South Africa contributes to more than 60% of the total CO2 emission in

Climate Change and Crop Production in Nigeria: An Error Correction Modelling Approach
303
SSA. The Sub-Saharan Africa region is made up of over 50 independent countries however it is shown
from the above graph than emission from South Africa alone is above 60% on the average during the
period under study. Nigeria emits less than 20% on the average to the total SSA CO2 emission in the
world. This is also clearly shown in Figure 7.
Figure 7 shows the CO2 emission in kilowatts for Nigeria, South Africa and SSA. It is clearly
seen that throughout the 1971-2008 period, Nigeria contributes insignificant amount to total emission
in SSA as against South Africa which takes the lion share of CO2 emission the region.
A cursory look at Figure 8 also indicates that in the world, despite the population of Nigeria,
Nigeria contributes to less than 0.5% of total emission in the world during the period under study as
against South Africa that around 1.5% emission to world total emission. The graph also shows that
SSA region emit less than 2% to total world emission of CO2 on the average for the sample period.
Developed countries of the world take lion share of global emission as against the developing
countries that contribute insignificant amount to world CO2 emission. However, the conflicting and
competing issue is that there is need to reduce GHGs emission in the world but developing countries
need to meet up with current challenges of development and this cannot happen in isolation of GHGs
emission. This is the sticky situation the developing countries of Africa have found themselves.

International Journal of Energy Economics and Policy, Vol. 4, No. 2, 2014, pp.297-311
304
3. Brief Empirical Literature
Empirical literature on the impact of climate variables on agricultural output has left us with
no direction as the results are inconclusive. Previous studies have concluded that temperature and
precipitation are appropriate variables for capturing climate change effects on crop yields in the
temperate and tropical regions respectively (Mendelsohn et al. 1994, Kurukulasuriya and Mendelsohn
2006, Ofori-Boateng, 2012).
Mendelsohn and Dinar (1999) have examined the impacts of climate change on agriculture in
India and Brazil. They employed three different methods for the analysis namely; the Ricardian
method, agro-economic model, and agro-ecological zone analysis. Environmental factors such as farm
performance, land value or net income and traditional economic inputs which are land and labour, and
support systems such as infrastructure were used as explanatory variables in the models. Unlike most
studies, this analysis pointed out the significance of the adaptation. They argue that farmers will adapt
to new condition due to climate change by making production decisions which are in their own best
interests. Crop choice is one of the examples of farmers’ adaptation to warmer weather in the paper.
Wheat, corn, and rice are three crops as examples since the regions in which they grow depend on the
temperature. As temperature gets warmer wheat farmers switch wheat to corn for making profits.
Later, if temperature gets warmer again enough to lose profits, farmers adapt to warmer weather thus
switch to rice from corn. The results of the Ricardian method, agro-economic model, and agro-
ecological zone analysis showed that increase in temperature will decrease the crop production
especially the crops grown in cool areas such as wheat. However, the authors argue that the result of
the Ricardian method suggests that farmers’ ability to adapt to new condition will mitigate the impacts
of climate change in the long run while the agro-economic model and agro-ecological zone analysis
would be more suitable for short run analysis since the adaptation is not included in the models.
Mathauda et al. (2000) investigated the effects of temperature change on rice yield in the
Punjab region in India by using the CERES RICE simulation model between 1970 and 1990. They
stratified the weather scenario by 5 different conditions which are normal weather, slight warm (0.5°C
increase in temperature), moderate warm (1°C increase), greater warm (1.5°C increase), and extreme
warm (2°C increase) in the simulation model. The model predicted that temperature increase decreases
rice yield by 3.2% in slight warm, 4.9% in moderate warm, 8.2% in greater warm, and 8.4 % in
extreme warm condition compared to normal condition scenario. The result also showed that an
increase in temperature negatively affects not only rice production but also other rice attributions such
as biomass, crop duration, and straw yield.
Torvanger et al. (2004) analyzed climate change impacts on agricultural production in Norway
for the period 1958-2001. The study employed time series data with a biophysical statistical model to
examine the dynamic linkages between yields of potatoes, barley, oats, wheat and climate change
variables such as temperature and precipitation. The study found that there is a positive impact on
yields from temperature in 18% of the crops. The effect is found to be strongest for potatoes.

Climate Change and Crop Production in Nigeria: An Error Correction Modelling Approach
305
Regionally, the study revealed that temperature is likely to be a more important limiting factor for crop
growth in Northern Norway than other regions. The effect of precipitation found to be negative in 20%
of the cases.
Seo et al. (2005) analyzed the climate change impacts on Sri Lankan agriculture using the
Ricardian method and five AOGCM experimental models. The model analyzed the net revenue per
hectare of the four most important crops (rice, coconut, rubber, and tea) in the country. This paper
focused more on the precipitation effect on crop production while most literatures usually analyze the
temperature effect. It is mainly due to the greater range of precipitation across the country although the
limited range of temperature variation allows only a simple test of temperature impacts in the study.
Both the Ricardian method and five AOGCM experimental models revealed that the effects of
increase in precipitation are predicted to be beneficial to all crops tested and the benefit ranges from 11
% to 122 % of the current net revenue of the crops in the model. On the other hand, the impacts of
increase in temperature are predicted to be harmful to the nation and the loss ranges from−18 % to−50
% of the current agricultural productivity.
Kabubo-Mariara and Karanja (2007) found in Kenya that there is a non-linear relation
between temperature and crop revenue on one hand and between precipitation and crop revenue on the
other. De (2009) identified temperature and precipitation as significant variables in explaining the
impact of climate change in Zimbabwe while Dell et al. (2008) established across several studies of
the world that temperature has a large negative effect on growth but only in poor countries. They
futher show that precipitation has no significant effect on growth in both rich and poor countries.
Basak (2009) analyzed climate change impacts on rice production in Bangladesh by using
simulation model. The model is specifically focused on Boro rice production which accounts for 58%
of the total rice production during 2008 in Bangladesh to estimate the effects of future climate change.
Soil and hydrologic characteristics of the locations, typical crop management practices, and traditional
growing period and climate data in 2008 were used for the analysis and temperature and Co2 levels are
controlled in the simulation model called DSSAT (Decision Support System for Agrotechnology
Transfer). The simulation results show that rice production varies in different locations for different
climatic conditions and hydrological properties of soil although same Boro rice was used in all areas.
The model also indicates that rice production decreases drastically from 2.6 % to 13.5 % and from
0.11% to 28.7% when the maximum temperature was increased by 2°C and 4°C. Although the
simulation model shows that a drop in minimum temperature also reduces the rice yield, it suggests
that increase in maximum temperature causes more damage in the production. The model also found
some positive effects of CO2 concentration on the rice yield but the impact was little compared to that
of temperature change.
In Nigeria, Agboola and Ojeleye (2007) examined the impact of climate change on food crop
production in Ibadan. The study adopted both primary and secondary data collection procedures. For
the secondary source of data, time series data covering 30 years were collected on climate variables
and the analysis was done with bivariate Chi-square and ANOVA supported by graphical illustrations.
The study revealed that farmers have noted various changes in climate conditions over the last two to
three decades. It was further shown that there has been decline in crop yields on food crop production
due to reduction in rainfall and relative humidity and as well as increase temperature.
Ayinde et al. (2011) examined the effect of climate change on agricultural production in
Nigeria and the study covered the period 1980-2002 and adopted time series data. They analyzed their
study with the recent cointegration technique of analysis and revealed that temperature had negative
effect on agricultural productivity while rainfall was found to exert positive effect on agricultural
productivity. Tunde et al. (2011) also analyzed the effect of climate variables on crop production in
Patigi, Kwara State, Nigeria and the study used time series data covering 1999-2008. The analysis was
done by correlation and Ordinary Least Square (OLS) methods without examining the time series
properties of the data. The study revealed that rainfall highly correlated with maize production but
weakly correlated with Millet production and Sorghum. Temperature however was found to correlate
with rice and groundnut production negative.
Jidauna et al. (2012) investigated empirically the effect of climate change on agricultural
activities in selected settlements in Nigeria specifically, the Sudano-Sahelian Region. The study used a
structured questionnaire and focus group approaches for data collection procedures and employed
inferential statistical technique for the analysis. The study found that rainfall and temperature have

International Journal of Energy Economics and Policy, Vol. 4, No. 2, 2014, pp.297-311
306
been on a decline and increase respectively. The effects are decline in crop yield that has attracted the
application of fertilizers and abandonment of farmlands.
Sowunmi and Akinola (2010) empirically examined the effect of climate variability on maize
production in Nigeria. The study specifically analyzed the dynamic link between changes in climate
elements and agronomic parameters for maize production in different ecological zones of Nigeria for
the period 1980-2002. They employed the two-way analysis of variance and the coefficient of
variation techniques of analyses. It was revealed that there exists a significant difference of annual
rainfall, temperature and output of maize in the seven identified ecological zones.
A cursory look at the empirical literatures shows that the studies on the relationship between
climate change and crop production in Nigeria are faced with weak methodological issues that might
have misleading results. Besides, these studies cover shorter time period and specific region or state in
Nigeria that might not give policy recommendation that could be applicable for Nigeria at large.
4. Theoretical Framework and Model Specification
4.1 Theoretical Framework Our empirical framework follows the derivation in Bond et al. (2007). Though, the derivation of this
framework was used for panel study, its theoretical explanation could be used for time series studies as
it best fits in explaining the dynamic linkages between climate variables and agricultural crop
production. This presented as follows. Consider the following simple economy:
.....................................................(1)tT
t t ty AL
...............................................(2)t
t
Ag T
A
where Y is aggregate output, L measures population, A measures labor productivity, and T measures
climate. Equation (1) captures the level effect of climate on production; that is, the effect of current
temperature or precipitation on crop yields. Equation (2) captures the growth effect of climate; i.e. the
effect of climate on features such as institutions that influence productivity growth. Taking logs in the
production function and differencing with respect to time, we have the dynamic growth equation:
1( ) .................................(3)t tg g T T
where gt is the growth rate of per-capita output. The “level effects” of climate shocks on output, which
come from equation (1), appear through β . The “growth effects” of climate shocks, which come from
equation (2), appear through γ. The growth equation in (3) allows separate identification of level
effects and growth effects through the examination of transitory weather shocks. In particular, both
effects influence the growth rate in the initial period of the shock. The difference is that the level effect
eventually reverses itself as the climate returns to its prior state. For example, a temperature shock
may reduce agricultural yields, but once temperature returns to its average value, agricultural yields
bounce back. By contrast, the growth effect appears during the climate shock and is not reversed: a
failure to innovate in one period leaves the country permanently further behind. The growth effect is
identified in (3) as the summation of the climate effects over time. The above reasoning extends to
models where climate effects play out more slowly. With more general lag structures in (1) and (2),
the growth effect is still identified by summing the lagged effects of the climate shock. For the
standard distributed-lag result demonstrated formally (see Bond et al., 2007).
4.2 Model Specification
Based on the above theoretical framework, present below is our empirical model to be estimated:
1 11 12 13 ...(4)t t t t toutp temp rain cab
Where, Outp=output of selected crops as indicated below
outp є [ gmz, gml, grc, gbn, gcv, gpt, gym,ggn,gcc, gsh]’ (see Table 2)
1
11 13
int ercepts
coefficients
error term
Temp=temperature (oC) ; rain= rainfall (mm) and cab=carbon emission (Kt)
The dynamic error correction model specification is thus;
Climate Change and Crop Production in Nigeria: An Error Correction Modelling Approach
307
∆outpt =α0+α1 1
n
t
a
outp
+α2 1
n
t
a
temp
+α3 1
n
t
a
rain
+α4 1
n
t
a
cab
+ ecmt-1....(5)
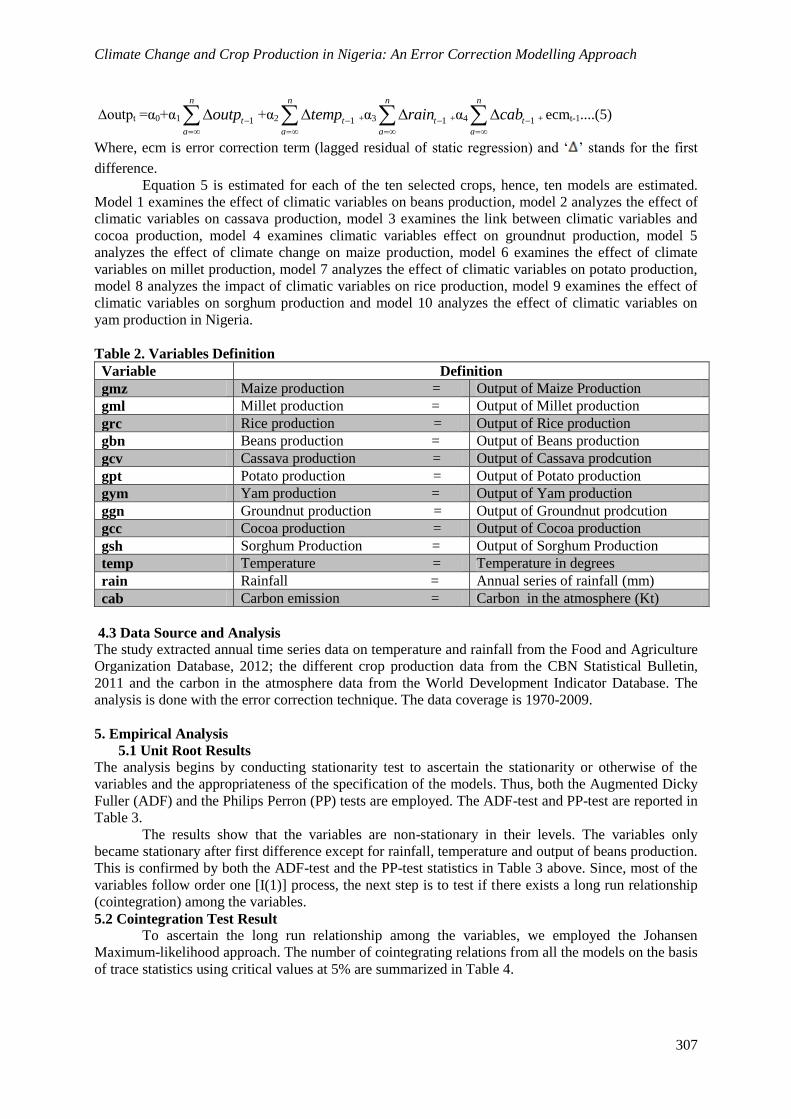
Where, ecm is error correction term (lagged residual of static regression) and ‘ ’ stands for the first
difference.
Equation 5 is estimated for each of the ten selected crops, hence, ten models are estimated.
Model 1 examines the effect of climatic variables on beans production, model 2 analyzes the effect of
climatic variables on cassava production, model 3 examines the link between climatic variables and
cocoa production, model 4 examines climatic variables effect on groundnut production, model 5
analyzes the effect of climate change on maize production, model 6 examines the effect of climate
variables on millet production, model 7 analyzes the effect of climatic variables on potato production,
model 8 analyzes the impact of climatic variables on rice production, model 9 examines the effect of
climatic variables on sorghum production and model 10 analyzes the effect of climatic variables on
yam production in Nigeria.
Table 2. Variables Definition
Variable Definition
gmz Maize production = Output of Maize Production
gml Millet production = Output of Millet production
grc Rice production = Output of Rice production
gbn Beans production = Output of Beans production
gcv Cassava production = Output of Cassava prodcution
gpt Potato production = Output of Potato production
gym Yam production = Output of Yam production
ggn Groundnut production = Output of Groundnut prodcution
gcc Cocoa production = Output of Cocoa production
gsh Sorghum Production = Output of Sorghum Production
temp Temperature = Temperature in degrees
rain Rainfall = Annual series of rainfall (mm)
cab Carbon emission = Carbon in the atmosphere (Kt)
4.3 Data Source and Analysis
The study extracted annual time series data on temperature and rainfall from the Food and Agriculture
Organization Database, 2012; the different crop production data from the CBN Statistical Bulletin,
2011 and the carbon in the atmosphere data from the World Development Indicator Database. The
analysis is done with the error correction technique. The data coverage is 1970-2009.
5. Empirical Analysis
5.1 Unit Root Results
The analysis begins by conducting stationarity test to ascertain the stationarity or otherwise of the
variables and the appropriateness of the specification of the models. Thus, both the Augmented Dicky
Fuller (ADF) and the Philips Perron (PP) tests are employed. The ADF-test and PP-test are reported in
Table 3.
The results show that the variables are non-stationary in their levels. The variables only
became stationary after first difference except for rainfall, temperature and output of beans production.
This is confirmed by both the ADF-test and the PP-test statistics in Table 3 above. Since, most of the
variables follow order one [I(1)] process, the next step is to test if there exists a long run relationship
(cointegration) among the variables.
5.2 Cointegration Test Result
To ascertain the long run relationship among the variables, we employed the Johansen
Maximum-likelihood approach. The number of cointegrating relations from all the models on the basis
of trace statistics using critical values at 5% are summarized in Table 4.

International Journal of Energy Economics and Policy, Vol. 4, No. 2, 2014, pp.297-311
308
Table 3. Unit Root Test Result
Variables
Augmented Dickey Fuller Test Philips Perron Test
Without Trend With Trend Without Trend With Trend
Level 1st Diff. Level 1
st diff. Level 1
st diff. Level 1
st Diff.
gmz 0.68 -6.02* -2.25 -6.34* 0.94 -6.02* -2.23 -6.40*
gml -0.66 -8.99* -4.11** -8.94* -1.09 -13.08* -4.09** -18.35*
grc -0.96 -9.13* -4.16*** -9.01* -1.26 -14.74* -4.16*** -15.88*
gbn -3.90* -5.65* -3.97* -5.65*
gcv 0.06 -5.13* -2.24 -5.12* -2.66 -7.62* -2.83 -7.59*
gpt 0.64 4.60 6.65 -6.18* 0.64 -5.70* -0.74 -6.20*
gym 0.93 -4.33* -1.77 -4.62* 0.36 -4.30* -2.46 -4.63*
ggn -0.45 -8.74* -2.55 -4.72* 0.01 -8.74* -2.39 -25.9*
gcc -2.93 -7.69* -3.06 -7.63 -2.93 -8.17* -3.03 -8.06*
gsh 0.91 -8.88* -3.47*** -9.38* 0.61 -9.68 -3.37*** -10.91
temp -3.73* -4.41* -3.55** -3.34***
rain -4.09* -5.62 -4.13* -5.62*
cab 1.23 -3.64* -1.19 -3.87* 1.26 -3.69* -0.57 -3.86*
Note: *, **, ***, indicate 0.99, 0.95 & 0.90 level of confidence respectively.
Source: E-Views Estimation by authors
Table 4. Cointegration Test Result rank Trace
Stat for
Model 1
Trace
Stat for
Model 2
Trace
Stat for
Model 3
Trace
Stat for
Model 4
Trace
Stat for
Model 5
Trace
Stat for
Model 6
Trace
Stat for
Model 7
Trace
Stat for
Model 8
Trace
Stat for
Model 9
Trace
Stat for
Model 10
r≤0 57.68 64.62* 73.56* 75.51* 71.70* 92.05* 75.76* 81.28* 82.03* 67.32*
r≤1 35.66 42.82* 47.28* 38.57* 40.01* 43.97* 41.84* 46.16* 48.87* 36.94*
r≤2 17.3** 22.80* 25.93* 20.14* 19.39* 20.45* 22.91* 23.88* 28.32* 18.53*
r≤3 4.36** 8.65* 8.76* 8.61* 7.20* 8.40** 7.44* 5.67** 9.42* 6.14**
Note: *,** stand for 0.99 & 0.95 level of confidence
Source: E-Views Estimation by authors
The results of the trace statistics in Table 4 indicate that the hypothesis of no cointegration
among the variables can be rejected for all the ten models. The results revealed that at least four
cointegrating vectors exist among the variables of interest in all the models. Considering the existence
of long run relationship established among the variables as shown in Table 4, the analysis employs an
error correction estimation approach which result is presented in the next section.
5.3 The Error Correction Result
As a result of the existence of unit root problem associated with some of the variables and
establishment of long run relationship with the Johansen cointegration, we proceed to estimate an error
correction model. Table 5 shows the parsimonious error correction result selected based on akaike
information criterion and Schwarz criterion.
The parsimonious error correction result shown in Table 5 indicates that almost all the models
are devoid of serious econometric problems as their Durbin-Watson statistics indicate absence of serial
correction and their F-statistics also passed the significant test except for models 6 and 9. The value of
their coefficient of determinants also exhibited goodness of fit as the explanatory variables explained
above 50% of the variation in each the crops used as dependent variable in the models. The value of F-
statistics implies that there is a considerable harmony between each of the crops in each model as
dependent variable and the explanatory variables put together.
It is evident from the result of model 1 that temperature had significantly negative effect on
beans from production while rainfall was found to have a positive impact on beans production in
Nigeria. However, carbon emission in the atmosphere was found to impact negatively the production
of beans in Nigeria.
This implies that increased temperature and carbon in the atmosphere leads to reduction in the
output of beans production in Nigeria. The error correction variable in the model that passed the
significant test indicates that about 2% of the deviation of beans production from its long run value
will be corrected. In model 2, temperature and rainfall were found to have significantly positive effect

Climate Change and Crop Production in Nigeria: An Error Correction Modelling Approach
309
on cassava production in Nigeria under the study period while carbon emission had significantly
negative effect on cassava production. The error correction variable which passed the significant test
shows that about 16% of the deviation in cassava production from its long run value will be corrected.
For model 3, temperature was found to have a significantly negative effect of cocoa production while
rainfall and carbon emission in the atmosphere were found to impact positively the production of
cocoa in Nigeria. The error correction variable in that model also passed the significant test; hence it
will act to correct about 3% of the deviation of cocoa production from its long run value.
Table 5. Parsimonious Error Correction Result Regressors Model 1 Model 2 Model 3 Model 4 Model 5 Model 6 Model 7 Model 8 Model 9 Model 10
C -21.1* 18.58* -28.5*** 300.9 -102.3 28.25 -3.48 85.92 12.57 16.47
Dep Var(-1) 0.79** 0.21** 0.68 -0.21 -1.44*** -0.13 0.83 1.02* 0.03 0.27
Temp -1.16** -8.34 -17.85* 110.14** -22.37*** 3.61 -2.26 -14.6** 6.48 19.49
Temp(-1) 0.31 -13.46*** 4.71 -150.9** 20.52 -7.96 1.89 -9.55*** -4.99 -10.61
Rainfall 0.05* -0.33 1.17** -6.98*** 4.24*** -0.87*** -1.78 1.07* -0.63** -1.43
Rainfall(-1) 0.20** 1.10*** 1.43 -0.35 3.25** 0.82 0.79*** -0.36 -0.15 -1.07**
carbon 1.49 2.29 -8.23*** 4.63*** -0.86*** -0.27 -0.45** -0.41 -0.46**
Carbon(-1) -0.09** -0.02** 2.33*** -0.87** 1.56 0.35 1.08 -0.24 -0.14** -1.61
ecm(-1) -0.02* -0.16** -0.03** -0.05*** -0.21** -0.06*** -0.07*** -0.18* -0.01 -0.08**
R2 0.78 0.68 0.95 0.76 0.65 0.73 0.71 0.98 0.61 0.53
Durbin-
Watson
2.25 1.83 2.29 2.05 2.02 2.19 2.35 2.23 2.15 2.04
F-statistics 8.56* .79*** 27.3*** 1.59 3.16*** 1.02 3.19** 80.42* 0.79 5.58***
Note: *,**,*** stand for 0.99,0.95 & 0.90 level of confidence respectively.
Source: E-Views Estimation by authors
In model 4, contemporary temperature was found to have positive effect on groundnut
production while lagged or previous temperature was found to have negative effect on groundnut
production. Rainfall was found to have a significantly negative effect on groundnut production while
carbon emission had positive effect on it. The error correction variable also passed the significant test
in the model; hence it could rightly act to correct any deviation of groundnut production from its long
run value for about 5%. For maize production, the model indicates that temperature and carbon
emission had significantly negative effect while rainfall had positive impact on the production of
maize in Nigeria. The error correction variable which was significant as deduced from the result could
rightly act to correct about 21% of deviation of maize production from its long run value. For millet
production as shown from model 6, temperature had negative effect on its production though this was
not significant while rainfall and carbon emission that passed the significant test were also found to
negatively influence the production of millet production in Nigeria. The error correction variable in
this model act to correct about 6% of the deviation of millet production from its long run and this is
significant.
For potato production in Nigeria as shown in model 7, carbon emission and temperature were
found to have insignificant effect on its production while rainfall was found to have a significantly
positive effect on potato production in Nigeria. The error correction variable which is significant
implies that any deviation of potato production from its long run value can be corrected for about 7%.
Model 8 shows that temperature and carbon emission affect negatively the production of rice in
Nigeria, the coefficients are significant. However, rainfall was found to have significantly positive
effect on rice production for the period under study. The error correction variable which is significant
implies that about 18% of deviation of rice production from its long run value is corrected. For the
model of sorghum production which is model 9, the error correction variable never passed the
significant test hence it cannot act to correction sorghum production from any deviation in its long run
value. However, all the explanatory variables were found to have negative effect on sorghum
production in Nigeria. And lastly for yam production as shown in model 10, temperature, rainfall and
carbon emission were all found to impact negatively the production of yam in Nigeria. The error
correction variable was significant; therefore it could rightly act to correction any deviation of yam
production from its long run value.

International Journal of Energy Economics and Policy, Vol. 4, No. 2, 2014, pp.297-311
310
4. Conclusion
This study attempts to examine the effect of climate change on crop production in Nigeria for
the period 1970-2009. The study used three climatic variables namely temperature, rainfall and carbon
in the atmosphere. Ten crops were selected which are beans, cassava, cocoa, groundnut, maize, millet,
potato, rice, sorghum and yam. The study employed an error correction technique of analysis. The
study first examined the stationarity status of the variables with the ADF-test and the PP-test and the
results revealed that all the variables became stationary after first difference except for temperature,
rainfall and output of beans production. We then proceeded to use the Johansen cointegration test to
establish long run relationship before estimating the parsimonious error model. In all, ten models were
estimated, one for each crop with the climatic variables included as explanatory variables. Data for the
study were extracted from the Food and Agriculture Organization database online and the Central
Bank of Nigeria Statistical Bulletin on various issues.
The study revealed that the effect of climatic variables on crop production varies depending on
the type of crop and seasonal properties and length of days of the crop. In general, climate change
effect was found to be pronounced on the output of the crop. This is deduced from the results that
some seasonal crops that are harvested during the raining seasons were found to have been negatively
affected by rainfall. Carbon emission in the atmosphere was also found to have affected the output of
almost all the crops during the sample period. It is therefore recommended that various mitigation and
adaptation strategies necessary for increased output of these crops be adopted by farmers. These
include the use of improved crop varieties that survive adverse climatic conditions, intercropping, soil
conservation, changing planting dates in line with climate changes, tree planting against harsh
temperature and irrigation.
The study suggests further that proper climate forecast is a sin-quo-non in guiding farmers.
There is also the need for enlightenment programmes such as organized seminars for the farmers to be
abreast with modern adaptation strategies.
References
Adger, W.N., Huq, S., Brown, K., Conway, D., Hulme M. (2003), Adaptation to Climate Change in
the Developing World. Progress in Development Studies, 3, 17-28.
African Partnership Forum (APF), (2007), Climate Change and Africa. Berlin, Germany, 22-23, May.
Agboola, T., Ojeleye, D. (2007), Climate Change and Food Crop Production in Ibadan, Nigeria.
African Crop Science Conference Proceedings, 8, 1423-1433. Egypt. African Crop Science
Society.
Asafu-Adjay, J. (2005), Environmental Economics: An Introduction for Non-Economists: Tools and
Policies for Sustainable Development. 2nd
Edition. New Jersey/London/Singapore: World
Scientific Publishing.
Asafu-Adjay, J. (2008), Climate Change and Economic Developemnt, Issues, Challenges and
Opportunities for Africa in the decades ahead. A AERC Senior Policy Seminar X. Addis Ababa,
Ethiopia.
Ayinde, O.E, Muchie, M., Olatunji, G.B. (2011), Effect of Climate Change on Agricultural
Productivity in Nigeria: A Cointegration Modeling Approach. Journal of Human Ecology,
35(3), 185-194
Basak, K. (2009), Climate Change Impacts on Rice Production in Bangladesh: Results from a Model,
Unnayan Onneshan-The Innovators, A Center for Research and Action on Development paper
no. 243
Bond, S.R., Leblebicioglu, A., Schiantarelli, F. (2007), “Capital Accumulation and Growth: A New
Look at the Empirical Evidence,” Mimeo, University of Oxford, Oxford.
Central Bank of Nigeria (CBN). (2011), Statistical Bulletin, Various Issues. Abuja. CBN Research
Department.
Dell, M., Jones, B.F., Olken, B.A. ( 2008), Climate Change and Economic Growth: evidence from the
last half Century. Niber Working Paper 14132. www.niber.org/papers/w14132
Glazewski, J. (2008), Teaching Climate Law and Policy Challenges facing a developing country: A
view from South Africa. www.iucnael.org/index.php (accessed Feb 15, 2010).
IPCC. (2000), Special Report on Emission Scenarios. Cambridge. Cambridge University Press.
IPCC. (2007), Climate Change: Synthesis Report. Cambridge. Cambridge University Press.

Climate Change and Crop Production in Nigeria: An Error Correction Modelling Approach
311
Jidauna, G.G., Dabi, D.D., Dia, R.Z. (2012), The Effect of Climate Change on Agricultural Activities
in Selected Settlements in the Sudano-Sahelian Region of Nigeria. Archives of Applied Science
Research ,4(1), 703-713.
Kabubo-Mariara, J., Karanja, F.K. (2007), The economic impact of climate change on Kenyan crop
agriculture: A Ricardian approach. Global and Planetary Change 57, 319–330
Kurukulasuriya, P., Mendelsohn, R. (2006), A Ricardian Analysis of the Impact of Climate Change on
African Crop Land. CEEPA Discussion Paper No. 8. Centre for Environmental Economics and
Policy in Africa. Pretoria, South Africa: University of Pretoria.
McCarthy, J., Canziani, O.F., Leary, N.A., Dokken, D.J., White, C. (2001), Climate change 2001:
Impacts, Adaptation, and Vulnerability. Contribution of Working Group II to the Third
Assessment Report of the Intergovernmental Panel on Climate Change. Cambridge, Cambridge
University Press.
Mathauda, S.S., Mavi, H.S., Bhangoo, B.S., Dhaliwal, B.K. (2000), “Impact of projected climate
change on rice production in Punjab (India). Tropical Ecology 41(1), 95-98.
Mendelsohn, R. and A. Dinar (1999), “Climate change, agriculture, and developing countries: does
adaptation matter?, TheWorld Bank Research Observer 14, 277–293.
Mendelsohn, R, Nordhaus, W.D., Shaw, D. (1994), The Impact of Global Warming on Agriculture: A
Ricardian Analysis,. American Economic Review, 84(4), 753-771.
Odingo, R.S. (2008), Climate Change and Economic Developemnt, Issues, Challenges and
Opportunities for Africa in the decades ahead. A AERC Senior Policy Semiar X. Addis Ababa,
Ethiopia.
Ofori-Boateng, K. (2012), Climaye Change and Cocoa Production in West Africa. An unpublished
PhD Thesis. Department of Economics, University of Ibadan, Nigeria.
Omojolaibi, J.A. (2011), Climate Change and Sustainable Development in Sub-Saharan Africa: An
Application of Panel Cointegration to Some Selected Countries In: Iwayemi, A, Adenikinju, A,
Iledare, W (eds); Energy, Environment and Economic Growth. Ibadan. Book Merit Publishers.
Oniemola, P.K. (2011), Climate Change and Sustainable Development:Any Way Forward after
Copenhagen? In: Iwayemi, A, Adenikinju, A, Iledare, W (eds); Energy, Environment and
Economic Growth. Ibadan. Book Merit Publishers.
Onyeneke, R.U. (2010), Climate Change and Crop Farmers’ Adaptation Measures in the Southeast
Rainforest Zone of Nigeria. Unpublished M.Sc. Thesis submitted to the Department of
Agricultural Economics, Imo State University Owerri, Nigeria, 112 pp.
Pearce, D., Cline, W., Achanta, A., Fankhauser, S., Pachauri, R., Tol, R., Vellinga, P. (1996), The
Social Costs of Climate Change: Greenhouse Damage and Benefits of Control. In Climate
change 1995: Economic and Social Dimensions of Climate Change, ed. J. Bruce, H. Lee, and E.
Haites. Cambridge: Cambridge University Press.
Redgwell, C. (2008), International Legal response to the challenges of a low carbon future: climate
Change, Carbon capture and storage and biofuels. In Donald N.Z, Redgwell, C, Omorogbe,
Y.O, and Barrrera-Hernandez, L.K (eds) Beyond Carbon Economy: Energy Law in Transition.
New York. Oxford University press.
Seo, S.N., Mendelsohn, R., Munasinghe, M. (2005), Climate change and agriculture in Sri Lanka: A
Ricardian valuation. Environmental Development Econonomics, 10, 581-596.
Sowumi, F.A., Akintola, J.O. (2010), Effect of Climate Change Variability in Maize Production in
Nigeria. Research Journal of Environmental and Earth Sciences, 2(1), 19-30.
Torvanger, A, Twena, M., Romstad, B. (2004), Climate Change Impacts on Agricultural Productivity
in Norway. Centre for International Climate and Environment Research Working Paper 10.
Tunde, A.M, Usman, B.A., Olawepo, V.O. (2011), Effects of Climate Variables on Crop Production in
Patigi LGA, Kwara State, Nigeria. Journal of Geography and Regional Planning, 4(4), 695-
700.
USDA Report (2000), Production Estimates and crop Assessment in Nigeria. Foreign Agricultural
Services. www.fas.usda.gov/pecade/pecade.html
World Trade Organization and the United Nations Environmental (WTO-UNEP) Report (2009), On
Trade and Climate Change. Switzerland. World Trade Organization.
www.wto.org/english/res_e/booksp_e/trade_climate_change_e.pdf