Climate and Energy in California
101
Climate and Energy in Climate and Energy in California California David W. Pierce David W. Pierce Tim P. Barnett Tim P. Barnett Eric Alfaro Eric Alfaro Alexander Gershunov Alexander Gershunov Climate Research Division Climate Research Division Scripps Institution of Oceanography Scripps Institution of Oceanography La Jolla, CA La Jolla, CA
-
Upload
amal-jenkins -
Category
Documents
-
view
23 -
download
2
description
Climate and Energy in California. David W. Pierce Tim P. Barnett Eric Alfaro Alexander Gershunov Climate Research Division Scripps Institution of Oceanography La Jolla, CA. How we got started: a typical climate change result. What does this mean to us ?. IPCC, 2001. - PowerPoint PPT Presentation
Transcript of Climate and Energy in California
Climate and Energy in CaliforniaClimate and Energy in California
David W. PierceDavid W. Pierce
Tim P. BarnettTim P. BarnettEric AlfaroEric Alfaro
Alexander GershunovAlexander Gershunov
Climate Research DivisionClimate Research DivisionScripps Institution of OceanographyScripps Institution of Oceanography
La Jolla, CALa Jolla, CA

How we got started: a typical climate change result
IPCC, 2001
What does this mean to us?

Effect of Climate Change on Western U.S.
• Large and growing population in a semi-arid region
• How will it impact water resources?
• Use an “end-to-end” approach

Project overview
Tim Barnett, SIO; R. Malone, LANL; W. Pennell, PNNL; A. Semtner, NPS; D. Stammer, SIO; W. Washington, NCAR

Step 1
• Begin with current state of global oceans
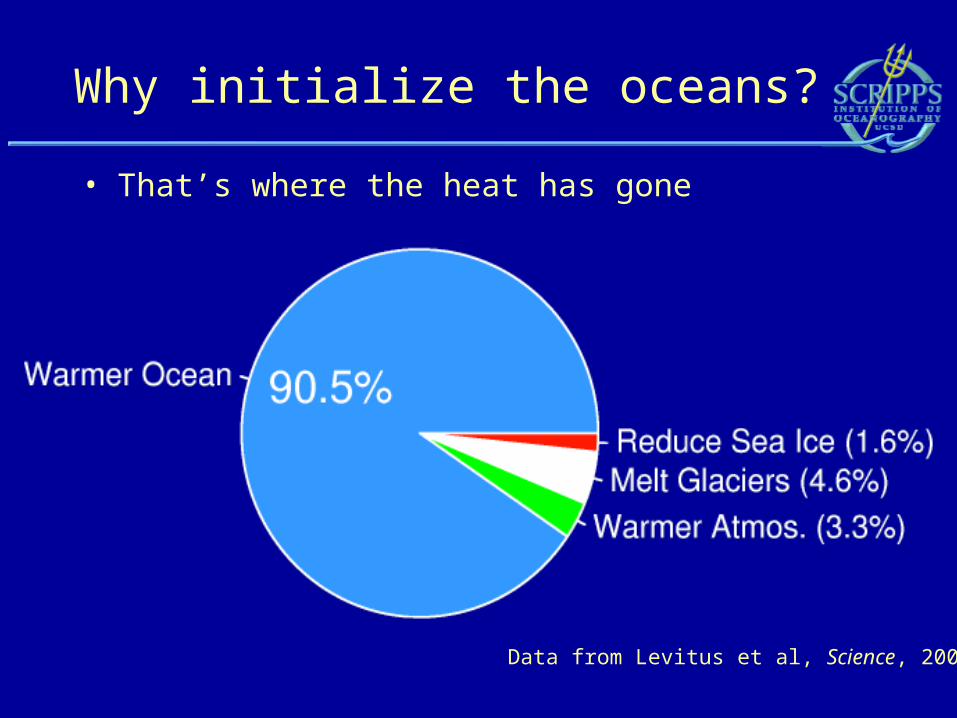
Why initialize the oceans?
• That’s where the heat has gone
Data from Levitus et al, Science, 2001
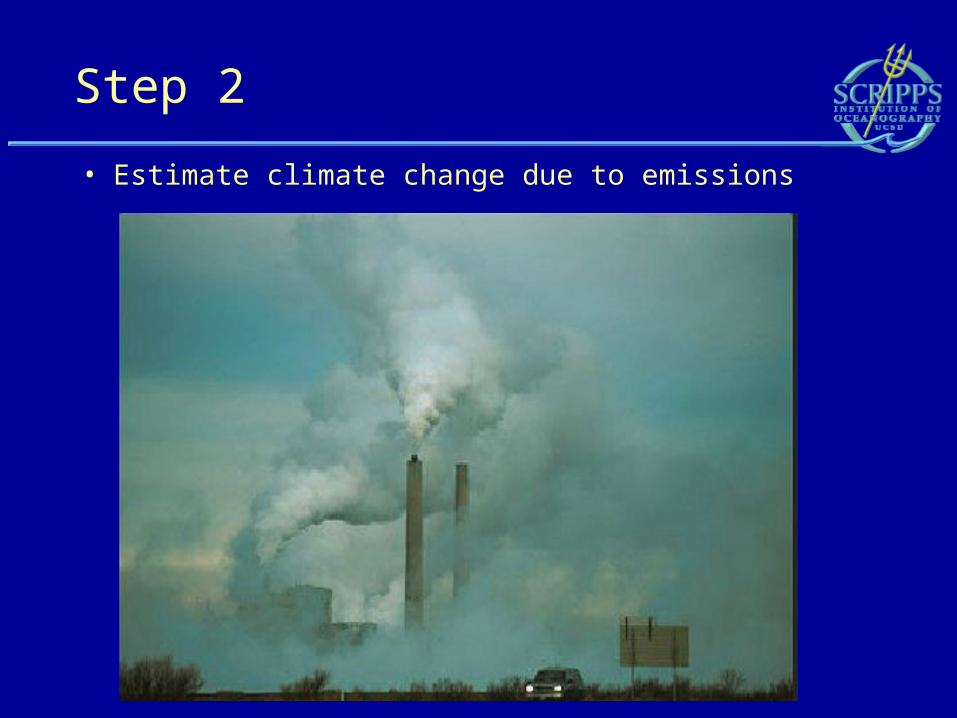
Step 2
• Estimate climate change due to emissions
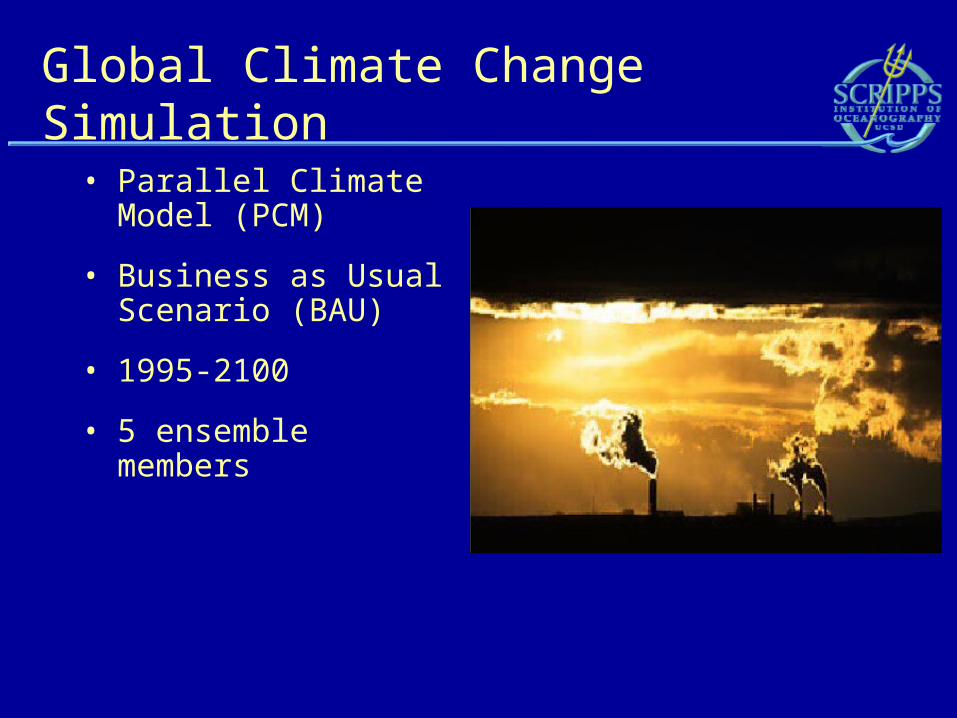
Global Climate Change Simulation
• Parallel Climate Model (PCM)
• Business as Usual Scenario (BAU)
• 1995-2100
• 5 ensemble members
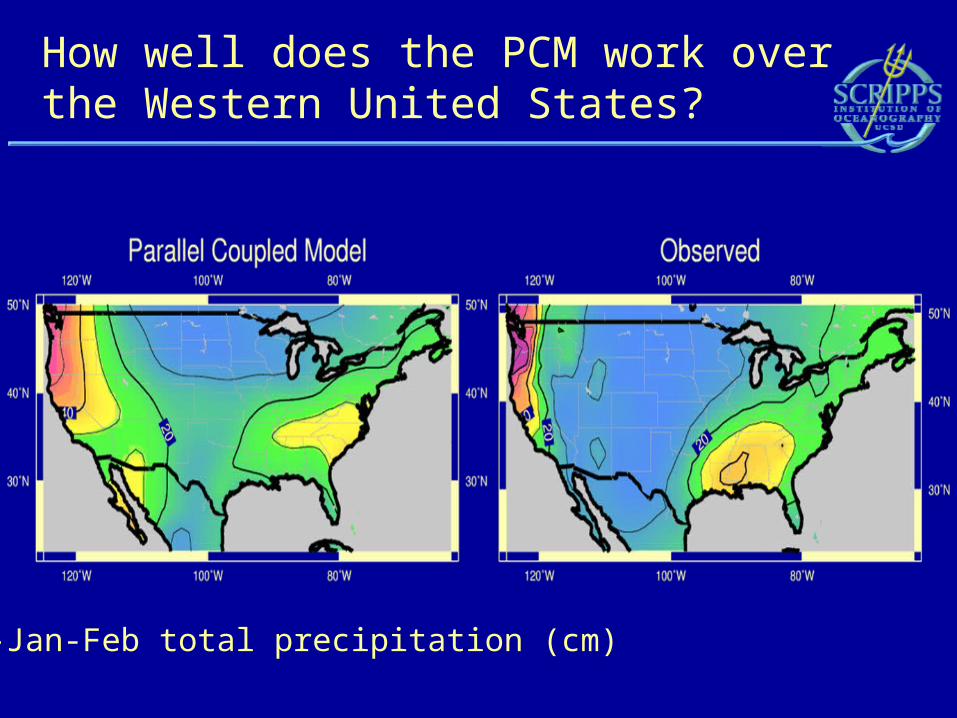
How well does the PCM work over the Western United States?
Dec-Jan-Feb total precipitation (cm)

Step 3
• Downscaling and impacts
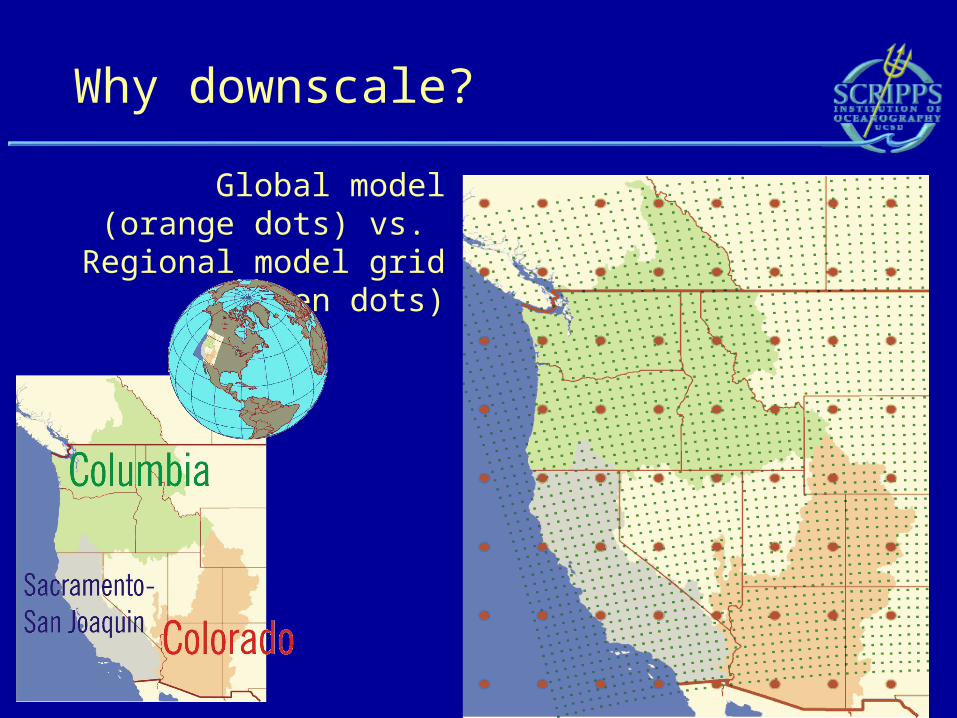
Why downscale?
Global model (orange dots) vs. Regional model grid
(green dots)
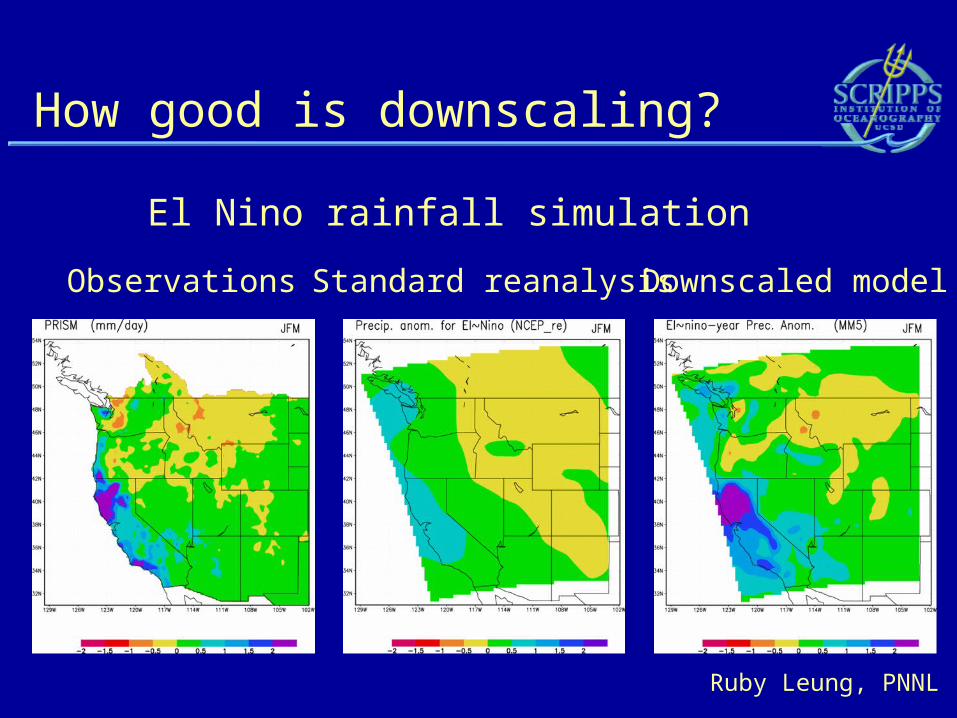
How good is downscaling?
El Nino rainfall simulation
Observations Downscaled modelStandard reanalysis
Ruby Leung, PNNL

Change in California snowpack
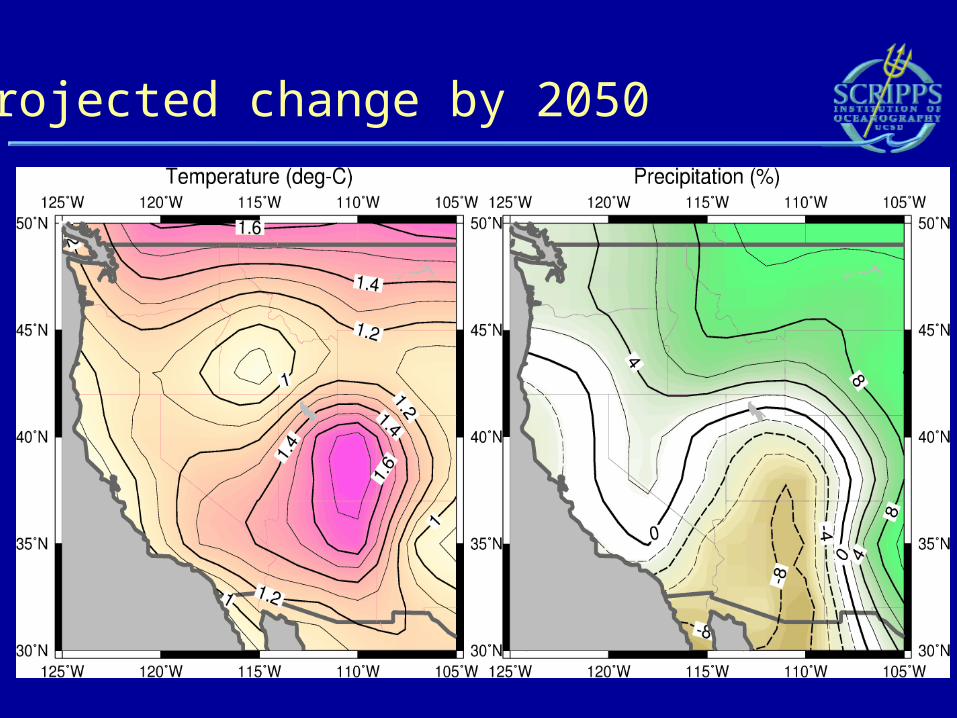
Projected change by 2050

River flow earlier in the year

Runoff already coming earlier
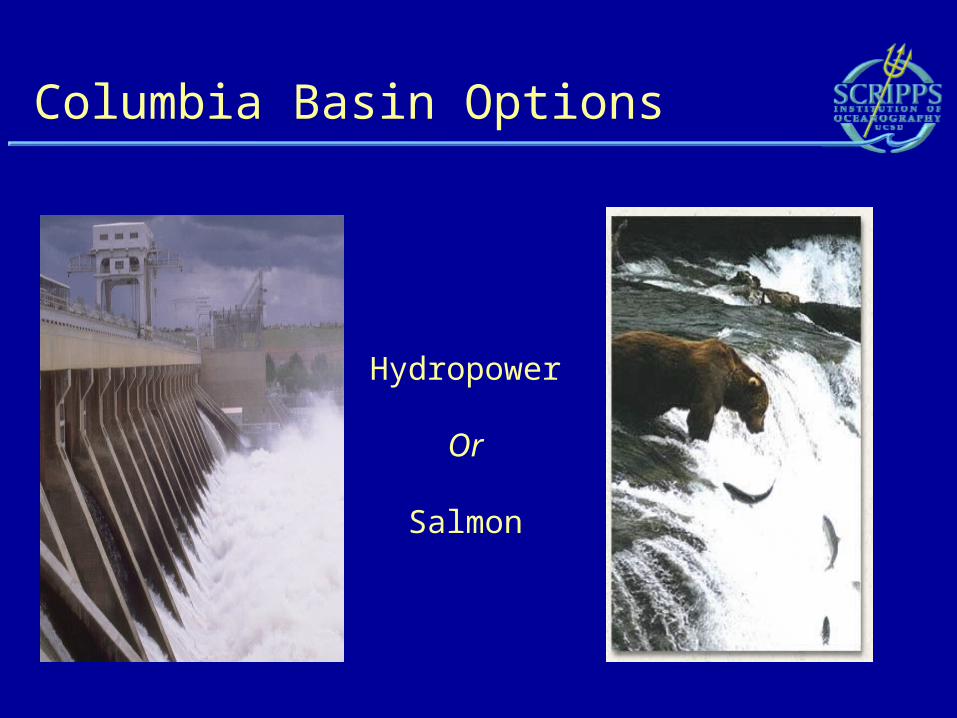
Columbia Basin Options
Hydropower
Or
Salmon

Los Angeles water shortage
Christensen et al., Climatic Change, to appear
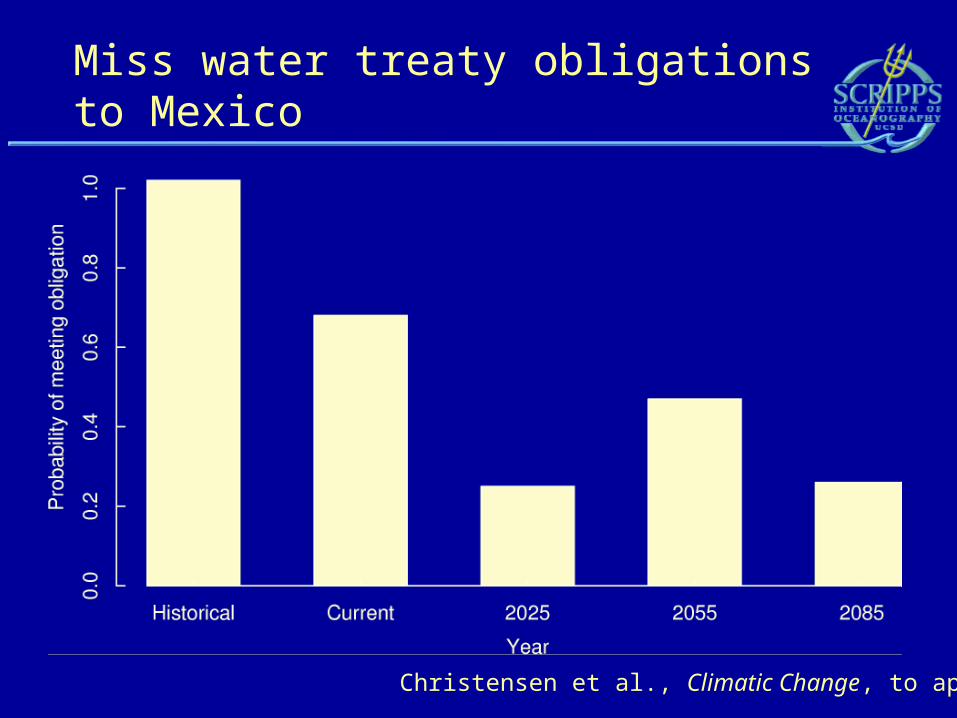
Miss water treaty obligations to Mexico
Christensen et al., Climatic Change, to appear
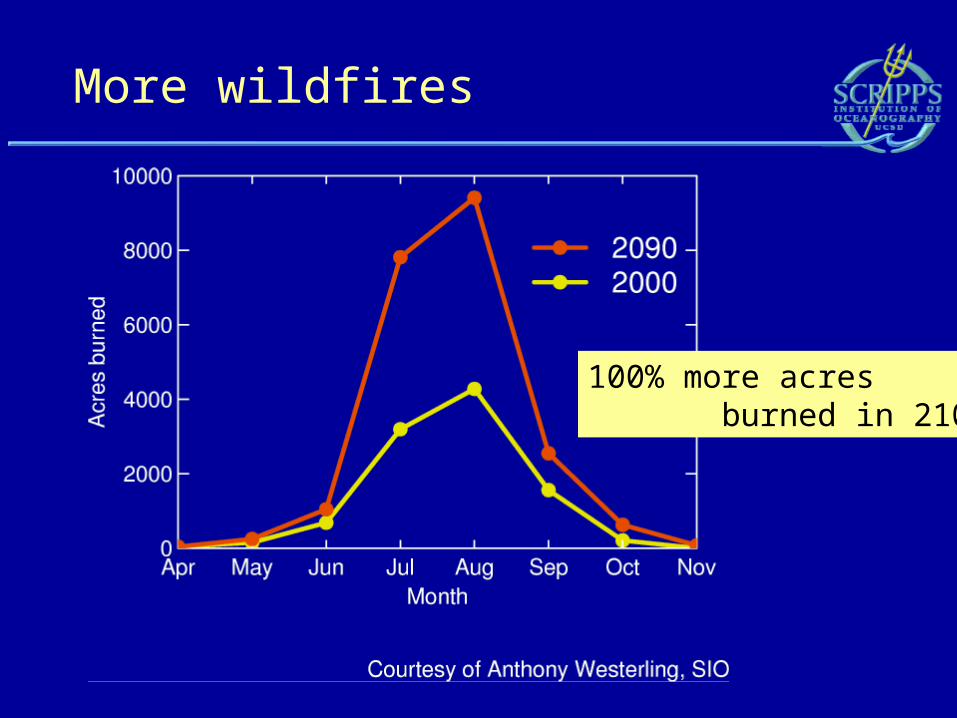
More wildfires
100% more acres burned in 2100
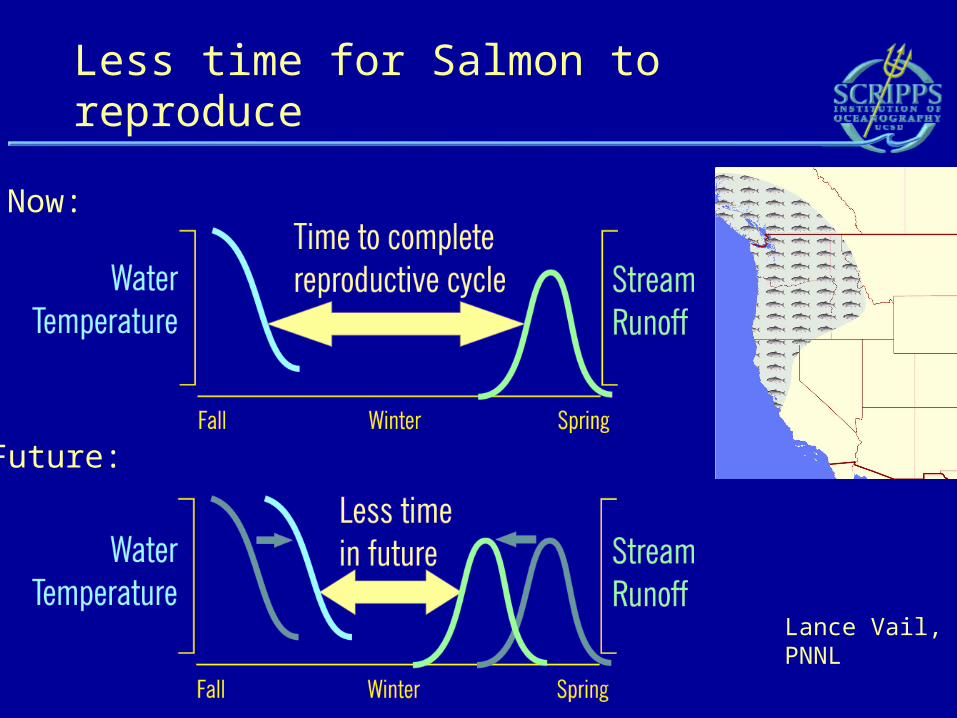
Less time for Salmon to reproduce
Now:
Lance Vail,PNNL
Future:
• A reduction of winter snowpack. Precipitation more likely to fall as rain, and what snow there is melts earlier in the year.
• River flow then comes more in winter/spring than in spring/summer – implications for wildfires, agriculture, recreation, and how reservoirs are managed.
• Will affect fish whose life cycle depends on the timing of water temperature and spring melt.
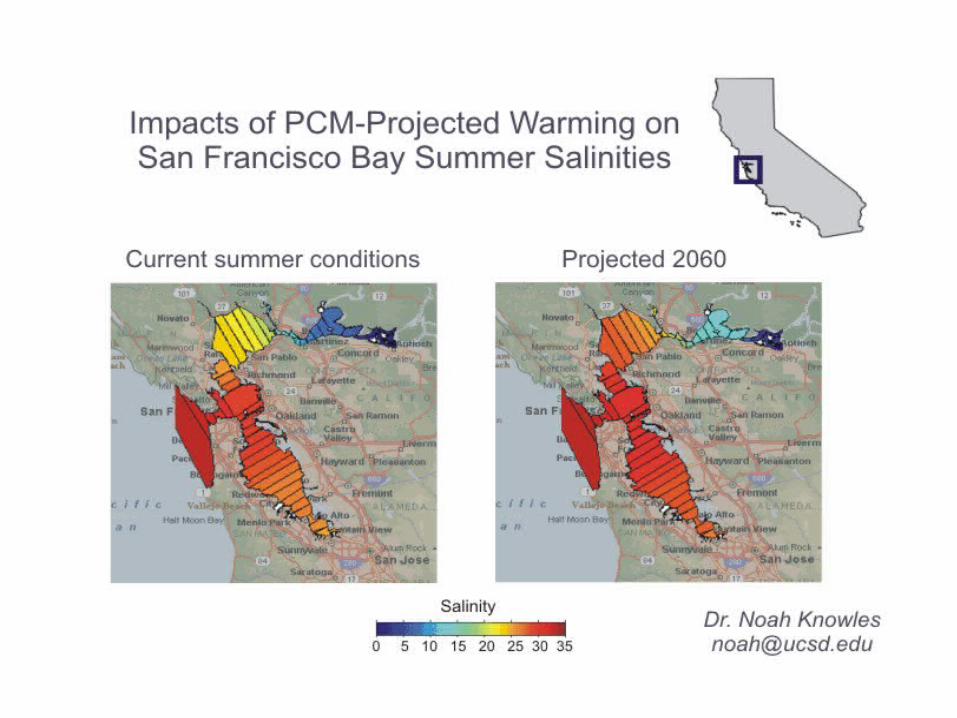
• Will also change salinities in the San Francisco bay.
Climate change conclusions
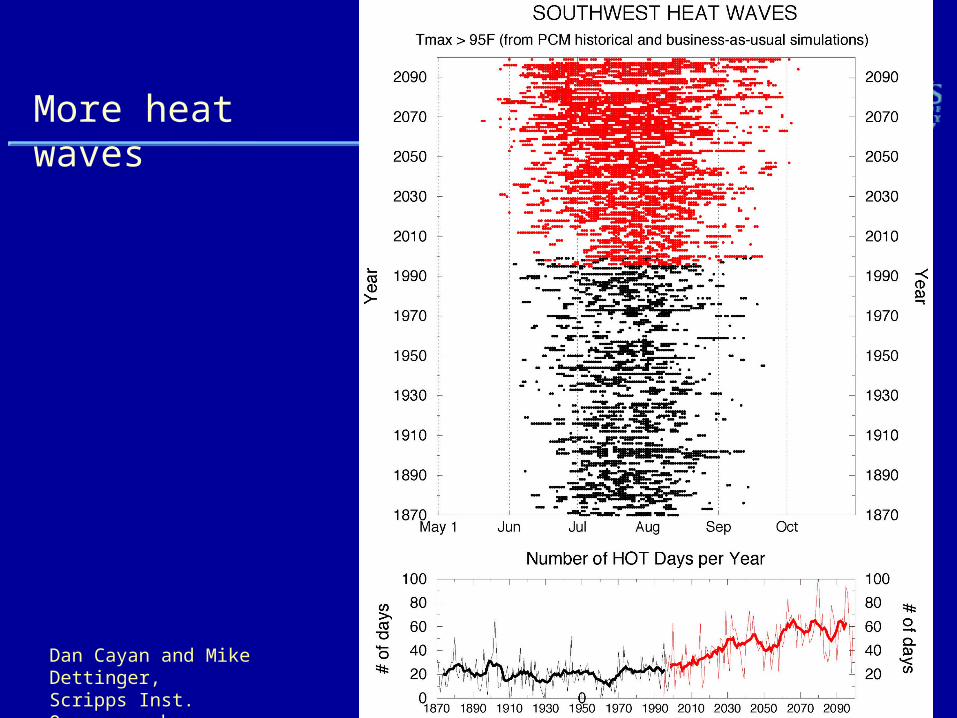
More heat waves
Dan Cayan and Mike Dettinger,Scripps Inst. Oceanography

August daily high temperature, Sacramento, CA
On a warm summer afternoon, 40% of all electricity in California goes to air conditioning

California Energy Project
Objective:
Determine the economic value of climate and weather forecasts to the energy sector
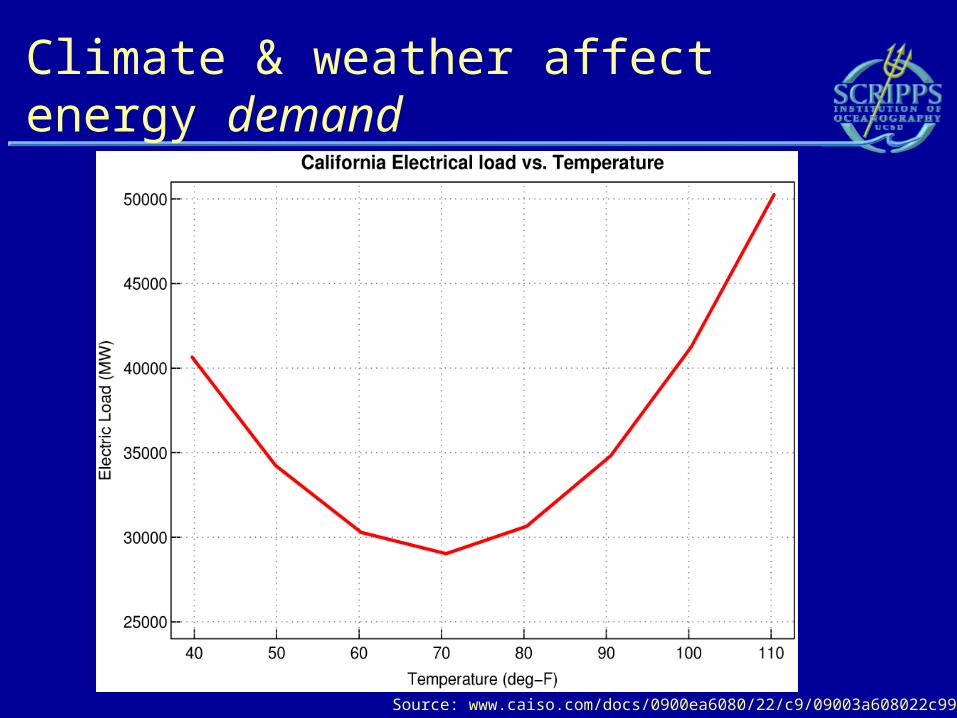
Climate & weather affect energy demand
Source: www.caiso.com/docs/0900ea6080/22/c9/09003a608022c993.pdf
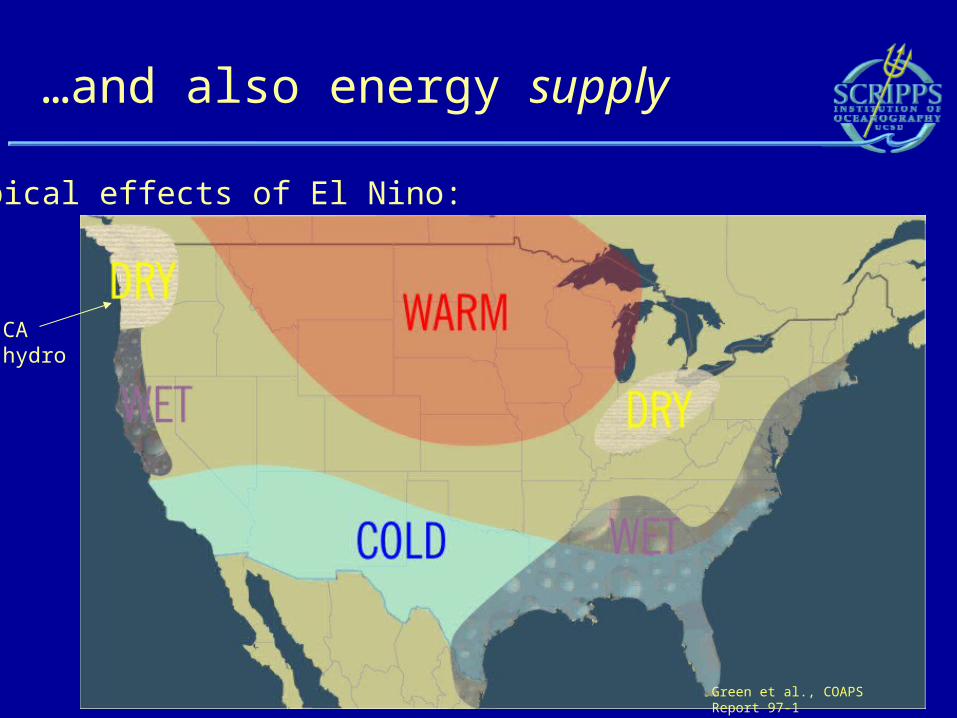
…and also energy supply
Green et al., COAPS Report 97-1
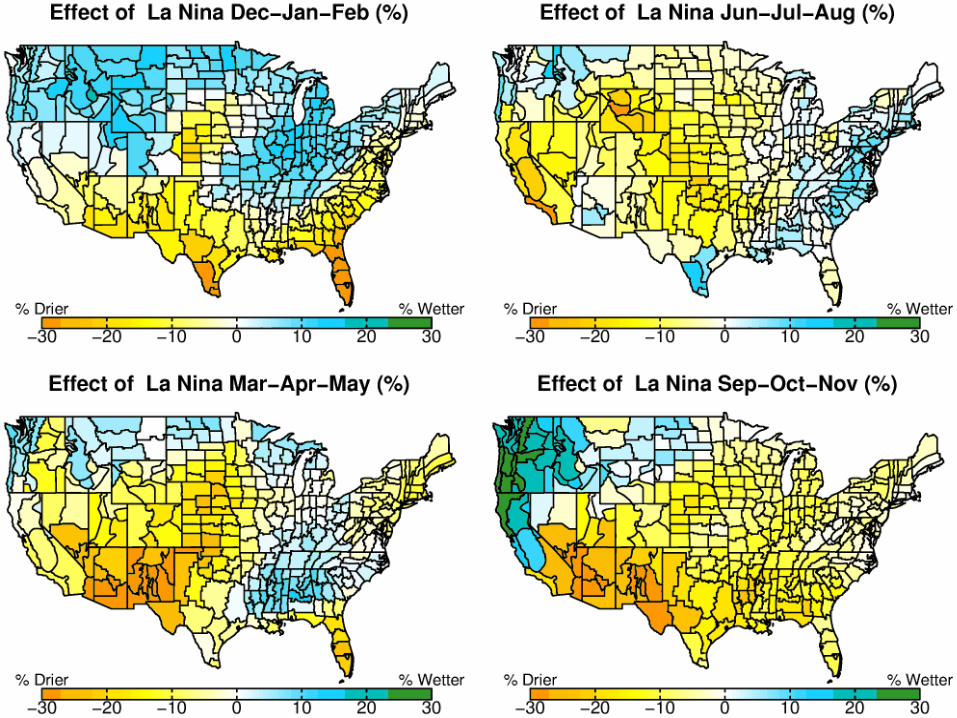
Typical effects of El Nino:
CAhydro
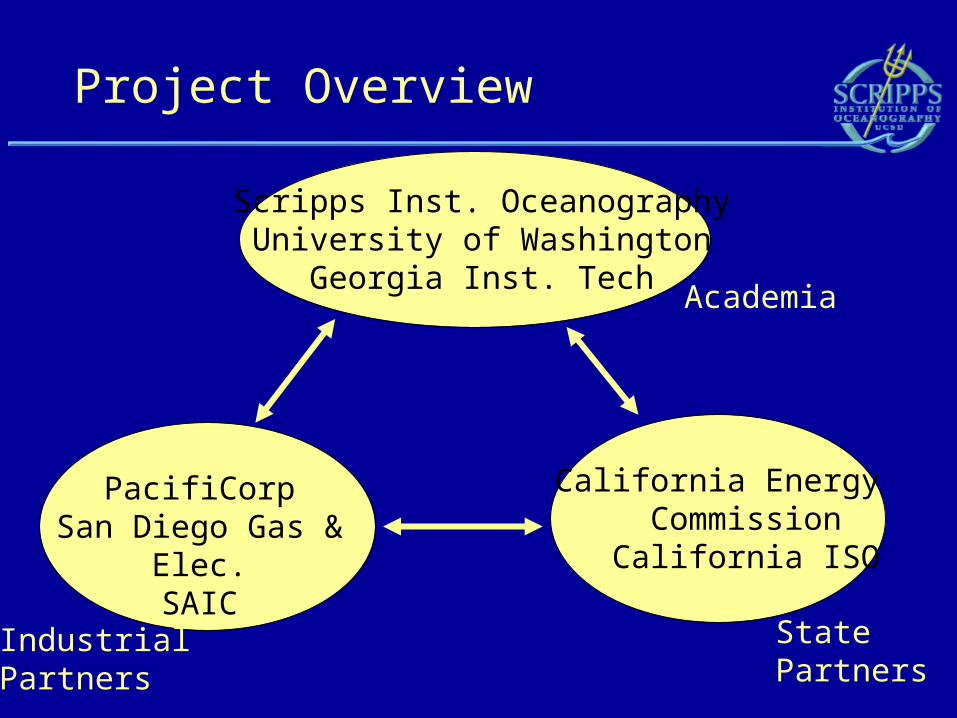
Project Overview
Scripps Inst. OceanographyUniversity of Washington
Georgia Inst. Tech
California Energy Commission California ISO
PacifiCorpSan Diego Gas & Elec.
SAIC
Academia
StatePartners
IndustrialPartners
Why aren’t climate forecasts used?
• Climate forecasts are probabilistic in nature – sometimes unfamiliar to the user
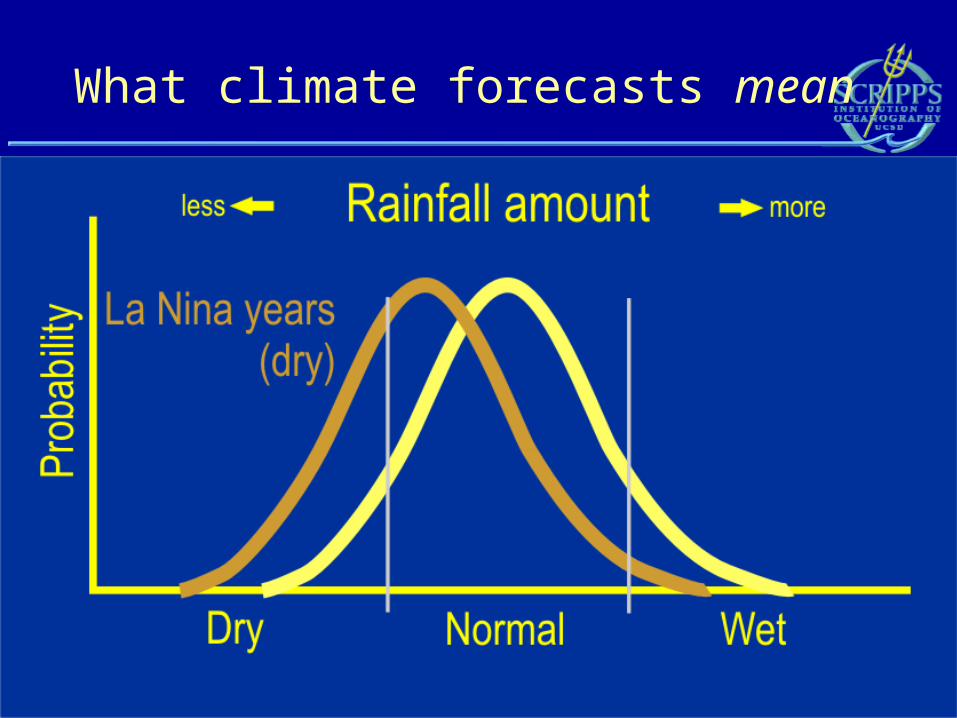
What climate forecasts mean
Why aren’t climate forecasts used?
• Climate forecasts are probabilistic in nature – sometimes unfamiliar to the user
• Lack of understanding of climate forecasts and their benefits
• Language and format of climate forecasts is hard to understand – need to be translated for end-users
• Aversion to change – easier to do things the traditional way
1. California "Delta Breeze"
• An important source of forecast load error (CalISO)
• Big events can change load by 500 MW (>1% of total)
• Direct cost of this power: $250K/breeze day (~40 days/year: ~$10M/year)
• Indirect costs: pushing stressed system past capacity when forecast is missed!
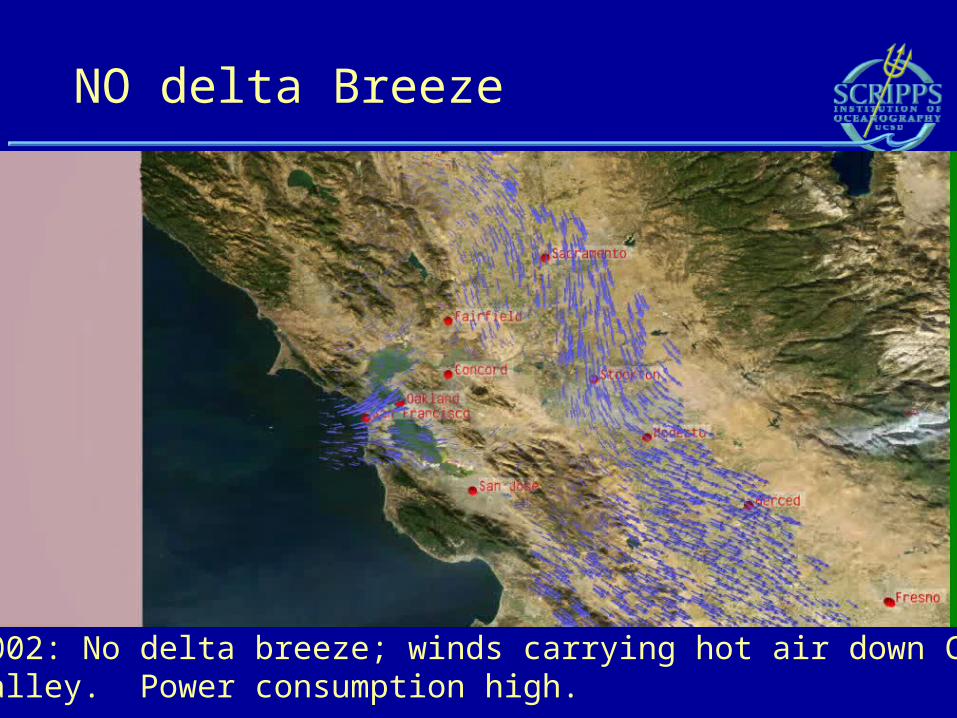
NO delta Breeze
Sep 25, 2002: No delta breeze; winds carrying hot air down CaliforniaCentral valley. Power consumption high.
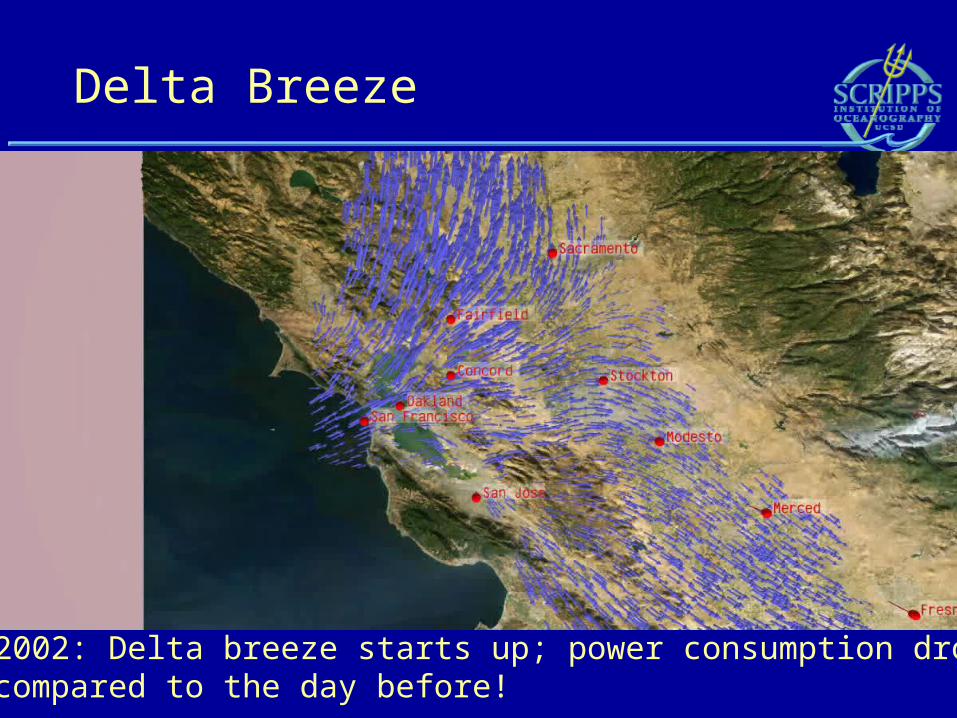
Delta Breeze
Sep 26, 2002: Delta breeze starts up; power consumption drops >500 MW compared to the day before!
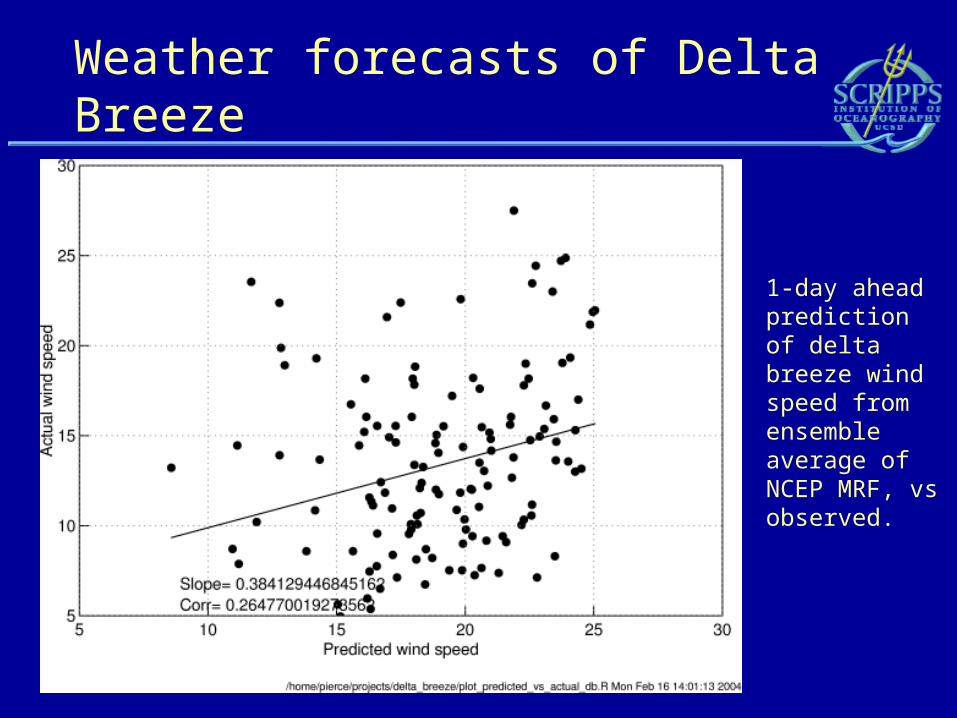
Weather forecasts of Delta Breeze
1-day ahead prediction of delta breeze wind speed from ensemble average of NCEP MRF, vs observed.
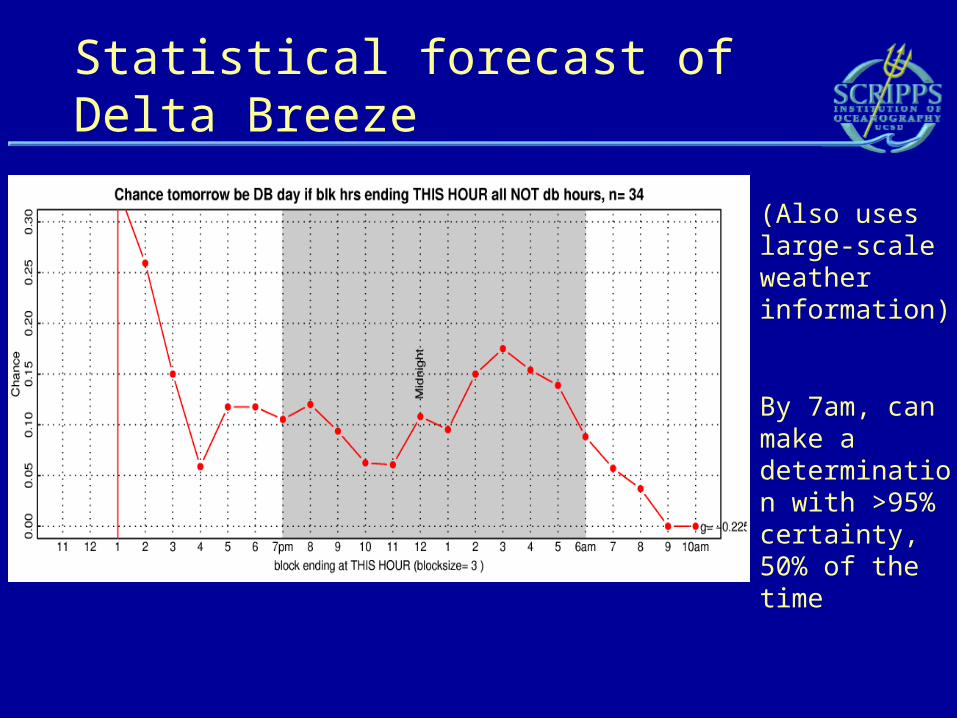
Statistical forecast of Delta Breeze
(Also uses large-scale weather information)
By 7am, can make a determination with >95% certainty, 50% of the time

Delta Breeze summary
• Using climate information can do better than dynamic weather forecasts
• Possible savings of 10 to 20% in costs due to weather forecast error. Depending on size of utility, will be in range of high 100,000s to low millions of dollars/year.

2. Load demand management
• Induce customers to reduce electrical load on peak electrical load days
• Prediction challenge: call those 12 days, 3 days in advance
• Amounts to calling weekdays with greatest "heat index" (temperature/humidity)

Why shave peak days?
http://www.energy.ca.gov/electricity/wepr/2000-07/index.html
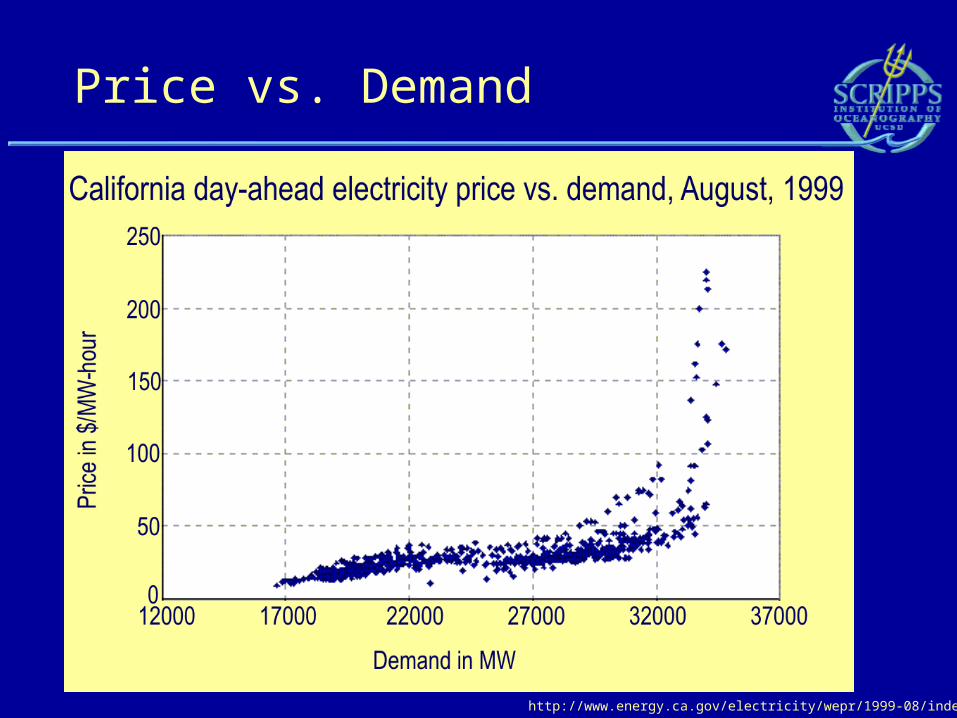
Price vs. Demand
http://www.energy.ca.gov/electricity/wepr/1999-08/index.html
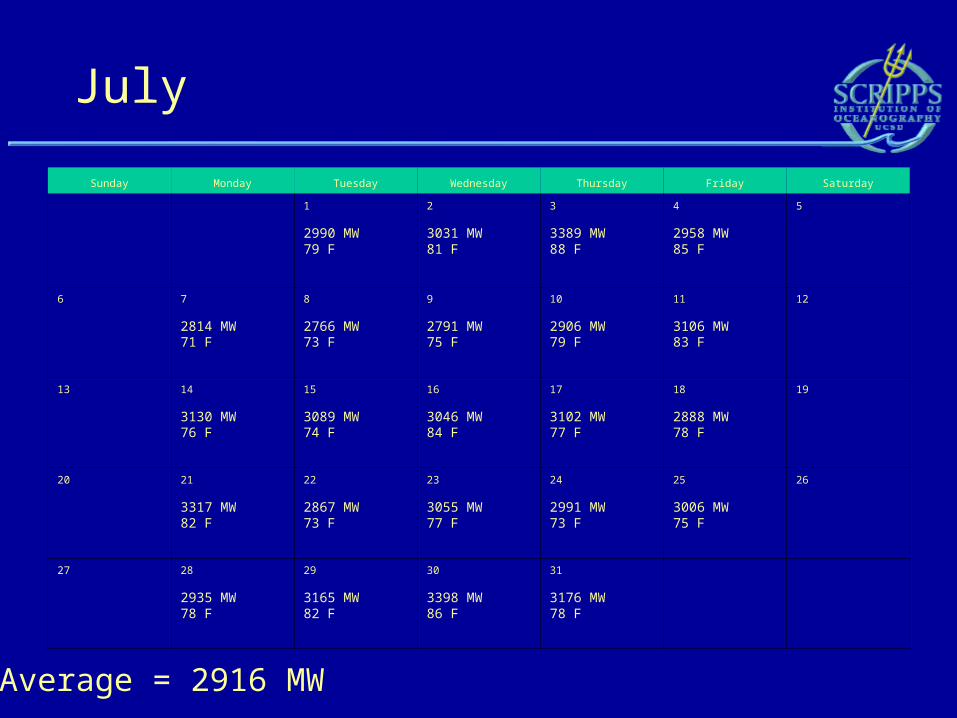
July
Sunday Monday Tuesday Wednesday Thursday Friday Saturday
1
2990 MW79 F
2
3031 MW81 F
3
3389 MW88 F
4
2958 MW85 F
5
6 7
2814 MW71 F
8
2766 MW73 F
9
2791 MW75 F
10
2906 MW79 F
11
3106 MW83 F
12
13 14
3130 MW76 F
15
3089 MW74 F
16
3046 MW84 F
17
3102 MW77 F
18
2888 MW78 F
19
20 21
3317 MW82 F
22
2867 MW73 F
23
3055 MW77 F
24
2991 MW73 F
25
3006 MW75 F
26
27 28
2935 MW78 F
29
3165 MW82 F
30
3398 MW86 F
31
3176 MW78 F
Average = 2916 MW

July
Sunday Monday Tuesday Wednesday Thursday Friday Saturday
1
2990 MW79 F
2
3031 MW81 F
3
3389 MW88 F
4
2958 MW85 F
5
6 7
2814 MW71 F
8
2766 MW73 F
9
2791 MW75 F
10
2906 MW79 F
11
3106 MW83 F
12
13 14
3130 MW76 F
15
3089 MW74 F
16
3046 MW84 F
17
3102 MW77 F
18
2888 MW78 F
19
20 21
3317 MW82 F
22
2867 MW73 F
23
3055 MW77 F
24
2991 MW73 F
25
3006 MW75 F
26
27 28
2935 MW78 F
29
3165 MW82 F
30
3398 MW86 F
31
3176 MW78 F
Average = 2916 MW Top days = 3383 MW (16 % more than avg)
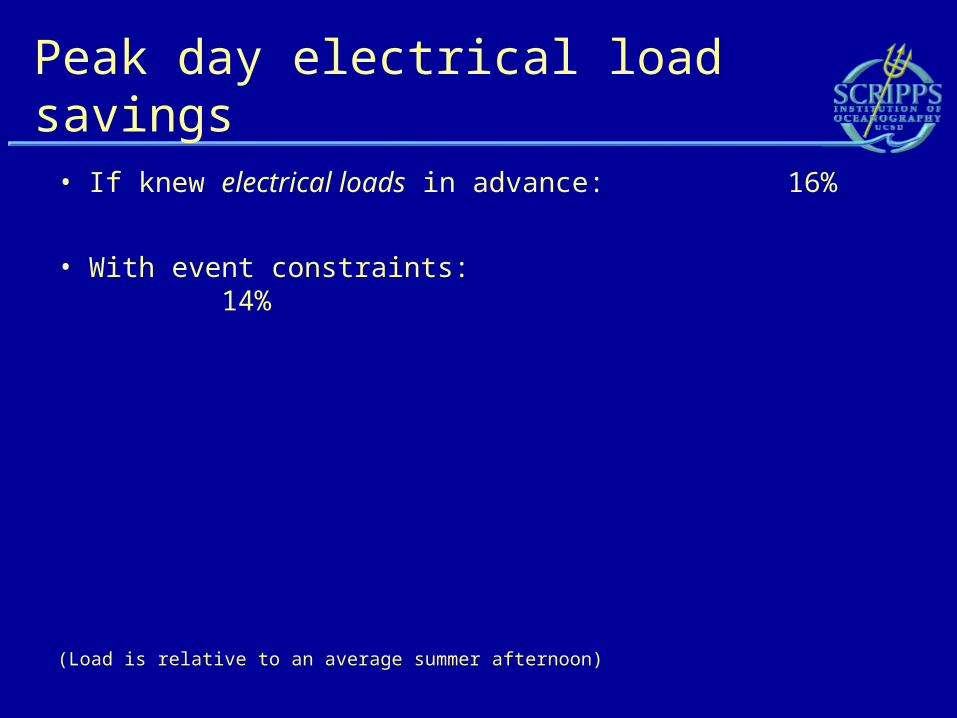
Peak day electrical load savings
• If knew electrical loads in advance: 16%
• With event constraints: 14%
(Load is relative to an average summer afternoon)

July
Sunday Monday Tuesday Wednesday Thursday Friday Saturday
1
2990 MW79 F
2
3031 MW81 F
3
3389 MW88 F
4
2958 MW85 F
5
6 7
2814 MW71 F
8
2766 MW73 F
9
2791 MW75 F
10
2906 MW79 F
11
3106 MW83 F
12
13 14
3130 MW76 F
15
3089 MW74 F
16
3046 MW84 F
17
3102 MW77 F
18
2888 MW78 F
19
20 21
3317 MW82 F
22
2867 MW73 F
23
3055 MW77 F
24
2991 MW73 F
25
3006 MW75 F
26
27 28
2935 MW78 F
29
3165 MW82 F
30
3398 MW86 F
31
3176 MW78 F
Average = 2916 MW
July
Sunday Monday Tuesday Wednesday Thursday Friday Saturday
1
2990 MW79 F
2
3031 MW81 F
3
3389 MW88 F
4
2958 MW
85 F
5
6 7
2814 MW71 F
8
2766 MW73 F
9
2791 MW75 F
10
2906 MW79 F
11
3106 MW83 F
12
13 14
3130 MW76 F
15
3089 MW74 F
16
3046 MW84 F
17
3102 MW77 F
18
2888 MW78 F
19
20 21
3317 MW82 F
22
2867 MW73 F
23
3055 MW77 F
24
2991 MW73 F
25
3006 MW75 F
26
27 28
2935 MW78 F
29
3165 MW82 F
30
3398 MW86 F
31
3176 MW78 F
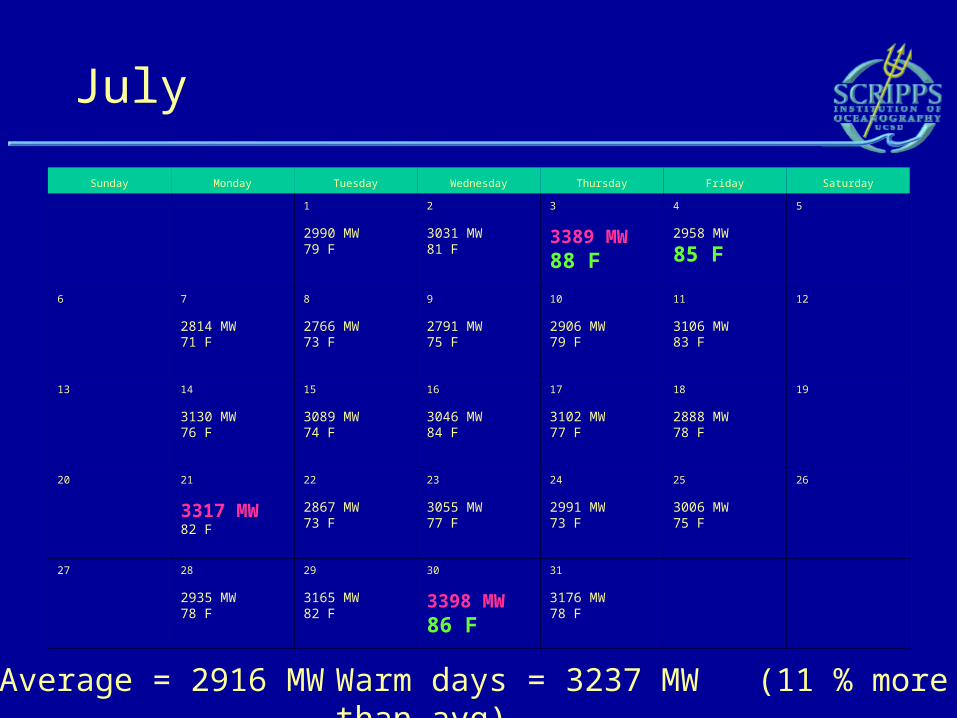
Average = 2916 MW Warm days = 3237 MW (11 % more than avg)
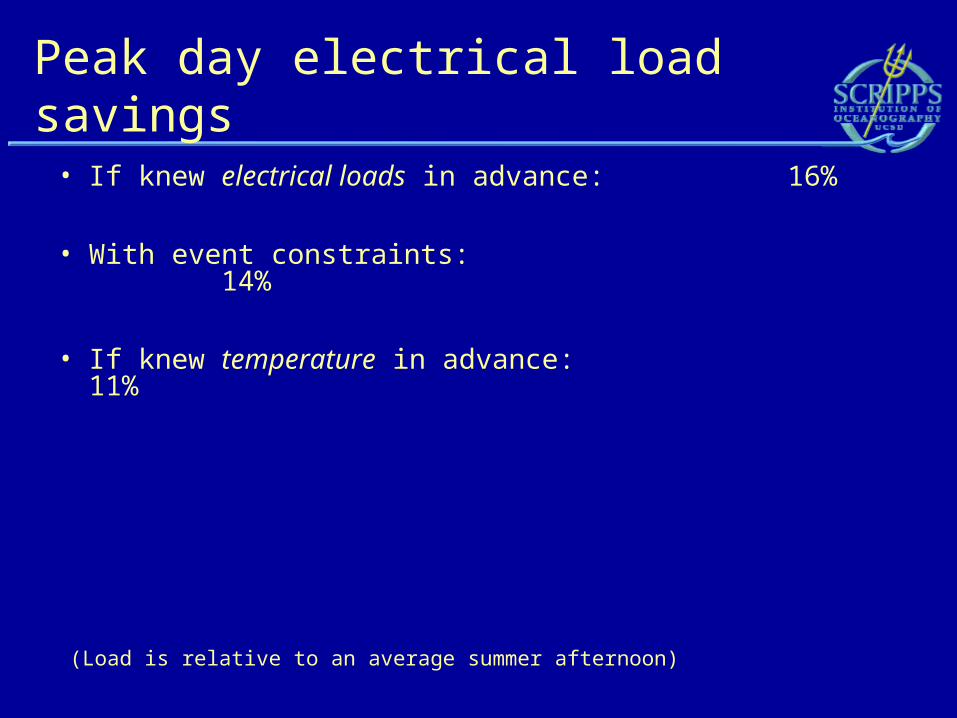
Peak day electrical load savings
• If knew electrical loads in advance: 16%
• With event constraints: 14%
• If knew temperature in advance: 11%
(Load is relative to an average summer afternoon)
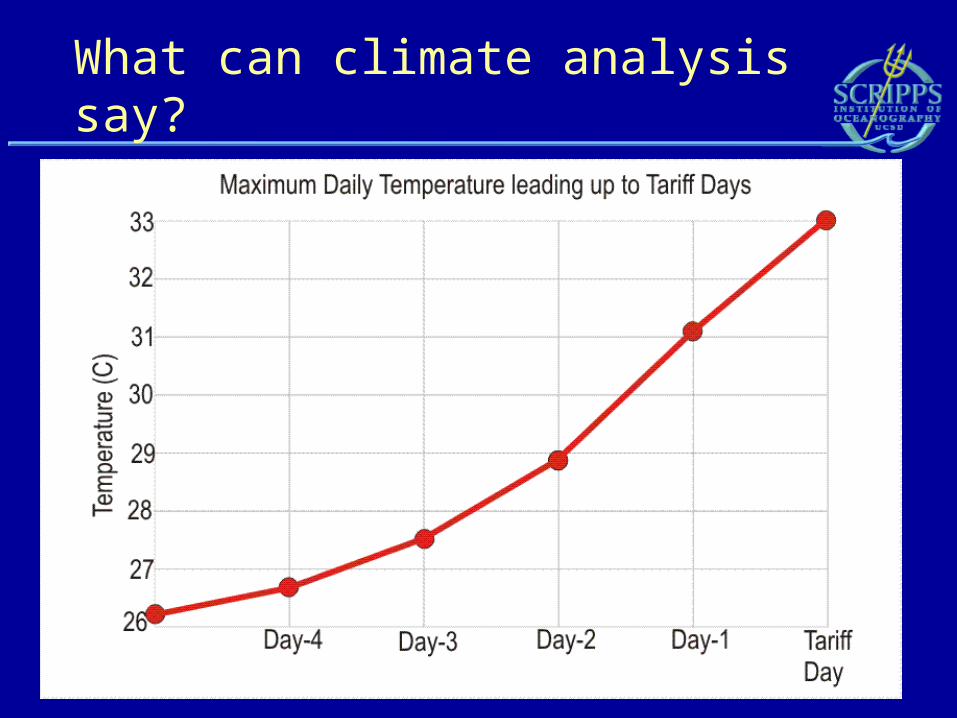
What can climate analysis say?
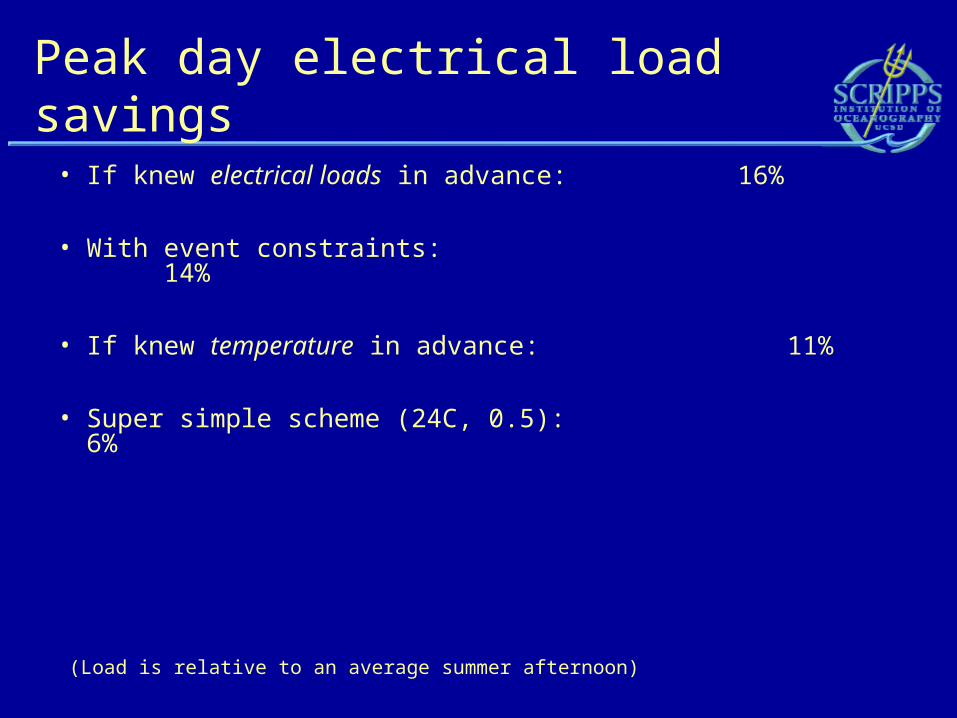
Peak day electrical load savings
• If knew electrical loads in advance: 16%
• With event constraints: 14%
• If knew temperature in advance: 11%
• Super simple scheme (24C, 0.5): 6%
(Load is relative to an average summer afternoon)

Optimizing the process
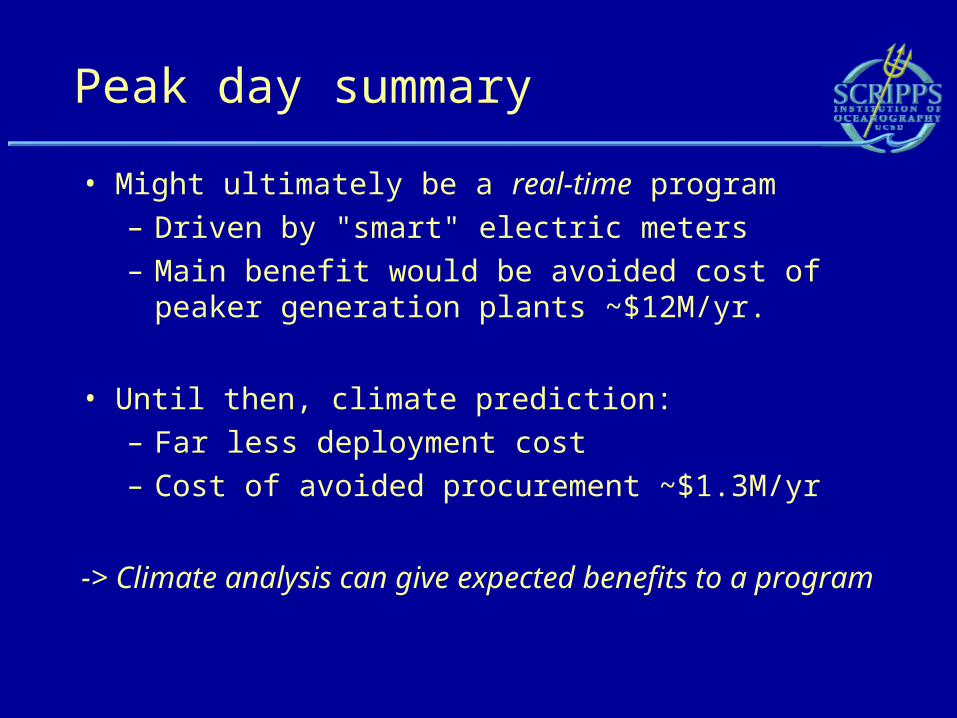
Peak day summary
• Might ultimately be a real-time program
– Driven by "smart" electric meters
– Main benefit would be avoided cost of peaker generation plants ~$12M/yr.
• Until then, climate prediction:
– Far less deployment cost
– Cost of avoided procurement ~$1.3M/yr
-> Climate analysis can give expected benefits to a program
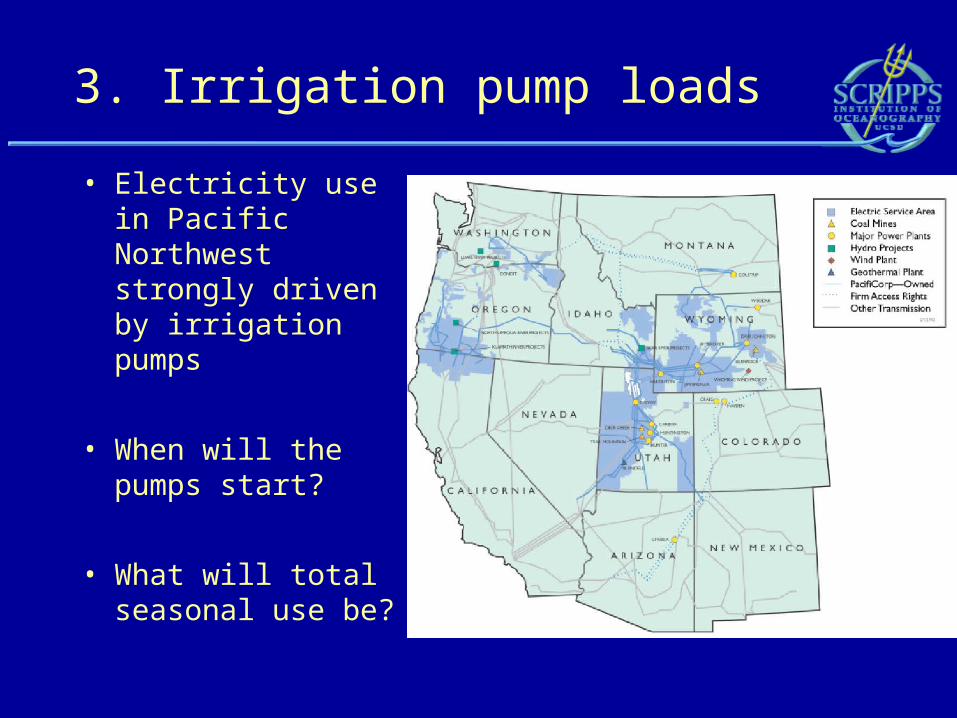
3. Irrigation pump loads
• Electricity use in Pacific Northwest strongly driven by irrigation pumps
• When will the pumps start?
• What will total seasonal use be?
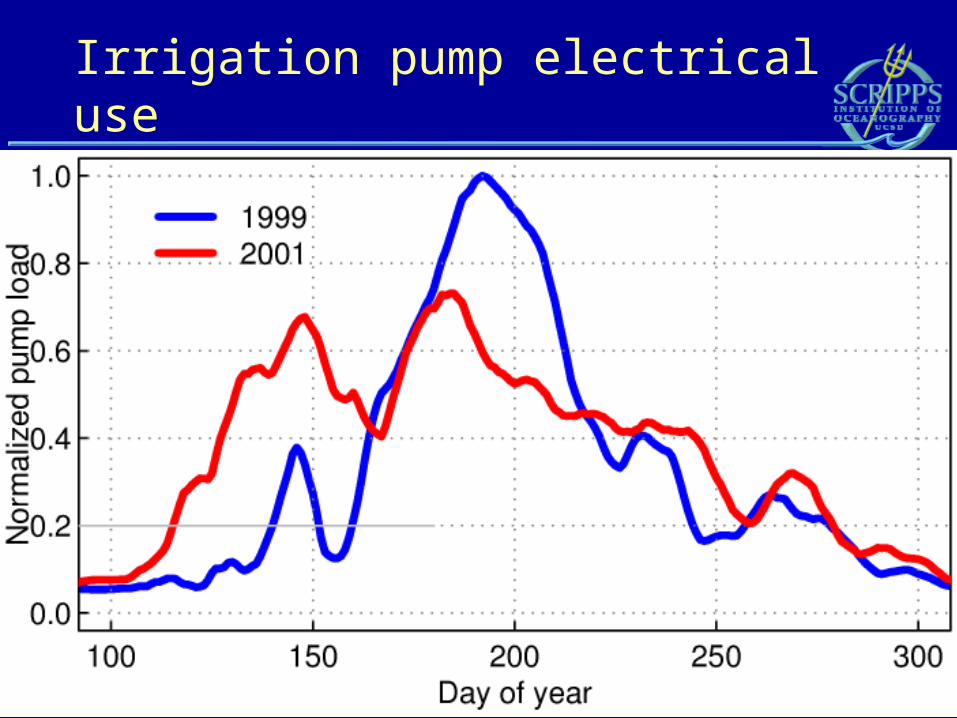
Irrigation pump electrical use
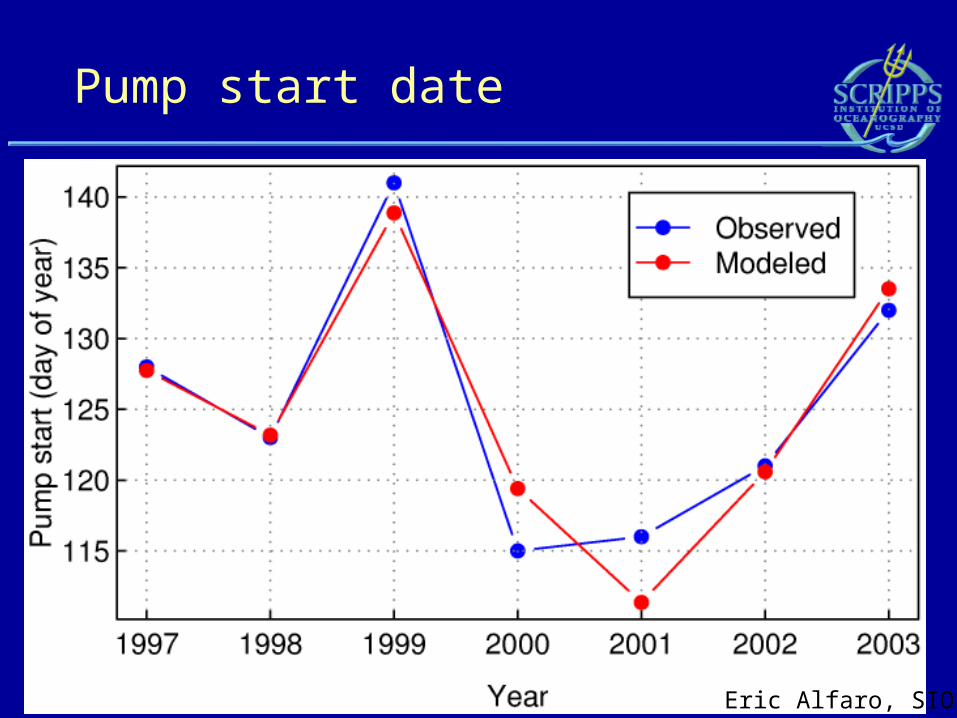
Pump start date
Eric Alfaro, SIO
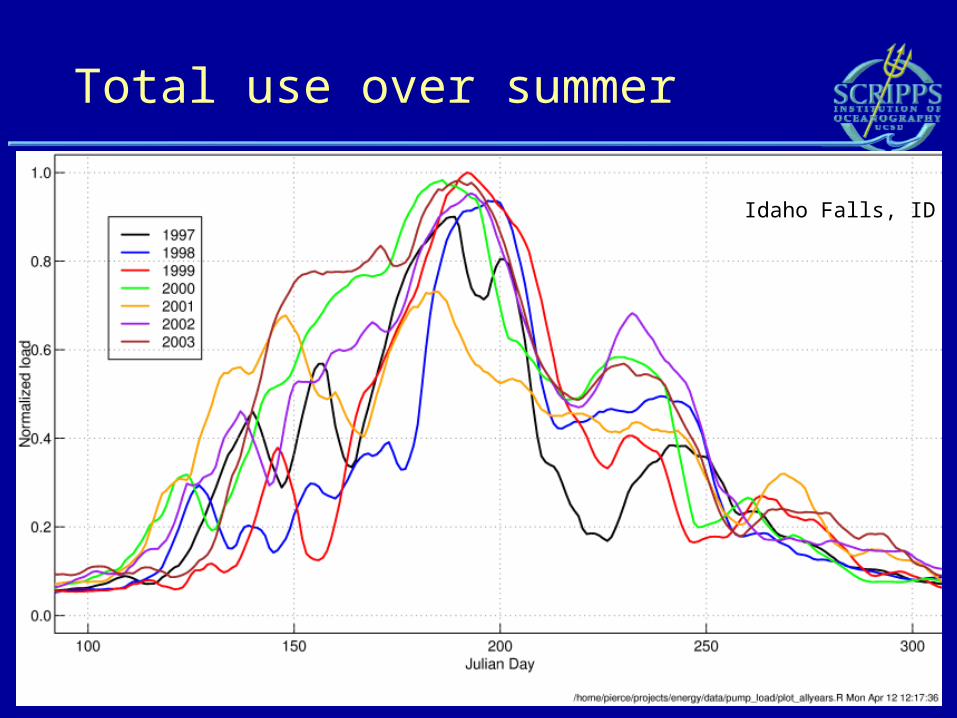
Total use over summer
Idaho Falls, ID
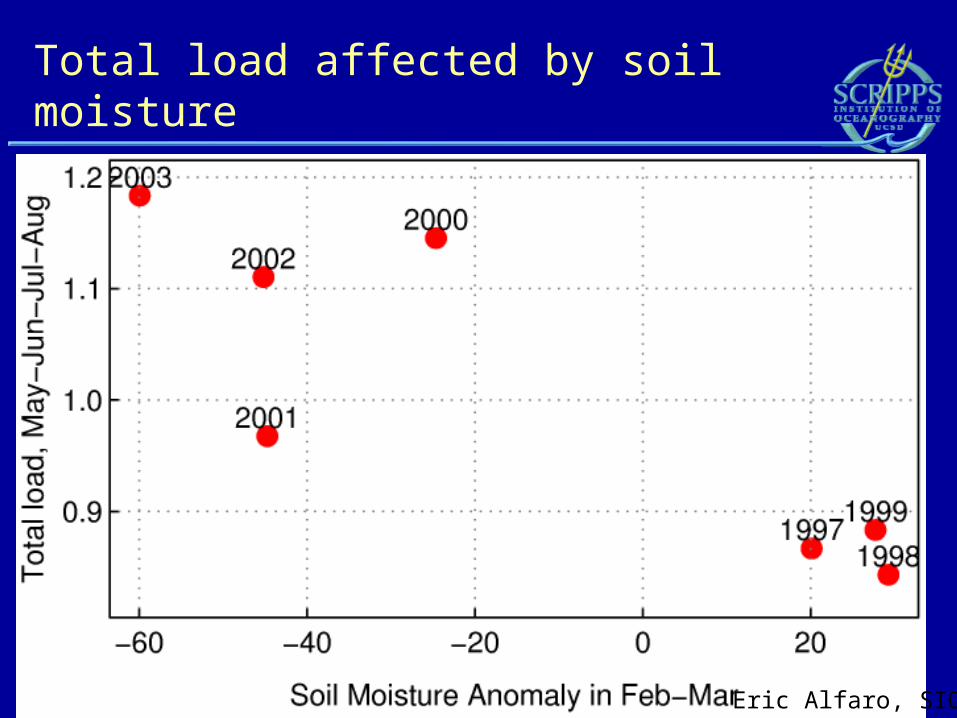
Total load affected by soil moisture
Eric Alfaro, SIO
Irrigation load summary
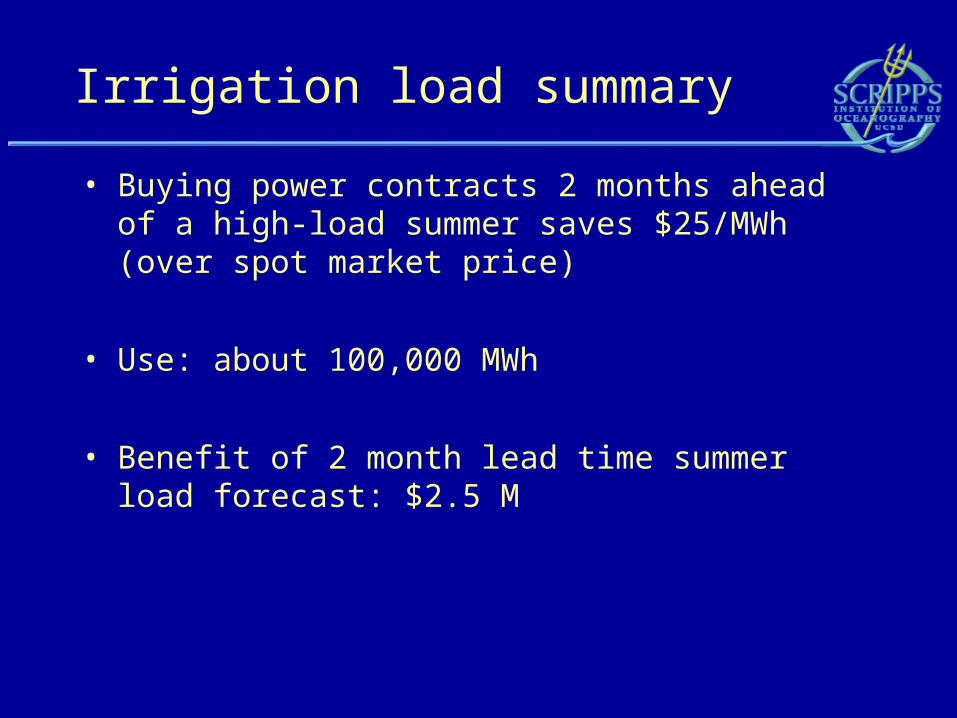
• Buying power contracts 2 months ahead of a high-load summer saves $25/MWh (over spot market price)
• Use: about 100,000 MWh
• Benefit of 2 month lead time summer load forecast: $2.5 M
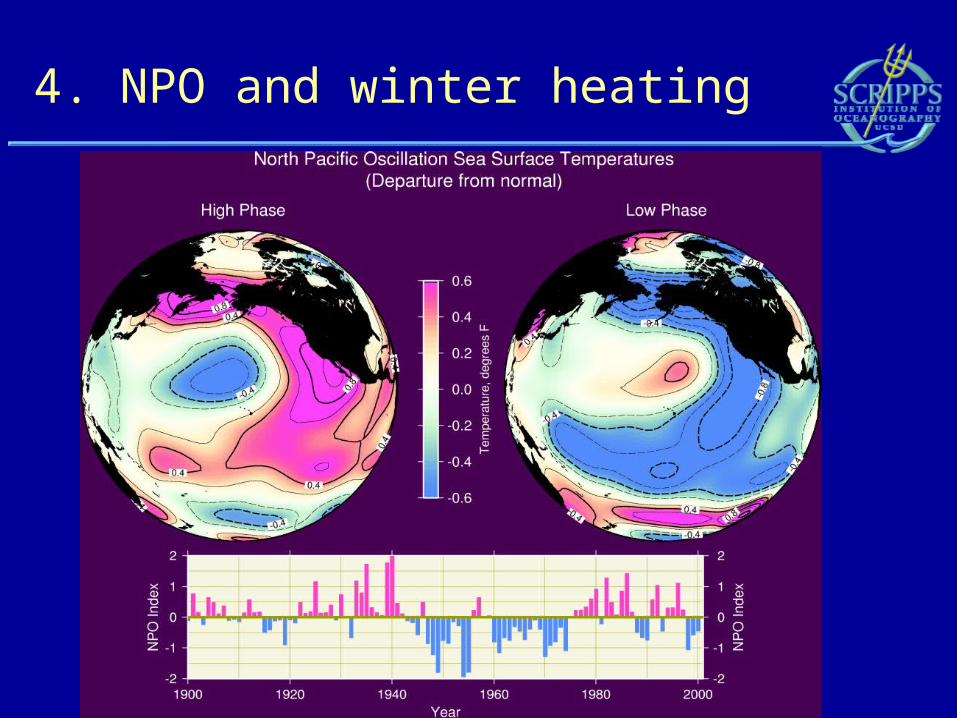
4. NPO and winter heating
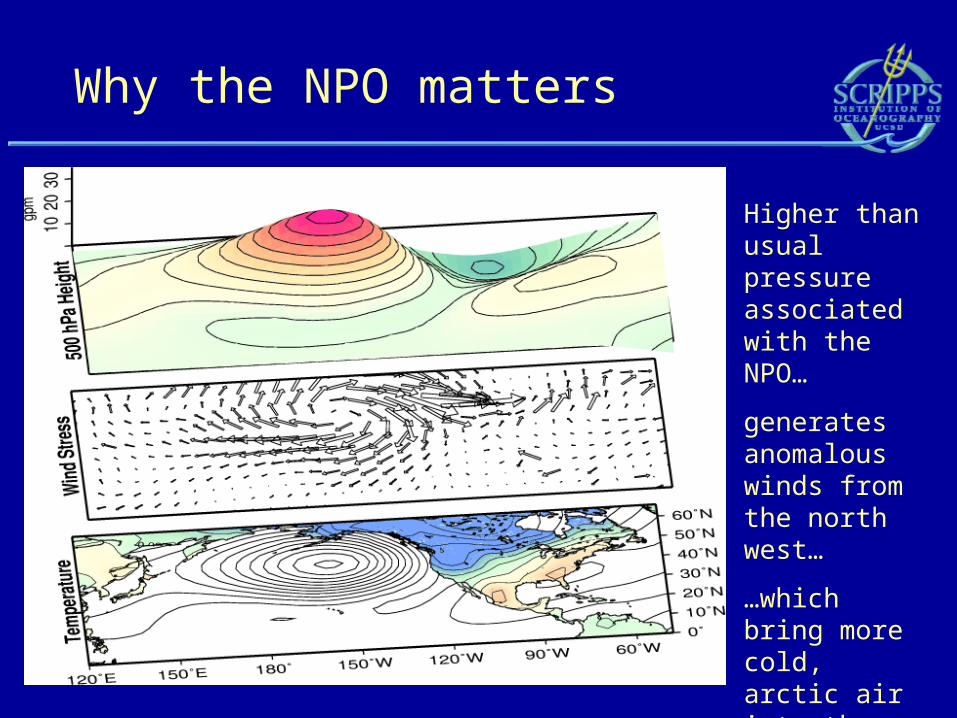
Why the NPO matters
Higher than usual pressure associated with the NPO…
generates anomalous winds from the north west…
…which bring more cold, arctic air into the western U.S. during winter
NPO affects summer, too!
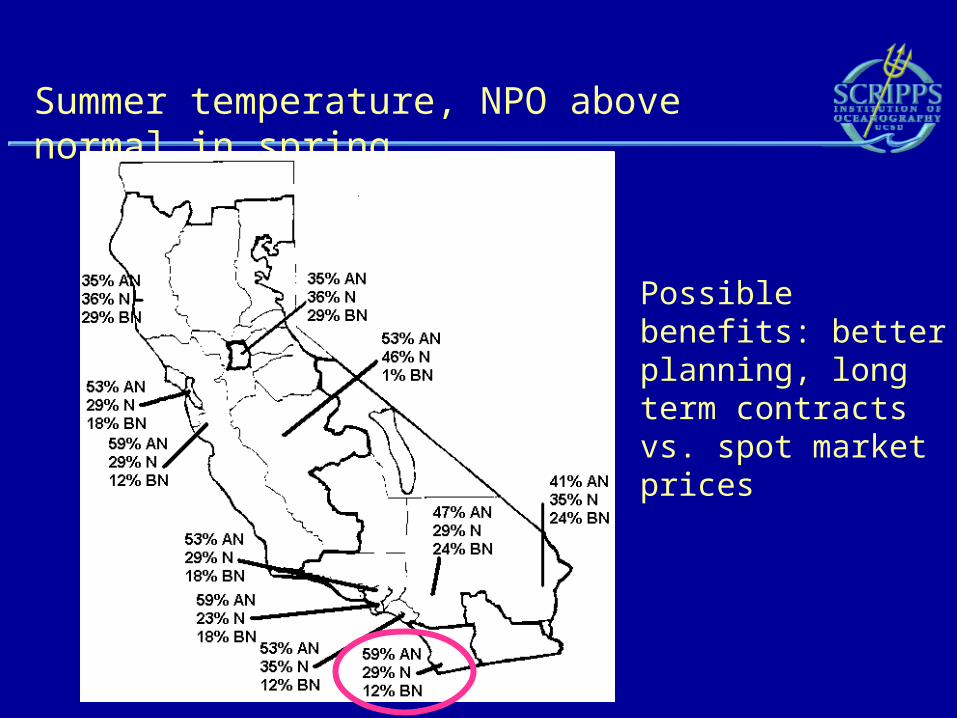
Summer temperature, NPO above normal in spring
Possible benefits: better planning, long term contracts vs. spot market prices
5. Hydropower
• CalEnergy work done by U.W. hydrology group (Dennis Lettenmaier, Alan Hamlet, Nathalie Voisin)
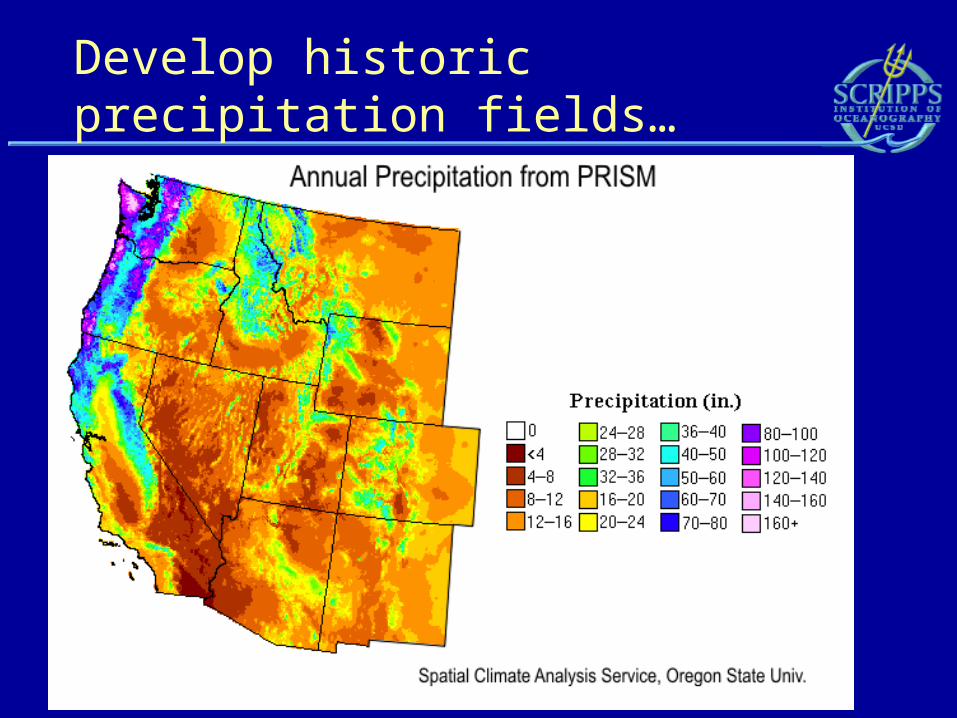
Develop historic precipitation fields…
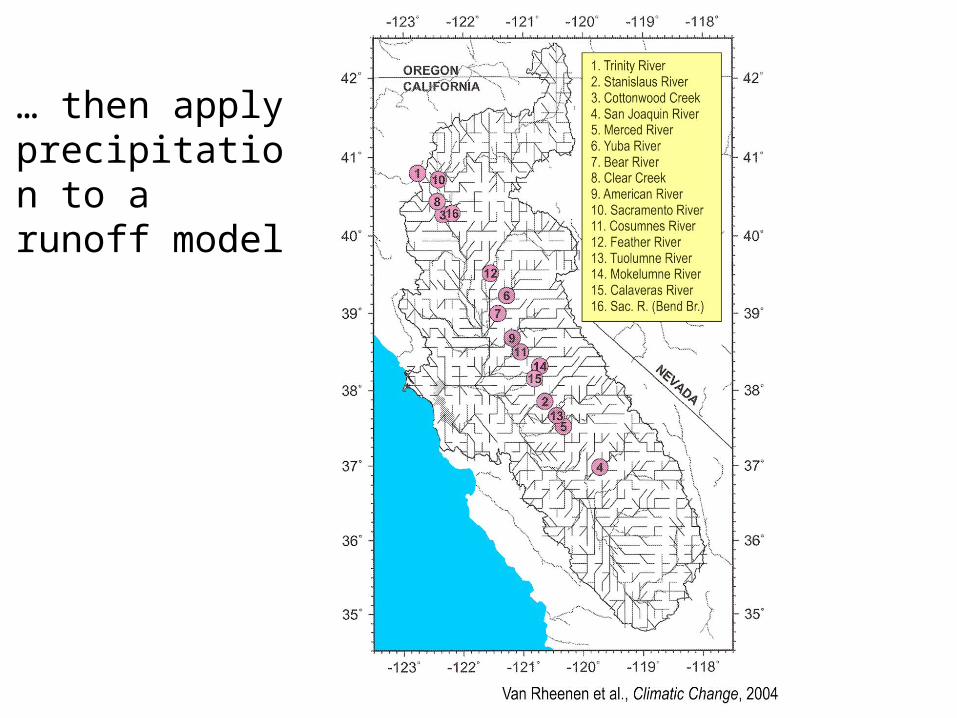
… then apply precipitation to a runoff model
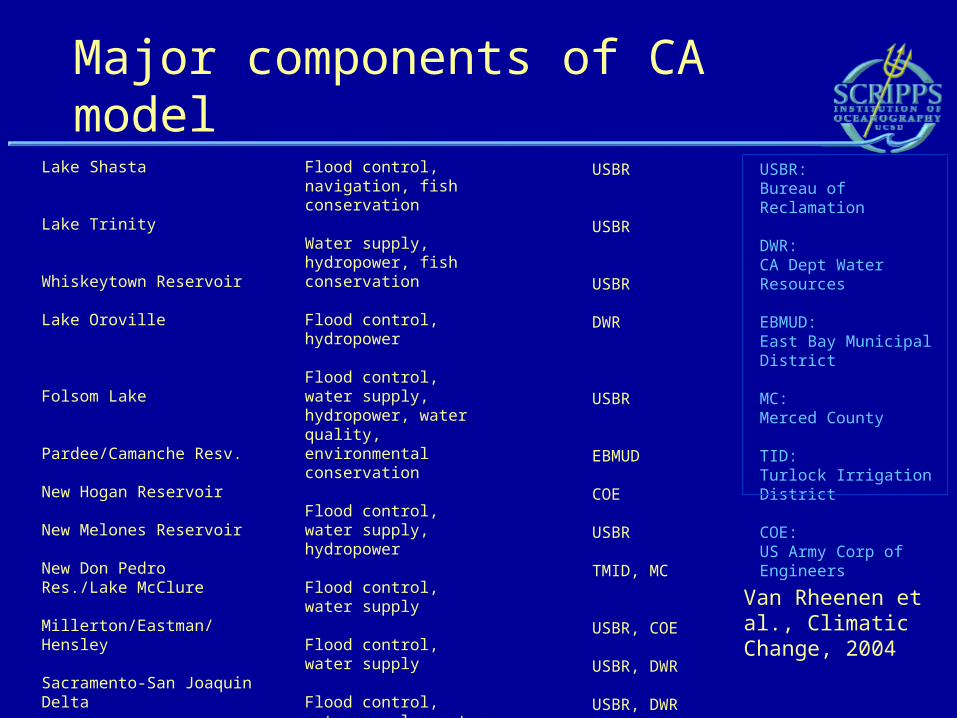
Major components of CA model
Lake Shasta
Lake Trinity
Whiskeytown Reservoir
Lake Oroville
Folsom Lake
Pardee/Camanche Resv.
New Hogan Reservoir
New Melones Reservoir
New Don Pedro Res./Lake McClure
Millerton/Eastman/Hensley
Sacramento-San Joaquin Delta
San Luis Reservoir
Flood control, navigation, fish conservation
Water supply, hydropower, fish conservation
Flood control, hydropower
Flood control, water supply, hydropower, water quality, environmental conservation
Flood control, water supply, hydropower
Flood control, water supply
Flood control, water supply
Flood control, water supply, water quality, hydropowerFlood control, water supply
Water supply, recreation
Water supply, water quality
Water supply, hydropower
USBR
USBR
USBR
DWR
USBR
EBMUD
COE
USBR
TMID, MC
USBR, COE
USBR, DWR
USBR, DWR
USBR: Bureau of Reclamation
DWR: CA Dept Water Resources
EBMUD: East Bay Municipal District
MC: Merced County
TID: Turlock Irrigation District
COE: US Army Corp of Engineers
Van Rheenen et al., Climatic Change, 2004
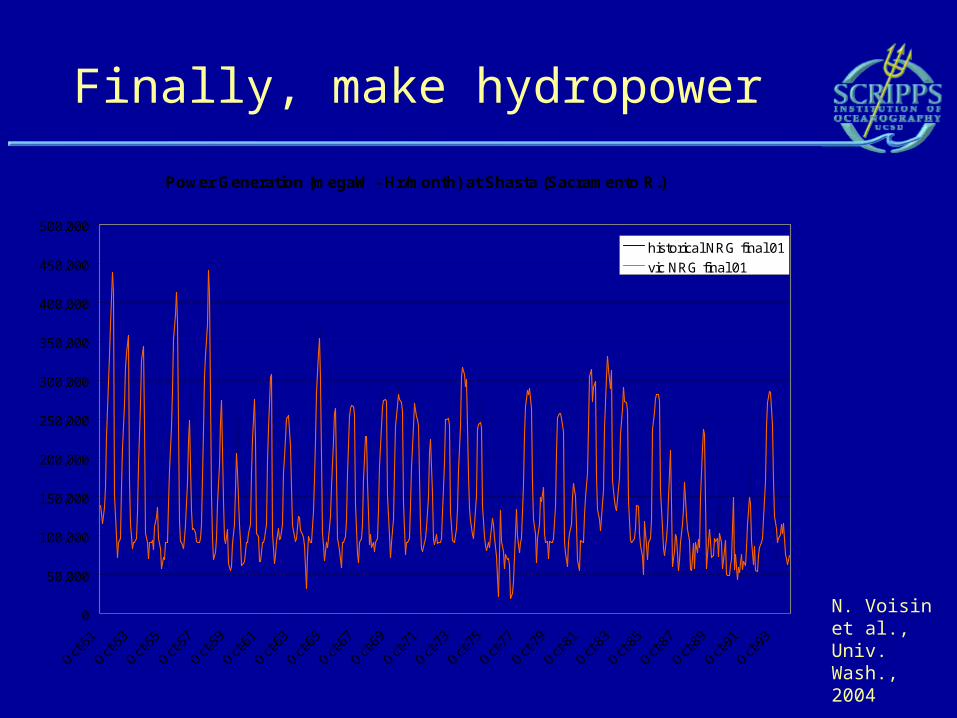
Finally, make hydropower
Power Generation (megaW - Hr/month) at Shasta (Sacramento R.)
0
50,000
100,000
150,000
200,000
250,000
300,000
350,000
400,000
450,000
500,000
Oct-51
Oct-53
Oct-55
Oct-57
Oct-59
Oct-61
Oct-63
Oct-65
Oct-67
Oct-69
Oct-71
Oct-73
Oct-75
Oct-77
Oct-79
Oct-81
Oct-83
Oct-85
Oct-87
Oct-89
Oct-91
Oct-93
historical NRG final 01
vic NRG final 01
N. Voisin et al., Univ. Wash., 2004
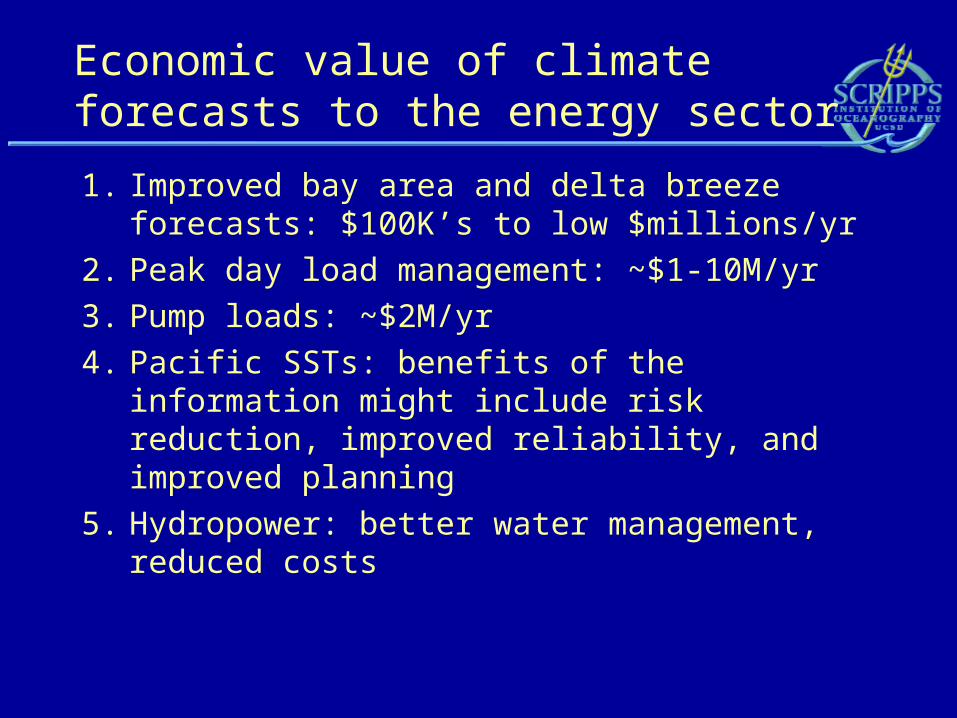
Economic value of climate forecasts to the energy sector
1. Improved bay area and delta breeze forecasts: $100K’s to low $millions/yr
2. Peak day load management: ~$1-10M/yr
3. Pump loads: ~$2M/yr
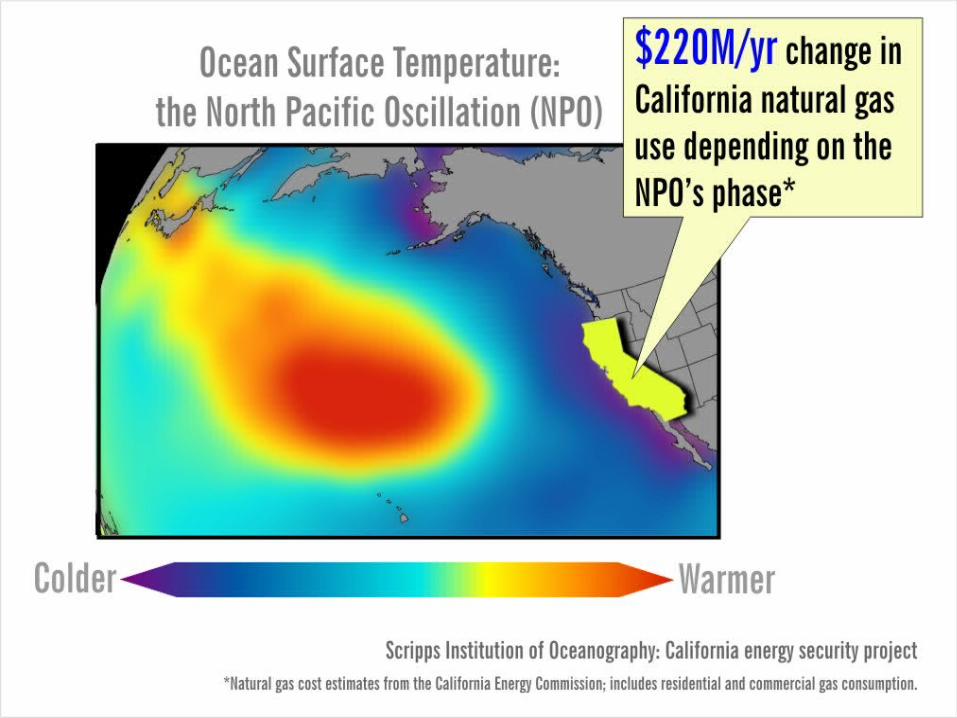
4. Pacific SSTs: benefits of the information might include risk reduction, improved reliability, and improved planning
5. Hydropower: better water management, reduced costs

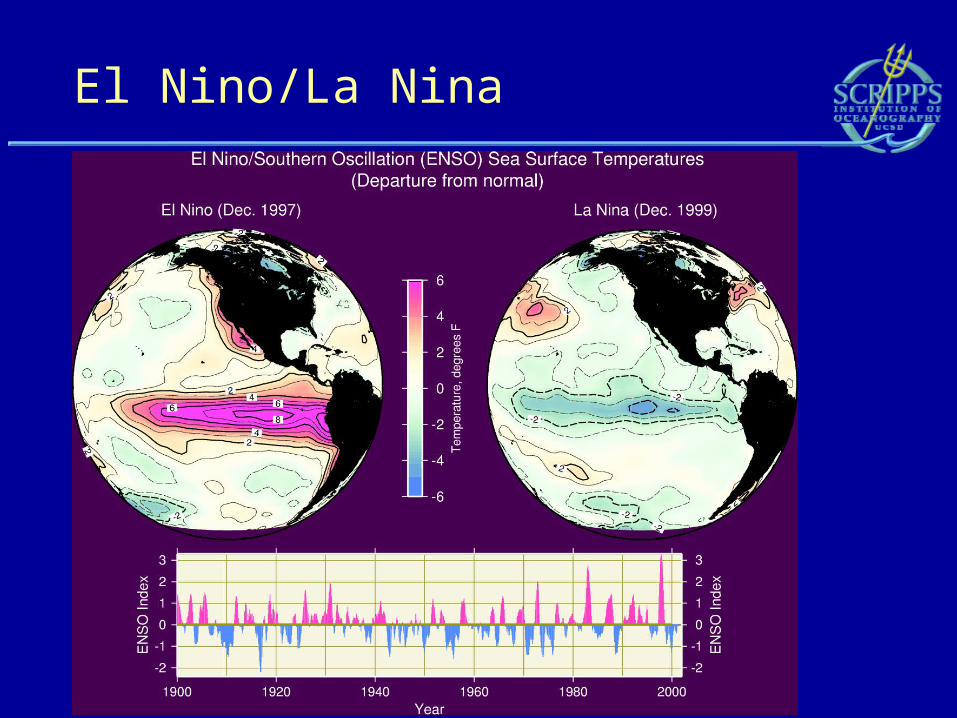
El Nino/La Nina

Why does that affect other places?
Global atmospheric pressure pattern “steers” weather
Horel and Wallace, 1981
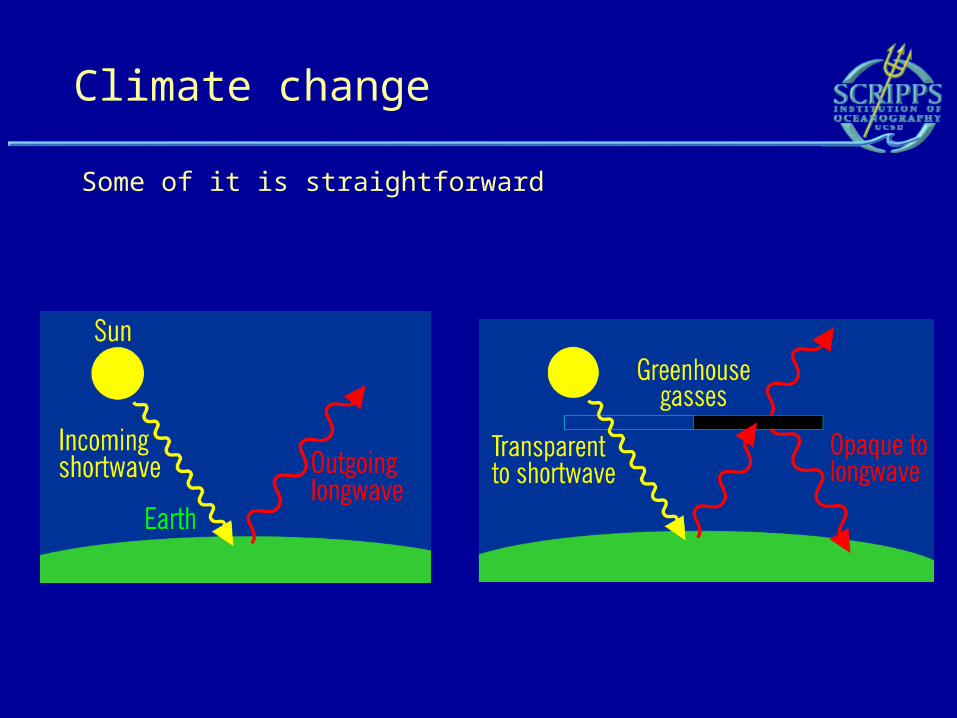
Climate change
Some of it is straightforward
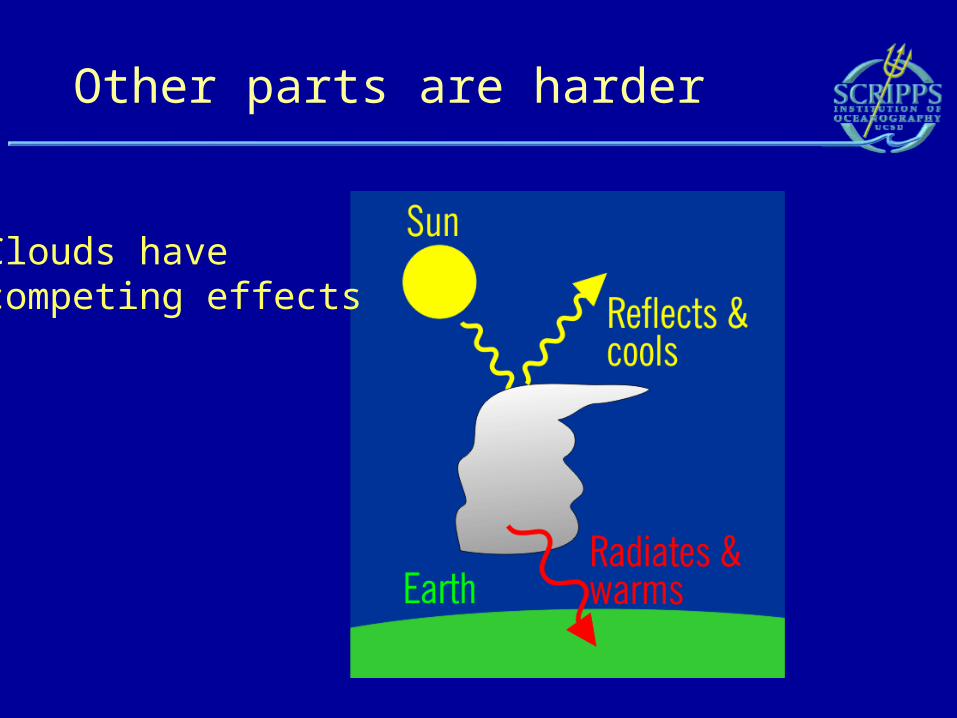
Other parts are harder
Clouds have competing effects
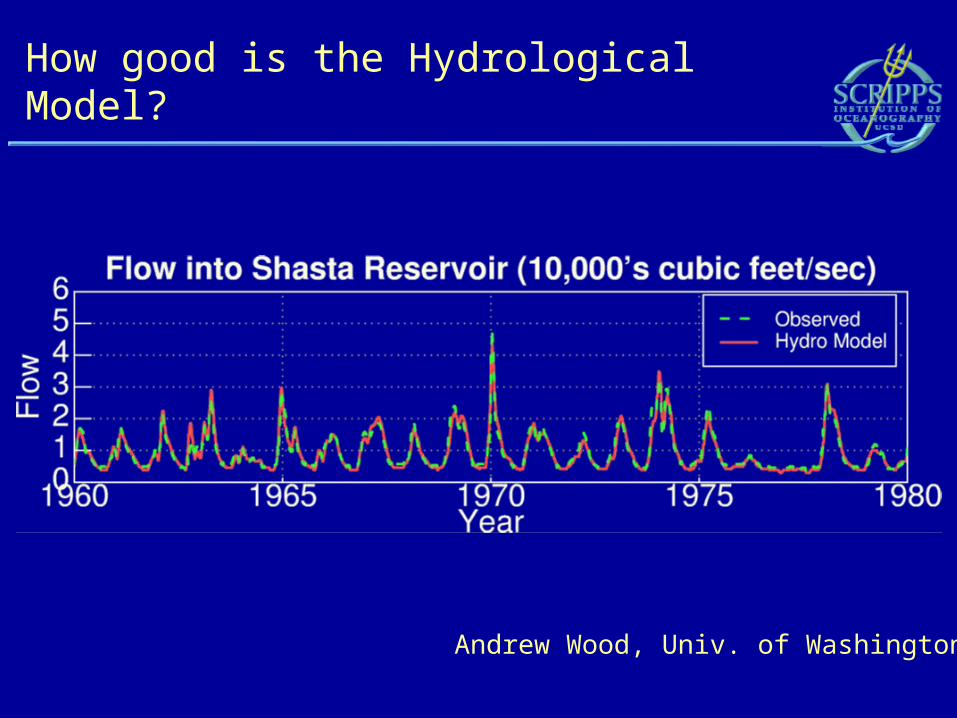
How good is the Hydrological Model?
Andrew Wood, Univ. of Washington
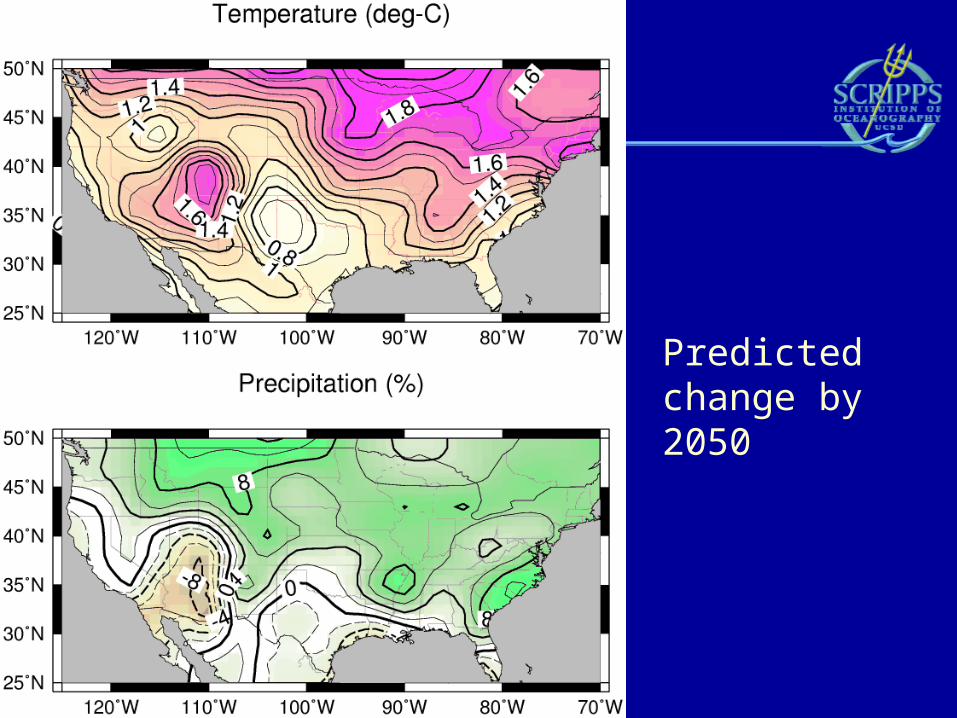
Predicted change by 2050

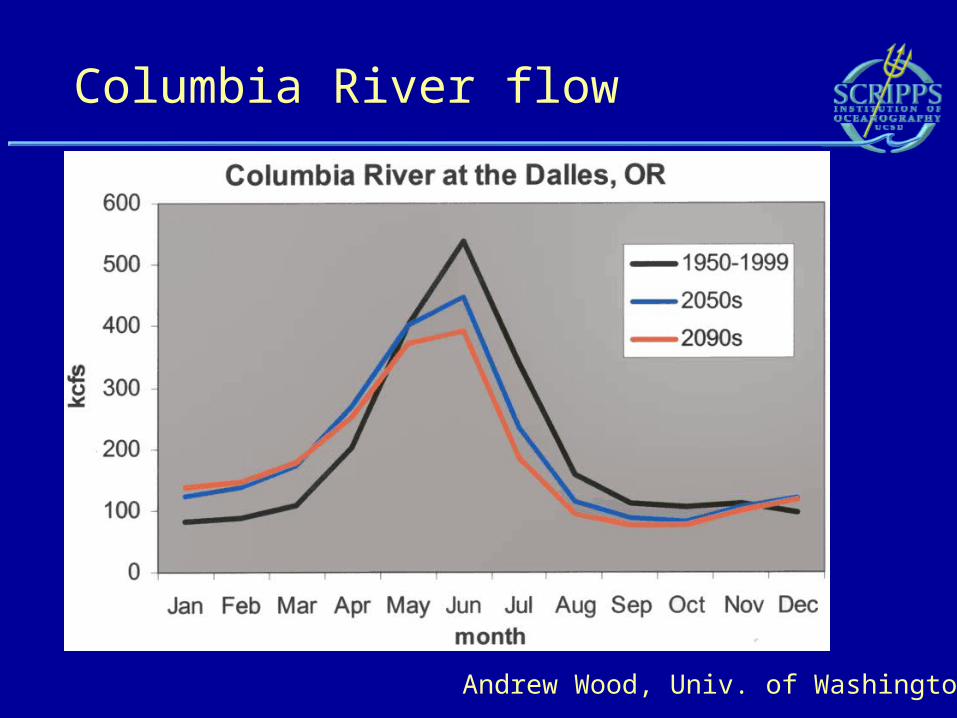
Columbia River flow
Andrew Wood, Univ. of Washington
The problem:
• Proposal to breach 4 Snake River dams to improve salmon habitat
• Those dams provide 940 MW of hydropower generation
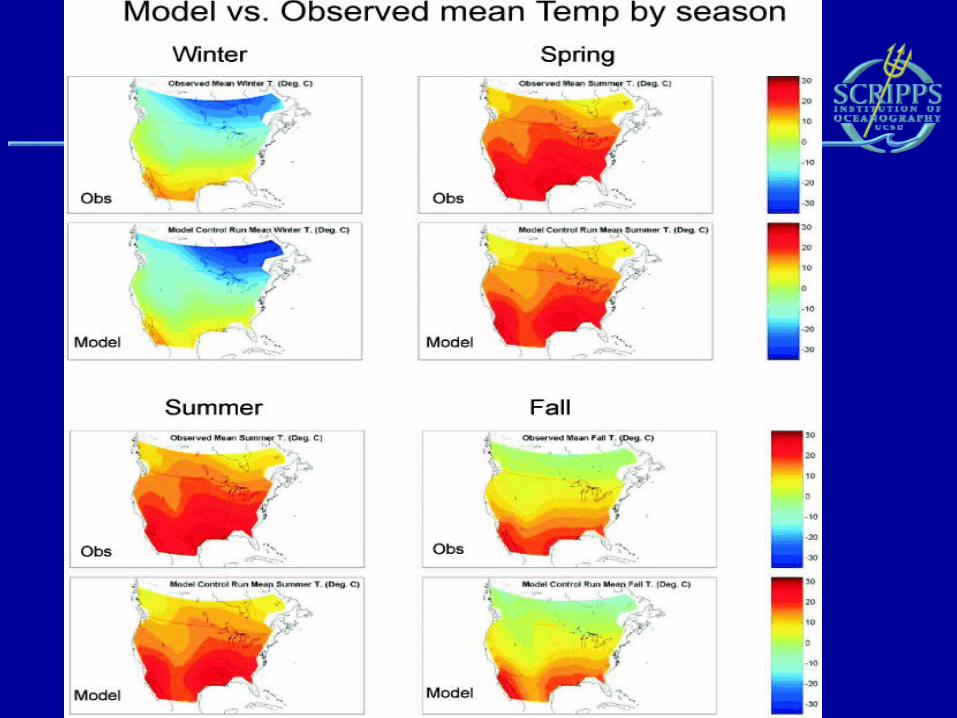

Historical Global Temperatures
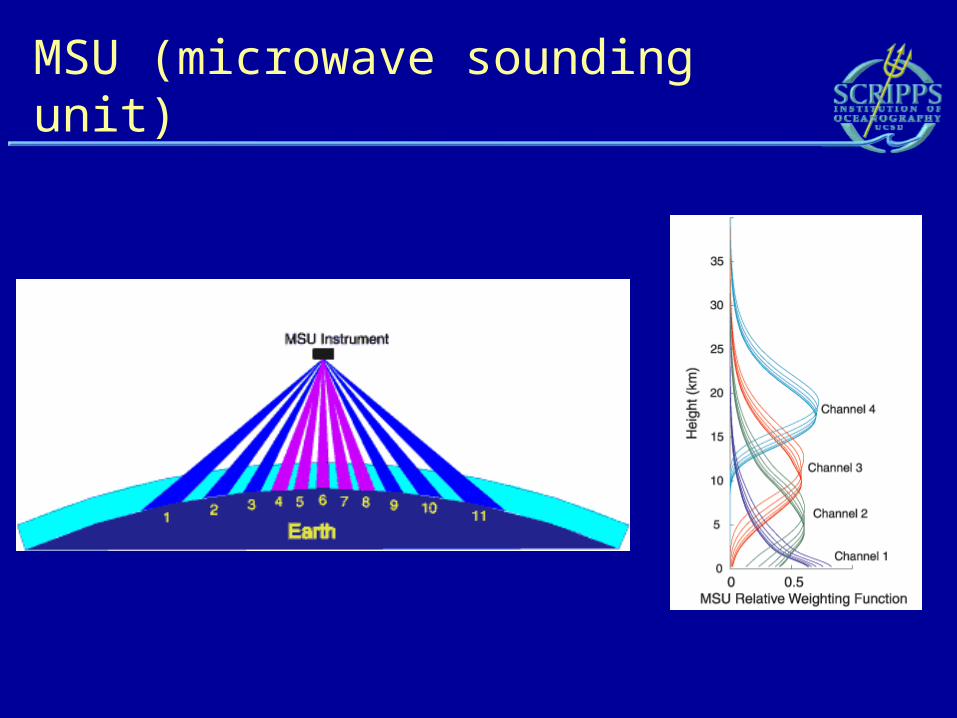
MSU (microwave sounding unit)

A difficult data set…
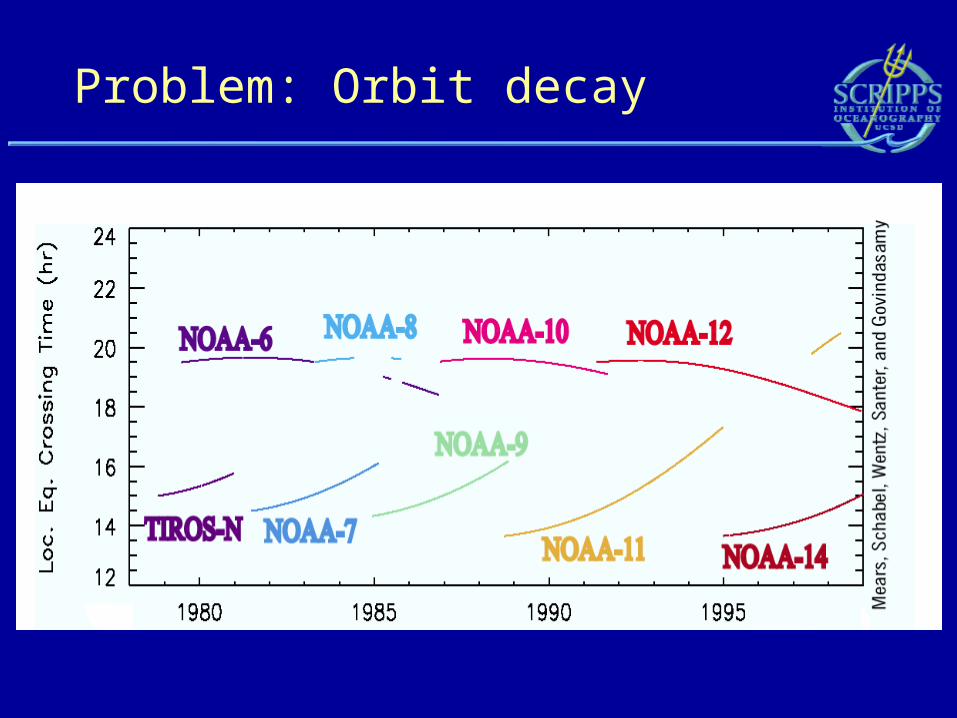
Problem: Orbit decay
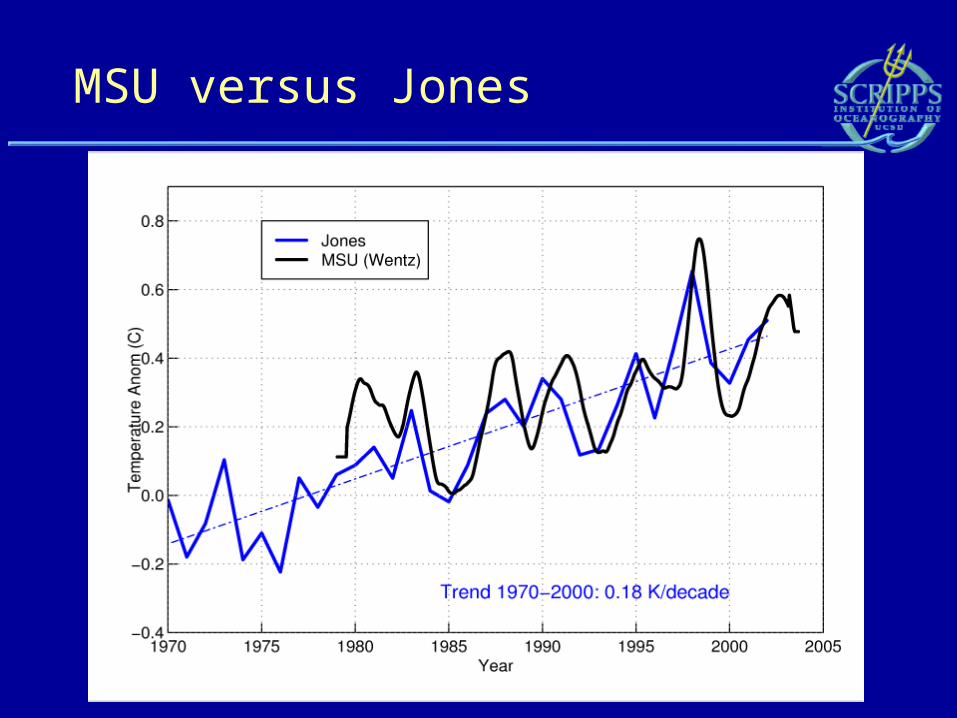
MSU versus Jones
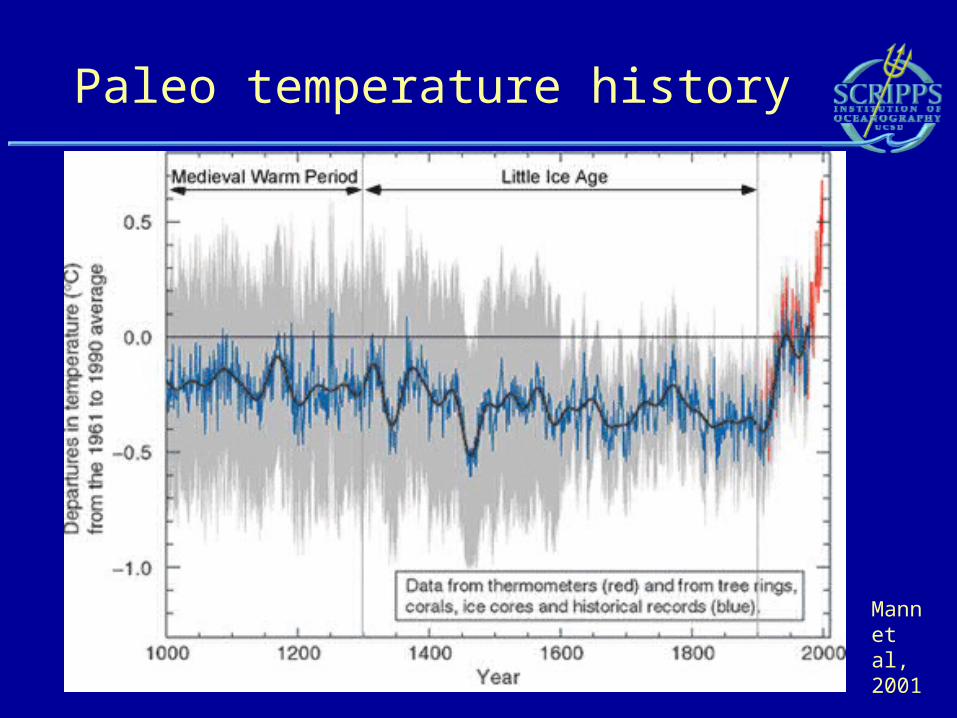
Paleo temperature history
Mann et al, 2001
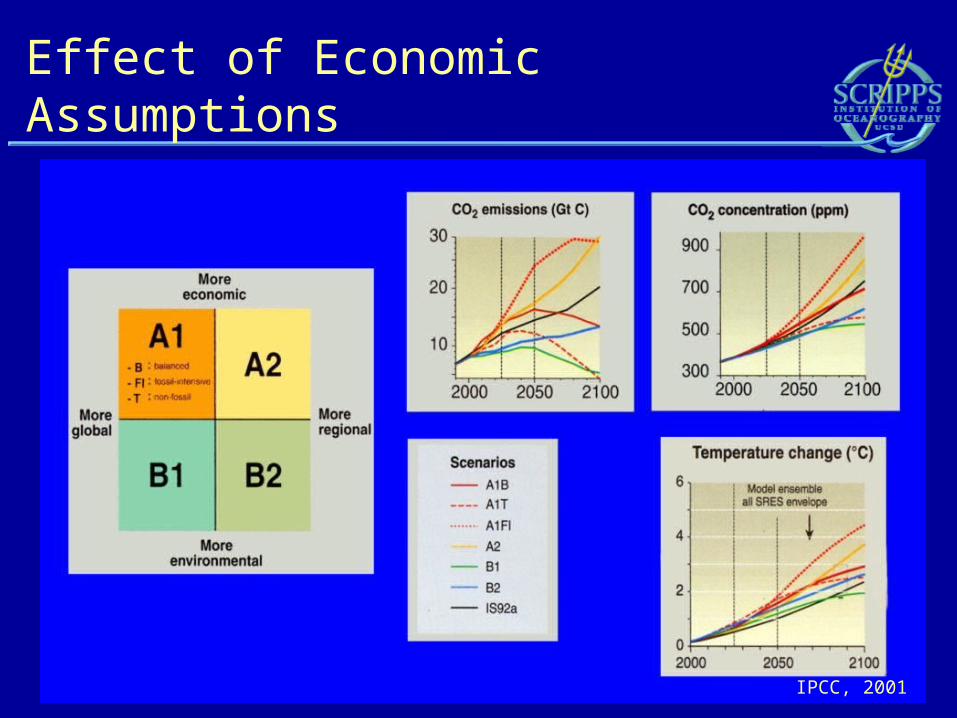
Effect of Economic Assumptions
IPCC, 2001

Natural vs. Human Influences
IPCC, 2001
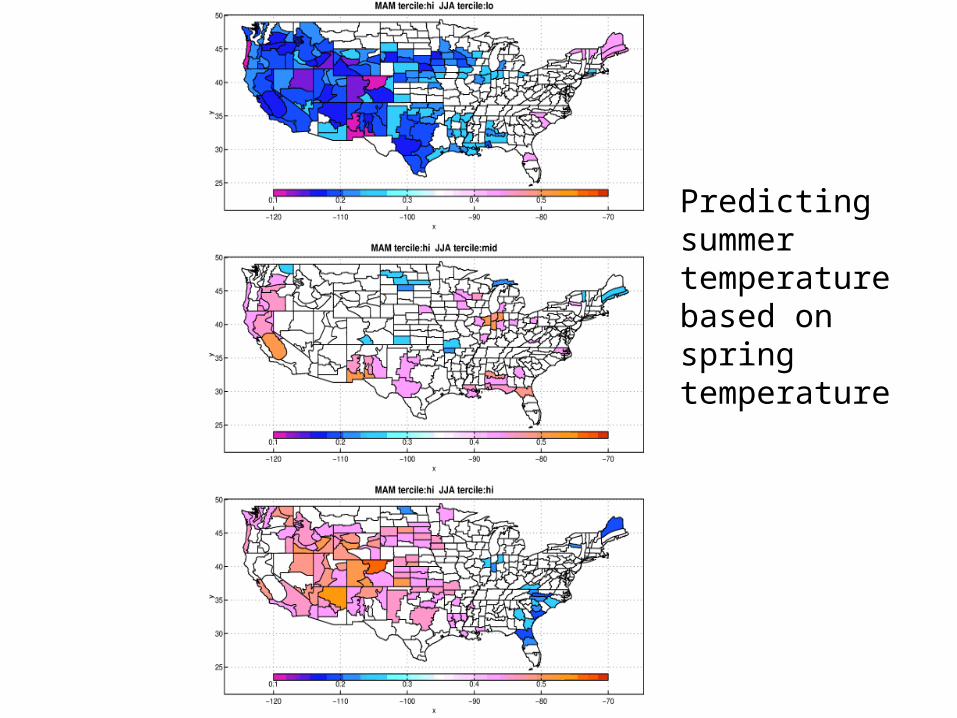
Predicting summer temperature based on spring temperature
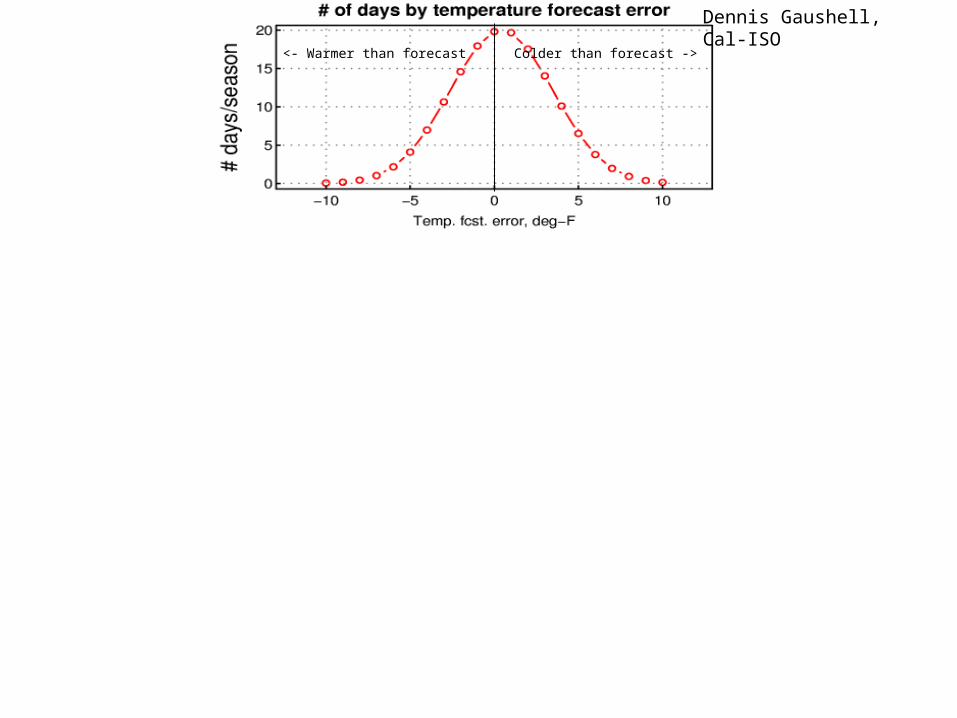
Dennis Gaushell,Cal-ISO
<- Warmer than forecast Colder than forecast ->
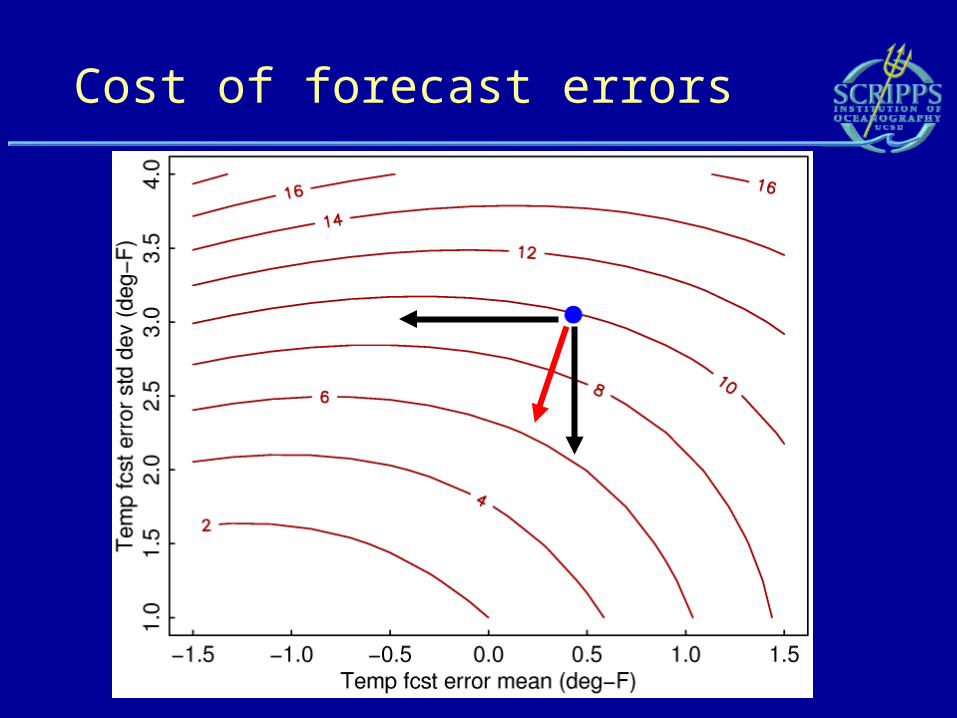
Cost of forecast errors
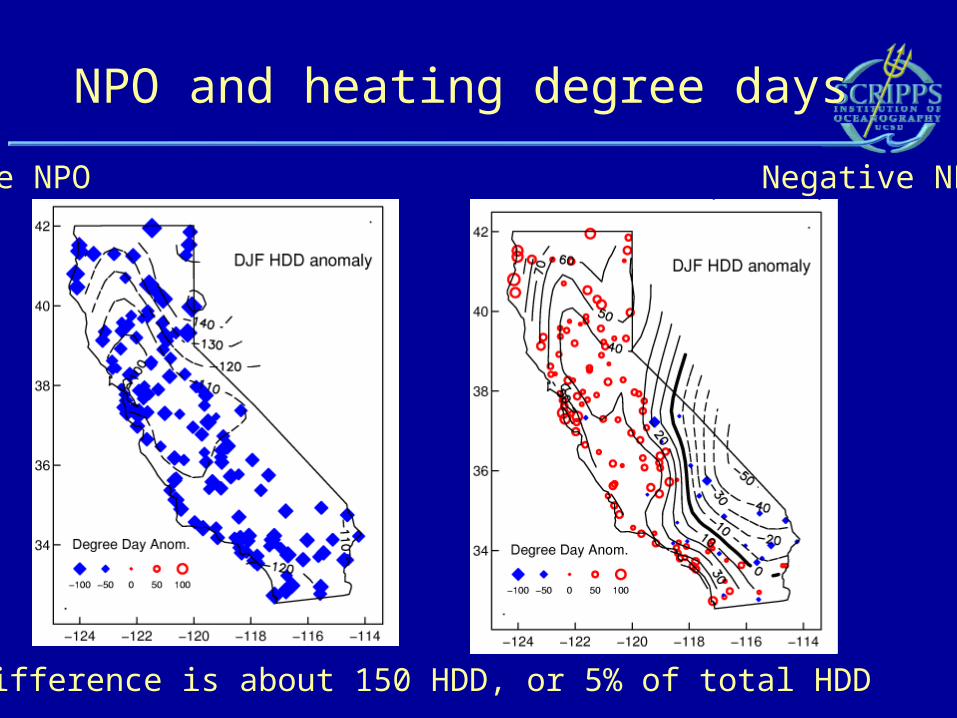
NPO and heating degree days
Positive NPO Negative NPO
Difference is about 150 HDD, or 5% of total HDD
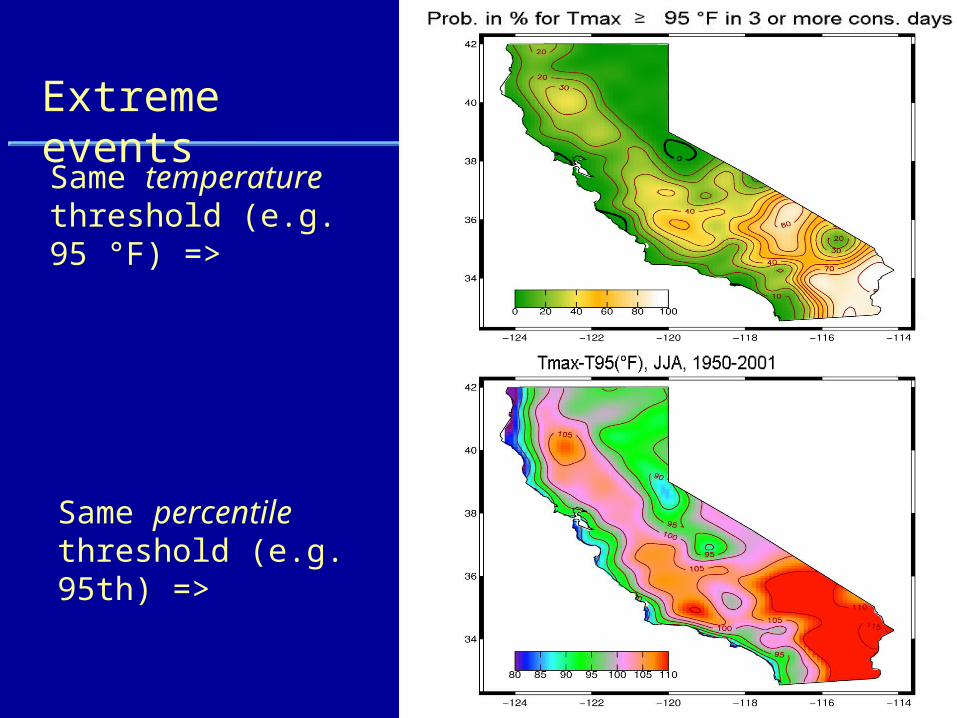
Extreme events
Same temperature threshold (e.g. 95 °F) =>
Same percentile threshold (e.g. 95th) =>
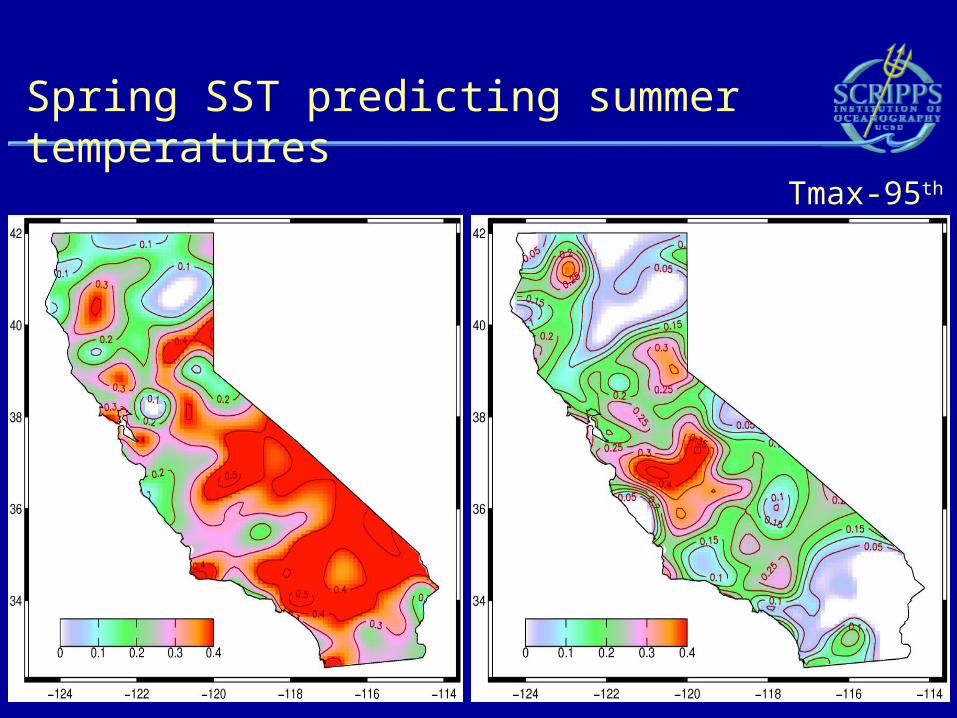
Spring SST predicting summer temperatures
CDD Tmax-95th percentile
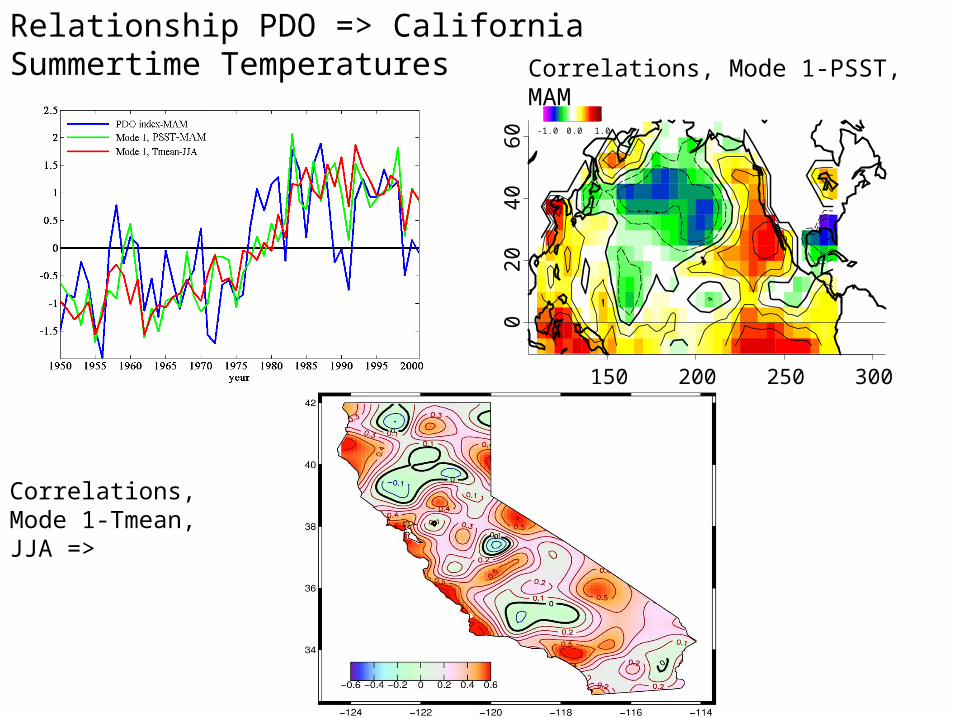
Relationship PDO => California Summertime Temperatures
150 200 250 300
02
04
06
0 -1.0 0.0 1.0
Correlations, Mode 1-Tmean, JJA =>
Correlations, Mode 1-PSST, MAM
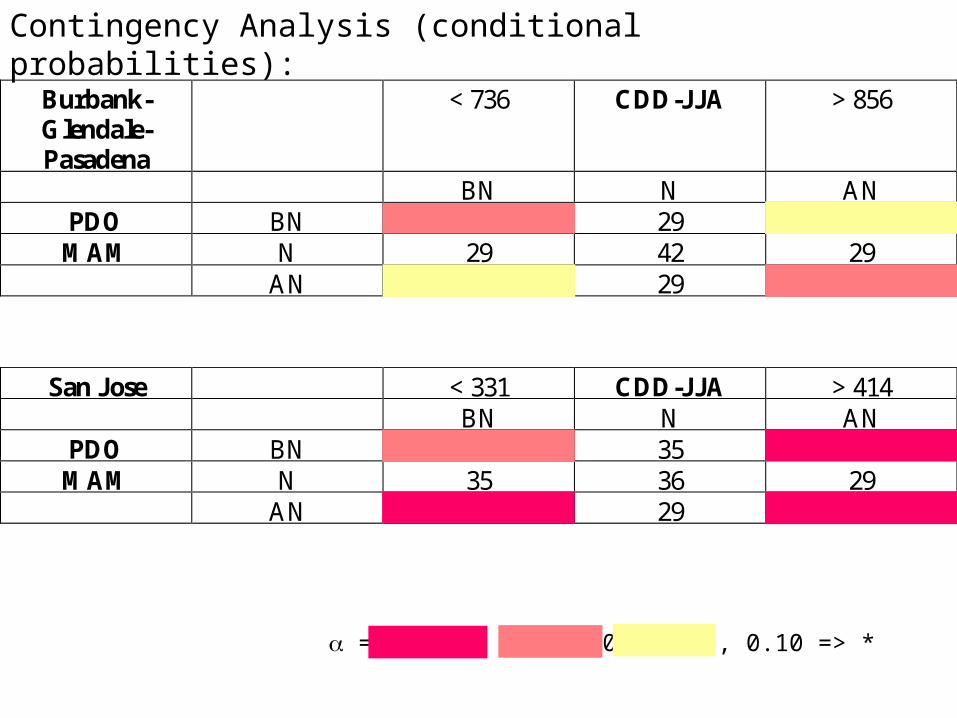
Contingency Analysis (conditional probabilities):
San Jose < 331 CDD-JJA > 414 BN N AN
PDO BN 53** 35 12*** MAM N 35 36 29
AN 12*** 29 59***
= 0.01 => ***, 0.05 => **, 0.10 => *
Burbank-Glendale-Pasadena
< 736 CDD-JJA > 856
BN N AN PDO BN 53** 29 18* MAM N 29 42 29
AN 18* 29 53**

Step 3. Verify streamflow
Nathalie Voisin et al., Univ. Washington, 2004
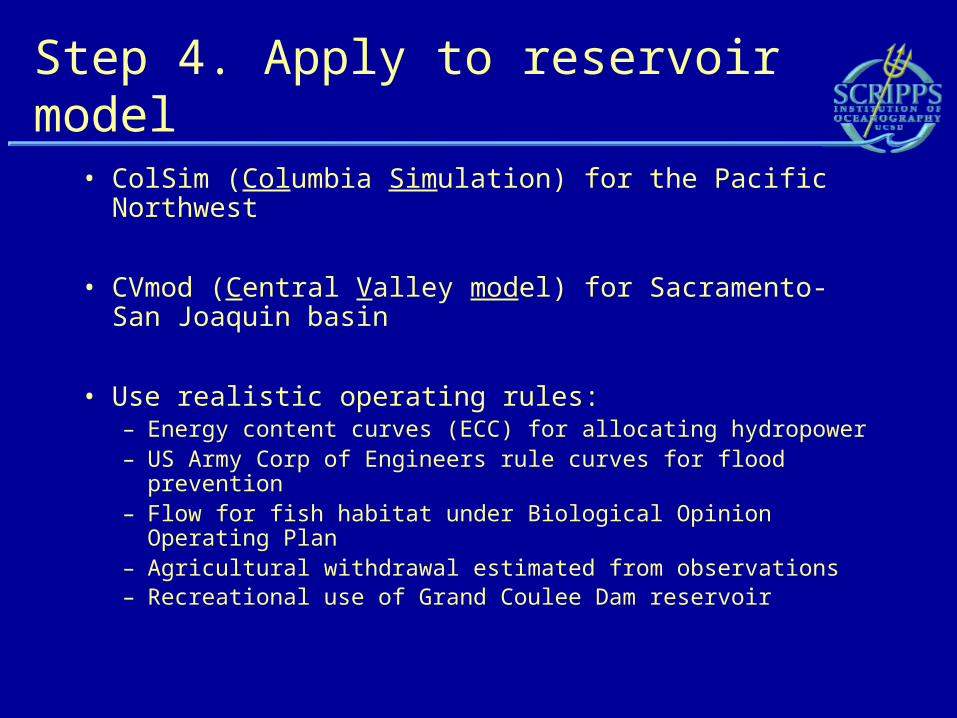
Step 4. Apply to reservoir model
• ColSim (Columbia Simulation) for the Pacific Northwest
• CVmod (Central Valley model) for Sacramento-San Joaquin basin
• Use realistic operating rules:– Energy content curves (ECC) for allocating hydropower– US Army Corp of Engineers rule curves for flood prevention– Flow for fish habitat under Biological Opinion Operating Plan– Agricultural withdrawal estimated from observations– Recreational use of Grand Coulee Dam reservoir
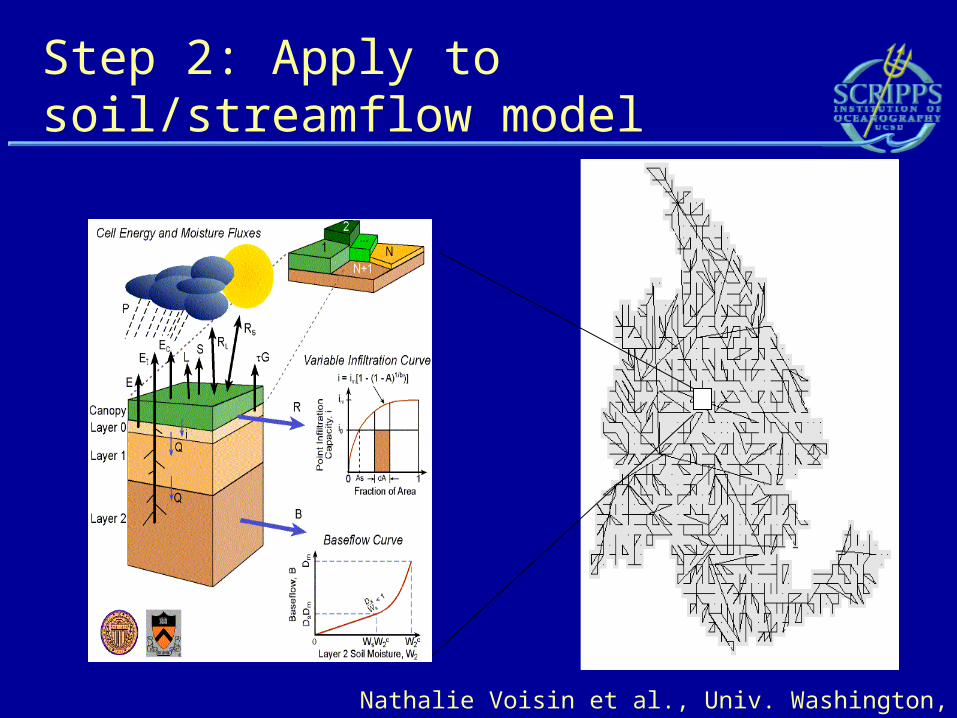
Step 2: Apply to soil/streamflow model
Nathalie Voisin et al., Univ. Washington, 2004
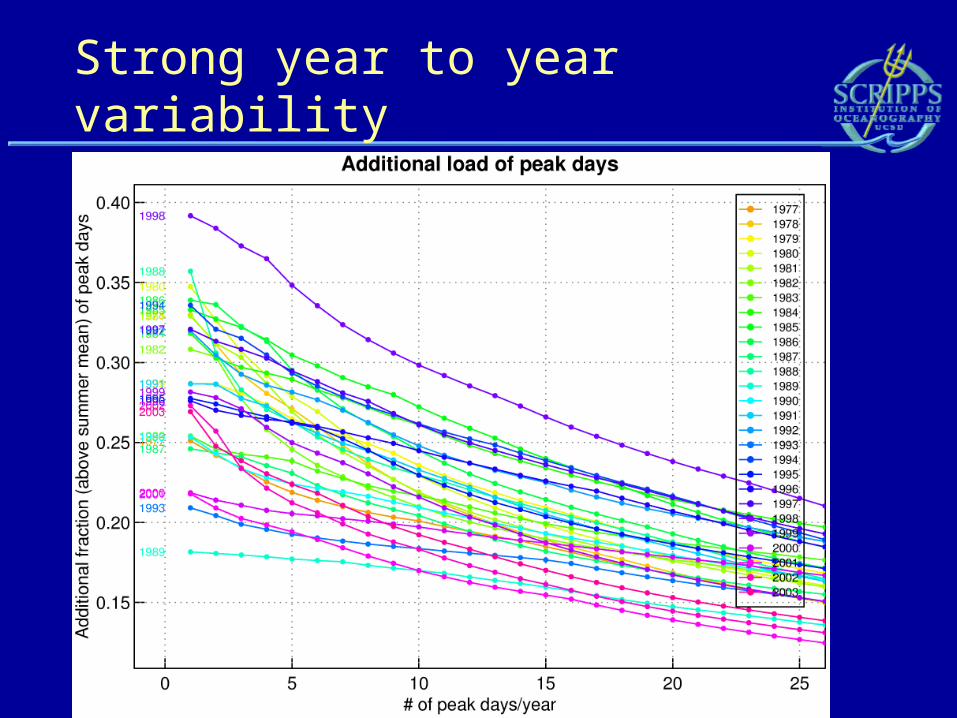
Strong year to year variability