Client Satisfaction With Develpmental Disabilites Services
21
http://www.jstor.org/stable/27503233 . Your use of the JSTOR archive indicates your acceptance of the Terms & Conditions of Use, available at . http://www.jstor.org/page/info/about/policies/terms.jsp . JSTOR is a not-for-profit service that helps scholars, researchers, and students discover, use, and build upon a wide range of content in a trusted digital archive. We use information technology and tools to increase productivity and facilitate new forms of scholarship. For more information about JSTOR, please contact [email protected]. . Springer is collaborating with JSTOR to digitize, preserve and extend access to Population and Environment. http://www.jstor.org
Transcript of Client Satisfaction With Develpmental Disabilites Services
8/9/2019 Client Satisfaction With Develpmental Disabilites Services
http://slidepdf.com/reader/full/client-satisfaction-with-develpmental-disabilites-services 1/20
http://www.jstor.org/stable/27503233 .
Your use of the JSTOR archive indicates your acceptance of the Terms & Conditions of Use, available at .http://www.jstor.org/page/info/about/policies/terms.jsp
.JSTOR is a not-for-profit service that helps scholars, researchers, and students discover, use, and build upon a wide range of
content in a trusted digital archive. We use information technology and tools to increase productivity and facilitate new forms
of scholarship. For more information about JSTOR, please contact [email protected].
.
Springer is collaborating with JSTOR to digitize, preserve and extend access to Population and Environment.
http://www.jstor.org
This content downloaded from 137.151.141.100 on Thu, 20 Nov 2014 13:39:45 PMAll use subject to JSTOR Terms and Conditions
8/9/2019 Client Satisfaction With Develpmental Disabilites Services
http://slidepdf.com/reader/full/client-satisfaction-with-develpmental-disabilites-services 2/20
8/9/2019 Client Satisfaction With Develpmental Disabilites Services
http://slidepdf.com/reader/full/client-satisfaction-with-develpmental-disabilites-services 3/20
122
POPULATION
AND ENVIRONMENT
duct
a
survey
to
determine
the
service
needs of
clients
of the
state
who
are
developmentally
disabled,
the
extent to
which these needs
are
being
met
in
a
satisfactory
manner,
and the
reasons
lying
behind
any
discontent.
To
help
do
this,
data
were
collected
in
face-to-face
interviews,
with
emphasis
being placed
upon
the
perceptions
of
the
clients rather than
upon
clinical
determinations
of need.
In
addition
to
providing
a
descriptive profile
of
the
service
needs
of
consumers
of
developmental
disabilities
services,
information
on
several
characteristics of the clients and their situation were also collected. This
makes
it
possible
to
determine
differentials
in
client
satisfaction,
thus
gain
ing insights
into
service
gaps
that
may
exist
and
ways
in
which the service
delivery
system
may
be
changed
to
provide
needed
services
more
satisfac
torily.
This
paper
describes the
methods
by
which
the data
were
collected,
the characteristics of
the
clients,
their
degree
of
satisfaction
with
the
serv
ices
they
receive,
and
the
reasons
for
any
dissatisfaction which exists.
METHODS AND SOURCE OF DATA
The
Florida
Department
of
Health and Rehabilitative
Services
(HRS)
and
the
Epilepsy
Foundation
provided
the
investigators
with
a
list of clients
and
their
addresses.
A
sample
of clients
residing
in
three
counties,
Dade,
Hillsborough
and
Leon,
was
generated
randomly.
These
counties
were
se
lected because
of
their
geographic
location,
a
willingness
on
the
part
of
local
HRS
personnel
to
facilitate
the
study,
and the
ease
of
finding quali
fied interviewers in each site. Together, these counties contain about 23%
of
the
state's
population.
In
each
county,
600
persons
were
selected
ini
tially,
with the
goal
of
actually interviewing
100
of them
in
each
county.
Each
name
and
address
selected
was
printed
and
distributed
to
trained
interviewers.
Altogether,
11
interviewers
were
used
in
conducting
the
survey:
three
in
Dade
County,
three
in
Hillsborough
County,
and five
in Leon
County.
Two
of
the
three
interviewers
in
Dade
County
were
bilingual.
In
Hills
borough
County provision
was
made
for
persons
who
spoke only
Spanish
to be interviewed at HRS facilities where
bilingual personnel
were avail
able.
In
addition,
interviewers
were
provided
with
a
Spanish
language
ver
sion
of
a
preliminary
draft
of
the
instrument.
Several
training
sessions
were
held for
interviewers.
At
these
sessions,
a
rationale
for
the
survey
was
pres
ented,
along
with
a
discussion
of the
organization
of the
instrument.
Each
interviewer
was
given
a
randomized
list of
names,
addresses and
suggested phone
numbers
(when available).
Whenever
possible,
they
were
also
given
the
name
of the client's social worker.
For
persons
living
in
This content downloaded from 137.151.141.100 on Thu, 20 Nov 2014 13:39:45 PMAll use subject to JSTOR Terms and Conditions
8/9/2019 Client Satisfaction With Develpmental Disabilites Services
http://slidepdf.com/reader/full/client-satisfaction-with-develpmental-disabilites-services 4/20
123
BOBWELLER
group
or
institutional
quarters,
the
names
and
telephone
numbers of the
client's social
worker and of the
institution's
operator
were
also
provided
whenever
possible.
Each
interviewer
was
instructed
to
begin
with
the first
name
on
the list and
to
make
up
to
three
attempts
to contact
the
person
by
telephone
before
moving
on
to
the
next
name
on
the list.
If
the initial
contact
was
made
by telephone,
interviewers
were
instructed
to
explain
the
purpose
of the
survey
(in
general
terms),
conduct
the first
portion
of the
interview
designed
to
screen
the
respondents
to
make
sure
the
person
would qualify as developmental ly disabled, and, if so, to make an appoint
ment to
conduct
the
rest
of the
interview
personally
in
a
face-to-face fash
ion. If
no
telephone
number
was
provided,
the
interviewer
was
instructed
to
go
to
the address
listed
and
to
try
an
interview
if
the client
(or
a
suitable
surrogate)
could be located.
Consent forms
were
completed
and
signed
at
the
beginning
of the face-to-face
interview.
Institutionalized
clients
posed
special
in
the
sense
that
they
were
very
likely
to
need
a
surrogate
to
respond
to
the
questions,
some
of the
ques
tions
were
inappropriate,
and
some
of the
institutional
operators
were
re
luctant to
grant
access because of an
(unfounded)
fear that their
particular
institution would somehow be
evaluated
unfavorably,
or
because
provid
ing
sufficient
personnel
to
serve
as
surrogates
was
difficult. This
was
espe
cially
the
case
for
those
institutions
in
which
several clients
were
included
in
the
sample.
Nevertheless,
institutional
clients
may
be
slightly
overrepre
sented
in
the
sample
because of the
ease
with which
they
could
be
located.
The National
Association
of
Developmental
Disabilities
Councils
de
veloped
the
questionnaire
used
to
conduct the
interviews.
It
was
used
in
54 states and territories
as
part of the national effort mandated by Congress
(NADDC,
1990).
Few
questionnaires
are
perfect.
This
one
had
several
shortcomings.
Pretests
showed
it
did
not
do well with
children and
persons
who
are
mentally
handicapped.
The
use
of
parallel
instruments
(for
surro
gates
and
clients)
was
considered
by
the instrument's
designers
but
re
jected
because the
designers thought
it
would be
unwieldy.
Most
of
the
interviews conducted
in
Florida involved the
help
of
surrogates.
Unfor
tunately,
one
cannot
ascertain
the
extent
of
surrogate
participation
in
the
interview
process.
The
questionnaire
was
also
rather
long
and sometimes
contained difficult
language.
These
shortcomings
were
largely
offset
by
in
terviewer
training.
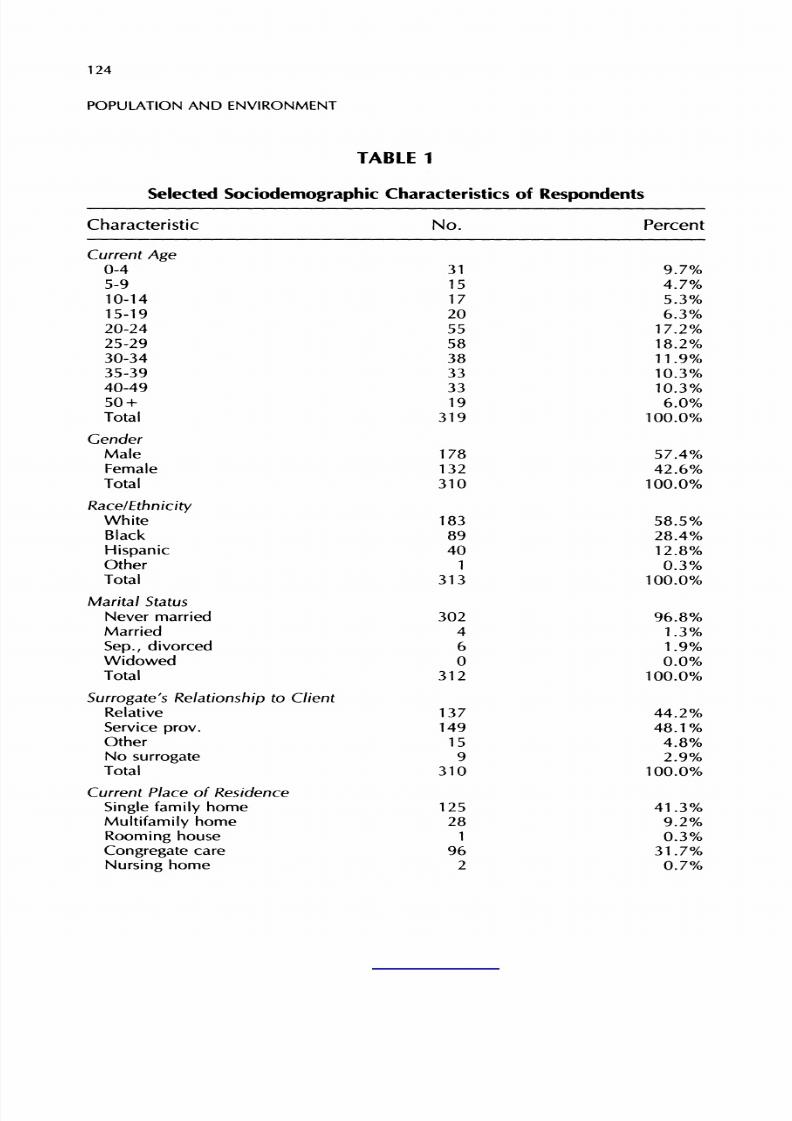
CHARACTERISTICS
OF
RESPONDENTS
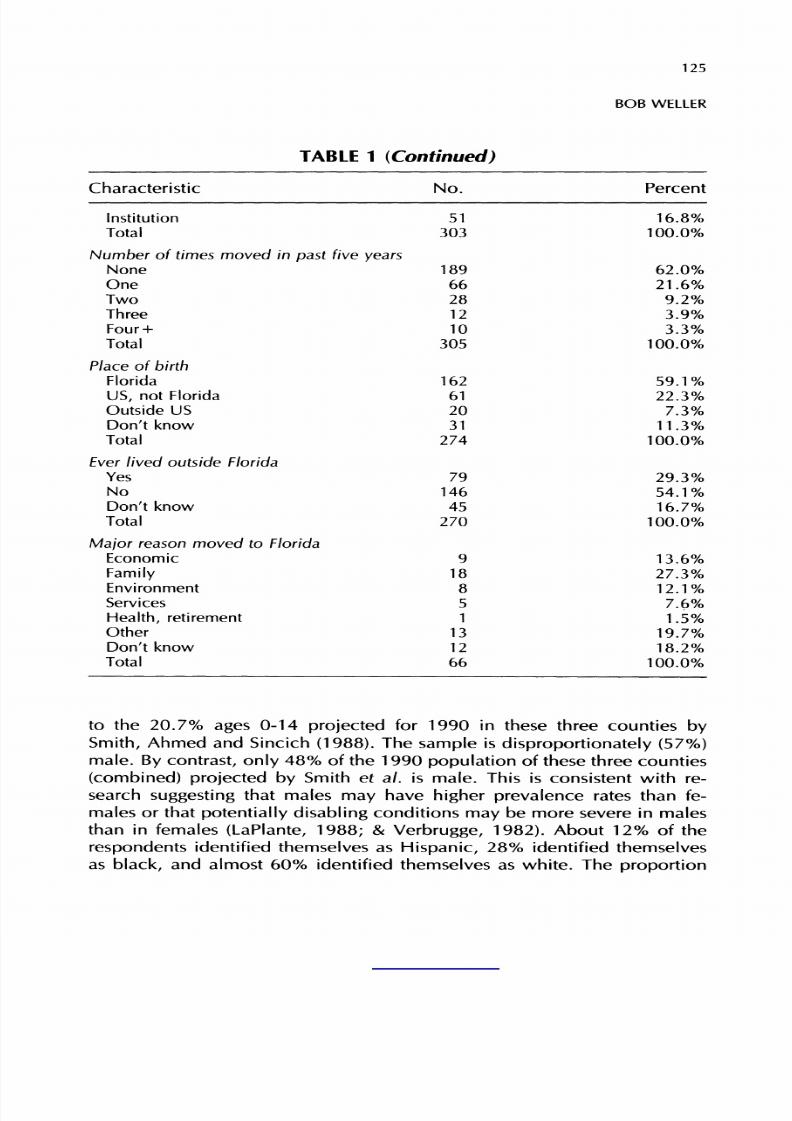
Table
1
presents
descriptive
statistics
of
the
respondents.
Slightly
less
than
10%
are
preschool
ages,
and
19.7%
are
ages
0-14.
This
is
very
close
This content downloaded from 137.151.141.100 on Thu, 20 Nov 2014 13:39:45 PMAll use subject to JSTOR Terms and Conditions
8/9/2019 Client Satisfaction With Develpmental Disabilites Services
http://slidepdf.com/reader/full/client-satisfaction-with-develpmental-disabilites-services 5/20
124
POPULATION
AND
ENVIRONMENT
TABLE 1
Selected
Sociodemographic
Characteristics of
Respondents
Characteristic
No.
Percent
Current
Age
0-4
5-9
10-14
15-19
20-24
25-29
30-34
35-39
40-49
50
+
Total
Gender
Male
Female
Total
Race/Ethnicity
White
Black
Hispanic
Other
Total
Marital Status
Never
married
Married
Sep.,
divorced
Widowed
Total
Surrogate's
Relationship
to
Client
Relative
Service
prov.
Other
No
surrogate
Total
Current
Place
of Residence
Single
family
home
Multifamily
home
Rooming
house
Congregate
care
Nursing
home
31
15
17
20
55
58
38
33
33
19
319
178
132
310
183
89
40
1
313
302
4
6
0
312
137
149
15
9
310
125
28
1
96
2
9.7%
4.7%
5.3%
6.3%
17.2%
18.2%
11.9%
10.3%
10.3%
6.0%
100.0%
57.4%
42.6%
100.0%
58.5%
28.4%
12.8%
0.3%
100.0%
96.8%
1.3%
1.9%
0.0%
100.0%
44.2%
48.1%
4.8%
2.9%
100.0%
41.3%
9.2%
0.3%
31.7%
0.7%
This content downloaded from 137.151.141.100 on Thu, 20 Nov 2014 13:39:45 PMAll use subject to JSTOR Terms and Conditions
8/9/2019 Client Satisfaction With Develpmental Disabilites Services
http://slidepdf.com/reader/full/client-satisfaction-with-develpmental-disabilites-services 6/20
125
TABLE 1
(Continued)
BOBWELLER
Characteristic
No. Percent
Institution
51
Total
303
Number of
times
moved
in
past
five
years
None 189
One
66
Two 28
Three
12
Four+
10
Total 305
Place of birth
Florida 162
US,
not
Florida 61
Outside
US
20
Don't
know 31
Total 274
Ever
lived outside
Florida
Yes
79
No
146
Don't
know
45
Total
270
Major
reason
moved
to
Florida
Economic
9
Family
18
Environment
8
Services 5
Health,
retirement
1
Other
13
Don't
know
12
Total
66
16.8%
100.0%
62.0%
21.6%
9.2%
3.9%
3.3%
100.0%
59.1%
22.3%
7.3%
11.3%
100.0%
29.3%
54.1%
16.7%
100.0%
13.6%
27.3%
12.1%
7.6%
1.5%
19.7%
18.2%
100.0%
to
the 20.7%
ages
0-14
projected
for 1990
in
these three counties
by
Smith,
Ahmed
and Sincich
(1988).
The
sample
is
disproportionately (57%)
male.
By
contrast,
only
48%
of
the 1990
population
of these
three counties
(combined)
projected
by
Smith
et
al.
is
male.
This
is
consistent
with
re
search
suggesting
that
males
may
have
higher
prevalence
rates
than
fe
males
or
that
potentially
disabling
conditions
may
be
more severe
in
males
than
in
females
(LaPlante,
1988;
&
Verbrugge,
1982).
About
12%
of
the
respondents
identified
themselves
as
Hispanic,
28%
identified themselves
as
black,
and almost
60%
identified themselves
as
white. The
proportion
This content downloaded from 137.151.141.100 on Thu, 20 Nov 2014 13:39:45 PMAll use subject to JSTOR Terms and Conditions
8/9/2019 Client Satisfaction With Develpmental Disabilites Services
http://slidepdf.com/reader/full/client-satisfaction-with-develpmental-disabilites-services 7/20
126
POPULATION
AND
ENVIRONMENT
TABLE 2
Educational
Experience
of
Respondents
Characteristic
No. Percent
Received
Early
intervention
Preschool
Elementary school
Junior
high/middle
school
High
school
Vocational
College
Homebound
Special
school
Unknown
Most
of education received
in
Special
school
(residential)
Special
school
(day)
Special
class,
regular
school
Regular
class,
regular
school
Homebound
Residential
facility
for
disabled
Residential
facility
for
mentally
il
Other
43
45
67
29
23
20
3
20
150
13
7
126
38
19
13
29
11
77
13.4%
14.1%
20.9%
9.1%
7.2%
6.3%
0.9%
6.3%
46.9%
4.1%
2.2%
39.4%
11.9%
5.9%
4.1%
9.1%
3.4%
10.5%
of these three counties (combined) that was Hispanic in 1990 has been
projected
as
30.4%
(Center,
1987).
Smith
et
al.
(1988)
project
the
propor
tion
black
in
1990
in
these three
counties
(combined)
as
20.5%.
These
figures
are
included
merely
to
provide
a
general
notion
of
how
the
popula
tion
of
respondents
compares
with the
general population.
Prevalence
rates
are
not
random but tend
to
vary
by
age,
sex,
and
ethnicity.
Thus
the
percent
distributions
of the
sample
and the
general population
will
not
necessarily
be
the
same.
Very
few
of
the
respondents
have
ever
been
married.
Only
2.9%
of
the
interviews
were
conducted
without the
help
of
a
surrogate.
In
over
90%
of the
cases,
the
surrogate
was
either
a
relative
or a
service
provider.
As
may
be
seen
in
Table
1,
slightly
more
than
half of the
sample
live
in
a
family
home.
Most
of
these
(41.3%
of
the
sample)
live
in
a
single family
home;
9.2%
of the
sample
live
in
a
multifamily
home.
Slightly
less
than
half
of the
respondents
live
in
some
sort
of
group
facility.
This breaks
down
as
31.7%
in
a
congregate
care
facility
and
16.8%
in
an
institution. The
This content downloaded from 137.151.141.100 on Thu, 20 Nov 2014 13:39:45 PMAll use subject to JSTOR Terms and Conditions
8/9/2019 Client Satisfaction With Develpmental Disabilites Services
http://slidepdf.com/reader/full/client-satisfaction-with-develpmental-disabilites-services 8/20
127
BOB
WELLER
remaining
1
%
of the
respondents
live
in
a
nursing
home
(0.7%)
or
rooming
house
(0.3%).
Persons born outside of Florida
are
29.6%
of
the
sample.
The
propor
tion
born outside the
U.S. is
7.3%.
The four
leading
reasons
given
for
migration
are:
family,
other,
economic and environment.
"Services" is
not
given
as
a
reason
for
migration
to
Florida
by only
7.6%
of
the
respondents.
This
finding
is similar
to
that
obtained
in
an
earlier
study
of
applicants
to
HRS
Developmental
Services.
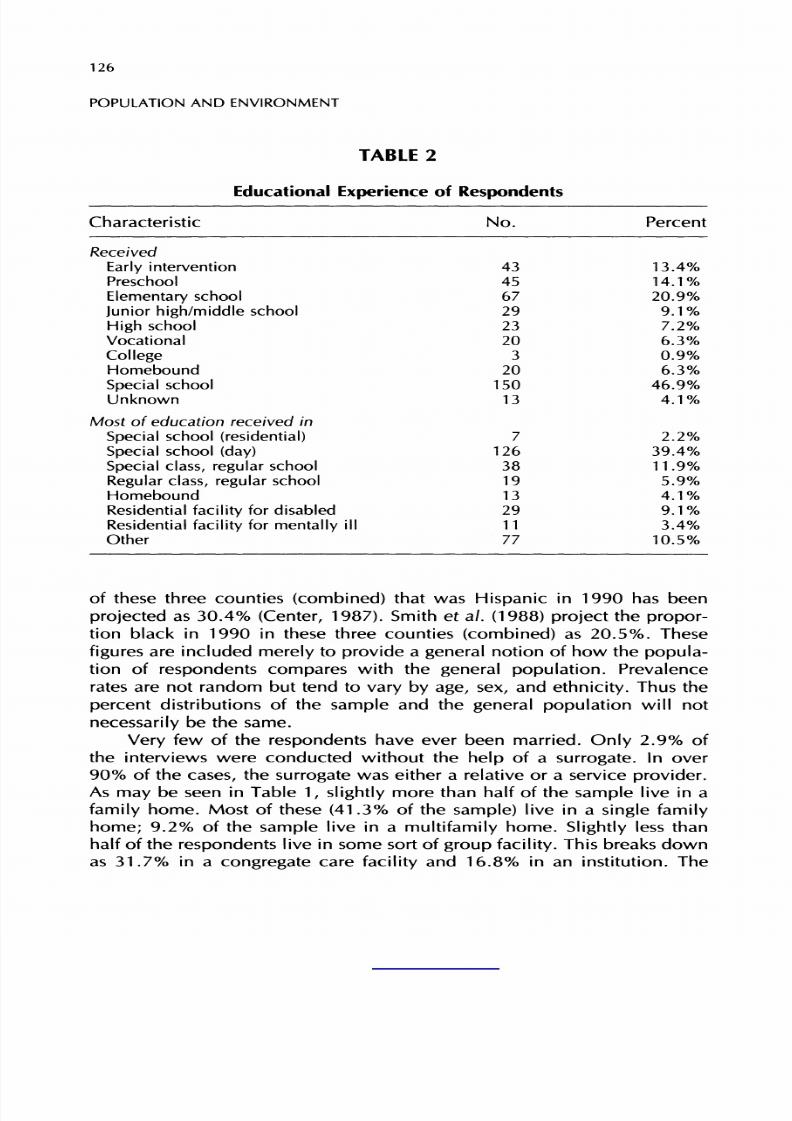
The educational
experience
of the
respondents
is
presented
in Table
2.
They
have
been
educated
in
a
variety
of
settings. Only
13.4%
have
received
early
intervention
and
only
14.1%
have
attended
preschool. Early
intervention
is
critical
to
prevent
further
problems
and
to
achieve
maxi
mum
development.
Yet
waiting
lists
are
long
and
programs
may
have
in
sufficient
resources,
especially
trained
professionals.
Many
day
care
pro
viders
do
not
accept
children with
special
needs
(NADDC,
1990).
Almost
half of the
respondents
have attended
a
special
school
or
program
with
no
grades.
This makes
it
impossible
to
compute
the
highest grade completed.
When
number of
years
of
schooling
is
calculated
by combining
number of
years
spent
in
each
type,
the
respondents
have
spent
an
average
of
7.2
years
in
school.
A
considerable
portion
of
the
respondents
report
that
most
of
their
schooling
took
place
in
a
special setting,
either
a
special
school
or
a
special
class
in
a
regular
school.
Only
5.9%
report
they
have
received
most
of
their
schooling
in
a
regular
class
in
a
regular
school.
This shows
segregation
of
developmental
ly
disabled
persons
in
the
public
educational
system.
It is consistent
with
a
federal
report that,
de
spite a federal law that requires students with disabilities to be served in
the "least
restrictive"
settings
possible,
some
states
exclude
more
than
two
thirds of
certain
disability
groups
from
regular
schools
(U.S.
Department
of
Education,
1985).
Nationally,
38%
of
the
children interviewed
as
part
of
the
consumer
survey
were
completely segregated
either
in
separate
build
ings,
residential schools
or
in
homebound
education
(NADDC,
1990).
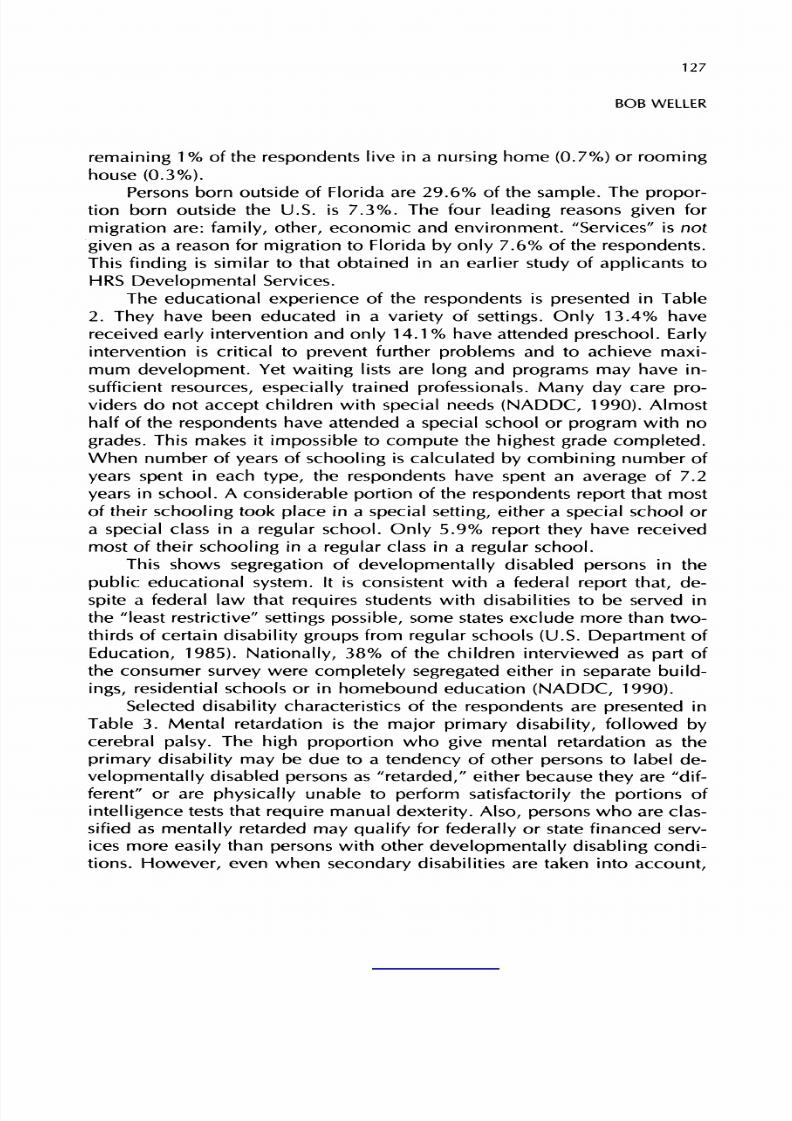
Selected
disability
characteristics
of the
respondents
are
presented
in
Table
3.
Mental
retardation
is
the
major
primary
disability,
followed
by
cerebral
palsy.
The
high proportion
who
give
mental retardation
as
the
primary disability
may
be
due
to
a
tendency
of other
persons
to
label
de
velopmentally
disabled
persons
as
"retarded,"
either
because
they
are
"dif
ferent"
or
are
physically
unable
to
perform
satisfactorily
the
portions
of
intelligence
tests
that
require
manual
dexterity.
Also,
persons
who
are
clas
sified
as
mentally
retarded
may
qualify
for
federally
or
state
financed
serv
ices
more
easily
than
persons
with
other
developmental
ly
disabling
condi
tions.
However,
even
when
secondary
disabilities
are
taken into
account,
This content downloaded from 137.151.141.100 on Thu, 20 Nov 2014 13:39:45 PMAll use subject to JSTOR Terms and Conditions
8/9/2019 Client Satisfaction With Develpmental Disabilites Services
http://slidepdf.com/reader/full/client-satisfaction-with-develpmental-disabilites-services 9/20
c
0>
U
i?CD
?
rsi
i?
rsi
m
rj-
<y>
(N lo
-^
rr
cx>
n
m
LO
COK
COO
lO
K
ld lo r\ m cx> ̂ cr>
O
Z
LO Lo ^D rsj
c\
m
tj
K
CO^t
M CO
LO
LO
t?
t?
<N
*?
CN (N (N
fO
C?
<
c
"o
c
Vi
eu
U
03
U
5
?
^
'<"
?
2?
-L CL
O
03
_
C
ro
nj
C
-
.2
C
c
o
IS
<u
t?
5:
?Q
tu .t;
g"?
?
Q
O
CL?
5.
03
03
<y
go
2
"2
o.
3
2
^
't
a^
_
CU
q; o>
03
?
?;
0?
to
_J
Q-
U <
O
Qj
eu
w
u
I
I
3 CU
CD
U
DO
C
?
"3
O
?
gi-S
?
?
E
c
t=
E
00
e
U
-j
??
?1 ?1
?
c/i
c
CD
u
vDO<Nror\imcNromomo coco^onLnincr>ror-cO'
vu O^ CO
O
O
Z
in^ffi'-O'-rni-r-inoi
rsi
t?
o
Mr
mm^-i-vOCOfNC^'-v?tNrtOO^tNOO
C\| CN
1?
r-
v?>
(N
CN
O (N
O
vu
:
jz
5
s-
<
:
O 1
U
c
-3
i
<
ex.
0)
03
C
?
*
c?U?
</>
.=-,
>-'c
-? DO03
S
"2
3
<^
Lul4
3
&
Q-
Q-X
=5
o<
This content downloaded from 137.151.141.100 on Thu, 20 Nov 2014 13:39:45 PMAll use subject to JSTOR Terms and Conditions
8/9/2019 Client Satisfaction With Develpmental Disabilites Services
http://slidepdf.com/reader/full/client-satisfaction-with-develpmental-disabilites-services 10/20
129
BOBWELLER
the
proportion
with mental
retardation
is
very
high
relative
to
the other
conditions.
The
high
proportion
that
is
classified
as
mentally
retarded
may
also
be
partially
attributable
to
a
tendency
to
classify
severely
disabled
persons
as
mentally
retarded,
even
though
they
may
not
actually
be
men
tally
retarded.
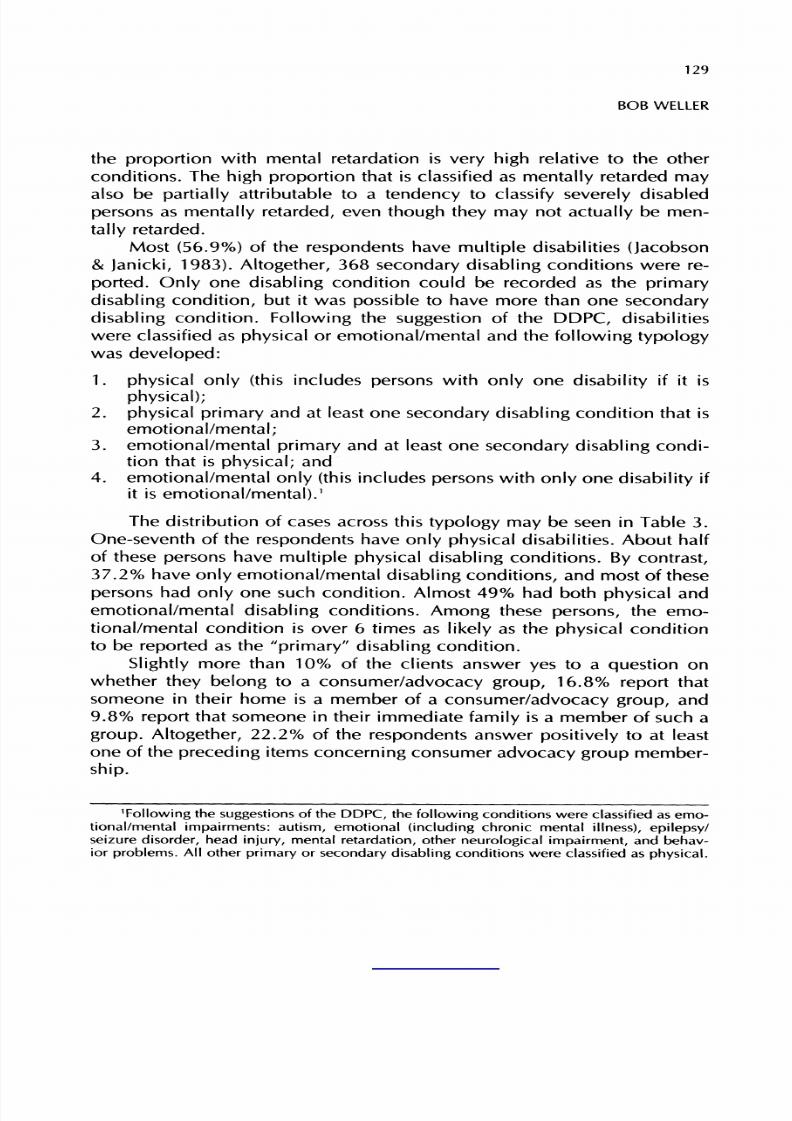
Most
(56.9%)
of the
respondents
have
multiple
disabilities
(Jacobson
&
Janicki,
1983).
Altogether,
368
secondary
disabling
conditions
were
re
ported.
Only
one
disabling
condition
could be
recorded
as
the
primary
disabling
condition,
but itwas
possible
to have more than one
secondary
disabling
condition.
Following
the
suggestion
of the
DDPC,
disabilities
were
classified
as
physical
or
emotional/mental and
the
following
typology
was
developed:
1.
physical only
(this
includes
persons
with
only
one
disability
if it is
physical);
2.
physical primary
and
at
least
one
secondary
disabling
condition
that
is
emotional/mental;
3. emotional/mental primary and at least one secondary disabling condi
tion
that
is
physical;
and
4.
emotional/mental
only
(this
includes
persons
with
only
one
disability
if
it
is
emotional/mental).1
The
distribution of
cases
across
this
typology
may
be
seen
in
Table
3.
One-seventh of the
respondents
have
only
physical
disabilities. About half
of
these
persons
have
multiple
physical
disabling
conditions.
By
contrast,
37.2%
have
only
emotional/mental
disabling
conditions,
and
most
of
these
persons
had
only
one
such
condition. Almost
49%
had both physical and
emotional/mental
disabling
conditions.
Among
these
persons,
the
emo
tional/mental condition
is
over
6
times
as
likely
as
the
physical
condition
to
be
reported
as
the
"primary"
disabling
condition.
Slightly
more
than
10%
of the
clients
answer
yes
to
a
question
on
whether
they
belong
to
a
consumer/advocacy
group,
16.8%
report
that
someone
in
their home is
a
member
of
a
consumer/advocacy
group,
and
9.8%
report
that
someone
in
their
immediate
family
is
a
member of
such
a
group.
Altogether,
22.2%
of the
respondents
answer
positively
to
at
least
one of the
preceding
items
concerning
consumer
advocacy
group
member
ship.
following
the
suggestions
of the
DDPC,
the
following
conditions
were
classified
as emo
tional/mental
impairments:
autism,
emotional
(including
chronic
mental
illness),
epilepsy/
seizure
disorder,
head
injury,
mental
retardation,
other
neurological
impairment,
and
behav
ior
problems.
All other
primary
or
secondary
disabling
conditions
were
classified
as
physical.
This content downloaded from 137.151.141.100 on Thu, 20 Nov 2014 13:39:45 PMAll use subject to JSTOR Terms and Conditions
8/9/2019 Client Satisfaction With Develpmental Disabilites Services
http://slidepdf.com/reader/full/client-satisfaction-with-develpmental-disabilites-services 11/20
130
POPULATION
AND ENVIRONMENT
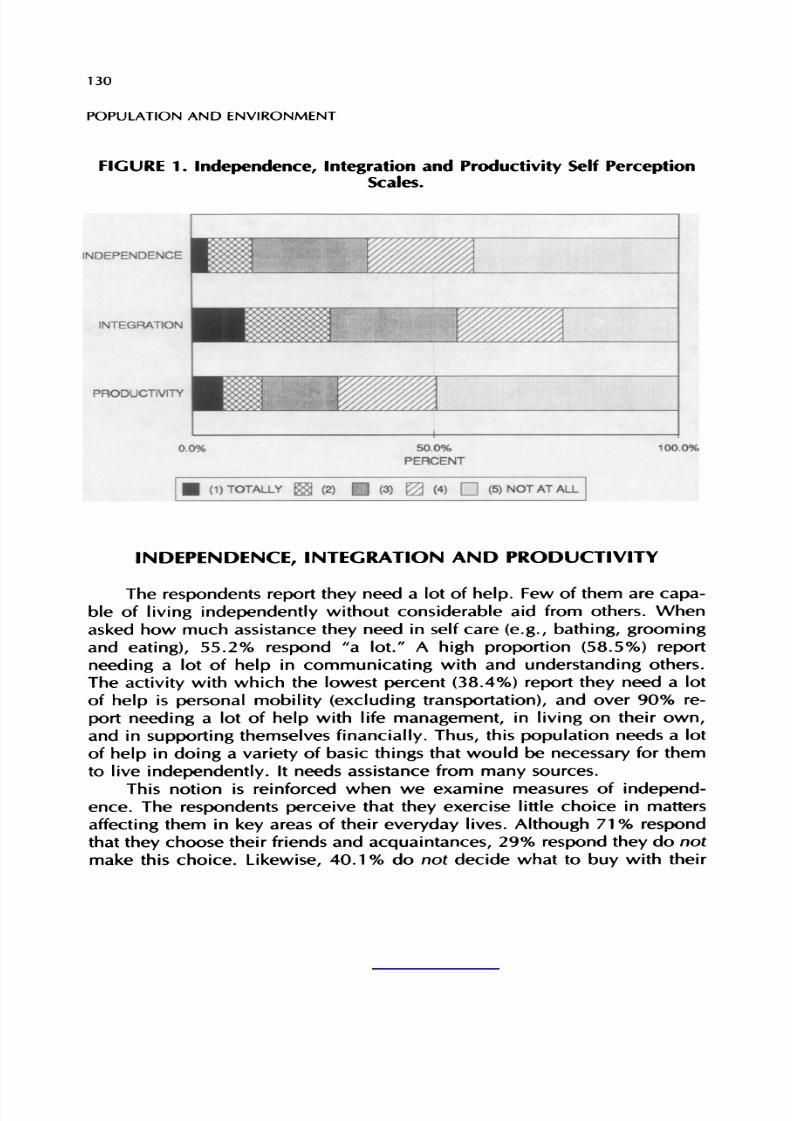
FIGURE 1.
Independence, Integration
and
Productivity
Self
Perception
Scales.
INDEPENDENCE
INTEGRATION
PRODUCnVTTY
Mi
0.0% 100.0%
(1)
OTALLY
gg
(2) (3) (4) (5)
NOT
T
ALL
INDEPENDENCE,
INTEGRATION
AND
PRODUCTIVITY
The respondents report they need
a
lot of help. Few of them
are
capa
ble of
living
independently
without considerable
aid from
others.
When
asked how
much
assistance
they
need
in
self
care
(e.g.,
bathing,
grooming
and
eating),
55.2%
respond
"a
lot."
A
high
proportion
(58.5%)
report
needing
a
lot of
help
in
communicating
with and
understanding
others.
The
activity
with which the lowest
percent
(38.4%)
report
they
need
a
lot
of
help
is
personal
mobility
(excluding
transportation),
and
over
90%
re
port
needing
a
lot
of
help
with life
management,
in
living
on
their
own,
and
in
supporting
themselves
financially.
Thus,
this
population
needs
a
lot
of
help
in
doing
a
variety
of basic
things
that would be
necessary
for them
to
live
independently.
It
needs
assistance from
many
sources.
This
notion
is
reinforced
when
we
examine
measures
of
independ
ence.
The
respondents
perceive
that
they
exercise
little choice
in
matters
affecting
them
in
key
areas
of their
everyday
lives.
Although
71%
respond
that
they
choose their
friends and
acquaintances,
29%
respond they
do
not
make
this choice.
Likewise,
40.1% do
not
decide
what
to
buy
with their
This content downloaded from 137.151.141.100 on Thu, 20 Nov 2014 13:39:45 PMAll use subject to JSTOR Terms and Conditions
8/9/2019 Client Satisfaction With Develpmental Disabilites Services
http://slidepdf.com/reader/full/client-satisfaction-with-develpmental-disabilites-services 12/20
131
BOBWELLER
spending
money,
40.2%
do
not
determine what clothes
to
wear,
43.1
%
do
not
determine
what their
weekend and
evening
activities will
be.
More
than
half do
not
exercise
choice
in
other
aspects
of
their lives.
As
may
be
seen
in
Figure
1,
over
42%
rate
themselves
as
"not
at
all"
independent
on
a
5
point
scale.
The
survey
data
also
show low
perceived
measures
of
productivity.
Half
of the
respondents
rated
themselves
as
"not
at
all"
productive.
Even
though
a
very
liberal definition of
working
(defined
to
include
day
and
training programs)
was
used,
only
27.3% of the
respondents
were
currently
working
and
only
a
slightly
higher
percentage
reported they
had
ever
worked. This
is consistent
with Bowe's
report
(1984)
that,
by
nearly
any
available
analysis,
two-thirds of
all
persons
with
disabilities
are
unem
ployed.
Likewise,
involvement
in
domestic
or
community
affairs
is
mini
mal,
and the
respondents
rate
themselves
as
fairly
unproductive
members
of
their
community.
The
respondents
fare
somewhat
better when
measures
of
integration
into
the mainstream of the community and society
are
considered. Al
though
only
5%
of
the
respondents reported
they
voted
in
the last
election,
more
than half of them
believed
they
engage
in
a
variety
of
activities
with
the
"right"
frequency.
One
must
be careful
in
interpreting
this
evaluation.
It
does
not
mean
they
do the
activity
frequently
(or
as
frequently
as a
per
son
not
classifiable
as
developmentally
disabled).
In
fact,
they
may
never
engage
in
a
particular activity.
It
merely
means
that
they
engage
in
a
par
ticular
activity
with
a
frequency they
believe
is
"right"
for
them.
The
aver
age
score
on
the scale
of
self-perceived integration
is
3.3,
much
lower
(and
hence more desirable) than the scores for
productivity
(4.0) and
independ
ence
(3.9).
Nevertheless,
over
one-third
of the
respondents
reported
them
selves
as
lonely,
less than
half
visit
regularly
with
friends who do
not
have
a
disability,
and almost
three-fourths
of
the
respondents
believe
that
most
of their
friends
are
developmental ly
disabled.
Generally,
the
respondents
in
this
survey
are
not
capable
of
independ
ent
living,
they
are
not
productive
members
of the
community,
and
they
are
segregated
from
its
mainstream.
This
is
very
consistent
with
Biklin's
(1988)
recent
characterization of the situation
of
disabled
persons
as exem
plifying
marginality.
Biklin
contends that
any
other
group
subjected
to
these circumstances
would
be
characterized
as a
minority
group.
How
ever,
the
tendency
has
been
to
view
persons
who
are
developmental
ly
disabled
as
(a)
victimized
by
a
disabling
condition
and
(b)
in
need
of
treat
ment.
He
believes
that
this
clinical
perspective
detracts
from
recognizing
that
persons
with
a
disability
need
rights.
This
keeps
disabled
persons
from
This content downloaded from 137.151.141.100 on Thu, 20 Nov 2014 13:39:45 PMAll use subject to JSTOR Terms and Conditions
8/9/2019 Client Satisfaction With Develpmental Disabilites Services
http://slidepdf.com/reader/full/client-satisfaction-with-develpmental-disabilites-services 13/20
132
POPULATION
AND
ENVIRONMENT
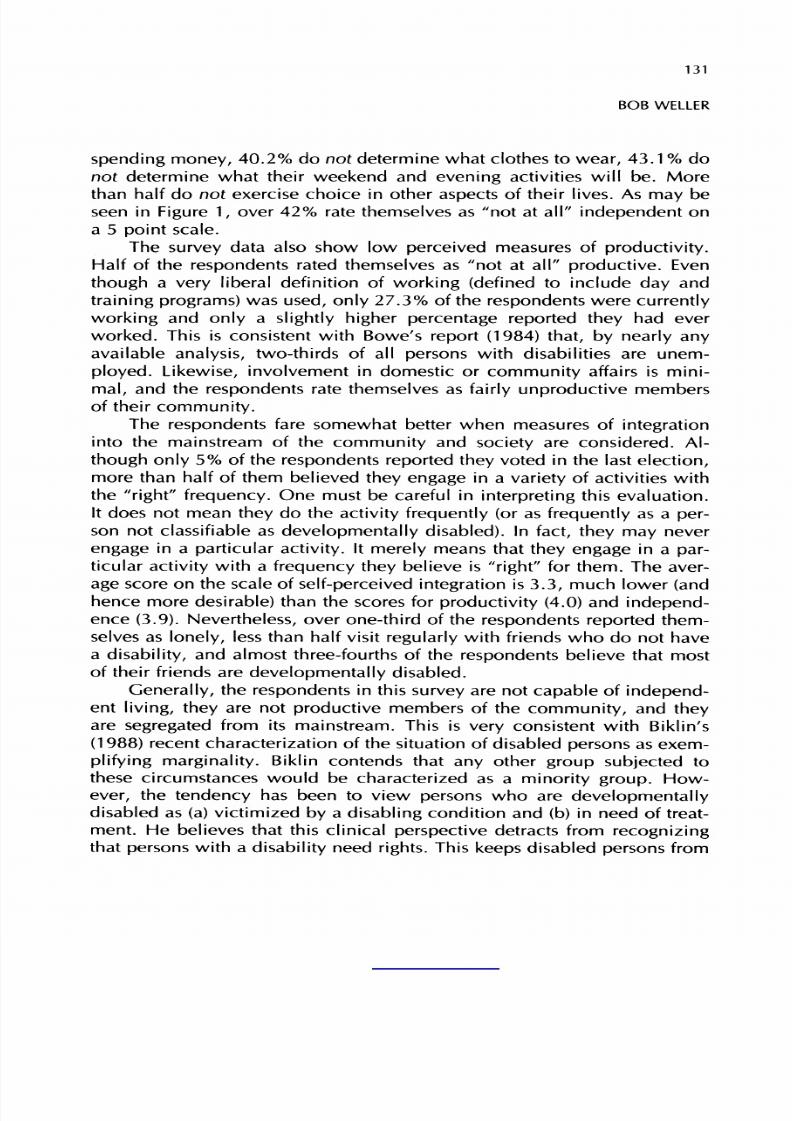
FIGURE
2.
Client
Satisfaction
with Services.
0.0%
50.0%
100.0%
PERCENT
VERY
ATISFIED
g|
SATISFIED
|
NEUTRAL
?2
DISSATISFIED
||
VERY ISSATISFIED
being
seen as
a
minority
group.
Thus,
persons
who
are
disabled
are
per
ceived
as
suffering
from
their
disabilities
rather
than
from social
ostracism
and discrimination.
SATISFACTION
WITH SERVICES
Figure
2
presents
levels
of
satisfaction
for
various
types
of
services
currently
received,
regardless
of
programmatic
source.
The
respondents
were
asked
their
level
of satisfaction
with
95
services,
which
have
been
classified
into
eight general
categories.
The
number
of
cases
upon
which
the
percentages
are
based
is
not
the
number
of
persons
receiving
services.
Rather, it is the number of
services received.
Some
persons
received
none
of the
services
in
that
particular
group;
some
received
more
than
one.
The
type
of
service
most
frequently
received
is
health
services
(1135),
followed
by
individual
support
services
(1119)
and
transportation
services
(1002).
The
least
received
service
is
vocational
(194),
followed
by
caregiver
sup
port
services
(233)
and
residential
services
(315).
One
must
be careful
not
to
equate
higher
levels
of satisfaction
with
higher
levels of
service.
Higher
levels
of
service
may
increase
satisfaction
This content downloaded from 137.151.141.100 on Thu, 20 Nov 2014 13:39:45 PMAll use subject to JSTOR Terms and Conditions
8/9/2019 Client Satisfaction With Develpmental Disabilites Services
http://slidepdf.com/reader/full/client-satisfaction-with-develpmental-disabilites-services 14/20
133
BOBWELLER
with
those
services.
Yet
satisfaction
is
also
a
function of the client's
expec
tations. When these
expectations
are
high, they
are
more
difficult
to
fulfill
and
hence
a
given
level of
service
may
be
more
likely
to
be
regarded
with
dissatisfaction.
Likewise,
it
may
be easier
to
meet
low
expectations,
and
persons
who
have low
expectations
may
be satisfied with
low
levels
of
service
received.
The
issue
of how much satisfaction should there be
also
makes the
subject
of satisfaction difficult
to
assess.
One is
faced with the
dilemma
of
choosing
between how full
or
how
empty
is
a
jar.
For
instance,
slightly more than three-fourths of the respondents report they are satisfied
with
life
in
general.
Yet
almost
one
out
of
every
four
respondents
do
not
report
they
are
satisfied
with
life
in
general.
The
same
situation exists
with
services the
respondent currently
receives.
Most
of the
reports
are
that
the
respondent
is
satisfied
with the
service.
Still,
there
is
room
for
improve
ment
because
some
clients
are
not
satisfied
with the
particular
service
they
are
receiving.
Moreover,
these
are
current
clients.
One
would
expect
cli
ents
who
are
dissatisfied with
services
to
be
less
likely
to
remain
clients
than
are
those
who
are
satisfied.
Hence
there
is
some
selectivity
involved.
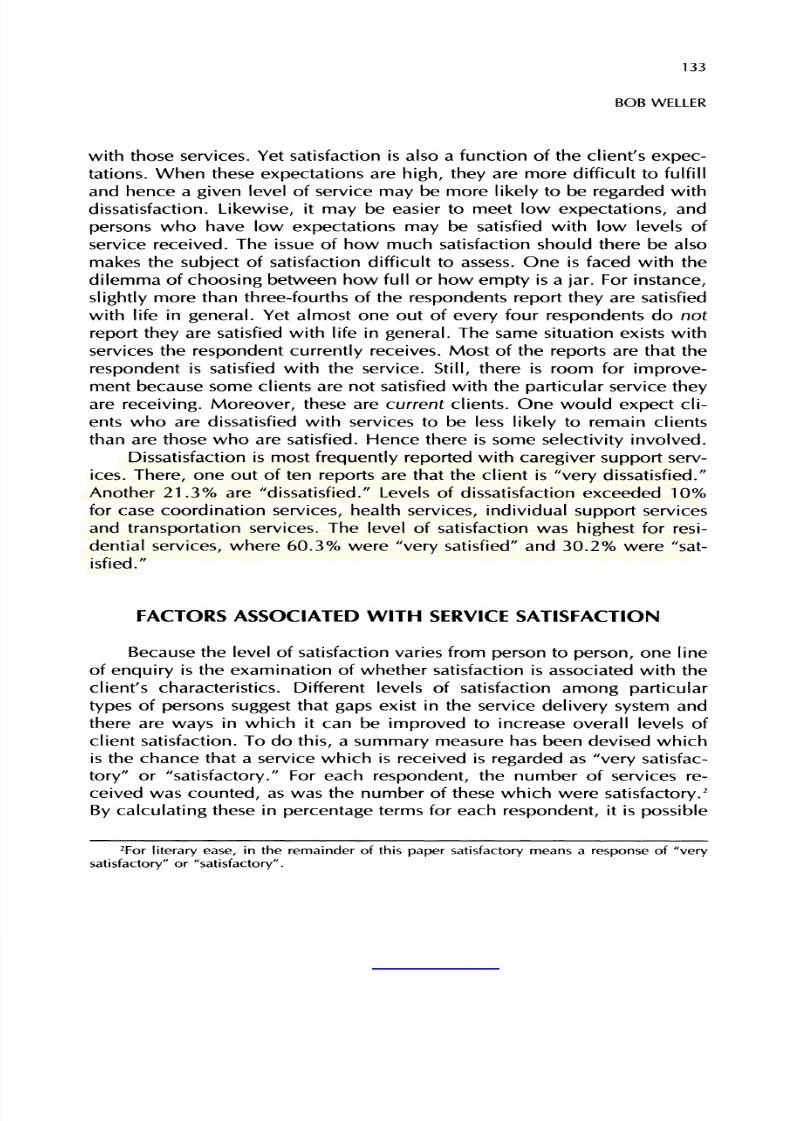
Dissatisfaction
is
most
frequently reported
with
caregiver
support
serv
ices.
There,
one
out
of
ten
reports
are
that the client
is
"very
dissatisfied."
Another
21.3%
are
"dissatisfied/' Levels
of dissatisfaction
exceeded
10%
for
case
coordination
services,
health
services,
individual
support
services
and
transportation
services.
The
level of satisfaction
was
highest
for
resi
dential
services,
where
60.3%
were
"very
satisfied"
and
30.2%
were
"sat
isfied."
FACTORS ASSOCIATED
WITH
SERVICE
SATISFACTION
Because
the level
of
satisfaction
varies
from
person
to
person,
one
line
of
enquiry
is
the
examination
of whether
satisfaction
is
associated with the
client's characteristics. Different levels
of satisfaction
among
particular
types
of
persons
suggest
that
gaps
exist in
the
service
delivery
system
and
there
are
ways
in
which
it
can
be
improved
to
increase
overall
levels
of
client
satisfaction.
To
do
this,
a
summary
measure
has
been devised which
is
the chance that
a
service
which
is
received
is
regarded
as
"very
satisfac
tory"
or
"satisfactory."
For
each
respondent,
the
number
of services
re
ceived
was
counted,
as
was
the
number
of these which
were
satisfactory.2
By
calculating
these
in
percentage
terms
for
each
respondent,
it
is
possible
2For
literary
ease,
in the remainder
of
this
paper
satisfactory
means a
response
of
"very
satisfactory"
or
"satisfactory".
This content downloaded from 137.151.141.100 on Thu, 20 Nov 2014 13:39:45 PMAll use subject to JSTOR Terms and Conditions
8/9/2019 Client Satisfaction With Develpmental Disabilites Services
http://slidepdf.com/reader/full/client-satisfaction-with-develpmental-disabilites-services 15/20
z
<
?S?
-D
.2
*?Z
>
"S
-a
o
oc
c
o
E
<
c/i
C
O
I
*
I
U
U
fi?
?
<
I
o
I
O
o?
N
o
c
</>
c
o
2
D
Z
Q
O
oc
5
O
X
Q
z
?5
O?
?
-o
c
c
>
o
5
z
i
<
5
<
00
O O
O
1^
CN
ro
O O
O
r-
O O
d
o> o
rr
CN
d
d
CN
??
N(NNN^---lflON
,
mOWKvON*?"l^K^(N
0000000000
O
00
Tf
m rn
\0 00
d
d
t? <y\ tn (N cn
rj-
M f^ K C^ _
CN
O
O O
O O O
v?>oor^mooorxTfv?>CO?? hv CN
,
O
O O
i- r-
?
00000000000
ill
II II
OINfNNvO^ONOOOivO
'?t
rOKr-0<-???^inr-r-
,
M
oooqoqt-qor-^-
|r
???oo??????
d
III
I I
y?
oooO'^-rMoor^'^-r^
fOOMINO^Cf>OKO
OOOOOCN??
COr-fN
o
- -
o o
I
I
ooooooooo
O CNO 00 IX
CN
O O
CN
O
oo
o>
m
o
*?
(NK r- M (N
r-
<-
O
O O
o
o o o o
o o
III I
r-
O O
0>
O
unm m
o o
o o
CN
vu
i?
^t
LO
O
on
CNm lo
,
O
CN
"?t
ro
m
ooooooooo
r-
IX
C0
O
cN
o
lo m
o
CN
q
d
d
d
d
C^r-Ktn'tfN^
l/l
O
't
n m
o?? olocooov.0?? ,
m m
i\
o v?>
*?
O O O O
?-
ro ro
mO?? OO
dddddddd
ddddd
I
I I
vO
0>
CN
LT)
CN0> CNvO
O
Tf
r<)
t^
O
l\
r- ro r- O sO '^,
O O O
O O O O
III
I
d d d d d d
l l l l l l
i?
m
i\ rx lo
m
O
ro
0>
CN
??
i\
?-
o o
?
o
?
d
d
d d
d d
I I I I l
l
^r
cN
r?
o>
oo
tt
oo
r-
sO
CN
IX
CT>0
^t
cN
m
t?-
i? r-
o
q
d
d d d d d
d
cN Ln
i\
o
O O
'
o o
o
o
o
t-vCN
r0L0rtO00CNv?5O
ro
CN
.Ixrj-oOrofNT?-t?
O
~
r-
(N
r-
(N
t-
? ?
oooooooo
o o o o
CNiri'tfON^rfNrN
CN'?
^f00OI\OO0>
OOCNOOOOOO
O O O O
OOOOOOOOO
mM^inincotNr-K
o<-ooocnooo
o o o o
o
I I I I
o
o o o o
LH CN
?
*-
I
o o
l\
o
o
r\
in
o
o o o
l\
O
("O
CNLO
O
c*o CN
\
ro
o o o o o o
ooooooooooo
<NfNu-)Lnroo>r-omooocr>
t?
l^mOrno^t?
LDCNOrors
OOOOOOOOOOOO
dddddddddddd
T-inocNCNr-
vno^T?
r^t?
o??
,
t?
OcNOOt^OCNOOOro^t-^
O
O
O
O O
??
rnr-OCNOCNCN
0000000000000
?
Z
>
<
?]
5
^s
'"
O
?
J
UJ
/)
o
d
o
f
_
5
?o
CD
=*
.?
'5 ?
fl
u
u
y
J2
' />
t
Il
^
LU
II
>
~
o g
5
T3
&
O
_C
l?#
<u
?
=
>
fl
S
3 ?
Q
&\
.
o
?-g
1
?
*
1 s.
'I
M
S
O
uj
'?75
.
u
111
'2
eu
'cy
?&
I
II
QJ
3^
"3
o|l3
? il
.2
<
>r
;
2
5
>
r
.
E
Z
Z
E
u
"g
d
.1
<D
?
d
"5
Il
?z
1
h"
Il
-c
>
?
|
>
O -?;""
in
>
?>
^
Q.'o
3
^
^?=
S
ro
c
"E
?.
y
^
.2
J
c?
oj
?
^2
-E
?
u
E
I
?
"
<
h
?
eu
l
ii
?r
-
y
2
o
?.
< i
5
-:
tu
,_
E
&
il
O
tri
ai
2
00
?
O
o
< E
?
a
?
?
5
I
??8
This content downloaded from 137.151.141.100 on Thu, 20 Nov 2014 13:39:45 PMAll use subject to JSTOR Terms and Conditions
8/9/2019 Client Satisfaction With Develpmental Disabilites Services
http://slidepdf.com/reader/full/client-satisfaction-with-develpmental-disabilites-services 16/20
135
BOB
WELLER
to
talk about
the chance that
a
person
who
receives
a
service is
satisfied
with
it.
This
is
a
total
measure
across
all
types
of service. Persons who
receive
many
services
are
considered
as
equal
to
those
who
receive
only
a
few.
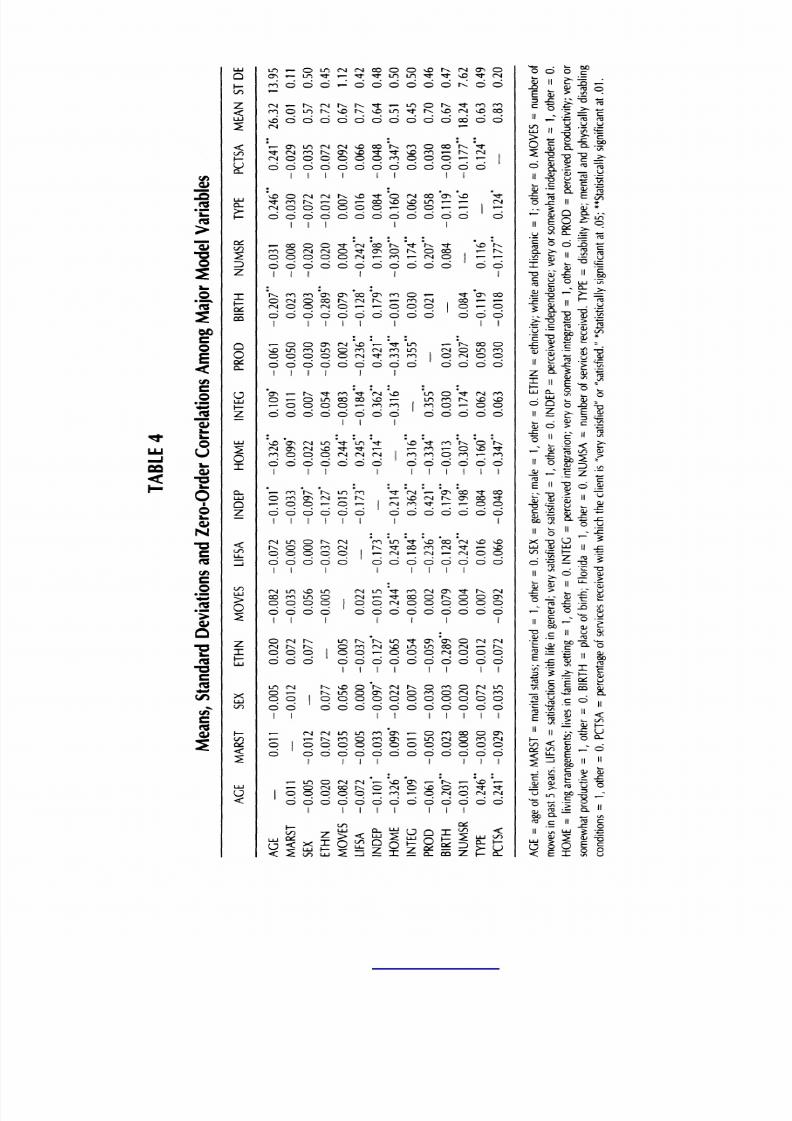
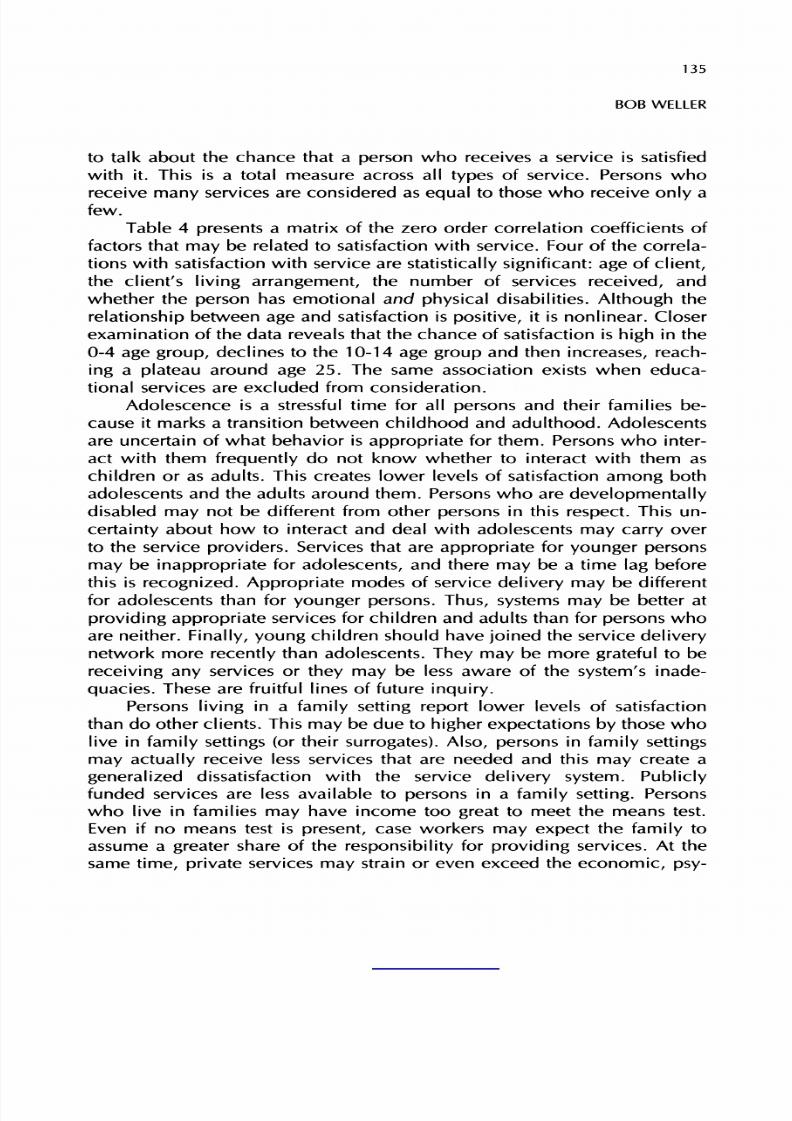
Table
4
presents
a
matrix
of the
zero
order correlation coefficients of
factors that
may
be related
to
satisfaction with service. Four of
the correla
tions with
satisfaction
with
service
are
statistically significant:
age
of
client,
the client's
living
arrangement,
the number of services
received,
and
whether the person has emotional and
physical
disabilities.
Although
the
relationship
between
age
and
satisfaction
is
positive,
it is
nonlinear.
Closer
examination of the data reveals
that
the
chance of satisfaction
is
high
in
the
0-4
age group,
declines
to
the
10-14
age
group
and
then
increases,
reach
ing
a
plateau
around
age
25.
The
same
association
exists
when
educa
tional
services
are
excluded
from
consideration.
Adolescence
is
a
stressful
time for
all
persons
and
their families
be
cause
it
marks
a
transition
between
childhood and adulthood. Adolescents
are
uncertain
of what
behavior
is
appropriate
for them.
Persons
who
inter
act
with them
frequently
do
not
know whether
to
interact
with
them
as
children
or
as
adults.
This
creates
lower
levels
of
satisfaction
among
both
adolescents
and
the adults
around
them. Persons
who
are
developmentally
disabled
may
not
be different from other
persons
in
this
respect.
This
un
certainty
about
how
to
interact
and deal with
adolescents
may carry
over
to
the
service
providers.
Services
that
are
appropriate
for
younger
persons
may
be
inappropriate
for
adolescents,
and
there
may
be
a
time
lag
before
this
is
recognized.
Appropriate
modes of
service
delivery
may
be different
for adolescents than for younger persons. Thus, systems may be better at
providing
appropriate
services for
children
and
adults than for
persons
who
are
neither.
Finally,
young
children should have
joined
the
service
delivery
network
more
recently
than
adolescents.
They
may
be
more
grateful
to
be
receiving
any
services
or
they
may
be
less
aware
of the
system's
inade
quacies.
These
are
fruitful
lines
of future
inquiry.
Persons
living
in
a
family
setting
report
lower levels of satisfaction
than do
other
clients.
This
may
be due
to
higher
expectations
by
those
who
live
in
family settings
(or
their
surrogates). Also,
persons
in
family settings
may
actually
receive less services
that
are
needed and this
may
create
a
generalized
dissatisfaction
with
the
service
delivery
system.
Publicly
funded
services
are
less available
to
persons
in
a
family
setting.
Persons
who
live
in
families
may
have income
too
great
to meet
the
means
test.
Even if
no means
test
is
present,
case
workers
may
expect
the
family
to
assume
a
greater
share of
the
responsibility
for
providing
services. At
the
same
time,
private
services
may
strain
or
even
exceed the
economic,
psy
This content downloaded from 137.151.141.100 on Thu, 20 Nov 2014 13:39:45 PMAll use subject to JSTOR Terms and Conditions
8/9/2019 Client Satisfaction With Develpmental Disabilites Services
http://slidepdf.com/reader/full/client-satisfaction-with-develpmental-disabilites-services 17/20
136
POPULATION
AND
ENVIRONMENT
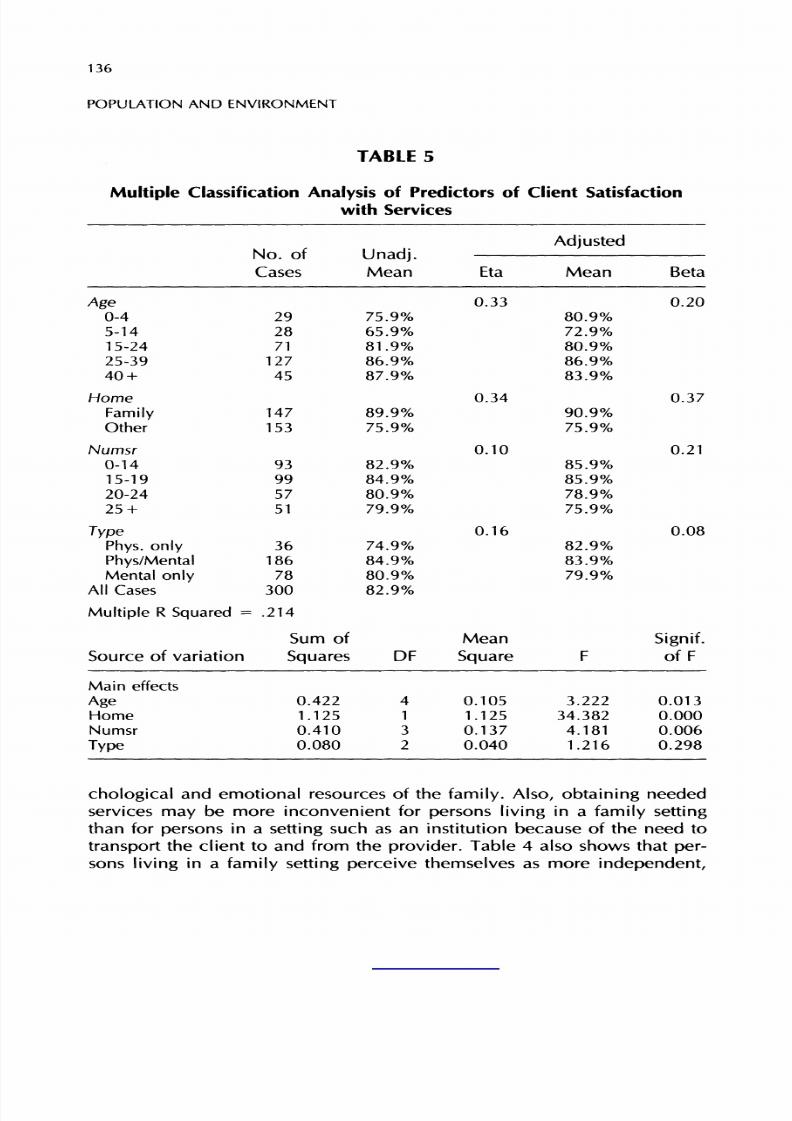
TABLE
5
Multiple
Classification
Analysis
of
Predictors
of
Client Satisfaction
with
Services
No.
of
Cases
Unadj.
Mean
Eta
Adjusted
Mean
Beta
Age
0-4
5-14
15-24
25-39
40
+
Home
Family
Other
Numsr
0-14
15-19
20-24
25
+
Type
Phys.
only
Phys/Mental
Mental
only
All
Cases
0.33 0.20
29
28
71
127
45
147
153
93
99
57
51
36
186
78
300
Multiple
R
Squared
=
.214
Source of variation
Sum of
Squares
75.9%
65.9%
81.9%
86.9%
87.9%
89.9%
75.9%
82.9%
84.9%
80.9%
79.9%
74.9%
84.9%
80.9%
82.9%
DF
0.34
0.10
0.16
Mean
Square
80.9%
72.9%
80.9%
86.9%
83.9%
90.9%
75.9%
85.9%
85.9%
78.9%
75.9%
82.9%
83.9%
79.9%
0.37
0.21
0.08
Signif.
of
F
Main
effects
Age
Home
Numsr
Type
0.422
1.125
0.410
0.080
0.105
1.125
0.137
0.040
3.222
34.382
4.181
1.216
0.013
0.000
0.006
0.298
chological
and emotional
resources
of
the
family.
Also,
obtaining
needed
services
may
be
more
inconvenient
for
persons
living
in
a
family
setting
than
for
persons
in
a
setting
such
as
an
institution
because of the
need
to
transport
the
client
to
and
from the
provider.
Table
4
also shows that
per
sons
living
in
a
family
setting perceive
themselves
as more
independent,
This content downloaded from 137.151.141.100 on Thu, 20 Nov 2014 13:39:45 PMAll use subject to JSTOR Terms and Conditions
8/9/2019 Client Satisfaction With Develpmental Disabilites Services
http://slidepdf.com/reader/full/client-satisfaction-with-develpmental-disabilites-services 18/20
137
BOB
WELLER
more
integrated
into
the
community
and
more
productive
than do
persons
who live
in
other
settings.
There
is
an
inverse
relationship
between
number of services
received
and
the
percent
of
services
received
satisfactorily.
Thus
persons
who
re
ceive
many
services
are
less
likely
to
be satisfied with the
services
they
receive
than
are
those who receive
only
a
few. This
may
be
due
to
many
factors.
Need
may
be
greater.
Alternatively,
it
may
be
easier to
overlook
shortcomings
in
one
service than
shortcomings
in
5
services.
Finally,
disability
type
seems to be related to likelihood of satisfaction.
Persons
who
have
at
least
one
physically
disabling
condition and
at
least
one
mental/emotionally
disabling
condition
are more
likely
than
other cli
ents to
report
satisfaction with services
received.
When
these variables
are
subjected
to
multivariate
analysis using
Mul
tiple
Classification
Analysis
(MCA),
a
form of
multiple
regression
suitable
for
categorical
variables,
they
explain
21%
of the variance
in
client satis
faction.
After controls
are
introduced
for
the other
three
variables,
living
arrangement
is
the
most
important predictor
of
satisfaction. Number
of
services
received
and
age
also
remain
important
predictors.
The
relation
ship
between
disability
type
and
service
satisfaction is
not
statistically sig
nificant.
Treating
age
and
number of services
received
as
continuous
vari
ables
produced
the
same
results:
age,
living
arrangement
and
number
of
services
received
are
statistically significant
predictors
of
satisfaction with
services
received.
CONCLUSIONS
Most
of
respondents
have
multiple
conditions. Almost half
report
both
a
physical
and
an
emotional/mental
condition.
This
means
that services
need
to
be
tailored
to
individual needs
rather than
to
program
slots
to
account
for
the
multiplicative
nature
of
multiple
conditions.
Levels
of
independence,
productivity
and
integration
into
the
main
stream
of
society
are
very
low for this
group.
Thus
clients
may
need
con
siderable
support
in
daily living
and
in
supporting
themselves.
Clients
are
only marginally
active
economically.
Some
barriers
to
greater
productivity
are
societal
and need
to
be removed.
Where barriers
to
greater
produc
tivity
are
not
societal
in nature
and
cannot
be
removed,
we
may
need
to
design
some
creative
ways
that
feelings
of
productivity
can
be
enhanced.
The
clients
are
in
effect
socially
segregated
from
society.
Greater inte
gration
can
be
produced
through
education
of
the
public,
increased
ac
cess,
supportive
services,
and
the
discouragement
of
discrimination. The
This content downloaded from 137.151.141.100 on Thu, 20 Nov 2014 13:39:45 PMAll use subject to JSTOR Terms and Conditions
8/9/2019 Client Satisfaction With Develpmental Disabilites Services
http://slidepdf.com/reader/full/client-satisfaction-with-develpmental-disabilites-services 19/20
138
POPULATION
AND
ENVIRONMENT
recently
enacted
Americans
with Disabilities
Act is
a
promising
start
in
this
direction.
The
reasons
most
frequently
given
for
dissatisfaction with
services
cur
rently
received
are
inappropriateness
and
insufficiency
of
amount.
This
suggests
that
the
amount
of
services
needs
to
be
increased and
services
need
to
be tailored
to
meet
the
needs of the individual.
The
area
associated
with the
lowest levels of satisfaction
is
caregiver
support
services.
Florida
may
do
a
better
job
of
meeting
the
needs of the
individual client than those of his/her support system who provide care.
This
is
an area
in
which the
amount
and
appropriateness
of services
ex
tended needs
to
be increased.
A
number
of
fruitful
areas
for additional
inquiry
are
suggested
by
the
findings.
Adolescents
are
less
likely
than other
persons
to
be
satisfied with
the
services
which
are
received. This
may
be due
to
the
stress
associated
with
adolescence itself.
It
may
also be the
case
that the
service
delivery
system
does better
at
delivering
appropriate
services in
an
appropriate
fash
ion
to
children and
to
adults
than
it
does
to
persons
undergoing
the
change
from childhood
to
adulthood. Adolescence
is
a
period
when
self-identity
as
an
adult
emerges.
The
adolescent
may
feel
frustrated that the service
system
does
not
produce
a
self-identity
that
is
perfect.
The
greater
the number of services
a
client receives
the
greater
the
level
of dissatisfaction with services.
A
high
number of services
received
may
be
indicative
of the existence
of
a
situation
for which
simple
and
adequate
solutions
are
extremely
difficult
to
attain.
Need
may
be
greater.
Alternatively,
it
may
be
easier
to
overlook
shortcomings
in
one
service
than to overlook shortcomings in several services. Moreover, receipt of
services
may
raise
expectations
which,
if
unmet,
increase
levels of
dissat
isfaction.
Thus,
there
may
be
a
cumulative effect which is
transformed
into
an
expression
of
dissatisfaction.,
Finally,
persons
who live
in
a
family setting
are
less
likely
to
be satis
fied
with the services
they
receive
than
are
other
persons.
This
may
be
due
to
higher
levels of
expectations,
lower levels of
public funding
for
services,
or
the inconvenience of
obtaining
the
appropriate
services.
REFERENCES
Biklin,
D.
(1988).
The
Myth
of
clinical
judgement.
Journal
of
Social
Issues, 44,
127-140.
Bowe,
F.
(1984).
Demography
and
disability:
A
chartbook for
rehabilitation.
Fayetteville,
AR:
Arkansas Rehabilitation
Research and
Training
Center.
This content downloaded from 137.151.141.100 on Thu, 20 Nov 2014 13:39:45 PMAll use subject to JSTOR Terms and Conditions
8/9/2019 Client Satisfaction With Develpmental Disabilites Services
http://slidepdf.com/reader/full/client-satisfaction-with-develpmental-disabilites-services 20/20
139
BOB
WELLER
Center
for
the
Study
of
Population.
(1987).
A
demographic study
of
persons
with
develop
mental disabilities
in
Florida,
Part
I,
Demand
analysis.
Tallahassee,
FL: Center
for the
Study
of
Population,
Florida
State
University.
Jacobson,
J.W.,
&
Janicki,
M.P.
(1983).
Observed
prevalence
of
multiple
developmental
dis
abilities.
Mental
Retardation, 21,
87-94.
LaPlante,
M.
(1988).
Data
on
disability
from
the National
Health
Interview
Survey,
1983-1985.
Washington,
D.C:
National
Institute
on
Disability
and
Rehabilitation
Re
search.
National
Association
of
Developmental
Disabilities Councils
(NADDC). (1990).
Forging
a
new
ERA:
The 1990
reports
on
people
with
developmental
disabilities.
Washington,
D.C:
National
Association of
Developmental
Disabilities
Councils.
Smith,
S.K.,
Ahmed,
B. &
Sincich,
F.
(1988).
Population
estimates and
projections
by
age,
sex
and
race
for Florida and
its
counties,
1987-2000.
Population
Studies,
Bulletin
No.
85-86.
Gainesville,
FL:
Bureau
of
Economic
and
Business
Research,
University
of
Flor
ida.
Tawney,
J.W.
&
Demchak,
M.S.
(1984).
Severely
retarded?
severely
handicapped?
multiply
handicapped?
A
definitional
analysis. Topics
in
Early
Childhood
Special
Education,
4,
1-18.
U.S.
Department
of
Education
(1985).
Seventy
annual
report
to
Congress
on
the
implementa
tion
of Public
Law
94-142:
The
education
for all
handicapped
children
act.
Washington,
D.C: U.S.
Department
of Education.
Verbrugge,
L.M.
(1982).
Sex
differentials
in
health. Public
Health
Reports,
97,
416-437.
Weller, R.H., Sly, D.F., Serow, W.J. & Micklin, M.M. (1989). A demographic study of per
sons
with
developmental
disabilities
in
Florida.
Tallahassee,
FL:
Center
for the
Study
of
Population,
Florida
State
University.