CLEAR SPEECH MODIFICATIONS IN CHILDREN AGED...
67
Clear Speech Modifications in Children Aged 6-10 Item Type text; Electronic Thesis Authors Taylor, Griffin Lijding Publisher The University of Arizona. Rights Copyright © is held by the author. Digital access to this material is made possible by the University Libraries, University of Arizona. Further transmission, reproduction or presentation (such as public display or performance) of protected items is prohibited except with permission of the author. Download date 14/07/2018 10:21:43 Link to Item http://hdl.handle.net/10150/625270
Transcript of CLEAR SPEECH MODIFICATIONS IN CHILDREN AGED...

Clear Speech Modifications in Children Aged 6-10
Item Type text; Electronic Thesis
Authors Taylor, Griffin Lijding
Publisher The University of Arizona.
Rights Copyright © is held by the author. Digital access to this materialis made possible by the University Libraries, University of Arizona.Further transmission, reproduction or presentation (such aspublic display or performance) of protected items is prohibitedexcept with permission of the author.
Download date 14/07/2018 10:21:43
Link to Item http://hdl.handle.net/10150/625270
CLEAR SPEECH MODIFICATIONS IN CHILDREN AGED 6-10
by
Griffin Lijding Taylor
____________________________ Copyright © Griffin L. Taylor 2017
A Thesis Submitted to the Faculty of the
DEPARTMENT OF SPEECH, LANGUAGE, AND HEARING SCIENCES
In Partial Fulfillment of the Requirements
For the Degree of
MASTER OF SCIENCE
In the Graduate College
THE UNIVERSITY OF ARIZONA
2017
2
STATEMENT BY AUTHOR
The thesis titled Clear Speech Modifications in Children Aged 6-10 prepared by Griffin Lijding Taylor has been submitted in partial fulfillment of requirements for a master’s degree at the University of Arizona and is deposited in the University Library to be made available to borrowers under rules of the Library.
Brief quotations from this thesis are allowable without special permission, provided
that an accurate acknowledgement of the source is made. Requests for permission for extended quotation from or reproduction of this manuscript in whole or in part may be granted by the head of the major department or the Dean of the Graduate College when in his or her judgment the proposed use of the material is in the interests of scholarship. In all other instances, however, permission must be obtained from the author.
SIGNED:
_____________________________________________ Griffin Lijding Taylor
APPROVAL BY THESIS DIRECTOR
This thesis has been approved on the date shown below:
04.17.2017 Kate Bunton Associate Professor in Speech, Language, and Hearing Sciences

3
ACKNOWLEDGMENT It takes a village to complete a master’s thesis, and here I acknowledge the village that helped transform this from an email into a research study. To my thesis committee: Dr. Bunton, you always make problems disappear in seconds, and turn everything to gold along the way. Dr. Story, your coding sorcery added an entirely new dimension to this study that otherwise would not have been possible. Dr. Plante, your input yielded plenty of output. It was an honor to be part of your intellectual community. Your combined wisdom made me better. To the children who lent us their minds and voices: you are what helps us make good on our promise to better understand communication and its disorders. To Drs. Truman Coggins and Alicia Beckford-Wassink: I would neither be a speech-language pathologist nor a researcher without you both. To my parents, who gave me the perspective that language is real, magical, and powerful. To Rachel, my sine qua non who has supported me always. Thank you.
4
Table of Contents Abstract 5 Introduction 6 Method 13 Results 21 Discussion 30 References 42 Appendix A 47 Appendix B 57

5
»Abstract
Modifications to speech production made by adult talkers in response to instructions to
speak clearly have been well documented in the literature. Targeting adult populations has been
motivated by efforts to improve speech production for the benefit of the communication partners,
however, many adults also have communication partners who are children. Surprisingly, there is
limited literature on whether children can change their speech production when cued to speak
clearly. Pettinato, Tuomainen, Granlund, and Hazan (2016) showed that by age 12, children
exhibited enlarged vowel space areas (VSA) and reduced articulation rate when prompted to
speak clearly, but did not produce any other adult-like clear speech modifications in connected
speech. Moreover, Syrett and Kawahara (2013) suggested that preschoolers produced longer and
more intense vowels when prompted to speak clearly at the word level. These findings contrasted
with adult speakers who show significant temporal and spectral differences between speech
produced in habitual and clear speech conditions. Therefore, it was the purpose of this study to
analyze changes in temporal and spectral characteristics of speech production that children aged
6-10 made in these experimental conditions. It is important to elucidate the clear speech profile
of this population to better understand which adult-like clear speech modifications they make
spontaneously and which modifications are still developing. Understanding these baselines will
help advance future studies that measure the impact of more explicit instructions and children’s
abilities to better accommodate their interlocutors, which is a critical component of children’s
pragmatic and speech-motor development.
6
»Introduction
I. Clear Speech
Despite its monolithic label, clear speech refers to a broad category of strategies, behaviors,
and modifications that speakers make in response to stimuli. Changes include modulations to the
frequency, intensity, rate, and vowel space during speech. One stimulus that may elicit these
modifications is the request to speak clearly in therapeutic contexts. “Speak clearly” is something
that speech-language pathologists and audiologists frequently ask of their clients from several
clinical populations. Clear speech modifications are also made in response to the demands of
different communicative contexts. These include demands due to the presence of background
noise, different interlocutors, and the need to resolve communication breakdowns (Cooke, King,
Garnier, & Aubanel, 2014). Regardless of the impetus for producing these adjustments, they are
typically done with the intent to improve the fidelity of the speech signal and provide some form
of benefit for a listener or communication partner (Lindblom, 1990; Uchanski, Geers, &
Protopapas, 2002). Speakers may shift into and out of clear speech registers as they see fit in
conversation, in connected speech, and at the word level. For these reasons, clear speech
modifications instantiate acoustic realizations of a speaker’s pragmatic and sociolinguistic
competence.
Clear speech instructions have been widely used in therapeutic contexts, and their effects
have been vigorously studied. In these contexts, clear speech has been shown to be an important
factor for improving the clarity of speech production for individuals with dysarthria as well as
improving intelligibility for hearing impaired and unimpaired communication partners. Park,
Theodoros, Finch, & Cardell (2015) showed that unfamiliar listeners received significant
intelligibility benefit from individuals with dysarthria who had completed clear speech training

7
in therapy. This result expands on effects of improved intelligibility for individuals with
dysarthria as shown in Beukelman, Fager, Ullman, & Logemann (2002). Similarly, clear speech
instructions have played an important role in aural (re)habilitation (Schum, 1996). Caissie et al.
(2005) found that both vague and specific clear speech instructions for communication partners
or individuals with hearing impairments yielded positive intelligibility benefits for both hearing
impaired and unimpaired listeners. The net effect of improved speech production and
intelligibility is the increased potential for individuals with communication impairments to
participate in social situations, increased ease of communication with communication partners,
and reduced likelihood of social withdrawal that is commonly observed in these populations
(Dykstra, Hakel, & Adams, 2007).
Another pertinent domain of clear speech research is devoted to explaining modifications
in specific contexts. Cooke et al. (2014) emphasized changes made in response to different
interlocutors and those in response to perturbations in the environment. Salient changes in speech
production have been reported in the literature for adult talkers with real or imagined
interlocutors include infant-directed speech (IDS; Kuhl et al., 1997), speech directed at
individuals with learning disabilities (Bradlow, Kraus, & Hayes, 2003), and speech directed at
individuals with hearing impairments (HIDS; Picheny, Durlach, & Braida, 1985; Uchanski et al.,
1996). The second focus of this domain of clear speech research has been to measure speech
production changes in response to the environment, particularly the presence of background
noise (Hazan & Baker, 2012; Lam and Tjaden, 2013; Baxter, 2016). The tendency to produce
speech at higher intensities in noise is referred to as ‘Lombard speech’ (Lombard, 1911). Similar
to the purposes and benefits of clear speech in therapeutic contexts, speakers’ modifications in
response to interlocutors and environmental stimuli suggest an effort to increase listeners’
8
comprehension, provide more robust linguistic information, decrease the requisite cognitive
effort for listeners, and facilitate auditory feedback and feedforward control for the speaker
(Cooke et al., 2014; Perkell, 2012).
To summarize, clear speech encompasses a constellation of methods that speakers
employ to tailor their speech production to a particular communicative context. These
modifications are produced consciously and subconsciously and are typically made with the
intent to improve the ease communication for both speakers and listeners (Krause & Braida,
2004). Research has sought to explain the nature and type of clear speech modifications because
it is an important pragmatic behavior and because findings have helped improve communication
and social participation for individuals with communication impairments.
II. Clear Speech Modifications in Adult Populations
To date, the vast majority of clear speech research has focused on quantifying acoustic
changes in adults’ speech production. This body of research has elucidated a comprehensive
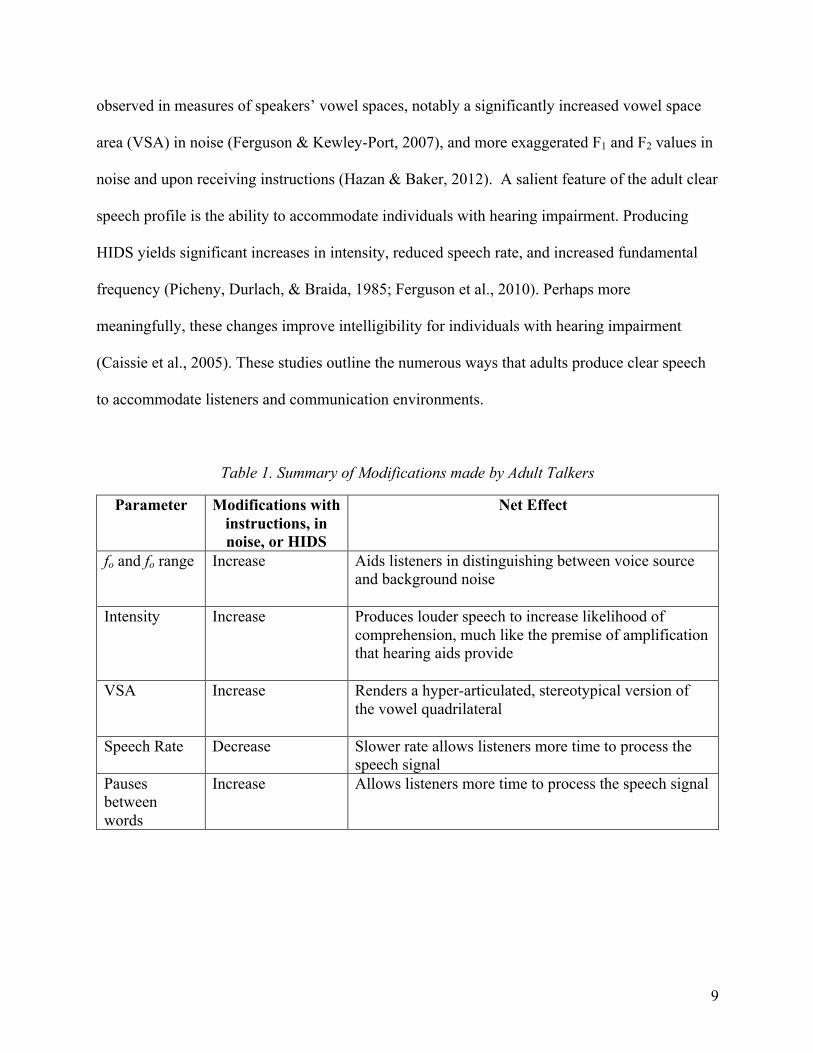
profile of methods adults use to produce clear speech that is both diverse and complex. Table 1
summarizes the adult clear speech profile. Among the most consistent findings is the tendency
for adults to increase intensity (i.e., speak louder), increase fundamental frequency (fo; i.e., speak
at a higher pitch), increase the range of fundamental frequency (fo range; i.e., use a wider range
of pitches), decrease the rate of speech (i.e., speak slowly), and increase the frequency and
duration of pauses (Cooke et al., 2014; Krause & Braida, 2004; Smiljanic & Bradlow, 2005).
Adults exhibited these changes upon receiving instructions to speak clearly, to produce HIDS,
and/or in the presence of noise. The changes observed in noise have been found to serve the dual
purpose of improving the auditory signal to maintain auditory feedback for the speaker and
improve comprehensibility for interlocutors (Mahl, 1972). Several changes have also been
9
observed in measures of speakers’ vowel spaces, notably a significantly increased vowel space
area (VSA) in noise (Ferguson & Kewley-Port, 2007), and more exaggerated F1 and F2 values in
noise and upon receiving instructions (Hazan & Baker, 2012). A salient feature of the adult clear
speech profile is the ability to accommodate individuals with hearing impairment. Producing
HIDS yields significant increases in intensity, reduced speech rate, and increased fundamental
frequency (Picheny, Durlach, & Braida, 1985; Ferguson et al., 2010). Perhaps more
meaningfully, these changes improve intelligibility for individuals with hearing impairment
(Caissie et al., 2005). These studies outline the numerous ways that adults produce clear speech
to accommodate listeners and communication environments.
Table 1. Summary of Modifications made by Adult Talkers
Parameter Modifications with instructions, in noise, or HIDS
Net Effect
fo and fo range
Increase Aids listeners in distinguishing between voice source and background noise
Intensity
Increase Produces louder speech to increase likelihood of comprehension, much like the premise of amplification that hearing aids provide
VSA Increase Renders a hyper-articulated, stereotypical version of the vowel quadrilateral
Speech Rate Decrease Slower rate allows listeners more time to process the speech signal
Pauses between words
Increase Allows listeners more time to process the speech signal

10
III. Clear Speech Modifications in Pediatric Populations
Relative to the considerable amount of knowledge about the adult clear speech profile,
the acoustic modifications that children make strangely remain only tentatively understood. Two
studies by Redford and Gilversleeve-Neuman (2007; 2009) measured changes that children aged
3-5 made speech across habitual (i.e., no instructions) and clear speech conditions at the word
level. They observed that children aged 4 exhibited an increased rate and decreased fo in the clear
speech condition, but no expansion of either fo range or VSA. In addition to those characteristics,
children aged 5 tended to increase F1 in vowels produced in clear speech conditions. Under
different circumstances, data from Syrett and Kawahara (2013) showed that vowels of preschool-
aged children had longer durations and were produced more loudly in words produced in a clear
speech condition. The preschool children in their sample also exhibited larger fo ranges and
variable VSAs in a clear speech condition. Pettinato, Tuomainen, Granlund, and Hazan (2016)
offered a more expanded analysis of clear speech development by examining the connected
speech of children aged 9-14. Their results showed that children aged 12-14 had significantly
larger VSA and reduced rate when instructed to produce clear speech while a vocoder distorted
their speech, but that children aged 9-11 showed no changes in VSA between habitual and
vocoder-distorted clear speech conditions. These patterns were observed whether the tasks were
completed face-to-face or without seeing their interlocutor. Furthermore, the 12-14 cohort
displayed a significant correlation between reduction in speech rate and increased VSA in the
vocoder condition; the 9-11 cohort did not yet exhibit this correlation. They concluded that
children had not yet approached fully adult-like VSA values by age 14.
11
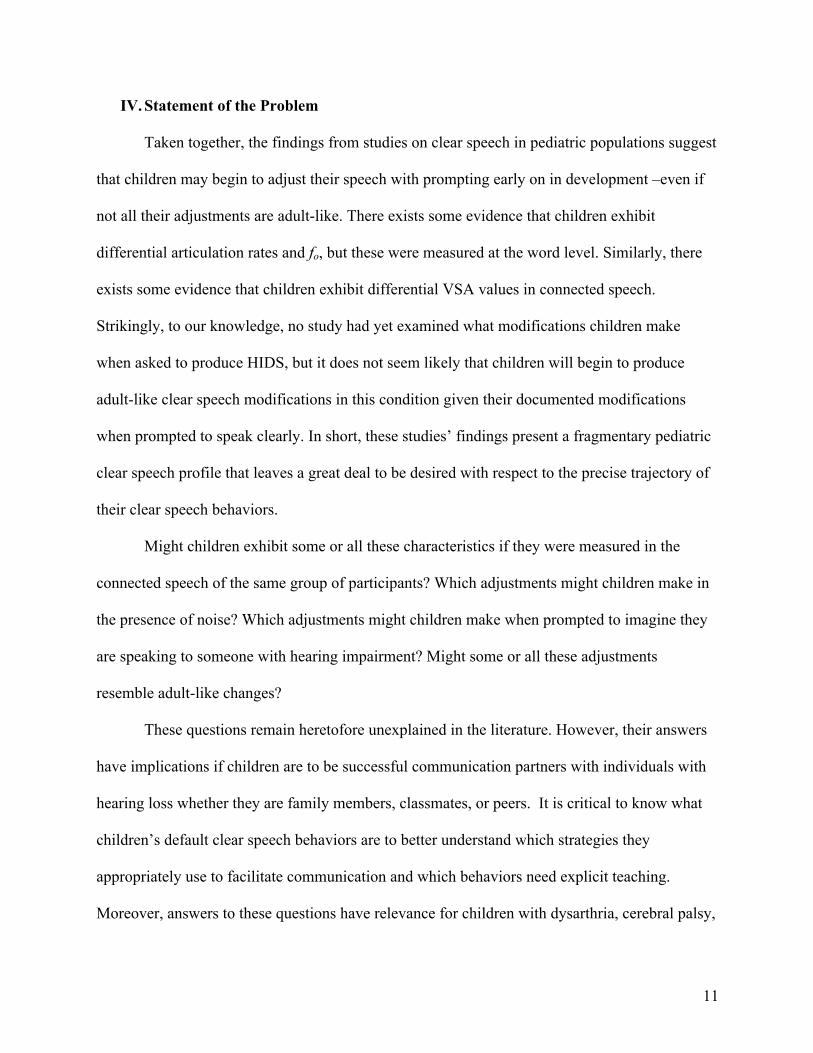
IV. Statement of the Problem
Taken together, the findings from studies on clear speech in pediatric populations suggest
that children may begin to adjust their speech with prompting early on in development –even if
not all their adjustments are adult-like. There exists some evidence that children exhibit
differential articulation rates and fo, but these were measured at the word level. Similarly, there
exists some evidence that children exhibit differential VSA values in connected speech.
Strikingly, to our knowledge, no study had yet examined what modifications children make
when asked to produce HIDS, but it does not seem likely that children will begin to produce
adult-like clear speech modifications in this condition given their documented modifications
when prompted to speak clearly. In short, these studies’ findings present a fragmentary pediatric
clear speech profile that leaves a great deal to be desired with respect to the precise trajectory of
their clear speech behaviors.
Might children exhibit some or all these characteristics if they were measured in the
connected speech of the same group of participants? Which adjustments might children make in
the presence of noise? Which adjustments might children make when prompted to imagine they
are speaking to someone with hearing impairment? Might some or all these adjustments
resemble adult-like changes?
These questions remain heretofore unexplained in the literature. However, their answers
have implications if children are to be successful communication partners with individuals with
hearing loss whether they are family members, classmates, or peers. It is critical to know what
children’s default clear speech behaviors are to better understand which strategies they
appropriately use to facilitate communication and which behaviors need explicit teaching.
Moreover, answers to these questions have relevance for children with dysarthria, cerebral palsy,

12
stuttering, and other motor speech disorders who may be prompted to speak clearly in
therapeutic contexts. Knowing prior to initiating therapy with these clinical populations that even
their typically developing peers do not (or do) produce adult-like clear speech modifications can
expedite the development of appropriate treatment goals by helping clinicians decipher between
typical and aberrant speech production techniques.
Research Aims and Hypotheses The present study had the following research aims:
1) To elucidate the modifications children make to speech production during connected
speech when prompted to speak clearly so that someone with hearing loss could
understand them compared to typical speech production (control);
2) To elucidate the modifications children make to speech production in connected speech,
compared to typical speech production, when prompted to speak clearly in the presence
of competing background noise in the form of multitalker babble;
3) To reconcile the acoustic modifications that children make to their speech with what is
known about those which adult talkers make to their speech.
Based on the aforementioned objectives, the following hypotheses were proposed:
1) In general, being prompted to speak as though talking to someone with a hearing
impairment would elicit few significant modifications to children’s connected speech
compared to the control condition;
2) That being prompted to speak clearly in the presence of noise would elicit significant
modifications to children’s connected speech compared to the control condition;
13
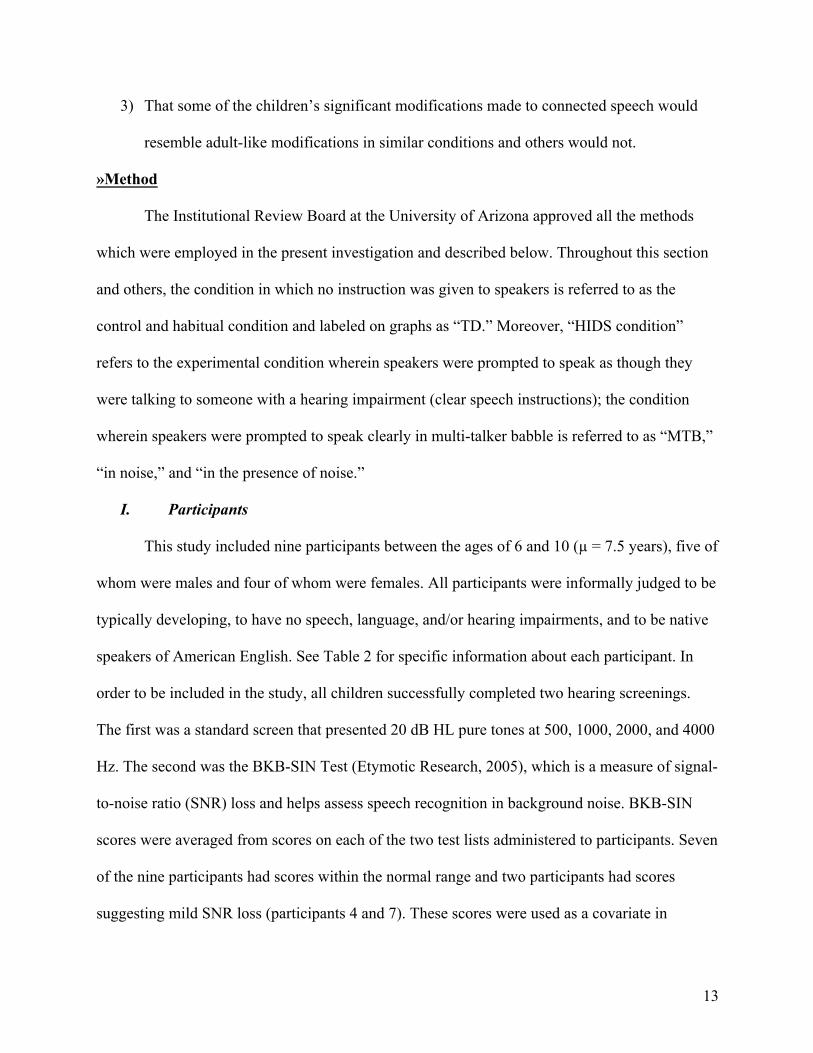
3) That some of the children’s significant modifications made to connected speech would
resemble adult-like modifications in similar conditions and others would not.
»Method
The Institutional Review Board at the University of Arizona approved all the methods
which were employed in the present investigation and described below. Throughout this section
and others, the condition in which no instruction was given to speakers is referred to as the
control and habitual condition and labeled on graphs as “TD.” Moreover, “HIDS condition”
refers to the experimental condition wherein speakers were prompted to speak as though they
were talking to someone with a hearing impairment (clear speech instructions); the condition
wherein speakers were prompted to speak clearly in multi-talker babble is referred to as “MTB,”
“in noise,” and “in the presence of noise.”
I. Participants
This study included nine participants between the ages of 6 and 10 (µ = 7.5 years), five of
whom were males and four of whom were females. All participants were informally judged to be
typically developing, to have no speech, language, and/or hearing impairments, and to be native
speakers of American English. See Table 2 for specific information about each participant. In
order to be included in the study, all children successfully completed two hearing screenings.
The first was a standard screen that presented 20 dB HL pure tones at 500, 1000, 2000, and 4000
Hz. The second was the BKB-SIN Test (Etymotic Research, 2005), which is a measure of signal-
to-noise ratio (SNR) loss and helps assess speech recognition in background noise. BKB-SIN
scores were averaged from scores on each of the two test lists administered to participants. Seven
of the nine participants had scores within the normal range and two participants had scores
suggesting mild SNR loss (participants 4 and 7). These scores were used as a covariate in

14
statistical analysis. Participants are listed in the order that they participated in the study, and are
listed in this order on all charts and graphs.
Table 2: Sex, Age, and BKB-SIN scores for individual participants
Participant Sex Age (years) BKB-SIN Score 1 Male 6 2.5 2 Male 7 0 3 Male 9 0.5 4 Male 7 4.5 5 Male 8 3 6 Female 8 3.5 7 Female 6 5.5 8 Female 10 -1 9 Female 7 3.5 µ = 7.5
II. Experimental Procedures
Each participant engaged in three speech tasks in three conditions for a total of nine
unique speech tasks. The three speech tasks included a low-structured conversation, a diapix
task, and a decision-making task. The three conditions included a control condition, clear speech
condition (HIDS), and a multi-talker babble condition (MTB). The babble used was a six-talker
babble based on three adult talkers and three child talkers. Participants were recorded in a sound
treated room using an AKG CS420 head microphone (4 cm mouth to microphone distance) and a
digital recording system (ZOOM, H5 HandyRecorder). A calibration tone was recorded at the
onset of each session. An experimenter was in the room during the recording of all nine
participants’ samples to deliver prompts and ensure that all experimental procedures were being
carried out correctly. Sessions lasted between 40 and 60 minutes.
Organization
All nine participants completed the three speech tasks in the control condition first in the
same order (i.e., conversation, diapix, and decision-making). However, the second and third
15
conditions were counterbalanced so that some participants completed the MTB condition second
and others completed the HIDS condition second (with the remaining condition completed last).
The conversation task was completed first in each condition; however, the other tasks were
counterbalanced. Some participants completed the diapix task second and others completed the
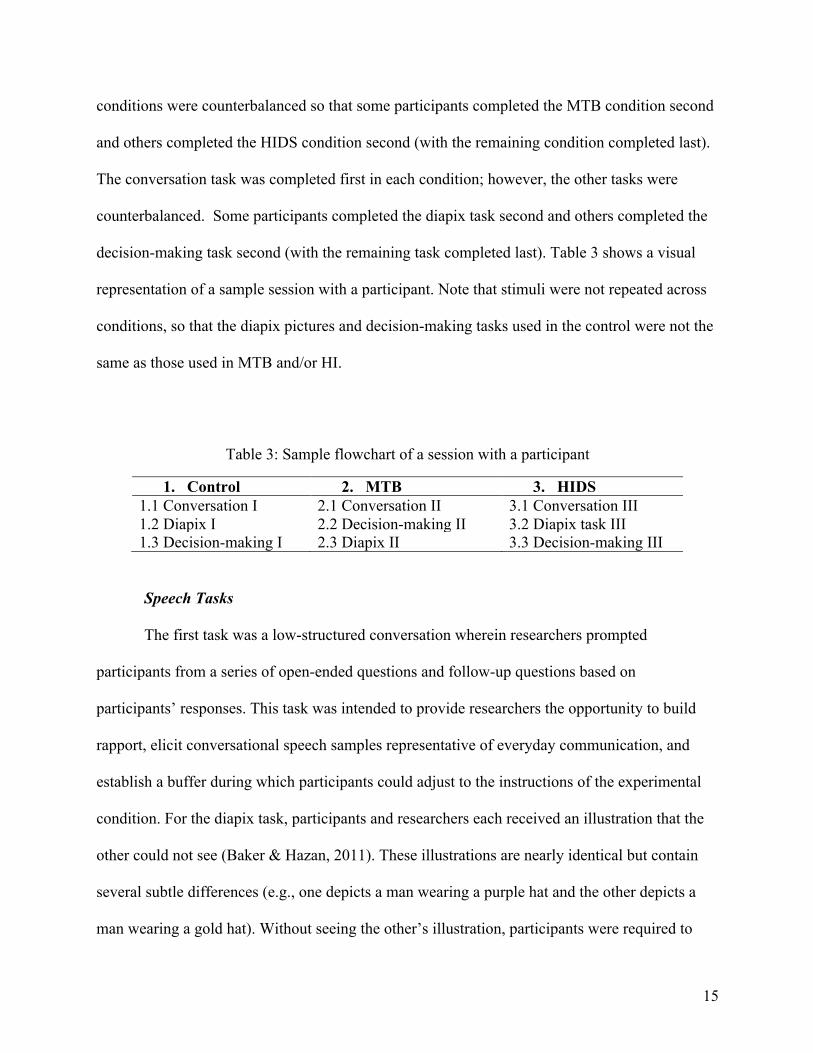
decision-making task second (with the remaining task completed last). Table 3 shows a visual
representation of a sample session with a participant. Note that stimuli were not repeated across
conditions, so that the diapix pictures and decision-making tasks used in the control were not the
same as those used in MTB and/or HI.
Table 3: Sample flowchart of a session with a participant
1. Control 2. MTB 3. HIDS 1.1 Conversation I 2.1 Conversation II 3.1 Conversation III 1.2 Diapix I 2.2 Decision-making II 3.2 Diapix task III 1.3 Decision-making I 2.3 Diapix II 3.3 Decision-making III
Speech Tasks
The first task was a low-structured conversation wherein researchers prompted
participants from a series of open-ended questions and follow-up questions based on
participants’ responses. This task was intended to provide researchers the opportunity to build
rapport, elicit conversational speech samples representative of everyday communication, and
establish a buffer during which participants could adjust to the instructions of the experimental
condition. For the diapix task, participants and researchers each received an illustration that the
other could not see (Baker & Hazan, 2011). These illustrations are nearly identical but contain
several subtle differences (e.g., one depicts a man wearing a purple hat and the other depicts a
man wearing a gold hat). Without seeing the other’s illustration, participants were required to
16
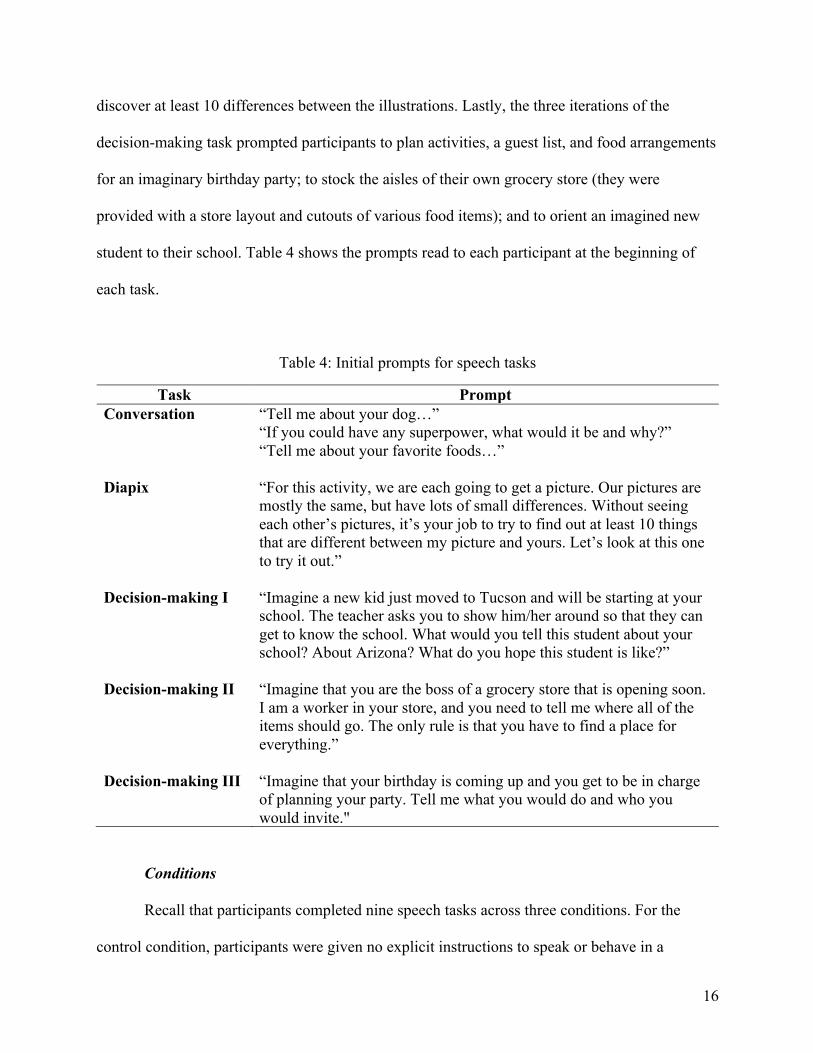
discover at least 10 differences between the illustrations. Lastly, the three iterations of the
decision-making task prompted participants to plan activities, a guest list, and food arrangements
for an imaginary birthday party; to stock the aisles of their own grocery store (they were
provided with a store layout and cutouts of various food items); and to orient an imagined new
student to their school. Table 4 shows the prompts read to each participant at the beginning of
each task.
Table 4: Initial prompts for speech tasks
Task Prompt Conversation “Tell me about your dog…”
“If you could have any superpower, what would it be and why?” “Tell me about your favorite foods…”
Diapix “For this activity, we are each going to get a picture. Our pictures are mostly the same, but have lots of small differences. Without seeing each other’s pictures, it’s your job to try to find out at least 10 things that are different between my picture and yours. Let’s look at this one to try it out.”
Decision-making I “Imagine a new kid just moved to Tucson and will be starting at your school. The teacher asks you to show him/her around so that they can get to know the school. What would you tell this student about your school? About Arizona? What do you hope this student is like?”
Decision-making II “Imagine that you are the boss of a grocery store that is opening soon. I am a worker in your store, and you need to tell me where all of the items should go. The only rule is that you have to find a place for everything.”
Decision-making III “Imagine that your birthday is coming up and you get to be in charge of planning your party. Tell me what you would do and who you would invite."
Conditions
Recall that participants completed nine speech tasks across three conditions. For the
control condition, participants were given no explicit instructions to speak or behave in a
17
particular way aside from the prompts they received for the speech tasks. In the HIDS condition,
participants were prompted to speak clearly as though they were talking to someone with a
hearing impairment. During this condition, researchers wore noise-cancelling headphones and
offered participants no feedback nor additional prompting. In the MTB condition, participants
completed the next set of speech tasks while multi-talker babble noise was presented in the
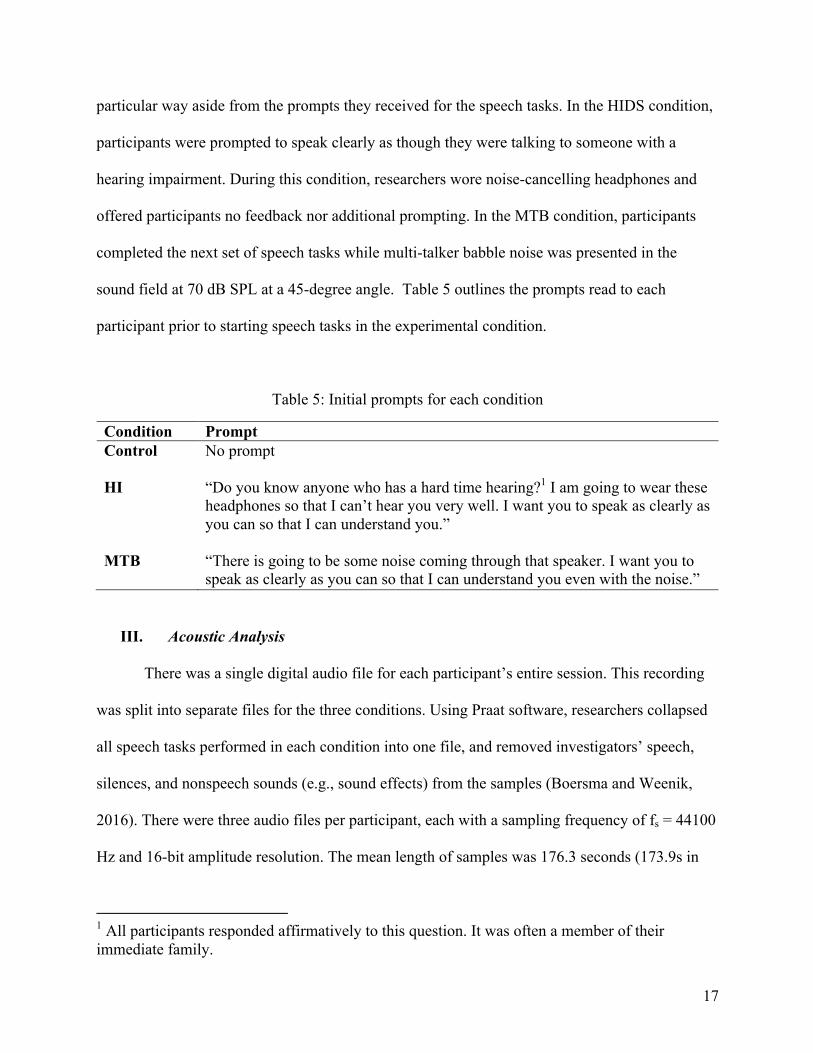
sound field at 70 dB SPL at a 45-degree angle. Table 5 outlines the prompts read to each
participant prior to starting speech tasks in the experimental condition.
Table 5: Initial prompts for each condition
Condition Prompt Control No prompt
HI “Do you know anyone who has a hard time hearing?1 I am going to wear these
headphones so that I can’t hear you very well. I want you to speak as clearly as you can so that I can understand you.”
MTB “There is going to be some noise coming through that speaker. I want you to speak as clearly as you can so that I can understand you even with the noise.”
III. Acoustic Analysis
There was a single digital audio file for each participant’s entire session. This recording
was split into separate files for the three conditions. Using Praat software, researchers collapsed
all speech tasks performed in each condition into one file, and removed investigators’ speech,
silences, and nonspeech sounds (e.g., sound effects) from the samples (Boersma and Weenik,
2016). There were three audio files per participant, each with a sampling frequency of fs = 44100
Hz and 16-bit amplitude resolution. The mean length of samples was 176.3 seconds (173.9s in
1 All participants responded affirmatively to this question. It was often a member of their immediate family.
18
control, 186.1s in HIDS, and 168.9s in MTB). Using these files, acoustic analyses were
performed using customized Matlab scripts (B. Story; Mathworks, 2016). Each of the
participants’ three files was processed with the following steps:
1. A periodicity detector based on the autocorrelation of overlapped 23ms windows was
used to find all segments that contained voicing and all subsequent analyses were
performed only on these voiced segments. This analysis allowed for determining location
and duration of pauses.
2. The fundamental frequency, fo, was determined with a cycle detection algorithm that
measured the period of each consecutive glottal cycle in each file.
3. SPL was determined by first multiplying the signal by the calibration factor obtained
during the previously-described calibration procedure. Then the RMS value of the
pressure signal (PRMS) was calculated within consecutive, overlapped 23 ms windows and
converted to SPL with 20log10(PRMS/Pref) where Pref = 0.00002 Pa.
4. Formants, F1 and F2, were tracked throughout all voiced segments of each signal. This
was accomplished by first downsampling each signal such that fs= 10000 Hz, applying an
autocorrelation-type LPC algorithm to generate an estimate of the vocal tract frequency
response, and finally finding the frequencies of the first two formant peaks with a
parabolic peak-picking technique (Titze et al., 1987). The LPC analysis was based on
overlapped 40 ms windows tapered at the left and right ends with a Gaussian window
function (alpha = 2.5) to provide formant values every 5 ms.
5. A smoothed version of the cepstral peak prominence (CPPS) was determined across the
duration of each signal with the method described by Hillenbrand and Houde (1994). For
a consecutive 92.9 ms windows, the real cepstrum (spectrum of a spectrum) was first

19
calculated and then smoothed with a 30-point averaging filter. A linear regression line
was then fit to the smoothed cepstrum, and the amplitude of the peak corresponding to
the fundamental period in the smoothed cepstrum and its location along the quefrency
axis was found with a peak detector. The difference between the peak value and the
regression line at the same quefrency was logged as the value of CPPS.
This custom analysis provided the following metrics for each participants’ files: articulation rate,
percent change in mean fo, percent change in mean SPL (in dB), VRD, VSDn, and CPPS. The
parameters analyzed in this study were included to match those from previous studies and
provide a comprehensive profile of baseline pediatric acoustic modifications (Cooke et al.,
2014).
Percent fo change. Mean fundamental frequency was calculated in each condition for
each participant. Percent difference between habitual fo and fo in experimental conditions was
then calculated.
Change in SPL. Mean sound pressure level was measured for each participant in all
conditions. Difference in dB level in the control condition versus experimental conditions were
then calculated.
Articulation rate. Recording time was measured from onset of speaking to the end.
Pauses with durations of 0.3 seconds or greater were removed. Rate of articulation was
calculated in units of syllables per second for the length of the sample.
Voice range density normalized (VRDn). The fo and SPL values were normalized to
their median values, and fo was converted to semitones. These values were used to plot a
normalized VRD plot as demonstrated by Story and Bunton (2016). In a grid spanning from -6 to

20
6 semitones in the horizontal dimension, and from -6 to 6 dB in the vertical dimension, the
number of [fo, SPL] pairs present within a radius of 0.1 from every point in the grid were counted
and assigned to the corresponding grid point as a density value. All density values were then
normalized to the maximum density present across the grid so that the maximum density is
always equal to 1.0. Plotted as a color map that varies from dark blue for low density, to red
indicating high density, the VRD provides a view of how the talker distributed their fundamental
frequency and SPL over the duration of the recording. Each voice range density plot was
quantified by finding area enclosed by a convex hull at a density level of 0.25. In this case, the
area measurement has units of dBHz.
Vowel space density normalized (VSDn). Based on the first and second formant
frequencies (F1, F2) measured across all voiced segments, a vowel space density plot was
determined as described by Story and Bunton (2016; 2017). The first step was to normalize the
formant values relative to the median such that Fn* = (Fn-Fn
median)/Fnmedian where n is the formant
number; this process allows for comparison across talkers, genders, age, etc. A grid was then
generated spanning a range from -1 to 1 along both the horizontal and vertical axes with an
increment of 0.01. At every point in the grid, the [F1*, F2
*] pairs that were located within a radius
of 0.075 were counted and logged as the density value associated with the specific grid point.
The density values were normalized to the largest density value so that the maximum was always
1.0. VSDNn plots were generated for each task and condition. Similar to the voice range profile,
the density of the normalized formant pair across each sample were plotted on the x and y axes,
with color differentiation to represent density of the vocalic productions in the normalized vowel
space. Again, dark blue represented low density and red represented high. This allowed for
discrimination between a speaker's tendency to centralize or disperse vowels.
21
Cepstral peak prominence (CPPS): The CPPS indicates degree of periodicity present in
the signal, as measured in dB. A low number suggests a significant aperiodic spectral component
such as would be expected in a breathy or rough voice, whereas a high number indicates that
most of the energy is in the harmonic components as may be expected during clear speech.
IV. Statistical Analysis
A one-way repeated measures ANOVA was used to investigate differences for these acoustic
measures as a function of condition. The BKB-SIN score was used as a covariate. The within-
subject repeated measure of task consisted of three factors: control, HIDS, and MTB. Following
a significant main effect, post hoc analyses were completed. The alpha level was set at .0167 for
all post hoc comparisons.
»Results
I. Frequency Measures
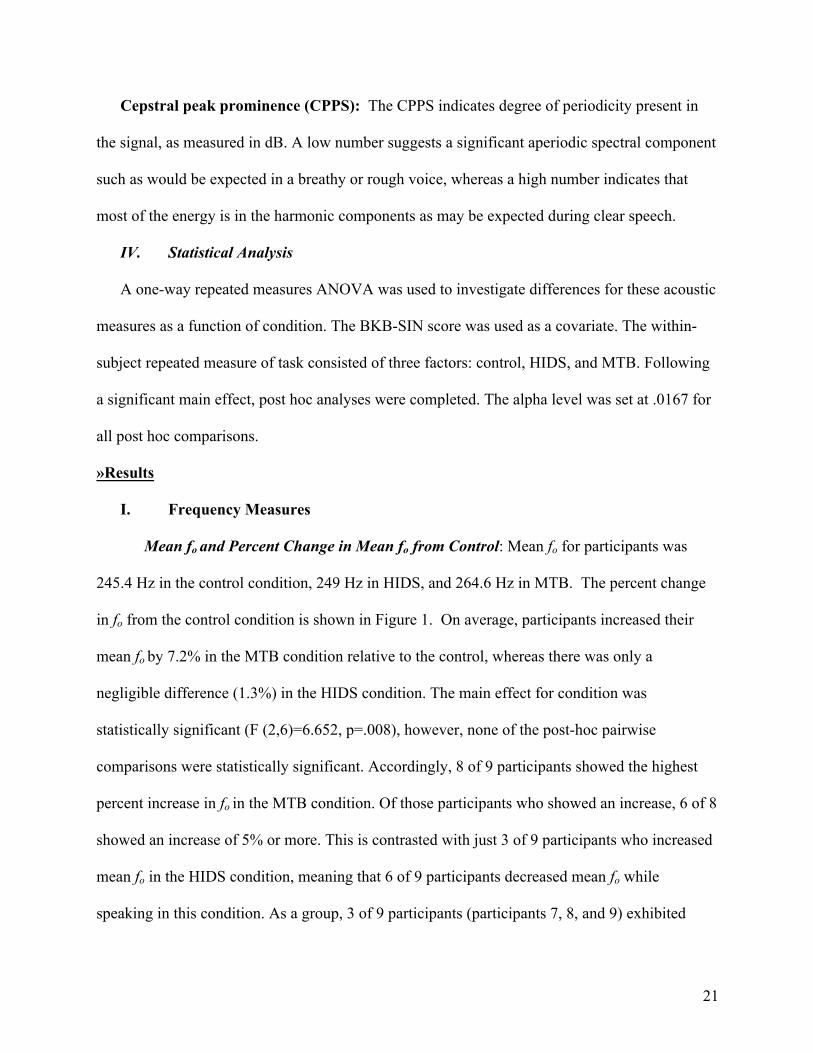
Mean fo and Percent Change in Mean fo from Control: Mean fo for participants was
245.4 Hz in the control condition, 249 Hz in HIDS, and 264.6 Hz in MTB. The percent change
in fo from the control condition is shown in Figure 1. On average, participants increased their
mean fo by 7.2% in the MTB condition relative to the control, whereas there was only a
negligible difference (1.3%) in the HIDS condition. The main effect for condition was
statistically significant (F (2,6)=6.652, p=.008), however, none of the post-hoc pairwise
comparisons were statistically significant. Accordingly, 8 of 9 participants showed the highest
percent increase in fo in the MTB condition. Of those participants who showed an increase, 6 of 8
showed an increase of 5% or more. This is contrasted with just 3 of 9 participants who increased
mean fo in the HIDS condition, meaning that 6 of 9 participants decreased mean fo while
speaking in this condition. As a group, 3 of 9 participants (participants 7, 8, and 9) exhibited
22
increases in mean fo greater than 10%, and only one participant (participant 9) showed such an
increase in both experimental conditions. When comparing sexes, males stayed relatively stable
across all conditions (averaging a .13% decrease in HIDS and a 2.2% increase in MTB) while
females showed a meaningful increase in mean fo in MTB (an average increase of 13.4%) but not
in HIDS (an average increase of 3.1%). Finally, it is notable that males’ fo averages (267 Hz in
control, 267.2 Hz in HIDS, and 273.4 Hz in MTB) were higher than the females’ fo averages
(218 Hz in control, 226.25 Hz in HIDS, and 253.5 Hz in MTB) across all conditions.
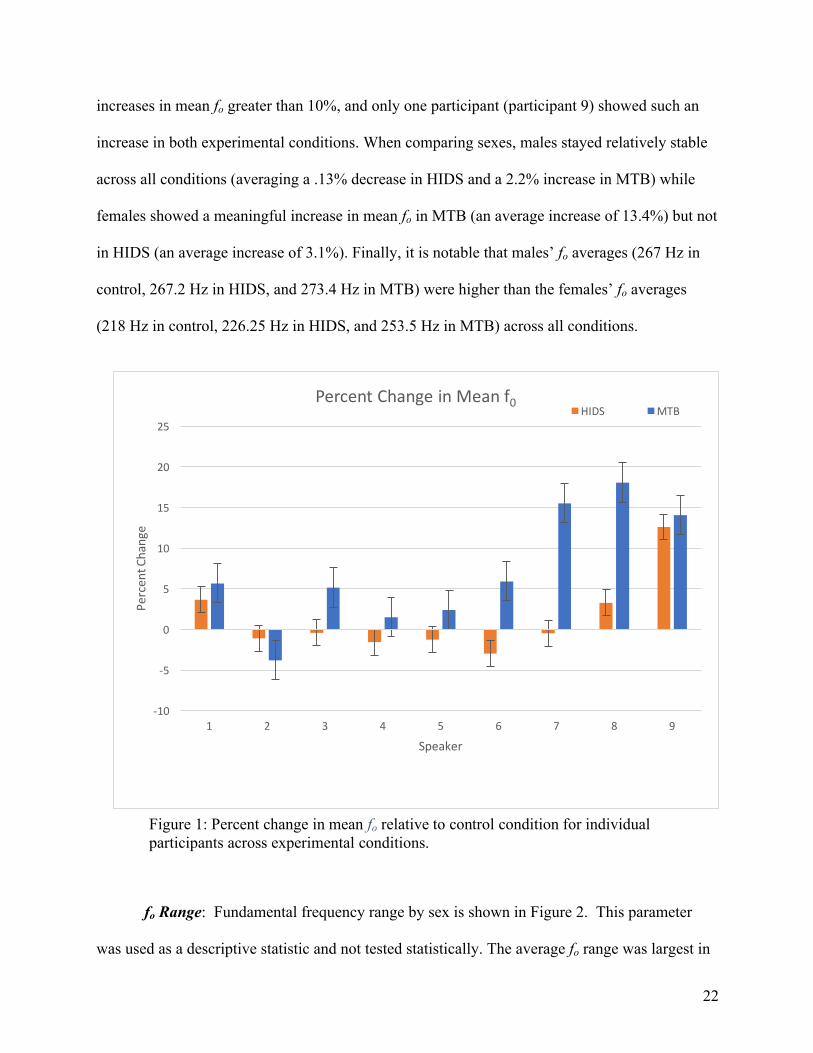
fo Range: Fundamental frequency range by sex is shown in Figure 2. This parameter
was used as a descriptive statistic and not tested statistically. The average fo range was largest in
Figure 1: Percent change in mean fo relative to control condition for individual participants across experimental conditions.
-10
-5
0
5
10
15
20
25
1 2 3 4 5 6 7 8 9
Percen
tChange
Speaker
PercentChangeinMeanf0HIDS MTB
23
the MTB condition (314.1 Hz), smallest in the HIDS condition (280.6 Hz), and the control
condition average fell in between the two experimental conditions (287.4 Hz). Six of nine
participants had the largest ranges in the MTB condition. Though on average participants had the
smallest ranges in the HIDS condition, this was only true for 3 of 9 participants. Neither of the
sexes’ averages across conditions resembled the trends of the group considered as a whole.
Males employed the largest range in the control condition (327.6 Hz), and showed subsequent
decreases in the HI (304.2 Hz) and MTB (321.4 Hz) conditions. Females, however, employed
the largest range in the MTB condition (305 Hz), followed by the HI (251 Hz) and control (237.3
Hz).
II. Intensity Measures
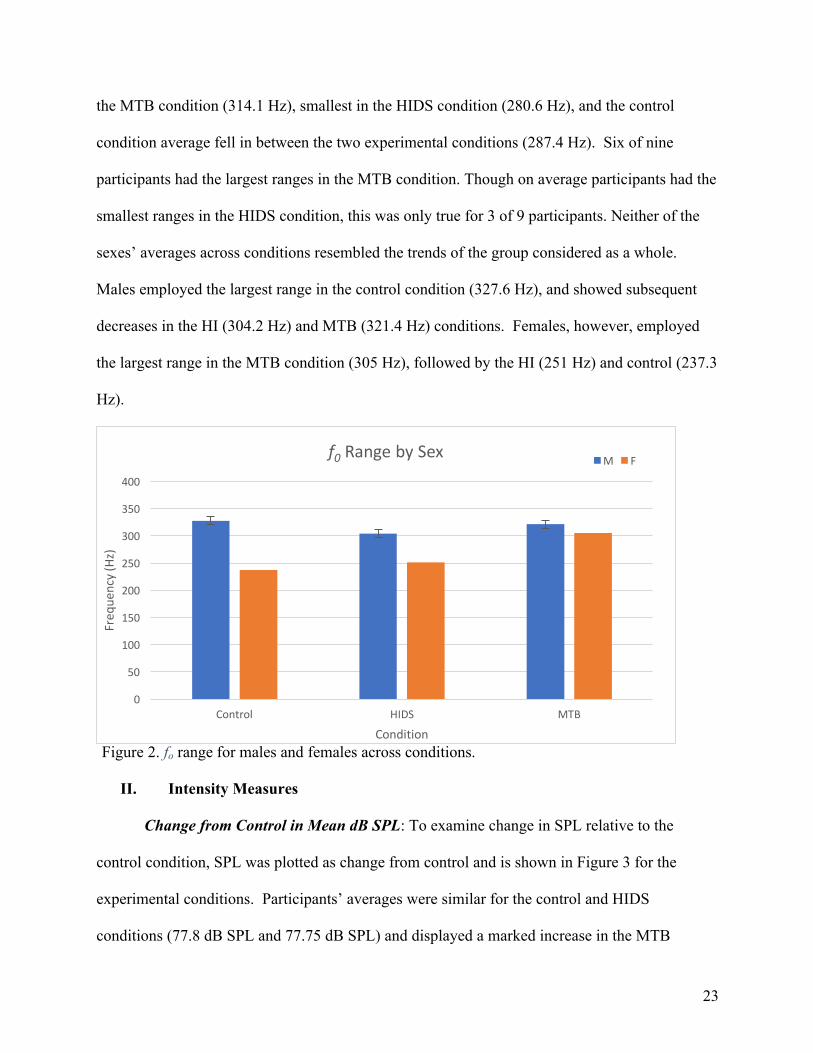
Change from Control in Mean dB SPL: To examine change in SPL relative to the
control condition, SPL was plotted as change from control and is shown in Figure 3 for the
experimental conditions. Participants’ averages were similar for the control and HIDS
conditions (77.8 dB SPL and 77.75 dB SPL) and displayed a marked increase in the MTB
Figure 2. fo range for males and females across conditions.
0
50
100
150
200
250
300
350
400
Control HIDS MTB
Freq
uency(Hz
)
Condition
f0 RangebySex M F

24
condition (80 dB SPL). The difference between condition was statistically significant
(F(2,16)=4.259, p=.033). Interestingly, over half (5 of 9) of participants displayed a lower (i.e.,
tended to speak quieter) mean SPL in the HIDS condition relative to the control condition,
compared to 4 of 9 participants who increased mean SPL in the HIDS condition. This yielded a
modest average increase of .002% in the HIDS condition relative to control. In the MTB
condition, 7 of 9 participants displayed a higher average (i.e., tended to speak louder), and 5 of 7
of those participants showed greater than 2% increases in mean SPL. This yielded an average
percent change of 3% relative to control. Females as a group stayed relatively stable across
conditions, which resulted in mean SPLs of 78 dB in control, 77.9 dB in HIDS, and 78.5 dB in
MTB. Males’ averages, however, were stable from control to HIDS (77.6dB for both) but
drastically increased their average to 81.3dB in MTB condition. Additionally, all males
(participants 1-5) showed at least some increase in mean SPL in the MTB condition, whereas
only two females (participants 8 and 9) increased mean SPL in response to noise and two
females (participants 6 and 7 on the graph below) responded to both experimental conditions by
lowering mean SPL.
25
Figure 3: Mean SPL for individual participants across experimental conditions.
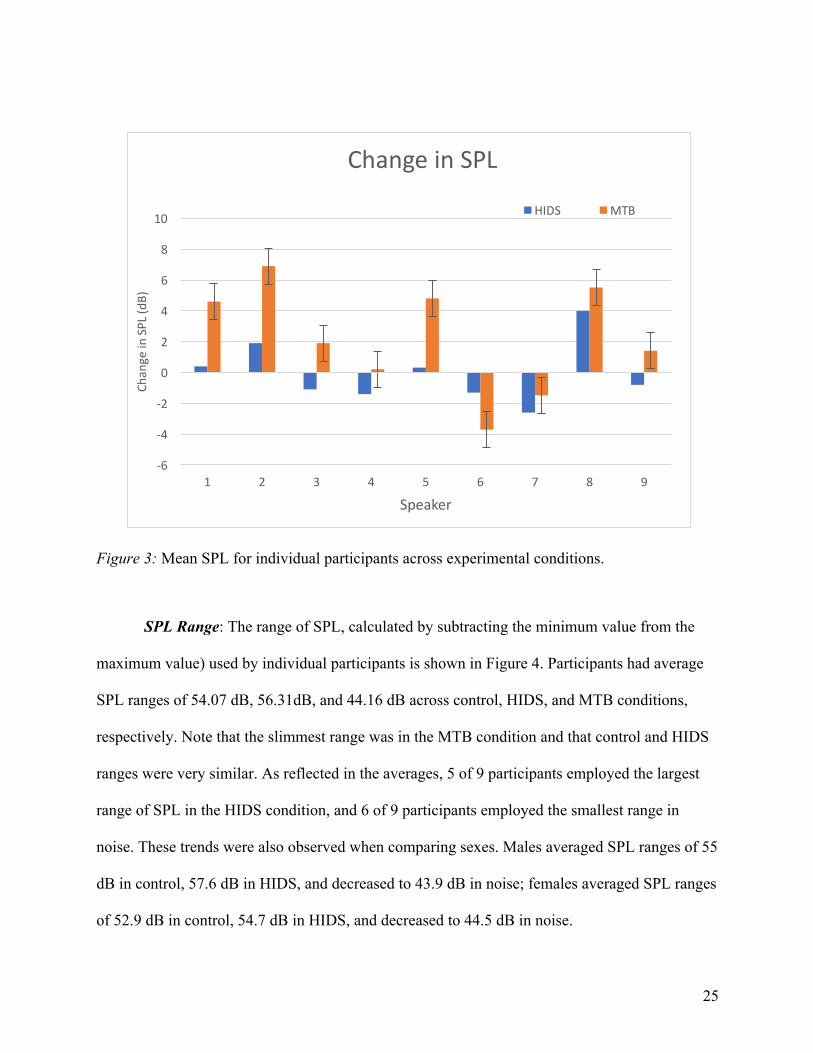
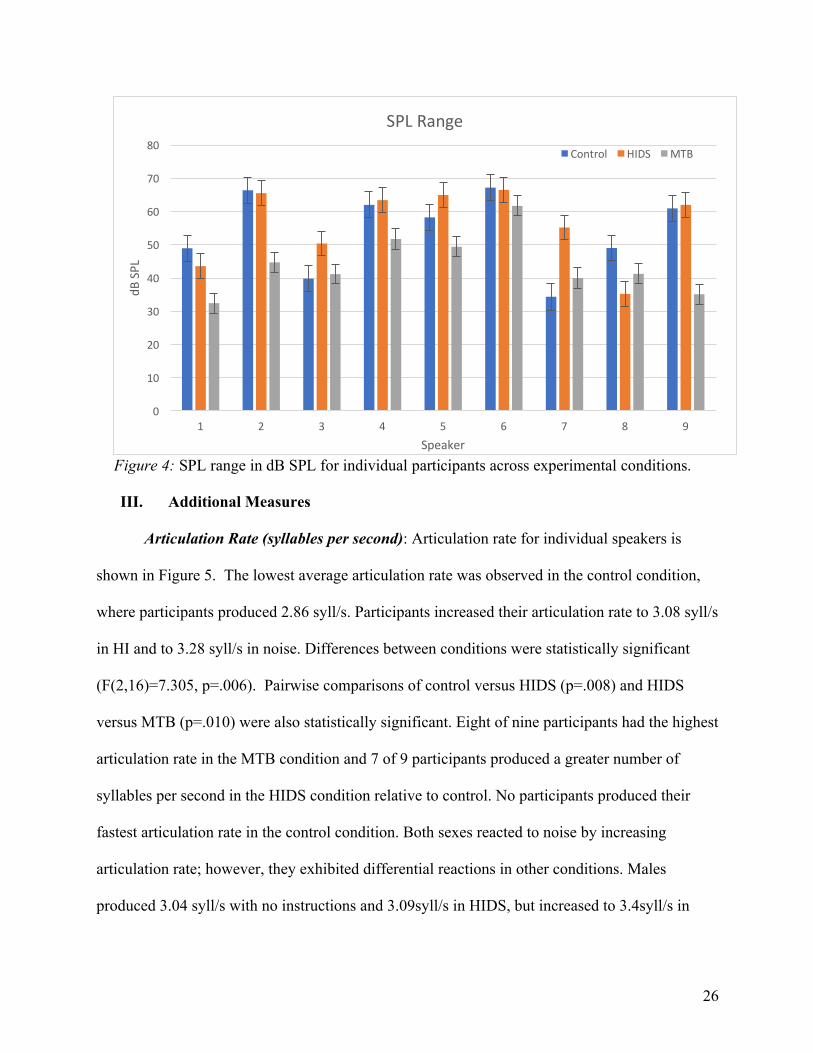
SPL Range: The range of SPL, calculated by subtracting the minimum value from the
maximum value) used by individual participants is shown in Figure 4. Participants had average
SPL ranges of 54.07 dB, 56.31dB, and 44.16 dB across control, HIDS, and MTB conditions,
respectively. Note that the slimmest range was in the MTB condition and that control and HIDS
ranges were very similar. As reflected in the averages, 5 of 9 participants employed the largest
range of SPL in the HIDS condition, and 6 of 9 participants employed the smallest range in
noise. These trends were also observed when comparing sexes. Males averaged SPL ranges of 55
dB in control, 57.6 dB in HIDS, and decreased to 43.9 dB in noise; females averaged SPL ranges
of 52.9 dB in control, 54.7 dB in HIDS, and decreased to 44.5 dB in noise.
-6
-4
-2
0
2
4
6
8
10
1 2 3 4 5 6 7 8 9
ChangeinSPL(d
B)
Speaker
ChangeinSPL
HIDS MTB
26
III. Additional Measures
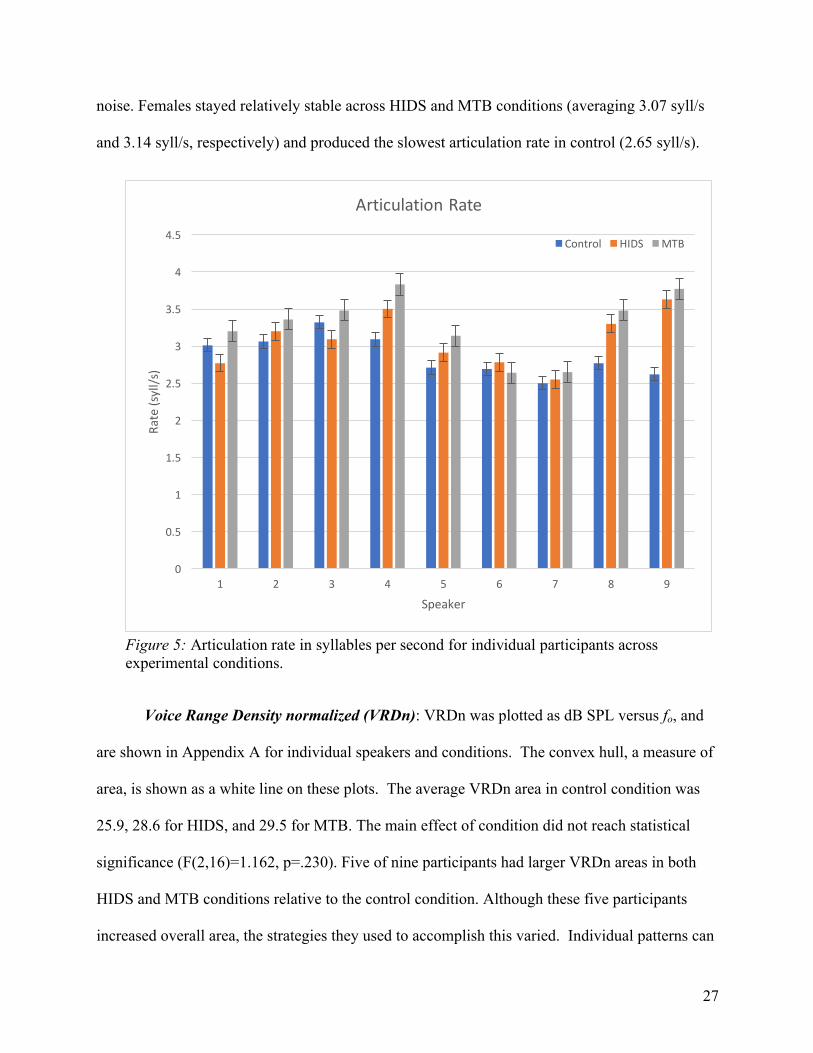
Articulation Rate (syllables per second): Articulation rate for individual speakers is
shown in Figure 5. The lowest average articulation rate was observed in the control condition,
where participants produced 2.86 syll/s. Participants increased their articulation rate to 3.08 syll/s
in HI and to 3.28 syll/s in noise. Differences between conditions were statistically significant
(F(2,16)=7.305, p=.006). Pairwise comparisons of control versus HIDS (p=.008) and HIDS
versus MTB (p=.010) were also statistically significant. Eight of nine participants had the highest
articulation rate in the MTB condition and 7 of 9 participants produced a greater number of
syllables per second in the HIDS condition relative to control. No participants produced their
fastest articulation rate in the control condition. Both sexes reacted to noise by increasing
articulation rate; however, they exhibited differential reactions in other conditions. Males
produced 3.04 syll/s with no instructions and 3.09syll/s in HIDS, but increased to 3.4syll/s in
Figure 4: SPL range in dB SPL for individual participants across experimental conditions.
0
10
20
30
40
50
60
70
80
1 2 3 4 5 6 7 8 9
dBSPL
Speaker
SPLRange
Control HIDS MTB
27
noise. Females stayed relatively stable across HIDS and MTB conditions (averaging 3.07 syll/s
and 3.14 syll/s, respectively) and produced the slowest articulation rate in control (2.65 syll/s).
Voice Range Density normalized (VRDn): VRDn was plotted as dB SPL versus fo, and
are shown in Appendix A for individual speakers and conditions. The convex hull, a measure of
area, is shown as a white line on these plots. The average VRDn area in control condition was
25.9, 28.6 for HIDS, and 29.5 for MTB. The main effect of condition did not reach statistical
significance (F(2,16)=1.162, p=.230). Five of nine participants had larger VRDn areas in both
HIDS and MTB conditions relative to the control condition. Although these five participants
increased overall area, the strategies they used to accomplish this varied. Individual patterns can
Figure 5: Articulation rate in syllables per second for individual participants across experimental conditions.
0
0.5
1
1.5
2
2.5
3
3.5
4
4.5
1 2 3 4 5 6 7 8 9
Rate(syll/s)
Speaker
ArticulationRate
Control HIDS MTB

28
be seen in the appendix. Four of nine participants had the largest overall VRDn area in the MTB
condition, four of nine participants had the largest VRDn area in HIDS, and only one participant
exhibited the greatest VRDn area in the control condition. Males showed the highest VRDn area
in MTB (29.24), compared to 26.02 in control and 25.8 in HIDS. Females showed the highest
VRDn area in HIDS with an average of 32.2, and averaged 29.8 in noise and 25.7 in the control
condition.
Qualitative analysis of the VRDn plots in Appendix A, show that there was not one single
strategy that this group of participants employed to vary VRDn, but rather a number of strategies
used by small subgroups of participants. For example, four of nine participants employed larger
ranges of fo variation in noise, four of nine participants employed larger ranges of fo variation in
HIDS, and two of nine participants exhibited only negligible changes across all conditions.
Vowel Space Density (VSDn): Normalized vowel space densities are shown in Appendix
B for individual participants and conditions. The area calculated based on a convex hull is
shown as a white line. The main effect of condition was not statistically significant
(F(1,16)=0.317, p=.733). Participants exhibited the smallest average VSDn in the MTB
condition (831,345 Hz2), while VSDn was relatively equal between control and HIDS conditions
(997,768 Hz2 and 1,018,591 Hz2, respectively). Five of nine participants showed decreases in
VSDN in both experimental conditions, three of nine participants increased VSDn in both
experimental conditions, and six of nine participants decreased VSDn in the MTB condition.
Males’ VSDn steadily decreased across conditions, averaging 1,063,391 Hz2 with no
instructions, 1,005,345 Hz2 in HIDS, and 817,380 Hz2 in noise. Females displayed greater
variability across conditions, averaging 915,740 Hz2 with no instructions, 1,035,148 Hz2 in
HIDS, and 848, 800 Hz2in the MTB condition. Note that both sexes had the lowest VSA

29
averages in the MTB condition. The changes made by individual speakers in the experimental
conditions varied greatly, as seen by changing convex hull shapes seen the VSDn plots in the
appendix.
Qualitative analysis of VSDn, displayed a high degree of variation. The most consistent
pattern was a greater variation in F1 in either MTB or HIDS (but not both) compared to other
conditions, which eight of nine participants exhibited. Four of nine participants showed greater
variation in F2 in HIDS compared to other conditions. Three of nine participants had nearly
identical VSDn shape in HIDS and MTB conditions, and three of nine participants had nearly
identical VSDn shape in TD and HIDS conditions.
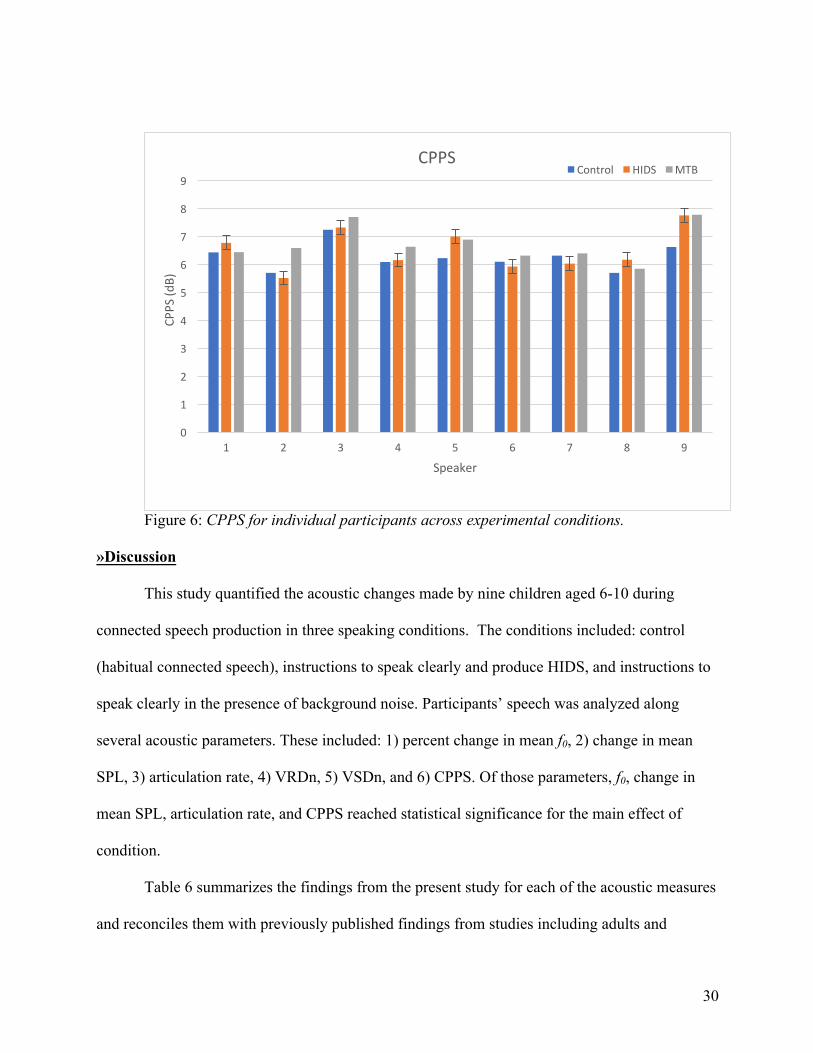
CPPS: CPPS is shown in Figure 6 by participant. Participants gradually increased CPPS
values across conditions. Without instructions (control condition), participants’ CPPS averaged
6.27 dB. This increased to 6.52 dB in HIDS and to 6.74 dB in MTB conditions. The difference
between conditions was statistically significant (F(2,16)=5.057, p=.020). The pairwise
comparison for HIDS versus MTB was also statistically significant (p=.007). It was notable that
all participants (9 of 9) increased their CPPS values in MTB relative to control, and that no
participants had the highest CPPS value in the control condition. Moreover, 5 of 9 participants
had higher CPPS values in MTB than in any other condition, while, the remaining four
participants had higher CPPS values in HIDS than in any other condition. The trend of steady
increases in CPPS across conditions was also observed in both sexes. Males had average values
of 6.3 dB in control, 6.6 dB in HI, and 6.8 dB in MTB; females averaged 6.2 dB in control, 6.5
dB in HIDS, and 6.6 dB in MTB. Note that females had lower CPPS values in all conditions.
30
Figure 6: CPPS for individual participants across experimental conditions.
»Discussion
This study quantified the acoustic changes made by nine children aged 6-10 during
connected speech production in three speaking conditions. The conditions included: control
(habitual connected speech), instructions to speak clearly and produce HIDS, and instructions to
speak clearly in the presence of background noise. Participants’ speech was analyzed along
several acoustic parameters. These included: 1) percent change in mean f0, 2) change in mean
SPL, 3) articulation rate, 4) VRDn, 5) VSDn, and 6) CPPS. Of those parameters, f0, change in
mean SPL, articulation rate, and CPPS reached statistical significance for the main effect of
condition.
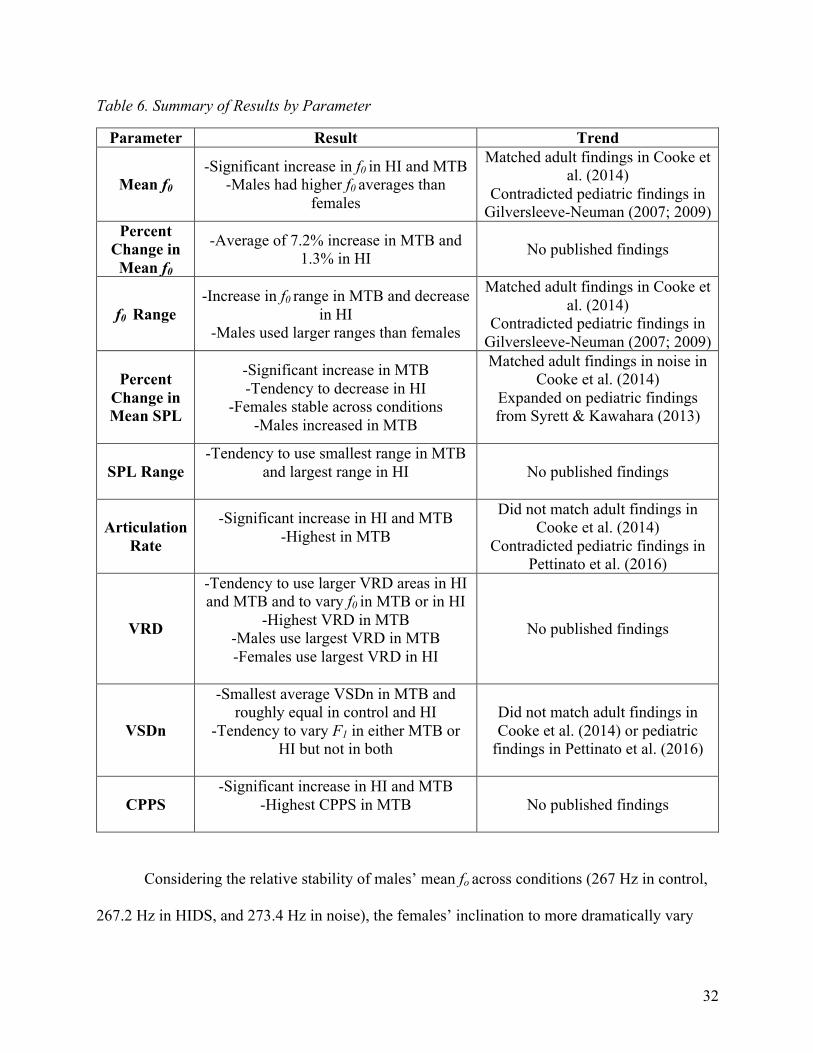
Table 6 summarizes the findings from the present study for each of the acoustic measures
and reconciles them with previously published findings from studies including adults and
0
1
2
3
4
5
6
7
8
9
1 2 3 4 5 6 7 8 9
CPPS(d
B)
Speaker
CPPSControl HIDS MTB

31
children. Participants exhibited a wide range of adjustments to their speech when prompted to
speak clearly in the two experimental conditions. In general, more robust and dramatic changes
were observed in the presence of noise. There tended to be only negligible differences between
control and HIDS conditions. Some of these adjustments matched those that adults and children
have made in previous published investigations. Some adjustments suggested that children
exhibited the emergence of adult-like clear speech strategies, and other adjustments were either
counterintuitive and/or completely distinct from adult-like clear speech strategies.
I. Frequency Measures
Recall that, as a group, participants significantly increased their mean fo while producing
connected speech in noise compared to the control condition (from an average of 245.4 Hz to
264.6 Hz, respectively). However, mean fo stayed relatively stable across control and HIDS
conditions (from an average of 245.4 Hz to 249 Hz, respectively). Accordingly, this was
reflected in the percent change in mean fo, where talkers showed an average of a 7.2% increase
compared to an average increase of 1.3% in HIDS. Although the difference was not statistically
significant, speakers also tended to increase f0 ranges in MTB and decrease ranges in HIDS
relative to the control.
The observation that children showed significant changes in mean fo and generally used
larger fo ranges in noise serve as examples where children’s performances matched what previous
studies including adults have shown (Cooke et al., 2014). These findings, however, were in
opposition to Redford and Gildersleeve-Neuman (2007, 2009) who found that children aged 4-5
lowered fo but that fo range did not meaningfully differ when prompted to speak clearly. Their
study targeted only the word level.
32
Table 6. Summary of Results by Parameter
Parameter Result Trend
Mean f0 -Significant increase in f0 in HI and MTB
-Males had higher f0 averages than females
Matched adult findings in Cooke et al. (2014)
Contradicted pediatric findings in Gilversleeve-Neuman (2007; 2009)
Percent Change in
Mean f0
-Average of 7.2% increase in MTB and 1.3% in HI No published findings
f0 Range -Increase in f0 range in MTB and decrease
in HI -Males used larger ranges than females
Matched adult findings in Cooke et al. (2014)
Contradicted pediatric findings in Gilversleeve-Neuman (2007; 2009)
Percent Change in Mean SPL
-Significant increase in MTB -Tendency to decrease in HI
-Females stable across conditions -Males increased in MTB
Matched adult findings in noise in Cooke et al. (2014)
Expanded on pediatric findings from Syrett & Kawahara (2013)
SPL Range -Tendency to use smallest range in MTB
and largest range in HI
No published findings
Articulation Rate
-Significant increase in HI and MTB -Highest in MTB
Did not match adult findings in Cooke et al. (2014)
Contradicted pediatric findings in Pettinato et al. (2016)
VRD
-Tendency to use larger VRD areas in HI and MTB and to vary f0 in MTB or in HI
-Highest VRD in MTB -Males use largest VRD in MTB -Females use largest VRD in HI
No published findings
VSDn
-Smallest average VSDn in MTB and roughly equal in control and HI
-Tendency to vary F1 in either MTB or HI but not in both
Did not match adult findings in Cooke et al. (2014) or pediatric
findings in Pettinato et al. (2016)
CPPS -Significant increase in HI and MTB
-Highest CPPS in MTB
No published findings
Considering the relative stability of males’ mean fo across conditions (267 Hz in control,
267.2 Hz in HIDS, and 273.4 Hz in noise), the females’ inclination to more dramatically vary

33
mean fo across conditions (218 Hz in control, 226.25 Hz in HI, and 253.5 Hz in noise)
contributed more to the difference in group averages than the males’. Hazan and Markham
(2004) found that adult females were perceived as clearer speakers than adult males. Although
the sample size of females included in the present study was small (n=4), the observation that
females started using f0 modulation earlier could be one factor that contributes to the perception
of females as clearer speakers, and may suggest that this trend begins early on in development.
Thus, for measures of frequency, children were inclined to behave more similarly to
adults (i.e., increase fo mean and fo range) while producing connected speech in the presence of
noise. Females in this sample appeared especially inclined to do so, though the oldest speaker
may have helped skew this (speaker #8, aged 10). Contrary to the adult-like adjustments made in
noise, the most notable adjustment to frequency when prompted to produce HIDS was a
reduction in fo range, a trend that deviates from the adult-like profile.
I. Intensity Measures
Children in this sample also displayed differential acoustic modifications with respect to
measures of intensity. The most salient modifications were a significant increase in mean dB
SPL in the MTB condition and a subtle decrease in mean dB SPL in the HIDS condition relative
to the control. Practically, this suggests that the children in this sample were capable of
approximating the adult-like tendency to produce louder speech in noise, but did not do so when
asked to produce HIDS (Ferguson et al., 2010; Cooke et al., 2014). Because there was no
experimental condition in which children were presented with noise but not explicitly prompted
to produce clear speech, this study does not address whether the children’s significant increase in
loudness was an adaptation to clear speech instructions or merely a reaction to the presence of
noise. However, the result that children produced no meaningful changes to intensity in the
34
HIDS condition, in which they were also instructed to speak clearly, implies that the presence of
noise influenced the intensity of children’s speech production to a greater degree than the
instructions and no sensory perturbation.
Producing louder speech may have also been a consequence of children’s desire to hear
themselves better and monitor their own speech than it was a pragmatic adjustment for their
interlocutors. Though research from Mahl (1972) and Perkell (2012) revealed that adults produce
louder speech to benefit themselves and listeners, our finding that children on average did not
produce significant changes in intensity when it would have only benefited a listener (as in the
HIDS condition) suggest that the observed changes in MTB were likely made to accommodate
their own feedback and not their listeners. Additional support for this explanation was the
tendency for children to remark that the multi-talker babble was loud, to state that it made it
difficult for them to hear themselves (but not that it made it difficult to hear researchers), and/or
that the presence of the noise made them appear visibly annoyed or uncomfortable (e.g., repeated
glancing at the loudspeaker, trailing off midsentence, and increased use of discourse markers).
The results also showed that children did not meaningfully modify intensity in the HIDS
condition. One possible reason for this is that children did not appreciate the connection between
speaking to someone with hearing impairment and the benefit that producing speech at greater
intensities could provide. A second potential explanation is that the children were neither
confronted with as many communication breakdowns (natural and scripted) nor opportunities to
resolve them (e.g., requests for repetition and/or explicit prompts to speak louder) in the
experimental condition. These may have occurred more regularly had participants conversed
with individuals with diagnosed hearing impairments or if they had been reminded more
frequently that the researchers were wearing headphones and could not hear the children as well.
35
Subscribing to this explanation, the children’s failure to produce louder speech in the HIDS
condition could be interpreted to mean that they assumed that their interlocutor could understand
them and that there was no communication breakdown to resolve. A third possibility is that this
trend could have resulted from a lack of experience with individuals with hearing loss or a lack
of familiarity with what it means to have trouble hearing. However, this seems unlikely simply
because all children reported knowing someone (in many cases, a grandparent or other close
relative) who had difficulty hearing.
Unlike with measures of frequency, where females reacted to condition more noticeably
than males, which then helped sway the group averages, the opposite effect was observed with
respect to intensity. For mean dB SPL, it was the males in the sample who produced markedly
louder speech in response to noise relative to the control and HIDS conditions, while the females
did not vary intensity much across conditions. It is possible that the males in this sample found
producing louder speech a more intuitive clear speech strategy than females, who were more
likely to spontaneously increase fo in the presence of noise.
II. Additional Measures
Relative to control, the children in this study used significantly faster rates of speech in
MTB and HIDS conditions (measured as articulation rate with pauses removed). As with several
other measures, participants produced greater changes in response to the presence of noise
(MTB) (up to 3.28 syll/s from 2.86 syll/s) than in the HIDS condition (up to 3.08 syll/s from 2.86
syll/s). Additionally, it was notable that both males and females exhibited a similar pattern,
unlike previous parameters in which one sex displayed a behavior to a greater extent than the
other. The tendency to increase speech rate in both experimental conditions contrasted with
adults, who have been found to significantly reduce articulation rate in similar conditions

36
(Ferguson et al., 2010; Cooke et al., 2014). It seems that children in this sample had not yet
acquired the adult-like modification of reducing articulation rate relative to control condition,
which is known to improve intelligibility and contribute to the percept of clear speech (Lam and
Tjaden, 2013). This provides more robust support for Redford and Gildersleeve-Neuman’s
(2007; 2009) finding that children aged 4-5 showed increased articulation rates at the word level,
given that the present study’s design could demonstrate an increased articulation rate at the level
of connected speech in ecologically valid speech tasks. It is not, however, known what
meaningful effects these increased articulation rates would have on measures of intelligibility
and comprehensibility to individuals who are typically developing, hearing impaired, or part of
other clinical populations. Though previous studies have shown that children have slower
articulation rates than adults in connected speech and in experimental conditions (Pettinato et al.,
2016), the design of the present investigation did not allow for such a direct comparison to
adults. It is possible that the presence of multi-talker babble may have been a factor that
influenced children in this sample to increase their articulation rate. That is, the presence of
multi-talker babble may have elicited a choral-reading effect wherein the children
subconsciously increased rate to mimic that of the speakers in the multi-talker babble. A second
interpretation is that the increased rate in multi-talker babble was another consequence of the
children being discomfited during that condition. The increased rate could be a reflection of the
children’s thought process that if they spoke more quickly, they would complete the speech tasks
more quickly, and that the noise would be turned off sooner.
For both VRDn and VSDn, participants displayed highly variable shapes across
conditions and exhibited no significant differences across conditions. The most consistent
observation for group measures of VRDn was the finding that participants tended to increase
37
VRDn in experimental conditions. Four of nine participants showed the largest variations in fo in
HI and four of nine participants showed the largest variations in fo in in MTB. Measures of
VSDn, however, revealed that participants tended to decrease VSDn in noise but behaved
roughly the same across control and HI conditions. Accordingly, eight of nine participants varied
F1 the most in either HI or MTB but not in both. Perhaps the most important observation from
measures of VSDn was that the children in this sample did not yet demonstrate the adult-like
behavior of significantly and consistently increasing the vowel space in experimental conditions
relative to their own values in control (Hazan & Baker, 2012; Cooke et al., 2014). In fact, the
observed VSDn averages revealed a reduction in VSDn in the presence of noise for six of nine
children. This contradicts several earlier studies that measured vowel spaces from children
younger and older than those included in the present study. Syrett and Kawahara (2013) found
that the preschoolers produced words with exaggerated and more intense vowels and larger
vowel space areas (VSA) than adults. Similarly, Pettinato et al., (2016) showed that children
aged 9-14 had enlarged VSAs compared to adults. It is important to remember that VSA is
based on target formant values for the corner vowels /i, æ, ɑ, u/ while VSDn is based on the
formant frequencies where speakers spend the most amount of time during connected speech.
Therefore, the direct comparison of the two measures should be done cautiously.
One possibility for the discrepant and inconsistent trajectory is that as children continue
to develop as communicators, they may subconsciously or consciously neglect making changes
to the vowel space in favor of devoting cognitive resources to making other modifications they
may perceive as more helpful to producing clear speech (e.g., increasing intensity, increasing
fundamental frequency, and increasing harmonic energy). This may be further supported by the
significant increases in participants’ CPPS averages in experimental conditions. Higher CPPS

38
values indicate that children’s voices had stronger, more robust harmonic energy when instructed
to speak clearly. An alternative explanation could be based on findings from Pettinato et al.
(2016) and Syrett and Kawahara (2013) that children produced larger VSAs than adults to begin
with. It is plausible, then, that children’s reduction in VSDn measures in experimental conditions
is actually an attempt to approximate adults’ values, and is a clear speech strategy.
III. Summary
This study measured the acoustic modifications that children aged 6-10 made in
connected speech when instructed to speak clearly in HIDS and in the presence of noise. The
speech tasks were conversation- and activity-based, which placed talkers in communicative
contexts that are representative of everyday situations and more ecologically valid than previous
investigations which have analyzed acoustic adjustments that children made in similar conditions
at the word level. Our analysis found that, as expected, the most meaningful and adult-like
adjustments were made in response to noise, and that the measures in the HIDS condition were
not usually distinct from the control condition. The most notable trends included the emergence
of adult-like clear speech modifications of significantly increasing fo and intensity in noise.
However, the children in this sample did not exhibit the ability to increase VSDn and did not
significantly decrease articulation rate in either of the experimental conditions. To our
knowledge, this study provided the first instantiation of this age group’s clear speech
modifications in these conditions. Clear speech modifications require considerable cognitive
prowess and the integration of fine motor and sensory mechanisms (Perkell, 2012). Children are
known to be in the process of developing mastery with these processes. It seems evident from
their clear speech modifications that this is another manifestation of their emergent fine-motor
and sensory integration skills, as has been previously suggested (Pettinato et al., 2016).

39
»Limitations:
The most pervasive limitation of this study was the size and profile of the sample size.
The small sample size limited the power of our results as well as the likelihood that they can be
generalized to larger groups of children aged 6-10. Of course, it is not possible to rule out the
many possibilities that different results would have been observed had the sample size included
more participants and individuals who were from geographical areas outside of Arizona or the
United States. Furthermore, the results could have been skewed by the unequal distribution of
ages in the sample size, and may have resulted in different effects if an equal number of children
from each age had been included in the sample. A caveat to this is that previous investigations
have focused on making conjectures about the behaviors of age groups (e.g., ages 9-14 or 19-24)
rather than at specific ages (e.g., ages 9, 10, and 11), and it remains to be seen if it could be
scientifically or clinically useful to be able to plot a trajectory of clear speech modifications by
age (Pettinato et al., 2016; Baxter, 2016).
Another limitation was that no listener judgments were made to clarify what effect
participants’ adjustments to speech produced in experimental conditions had on intelligibility or
influenced perceptions of clear speech. Thus, no speculation can be made about whether making
adult-like acoustic modifications truly resulted in clear speech benefits or that some of the
children’s idiosyncratic patterns caused them to be perceived as less intelligible. Furthermore,
the current study’s design did not include a condition that would have permitted the assessment
of how children might have responded to specific prompting (e.g., talk louder, talk slower, etc.).
Accordingly, these results are unable to suggest that children aged 6-10 are incapable of
producing a complete profile of adult-like clear speech adjustments, only that the participants in
this sample did not do so spontaneously –results that had not yet been observed. These results

40
could have also been impacted by the presence of an unfamiliar interlocutor and different results
might have been obtained had the talkers been required to complete the speech tasks in age-
matched pairs or with familiar communication partners. Along those lines, the measures in the
HI condition could have been more distinct from control had the talkers completed the speech
tasks with individuals who truly had hearing impairments. Finally, though all children in the
study were judged to be typically developing by the absence of previous diagnoses of
communication disorders and were judged to have normal hearing thresholds by passing a
hearing screen, there exists the possibility that younger children might not have been able to
comprehend what was being asked of them in the experimental conditions.
»Clinical Implications
This study found that children exhibit emergent adult-like patterns in the presence of
noise, but overall do not spontaneously make the same adjustments that adults do. This suggests
that children in this age group likely require explicit instructions on how to modify their speech
in ways that are known to accommodate someone with a hearing impairment. This has important
implications for training children to be successful communication partners with their classmates,
family members, and other peers who have difficulty hearing. A second population for whom
these results have important implications are children with fluency disorders. If the results
obtained in this study turn out to be representative of children aged 6-10 in general, it is possible
that children with fluency disorders may also increase articulation rate, intensity, and
fundamental frequency when instructed simply to speak clearly without specification. Such
modifications run counter to typical expectations for stuttering modifications and fluency
enhancers (Ramig & Dodge, 2005). These findings are also applicable to children with cerebral

41
palsy and dysarthria who seek to improve intelligibility using clear speech targets. More specific
instructions may benefit these populations as well.
»Future Directions
Future studies that seek to better understand the modifications that children aged 6-10
make in similar experimental conditions should account for the limitations described above.
Most importantly, it is recommended that studies include a larger sample size to understand the
degree to which the trends observed in this study generalize to the age group. Further clarity
could be added if such studies also included a between-group comparison to the adjustments that
adult participants make in identical experimental conditions. Another logical step would be to
describe what effects these modifications have on listener judgments, and to specifically
compare whether children receive significantly lower clear speech ratings from adults who are
typically developing and/or hearing impaired. Moreover, now that there is at least tentative
evidence that children exhibit the emergence of some adult-like clear speech modifications
without explicit instructions, future studies could elucidate whether children can produce these
adjustments to larger degrees after receiving explicit instructions, whether such instructions
instigate the production other adult-like adjustments that were not observed in this study, and
probe children’s awareness of any clear speech strategies they use. Finally, the onus is on future
investigators to maintain the emphasis on understanding clear speech strategies that children
make in connected speech while completing tasks that are ecologically valid and
developmentally appropriate for this age group. Future research that accounts for these
limitations and maintains these foci will help contribute to a broader understanding of the
development of clear speech strategies throughout childhood and adolescence.
42
References
Baker, R., & Hazan, V. (2011). DiapixUK: Task materials for the elicitation of multiple
spontaneous speech dialogs. Behavior Research Methods, 43(3), 761-770.
doi:10.3758/s13428-011-0075-y
Baxter, A. Y. O. (2016). Effects of instruction and background noise on production of clear
speech. Tucson, Arizona: University of Arizona.
Beukelman, D. R., Fager, S., Ullman, C., Hanson, E., & Logemann, J. (2002). The impact of
speech supplementation and clear speech on the intelligibility and speaking rate of people
with traumatic brain injury. Journal of Medical Speech-Language Pathology, 10(4), 237-
242.
Boersma, Paul & Weenink, David (2016). Praat: doing phonetics by computer [Computer
program]. Version 6.0.24, retrieved 23 January 2017 from http://www.praat.org/
Bonferroni, C. E., Teoria statistica delle classi e calcolo delle probabilità, Pubblicazioni del R
Istituto Superiore di Scienze Economiche e Commerciali di Firenze 1936
Bradlow, A. R., Kraus, N., & Hayes, E. (2003). Speaking clearly for children with learning
disabilities: Sentence perception in noise. Journal of Speech, Language, and Hearing
Research, 46(1), 80-97. doi:10.1044/1092-4388(2003/007)
Caissie, R., McNuttn Campbell, M., Frenette, W. L., Scott, L., Howell, I., & Roy, A. (2005).
Clear speech for adults with a hearing loss: Does intervention with communication
partners make a difference?. Journal of the American Academy of Audiology, 16(3), 157-
171.
43
Cooke, M., King, S., Garnier, M., & Aubanel, V. (2014). The listening talker: A review of
human and algorithmic context-induced modifications of speech. Computer Speech and
Language, 28(2), 543-571. doi:10.1016/j.csl.2013.08.003
Dykstra, A. D., Adams, S. G., & Jog, M. (2012). The effect of background noise on the speech
intensity of individuals with hypophonia associated with Parkinson's disease. Journal of
Medical Speech-Language Pathology, 20(3), 19-31.
Etymotic Research (2001). QuickSIN Speech in Noise Test Version 1.3. Elk Grove Village, IL
Ferguson, S. H., & Kewley-Port, D. (2007). Talker differences in clear and conversational
speech: Acoustic characteristics of vowels. Journal of Speech, Language, and Hearing
Research, 50(5), 1241-1255.
Ferguson, S. H., Poore, M. A., Shrivastav, R., Kendrick, A., McGinnis, M., & Perigoe, C.
(2010). Acoustic correlates of reported clear speech strategies. Journal of the Academy of
Rehabilitative Audiology, 43, 45-64.
Hazan, V., Markham, D., 2004. Acoustic–phonetic correlates of talker intelligibility for adults
and children. The Journal of the Acoustical Society of America, 116, 3108–3118.
Hazan, V., Grynpas, J., & Baker, R. (2012). Is clear speech tailored to counter the effect of
specific adverse listening conditions?. The Journal of the Acoustical Society of America,
132(5), EL371-EL377.
Hillenbrand J., Houde, R. A. (1996) Acoustic correlates of breathy vocal quality: Dysphonic
voices and continuous speech. Journal of Speech, Language, and Hearing Research, 39,
311–321.
44
Krause, J. C., & Braida, L. D. (2004). Acoustic properties of naturally produced clear speech at
normal speaking rates. The Journal of the Acoustical Society of America, 115(1), 362-
378.
Kuhl, P.K., Andruski, J.E., Chistovich, I.A., Chistovich, L.A., Kozhevnikova, E.V., Ryskina,
V.L. et al. Cross-language analysis of phonetic units in language addressed to infants.
Science, 277 (5326) (1997), pp. 684–686
http://dx.doi.org.ezproxy2.library.arizona.edu/10.1126/science.277.5326.684
Lam, J., & Tjaden, K. (2013). Intelligibility of clear speech: Effect of instruction. Journal of
Speech, Language, and Hearing Research, 56(5), 1429-1440.
Lindblom, B. (1990). On the communication process: Speaker-listener interaction and the
development of speech. Augmentative and Alternative Communication, 6(4), 220-230.
doi:10.1080/07434619012331275504
Lombard, E., 1911. Le signe d’élévation de la voix [The sign of the elevation of the voice].
Annales des maladies de l’oreille et du larynx, 37, 101–119.
Mahl, G. People talking when they can’t hear their voices. Siegman, A., Pope, B. (Eds.). (1972),
Studies in dyadic communication. New York, NY: Pergamon Press.
MATLAB Release 2017, The MathWorks, Inc., Natick, Massachusetts, United States.
Park, S., Theodoros, D., Finch, E., & Cardell, E. (2016). Be Clear: A New Intensive Speech
Treatment for Adults with Nonprogressive Dysarthria. American Journal of Speech-
Language Pathology, 25(1), 97-110.
Perkell, J. S. (2012). Movement goals and feedback and feedforward control mechanisms in
speech production. Journal of Neurolinguistics, 25(5), 382-407.
doi:10.1016/j.jneuroling.2010.02.011
45
Pettinato, M., Tuomainen, O., Granlund, S., & Hazan, V. (2016). Vowel space area in later
childhood and adolescence: Effects of age, sex and ease of communication. Journal of
Phonetics, 54, 1-14. doi:10.1016/j.wocn.2015.07.002
Picheny, M. A., Durlach, N. I., & Braida, L. D. (1985). Speaking Clearly for the Hard of Hearing
Intelligibility Differences between Clear and Conversational Speech. Journal of Speech,
Language, and Hearing Research, 28(1), 96-103.
Ramig, P. R., 1946, & Dodge, D. (2005). The child and adolescent stuttering treatment and
activity resource guide. Clifton Park, NY: Thomson Delmar Learning.
Redford, M.A. & Gildersleeve-Neumann, C.E. (2007). Children's clear speech suggests word-
level targets: Preliminary evidence. In J. Trouvain, W.J. Barry (Eds.), Proceedings from
the 16th International Congress of Phonetic Sciences, pp. 365–368.
Redford, M. A., & Gildersleeve-Neumann, C. E. (2009). The development of distinct speaking
styles in preschool children. Journal of Speech, Language, and Hearing Research, 52(6),
1434–1448.
Schum, D.J., 1996. Intelligibility of clear and conversational speech of young and elderly talkers.
Journal of the American Academy of Audiology, 7, 212–218.
Smiljanic, R., Bradlow, A.R., 2005. Production and perception of clear speech in Croatian and
English. The Journal of the Acoustical Society of America, 118, 1677–1688.
Story, B.H., and Bunton, K. (2016). Formant measurement in children's speech based on spectral
filtering, Speech Communication, 76, 93-111.
http://dx.doi.org/10.1016/j.specom.2015.11.001

46
Story, B. H., and Bunton, K., (2017). An acoustically-driven vocal tract model for stop
consonant production, Speech Communication, 87, 1-17. Final version published online:
20-Dec-2016. DOI information: 10.1016/j.specom.2016.12.001.
Syrett, K., & Kawahara, S. (2013). Production and perception of listener-oriented clear speech in
child language. Journal of Child Language, 14(6), 1–17.
Titze, I. R., Horii, Y., & Scherer, R. C. (1987). Some technical considerations in voice
perturbation measurements. Journal of Speech, Language, and Hearing Research, 30(2),
252-260.
Uchanski, R.M., Choi, S.S., Braida, L.D., Reed, C.M., Durlach, N.I., 1996. Speaking clearly for
the hard of hearing IV: further studies of the role of speaking rate. Journal of Speech and
Hearing Research, 39, 494–509.
Uchanski, R. M., Geers, A. E., & Protopapas, A. (2002). Intelligibility of modified speech for
young listeners with normal and impaired hearing. Journal of Speech, Language, and
Hearing Research, 45(5), 1027-1038. doi:10.1044/1092-4388(2002/083).

47
Appendix A: Voice range density plots for individual talkers
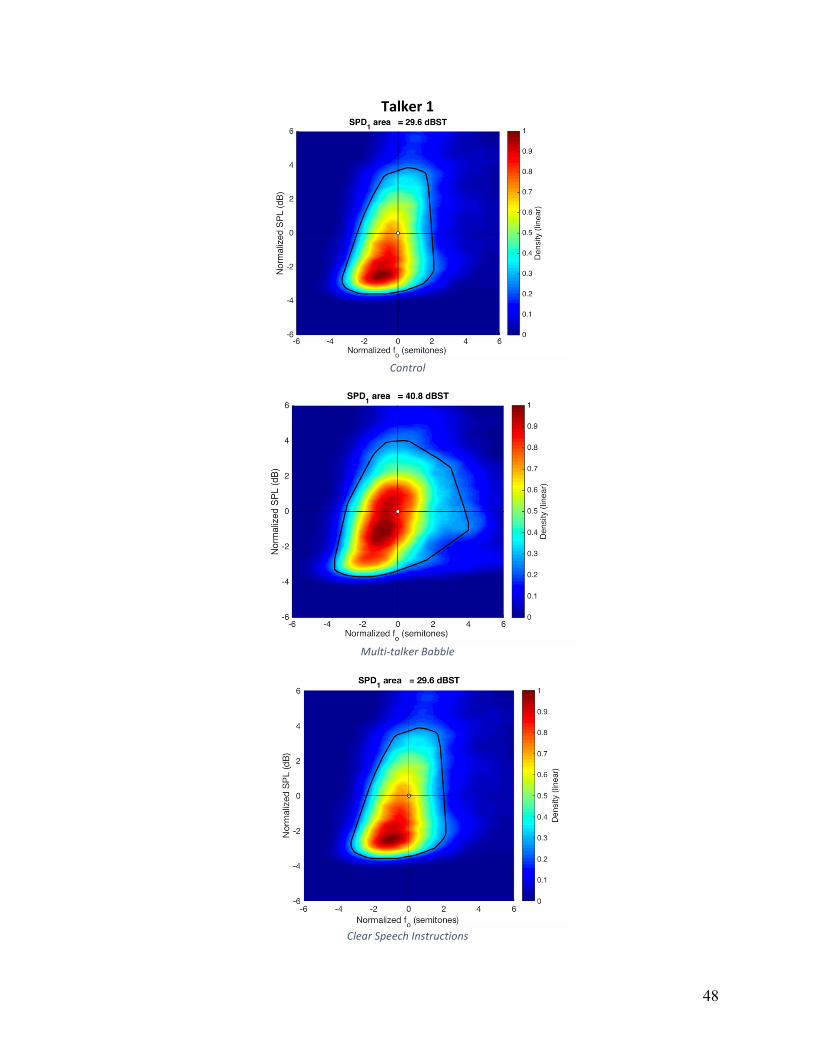
48
Talker1
Control
Multi-talkerBabble
ClearSpeechInstructions
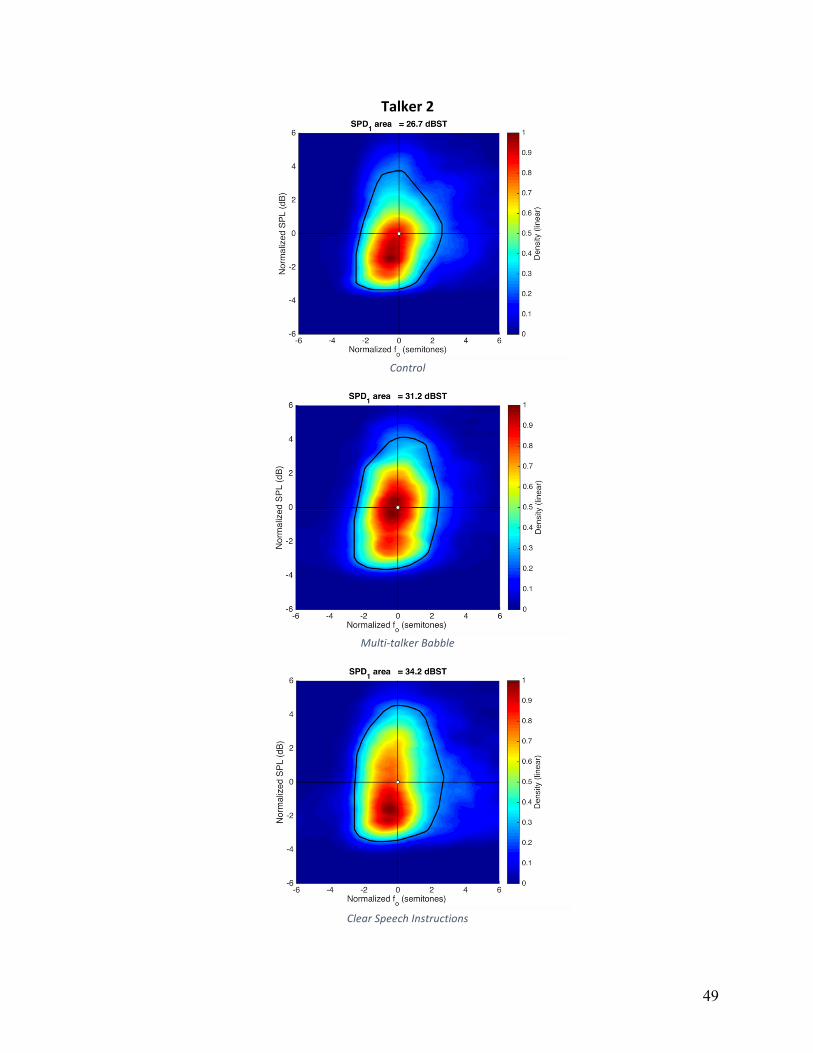
49
Talker2
Control
Multi-talkerBabble
ClearSpeechInstructions
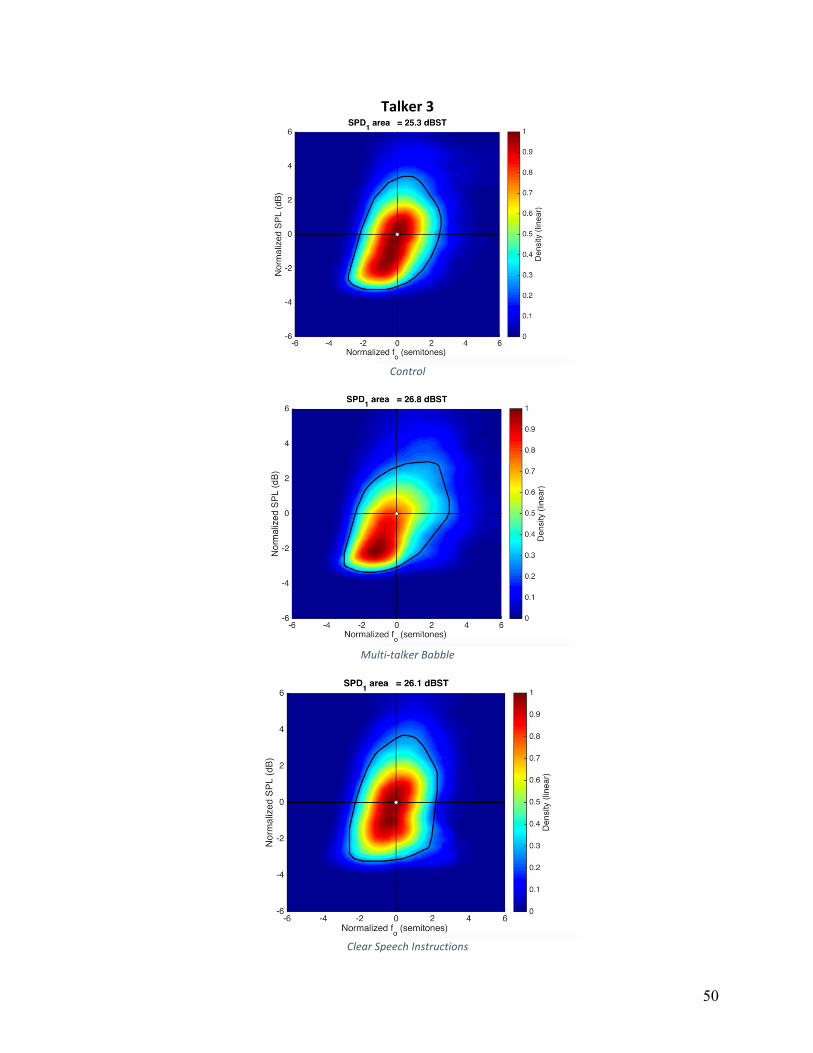
50
Talker3
Control
Multi-talkerBabble
ClearSpeechInstructions
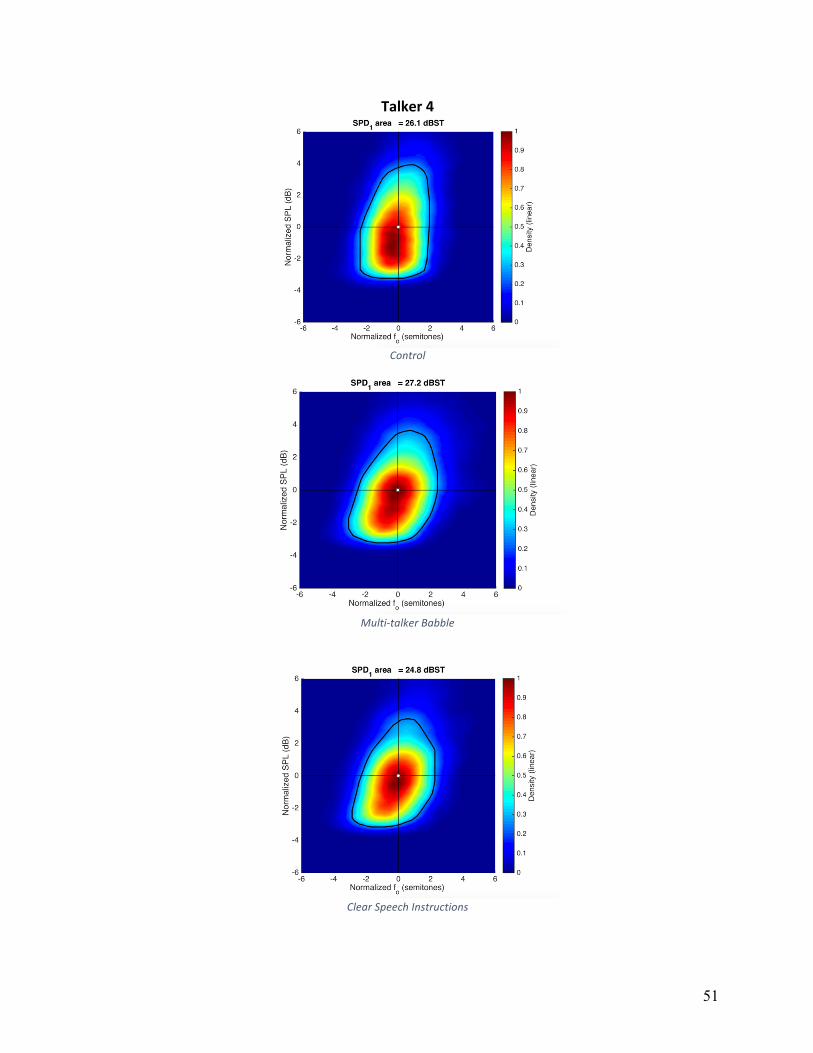
51
Talker4
Control
Multi-talkerBabble
ClearSpeechInstructions
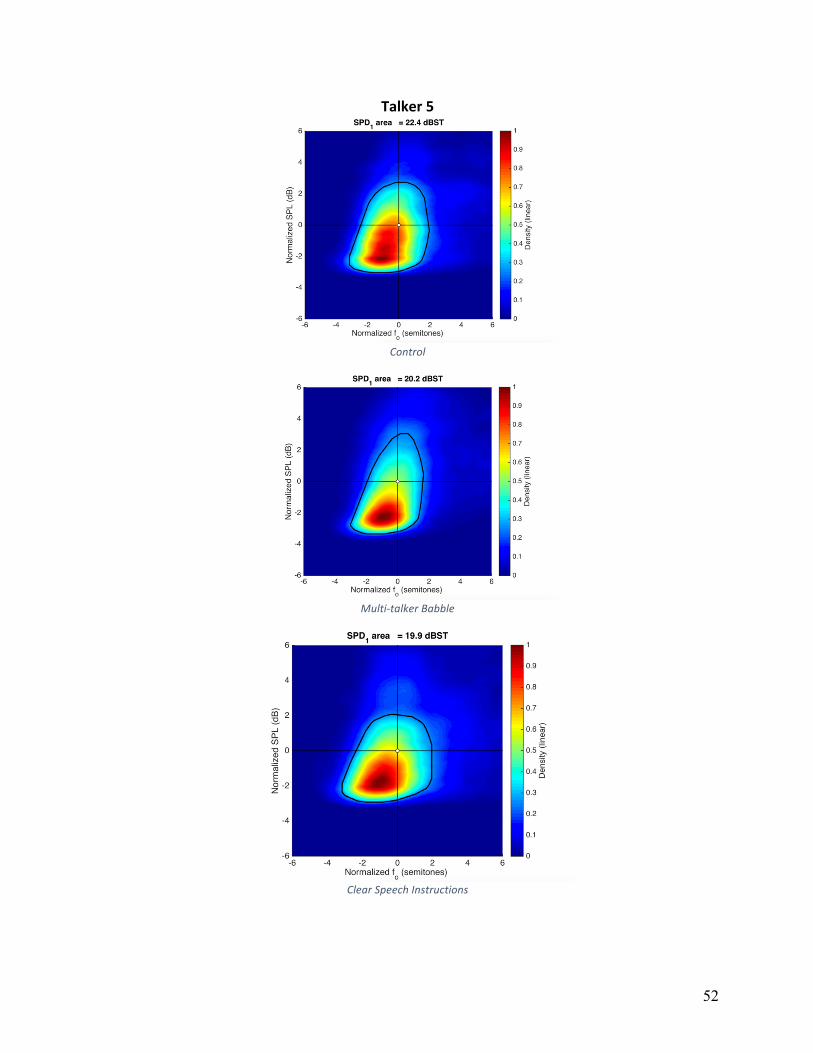
52
Talker5
Control
Multi-talkerBabble
ClearSpeechInstructions
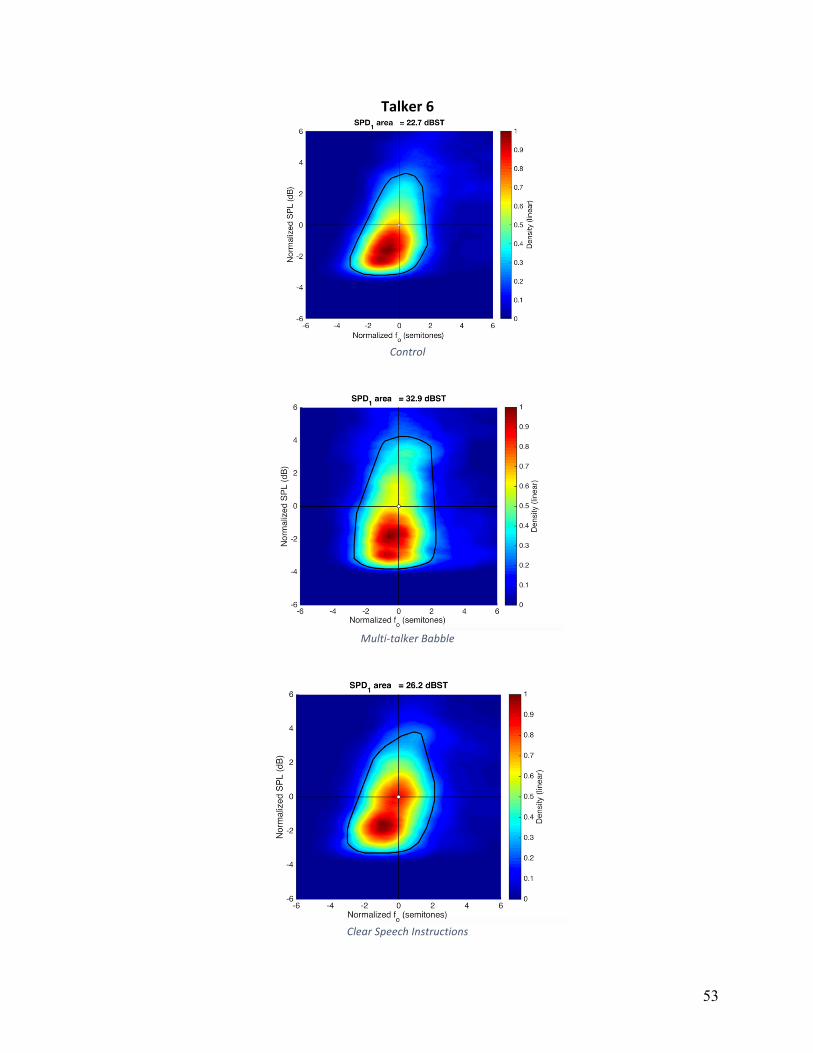
53
Talker6
Control
Multi-talkerBabble
ClearSpeechInstructions
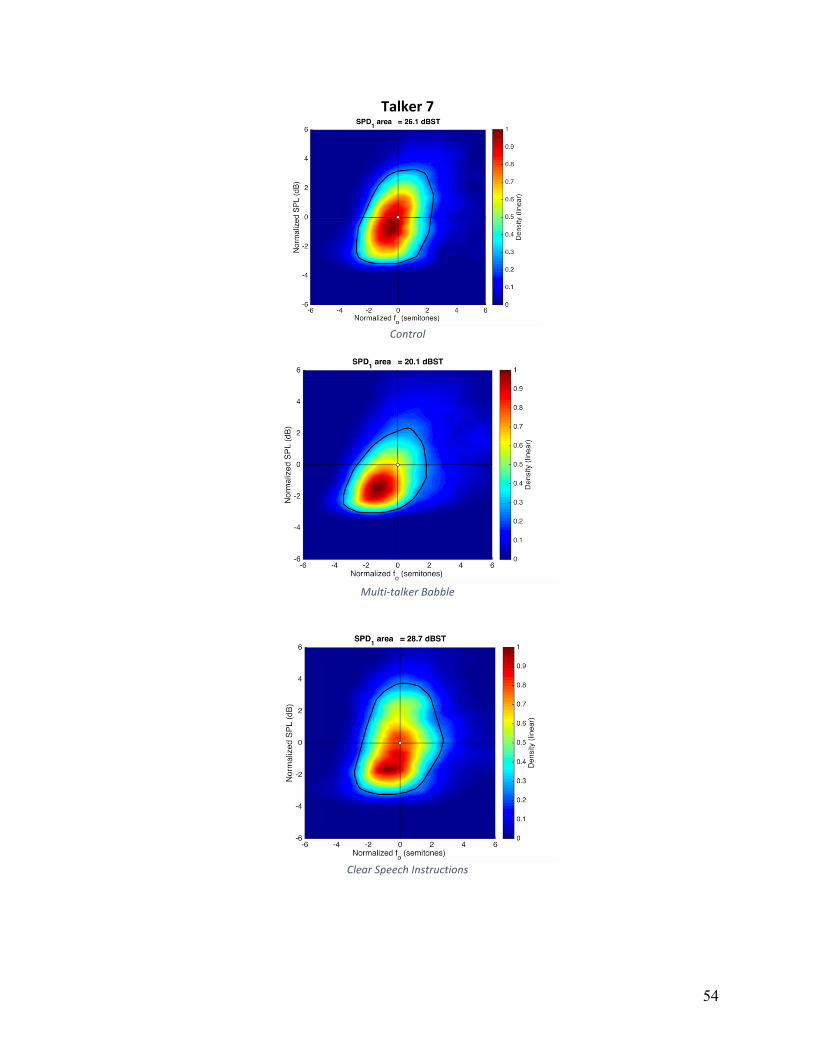
54
Talker7
Control
Multi-talkerBabble
ClearSpeechInstructions

55
Talker8
Control
Multi-talkerBabble
ClearSpeechInstructions
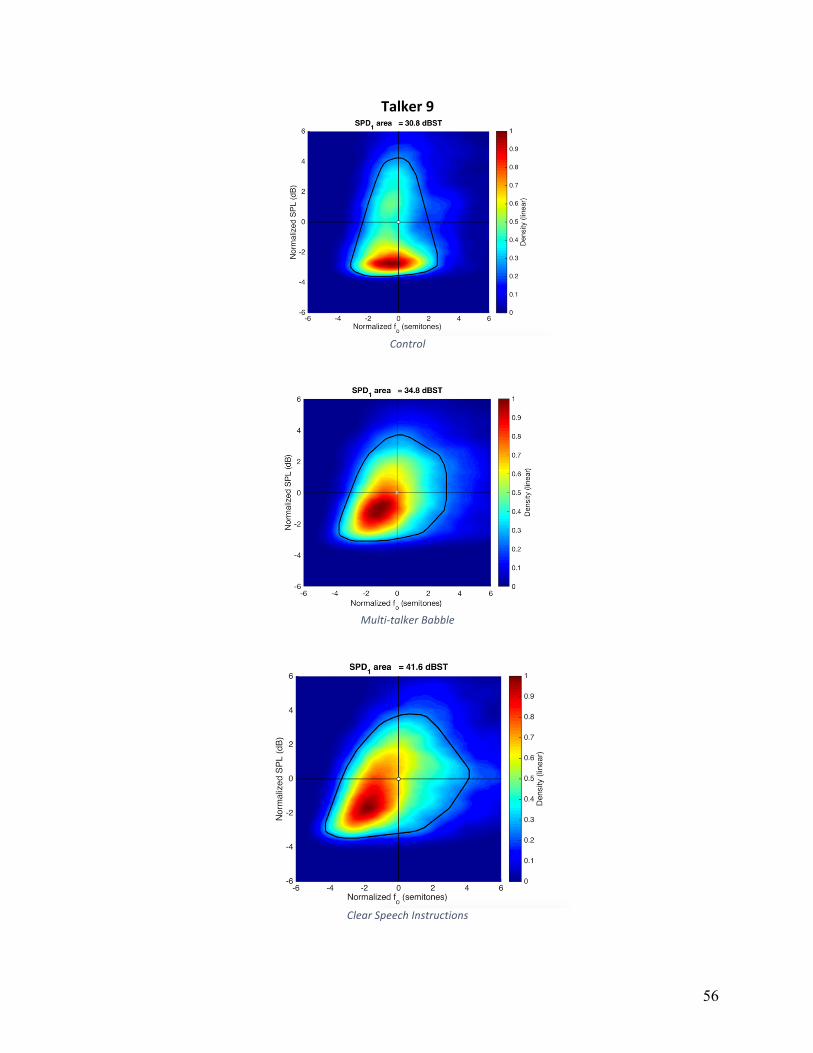
56
Talker9
Control
Multi-talkerBabble
ClearSpeechInstructions

57
Appendix B: Vowel space area plots for individual talkers
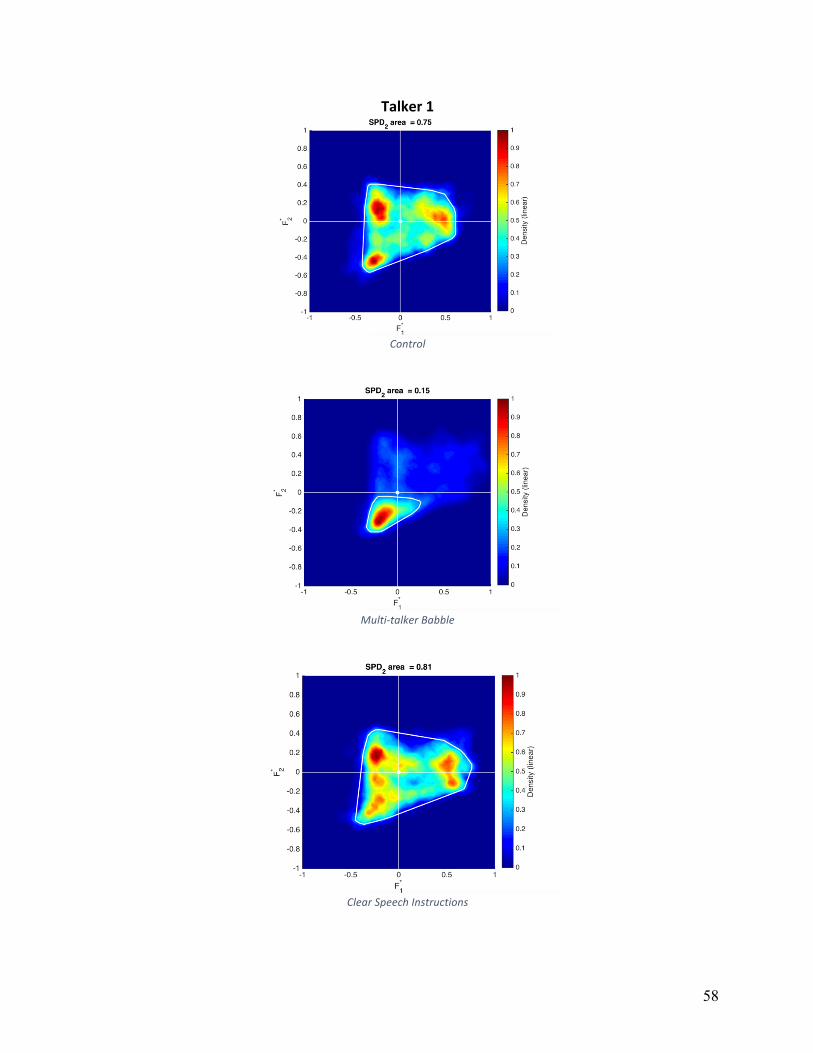
58
Talker1
Control
Multi-talkerBabble
ClearSpeechInstructions
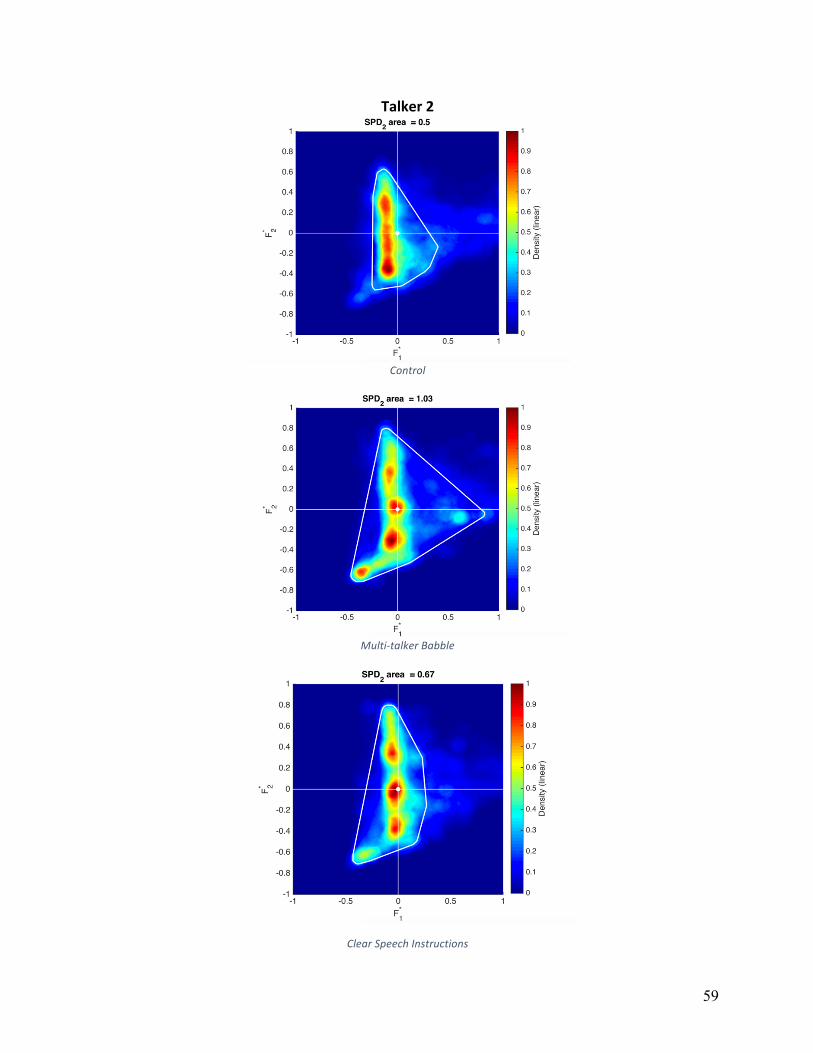
59
Talker2
Control
Multi-talkerBabble
ClearSpeechInstructions
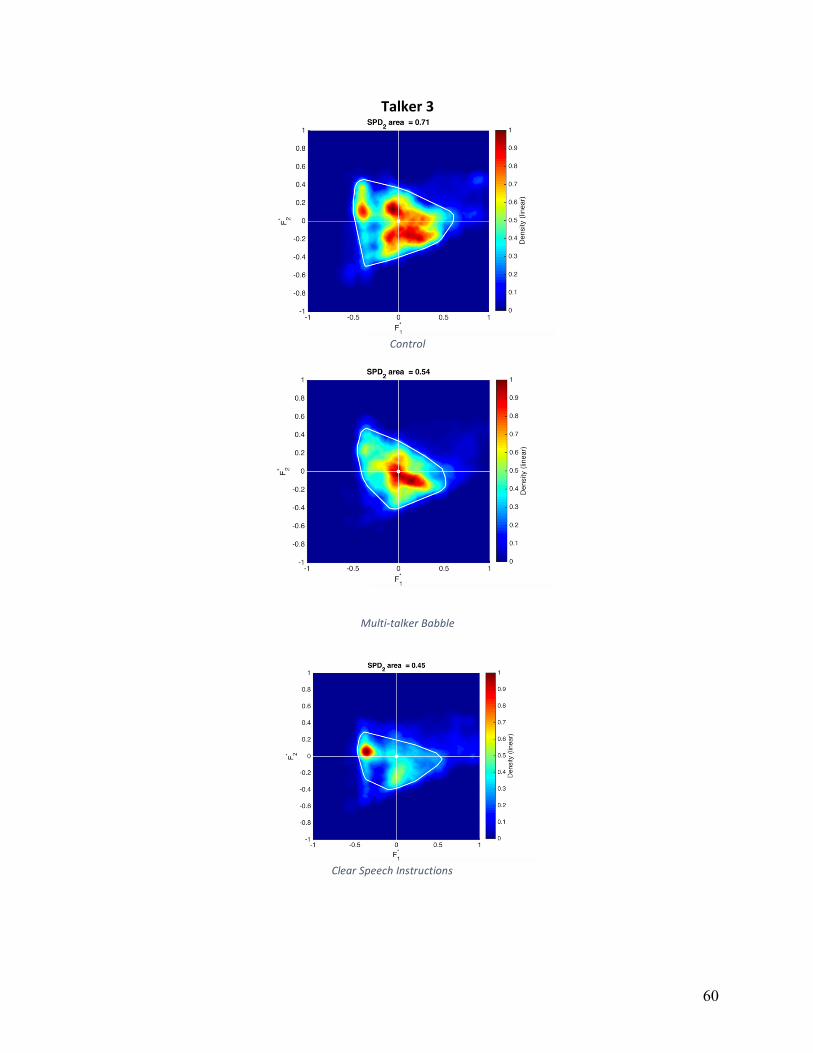
60
Talker3
Control
Multi-talkerBabble
ClearSpeechInstructions
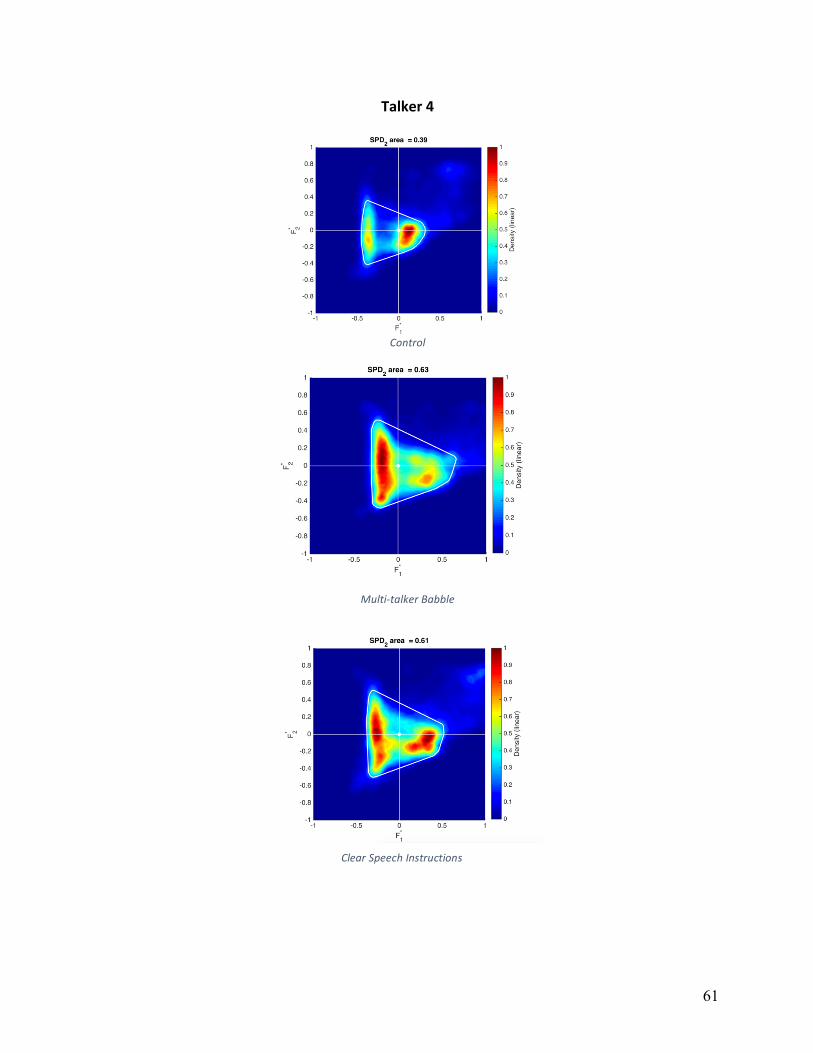
61
Talker4
Control
Multi-talkerBabble
ClearSpeechInstructions
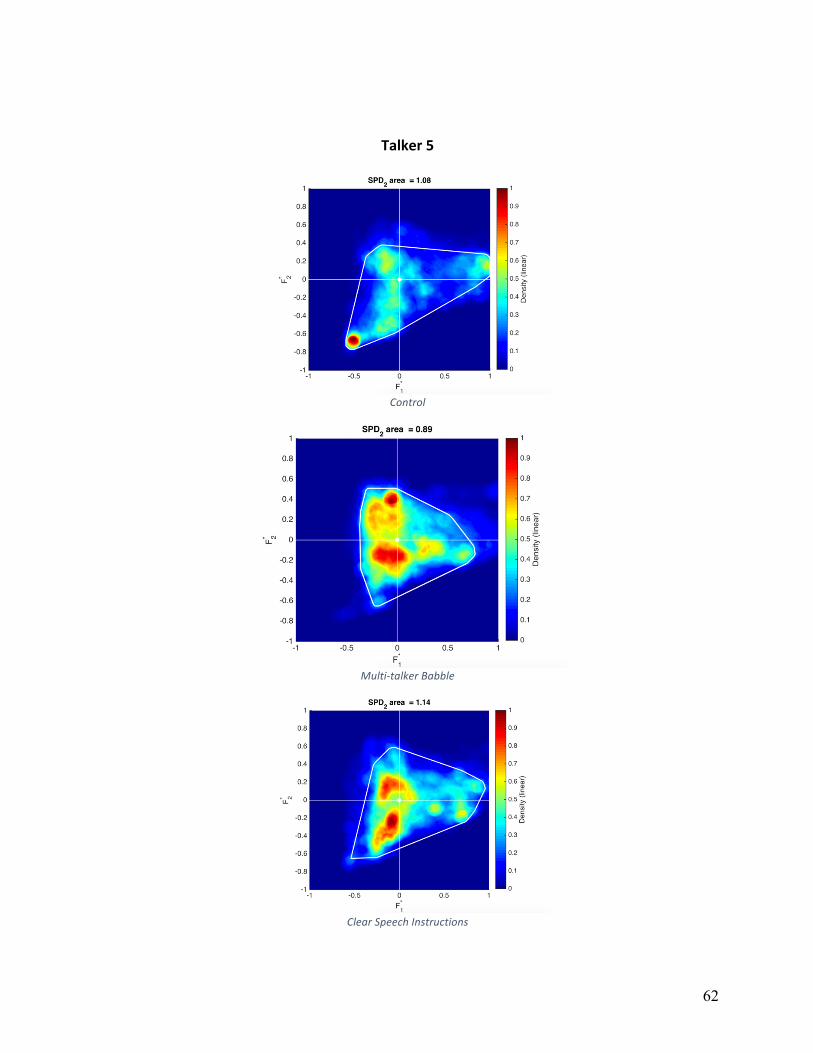
62
Talker5
Control
Multi-talkerBabble
ClearSpeechInstructions

63
Talker6
Control
Multi-talkerBabble
ClearSpeechInstructions
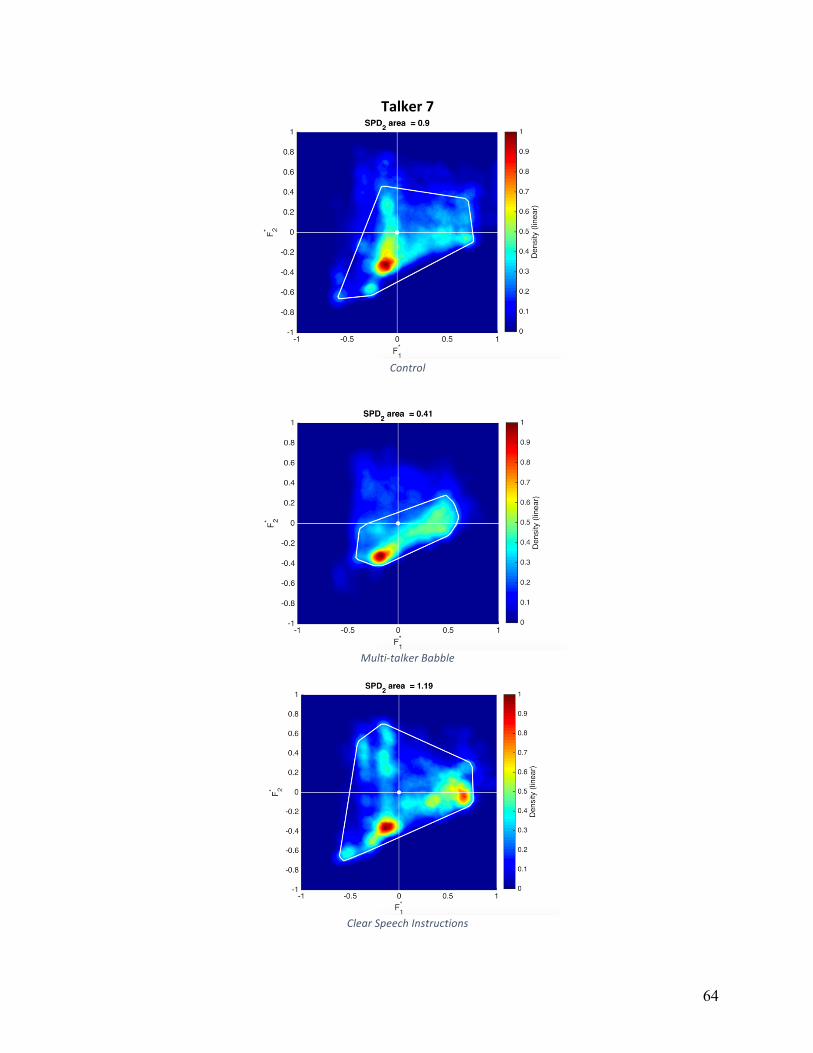
64
Talker7
Control
Multi-talkerBabble
ClearSpeechInstructions

65
Talker8
Control
Multi-talkerBabble
ClearSpeechInstructions

66
Talker9
Conversation
Multi-talkerBabble
ClearSpeechInstructions