Investigating the Salient Characteristics of Clear Speech ...
66
Investigating the Salient Characteristics of Clear Speech that Contribute to Improved Speech Perception by Katherine E. McNeilly Communication Science, School of Health and Rehabilitation Science, 2017 Submitted to the Graduate Faculty of Katherine McNeilly in partial fulfillment of the requirements for the degree of Bachelor of Philosophy University of Pittsburgh 2017
Transcript of Investigating the Salient Characteristics of Clear Speech ...

UNIVERSITY OF PITTSBURGH
School of Health and Rehabilitation Science
This thesis was presented
Investigating the Salient Characteristics of Clear Speech that Contribute to Improved Speech Perception
by
Katherine E. McNeilly
Communication Science, School of Health and Rehabilitation Science, 2017
Submitted to the Graduate Faculty of
Katherine McNeilly in partial fulfillment
of the requirements for the degree of
Bachelor of Philosophy
University of Pittsburgh
2017

ii
UNIVERSITY OF PITTSBURGH
SCHOOL OF HEATH AND REHABILITATION SCIENCES
This Thesis was presented
by
Katherine Elise McNeilly
It was defended on
April 14, 2017
Christopher Brown, PhD., Communication Science and Disorders, University of Pittsburgh
Sheila Pratt, PhD., Communication Science and Disorders, University of Pittsburgh
Laurie Heller, PhD., Psychology, Carnegie Mellon University
Thesis Advisor: Catherine Palmer, PhD., Communication Science and Disorders, University of
Pittsburgh

iii
Copyright © by Katherine Elise McNeilly
2017

iv
Clear speech is one strategy used to promote successful communication strategy with people
who have hearing loss. It occurs naturally and is more intelligible than speech used in
conversational settings. However, the aspect of clear speech that makes it more intelligible than
conversational speech is unknown. The aim of this study is to investigate the importance of clear
speech formant contours. By hybridizing a conversational speech carrier sentence with a clear
speech formant contour at a vowel-nasal transition in a target word, it will be determined
whether clear speech formant contours impact the way normally hearing listeners understand an
otherwise conversational speech sentence.
A total of 30 normally hearing subjects between the ages of 18 and 32 participated in this
study. Participants listened to 30 clear, conversational, and manipulated sentences presented in
Sine Wave Speech and were asked to identify the last word in the sentences out of four multiple
choice answers. Participants responses were scored for number correct out of 10 for each of the 3
conditions. The results indicated no difference in identification between the conditions. Formant
contour as an isolated cue as presented in this study does not appear to differentiate clear and
conversational speech.
Investigating the Salient Characteristics of Clear Speech that Contribute to Improved Speech Perception
Katherine Elise McNeilly
University of Pittsburgh, 2017

v
TABLE OF CONTENTS
ACKNOWLEDGMENTS ....................................................................................................... VIII
1.0 INTRODUCTION ........................................................................................................ 1
1.1 CLEAR SPEECH: CHARACTERISTICS ....................................................... 2
1.2 HYBRIDIZATION OF WAVES ........................................................................ 8
1.3 SINE WAVE SPEECH........................................................................................ 9
2.0 CURRENT STUDY ................................................................................................... 13
2.1 SPECIFIC AIMS ............................................................................................... 13
2.2 HYPOTHESIS ................................................................................................... 14
3.0 METHOD ................................................................................................................... 15
3.1 SPEECH STIMULI ........................................................................................... 15
3.1.1 r-SPIN Sentences ........................................................................................... 15
3.1.2 Manipulated Speech Hybridization ............................................................. 18
3.1.3 Sine Wave Speech Manipulation .................................................................. 21
3.2 PARTICIPANTS ............................................................................................... 21
3.2.1 Recruitment .................................................................................................... 22
3.3 PROCEDURE .................................................................................................... 22
3.3.1 Screening Procedures .................................................................................... 22
3.3.2 Experimental Tasks ....................................................................................... 23

vi
3.3.2.1 Part 1: Word Identification Task with Feedback ............................ 23
3.3.2.2 Part 2: Word Identification Task without Feedback ....................... 24
4.0 RESULTS ................................................................................................................... 27
5.0 DISCUSSION ............................................................................................................. 30
6.0 SUMMARY AND CONCLUSION ........................................................................... 33
APPENDIX A .............................................................................................................................. 35
APPENDIX B .............................................................................................................................. 37
REFERENCES ............................................................................................................................ 53

vii
LIST OF TABLES
Table 1. mean and standard deviation values of clear and conversational recordings of low-
predictability r-SPIN sentences (Ortmann, 2012). ........................................................................ 16
Table 2. Target words organized by nasal sound .......................................................................... 17
Table 3. Target words organized by vowel sound. ....................................................................... 18
Table 4. Example of stimuli presentation and response. .............................................................. 24
Table 5. Stimuli presented to subjects to ensure that no subjects heard the same key word twice.
....................................................................................................................................................... 26
Table 6. Comparison of methodology between the Amano-Kusumoto et al (2014) study and the
current study.................................................................................................................................. 32
Table 7. Individual Subject Data .................................................................................................. 36

viii
LIST OF FIGURES
Figure 1. Spectrogram of the naturally spoken, clear speech sentence, “Ruth’s grandmother
discussed the broom.” ................................................................................................................... 11
Figure 2. Spectrogram of the clear, Sine Wave Speech sentence, “Ruth’s grandmother discussed
the broom.” ................................................................................................................................... 12
Figure 3. Spectrogram of clear speech sentence “Ruth’s grandmother discussed the broom.” with
the formant contour to be extracted circled. ................................................................................. 19
Figure 4. Spectrogram of conversational speech sentence “Ruth’s grandmother discussed the
broom.” with the formant contour to be replaced circled. ............................................................ 20
Figure 5. mean number of words identified correctly by condition. Chance performance is
represented by the solid line (2.5). ................................................................................................ 28
Figure 6. Histogram of the number of clear, conversational, and manipulated words identified
correctly by subjects. .................................................................................................................... 29
Figure 7. Histogram of participant responses for the target word “Aim” ..................................... 37
Figure 8. Histogram of participant responses for the target word “Bench”.................................. 38
Figure 9. Histogram of participant responses for the target word “Bend” ................................... 38
Figure 10. Histogram of participant responses for the target word “Broom” ............................... 39
Figure 11. Histogram of participant responses for the target word “Bone” ................................. 39
Figure 12. Histogram of participant responses for the target word “Drain” ................................. 40

ix
Figure 13. Histogram of participant responses for the target word “Flame” ................................ 40
Figure 14. Histogram of participant responses for the target word “Foam”
....................................................................................................................................................... 41
Figure 15. Histogram of participant responses for the target word “Fun”.................................... 41
Figure 16. Histogram of participant responses for the target word “Gang” ................................. 42
Figure 17. Histogram of participant responses for the target word “Grain” ................................. 42
Figure 18. Histogram of participant responses for the target word “Grin” .................................. 43
Figure 19. Histogram of participant responses for the target word “Gum” .................................. 43
Figure 20. Histogram of participant responses for the target word “Hint” ................................... 44
Figure 21. Histogram of participant responses for the target word “Hint” ................................... 44
Figure 22. Histogram of participant responses for the target word “Lamp” ................................ 45
Figure 23. Histogram of participant responses for the target word “Lungs” ................................ 46
Figure 24. Histogram of participant responses for the target word “Mink” ................................. 46
Figure 25. Histogram of participant responses for the target word “Pond”.................................. 47
Figure 26. Histogram of participant responses for the target word “Rent” .................................. 47
Figure 27. Histogram of participant responses for the target word “Rim” ................................... 48
Figure 28. Histogram of participant responses for the target word “Scream” .............................. 48
Figure 29. Histogram of participant responses for the target word “Screen” ............................... 49
Figure 30. Histogram of participant responses for the target word “Skunk”................................ 49
Figure 31. Histogram of participant responses for the target word “Spoon”................................ 50
Figure 32. Histogram of participant responses for the target word “Stamp”................................ 50
Figure 33. Histogram of participant responses for the target word “Steam” ................................ 50
Figure 34. Histogram of participant responses for the target word “Swan” ................................. 51

x
Figure 35. Histogram of participant responses for the target word “Van” ................................... 51
Figure 36. Histogram of participant responses for the target word “Bomb” ................................ 52

xi
ACKNOWLEDGMENTS
The completion of this project would not have been possible without the support and guidance of
my research advisor, Dr. Catherine Palmer. Thank you for taking the time to share your
knowledge with me. I am grateful to Dr. Brown for his advice and technical assistance on this
project. Thank you to my committee for their willingness to be a part of this process and to
everyone in the Auditory Processing Lab for their support throughout the past 2 years.

1
1.0 INTRODUCTION
Speech perception challenges are one of the most common issues individuals face when they lose
hearing later in life. Twenty-five percent of people over the age of 65 have disabling hearing loss
("Quick Statistics about Hearing," 2016). This aging population is growing, where by 2060, we
will be twice the number of adults 65 or older than in 2014 (Administration of Aging, 2016).
Permanent hearing loss is not medically treatable but rather managed with amplification devices.
Currently, less than 30% of older adults who need amplification devices obtain hearing aids
("Quick Statistics about Hearing," 2016). Because the most common form of permanent hearing
loss is sensorineural, damage to the inner ear or neural pathways to the brain, individuals using
amplification devices still struggle in complex listening environments. In the 21st century,
hearing loss has become a public health concern with untreated hearing loss leading to
underemployment, depression, and social isolation (Bess, Lichtenstein, Logan, Burger, &
Nelson, 1989; Chang-Quan, Bi-Rong, Zhen-Chan, Ji-Rong, & Qing-Xiu, 2010; Kochkin &
Rogin, 2000; Mick, Foley, & Lin, 2014).
Clear speech is one strategy used to promote successful communication. It is the speech
commonly used when speaking to individuals with hearing loss when the goal is to be
understood. It occurs naturally in humans and is more intelligible than speech used in
conversational settings (Picheny, Durlach, & Braida, 1985). By identifying the salient
characteristics of clear speech that contribute to improved speech perception, this information

2
could be applied to auditory training programs or technology development. This could benefit
people with hearing loss and their communication partners and potentially impact signal
processing design in amplification devices.
.
1.1 CLEAR SPEECH: CHARACTERISTICS
Clear Speech is a speaking style commonly used with people who have hearing loss. It has been
widely recognized as having an intelligibility advantage regardless of listener (Picheny, Durlach,
& Braida, 1985). Clear speech is often differentiated from Conversational Speech, which is the
typical speaking style used in conversation because the two communication styles differ in many
of their acoustic properties. Clear speech is significantly louder in volume, slower in rate, and
contains longer pauses between words and between phonemes within words (Picheny, Durlach,
& Braida, 1985). Much of the literature written about Clear Speech has focused on examining its
differences from conversational speech and analyzing it acoustically to identify what produces
increased intelligibility.
Picheny, Durlach, and Braida were some of the first in their field to report the
characteristics that make clear speech unique from conversational speech. In one of their first
papers published in 1985, they were testing to see if clear speech was significantly more
intelligible than conversational speech. Listeners with hearing loss listened to 50 nonsense
sentences recorded clearly and conversationally and then wrote down or orally repeated the

3
sentence they heard. Results showed that clear speech lead to improvements in intelligibility
(Picheny et al., 1985). In a later study conducted by the same authors in 1986, the specific
properties of clear speech were explored. Speakers were asked to record clear and conversational
nonsense sentences similar to the sentences used in the previous study. Each sentence was
analyzed for speaking rate, pause and fundamental frequency distributions, and long-term RMS
spectra. They concluded that Clear Speech is spoken more slowly than conversational speech by
lengthening pauses between words and lengthening the duration of speech sounds. Speakers also
modeled more complete pronunciation of phonemes within words. Vowels were less modified
and stop bursts and word final consonants were always released (Picheny, Durlach, & Braida,
1986).
Knowing that clear speech has unique characteristics that lead to improved speech
intelligibility leaves the question; Which property or combination of properties of clear speech
makes it more intelligible than conversational speech? In the remaining portion of the
introduction, the important aspects of clear speech that have been identified in the literature will
be explored in detail.
One of the most commonly identified aspect of clear speech is its increased intensity. In
early literature, increased loudness was reported to increase speech intelligibility (Picheny et al.,
1986). Clear speech had a 5 to 8 dB increase in intensity when compared to conversational
speech (Picheny et al., 1986). Yet, in later literature, the intelligibility benefit of clear speech was
found to be independent of intensity level when sentences are presented at an audible level
(Krause & Braida, 2009). This study was examining 2 aspects of clear speech; the increased
energy in long term spectra and the increased low frequency modulations of the intensity
envelope. Krause and Braida raised the formant amplitudes of conversational speech between

4
3000 and 5000 Hz and increased the depth of low modulation frequencies. People with normal
hearing and hearing loss were asked to listen to the manipulated sentences along with clear and
conversational speech sentences at normal rates. Subjects wrote down the sentences they heard.
Results showed that neither condition provided significant increases in intelligibility when
manipulated in isolation. Krause and Braida (2009) stated that increased modulation of the
intensity envelope in isolation is “detrimental to intelligibility, even though this acoustic property
is considered likely to be at least partly responsible for the intelligibility benefit of clear speech”
(p. 3356). However, increasing the intensity of formant frequencies did provide more
intelligibility than conversational speech (Krause & Braida, 2009).
Clear speech as compared to conversational speech is slower in overall speaking rate
with lengthened pauses between words (Picheny, Durlach, & Braida, 1989). In a study by
Picheny, Durlach, and Braida (1989), they reported that although uniform adjustment of rate in
conversational speech did not increase intelligibility on its own, rate should be considered a key
characteristic to making clear speech more intelligible than conversational speech. Later studies
showed that the benefits of clear speech versus conversational speech are independent of rate
(Ferguson & Kewley-Port, 2002; Krause & Braida, 2002; Picheny et al., 1989; Uchanski, Choi,
Braida, Reed, & Durlach, 1996). In a study by Picheny et al (1989), clear speech was processed
to have the duration of conversational speech and conversational speech was processed to have
the duration of clear speech. Both conditions were evaluated for intelligibility with listeners with
hearing loss. Making conversational speech slower in rate and clear speech faster in rate both had
lower intelligibility scores than unprocessed clear and conversational speech. Duration is not a
sole value that increases the intelligibility of clear speech.

5
Other studies have tried to produce Clear Speech at a normal speaking rate (Uchanski et
al., 1996), but were unsuccessful. They asked speakers to speak as clearly as they could and as
quickly as they could. Speakers were not able to increase their intelligibility without slowing
down their speech (Uchanski et al., 1996). These findings led researchers to believe that
differences in pause structure accounted for differences in intelligibility. In a study by Krause
and Braida (2002), speakers were asked to record clear and conversational speech at three
different speaking rates- slow, normal, and quick. Listeners with normal hearing listened to the
recorded sentences and participated in an intelligibility test. The benefits of clear speech
occurred in faster speaking rates but did not extend to the quick speech condition when talkers
were adequately trained to produce these samples (Krause & Braida, 2002).
Clear speech contains lengthened pauses between words and between phonemes within
words (Picheny et al., 1986; Uchanski et al., 1996). This characteristic relates heavily to the
duration of clear speech. In the study by Uchanski et al (1996), pauses that occurred in clear
speech sentences but were absent in their conversational speech correlate were deleted. Pauses
also were inserted into conversational speech where they occurred in clear speech. Subjects had
more difficulty understanding the conversational speech sentences with added pauses than the
clear speech sentences with omitted pauses (Uchanski et al., 1996). This suggests that differences
in pause structure does not necessarily account for differences in intelligibility.
As mentioned in the Picheny et al (1986) study, an expanded vowel space is a key
characteristic of clear speech. In a research study done in by Ferguson and Kewley-Port (2007),
the acoustic vowel qualities that occur naturally in clear speech were studied in isolation.
Acoustic vowel space expansion and large vowel duration increases improve vowel
intelligibility. Speakers were asked to record a series of sentences containing a target vowel

6
sound in clear and conversational speech. Half of the speakers had been recorded in previous
studies and were found to produce a vowel intelligibility effect in their clear speech. The
sentences produced by these talkers were labeled “Big Benefit Sentences”. The other half of the
speakers did not produce any intelligibility advantage in their clear speech, so their sentences
were labeled “No Benefit”. Each target vowel was analyzed for duration, steady state formant
values, and dynamic formant movement. Vowel duration was increased in length and may have
had an impact on the speech intelligibility (Ferguson & Kewley-Port, 2007), in contrast to the
previous findings studying rate of clear speech (Ferguson & Kewley-Port, 2002; Krause &
Braida, 2002; Picheny et al., 1986; Uchanski et al., 1996). For steady state formant values, the
vowel expands to some extent for all talkers when producing clear speech. In general, expansion
is larger in the F2 dimension than the F1 dimension, primarily effecting low front vowels, like
/æ/ and /a/. Dynamic formant movement was linked to an increase in the duration of clear
speech. Overall, Ferguson and Kewley-Port reported that duration and steady state formant
values contributed significantly to clear speech intelligibility while dynamic formant alteration
for vowels had little effect on the intelligibility of vowels in clear speech (Ferguson & Kewley-
Port, 2007).
Following the results found in the Ferguson and Kewley-Port (2007) study, Kain,
Amano-Kusumoto, and Hosom did a study in 2008 examining hybrid sentences, where a
conversational carrier sentence was manipulated to contain elements of clear speech. Two
different experiments were conducted. The first experiment included hybrid sentence conditions
grouping duration and short-term spectral information together (HYB-DSP), and Energy, f0 and
Non-speech characteristics (HYB-EFN) together. The HYB-DSP condition increased
intelligibility. In the second experiment, duration alone did not provide a significant difference in

7
speech intelligibility, but short-term spectrum alone did. It was hypothesized that spectrum plays
a role in the intelligibility of clear speech (Kain, Amano-Kusumoto, & Hosom, 2008).
Continuing to look at the relationship of temporal cues on the intelligibility of clear
speech, Amano-Kusumoto, Hosom, Kain, and Aronoff (2014) produced another paper looking at
the specific features of short-term spectra and their impact on intelligibility. In previous studies it
has been recognized that formant movement is increased in clear speech (Akiko Amano-
Kusumoto & Hosom, 2009; Ferguson & Kewley-Port, 2002; Moon & Lindblom, 1994; Wouters
& Macon, 2002). In this study, three different conditions (along with clear and conversational
speech) were examined. One condition looked at the formant contours and duration (HYB-C), or
the change in formant frequency over time. The second condition examined the formant
frequencies at the steady state and transition of the vowel (HYB-MT). The third condition
examined formant frequency of the vowel at the steady-state in isolation (HYB-M). All
conditions were created through the hybridization process mentioned previously (Kain et al.,
2008). Four different vowels were examined in the context of the target word /wVl/. Subjects
listened to each sentence and chose which word they heard from four multiple-choice answers
given. Modifying the formant contour along with duration (HYB-C) in conversational speech to
match that of clear speech increased intelligibility. Modifying the steady state in isolation and the
steady state with the formant transition were found to be less important for speech perception (A.
Amano-Kusumoto, Hosom, Kain, & Aronoff, 2014).
While these findings were beneficial in understanding the relationship between formant
contours, duration, and clear speech perception, they did not successfully isolate a single, most
salient characteristic of Clear Speech. Their manipulation of both formant contours and duration
sets the stage for further inquiry into the impact of formant contour modification in isolation on
8
speech perception. This also raises the question of what are appropriate methods to isolate
formant contours for this type of investigation.
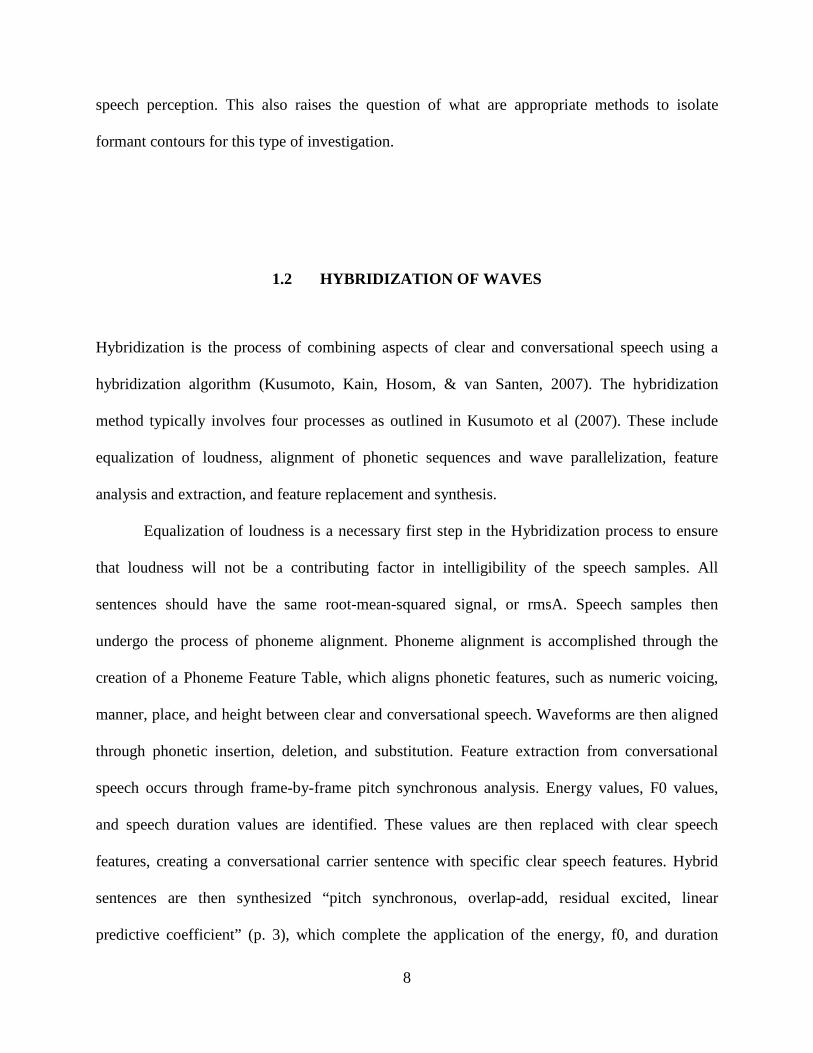
1.2 HYBRIDIZATION OF WAVES
Hybridization is the process of combining aspects of clear and conversational speech using a
hybridization algorithm (Kusumoto, Kain, Hosom, & van Santen, 2007). The hybridization
method typically involves four processes as outlined in Kusumoto et al (2007). These include
equalization of loudness, alignment of phonetic sequences and wave parallelization, feature
analysis and extraction, and feature replacement and synthesis.
Equalization of loudness is a necessary first step in the Hybridization process to ensure
that loudness will not be a contributing factor in intelligibility of the speech samples. All
sentences should have the same root-mean-squared signal, or rmsA. Speech samples then
undergo the process of phoneme alignment. Phoneme alignment is accomplished through the
creation of a Phoneme Feature Table, which aligns phonetic features, such as numeric voicing,
manner, place, and height between clear and conversational speech. Waveforms are then aligned
through phonetic insertion, deletion, and substitution. Feature extraction from conversational
speech occurs through frame-by-frame pitch synchronous analysis. Energy values, F0 values,
and speech duration values are identified. These values are then replaced with clear speech
features, creating a conversational carrier sentence with specific clear speech features. Hybrid
sentences are then synthesized “pitch synchronous, overlap-add, residual excited, linear
predictive coefficient” (p. 3), which complete the application of the energy, f0, and duration

9
changes in the clear speech segments of the conversational speech sentence (Kusumoto et al.,
2007). This process of hybridization was later used in experiments to successfully combine
features of clear and conversational speech (Akiko Amano-Kusumoto & Hosom, 2009; A.
Amano-Kusumoto et al., 2014; Kain et al., 2008)
1.3 SINE WAVE SPEECH
Sine wave speech is a synthesized form of speech in which many acoustic characteristics are
removed from the signal. Sine wave speech was first developed by Phillip Rubin in the 1970s. In
a paper by Remez, Rubin, Pisoni, and Carrell (1981), stimuli were created using three sinusoids,
representative of the first three formant frequencies of an utterance. Figure 1 shows a clear
speech spectrogram of the sentence “Ruth’s grandmother discussed the broom”. The Sine Wave
Speech manipulation of the same sentence is displayed in Figure 2. These formant frequencies
preserve amplitude and frequency variation of normal speech. The energy spectra is one of the
fundamental differences between natural speech and Sine Wave Speech. Many of the acoustic
characteristics of natural speech, like voicing and stress, are absent (R. Remez, Rubin, Pisoni, &
Carrell, 1981). When subjects were asked to listen to sentences presented in Sine Wave Speech
and give their impressions of the stimuli, most of subjects did not identify the sounds as a speech
signal. Many described the signal as “Science fiction sounds”, “mechanical sound effects” or
“bird sounds”. When subjects were told they were going to hear a sentence and were asked to
repeat it, some could correctly transcribe the whole sentence (R. Remez et al., 1981).

10
Listeners could identify familiar talker voices and the sex of an unfamiliar talker
presented to them in Sine Wave Speech (Brungart, Iyer, & Simpson, 2006; Fellowes, Remez, &
Rubin, 1997; R. E. Remez, Fellowes, & Rubin, 1997). These findings were beneficial in
understanding how humans perceive speech. Up until these findings, many thought that voice
and speech recognition came from the tonal and vocal qualities of a speaker ((Pollock, Pickett, &
Sumby, 1954; Williams, 1964).
In order to successfully investigate the significance of a single clear speech characteristic
on intelligibility, the process of hybridization and Sine Wave Speech transformation can be used
in conjunction. Hybridization will allow for a single clear speech characteristic to be presented in
an otherwise conversational sentence. Sine Wave Speech transformation then isolates that single
characteristic by removing many acoustic cues from a signal that could impact the results of
experimentation. These processes were used in the creation of stimuli for the current study.

11
R u th s gr a n d mother di s cu ss ed the br oo m
Figure 1. Spectrogram of the naturally spoken, clear speech sentence, “Ruth’s grandmother
discussed the broom.”

12
R u th s gr a n d mother di s cu ss ed the br oo m
Figure 2. Spectrogram of the clear, Sine Wave Speech sentence, “Ruth’s grandmother discussed
the broom.”

13
2.0 CURRENT STUDY
2.1 SPECIFIC AIMS
The specific aim of this study is to explore the impact of clear vowel-nasal formant contours on
conversational speech perception in normally hearing individuals. This study will evaluate the
intelligibility of conversationally spoken words with clear formant contours while keeping
duration of sentences at a conversational rate. These manipulated sentences were compared to
the intelligibility of conversationally and clearly spoken sentences. The research question related
to my specific aim is:
1. Do clear speech formant contours embedded within conversationally spoken words
within sentences lead to improved perception of conversationally spoken speech?

14
2.2 HYPOTHESIS
This study will test the hypothesis that clear speech manipulation of vowel-nasal formant
contours in a conversational carrier sentence will lead to improved perception of conversational
speech. Clear speech is predicted to be more intelligible than conversational speech sentences.
Manipulated type sentences are predicted to be as intelligible as clear speech sentences and more
intelligible than conversational speech sentences.

15
3.0 METHOD
3.1 SPEECH STIMULI
3.1.1 r-SPIN Sentences
The speech materials used in this study are from the Revised Speech Perception in Noise (r-
SPIN) test (Bilger, Nuetzel, Rabinowitz, & Rzeczkowski, 1984). This test contains 200 high-
predictability and 200 low-predictability sentences. Key words, or the last word of each sentence,
will be scored. In the high predictability context, final words can be predicted from the sentence.
For example, in the sentence “I sat on the chair”, the verb “sat” provides context and “chair” can
easily be predicted as the key word. In low-predictability sentences, the final word is not cued by
context, causing the listener to rely solely on the acoustic characteristics of the final word. An
example of a low-predictability sentence would be “He looked at the dog”. The verb “looked”
does not predict the final word.
Only low-predictability sentences were used in this study to ensure that listeners focused
on the acoustic characteristics of the clear, conversational, and manipulated sentences. The
speech materials were created for previous research (Ortmann, 2012) and are briefly described.
Two hundred novel sentences were recorded twice, using clear and conversational speech. All
sentences were recorded by a male speaker with a Standard American accent. The speaker had

16
experience producing clear and conversational speech. For conversational sentences, the speaker
memorized the target sentence and a sentence following it, producing the sentence naturally. For
clear speech, the speaker was asked to produce the same sentences in a clear manner. The second
sentence in each sequence was added to ensure that emphasis was not placed on the final word of
the target sentence.
These recorded sentences were analyzed and compared to the original r-SPIN sentences
(Bilger et al., 1984) and Sentences were found to match the characteristics of clear and
conversational speech (Ortmann, 2012). Values for the clear and conversational speech
recordings used in this study are provided in Table 1. All characteristics measured in this study,
including speaking rate, articulation rate, vowel duration of final key words, and voiceless VOT
of key words, are representative of the differences in clear and conversational speech found in
previous literature ((Ferguson & Kewley-Port, 2002; Krause & Braida, 2004; Picheny et al.,
1986).
Characteristics Values
Clear Conversational
Speaking Rate (word/min) 144(23.5) 270 (38.9)
Articulation Rate (Syllable/sec) 3.05 (0.46) 5.67 (0.72)
Vowel Duration of the Final Key Words (ms)
242 (80) 180 (92)
Voiceless VOT of the Key Words (ms)
95 (12) 33 (16)
Table 1. mean and standard deviation values of clear and conversational recordings of low-
predictability r-SPIN sentences (Ortmann, 2012).

17
Sentences used in the current study were chosen based on the phonetic characteristics
found in the last word, which will now be referred to as the target word, of the sentence. In order
to have a voiced transition, this study is focusing on vowel-nasal transitions in the middle and
final position of words. Nasals were selected as the consonant of interest because of their voiced
quality, and a variety of vowel-nasal transitions were represented in the r-SPIN stimuli set. Out
of the 200 r-SPIN sentences recorded, 43 contained this type of transition. Thirty sentences were
chosen from this pool to have a representative sample of vowels and nasal sounds. All 3 nasal
sounds (/m/ /n/ and /ŋ/) were represented in this study, as shown in Table 2, where all thirty
target words are presented by nasal sound. Nine different vowels- /ɪ/ /i/ /e/ /ɛ/ /ə/ /ɑ/ /æ/ /u/ and
/o/ were included, as shown in Table 3, where all target words are presented by vowel.
Table 2. Target words organized by nasal sound
/m/ /n/ /ŋ/ Rim Hint Mink steam screen skunk scream drain lungs flame grain Gang aim rent gum bend bomb bench stamp hen lamp swan broom pond van spoon bone grin fun

18
Table 3. Target words organized by vowel sound.
3.1.2 Manipulated Speech Hybridization
The manipulated speech stimuli created for this study were a hybridized version of the clear and
conversational r-SPIN sentences recorded previously. Each manipulated-type sentence contained
conversational speech carrier with a clear vowel-nasal formant contour inserted into the target
word at the end of the sentence.
For each target word, the formant contour duration from the steady state of the vowel to the
steady state of the nasal was identified for clear and conversational speech. To define this area in
time, target words were analyzed on a wide-band spectrogram on Praat, a speech analysis
software suite (Boersma & Weenink, 2016). A formant transition is defined in previous literature
as a change in frequency greater than 20 Hz. The trajectory of the second formant (F2) contour
was determined by examining the F2 onset and offset surrounding the vowel-nasal transition.
ɪ i e ɛ ə ɑ ᴂ u o Mink Steam Flame Rent Gum Bomb Lamp Broom foam
rim screen drain bend skunk swan gang spoon bone
grin scream grain bench lungs pond van
hint aim hen fun stamp

19
The onset occurs 20 milliseconds before the formant transition occurred, and the offset occurs 20
milliseconds after the transition ends (Tjaden & Weismer, 1998). In Figure 3, the spectrogram of
the clear speech sentence, “Ruth’s grandmother discussed the broom.” is presented. In figure 4,
the conversational speech sentence is presented. The clear formant contour that was extracted is
circled in red. All clear formant contours were adjusted to have the same duration as the
conversational formant contours using the “Change Speed” effect function on Audacity, an audio
software used for recording and editing (Audacity-Team, 2017).
R u th s g ran d mother di s cussed th e b r oo m
Figure 3. Spectrogram of clear speech sentence “Ruth’s grandmother discussed the broom.” with
the formant contour to be extracted circled.

20
R u th s g ra n d mother d i s c u ss ed the b r oo m
Figure 4. Spectrogram of conversational speech sentence “Ruth’s grandmother discussed the
broom.” with the formant contour to be replaced circled.
The formant contours were removed from the conversational carrier sentence in Audacity
(Audacity-Team, 2017). Clear speech formants were inserted into the conversational sentence at
zero-crossings to avoid hearing clicks in the new manipulated stimuli. A drawing tool, which
helps the user manually edit formant frequencies, was used to smooth out edges that could cause
unnatural sounding speech around the insertion points.
This technique produced a set of clear speech stimuli (nothing manipulated), a set of
conversational speech stimuli (nothing manipulated) and a set of manipulated conversational
speech stimuli (conversational speech with a clear speech format in the final word of the
sentence).

21
3.1.3 Sine Wave Speech Manipulation
Sine Wave Speech was used to ensure that the formant contours applied to the three sets of
stimuli (normal conversational, normal clear speech, and manipulated conversational with a clear
speech formant contour) were isolated as the feature that was different among the different
speech stimuli. This technique takes away many of the other characteristics of speech that could
act as a confounding variable in this experiment. This technique also was used to avoid ceiling
effects in this study. Because a normally hearing population was tested, subjects would easily
understand clear and conversational speech because manipulations that were made to the stimuli
were so minor. Initially, all sentences were going to be presented in 12 talker babble, but it was
decided that Sine Wave Speech would better control for ceiling effects while highlighting the
manipulation at hand. All sentence conditions used in the study were processed through a
PYTHON script for Praat written by Dr. Christopher Brown.
3.2 PARTICIPANTS
Thirty participants completed this study. This sample size was deemed appropriate after looking
at previous literature (Amano-Kusumoto et al, 2014), where significant results were found using
a smaller sized sample population when investigating the effect of formant contours on clear and
conversational speech. All participants were required to be 18-35 years in age and have normal
hearing. Twenty females and 10 males participated in this study.

22
3.2.1 Recruitment
All subjects were affiliated with the University of Pittsburgh. Many subjects came from
undergraduate Communication Science classes. Other subjects were recruited from clubs and
extracurricular activities where this research study was advertised. Interested subjects signed up
for a time slot online or by emailing the Primary Investigator. All subjects participated without
extra credit given to them.
3.3 PROCEDURE
3.3.1 Screening Procedures
After arriving at the testing site, subjects listened to a verbal consent script approved by the
University of Pittsburgh Institutional Review Board and consent was obtained from all subjects.
Because this study was deemed low risk by the IRB, written consent was not required for this
study. All subjects underwent a pure-tone, bilateral hearing screening (ASHA, 2016) presented at
25 dB SPL. All participants listened to frequencies of 250 Hz, 500 Hz, 1000 Hz, 2000 Hz, and
4000 Hz. An audiometer and insert headphones were used. Participants were deemed eligible if
they passed the screening at all frequencies in both ears.

23
3.3.2 Experimental Tasks
Participants completed two experimental tasks in this study. Part One included a Word
Identification task with feedback, which served as training for subjects. Part Two included a
Word Identification task without feedback. Each task was presented to subjects using the same
insert earphones used in the hearing screening. Subjects were instructed to listen to sentences
presented in “Sine Wave Speech”. It was explained that Sine Wave speech is a synthesized
version of speech and that it will have a robotic sound. Both tasks were presented using Super
Lab. All sentences were presented at 60 dB SPL.
3.3.2.1 Part 1: Word Identification Task with Feedback
In previous literature, practice sentences included before the study were used (Rosen & Hui,
2015). The unprocessed, natural spoken sentence was presented after the presentation of the Sine
Wave Speech sentence (Rosen & Hui, 2015).The Revised Speech Perception in Noise (r-SPIN)
Sentences included in this word identification task were obtained from a previous study
(Ortmann, 2012). Thirty sentences, 15 clear speech sentences and 15 conversational speech
sentences, were processed through the Sine Wave Speech PYTHON script for Praat written by
Dr. Christopher Brown. These sentences were presented as practice for subjects to avoid floor
effects due to the unusual nature and sound of Sine Wave Speech.
Participants were instructed to listen carefully to the sentence and identify the last word
that they heard. After hearing the sentence, 4 multiple choice options appeared on a screen and

24
subjects chose the word they thought they heard using a response pad with 4 corresponding
buttons. All multiple-choice foils were selected from pilot data, where participants heard sine
wave speech sentences and wrote down words that they heard. Two examples used in this section
are presented in Table 4. Subjects had 6 seconds to make a choice. After making their selection,
a response appeared on the screen- “Correct” or “Incorrect”. The subjects would then listen to
the non-synthesized, original sentence.
Table 4. Example of stimuli presentation and response.
3.3.2.2 Part 2: Word Identification Task without Feedback
As a part of the research design, participants were divided into three sections for testing. Each
subject listened to 30 sine wave speech sentences with ten clear speech sentences, ten
conversational speech sentences, and ten manipulated-type speech sentences. There were 30
sentences used in this study- each presented as clear, conversational, and manipulated conditions.
Sentence Presented- Multiple Choice Answers- She hopes Jane called about the calf (clear) A) Cat
B) Cast C) Calf D) Cab
The man could not discuss the mouse (conversational) A) Blouse B) Mouse C) House D) Spouse

25
Each set of listeners heard a different combination of these sentences so that no sentence was
repeated to a single listener. Table 5 shows the different sections presented to subjects.
Participants were instructed to choose the word that they heard at the end of the sentence,
as they did in the previous task. After sentence presentation, four multiple-choice answers were
presented on the screen. Subjects had an unlimited amount of time to make their choice. No
feedback was given after answers were selected.
10 Subjects 10 Subjects 10 Subjects Clear Clear Clear steam screen scream swan bomb pond spoon broom bone foam mink grin rim hint bench bend rent hen lungs gum skunk gang lamp fun stamp flame van drain grain aim Conversational Conversational Conversational screen scream steam bomb pond swan broom bone spoon mink grin foam hint bench rim rent hen bend gum skunk lungs lamp fun gang flame van stamp grain aim drain Manipulated Manipulated Manipulated scream steam screen pond swan bomb bone spoon broom grin foam mink bench rim hint hen bend rent skunk lungs gum

26
Table 5. Stimuli presented to subjects to ensure that no subjects heard the same key word
twice.
fun gang lamp van stamp flame aim drain grain

27
4.0 RESULTS
Each participant’s responses were scored for total number correct out of 10 for each condition
(clear, conversational, and manipulated). The average number of words identified correctly
across the thirty subjects for each condition was then calculated, along with the standard
deviation. See Appendix A for complete subject data A Repeated-measure ANOVA was used to
analyze these data to compare average performance across all three conditions. No difference
was observed among conditions (conversational, clear, manipulated), F(2, 27)=.08, p=.923 and
the mean number of correct scores out of ten were very similar across all groups (see Figure 5).
Figure 6 provides a histogram of performance comparing the three listening conditions. The
majority of subjects scored within the 5 and 7 range for all 3 conditions.
The chance performance level of this experiment is approximately 2.5, which was
calculated from the mean chance score equation, M(c)= K/A, where K represents the number of
items, and A represents the number of alternatives (Cliff, 1958). All subjects performed above
chance meaning that they could complete the task.

28
Figure 5. mean number of words identified correctly by condition. Chance performance is
represented by the solid line (2.5).
C lea r
C o n v e rsa t io
n a l
Ma n ip
u late
d0
2
4
6
8
1 0
Wo
rds
Id
en
tifi
ed
Co
rre
ctl
y (
ou
t o
f 1
0)
L is te n in g C o n d it io n

29
Figure 6. Histogram of the number of clear, conversational, and manipulated words identified
correctly by subjects.

30
5.0 DISCUSSION
In this experiment, the intelligibility of hybridized words (clear speech formant contours in
conversational speech) at the end of low-predictability sentences was compared to the
intelligibility of clearly and conversationally spoken words at the end of low-predictability
sentences. All conditions were presented as Sine Wave Speech. The hybridized condition was
designed to test the significance of a vowel-nasal formant contour in isolation on intelligibility.
As stated in the Results section, no significant differences were found among the conditions.
The methods Kusumoto et al (2014) used varied from the ones used in the current study,
which may account for the difference in findings. Table 6 presents the difference in methodology
that may account for differences in findings. In the creation of hybrid formant contours as
outlined by Amano-Kusumoto et al, a hybridization algorithm described in the introduction
section was used to modify existing formant contours of conversational carrier sentences to have
clear speech characteristics. In the current study, formant contours of clear speech were cut out
of a previously recorded sentence and inserted into a conversational speech sentence rather than
manipulating features within a sentence. This difference in method may have led to a difference
in results.
Duration of the formant contours also differed between the two studies. In Amano-
Kusumoto (2014), formant contours were kept at a clear speech duration. The current study
maintained a conversational duration, as a way to test formant contours in isolation. This

31
difference also may have impacted results of the current study as compared to the previous
investigation.
Finally, sentence conditions were presented to subjects in different ways between the two
studies. In the Amano-Kusumoto et al study, stimuli were presented binaurally with 12-talker
babble and were adjusted to the signal-to-noise ratio where subjects could identify conversational
sentences 50% of the time (Amano-Kusumoto, Hosom, Kain, & Aronoff, 2014) in order to make
the task difficult enough for participants with normal hearing to avoid a ceiling effect. In the
current study, stimuli were presented in sine wave speech in order to create a difficult task for
normally hearing individuals again avoiding a ceiling effect without creating a floor effect in
terms of measured intelligibility. The sine wave speech transformation was also used to focus
specifically on the formant contours presented in clear and conversational speech while taking
away many other characteristics of speech including duration differences that could act as a
confounding variable in this experiment. It was decided that Sine Wave Speech would be more
beneficial in increasing task difficulty while remaining focused on the manipulation in question
than speech-in-noise.
Because Sine Wave Speech sounds so different from natural speech, an initial concern
was with the difficulty of the experimental task. After calculating chance level as 2.5, the mean
scores for all 3 conditions were above chance. Further analysis of participant responses by target
word showed that only 3 of the 30 words showed bimodality in responses due to similar first
sounds, and 2 showed bimodality in responses due to similar end sounds. All histograms
presenting this Given that data can be found in Appendix B. The listeners were provided with 4
choices, and in some cases one choice may have seemed more logical than other choices. If the
individual did not hear a sentence accurately, they may have defaulted to what they considered to

32
be the most logical target word. But in all cases, these were low context sentences, and none of
the final words could be predicted by the beginning of the sentence.
The possible differences in the experiments include the different methods of isolating the
formant contour cue with the Amano-Kusumoto et al (2014) method leaving additional cues in
the stimuli that might have differentiated the clear speech, conversational speech, and
manipulated speech conditions. The studies also used different presentation methods that might
have impacted the ability to detect differences in the stimuli between investigations.
FEATURES AMANO-KUSUMOTO CURRENT STUDY FORMANT CONTOURS
manipulated from conversational speech contours
extracted from clear speech and inserted
DURATION
clear speech duration in conversational speech
maintained conversational speech duration
TASK DIFFICULTY
Speech in noise
Sine Wave Speech
INTENSITY
controlled so no difference between conditions
controlled at the word level so no differences between conditions
PRESENTATION
single words presented
word at the end of the sentence was scored
Table 6. Comparison of methodology between the Amano-Kusumoto et al (2014) study and the
current study.

33
6.0 SUMMARY AND CONCLUSION
In this study, the characteristics of Clear Speech were explored through the examination of
formant contours in clear and conversational speech sentences. It was hypothesized that clear
formant contours with a conversational speech duration would increase conversational speech
intelligibility to that of clear speech. To isolate the cue of interest (formant contour)
conversational speech carrier sentences were hybridized to have clear speech formant contours at
a vowel-nasal transition and presented through sine wave speech. No significant differences were
found between conditions.
In the previous study by Amano-Kusumoto et al (2014), formant contours hybridized
within conversational speech along with maintained clear speech duration increased the
intelligibility of conversational speech (Amano-Kusumoto, Hosom, Kain, & Aronoff, 2014). In
the current study, formant contours were manipulated in isolation, where duration was kept at a
conversational rate. The lack of differences seen between the three conditions in the current
study suggests that clear formant contours may only benefit in the perception of conversational
speech when duration of clear speech remains.
These results may point to the need for formant contour cues to interact with other
aspects of the clear speech signal in order to produce improved intelligibility compared to
conversational speech given that formant contours were isolated as the only cue difference in this
experiment. This is the first study strictly focused on the effect of formant contour in isolation, so

34
further investigation would be required to determine if experimental differences with previous
studies also may have contributed to differing results and to investigate what acoustic cues might
interact with formant contour in order to produce improved intelligibility. In the future, revisiting
the Amano-Kusumoto et al (2014) study and other studies that looked at the impact of rate on
clear speech perception (Uchanski et al, 1996; Krause and Braida, 2002) would be beneficial in
examining the impact of formant contour duration as an isolated cue.

35
APPENDIX A
Individual subject data.
Clear Conversational Manipulated
Subject 1 5 5 6 Subject 2 5 6 7 Subject 3 6 5 4 Subject 4 6 5 5 Subject 5 3 3 7 Subject 6 5 5 5 Subject 7 5 7 3 Subject 8 4 7 5 Subject 9 7 6 6 Subject 10 3 5 3 Subject 11 7 6 8 Subject 12 7 3 3 Subject 13 4 7 5 Subject 14 6 4 8 Subject 15 7 4 7 Subject 16 5 8 5 Subject 17 7 8 8 Subject 18 6 4 6 Subject 19 3 6 7 Subject 20 7 6 6 Subject 21 7 9 7 Subject 22 4 5 5 Subject 23 7 6 5 Subject 24 7 6 5 Subject 25 7 5 7 Subject 26 6 6 7 Subject 27 8 7 8 Subject 28 6 5 4

36
Subject 29 5 7 4 Subject 30 7 9 6
Mean 5.73 5.83 5.73 Standard Deviation 1.41 1.53 1.53
Table 7. Individual Subject Data

37
APPENDIX B
Histograms of Participant Responses per Target Word.
Figure 7. Histogram of participant responses for the target word “Aim”

38
Figure 8. Histogram of participant responses for the target word “Bench”
Figure 9. Histogram of participant responses for the target word “Bend”

39
Figure 10. Histogram of participant responses for the target word “Broom”
Figure 11. Histogram of participant responses for the target word “Bone”
Figure 5.

40
Figure 12. Histogram of participant responses for the target word “Drain”
Figure 13. Histogram of participant responses for the target word “Flame”

41
Figure 14. Histogram of participant responses for the target word “Foam”
Figure 15. Histogram of participant responses for the target word “Fun”

42
Figure 16. Histogram of participant responses for the target word “Gang”
Figure 17. Histogram of participant responses for the target word “Grain”

43
Figure 18. Histogram of participant responses for the target word “Grin”
Figure 19. Histogram of participant responses for the target word “Gum”

44
Figure 20. Histogram of participant responses for the target word “Hint”
Figure 21. Histogram of participant responses for the target word “Hint”

45
Figure 22. Histogram of participant responses for the target word “Lamp”

46
Figure 23. Histogram of participant responses for the target word “Lungs”
Figure 24. Histogram of participant responses for the target word “Mink”

47
Figure 25. Histogram of participant responses for the target word “Pond”
Figure 26. Histogram of participant responses for the target word “Rent”

48
Figure 27. Histogram of participant responses for the target word “Rim”
Figure 28. Histogram of participant responses for the target word “Scream”

49
Figure 29. Histogram of participant responses for the target word “Screen”
Figure 30. Histogram of participant responses for the target word “Skunk”

50
Figure 31. Histogram of participant responses for the target word “Spoon”
Figure 32. Histogram of participant responses for the target word “Stamp”
Figure 33. Histogram of participant responses for the target word “Steam”

51
Figure 34. Histogram of participant responses for the target word “Swan”
Figure 35. Histogram of participant responses for the target word “Van”

52
Figure 36. Histogram of participant responses for the target word “Bomb”

53
REFERENCES
Administration on Aging (2016). Aging Statistics. Available from https://aoa.acl.gov/Aging_Statistics/Index.aspx
American Speech-Language-Hearing Association (2016). Adult Hearing Screening [Guidelines]. Available from http://www.asha.org/policy/.
Amano-Kusumoto, A., & Hosom, J.-P. (2009, 2009). The effect of formant trajectories and phoneme durations on vowel intelligibility.
Amano-Kusumoto, A., Hosom, J. P., Kain, A., & Aronoff, J. M. (2014). Determining the relevance of different aspects of formant contours to intelligibility. Speech Commun, 59, 1-9. doi: 10.1016/j.specom.2013.12.001
Audacity-Team. (2017). Audacity: Free Audio Editor and Recorder (Version 2.0.0). http://audacity.sourceforge.net/.
Bess, F. H., Lichtenstein, M. J., Logan, S. A., Burger, M. C., & Nelson, E. (1989). Hearing impairment as a determinant of function in the elderly. J Am Geriatr Soc, 37(2), 123-128.
Bilger, R. C., Nuetzel, J. M., Rabinowitz, W. M., & Rzeczkowski, C. (1984). Standardization of a Test of Speech Perception in Noise. Journal of Speech, Language, and Hearing Research, 27(1), 32-48. doi: 10.1044/jshr.2701.32
Boersma, & Weenink. (2016). Praat: doing phonetics by computer (Version 6.0.27). http://www.praat.org/.
Brungart, D. S., Iyer, N., & Simpson, B. D. (2006). Monaural speech segregation using synthetic speech signals. J Acoust Soc Am, 119(4), 2327-2333.
Chang-Quan, H., Bi-Rong, D., Zhen-Chan, L., Ji-Rong, Y., & Qing-Xiu, L. (2010). Chronic diseases and risk for depression in old age: A meta-analysis of published literature. Ageing Research Reviews, 9, 131-141.
Cliff, R. (1958). The Predictive Value of Chance-Level Scores. Educational and Psychological Measurement, 18(3), 607-616.
Fellowes, J. M., Remez, R. E., & Rubin, P. E. (1997). Perceiving the sex and identity of a talker without natural vocal timbre. Percept Psychophys, 59(6), 839-849.
Ferguson, S. H., & Kewley-Port, D. (2002). Vowel intelligibility in clear and conversational speech for normal-hearing and hearing-impaired listeners. J Acoust Soc Am, 112(1), 259-271.
Ferguson, S. H., & Kewley-Port, D. (2007). Talker differences in clear and conversational speech: acoustic characteristics of vowels. J Speech Lang Hear Res, 50(5), 1241-1255. doi: 10.1044/1092-4388(2007/087)
Kain, A., Amano-Kusumoto, A., & Hosom, J. P. (2008). Hybridizing conversational and clear speech to determine the degree of contribution of acoustic features to intelligibility. J Acoust Soc Am, 124(4), 2308-2319. doi: 10.1121/1.2967844

54
Kochkin, S., & Rogin, C. (2000). Quantifying the obvious: The impact of hearing instruments on quality of life Hearing Review, 7(1), 8-34.
Krause, J. C., & Braida, L. D. (2002). Investigating alternative forms of clear speech: the effects of speaking rate and speaking mode on intelligibility. J Acoust Soc Am, 112(5 Pt 1), 2165-2172.
Krause, J. C., & Braida, L. D. (2004). Acoustic properties of naturally produced clear speech at normal speaking rates. J Acoust Soc Am, 115(1), 362-378.
Krause, J. C., & Braida, L. D. (2009). Evaluating the role of spectral and envelope characteristics in the intelligibility advantage of clear speech. J Acoust Soc Am, 125(5), 3346-3357. doi: 10.1121/1.3097491
Kusumoto, A., Kain, A. B., Hosom, J.-P., & van Santen, J. P. H. (2007). Hybridizing Conversational and Clear Speech.
Mick, P., Foley, D. M., & Lin, F. R. (2014). Hearing loss is associated with poorer ratings of patient–physician communication and healthcare quality. J Am Geriatr Soc, 62(11), 2207-2209.
Moon, S.-j., & Lindblom, B. (1994). Interaction between Duration, Context, and Speaking Style in English Stressed Vowels. Journal of the Acoustical Society of America, 96(1), 40. doi: 10.1121/1.410492
Ortmann, A. J. (2012). The impact of spectrally asynchronous delay on the intelligibility of conversational speech. (Doctoral dissertation), University of Pittsburgh, ProQuest, UMI Dissertations Publishing.
Picheny, M. A., Durlach, N. I., & Braida, L. D. (1985). Speaking clearly for the hard of hearing I: Intelligibility differences between clear and conversational speech. J Speech Hear Res, 28(1), 96-103.
Picheny, M. A., Durlach, N. I., & Braida, L. D. (1986). Speaking clearly for the hard of hearing. II: Acoustic characteristics of clear and conversational speech. J Speech Hear Res, 29(4), 434-446.
Picheny, M. A., Durlach, N. I., & Braida, L. D. (1989). Speaking clearly for the hard of hearing. III: An attempt to determine the contribution of speaking rate to differences in intelligibility between clear and conversational speech. J Speech Hear Res, 32(3), 600-603.
Pollock, Pickett, & Sumby. (1954). On the identification of talkers by voice. The Journal of the Acoustic Society of America, 26, 403-406.
Quick Statistics about Hearing. (2016). Retrieved 3/18/2017, from https://www.nidcd.nih.gov/health/statistics/quick-statistics-hearing
Remez, R., Rubin, P., Pisoni, D., & Carrell, T. (1981). Speech perception without traditional speech cues. Science, 212(4497), 947-949. doi: 10.1126/science.7233191
Remez, R. E., Fellowes, J. M., & Rubin, P. E. (1997). Talker identification based on phonetic information. J Exp Psychol Hum Percept Perform, 23(3), 651-666.
Rosen, S., & Hui, S. N. (2015). Sine-wave and noise-vocoded sine-wave speech in a tone language: Acoustic details matter. J Acoust Soc Am, 138(6), 3698-3702. doi: 10.1121/1.4937605
Tjaden, K., & Weismer, G. (1998). Speaking-rate-induced variability in F2 trajectories. J Speech Lang Hear Res, 41(5), 976-989.

55
Uchanski, R. M., Choi, S. S., Braida, L. D., Reed, C. M., & Durlach, N. I. (1996). Speaking clearly for the hard of hearing IV: Further studies of the role of speaking rate. J Speech Hear Res, 39(3), 494-509.
Williams, C. E. (1964). The Effects of selected factors on aural identification of speakers. Hanscom Field, MA: Electronic Systems Division, Air Force Systems Command.
Wouters, J., & Macon, M. W. (2002). Effects of prosodic factors on spectral dynamics. I. Analysis. J Acoust Soc Am, 111(1 Pt 1), 417-427.