Clean Cities / 1 Alternative Fuel Opportunities Ahead Alleyn Harned Virginia Clean Cities.

Ethanol Propane BiodieselNatural Gas
CLEAN CITIES
Alternative Fuel Price Report
January 2016
CLEAN CITIES ALTERNATIVE FUEL PRICE REPORT JANUARY 2016
2
Welcome to the
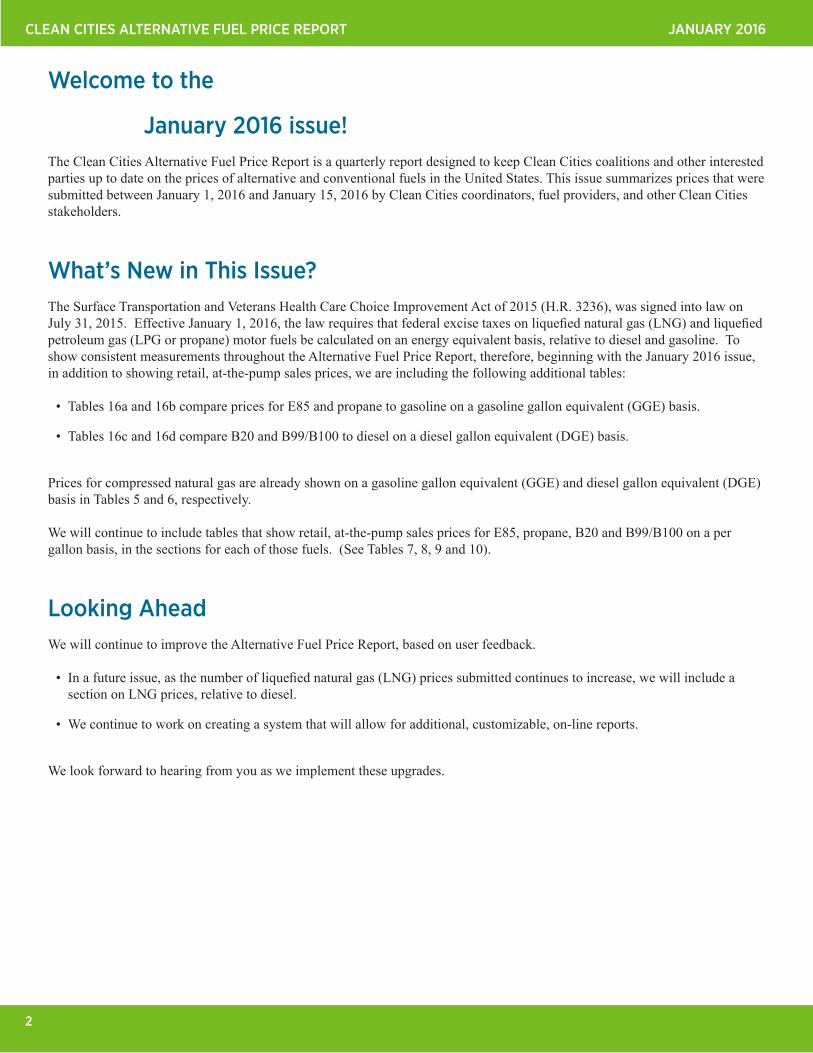
January 2016 issueThe Clean Cities Alternative Fuel Price Report is a quarterly report designed to keep Clean Cities coalitions and other interested parties up to date on the prices of alternative and conventional fuels in the United States This issue summarizes prices that were submitted between January 1 2016 and January 15 2016 by Clean Cities coordinators fuel providers and other Clean Cities stakeholders
Whatrsquos New in This IssueThe Surface Transportation and Veterans Health Care Choice Improvement Act of 2015 (HR 3236) was signed into law on July 31 2015 Effective January 1 2016 the law requires that federal excise taxes on liquefied natural gas (LNG) and liquefied petroleum gas (LPG or propane) motor fuels be calculated on an energy equivalent basis relative to diesel and gasoline To show consistent measurements throughout the Alternative Fuel Price Report therefore beginning with the January 2016 issue in addition to showing retail at-the-pump sales prices we are including the following additional tables
bull Tables 16a and 16b compare prices for E85 and propane to gasoline on a gasoline gallon equivalent (GGE) basis
bull Tables 16c and 16d compare B20 and B99B100 to diesel on a diesel gallon equivalent (DGE) basis
Prices for compressed natural gas are already shown on a gasoline gallon equivalent (GGE) and diesel gallon equivalent (DGE) basis in Tables 5 and 6 respectively
We will continue to include tables that show retail at-the-pump sales prices for E85 propane B20 and B99B100 on a per gallon basis in the sections for each of those fuels (See Tables 7 8 9 and 10)
Looking AheadWe will continue to improve the Alternative Fuel Price Report based on user feedback
bull In a future issue as the number of liquefied natural gas (LNG) prices submitted continues to increase we will include a section on LNG prices relative to diesel
bull We continue to work on creating a system that will allow for additional customizable on-line reports
We look forward to hearing from you as we implement these upgrades
3
CLEAN CITIES ALTERNATIVE FUEL PRICE REPORT JANUARY 2016
Methodologybull This reportrsquos prices represent retail at-the-pump sales
prices for each fuel including federal and state motor fuel taxes1
bull Clean Cities coordinators fuel providers and other key stakeholders provide prices for fuels in their areas on a voluntary basis
bull Prices were submitted for all major alternative fuels currently in widespread use ie natural gas propane biodiesel and ethanol
bull Prices were submitted for conventional fuels from stations that also sell alternative fuels or from nearby stations
bull Prices from public and private refueling stations are included2
bull Prices were averaged to determine regional price trends by fuel and variability in fuel price within and among regions3
bull Some states charge a flat annual fee in lieu of collecting motor fuel taxes at the pump usually for large trucks using gaseous fuels like compressed natural gas (CNG) and liquefied petroleum gas (LPG or propane) These flat fees are not included in the prices reported in these pages
bull Consistent with the US Energy Information Administration (EIA) fuel price reporting format prices are grouped by the Petroleum Administration for Defense Districts (PADD) The PADD districts are illustrated in the map below
FIGURE 1 PETROLEUM ADMINSTRATION FOR DEFENSE DISTRICTS (PADD)Source US Energy Information Administration
Number of Data Points Submitted
Region Gasoline Diesel CNG Ethanol Propane B20 B99B100
New England 40 33 28 5 25 11 4
Central Atlantic 87 88 93 97 50 32 2
Lower Atlantic 71 66 62 80 129 22 13
Midwest 234 128 117 226 78 21 0
Gulf Coast 87 71 59 127 126 7 2
Rocky Mountain 104 75 108 63 76 9 1
West Coast 122 138 130 78 125 34 28
TOTAL 745 599 597 676 609 136 50
1 In some cases prices were submitted by government refueling facilities and motor fuel taxes were not included in the prices reported to Clean Cities In these instances the appropriate federal and state motor fuel taxes have been added to the reported prices to provide a more representative basis for comparison 2 Public refueling stations are open to the public while private fueling stations are privately-owned or available only to selected fleets 3Fuel price averages for this report are determined by simply averaging the individual data points received A comparison of average fuel prices for private and for public stations by region can be found on pages 20-21
TABLE 1
CLEAN CITIES ALTERNATIVE FUEL PRICE REPORT JANUARY 2016
4
Summary of Current Report Information
National Average Retail Fuel PricesConventional and Alternative Fuels January 2016
Fuel Type4 October 2015
January 2016
Change in PriceOctober-January
Units of Measurement
Gasoline (E10)
$235 $198 -$037 per gallon
Diesel $259 $223 -$036 per gallon
CNG $209 $209 $000 per GGE
Ethanol (E85) $218 $186 -$032 per gallon
Propane $290 $285 -$005 per gallon
Biodiesel (B20) $266 $241 -$025 per gallon
Biodiesel (B99B100)
$340 $321 -$019 per gallon
TABLE 2
Liquid fuels have differing energy contents per gallon so the price paid per unit of energy content can differ somewhat from the price paid per gallon Table 3 shows fuel prices from Table 2 normalized to an energy-equivalent basis
Note that for the alternative fuels prices on an energy-equivalent basis ie $GGE or $DGE are generally higher than the prices per gallon due to their lower energy content5
Propane prices include information from both ldquoprimaryrdquo and ldquosecondaryrdquo stations Primary stations have dedicated vehicle services and tend to be less expensive than secondary stations which mostly serve the propane tank and bottle market
Prices for Table 3 were calculated using the nominal lower heating values in BTUs per gallon of fuel from the Oak Ridge National Laboratoryrsquos Transportation Energy Data Book6
National Average Retail Fuel Prices On An Energy-Equivalent Basis January 2016
Fuel TypePer Gasoline
Gallon Equivalent ($GGE)
Per Diesel Gallon Equivalent
($DGE)
Per Million British Thermal Units ($MBtu)
Gasoline (E10)
$198 $224 $1732
Diesel $199 $223 $1733
CNG $209 $236 $1829
Ethanol (E85)
$242 $273 $2763
Propane $391 $440 $4683
Biodiesel (B20)
$217 $246 $1717
Biodiesel (B99B100)
$315 $353 $2690
Table 2 shows national average retail fuel prices for this report and the previous report Changes in average retail prices from one quarter to another may be due to a number of factors including an actual change in price different sample sizes the inclusion of different locations and seasonal variations in demand
Prices in this report were reported in the units in which they are typically sold for example dollars per gallon of gasoline or dollars per gasoline gallon equivalent (GGE) of CNG
Consumer interest in alternative fuels generally increases when the alternative fuel price is less than the conventional fuel price on a per gallon basis even if that differential does not directly translate to savings on an energy-equivalent basis
TABLE 3
4 A very small sample (6 points) of hydrogen information was received with an average price of $1393GGE 5 For ethanol flexible-fuel vehicles (FFVs) the actual difference in fuel used per mile is somewhat less than would be calculated simply on the difference in energy content of the fuels Some sources have noted that some FFVs can achieve better energy efficiency (miles per unit of energy) on E85 than on gasoline This effect is not currently included in these calculations as the magnitude of the effect varies by specific FFV model6 httpctaornlgovdata A listing of the conversion factors used appears as an appendix at the end of this report
Includes public and private stationsIncludes primary and secondary stations
Includes public and private stationsIncludes primary and secondary stations
5
CLEAN CITIES ALTERNATIVE FUEL PRICE REPORT JANUARY 2016
Gasoline and Diesel Prices Clean Cities and EIA Data
Table 4 below shows gasoline and diesel prices submitted by Clean Cities coordinators fuel providers and other stakeholders on a voluntary basis between January 1 and January 15 2016 compared to prices from the petroleum information section of the Energy Information Administration (EIA) website for the week of January 4 2016
Clean Cities prices for conventional fuels were obtained from retail stations providing alternative fuel price information or from nearby stations so data collection was not uniform across the regions of the country however the information is representative of refueling stations selling both alternative fuels and conventional fuels
Average Retail Gasoline and Diesel Prices by Region in $gal from Clean Cities and EIA Sources
GASOLINE PRICES DIESEL PRICES
Region Clean Cities EIA Difference Clean Cities EIA Difference
New England $212 $204 $008 $250 $234 $016
Central Atlantic $201 $207 -$006 $227 $239 -$012
Lower Atlantic $193 $193 $000 $219 $214 $005
Midwest $183 $186 -$003 $205 $213 -$008
Gulf Coast $166 $175 -$009 $201 $211 -$010
Rocky Mountain $184 $196 -$012 $205 $219 -$014
West Coast $260 $266 -$006 $255 $246 $009
NATIONAL AVERAGE $198 $203 -$005 $223 $221 $002
EIA = Energy Information AdministrationEIA prices are from the petroleum information section of the EIA website week of January 4 2016 httpwwweiagovdnavpetxlsPET_PRI_GND_A_EPMR_PTE_DPGAL_WxlshttpwwweiagovdnavpetxlsPET_PRI_GND_A_EPD2D_PTE_DPGAL_WxlsNegative numbers represent average Clean Cities prices that are lower than EIA prices
TABLE 4
The EIA data shows weekly average prices from a sample of approximately 800 retail gasoline and 400 retail diesel outlets across the country The EIA data points are weighted to reflect the quantity of fuel being sold at that price
The Clean Cities data is not weighted and represents simple averages of reported prices While there is some variation the EIA average prices match relatively closely with the average prices reported by Clean Cities coordinators
CLEAN CITIES ALTERNATIVE FUEL PRICE REPORT JANUARY 2016
6
Compressed Natural Gas (Relative to Gasoline)
CNG prices in Table 5 were obtained from the ldquoprice at the pumprdquo given in $gasoline gallon equivalent (GGE) and averaged for each region
As with other fuels the energy content of natural gas can vary CNG dispensers are calibrated for local gas compositions and dispense an accurate GGE for the actual gas being sold
COMPRESSED NATURAL GAS (CNG) AND GASOLINE AVERAGE RETAIL PRICES BY REGION
Region CNG Prices ($GGE)
Gasoline Prices ($gal)
PriceDifference
New England $245 $212 $033
Central Atlantic $197 $201 -$004
Lower Atlantic $206 $193 $013
Midwest $195 $183 $012
Gulf Coast $203 $166 $037
Rocky Mountain $191 $184 $007
West Coast $240 $260 -$020
NATIONAL AVERAGE $209 $198 $011
The prices shown in Table 5 were submitted by Clean Cities coordinators fuel providers and other stakeholders on a voluntary basis between January 1 and January 15 2016
On average during this reporting period CNG cost about $011 more than gasoline on a per gasoline gallon equivalent (GGE) basis
In this map negative numbers represent prices for CNG that
are lower than gasoline on a per gasoline gallon equivalent basis
States not highlighted with a color did not have any CNG data points in
the current report
FIGURE 2 PRICE DIFFERENTIALS BY STATE FOR COMPRESSED NATURAL GAS (CNG) RELATIVE TO GASOLINE
CNG Price DifferenceRelative to Gasoline
GGE = gasoline gallon equivalentNegative numbers represent average CNG prices that are lower than gasoline on a $GGE basis
TABLE 5
Note The Alternative Fuel Price Report is a snapshot in time of retail fuel prices Alternative fuel fleets can obtain significantly lower fuel prices than those reported in the AFPR by entering into contracts directly with local fuel suppliers Contract prices will vary depending on fleet size and amount of fuel to be purchased distance from the supplier region of the country and other factors
7
CLEAN CITIES ALTERNATIVE FUEL PRICE REPORT JANUARY 2016
2010 2012 20142009 2011 lsquo162013 2015lsquo07 2008O J A J O J A J O J A J O J A J O J A J O J A J O J A J O OJ A J J
Natural Gas (GGE)Gasoline
$150
$175
$200
$225
$250
$275
$300
$325
$350
$375
$400
Pric
e pe
r gas
olin
e ga
llon
equi
vale
nt (
$G
GE)
Compressed Natural Gas (CNG) cont
FIGURE 3 HISTORICAL COMPRESSED NATURAL GAS (CNG) PRICES VERSUS GASOLINE
CNG
CLEAN CITIES ALTERNATIVE FUEL PRICE REPORT JANUARY 2016
8
Compressed Natural Gas (Relative to Diesel)7
Table 6 shows the prices from Table 5 converted to $diesel gallon equivalent ($DGE) for easy comparison with diesel prices
As with other fuels the energy content of natural gas can vary CNG dispensers are calibrated for local gas compositions and dispense an accurate GGE for the actual gas being sold
COMPRESSED NATURAL GAS (CNG) AND DIESEL AVERAGE RETAIL PRICES BY REGION
Region CNG Prices ($DGE)
Diesel Prices ($gal)
PriceDifference
New England $277 $250 $027
Central Atlantic $223 $227 -$004
Lower Atlantic $233 $219 $014
Midwest $221 $205 $016
Gulf Coast $229 $201 $028
Rocky Mountain $216 $205 $011
West Coast $271 $255 $016
NATIONAL AVERAGE $236 $223 $013
The prices shown in Table 6 were submitted by Clean Cities coordinators fuel providers and other stakeholders on a voluntary basis between January 1 and January 15 2016
On average during this reporting period CNG cost about $013 more than diesel on a per diesel gallon equivalent basis
In this map negative numbers represent prices for CNG that are lower
than diesel on a per diesel gallon equivalent basis States not highlighted with a color did not have any CNG data
points in the current report
FIGURE 4 PRICE DIFFERENTIALS BY STATE FOR COMPRESSED NATURAL GAS (CNG) RELATIVE TO DIESEL
CNG Price DifferenceRelative to Diesel
DGE = diesel gallon equivalent Negative numbers represent average CNG prices that are lower than diesel on a $DGE basis
7 A total of 43 liquefied natural gas (LNG) prices were submitted with an average fuel price of $245DGE Because of the small number of price points this data is not reflected in the report
TABLE 6
Note The Alternative Fuel Price Report is a snapshot in time of retail fuel prices Alternative fuel fleets can obtain significantly lower fuel prices than those reported in the AFPR by entering into contracts directly with local fuel suppliers Contract prices will vary depending on fleet size and amount of fuel to be purchased distance from the supplier region of the country and other factors
9
CLEAN CITIES ALTERNATIVE FUEL PRICE REPORT JANUARY 2016
2010 2012 20142009 2011 lsquo162013 2015lsquo07 2008O J A J O J A J O J A J O J A J O J A J O J A J O J A J O OJ A J J
Natural Gas (DGE)Diesel
$175
$200
$225
$250
$275
$300
$325
$350
$375
$400
$425
$450
$475
Pric
e pe
r die
sel g
allo
n eq
uiva
lent
($
DG
E)
Compressed Natural Gas (CNG) cont
FIGURE 5 HISTORICAL COMPRESSED NATURAL GAS (CNG) PRICES VERSUS DIESEL
CNG
CLEAN CITIES ALTERNATIVE FUEL PRICE REPORT JANUARY 2016
10
Ethanol (E85)
Most gasoline available throughout the United States today is a blend of 90 gasoline and up to 10 ethanol or E10 Additionally the E85 that is sold in the United States today actually contains on average approximately 70 ethanol
E85 energy content for this report is therefore calculated as (70)(E100 energy content) + (30)(E0 energy content) to more closely reflect the actual energy content of E85 fuel available today
ETHANOL (E85) AND GASOLINE AVERAGE RETAIL PRICES BY REGION
Region E85 Prices ($gal)
Gasoline Prices ($gal)
PriceDifference
New England $251 $212 $039
Central Atlantic $212 $201 $011
Lower Atlantic $192 $193 -$001
Midwest $169 $183 -$014
Gulf Coast $159 $166 -$007
Rocky Mountain $187 $184 $003
West Coast $237 $260 -$023
NATIONAL AVERAGE $186 $198 -$012
The prices shown in Table 7 were submitted by Clean Cities coordinators fuel providers and other stakeholders on a voluntary basis between January 1 and January 15 2016
On average during this reporting period E85 cost about $012 less than gasoline on a per gallon basis
In this map negative numbers represent prices for E85 that are
lower than gasoline on a per gallon basis States not highlighted with a color did not have any E85 data
points in the current report
FIGURE 6 PRICE DIFFERENTIALS BY STATE FOR E85 RELATIVE TO GASOLINE
E85 Price DifferenceRelative to Gasoline
Negative numbers represent average E85 prices that are lower than gasoline on a $gal basis
TABLE 7
11
CLEAN CITIES ALTERNATIVE FUEL PRICE REPORT JANUARY 2016
2010 2012 20142009 2011 lsquo162013 2015lsquo07 2008O J A J O J A J O J A J O J A J O J A J O J A J O J A J O OJ A J J
$175
$200
$225
$250
$275
$300
$325
$350
$375
$400
EthanolGasoline
Ethanol (E85) cont
FIGURE 7 HISTORICAL ETHANOL (E85) PRICES VERSUS GASOLINE
CLEAN CITIES ALTERNATIVE FUEL PRICE REPORT JANUARY 2016
12
Propane (LPG)
Propane prices in this report are from both private fleet refueling stations and public refueling sites that can provide propane for vehicles and for other uses8
Note The Alternative Fuel Price Report is a snapshot in time of retail fuel prices Alternative fuel fleets can obtain significantly lower fuel prices than those reported in the AFPR by entering into contracts directly with local fuel suppliers Contract prices will vary depending on fleet size and amount of fuel to be purchased distance from the supplier region of the country and other factors
PROPANE (LPG) AND GASOLINE AVERAGE RETAIL PRICES BY REGION
Region LPG Prices ($gal)
Gasoline Prices ($gal)
PriceDifference
New England $289 $212 $077
Central Atlantic $279 $201 $078
Lower Atlantic $285 $193 $092
Midwest $245 $183 $062
Gulf Coast $304 $166 $138
Rocky Mountain $288 $184 $104
West Coast $294 $260 $034
NATIONAL AVERAGE $285 $198 $087
The prices shown in Table 8 were submitted by Clean Cities coordinators fuel providers and other stakeholders on a voluntary basis between January 1 and January 15 2016
On average during this reporting period propane cost about $087 more than gasoline on a per (liquid) gallon basis
8 Because many propane retailers provide fuel for non-vehicle uses (camping stoves gas grills etc) the National Renewable Energy Laboratory (NREL) has worked with suppliers to clarify the differences On the AFDC Station Locator website (httpwwwafdcenergygovlocatorstations) each public propane station is designated as a ldquoprimaryrdquo or ldquosecondaryrdquo service type Both types are able to fuel vehicles however stations designated as ldquoprimaryrdquo have indicated they have facilities and billing procedures specifically designed for vehicle customers They may also offer special vehicle pricing and most accept major credit cards similar to traditional gasolinediesel retailers Propane pricing reported in this guide reflects a sampling of both primary and secondary stations
In this map negative numbers represent prices for propane that are
lower than gasoline on a per gallon basis States not highlighted with a
color did not have any propane data points in the current report
FIGURE 8 PRICE DIFFERENTIALS BY STATE FOR PROPANE (LPG) RELATIVE TO GASOLINE
LPG Price DifferenceRelative to Gasoline
Negative numbers represent average propane prices that are lower than gasoline on a $gal basis
TABLE 8
13
CLEAN CITIES ALTERNATIVE FUEL PRICE REPORT JANUARY 2016
2010 2012 20142009 2011 lsquo162013 2015lsquo07 2008O J A J O J A J O J A J O J A J O J A J O J A J O J A J O OJ A J J
PropaneGasoline
Propane (LPG) cont
FIGURE 9 HISTORICAL PROPANE (LPG) PRICES VERSUS GASOLINE
LPG
CLEAN CITIES ALTERNATIVE FUEL PRICE REPORT JANUARY 2016
14
Biodiesel Blends B20
B20 is a blend of 20 biodiesel and 80 conventional diesel B20 contains only about 2 less energy (BTUs) per volume than 100 diesel The appendix at the end of this report provides conversion factors for calculating B20 prices on a GGE and DGE basis
BIODIESEL (B20) AND DIESEL AVERAGE RETAIL PRICES BY REGION
Region B20 Prices ($gal)
Diesel Prices ($gal)
PriceDifference
New England $249 $250 -$001
Central Atlantic $233 $227 $006
Lower Atlantic $228 $219 $009
Midwest $230 $205 $025
Gulf Coast $210 $201 $009
Rocky Mountain $221 $205 $016
West Coast $274 $255 $019
NATIONAL AVERAGE $241 $223 $018
The prices shown in Table 9 were submitted by Clean Cities coordinators fuel providers and other stakeholders on a voluntary basis between January 1 and January 15 2016
On a national average basis during this reporting period B20 cost about $018 more than diesel on a per gallon basis
In this map negative numbers represent prices for B20 that are lower than diesel on a per gallon basis States not highlighted with
a color did not have any B20 data points in the current report
FIGURE 10 PRICE DIFFERENTIALS BY STATE FOR B20 RELATIVE TO DIESEL
B20 Price DifferenceRelative to Diesel
Negative numbers represent average B20 prices that are lower than diesel on a $GAL basis
Note that B20 prices in many regions track very closely with diesel prices
TABLE 9
15
CLEAN CITIES ALTERNATIVE FUEL PRICE REPORT JANUARY 2016
2010 2012 20142009 2011 lsquo162013 2015lsquo07 2008O J A J O J A J O J A J O J A J O J A J O J A J O J A J O OJ A J J
$175
$200
$225
$250
$275
$300
$325
$350
$375
$400
$425
$450
$475
B20Diesel
Biodiesel Blends B20 cont
FIGURE 11 HISTORICAL B20 PRICES VERSUS DIESEL
CLEAN CITIES ALTERNATIVE FUEL PRICE REPORT JANUARY 2016
16
Biodiesel Blends B99B100
B100 contains about 10 less energy (BTUs) per volume than 100 diesel
The appendix at the end of this report provides conversion factors for calculating B100 prices on a GGE and DGE basis
BIODIESEL (B99B100) AND DIESEL AVERAGE RETAIL PRICES BY REGION
Region B99B100 Prices ($gal)
Diesel Prices ($gal)
PriceDifference
New England 235 250 -015
Central Atlantic 430 227 203
Lower Atlantic 312 219 093
Midwest --- 205 ---
Gulf Coast 228 201 027
Rocky Mountain 240 205 035
West Coast 339 255 084
NATIONAL AVERAGE 321 223 098
The prices shown in Table 10 were submitted by Clean Cities coordinators fuel providers and other stakeholders on a voluntary basis between January 1 and January 15 2016
On average during this reporting period B99B100 cost about $098 more than diesel on a per gallon basis
In this map negative numbers represent prices for B99B100 that
are lower than diesel on a per gallon basis States not highlighted with
a color did not have any B99B100 data points in the current report
FIGURE 12 PRICE DIFFERENTIALS BY STATE FOR B99B100 RELATIVE TO DIESEL
B99B100 Price Difference
Relative to Diesel
Negative numbers represent average B99B100 prices that are lower than diesel on a $GAL basis
TABLE 10
17
CLEAN CITIES ALTERNATIVE FUEL PRICE REPORT JANUARY 2016
2010 2012 20142009 2011 lsquo162013 2015lsquo07 2008O J A J O J A J O J A J O J A J O J A J O J A J O J A J O OJ A J J$200
$225
$250
$275
$300
$325
$350
$375
$400
$425
$450
$475
$500
B99B100Diesel
Biodiesel Blends B99B100 cont
FIGURE 13 HISTORICAL B99B100 PRICES VERSUS DIESEL
CLEAN CITIES ALTERNATIVE FUEL PRICE REPORT JANUARY 2016
18
Comparison Of Prices This Report Versus Last ReportThe following tables summarize the average retail prices submitted for this report by region and compare them to prices submitted for the October 2015 Alternative Fuel Price Report It should be noted that a portion of the price changes may be attributed to differing sample sizes and locations between the two reports
GASOLINE ($ per gallon)
Region Price for October 2015
Price for January 2016 Difference in $ Difference in
New England 241 212 -029 -1203
Central Atlantic 220 201 -019 -864
Lower Atlantic 215 193 -022 -1023
Midwest 236 183 -053 -2246
Gulf Coast 197 166 -031 -1574
Rocky Mountain 235 184 -051 -2170
West Coast 276 260 -016 -580
NATIONAL AVERAGE 235 198 -037 -1574
Region Price for October 2015
Price for January 2016 Difference in $ Difference in
New England 272 250 -022 -809
Central Atlantic 273 227 -046 -1685
Lower Atlantic 248 219 -029 -1169
Midwest 247 205 -042 -1700
Gulf Coast 227 201 -026 -1145
Rocky Mountain 246 205 -041 -1667
West Coast 280 255 -025 -893
NATIONAL AVERAGE 259 223 -036 -1390
DIESEL ($ per gallon)
CNG ($ per GGE)
Region Price for October 2015
Price for January 2016 Difference in $ Difference in
New England 244 245 001 041
Central Atlantic 199 197 -002 -101
Lower Atlantic 207 206 -001 -048
Midwest 203 195 -008 -394
Gulf Coast 204 203 -001 -049
Rocky Mountain 189 191 002 106
West Coast 237 240 003 127
NATIONAL AVERAGE 209 209 000 000
CNG
TABLE 11 a
TABLE 11 b
TABLE 11 c
19
CLEAN CITIES ALTERNATIVE FUEL PRICE REPORT JANUARY 2016
Comparison Of Prices This Report Versus Last Report cont
Region Price for Oct 2015 Price for January 2016 Difference in $ Difference in
New England 278 251 -027 -971
Central Atlantic 241 212 -029 -1203
Lower Atlantic 207 192 -015 -725
Midwest 211 169 -042 -1991
Gulf Coast 192 159 -033 -1719
Rocky Mountain 220 187 -033 -1500
West Coast 262 237 -025 -954
NATIONAL AVERAGE 218 186 -032 -1468
Region Price for Oct 2015 Price for January 2016 Difference in $ Difference in
New England 284 289 005 176
Central Atlantic 268 279 011 410
Lower Atlantic 296 285 -011 -372
Midwest 270 245 -025 -926
Gulf Coast 299 304 005 167
Rocky Mountain 291 288 -003 -103
West Coast 296 294 -002 -068
NATIONAL AVERAGE 290 285 -005 -172
Region Price for Oct 2015 Price for January 2016 Difference in $ Difference in
New England 270 249 -021 -778
Central Atlantic 260 233 -027 -1038
Lower Atlantic 256 228 -028 -1094
Midwest 253 230 -023 -909
Gulf Coast 251 210 -041 -1633
Rocky Mountain 255 221 -034 -1333
West Coast 296 274 -022 -743
NATIONAL AVERAGE 266 241 -025 -940
Region Price for Oct 2015 Price for January 2016 Difference in $ Difference in
New England 262 235 -027 -1031
Central Atlantic 582 430 -152 -2612
Lower Atlantic 333 312 -021 -631
Midwest 246 --- --- ---
Gulf Coast 249 228 -021 -843
Rocky Mountain 259 240 -019 -734
West Coast 353 339 -014 -397
NATIONAL AVERAGE 340 321 -019 -559
ETHANOL (E85)
($ per gallon)
PROPANE ($ per gallon)
BIODIESELB20
($ per gallon)
LPG
BIODIESELB99B100
($ per gallon)
TABLE 11 d
TABLE 11 e
TABLE 11 f
TABLE 11 g
CLEAN CITIES ALTERNATIVE FUEL PRICE REPORT JANUARY 2016
20
Price Comparison By Region For Public amp Private Refueling StationsThe tables below summarize average retail fuel prices contained in this report sorted by type of refueling station ie ldquoprivaterdquo or ldquopublicrdquo The stations classified as ldquopublicrdquo are open to the general public The majority of the stations classified as ldquoprivaterdquo are operated by state or local government agencies transit agencies utility districts colleges or universities or military facilities They serve the host agencyrsquos fleets and may have contractual or other arrangements in place to sell fuel to other government agencies andor selected other fleets In some cases contracts may include billing accounting or fleet service management fees that are rolled into the price of the fuel
For this report there were 3101 prices submitted from ldquopublicrdquo refueling stations and 360 prices submitted from ldquoprivaterdquo refueling stations for a total of 3461 prices
As with the other prices in this report these prices include state and federal taxes as described in the Methodology section of this document
Region PRIVATE PUBLIC
New England $213 $212
Central Atlantic $199 $201
Lower Atlantic $200 $193
Midwest $221 $181
Gulf Coast --- $166
Rocky Mountain $187 $184
West Coast $263 $259
NATIONAL AVERAGE $223 $196
Region PRIVATE PUBLIC
New England $202 $250
Central Atlantic $182 $204
Lower Atlantic $075 $213
Midwest $189 $197
Gulf Coast $177 $206
Rocky Mountain $176 $201
West Coast $207 $244
NATIONAL AVERAGE $182 $216
Region PRIVATE PUBLIC
New England $253 $250
Central Atlantic $207 $238
Lower Atlantic $199 $220
Midwest $167 $206
Gulf Coast --- $201
Rocky Mountain $162 $206
West Coast $239 $256
NATIONAL AVERAGE $214 $224
Region PRIVATE PUBLIC
New England --- $251
Central Atlantic $217 $211
Lower Atlantic $231 $192
Midwest $192 $167
Gulf Coast $199 $158
Rocky Mountain $167 $188
West Coast $244 $237
NATIONAL AVERAGE $205 $185
TABLE 12 a - GasolineAverage Retail Price by Refueling Station Type ($gal)
TABLE 12 b - DieselAverage Retail Price by Refueling Station Type ($gal)
TABLE 12 c - CNGAverage Retail Price by Refueling Station Type ($GGE)
TABLE 12 d - E85Average Retail Price by Refueling Station Type ($gal)
--- indicates no data points were submitted for this region
21
CLEAN CITIES ALTERNATIVE FUEL PRICE REPORT JANUARY 2016
Region PRIVATE PUBLIC
New England $258 $290
Central Atlantic $134 $320
Lower Atlantic $382 $284
Midwest $161 $249
Gulf Coast $131 $315
Rocky Mountain $243 $289
West Coast $302 $293
NATIONAL AVERAGE $200 $291
Region PRIVATE PUBLIC
New England $214 $270
Central Atlantic $221 $270
Lower Atlantic $204 $232
Midwest $205 $232
Gulf Coast $199 $212
Rocky Mountain --- $221
West Coast $228 $293
NATIONAL AVERAGE $220 $252
Comparison Of Prices By Region For Public amp Private Refueling Stations cont
Region PRIVATE PUBLIC
New England --- $235
Central Atlantic $161 $698
Lower Atlantic $350 $289
Midwest --- ---
Gulf Coast --- $227
Rocky Mountain --- $240
West Coast $341 $339
NATIONAL AVERAGE $326 $320
TABLE 12 e - PropaneAverage Retail Price by Refueling Station Type ($gal)
TABLE 12 f - B20Average Retail Price by Refueling Station Type ($gal)
TABLE 12 g - B99B100Average Retail Price by Refueling Station Type ($gal)
--- indicates no data points were submitted for this region
CLEAN CITIES ALTERNATIVE FUEL PRICE REPORT JANUARY 2016
22
Historical Alternative Fuel Prices From Previous ReportsThe following graphs illustrate historical prices for the alternative fuels included in the Alternative Fuel Price Report from 2007 to the present relative to gasoline and diesel Compressed natural gas (in GGE) propane and ethanol (E85) have been graphed against gasoline prices while compressed natural gas (in DGE) and biodiesel blends (B20 and B99B100) have been graphed against diesel prices
2010 2012 20142009 2011 lsquo162013 2015lsquo07 2008O J A J O J A J O J A J O J A J O J A J O J A J O J A J O OJ A J J
Natural Gas (GGE)Gasoline Ethanol (E85) Propane
$150
$175
$200
$225
$250
$275
$300
$325
$350
$375
$400
Pric
e pe
r gal
lon
2010 2012 20142009 2011 lsquo162013 2015lsquo07 2008O J A J O J A J O J A J O J A J O J A J O J A J O J A J O OJ A J J
Natural Gas (DGE)Diesel Biodiesel (B20) Biodiesel (B2B5)
$175
$200
$225
$250
$275
$300
$325
$350
$375
$400
$425
$450
$475
$500
Pric
e pe
r gal
lon
B99B100
FIGURE 14 ALTERNATIVE FUEL PRICES VERSUS GASOLINE
FIGURE 15 ALTERNATIVE FUEL PRICES VERSUS DIESEL
23
CLEAN CITIES ALTERNATIVE FUEL PRICE REPORT JANUARY 2016
Illustration of Conversion Factors for Fuels
9 httpctaornlgovdata10 According to the National Renewable Energy Laboratory (NREL) Alternative Fuels Data Center the energy content of common gasoline baseline references (E0 E10 and indolene) varies between 112114 and 116090 Btugal We chose 114300 Btugal for the E10 energy content consistent with the Transportation Energy Data Book (TEDB) energy content of CNG in GGEs See next footnote11 (566 lbs of CNGGGE) x (20200 BTUlb) = 114332 rounded to 11430012 Most gasoline available throughout the United States today is a blend of 90 gasoline and up to 10 ethanol or E10 Additionally the E85 that is sold in the United States today actually contains on average approximately 70 ethanol E85 energy content for this report is therefore calculated as [(70) x (E100 energy content)] + [(30) x (E0 energy content)] to more closely reflect the actual energy content of E85 fuel available today13 See footnote 12 above
Fuel Lower Heating Value
Gasoline (E0) 115400 BTUgal
Gasoline (E10)10 114300 BTUgal
Diesel 128700 BTUgal
Biodiesel (B100) 117100 BTUgal
Compressed Natural Gas (CNG)11 114300 BTUGGE
Ethanol (E100) 75700 BTUgal
Propane 83500 BTUgal
TABLE 13 Lower Heating Values
Conversion to GGE
The conversion factor used to convert the price of an alternative fuel from $gallon to $GGE is determined as follows
Conversion factor = BTUgal of gasoline (E10) BTUgal of alternative fuel
To calculate the price of an alternative fuel in $GGE multiply the price per gallon of the alternative fuel by the relevant conversion factor from Table 14
Fuel Conversion Factor
Biodiesel (B20) 090
Biodiesel (B100) 098
CNG 100
Ethanol (E85)12 130
Propane 137
TABLE 14 Conversion Factors $gal to $GGE
Fuel Conversion Factor
Biodiesel (B20) 102
Biodiesel (B100) 110
CNG 113
Ethanol (E85) 13 147
Propane 154
TABLE 15 Conversion Factors $gal to $DGE
Conversion factors used to establish prices in dollars per gasoline gallon equivalent ($GGE) and dollars per diesel gallon equivalent ($DGE) were developed using the lower heating values from the Transportation Energy Data Book Edition 339 and are listed to the left
In the case of CNG prices are provided to us in GGE so no conversion is necessary The representative heating value of CNG is provided in Table 13 as a reference
Conversion to DGE
The conversion factor used to convert the price of an alternative fuel from $gallon to $DGE is determined as follows
Conversion factor = BTUgal of diesel BTUgal of alternative fuel
For example the conversion factor used to convert a B100 price from $gal to $DGE is determined as follows
128700 BTUgal of diesel = 1099 rounded to 110 117100 BTUgal of B100
To calculate the price of an alternative fuel in $DGE multiply the price per gallon of the alternative fuel by the relevant conversion factor from Table 15
For example if the price of B100 is given as $300gal the $DGE is determined as follows ($300gal) x 110 = $330DGE
CLEAN CITIES ALTERNATIVE FUEL PRICE REPORT JANUARY 2016
24
ETHANOL (E85) AND GASOLINE AVERAGE RETAIL PRICES BY REGION (GGE)
Region E85 Prices ($GGE)
Gasoline Prices ($gal)
Price Difference
New England $326 $212 $114
Central Atlantic $276 $201 $075
Lower Atlantic $250 $193 $057
Midwest $220 $183 $037
Gulf Coast $207 $166 $041
Rocky Mountain $243 $184 $059
West Coast $308 $260 $048
NATIONAL AVERAGE
$242 $198 $044
TABLE 16aPROPANE (LPG) AND GASOLINE AVERAGE RETAIL PRICES
BY REGION (GGE)
Region LPG Prices ($GGE)
Gasoline Prices ($gal)
Price Difference
New England $396 $212 $184
Central Atlantic $382 $201 $181
Lower Atlantic $390 $193 $197
Midwest $336 $183 $153
Gulf Coast $416 $166 $250
Rocky Mountain $395 $184 $211
West Coast $403 $260 $143
NATIONAL AVERAGE
$390 $198 $192
TABLE 16b
BIODIESEL (B20) AND DIESEL AVERAGE RETAIL PRICES BY REGION (DGE)
Region B20 Prices ($DGE)
Diesel Prices ($gal)
Price Difference
New England $254 $250 $004
Central Atlantic $238 $227 $011
Lower Atlantic $233 $219 $014
Midwest $235 $205 $030
Gulf Coast $214 $201 $013
Rocky Mountain $225 $205 $020
West Coast $279 $255 $024
NATIONAL AVERAGE
$246 $223 $023
TABLE 16c
Negative numbers represent average E85 prices that are lower than gasoline on a $GGE basis Negative numbers represent average propane prices that are lower than gasoline on a $GGE basis
Negative numbers represent average B20 prices that are lower than gasoline on a $DGE basis
BIODIESEL (B99B100) AND DIESEL AVERAGE RETAIL PRICES BY REGION (DGE)
Region B99B100 Prices ($DGE)
Diesel Prices ($gal)
Price Difference
New England $258 $250 $009
Central Atlantic $473 $227 $246
Lower Atlantic $343 $219 $124
Midwest --- $205 ---
Gulf Coast $251 $201 $050
Rocky Mountain $264 $205 $059
West Coast $373 $255 $118
NATIONAL AVERAGE
$353 $223 $130
TABLE 16d
Negative numbers represent average B99B100 prices that are lower than gasoline on a $DGE basis
Comparison of Prices on an Energy-Equivalent BasisThe following tables compare prices for E85 propane B20 and B99B100 to conventional fuels (gasoline and diesel) on an energy-equivalent basis (Natural gas is generally sold in gasoline gallon equivalents or diesel gallon equivalents so the natural gas ldquoprice at the pumprdquo can be directly compared to the price of the corresponding conventional fuel as shown in Tables 5 and 6)
25
CLEAN CITIES ALTERNATIVE FUEL PRICE REPORT JANUARY 2016
AcknowledgementsThe authors would like to acknowledge all of the contributors from the Clean Cities community who have provided prices for this report we sincerely appreciate your continued dedication to the success of this report The authors would also like to acknowledge the continued support of DOE for developing this report
Would You Like To ParticipateIf you would like to provide prices for alternative fuels in your region and be part of the data collection effort for this report or if you have any questions please contact
US DOE Clean CitiesEE-3V1000 Independence Avenue SWWashington DC 20585Phone (202) 586-6459afprnwttechcom
DISCLAIMERThis document highlights work sponsored by agencies of the US Government Neither the US Government nor any agency thereof nor any of their employees makes any warranty express or implied or assumes any legal liability or responsibility for the accuracy completeness or usefulness of any information apparatus product or process disclosed or represents that its use would not infringe privately owned rights Reference herein to any specific commercial product process or ser-vice by trade name trademark manufacturer or otherwise does not necessarily constitute or imply its endorsement recommendation or favoring by the US Govern-ment or any agency thereof The views and opinions of authors expressed herein do not necessarily state or reflect those of the US Government or any agency thereof
For more information on this and other Clean Cities publications visit wwwcleancitiesenergygov or contact the Clean Cities Technical Response Service at 800-254-6735
CLEAN CITIES ALTERNATIVE FUEL PRICE REPORT JANUARY 2016
2
Welcome to the
January 2016 issueThe Clean Cities Alternative Fuel Price Report is a quarterly report designed to keep Clean Cities coalitions and other interested parties up to date on the prices of alternative and conventional fuels in the United States This issue summarizes prices that were submitted between January 1 2016 and January 15 2016 by Clean Cities coordinators fuel providers and other Clean Cities stakeholders
Whatrsquos New in This IssueThe Surface Transportation and Veterans Health Care Choice Improvement Act of 2015 (HR 3236) was signed into law on July 31 2015 Effective January 1 2016 the law requires that federal excise taxes on liquefied natural gas (LNG) and liquefied petroleum gas (LPG or propane) motor fuels be calculated on an energy equivalent basis relative to diesel and gasoline To show consistent measurements throughout the Alternative Fuel Price Report therefore beginning with the January 2016 issue in addition to showing retail at-the-pump sales prices we are including the following additional tables
bull Tables 16a and 16b compare prices for E85 and propane to gasoline on a gasoline gallon equivalent (GGE) basis
bull Tables 16c and 16d compare B20 and B99B100 to diesel on a diesel gallon equivalent (DGE) basis
Prices for compressed natural gas are already shown on a gasoline gallon equivalent (GGE) and diesel gallon equivalent (DGE) basis in Tables 5 and 6 respectively
We will continue to include tables that show retail at-the-pump sales prices for E85 propane B20 and B99B100 on a per gallon basis in the sections for each of those fuels (See Tables 7 8 9 and 10)
Looking AheadWe will continue to improve the Alternative Fuel Price Report based on user feedback
bull In a future issue as the number of liquefied natural gas (LNG) prices submitted continues to increase we will include a section on LNG prices relative to diesel
bull We continue to work on creating a system that will allow for additional customizable on-line reports
We look forward to hearing from you as we implement these upgrades
3
CLEAN CITIES ALTERNATIVE FUEL PRICE REPORT JANUARY 2016
Methodologybull This reportrsquos prices represent retail at-the-pump sales
prices for each fuel including federal and state motor fuel taxes1
bull Clean Cities coordinators fuel providers and other key stakeholders provide prices for fuels in their areas on a voluntary basis
bull Prices were submitted for all major alternative fuels currently in widespread use ie natural gas propane biodiesel and ethanol
bull Prices were submitted for conventional fuels from stations that also sell alternative fuels or from nearby stations
bull Prices from public and private refueling stations are included2
bull Prices were averaged to determine regional price trends by fuel and variability in fuel price within and among regions3
bull Some states charge a flat annual fee in lieu of collecting motor fuel taxes at the pump usually for large trucks using gaseous fuels like compressed natural gas (CNG) and liquefied petroleum gas (LPG or propane) These flat fees are not included in the prices reported in these pages
bull Consistent with the US Energy Information Administration (EIA) fuel price reporting format prices are grouped by the Petroleum Administration for Defense Districts (PADD) The PADD districts are illustrated in the map below
FIGURE 1 PETROLEUM ADMINSTRATION FOR DEFENSE DISTRICTS (PADD)Source US Energy Information Administration
Number of Data Points Submitted
Region Gasoline Diesel CNG Ethanol Propane B20 B99B100
New England 40 33 28 5 25 11 4
Central Atlantic 87 88 93 97 50 32 2
Lower Atlantic 71 66 62 80 129 22 13
Midwest 234 128 117 226 78 21 0
Gulf Coast 87 71 59 127 126 7 2
Rocky Mountain 104 75 108 63 76 9 1
West Coast 122 138 130 78 125 34 28
TOTAL 745 599 597 676 609 136 50
1 In some cases prices were submitted by government refueling facilities and motor fuel taxes were not included in the prices reported to Clean Cities In these instances the appropriate federal and state motor fuel taxes have been added to the reported prices to provide a more representative basis for comparison 2 Public refueling stations are open to the public while private fueling stations are privately-owned or available only to selected fleets 3Fuel price averages for this report are determined by simply averaging the individual data points received A comparison of average fuel prices for private and for public stations by region can be found on pages 20-21
TABLE 1
CLEAN CITIES ALTERNATIVE FUEL PRICE REPORT JANUARY 2016
4
Summary of Current Report Information
National Average Retail Fuel PricesConventional and Alternative Fuels January 2016
Fuel Type4 October 2015
January 2016
Change in PriceOctober-January
Units of Measurement
Gasoline (E10)
$235 $198 -$037 per gallon
Diesel $259 $223 -$036 per gallon
CNG $209 $209 $000 per GGE
Ethanol (E85) $218 $186 -$032 per gallon
Propane $290 $285 -$005 per gallon
Biodiesel (B20) $266 $241 -$025 per gallon
Biodiesel (B99B100)
$340 $321 -$019 per gallon
TABLE 2
Liquid fuels have differing energy contents per gallon so the price paid per unit of energy content can differ somewhat from the price paid per gallon Table 3 shows fuel prices from Table 2 normalized to an energy-equivalent basis
Note that for the alternative fuels prices on an energy-equivalent basis ie $GGE or $DGE are generally higher than the prices per gallon due to their lower energy content5
Propane prices include information from both ldquoprimaryrdquo and ldquosecondaryrdquo stations Primary stations have dedicated vehicle services and tend to be less expensive than secondary stations which mostly serve the propane tank and bottle market
Prices for Table 3 were calculated using the nominal lower heating values in BTUs per gallon of fuel from the Oak Ridge National Laboratoryrsquos Transportation Energy Data Book6
National Average Retail Fuel Prices On An Energy-Equivalent Basis January 2016
Fuel TypePer Gasoline
Gallon Equivalent ($GGE)
Per Diesel Gallon Equivalent
($DGE)
Per Million British Thermal Units ($MBtu)
Gasoline (E10)
$198 $224 $1732
Diesel $199 $223 $1733
CNG $209 $236 $1829
Ethanol (E85)
$242 $273 $2763
Propane $391 $440 $4683
Biodiesel (B20)
$217 $246 $1717
Biodiesel (B99B100)
$315 $353 $2690
Table 2 shows national average retail fuel prices for this report and the previous report Changes in average retail prices from one quarter to another may be due to a number of factors including an actual change in price different sample sizes the inclusion of different locations and seasonal variations in demand
Prices in this report were reported in the units in which they are typically sold for example dollars per gallon of gasoline or dollars per gasoline gallon equivalent (GGE) of CNG
Consumer interest in alternative fuels generally increases when the alternative fuel price is less than the conventional fuel price on a per gallon basis even if that differential does not directly translate to savings on an energy-equivalent basis
TABLE 3
4 A very small sample (6 points) of hydrogen information was received with an average price of $1393GGE 5 For ethanol flexible-fuel vehicles (FFVs) the actual difference in fuel used per mile is somewhat less than would be calculated simply on the difference in energy content of the fuels Some sources have noted that some FFVs can achieve better energy efficiency (miles per unit of energy) on E85 than on gasoline This effect is not currently included in these calculations as the magnitude of the effect varies by specific FFV model6 httpctaornlgovdata A listing of the conversion factors used appears as an appendix at the end of this report
Includes public and private stationsIncludes primary and secondary stations
Includes public and private stationsIncludes primary and secondary stations
5
CLEAN CITIES ALTERNATIVE FUEL PRICE REPORT JANUARY 2016
Gasoline and Diesel Prices Clean Cities and EIA Data
Table 4 below shows gasoline and diesel prices submitted by Clean Cities coordinators fuel providers and other stakeholders on a voluntary basis between January 1 and January 15 2016 compared to prices from the petroleum information section of the Energy Information Administration (EIA) website for the week of January 4 2016
Clean Cities prices for conventional fuels were obtained from retail stations providing alternative fuel price information or from nearby stations so data collection was not uniform across the regions of the country however the information is representative of refueling stations selling both alternative fuels and conventional fuels
Average Retail Gasoline and Diesel Prices by Region in $gal from Clean Cities and EIA Sources
GASOLINE PRICES DIESEL PRICES
Region Clean Cities EIA Difference Clean Cities EIA Difference
New England $212 $204 $008 $250 $234 $016
Central Atlantic $201 $207 -$006 $227 $239 -$012
Lower Atlantic $193 $193 $000 $219 $214 $005
Midwest $183 $186 -$003 $205 $213 -$008
Gulf Coast $166 $175 -$009 $201 $211 -$010
Rocky Mountain $184 $196 -$012 $205 $219 -$014
West Coast $260 $266 -$006 $255 $246 $009
NATIONAL AVERAGE $198 $203 -$005 $223 $221 $002
EIA = Energy Information AdministrationEIA prices are from the petroleum information section of the EIA website week of January 4 2016 httpwwweiagovdnavpetxlsPET_PRI_GND_A_EPMR_PTE_DPGAL_WxlshttpwwweiagovdnavpetxlsPET_PRI_GND_A_EPD2D_PTE_DPGAL_WxlsNegative numbers represent average Clean Cities prices that are lower than EIA prices
TABLE 4
The EIA data shows weekly average prices from a sample of approximately 800 retail gasoline and 400 retail diesel outlets across the country The EIA data points are weighted to reflect the quantity of fuel being sold at that price
The Clean Cities data is not weighted and represents simple averages of reported prices While there is some variation the EIA average prices match relatively closely with the average prices reported by Clean Cities coordinators
CLEAN CITIES ALTERNATIVE FUEL PRICE REPORT JANUARY 2016
6
Compressed Natural Gas (Relative to Gasoline)
CNG prices in Table 5 were obtained from the ldquoprice at the pumprdquo given in $gasoline gallon equivalent (GGE) and averaged for each region
As with other fuels the energy content of natural gas can vary CNG dispensers are calibrated for local gas compositions and dispense an accurate GGE for the actual gas being sold
COMPRESSED NATURAL GAS (CNG) AND GASOLINE AVERAGE RETAIL PRICES BY REGION
Region CNG Prices ($GGE)
Gasoline Prices ($gal)
PriceDifference
New England $245 $212 $033
Central Atlantic $197 $201 -$004
Lower Atlantic $206 $193 $013
Midwest $195 $183 $012
Gulf Coast $203 $166 $037
Rocky Mountain $191 $184 $007
West Coast $240 $260 -$020
NATIONAL AVERAGE $209 $198 $011
The prices shown in Table 5 were submitted by Clean Cities coordinators fuel providers and other stakeholders on a voluntary basis between January 1 and January 15 2016
On average during this reporting period CNG cost about $011 more than gasoline on a per gasoline gallon equivalent (GGE) basis
In this map negative numbers represent prices for CNG that
are lower than gasoline on a per gasoline gallon equivalent basis
States not highlighted with a color did not have any CNG data points in
the current report
FIGURE 2 PRICE DIFFERENTIALS BY STATE FOR COMPRESSED NATURAL GAS (CNG) RELATIVE TO GASOLINE
CNG Price DifferenceRelative to Gasoline
GGE = gasoline gallon equivalentNegative numbers represent average CNG prices that are lower than gasoline on a $GGE basis
TABLE 5
Note The Alternative Fuel Price Report is a snapshot in time of retail fuel prices Alternative fuel fleets can obtain significantly lower fuel prices than those reported in the AFPR by entering into contracts directly with local fuel suppliers Contract prices will vary depending on fleet size and amount of fuel to be purchased distance from the supplier region of the country and other factors
7
CLEAN CITIES ALTERNATIVE FUEL PRICE REPORT JANUARY 2016
2010 2012 20142009 2011 lsquo162013 2015lsquo07 2008O J A J O J A J O J A J O J A J O J A J O J A J O J A J O OJ A J J
Natural Gas (GGE)Gasoline
$150
$175
$200
$225
$250
$275
$300
$325
$350
$375
$400
Pric
e pe
r gas
olin
e ga
llon
equi
vale
nt (
$G
GE)
Compressed Natural Gas (CNG) cont
FIGURE 3 HISTORICAL COMPRESSED NATURAL GAS (CNG) PRICES VERSUS GASOLINE
CNG
CLEAN CITIES ALTERNATIVE FUEL PRICE REPORT JANUARY 2016
8
Compressed Natural Gas (Relative to Diesel)7
Table 6 shows the prices from Table 5 converted to $diesel gallon equivalent ($DGE) for easy comparison with diesel prices
As with other fuels the energy content of natural gas can vary CNG dispensers are calibrated for local gas compositions and dispense an accurate GGE for the actual gas being sold
COMPRESSED NATURAL GAS (CNG) AND DIESEL AVERAGE RETAIL PRICES BY REGION
Region CNG Prices ($DGE)
Diesel Prices ($gal)
PriceDifference
New England $277 $250 $027
Central Atlantic $223 $227 -$004
Lower Atlantic $233 $219 $014
Midwest $221 $205 $016
Gulf Coast $229 $201 $028
Rocky Mountain $216 $205 $011
West Coast $271 $255 $016
NATIONAL AVERAGE $236 $223 $013
The prices shown in Table 6 were submitted by Clean Cities coordinators fuel providers and other stakeholders on a voluntary basis between January 1 and January 15 2016
On average during this reporting period CNG cost about $013 more than diesel on a per diesel gallon equivalent basis
In this map negative numbers represent prices for CNG that are lower
than diesel on a per diesel gallon equivalent basis States not highlighted with a color did not have any CNG data
points in the current report
FIGURE 4 PRICE DIFFERENTIALS BY STATE FOR COMPRESSED NATURAL GAS (CNG) RELATIVE TO DIESEL
CNG Price DifferenceRelative to Diesel
DGE = diesel gallon equivalent Negative numbers represent average CNG prices that are lower than diesel on a $DGE basis
7 A total of 43 liquefied natural gas (LNG) prices were submitted with an average fuel price of $245DGE Because of the small number of price points this data is not reflected in the report
TABLE 6
Note The Alternative Fuel Price Report is a snapshot in time of retail fuel prices Alternative fuel fleets can obtain significantly lower fuel prices than those reported in the AFPR by entering into contracts directly with local fuel suppliers Contract prices will vary depending on fleet size and amount of fuel to be purchased distance from the supplier region of the country and other factors
9
CLEAN CITIES ALTERNATIVE FUEL PRICE REPORT JANUARY 2016
2010 2012 20142009 2011 lsquo162013 2015lsquo07 2008O J A J O J A J O J A J O J A J O J A J O J A J O J A J O OJ A J J
Natural Gas (DGE)Diesel
$175
$200
$225
$250
$275
$300
$325
$350
$375
$400
$425
$450
$475
Pric
e pe
r die
sel g
allo
n eq
uiva
lent
($
DG
E)
Compressed Natural Gas (CNG) cont
FIGURE 5 HISTORICAL COMPRESSED NATURAL GAS (CNG) PRICES VERSUS DIESEL
CNG
CLEAN CITIES ALTERNATIVE FUEL PRICE REPORT JANUARY 2016
10
Ethanol (E85)
Most gasoline available throughout the United States today is a blend of 90 gasoline and up to 10 ethanol or E10 Additionally the E85 that is sold in the United States today actually contains on average approximately 70 ethanol
E85 energy content for this report is therefore calculated as (70)(E100 energy content) + (30)(E0 energy content) to more closely reflect the actual energy content of E85 fuel available today
ETHANOL (E85) AND GASOLINE AVERAGE RETAIL PRICES BY REGION
Region E85 Prices ($gal)
Gasoline Prices ($gal)
PriceDifference
New England $251 $212 $039
Central Atlantic $212 $201 $011
Lower Atlantic $192 $193 -$001
Midwest $169 $183 -$014
Gulf Coast $159 $166 -$007
Rocky Mountain $187 $184 $003
West Coast $237 $260 -$023
NATIONAL AVERAGE $186 $198 -$012
The prices shown in Table 7 were submitted by Clean Cities coordinators fuel providers and other stakeholders on a voluntary basis between January 1 and January 15 2016
On average during this reporting period E85 cost about $012 less than gasoline on a per gallon basis
In this map negative numbers represent prices for E85 that are
lower than gasoline on a per gallon basis States not highlighted with a color did not have any E85 data
points in the current report
FIGURE 6 PRICE DIFFERENTIALS BY STATE FOR E85 RELATIVE TO GASOLINE
E85 Price DifferenceRelative to Gasoline
Negative numbers represent average E85 prices that are lower than gasoline on a $gal basis
TABLE 7
11
CLEAN CITIES ALTERNATIVE FUEL PRICE REPORT JANUARY 2016
2010 2012 20142009 2011 lsquo162013 2015lsquo07 2008O J A J O J A J O J A J O J A J O J A J O J A J O J A J O OJ A J J
$175
$200
$225
$250
$275
$300
$325
$350
$375
$400
EthanolGasoline
Ethanol (E85) cont
FIGURE 7 HISTORICAL ETHANOL (E85) PRICES VERSUS GASOLINE
CLEAN CITIES ALTERNATIVE FUEL PRICE REPORT JANUARY 2016
12
Propane (LPG)
Propane prices in this report are from both private fleet refueling stations and public refueling sites that can provide propane for vehicles and for other uses8
Note The Alternative Fuel Price Report is a snapshot in time of retail fuel prices Alternative fuel fleets can obtain significantly lower fuel prices than those reported in the AFPR by entering into contracts directly with local fuel suppliers Contract prices will vary depending on fleet size and amount of fuel to be purchased distance from the supplier region of the country and other factors
PROPANE (LPG) AND GASOLINE AVERAGE RETAIL PRICES BY REGION
Region LPG Prices ($gal)
Gasoline Prices ($gal)
PriceDifference
New England $289 $212 $077
Central Atlantic $279 $201 $078
Lower Atlantic $285 $193 $092
Midwest $245 $183 $062
Gulf Coast $304 $166 $138
Rocky Mountain $288 $184 $104
West Coast $294 $260 $034
NATIONAL AVERAGE $285 $198 $087
The prices shown in Table 8 were submitted by Clean Cities coordinators fuel providers and other stakeholders on a voluntary basis between January 1 and January 15 2016
On average during this reporting period propane cost about $087 more than gasoline on a per (liquid) gallon basis
8 Because many propane retailers provide fuel for non-vehicle uses (camping stoves gas grills etc) the National Renewable Energy Laboratory (NREL) has worked with suppliers to clarify the differences On the AFDC Station Locator website (httpwwwafdcenergygovlocatorstations) each public propane station is designated as a ldquoprimaryrdquo or ldquosecondaryrdquo service type Both types are able to fuel vehicles however stations designated as ldquoprimaryrdquo have indicated they have facilities and billing procedures specifically designed for vehicle customers They may also offer special vehicle pricing and most accept major credit cards similar to traditional gasolinediesel retailers Propane pricing reported in this guide reflects a sampling of both primary and secondary stations
In this map negative numbers represent prices for propane that are
lower than gasoline on a per gallon basis States not highlighted with a
color did not have any propane data points in the current report
FIGURE 8 PRICE DIFFERENTIALS BY STATE FOR PROPANE (LPG) RELATIVE TO GASOLINE
LPG Price DifferenceRelative to Gasoline
Negative numbers represent average propane prices that are lower than gasoline on a $gal basis
TABLE 8
13
CLEAN CITIES ALTERNATIVE FUEL PRICE REPORT JANUARY 2016
2010 2012 20142009 2011 lsquo162013 2015lsquo07 2008O J A J O J A J O J A J O J A J O J A J O J A J O J A J O OJ A J J
PropaneGasoline
Propane (LPG) cont
FIGURE 9 HISTORICAL PROPANE (LPG) PRICES VERSUS GASOLINE
LPG
CLEAN CITIES ALTERNATIVE FUEL PRICE REPORT JANUARY 2016
14
Biodiesel Blends B20
B20 is a blend of 20 biodiesel and 80 conventional diesel B20 contains only about 2 less energy (BTUs) per volume than 100 diesel The appendix at the end of this report provides conversion factors for calculating B20 prices on a GGE and DGE basis
BIODIESEL (B20) AND DIESEL AVERAGE RETAIL PRICES BY REGION
Region B20 Prices ($gal)
Diesel Prices ($gal)
PriceDifference
New England $249 $250 -$001
Central Atlantic $233 $227 $006
Lower Atlantic $228 $219 $009
Midwest $230 $205 $025
Gulf Coast $210 $201 $009
Rocky Mountain $221 $205 $016
West Coast $274 $255 $019
NATIONAL AVERAGE $241 $223 $018
The prices shown in Table 9 were submitted by Clean Cities coordinators fuel providers and other stakeholders on a voluntary basis between January 1 and January 15 2016
On a national average basis during this reporting period B20 cost about $018 more than diesel on a per gallon basis
In this map negative numbers represent prices for B20 that are lower than diesel on a per gallon basis States not highlighted with
a color did not have any B20 data points in the current report
FIGURE 10 PRICE DIFFERENTIALS BY STATE FOR B20 RELATIVE TO DIESEL
B20 Price DifferenceRelative to Diesel
Negative numbers represent average B20 prices that are lower than diesel on a $GAL basis
Note that B20 prices in many regions track very closely with diesel prices
TABLE 9
15
CLEAN CITIES ALTERNATIVE FUEL PRICE REPORT JANUARY 2016
2010 2012 20142009 2011 lsquo162013 2015lsquo07 2008O J A J O J A J O J A J O J A J O J A J O J A J O J A J O OJ A J J
$175
$200
$225
$250
$275
$300
$325
$350
$375
$400
$425
$450
$475
B20Diesel
Biodiesel Blends B20 cont
FIGURE 11 HISTORICAL B20 PRICES VERSUS DIESEL
CLEAN CITIES ALTERNATIVE FUEL PRICE REPORT JANUARY 2016
16
Biodiesel Blends B99B100
B100 contains about 10 less energy (BTUs) per volume than 100 diesel
The appendix at the end of this report provides conversion factors for calculating B100 prices on a GGE and DGE basis
BIODIESEL (B99B100) AND DIESEL AVERAGE RETAIL PRICES BY REGION
Region B99B100 Prices ($gal)
Diesel Prices ($gal)
PriceDifference
New England 235 250 -015
Central Atlantic 430 227 203
Lower Atlantic 312 219 093
Midwest --- 205 ---
Gulf Coast 228 201 027
Rocky Mountain 240 205 035
West Coast 339 255 084
NATIONAL AVERAGE 321 223 098
The prices shown in Table 10 were submitted by Clean Cities coordinators fuel providers and other stakeholders on a voluntary basis between January 1 and January 15 2016
On average during this reporting period B99B100 cost about $098 more than diesel on a per gallon basis
In this map negative numbers represent prices for B99B100 that
are lower than diesel on a per gallon basis States not highlighted with
a color did not have any B99B100 data points in the current report
FIGURE 12 PRICE DIFFERENTIALS BY STATE FOR B99B100 RELATIVE TO DIESEL
B99B100 Price Difference
Relative to Diesel
Negative numbers represent average B99B100 prices that are lower than diesel on a $GAL basis
TABLE 10
17
CLEAN CITIES ALTERNATIVE FUEL PRICE REPORT JANUARY 2016
2010 2012 20142009 2011 lsquo162013 2015lsquo07 2008O J A J O J A J O J A J O J A J O J A J O J A J O J A J O OJ A J J$200
$225
$250
$275
$300
$325
$350
$375
$400
$425
$450
$475
$500
B99B100Diesel
Biodiesel Blends B99B100 cont
FIGURE 13 HISTORICAL B99B100 PRICES VERSUS DIESEL
CLEAN CITIES ALTERNATIVE FUEL PRICE REPORT JANUARY 2016
18
Comparison Of Prices This Report Versus Last ReportThe following tables summarize the average retail prices submitted for this report by region and compare them to prices submitted for the October 2015 Alternative Fuel Price Report It should be noted that a portion of the price changes may be attributed to differing sample sizes and locations between the two reports
GASOLINE ($ per gallon)
Region Price for October 2015
Price for January 2016 Difference in $ Difference in
New England 241 212 -029 -1203
Central Atlantic 220 201 -019 -864
Lower Atlantic 215 193 -022 -1023
Midwest 236 183 -053 -2246
Gulf Coast 197 166 -031 -1574
Rocky Mountain 235 184 -051 -2170
West Coast 276 260 -016 -580
NATIONAL AVERAGE 235 198 -037 -1574
Region Price for October 2015
Price for January 2016 Difference in $ Difference in
New England 272 250 -022 -809
Central Atlantic 273 227 -046 -1685
Lower Atlantic 248 219 -029 -1169
Midwest 247 205 -042 -1700
Gulf Coast 227 201 -026 -1145
Rocky Mountain 246 205 -041 -1667
West Coast 280 255 -025 -893
NATIONAL AVERAGE 259 223 -036 -1390
DIESEL ($ per gallon)
CNG ($ per GGE)
Region Price for October 2015
Price for January 2016 Difference in $ Difference in
New England 244 245 001 041
Central Atlantic 199 197 -002 -101
Lower Atlantic 207 206 -001 -048
Midwest 203 195 -008 -394
Gulf Coast 204 203 -001 -049
Rocky Mountain 189 191 002 106
West Coast 237 240 003 127
NATIONAL AVERAGE 209 209 000 000
CNG
TABLE 11 a
TABLE 11 b
TABLE 11 c
19
CLEAN CITIES ALTERNATIVE FUEL PRICE REPORT JANUARY 2016
Comparison Of Prices This Report Versus Last Report cont
Region Price for Oct 2015 Price for January 2016 Difference in $ Difference in
New England 278 251 -027 -971
Central Atlantic 241 212 -029 -1203
Lower Atlantic 207 192 -015 -725
Midwest 211 169 -042 -1991
Gulf Coast 192 159 -033 -1719
Rocky Mountain 220 187 -033 -1500
West Coast 262 237 -025 -954
NATIONAL AVERAGE 218 186 -032 -1468
Region Price for Oct 2015 Price for January 2016 Difference in $ Difference in
New England 284 289 005 176
Central Atlantic 268 279 011 410
Lower Atlantic 296 285 -011 -372
Midwest 270 245 -025 -926
Gulf Coast 299 304 005 167
Rocky Mountain 291 288 -003 -103
West Coast 296 294 -002 -068
NATIONAL AVERAGE 290 285 -005 -172
Region Price for Oct 2015 Price for January 2016 Difference in $ Difference in
New England 270 249 -021 -778
Central Atlantic 260 233 -027 -1038
Lower Atlantic 256 228 -028 -1094
Midwest 253 230 -023 -909
Gulf Coast 251 210 -041 -1633
Rocky Mountain 255 221 -034 -1333
West Coast 296 274 -022 -743
NATIONAL AVERAGE 266 241 -025 -940
Region Price for Oct 2015 Price for January 2016 Difference in $ Difference in
New England 262 235 -027 -1031
Central Atlantic 582 430 -152 -2612
Lower Atlantic 333 312 -021 -631
Midwest 246 --- --- ---
Gulf Coast 249 228 -021 -843
Rocky Mountain 259 240 -019 -734
West Coast 353 339 -014 -397
NATIONAL AVERAGE 340 321 -019 -559
ETHANOL (E85)
($ per gallon)
PROPANE ($ per gallon)
BIODIESELB20
($ per gallon)
LPG
BIODIESELB99B100
($ per gallon)
TABLE 11 d
TABLE 11 e
TABLE 11 f
TABLE 11 g
CLEAN CITIES ALTERNATIVE FUEL PRICE REPORT JANUARY 2016
20
Price Comparison By Region For Public amp Private Refueling StationsThe tables below summarize average retail fuel prices contained in this report sorted by type of refueling station ie ldquoprivaterdquo or ldquopublicrdquo The stations classified as ldquopublicrdquo are open to the general public The majority of the stations classified as ldquoprivaterdquo are operated by state or local government agencies transit agencies utility districts colleges or universities or military facilities They serve the host agencyrsquos fleets and may have contractual or other arrangements in place to sell fuel to other government agencies andor selected other fleets In some cases contracts may include billing accounting or fleet service management fees that are rolled into the price of the fuel
For this report there were 3101 prices submitted from ldquopublicrdquo refueling stations and 360 prices submitted from ldquoprivaterdquo refueling stations for a total of 3461 prices
As with the other prices in this report these prices include state and federal taxes as described in the Methodology section of this document
Region PRIVATE PUBLIC
New England $213 $212
Central Atlantic $199 $201
Lower Atlantic $200 $193
Midwest $221 $181
Gulf Coast --- $166
Rocky Mountain $187 $184
West Coast $263 $259
NATIONAL AVERAGE $223 $196
Region PRIVATE PUBLIC
New England $202 $250
Central Atlantic $182 $204
Lower Atlantic $075 $213
Midwest $189 $197
Gulf Coast $177 $206
Rocky Mountain $176 $201
West Coast $207 $244
NATIONAL AVERAGE $182 $216
Region PRIVATE PUBLIC
New England $253 $250
Central Atlantic $207 $238
Lower Atlantic $199 $220
Midwest $167 $206
Gulf Coast --- $201
Rocky Mountain $162 $206
West Coast $239 $256
NATIONAL AVERAGE $214 $224
Region PRIVATE PUBLIC
New England --- $251
Central Atlantic $217 $211
Lower Atlantic $231 $192
Midwest $192 $167
Gulf Coast $199 $158
Rocky Mountain $167 $188
West Coast $244 $237
NATIONAL AVERAGE $205 $185
TABLE 12 a - GasolineAverage Retail Price by Refueling Station Type ($gal)
TABLE 12 b - DieselAverage Retail Price by Refueling Station Type ($gal)
TABLE 12 c - CNGAverage Retail Price by Refueling Station Type ($GGE)
TABLE 12 d - E85Average Retail Price by Refueling Station Type ($gal)
--- indicates no data points were submitted for this region
21
CLEAN CITIES ALTERNATIVE FUEL PRICE REPORT JANUARY 2016
Region PRIVATE PUBLIC
New England $258 $290
Central Atlantic $134 $320
Lower Atlantic $382 $284
Midwest $161 $249
Gulf Coast $131 $315
Rocky Mountain $243 $289
West Coast $302 $293
NATIONAL AVERAGE $200 $291
Region PRIVATE PUBLIC
New England $214 $270
Central Atlantic $221 $270
Lower Atlantic $204 $232
Midwest $205 $232
Gulf Coast $199 $212
Rocky Mountain --- $221
West Coast $228 $293
NATIONAL AVERAGE $220 $252
Comparison Of Prices By Region For Public amp Private Refueling Stations cont
Region PRIVATE PUBLIC
New England --- $235
Central Atlantic $161 $698
Lower Atlantic $350 $289
Midwest --- ---
Gulf Coast --- $227
Rocky Mountain --- $240
West Coast $341 $339
NATIONAL AVERAGE $326 $320
TABLE 12 e - PropaneAverage Retail Price by Refueling Station Type ($gal)
TABLE 12 f - B20Average Retail Price by Refueling Station Type ($gal)
TABLE 12 g - B99B100Average Retail Price by Refueling Station Type ($gal)
--- indicates no data points were submitted for this region
CLEAN CITIES ALTERNATIVE FUEL PRICE REPORT JANUARY 2016
22
Historical Alternative Fuel Prices From Previous ReportsThe following graphs illustrate historical prices for the alternative fuels included in the Alternative Fuel Price Report from 2007 to the present relative to gasoline and diesel Compressed natural gas (in GGE) propane and ethanol (E85) have been graphed against gasoline prices while compressed natural gas (in DGE) and biodiesel blends (B20 and B99B100) have been graphed against diesel prices
2010 2012 20142009 2011 lsquo162013 2015lsquo07 2008O J A J O J A J O J A J O J A J O J A J O J A J O J A J O OJ A J J
Natural Gas (GGE)Gasoline Ethanol (E85) Propane
$150
$175
$200
$225
$250
$275
$300
$325
$350
$375
$400
Pric
e pe
r gal
lon
2010 2012 20142009 2011 lsquo162013 2015lsquo07 2008O J A J O J A J O J A J O J A J O J A J O J A J O J A J O OJ A J J
Natural Gas (DGE)Diesel Biodiesel (B20) Biodiesel (B2B5)
$175
$200
$225
$250
$275
$300
$325
$350
$375
$400
$425
$450
$475
$500
Pric
e pe
r gal
lon
B99B100
FIGURE 14 ALTERNATIVE FUEL PRICES VERSUS GASOLINE
FIGURE 15 ALTERNATIVE FUEL PRICES VERSUS DIESEL
23
CLEAN CITIES ALTERNATIVE FUEL PRICE REPORT JANUARY 2016
Illustration of Conversion Factors for Fuels
9 httpctaornlgovdata10 According to the National Renewable Energy Laboratory (NREL) Alternative Fuels Data Center the energy content of common gasoline baseline references (E0 E10 and indolene) varies between 112114 and 116090 Btugal We chose 114300 Btugal for the E10 energy content consistent with the Transportation Energy Data Book (TEDB) energy content of CNG in GGEs See next footnote11 (566 lbs of CNGGGE) x (20200 BTUlb) = 114332 rounded to 11430012 Most gasoline available throughout the United States today is a blend of 90 gasoline and up to 10 ethanol or E10 Additionally the E85 that is sold in the United States today actually contains on average approximately 70 ethanol E85 energy content for this report is therefore calculated as [(70) x (E100 energy content)] + [(30) x (E0 energy content)] to more closely reflect the actual energy content of E85 fuel available today13 See footnote 12 above
Fuel Lower Heating Value
Gasoline (E0) 115400 BTUgal
Gasoline (E10)10 114300 BTUgal
Diesel 128700 BTUgal
Biodiesel (B100) 117100 BTUgal
Compressed Natural Gas (CNG)11 114300 BTUGGE
Ethanol (E100) 75700 BTUgal
Propane 83500 BTUgal
TABLE 13 Lower Heating Values
Conversion to GGE
The conversion factor used to convert the price of an alternative fuel from $gallon to $GGE is determined as follows
Conversion factor = BTUgal of gasoline (E10) BTUgal of alternative fuel
To calculate the price of an alternative fuel in $GGE multiply the price per gallon of the alternative fuel by the relevant conversion factor from Table 14
Fuel Conversion Factor
Biodiesel (B20) 090
Biodiesel (B100) 098
CNG 100
Ethanol (E85)12 130
Propane 137
TABLE 14 Conversion Factors $gal to $GGE
Fuel Conversion Factor
Biodiesel (B20) 102
Biodiesel (B100) 110
CNG 113
Ethanol (E85) 13 147
Propane 154
TABLE 15 Conversion Factors $gal to $DGE
Conversion factors used to establish prices in dollars per gasoline gallon equivalent ($GGE) and dollars per diesel gallon equivalent ($DGE) were developed using the lower heating values from the Transportation Energy Data Book Edition 339 and are listed to the left
In the case of CNG prices are provided to us in GGE so no conversion is necessary The representative heating value of CNG is provided in Table 13 as a reference
Conversion to DGE
The conversion factor used to convert the price of an alternative fuel from $gallon to $DGE is determined as follows
Conversion factor = BTUgal of diesel BTUgal of alternative fuel
For example the conversion factor used to convert a B100 price from $gal to $DGE is determined as follows
128700 BTUgal of diesel = 1099 rounded to 110 117100 BTUgal of B100
To calculate the price of an alternative fuel in $DGE multiply the price per gallon of the alternative fuel by the relevant conversion factor from Table 15
For example if the price of B100 is given as $300gal the $DGE is determined as follows ($300gal) x 110 = $330DGE
CLEAN CITIES ALTERNATIVE FUEL PRICE REPORT JANUARY 2016
24
ETHANOL (E85) AND GASOLINE AVERAGE RETAIL PRICES BY REGION (GGE)
Region E85 Prices ($GGE)
Gasoline Prices ($gal)
Price Difference
New England $326 $212 $114
Central Atlantic $276 $201 $075
Lower Atlantic $250 $193 $057
Midwest $220 $183 $037
Gulf Coast $207 $166 $041
Rocky Mountain $243 $184 $059
West Coast $308 $260 $048
NATIONAL AVERAGE
$242 $198 $044
TABLE 16aPROPANE (LPG) AND GASOLINE AVERAGE RETAIL PRICES
BY REGION (GGE)
Region LPG Prices ($GGE)
Gasoline Prices ($gal)
Price Difference
New England $396 $212 $184
Central Atlantic $382 $201 $181
Lower Atlantic $390 $193 $197
Midwest $336 $183 $153
Gulf Coast $416 $166 $250
Rocky Mountain $395 $184 $211
West Coast $403 $260 $143
NATIONAL AVERAGE
$390 $198 $192
TABLE 16b
BIODIESEL (B20) AND DIESEL AVERAGE RETAIL PRICES BY REGION (DGE)
Region B20 Prices ($DGE)
Diesel Prices ($gal)
Price Difference
New England $254 $250 $004
Central Atlantic $238 $227 $011
Lower Atlantic $233 $219 $014
Midwest $235 $205 $030
Gulf Coast $214 $201 $013
Rocky Mountain $225 $205 $020
West Coast $279 $255 $024
NATIONAL AVERAGE
$246 $223 $023
TABLE 16c
Negative numbers represent average E85 prices that are lower than gasoline on a $GGE basis Negative numbers represent average propane prices that are lower than gasoline on a $GGE basis
Negative numbers represent average B20 prices that are lower than gasoline on a $DGE basis
BIODIESEL (B99B100) AND DIESEL AVERAGE RETAIL PRICES BY REGION (DGE)
Region B99B100 Prices ($DGE)
Diesel Prices ($gal)
Price Difference
New England $258 $250 $009
Central Atlantic $473 $227 $246
Lower Atlantic $343 $219 $124
Midwest --- $205 ---
Gulf Coast $251 $201 $050
Rocky Mountain $264 $205 $059
West Coast $373 $255 $118
NATIONAL AVERAGE
$353 $223 $130
TABLE 16d
Negative numbers represent average B99B100 prices that are lower than gasoline on a $DGE basis
Comparison of Prices on an Energy-Equivalent BasisThe following tables compare prices for E85 propane B20 and B99B100 to conventional fuels (gasoline and diesel) on an energy-equivalent basis (Natural gas is generally sold in gasoline gallon equivalents or diesel gallon equivalents so the natural gas ldquoprice at the pumprdquo can be directly compared to the price of the corresponding conventional fuel as shown in Tables 5 and 6)
25
CLEAN CITIES ALTERNATIVE FUEL PRICE REPORT JANUARY 2016
AcknowledgementsThe authors would like to acknowledge all of the contributors from the Clean Cities community who have provided prices for this report we sincerely appreciate your continued dedication to the success of this report The authors would also like to acknowledge the continued support of DOE for developing this report
Would You Like To ParticipateIf you would like to provide prices for alternative fuels in your region and be part of the data collection effort for this report or if you have any questions please contact
US DOE Clean CitiesEE-3V1000 Independence Avenue SWWashington DC 20585Phone (202) 586-6459afprnwttechcom
DISCLAIMERThis document highlights work sponsored by agencies of the US Government Neither the US Government nor any agency thereof nor any of their employees makes any warranty express or implied or assumes any legal liability or responsibility for the accuracy completeness or usefulness of any information apparatus product or process disclosed or represents that its use would not infringe privately owned rights Reference herein to any specific commercial product process or ser-vice by trade name trademark manufacturer or otherwise does not necessarily constitute or imply its endorsement recommendation or favoring by the US Govern-ment or any agency thereof The views and opinions of authors expressed herein do not necessarily state or reflect those of the US Government or any agency thereof
For more information on this and other Clean Cities publications visit wwwcleancitiesenergygov or contact the Clean Cities Technical Response Service at 800-254-6735

CLEAN CITIES ALTERNATIVE FUEL PRICE REPORT JANUARY 2016
4
Summary of Current Report Information
National Average Retail Fuel PricesConventional and Alternative Fuels January 2016
Fuel Type4 October 2015
January 2016
Change in PriceOctober-January
Units of Measurement
Gasoline (E10)
$235 $198 -$037 per gallon
Diesel $259 $223 -$036 per gallon
CNG $209 $209 $000 per GGE
Ethanol (E85) $218 $186 -$032 per gallon
Propane $290 $285 -$005 per gallon
Biodiesel (B20) $266 $241 -$025 per gallon
Biodiesel (B99B100)
$340 $321 -$019 per gallon
TABLE 2
Liquid fuels have differing energy contents per gallon so the price paid per unit of energy content can differ somewhat from the price paid per gallon Table 3 shows fuel prices from Table 2 normalized to an energy-equivalent basis
Note that for the alternative fuels prices on an energy-equivalent basis ie $GGE or $DGE are generally higher than the prices per gallon due to their lower energy content5
Propane prices include information from both ldquoprimaryrdquo and ldquosecondaryrdquo stations Primary stations have dedicated vehicle services and tend to be less expensive than secondary stations which mostly serve the propane tank and bottle market
Prices for Table 3 were calculated using the nominal lower heating values in BTUs per gallon of fuel from the Oak Ridge National Laboratoryrsquos Transportation Energy Data Book6
National Average Retail Fuel Prices On An Energy-Equivalent Basis January 2016
Fuel TypePer Gasoline
Gallon Equivalent ($GGE)
Per Diesel Gallon Equivalent
($DGE)
Per Million British Thermal Units ($MBtu)
Gasoline (E10)
$198 $224 $1732
Diesel $199 $223 $1733
CNG $209 $236 $1829
Ethanol (E85)
$242 $273 $2763
Propane $391 $440 $4683
Biodiesel (B20)
$217 $246 $1717
Biodiesel (B99B100)
$315 $353 $2690
Table 2 shows national average retail fuel prices for this report and the previous report Changes in average retail prices from one quarter to another may be due to a number of factors including an actual change in price different sample sizes the inclusion of different locations and seasonal variations in demand
Prices in this report were reported in the units in which they are typically sold for example dollars per gallon of gasoline or dollars per gasoline gallon equivalent (GGE) of CNG
Consumer interest in alternative fuels generally increases when the alternative fuel price is less than the conventional fuel price on a per gallon basis even if that differential does not directly translate to savings on an energy-equivalent basis
TABLE 3
4 A very small sample (6 points) of hydrogen information was received with an average price of $1393GGE 5 For ethanol flexible-fuel vehicles (FFVs) the actual difference in fuel used per mile is somewhat less than would be calculated simply on the difference in energy content of the fuels Some sources have noted that some FFVs can achieve better energy efficiency (miles per unit of energy) on E85 than on gasoline This effect is not currently included in these calculations as the magnitude of the effect varies by specific FFV model6 httpctaornlgovdata A listing of the conversion factors used appears as an appendix at the end of this report
Includes public and private stationsIncludes primary and secondary stations
Includes public and private stationsIncludes primary and secondary stations
5
CLEAN CITIES ALTERNATIVE FUEL PRICE REPORT JANUARY 2016
Gasoline and Diesel Prices Clean Cities and EIA Data
Table 4 below shows gasoline and diesel prices submitted by Clean Cities coordinators fuel providers and other stakeholders on a voluntary basis between January 1 and January 15 2016 compared to prices from the petroleum information section of the Energy Information Administration (EIA) website for the week of January 4 2016
Clean Cities prices for conventional fuels were obtained from retail stations providing alternative fuel price information or from nearby stations so data collection was not uniform across the regions of the country however the information is representative of refueling stations selling both alternative fuels and conventional fuels
Average Retail Gasoline and Diesel Prices by Region in $gal from Clean Cities and EIA Sources
GASOLINE PRICES DIESEL PRICES
Region Clean Cities EIA Difference Clean Cities EIA Difference
New England $212 $204 $008 $250 $234 $016
Central Atlantic $201 $207 -$006 $227 $239 -$012
Lower Atlantic $193 $193 $000 $219 $214 $005
Midwest $183 $186 -$003 $205 $213 -$008
Gulf Coast $166 $175 -$009 $201 $211 -$010
Rocky Mountain $184 $196 -$012 $205 $219 -$014
West Coast $260 $266 -$006 $255 $246 $009
NATIONAL AVERAGE $198 $203 -$005 $223 $221 $002
EIA = Energy Information AdministrationEIA prices are from the petroleum information section of the EIA website week of January 4 2016 httpwwweiagovdnavpetxlsPET_PRI_GND_A_EPMR_PTE_DPGAL_WxlshttpwwweiagovdnavpetxlsPET_PRI_GND_A_EPD2D_PTE_DPGAL_WxlsNegative numbers represent average Clean Cities prices that are lower than EIA prices
TABLE 4
The EIA data shows weekly average prices from a sample of approximately 800 retail gasoline and 400 retail diesel outlets across the country The EIA data points are weighted to reflect the quantity of fuel being sold at that price
The Clean Cities data is not weighted and represents simple averages of reported prices While there is some variation the EIA average prices match relatively closely with the average prices reported by Clean Cities coordinators
CLEAN CITIES ALTERNATIVE FUEL PRICE REPORT JANUARY 2016
6
Compressed Natural Gas (Relative to Gasoline)
CNG prices in Table 5 were obtained from the ldquoprice at the pumprdquo given in $gasoline gallon equivalent (GGE) and averaged for each region
As with other fuels the energy content of natural gas can vary CNG dispensers are calibrated for local gas compositions and dispense an accurate GGE for the actual gas being sold
COMPRESSED NATURAL GAS (CNG) AND GASOLINE AVERAGE RETAIL PRICES BY REGION
Region CNG Prices ($GGE)
Gasoline Prices ($gal)
PriceDifference
New England $245 $212 $033
Central Atlantic $197 $201 -$004
Lower Atlantic $206 $193 $013
Midwest $195 $183 $012
Gulf Coast $203 $166 $037
Rocky Mountain $191 $184 $007
West Coast $240 $260 -$020
NATIONAL AVERAGE $209 $198 $011
The prices shown in Table 5 were submitted by Clean Cities coordinators fuel providers and other stakeholders on a voluntary basis between January 1 and January 15 2016
On average during this reporting period CNG cost about $011 more than gasoline on a per gasoline gallon equivalent (GGE) basis
In this map negative numbers represent prices for CNG that
are lower than gasoline on a per gasoline gallon equivalent basis
States not highlighted with a color did not have any CNG data points in
the current report
FIGURE 2 PRICE DIFFERENTIALS BY STATE FOR COMPRESSED NATURAL GAS (CNG) RELATIVE TO GASOLINE
CNG Price DifferenceRelative to Gasoline
GGE = gasoline gallon equivalentNegative numbers represent average CNG prices that are lower than gasoline on a $GGE basis
TABLE 5
Note The Alternative Fuel Price Report is a snapshot in time of retail fuel prices Alternative fuel fleets can obtain significantly lower fuel prices than those reported in the AFPR by entering into contracts directly with local fuel suppliers Contract prices will vary depending on fleet size and amount of fuel to be purchased distance from the supplier region of the country and other factors
7
CLEAN CITIES ALTERNATIVE FUEL PRICE REPORT JANUARY 2016
2010 2012 20142009 2011 lsquo162013 2015lsquo07 2008O J A J O J A J O J A J O J A J O J A J O J A J O J A J O OJ A J J
Natural Gas (GGE)Gasoline
$150
$175
$200
$225
$250
$275
$300
$325
$350
$375
$400
Pric
e pe
r gas
olin
e ga
llon
equi
vale
nt (
$G
GE)
Compressed Natural Gas (CNG) cont
FIGURE 3 HISTORICAL COMPRESSED NATURAL GAS (CNG) PRICES VERSUS GASOLINE
CNG
CLEAN CITIES ALTERNATIVE FUEL PRICE REPORT JANUARY 2016
8
Compressed Natural Gas (Relative to Diesel)7
Table 6 shows the prices from Table 5 converted to $diesel gallon equivalent ($DGE) for easy comparison with diesel prices
As with other fuels the energy content of natural gas can vary CNG dispensers are calibrated for local gas compositions and dispense an accurate GGE for the actual gas being sold
COMPRESSED NATURAL GAS (CNG) AND DIESEL AVERAGE RETAIL PRICES BY REGION
Region CNG Prices ($DGE)
Diesel Prices ($gal)
PriceDifference
New England $277 $250 $027
Central Atlantic $223 $227 -$004
Lower Atlantic $233 $219 $014
Midwest $221 $205 $016
Gulf Coast $229 $201 $028
Rocky Mountain $216 $205 $011
West Coast $271 $255 $016
NATIONAL AVERAGE $236 $223 $013
The prices shown in Table 6 were submitted by Clean Cities coordinators fuel providers and other stakeholders on a voluntary basis between January 1 and January 15 2016
On average during this reporting period CNG cost about $013 more than diesel on a per diesel gallon equivalent basis
In this map negative numbers represent prices for CNG that are lower
than diesel on a per diesel gallon equivalent basis States not highlighted with a color did not have any CNG data
points in the current report
FIGURE 4 PRICE DIFFERENTIALS BY STATE FOR COMPRESSED NATURAL GAS (CNG) RELATIVE TO DIESEL
CNG Price DifferenceRelative to Diesel
DGE = diesel gallon equivalent Negative numbers represent average CNG prices that are lower than diesel on a $DGE basis
7 A total of 43 liquefied natural gas (LNG) prices were submitted with an average fuel price of $245DGE Because of the small number of price points this data is not reflected in the report
TABLE 6
Note The Alternative Fuel Price Report is a snapshot in time of retail fuel prices Alternative fuel fleets can obtain significantly lower fuel prices than those reported in the AFPR by entering into contracts directly with local fuel suppliers Contract prices will vary depending on fleet size and amount of fuel to be purchased distance from the supplier region of the country and other factors
9
CLEAN CITIES ALTERNATIVE FUEL PRICE REPORT JANUARY 2016
2010 2012 20142009 2011 lsquo162013 2015lsquo07 2008O J A J O J A J O J A J O J A J O J A J O J A J O J A J O OJ A J J
Natural Gas (DGE)Diesel
$175
$200
$225
$250
$275
$300
$325
$350
$375
$400
$425
$450
$475
Pric
e pe
r die
sel g
allo
n eq
uiva
lent
($
DG
E)
Compressed Natural Gas (CNG) cont
FIGURE 5 HISTORICAL COMPRESSED NATURAL GAS (CNG) PRICES VERSUS DIESEL
CNG
CLEAN CITIES ALTERNATIVE FUEL PRICE REPORT JANUARY 2016
10
Ethanol (E85)
Most gasoline available throughout the United States today is a blend of 90 gasoline and up to 10 ethanol or E10 Additionally the E85 that is sold in the United States today actually contains on average approximately 70 ethanol
E85 energy content for this report is therefore calculated as (70)(E100 energy content) + (30)(E0 energy content) to more closely reflect the actual energy content of E85 fuel available today
ETHANOL (E85) AND GASOLINE AVERAGE RETAIL PRICES BY REGION
Region E85 Prices ($gal)
Gasoline Prices ($gal)
PriceDifference
New England $251 $212 $039
Central Atlantic $212 $201 $011
Lower Atlantic $192 $193 -$001
Midwest $169 $183 -$014
Gulf Coast $159 $166 -$007
Rocky Mountain $187 $184 $003
West Coast $237 $260 -$023
NATIONAL AVERAGE $186 $198 -$012
The prices shown in Table 7 were submitted by Clean Cities coordinators fuel providers and other stakeholders on a voluntary basis between January 1 and January 15 2016
On average during this reporting period E85 cost about $012 less than gasoline on a per gallon basis
In this map negative numbers represent prices for E85 that are
lower than gasoline on a per gallon basis States not highlighted with a color did not have any E85 data
points in the current report
FIGURE 6 PRICE DIFFERENTIALS BY STATE FOR E85 RELATIVE TO GASOLINE
E85 Price DifferenceRelative to Gasoline
Negative numbers represent average E85 prices that are lower than gasoline on a $gal basis
TABLE 7
11
CLEAN CITIES ALTERNATIVE FUEL PRICE REPORT JANUARY 2016
2010 2012 20142009 2011 lsquo162013 2015lsquo07 2008O J A J O J A J O J A J O J A J O J A J O J A J O J A J O OJ A J J
$175
$200
$225
$250
$275
$300
$325
$350
$375
$400
EthanolGasoline
Ethanol (E85) cont
FIGURE 7 HISTORICAL ETHANOL (E85) PRICES VERSUS GASOLINE
CLEAN CITIES ALTERNATIVE FUEL PRICE REPORT JANUARY 2016
12
Propane (LPG)
Propane prices in this report are from both private fleet refueling stations and public refueling sites that can provide propane for vehicles and for other uses8
Note The Alternative Fuel Price Report is a snapshot in time of retail fuel prices Alternative fuel fleets can obtain significantly lower fuel prices than those reported in the AFPR by entering into contracts directly with local fuel suppliers Contract prices will vary depending on fleet size and amount of fuel to be purchased distance from the supplier region of the country and other factors
PROPANE (LPG) AND GASOLINE AVERAGE RETAIL PRICES BY REGION
Region LPG Prices ($gal)
Gasoline Prices ($gal)
PriceDifference
New England $289 $212 $077
Central Atlantic $279 $201 $078
Lower Atlantic $285 $193 $092
Midwest $245 $183 $062
Gulf Coast $304 $166 $138
Rocky Mountain $288 $184 $104
West Coast $294 $260 $034
NATIONAL AVERAGE $285 $198 $087
The prices shown in Table 8 were submitted by Clean Cities coordinators fuel providers and other stakeholders on a voluntary basis between January 1 and January 15 2016
On average during this reporting period propane cost about $087 more than gasoline on a per (liquid) gallon basis
8 Because many propane retailers provide fuel for non-vehicle uses (camping stoves gas grills etc) the National Renewable Energy Laboratory (NREL) has worked with suppliers to clarify the differences On the AFDC Station Locator website (httpwwwafdcenergygovlocatorstations) each public propane station is designated as a ldquoprimaryrdquo or ldquosecondaryrdquo service type Both types are able to fuel vehicles however stations designated as ldquoprimaryrdquo have indicated they have facilities and billing procedures specifically designed for vehicle customers They may also offer special vehicle pricing and most accept major credit cards similar to traditional gasolinediesel retailers Propane pricing reported in this guide reflects a sampling of both primary and secondary stations
In this map negative numbers represent prices for propane that are
lower than gasoline on a per gallon basis States not highlighted with a
color did not have any propane data points in the current report
FIGURE 8 PRICE DIFFERENTIALS BY STATE FOR PROPANE (LPG) RELATIVE TO GASOLINE
LPG Price DifferenceRelative to Gasoline
Negative numbers represent average propane prices that are lower than gasoline on a $gal basis
TABLE 8
13
CLEAN CITIES ALTERNATIVE FUEL PRICE REPORT JANUARY 2016
2010 2012 20142009 2011 lsquo162013 2015lsquo07 2008O J A J O J A J O J A J O J A J O J A J O J A J O J A J O OJ A J J
PropaneGasoline
Propane (LPG) cont
FIGURE 9 HISTORICAL PROPANE (LPG) PRICES VERSUS GASOLINE
LPG
CLEAN CITIES ALTERNATIVE FUEL PRICE REPORT JANUARY 2016
14
Biodiesel Blends B20
B20 is a blend of 20 biodiesel and 80 conventional diesel B20 contains only about 2 less energy (BTUs) per volume than 100 diesel The appendix at the end of this report provides conversion factors for calculating B20 prices on a GGE and DGE basis
BIODIESEL (B20) AND DIESEL AVERAGE RETAIL PRICES BY REGION
Region B20 Prices ($gal)
Diesel Prices ($gal)
PriceDifference
New England $249 $250 -$001
Central Atlantic $233 $227 $006
Lower Atlantic $228 $219 $009
Midwest $230 $205 $025
Gulf Coast $210 $201 $009
Rocky Mountain $221 $205 $016
West Coast $274 $255 $019
NATIONAL AVERAGE $241 $223 $018
The prices shown in Table 9 were submitted by Clean Cities coordinators fuel providers and other stakeholders on a voluntary basis between January 1 and January 15 2016
On a national average basis during this reporting period B20 cost about $018 more than diesel on a per gallon basis
In this map negative numbers represent prices for B20 that are lower than diesel on a per gallon basis States not highlighted with
a color did not have any B20 data points in the current report
FIGURE 10 PRICE DIFFERENTIALS BY STATE FOR B20 RELATIVE TO DIESEL
B20 Price DifferenceRelative to Diesel
Negative numbers represent average B20 prices that are lower than diesel on a $GAL basis
Note that B20 prices in many regions track very closely with diesel prices
TABLE 9
15
CLEAN CITIES ALTERNATIVE FUEL PRICE REPORT JANUARY 2016
2010 2012 20142009 2011 lsquo162013 2015lsquo07 2008O J A J O J A J O J A J O J A J O J A J O J A J O J A J O OJ A J J
$175
$200
$225
$250
$275
$300
$325
$350
$375
$400
$425
$450
$475
B20Diesel
Biodiesel Blends B20 cont
FIGURE 11 HISTORICAL B20 PRICES VERSUS DIESEL
CLEAN CITIES ALTERNATIVE FUEL PRICE REPORT JANUARY 2016
16
Biodiesel Blends B99B100
B100 contains about 10 less energy (BTUs) per volume than 100 diesel
The appendix at the end of this report provides conversion factors for calculating B100 prices on a GGE and DGE basis
BIODIESEL (B99B100) AND DIESEL AVERAGE RETAIL PRICES BY REGION
Region B99B100 Prices ($gal)
Diesel Prices ($gal)
PriceDifference
New England 235 250 -015
Central Atlantic 430 227 203
Lower Atlantic 312 219 093
Midwest --- 205 ---
Gulf Coast 228 201 027
Rocky Mountain 240 205 035
West Coast 339 255 084
NATIONAL AVERAGE 321 223 098
The prices shown in Table 10 were submitted by Clean Cities coordinators fuel providers and other stakeholders on a voluntary basis between January 1 and January 15 2016
On average during this reporting period B99B100 cost about $098 more than diesel on a per gallon basis
In this map negative numbers represent prices for B99B100 that
are lower than diesel on a per gallon basis States not highlighted with
a color did not have any B99B100 data points in the current report
FIGURE 12 PRICE DIFFERENTIALS BY STATE FOR B99B100 RELATIVE TO DIESEL
B99B100 Price Difference
Relative to Diesel
Negative numbers represent average B99B100 prices that are lower than diesel on a $GAL basis
TABLE 10
17
CLEAN CITIES ALTERNATIVE FUEL PRICE REPORT JANUARY 2016
2010 2012 20142009 2011 lsquo162013 2015lsquo07 2008O J A J O J A J O J A J O J A J O J A J O J A J O J A J O OJ A J J$200
$225
$250
$275
$300
$325
$350
$375
$400
$425
$450
$475
$500
B99B100Diesel
Biodiesel Blends B99B100 cont
FIGURE 13 HISTORICAL B99B100 PRICES VERSUS DIESEL
CLEAN CITIES ALTERNATIVE FUEL PRICE REPORT JANUARY 2016
18
Comparison Of Prices This Report Versus Last ReportThe following tables summarize the average retail prices submitted for this report by region and compare them to prices submitted for the October 2015 Alternative Fuel Price Report It should be noted that a portion of the price changes may be attributed to differing sample sizes and locations between the two reports
GASOLINE ($ per gallon)
Region Price for October 2015
Price for January 2016 Difference in $ Difference in
New England 241 212 -029 -1203
Central Atlantic 220 201 -019 -864
Lower Atlantic 215 193 -022 -1023
Midwest 236 183 -053 -2246
Gulf Coast 197 166 -031 -1574
Rocky Mountain 235 184 -051 -2170
West Coast 276 260 -016 -580
NATIONAL AVERAGE 235 198 -037 -1574
Region Price for October 2015
Price for January 2016 Difference in $ Difference in
New England 272 250 -022 -809
Central Atlantic 273 227 -046 -1685
Lower Atlantic 248 219 -029 -1169
Midwest 247 205 -042 -1700
Gulf Coast 227 201 -026 -1145
Rocky Mountain 246 205 -041 -1667
West Coast 280 255 -025 -893
NATIONAL AVERAGE 259 223 -036 -1390
DIESEL ($ per gallon)
CNG ($ per GGE)
Region Price for October 2015
Price for January 2016 Difference in $ Difference in
New England 244 245 001 041
Central Atlantic 199 197 -002 -101
Lower Atlantic 207 206 -001 -048
Midwest 203 195 -008 -394
Gulf Coast 204 203 -001 -049
Rocky Mountain 189 191 002 106
West Coast 237 240 003 127
NATIONAL AVERAGE 209 209 000 000
CNG
TABLE 11 a
TABLE 11 b
TABLE 11 c
19
CLEAN CITIES ALTERNATIVE FUEL PRICE REPORT JANUARY 2016
Comparison Of Prices This Report Versus Last Report cont
Region Price for Oct 2015 Price for January 2016 Difference in $ Difference in
New England 278 251 -027 -971
Central Atlantic 241 212 -029 -1203
Lower Atlantic 207 192 -015 -725
Midwest 211 169 -042 -1991
Gulf Coast 192 159 -033 -1719
Rocky Mountain 220 187 -033 -1500
West Coast 262 237 -025 -954
NATIONAL AVERAGE 218 186 -032 -1468
Region Price for Oct 2015 Price for January 2016 Difference in $ Difference in
New England 284 289 005 176
Central Atlantic 268 279 011 410
Lower Atlantic 296 285 -011 -372
Midwest 270 245 -025 -926
Gulf Coast 299 304 005 167
Rocky Mountain 291 288 -003 -103
West Coast 296 294 -002 -068
NATIONAL AVERAGE 290 285 -005 -172
Region Price for Oct 2015 Price for January 2016 Difference in $ Difference in
New England 270 249 -021 -778
Central Atlantic 260 233 -027 -1038
Lower Atlantic 256 228 -028 -1094
Midwest 253 230 -023 -909
Gulf Coast 251 210 -041 -1633
Rocky Mountain 255 221 -034 -1333
West Coast 296 274 -022 -743
NATIONAL AVERAGE 266 241 -025 -940
Region Price for Oct 2015 Price for January 2016 Difference in $ Difference in
New England 262 235 -027 -1031
Central Atlantic 582 430 -152 -2612
Lower Atlantic 333 312 -021 -631
Midwest 246 --- --- ---
Gulf Coast 249 228 -021 -843
Rocky Mountain 259 240 -019 -734
West Coast 353 339 -014 -397
NATIONAL AVERAGE 340 321 -019 -559
ETHANOL (E85)
($ per gallon)
PROPANE ($ per gallon)
BIODIESELB20
($ per gallon)
LPG
BIODIESELB99B100
($ per gallon)
TABLE 11 d
TABLE 11 e
TABLE 11 f
TABLE 11 g
CLEAN CITIES ALTERNATIVE FUEL PRICE REPORT JANUARY 2016
20
Price Comparison By Region For Public amp Private Refueling StationsThe tables below summarize average retail fuel prices contained in this report sorted by type of refueling station ie ldquoprivaterdquo or ldquopublicrdquo The stations classified as ldquopublicrdquo are open to the general public The majority of the stations classified as ldquoprivaterdquo are operated by state or local government agencies transit agencies utility districts colleges or universities or military facilities They serve the host agencyrsquos fleets and may have contractual or other arrangements in place to sell fuel to other government agencies andor selected other fleets In some cases contracts may include billing accounting or fleet service management fees that are rolled into the price of the fuel
For this report there were 3101 prices submitted from ldquopublicrdquo refueling stations and 360 prices submitted from ldquoprivaterdquo refueling stations for a total of 3461 prices
As with the other prices in this report these prices include state and federal taxes as described in the Methodology section of this document
Region PRIVATE PUBLIC
New England $213 $212
Central Atlantic $199 $201
Lower Atlantic $200 $193
Midwest $221 $181
Gulf Coast --- $166
Rocky Mountain $187 $184
West Coast $263 $259
NATIONAL AVERAGE $223 $196
Region PRIVATE PUBLIC
New England $202 $250
Central Atlantic $182 $204
Lower Atlantic $075 $213
Midwest $189 $197
Gulf Coast $177 $206
Rocky Mountain $176 $201
West Coast $207 $244
NATIONAL AVERAGE $182 $216
Region PRIVATE PUBLIC
New England $253 $250
Central Atlantic $207 $238
Lower Atlantic $199 $220
Midwest $167 $206
Gulf Coast --- $201
Rocky Mountain $162 $206
West Coast $239 $256
NATIONAL AVERAGE $214 $224
Region PRIVATE PUBLIC
New England --- $251
Central Atlantic $217 $211
Lower Atlantic $231 $192
Midwest $192 $167
Gulf Coast $199 $158
Rocky Mountain $167 $188
West Coast $244 $237
NATIONAL AVERAGE $205 $185
TABLE 12 a - GasolineAverage Retail Price by Refueling Station Type ($gal)
TABLE 12 b - DieselAverage Retail Price by Refueling Station Type ($gal)
TABLE 12 c - CNGAverage Retail Price by Refueling Station Type ($GGE)
TABLE 12 d - E85Average Retail Price by Refueling Station Type ($gal)
--- indicates no data points were submitted for this region
21
CLEAN CITIES ALTERNATIVE FUEL PRICE REPORT JANUARY 2016
Region PRIVATE PUBLIC
New England $258 $290
Central Atlantic $134 $320
Lower Atlantic $382 $284
Midwest $161 $249
Gulf Coast $131 $315
Rocky Mountain $243 $289
West Coast $302 $293
NATIONAL AVERAGE $200 $291
Region PRIVATE PUBLIC
New England $214 $270
Central Atlantic $221 $270
Lower Atlantic $204 $232
Midwest $205 $232
Gulf Coast $199 $212
Rocky Mountain --- $221
West Coast $228 $293
NATIONAL AVERAGE $220 $252
Comparison Of Prices By Region For Public amp Private Refueling Stations cont
Region PRIVATE PUBLIC
New England --- $235
Central Atlantic $161 $698
Lower Atlantic $350 $289
Midwest --- ---
Gulf Coast --- $227
Rocky Mountain --- $240
West Coast $341 $339
NATIONAL AVERAGE $326 $320
TABLE 12 e - PropaneAverage Retail Price by Refueling Station Type ($gal)
TABLE 12 f - B20Average Retail Price by Refueling Station Type ($gal)
TABLE 12 g - B99B100Average Retail Price by Refueling Station Type ($gal)
--- indicates no data points were submitted for this region
CLEAN CITIES ALTERNATIVE FUEL PRICE REPORT JANUARY 2016
22
Historical Alternative Fuel Prices From Previous ReportsThe following graphs illustrate historical prices for the alternative fuels included in the Alternative Fuel Price Report from 2007 to the present relative to gasoline and diesel Compressed natural gas (in GGE) propane and ethanol (E85) have been graphed against gasoline prices while compressed natural gas (in DGE) and biodiesel blends (B20 and B99B100) have been graphed against diesel prices
2010 2012 20142009 2011 lsquo162013 2015lsquo07 2008O J A J O J A J O J A J O J A J O J A J O J A J O J A J O OJ A J J
Natural Gas (GGE)Gasoline Ethanol (E85) Propane
$150
$175
$200
$225
$250
$275
$300
$325
$350
$375
$400
Pric
e pe
r gal
lon
2010 2012 20142009 2011 lsquo162013 2015lsquo07 2008O J A J O J A J O J A J O J A J O J A J O J A J O J A J O OJ A J J
Natural Gas (DGE)Diesel Biodiesel (B20) Biodiesel (B2B5)
$175
$200
$225
$250
$275
$300
$325
$350
$375
$400
$425
$450
$475
$500
Pric
e pe
r gal
lon
B99B100
FIGURE 14 ALTERNATIVE FUEL PRICES VERSUS GASOLINE
FIGURE 15 ALTERNATIVE FUEL PRICES VERSUS DIESEL
23
CLEAN CITIES ALTERNATIVE FUEL PRICE REPORT JANUARY 2016
Illustration of Conversion Factors for Fuels
9 httpctaornlgovdata10 According to the National Renewable Energy Laboratory (NREL) Alternative Fuels Data Center the energy content of common gasoline baseline references (E0 E10 and indolene) varies between 112114 and 116090 Btugal We chose 114300 Btugal for the E10 energy content consistent with the Transportation Energy Data Book (TEDB) energy content of CNG in GGEs See next footnote11 (566 lbs of CNGGGE) x (20200 BTUlb) = 114332 rounded to 11430012 Most gasoline available throughout the United States today is a blend of 90 gasoline and up to 10 ethanol or E10 Additionally the E85 that is sold in the United States today actually contains on average approximately 70 ethanol E85 energy content for this report is therefore calculated as [(70) x (E100 energy content)] + [(30) x (E0 energy content)] to more closely reflect the actual energy content of E85 fuel available today13 See footnote 12 above
Fuel Lower Heating Value
Gasoline (E0) 115400 BTUgal
Gasoline (E10)10 114300 BTUgal
Diesel 128700 BTUgal
Biodiesel (B100) 117100 BTUgal
Compressed Natural Gas (CNG)11 114300 BTUGGE
Ethanol (E100) 75700 BTUgal
Propane 83500 BTUgal
TABLE 13 Lower Heating Values
Conversion to GGE
The conversion factor used to convert the price of an alternative fuel from $gallon to $GGE is determined as follows
Conversion factor = BTUgal of gasoline (E10) BTUgal of alternative fuel
To calculate the price of an alternative fuel in $GGE multiply the price per gallon of the alternative fuel by the relevant conversion factor from Table 14
Fuel Conversion Factor
Biodiesel (B20) 090
Biodiesel (B100) 098
CNG 100
Ethanol (E85)12 130
Propane 137
TABLE 14 Conversion Factors $gal to $GGE
Fuel Conversion Factor
Biodiesel (B20) 102
Biodiesel (B100) 110
CNG 113
Ethanol (E85) 13 147
Propane 154
TABLE 15 Conversion Factors $gal to $DGE
Conversion factors used to establish prices in dollars per gasoline gallon equivalent ($GGE) and dollars per diesel gallon equivalent ($DGE) were developed using the lower heating values from the Transportation Energy Data Book Edition 339 and are listed to the left
In the case of CNG prices are provided to us in GGE so no conversion is necessary The representative heating value of CNG is provided in Table 13 as a reference
Conversion to DGE
The conversion factor used to convert the price of an alternative fuel from $gallon to $DGE is determined as follows
Conversion factor = BTUgal of diesel BTUgal of alternative fuel
For example the conversion factor used to convert a B100 price from $gal to $DGE is determined as follows
128700 BTUgal of diesel = 1099 rounded to 110 117100 BTUgal of B100
To calculate the price of an alternative fuel in $DGE multiply the price per gallon of the alternative fuel by the relevant conversion factor from Table 15
For example if the price of B100 is given as $300gal the $DGE is determined as follows ($300gal) x 110 = $330DGE
CLEAN CITIES ALTERNATIVE FUEL PRICE REPORT JANUARY 2016
24
ETHANOL (E85) AND GASOLINE AVERAGE RETAIL PRICES BY REGION (GGE)
Region E85 Prices ($GGE)
Gasoline Prices ($gal)
Price Difference
New England $326 $212 $114
Central Atlantic $276 $201 $075
Lower Atlantic $250 $193 $057
Midwest $220 $183 $037
Gulf Coast $207 $166 $041
Rocky Mountain $243 $184 $059
West Coast $308 $260 $048
NATIONAL AVERAGE
$242 $198 $044
TABLE 16aPROPANE (LPG) AND GASOLINE AVERAGE RETAIL PRICES
BY REGION (GGE)
Region LPG Prices ($GGE)
Gasoline Prices ($gal)
Price Difference
New England $396 $212 $184
Central Atlantic $382 $201 $181
Lower Atlantic $390 $193 $197
Midwest $336 $183 $153
Gulf Coast $416 $166 $250
Rocky Mountain $395 $184 $211
West Coast $403 $260 $143
NATIONAL AVERAGE
$390 $198 $192
TABLE 16b
BIODIESEL (B20) AND DIESEL AVERAGE RETAIL PRICES BY REGION (DGE)
Region B20 Prices ($DGE)
Diesel Prices ($gal)
Price Difference
New England $254 $250 $004
Central Atlantic $238 $227 $011
Lower Atlantic $233 $219 $014
Midwest $235 $205 $030
Gulf Coast $214 $201 $013
Rocky Mountain $225 $205 $020
West Coast $279 $255 $024
NATIONAL AVERAGE
$246 $223 $023
TABLE 16c
Negative numbers represent average E85 prices that are lower than gasoline on a $GGE basis Negative numbers represent average propane prices that are lower than gasoline on a $GGE basis
Negative numbers represent average B20 prices that are lower than gasoline on a $DGE basis
BIODIESEL (B99B100) AND DIESEL AVERAGE RETAIL PRICES BY REGION (DGE)
Region B99B100 Prices ($DGE)
Diesel Prices ($gal)
Price Difference
New England $258 $250 $009
Central Atlantic $473 $227 $246
Lower Atlantic $343 $219 $124
Midwest --- $205 ---
Gulf Coast $251 $201 $050
Rocky Mountain $264 $205 $059
West Coast $373 $255 $118
NATIONAL AVERAGE
$353 $223 $130
TABLE 16d
Negative numbers represent average B99B100 prices that are lower than gasoline on a $DGE basis
Comparison of Prices on an Energy-Equivalent BasisThe following tables compare prices for E85 propane B20 and B99B100 to conventional fuels (gasoline and diesel) on an energy-equivalent basis (Natural gas is generally sold in gasoline gallon equivalents or diesel gallon equivalents so the natural gas ldquoprice at the pumprdquo can be directly compared to the price of the corresponding conventional fuel as shown in Tables 5 and 6)
25
CLEAN CITIES ALTERNATIVE FUEL PRICE REPORT JANUARY 2016
AcknowledgementsThe authors would like to acknowledge all of the contributors from the Clean Cities community who have provided prices for this report we sincerely appreciate your continued dedication to the success of this report The authors would also like to acknowledge the continued support of DOE for developing this report
Would You Like To ParticipateIf you would like to provide prices for alternative fuels in your region and be part of the data collection effort for this report or if you have any questions please contact
US DOE Clean CitiesEE-3V1000 Independence Avenue SWWashington DC 20585Phone (202) 586-6459afprnwttechcom
DISCLAIMERThis document highlights work sponsored by agencies of the US Government Neither the US Government nor any agency thereof nor any of their employees makes any warranty express or implied or assumes any legal liability or responsibility for the accuracy completeness or usefulness of any information apparatus product or process disclosed or represents that its use would not infringe privately owned rights Reference herein to any specific commercial product process or ser-vice by trade name trademark manufacturer or otherwise does not necessarily constitute or imply its endorsement recommendation or favoring by the US Govern-ment or any agency thereof The views and opinions of authors expressed herein do not necessarily state or reflect those of the US Government or any agency thereof
For more information on this and other Clean Cities publications visit wwwcleancitiesenergygov or contact the Clean Cities Technical Response Service at 800-254-6735
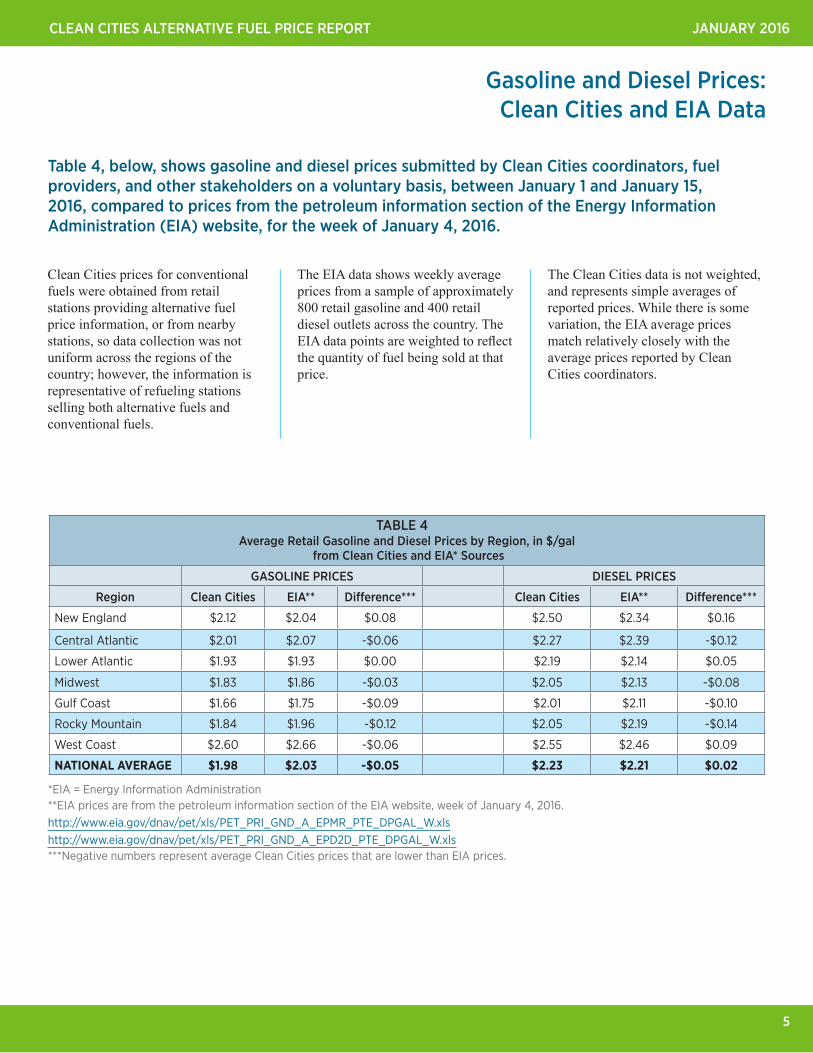

CLEAN CITIES ALTERNATIVE FUEL PRICE REPORT JANUARY 2016
6
Compressed Natural Gas (Relative to Gasoline)
CNG prices in Table 5 were obtained from the ldquoprice at the pumprdquo given in $gasoline gallon equivalent (GGE) and averaged for each region
As with other fuels the energy content of natural gas can vary CNG dispensers are calibrated for local gas compositions and dispense an accurate GGE for the actual gas being sold
COMPRESSED NATURAL GAS (CNG) AND GASOLINE AVERAGE RETAIL PRICES BY REGION
Region CNG Prices ($GGE)
Gasoline Prices ($gal)
PriceDifference
New England $245 $212 $033
Central Atlantic $197 $201 -$004
Lower Atlantic $206 $193 $013
Midwest $195 $183 $012
Gulf Coast $203 $166 $037
Rocky Mountain $191 $184 $007
West Coast $240 $260 -$020
NATIONAL AVERAGE $209 $198 $011
The prices shown in Table 5 were submitted by Clean Cities coordinators fuel providers and other stakeholders on a voluntary basis between January 1 and January 15 2016
On average during this reporting period CNG cost about $011 more than gasoline on a per gasoline gallon equivalent (GGE) basis
In this map negative numbers represent prices for CNG that
are lower than gasoline on a per gasoline gallon equivalent basis
States not highlighted with a color did not have any CNG data points in
the current report
FIGURE 2 PRICE DIFFERENTIALS BY STATE FOR COMPRESSED NATURAL GAS (CNG) RELATIVE TO GASOLINE
CNG Price DifferenceRelative to Gasoline
GGE = gasoline gallon equivalentNegative numbers represent average CNG prices that are lower than gasoline on a $GGE basis
TABLE 5
Note The Alternative Fuel Price Report is a snapshot in time of retail fuel prices Alternative fuel fleets can obtain significantly lower fuel prices than those reported in the AFPR by entering into contracts directly with local fuel suppliers Contract prices will vary depending on fleet size and amount of fuel to be purchased distance from the supplier region of the country and other factors
7
CLEAN CITIES ALTERNATIVE FUEL PRICE REPORT JANUARY 2016
2010 2012 20142009 2011 lsquo162013 2015lsquo07 2008O J A J O J A J O J A J O J A J O J A J O J A J O J A J O OJ A J J
Natural Gas (GGE)Gasoline
$150
$175
$200
$225
$250
$275
$300
$325
$350
$375
$400
Pric
e pe
r gas
olin
e ga
llon
equi
vale
nt (
$G
GE)
Compressed Natural Gas (CNG) cont
FIGURE 3 HISTORICAL COMPRESSED NATURAL GAS (CNG) PRICES VERSUS GASOLINE
CNG
CLEAN CITIES ALTERNATIVE FUEL PRICE REPORT JANUARY 2016
8
Compressed Natural Gas (Relative to Diesel)7
Table 6 shows the prices from Table 5 converted to $diesel gallon equivalent ($DGE) for easy comparison with diesel prices
As with other fuels the energy content of natural gas can vary CNG dispensers are calibrated for local gas compositions and dispense an accurate GGE for the actual gas being sold
COMPRESSED NATURAL GAS (CNG) AND DIESEL AVERAGE RETAIL PRICES BY REGION
Region CNG Prices ($DGE)
Diesel Prices ($gal)
PriceDifference
New England $277 $250 $027
Central Atlantic $223 $227 -$004
Lower Atlantic $233 $219 $014
Midwest $221 $205 $016
Gulf Coast $229 $201 $028
Rocky Mountain $216 $205 $011
West Coast $271 $255 $016
NATIONAL AVERAGE $236 $223 $013
The prices shown in Table 6 were submitted by Clean Cities coordinators fuel providers and other stakeholders on a voluntary basis between January 1 and January 15 2016
On average during this reporting period CNG cost about $013 more than diesel on a per diesel gallon equivalent basis
In this map negative numbers represent prices for CNG that are lower
than diesel on a per diesel gallon equivalent basis States not highlighted with a color did not have any CNG data
points in the current report
FIGURE 4 PRICE DIFFERENTIALS BY STATE FOR COMPRESSED NATURAL GAS (CNG) RELATIVE TO DIESEL
CNG Price DifferenceRelative to Diesel
DGE = diesel gallon equivalent Negative numbers represent average CNG prices that are lower than diesel on a $DGE basis
7 A total of 43 liquefied natural gas (LNG) prices were submitted with an average fuel price of $245DGE Because of the small number of price points this data is not reflected in the report
TABLE 6
Note The Alternative Fuel Price Report is a snapshot in time of retail fuel prices Alternative fuel fleets can obtain significantly lower fuel prices than those reported in the AFPR by entering into contracts directly with local fuel suppliers Contract prices will vary depending on fleet size and amount of fuel to be purchased distance from the supplier region of the country and other factors
9
CLEAN CITIES ALTERNATIVE FUEL PRICE REPORT JANUARY 2016
2010 2012 20142009 2011 lsquo162013 2015lsquo07 2008O J A J O J A J O J A J O J A J O J A J O J A J O J A J O OJ A J J
Natural Gas (DGE)Diesel
$175
$200
$225
$250
$275
$300
$325
$350
$375
$400
$425
$450
$475
Pric
e pe
r die
sel g
allo
n eq
uiva
lent
($
DG
E)
Compressed Natural Gas (CNG) cont
FIGURE 5 HISTORICAL COMPRESSED NATURAL GAS (CNG) PRICES VERSUS DIESEL
CNG
CLEAN CITIES ALTERNATIVE FUEL PRICE REPORT JANUARY 2016
10
Ethanol (E85)
Most gasoline available throughout the United States today is a blend of 90 gasoline and up to 10 ethanol or E10 Additionally the E85 that is sold in the United States today actually contains on average approximately 70 ethanol
E85 energy content for this report is therefore calculated as (70)(E100 energy content) + (30)(E0 energy content) to more closely reflect the actual energy content of E85 fuel available today
ETHANOL (E85) AND GASOLINE AVERAGE RETAIL PRICES BY REGION
Region E85 Prices ($gal)
Gasoline Prices ($gal)
PriceDifference
New England $251 $212 $039
Central Atlantic $212 $201 $011
Lower Atlantic $192 $193 -$001
Midwest $169 $183 -$014
Gulf Coast $159 $166 -$007
Rocky Mountain $187 $184 $003
West Coast $237 $260 -$023
NATIONAL AVERAGE $186 $198 -$012
The prices shown in Table 7 were submitted by Clean Cities coordinators fuel providers and other stakeholders on a voluntary basis between January 1 and January 15 2016
On average during this reporting period E85 cost about $012 less than gasoline on a per gallon basis
In this map negative numbers represent prices for E85 that are
lower than gasoline on a per gallon basis States not highlighted with a color did not have any E85 data
points in the current report
FIGURE 6 PRICE DIFFERENTIALS BY STATE FOR E85 RELATIVE TO GASOLINE
E85 Price DifferenceRelative to Gasoline
Negative numbers represent average E85 prices that are lower than gasoline on a $gal basis
TABLE 7
11
CLEAN CITIES ALTERNATIVE FUEL PRICE REPORT JANUARY 2016
2010 2012 20142009 2011 lsquo162013 2015lsquo07 2008O J A J O J A J O J A J O J A J O J A J O J A J O J A J O OJ A J J
$175
$200
$225
$250
$275
$300
$325
$350
$375
$400
EthanolGasoline
Ethanol (E85) cont
FIGURE 7 HISTORICAL ETHANOL (E85) PRICES VERSUS GASOLINE
CLEAN CITIES ALTERNATIVE FUEL PRICE REPORT JANUARY 2016
12
Propane (LPG)
Propane prices in this report are from both private fleet refueling stations and public refueling sites that can provide propane for vehicles and for other uses8
Note The Alternative Fuel Price Report is a snapshot in time of retail fuel prices Alternative fuel fleets can obtain significantly lower fuel prices than those reported in the AFPR by entering into contracts directly with local fuel suppliers Contract prices will vary depending on fleet size and amount of fuel to be purchased distance from the supplier region of the country and other factors
PROPANE (LPG) AND GASOLINE AVERAGE RETAIL PRICES BY REGION
Region LPG Prices ($gal)
Gasoline Prices ($gal)
PriceDifference
New England $289 $212 $077
Central Atlantic $279 $201 $078
Lower Atlantic $285 $193 $092
Midwest $245 $183 $062
Gulf Coast $304 $166 $138
Rocky Mountain $288 $184 $104
West Coast $294 $260 $034
NATIONAL AVERAGE $285 $198 $087
The prices shown in Table 8 were submitted by Clean Cities coordinators fuel providers and other stakeholders on a voluntary basis between January 1 and January 15 2016
On average during this reporting period propane cost about $087 more than gasoline on a per (liquid) gallon basis
8 Because many propane retailers provide fuel for non-vehicle uses (camping stoves gas grills etc) the National Renewable Energy Laboratory (NREL) has worked with suppliers to clarify the differences On the AFDC Station Locator website (httpwwwafdcenergygovlocatorstations) each public propane station is designated as a ldquoprimaryrdquo or ldquosecondaryrdquo service type Both types are able to fuel vehicles however stations designated as ldquoprimaryrdquo have indicated they have facilities and billing procedures specifically designed for vehicle customers They may also offer special vehicle pricing and most accept major credit cards similar to traditional gasolinediesel retailers Propane pricing reported in this guide reflects a sampling of both primary and secondary stations
In this map negative numbers represent prices for propane that are
lower than gasoline on a per gallon basis States not highlighted with a
color did not have any propane data points in the current report
FIGURE 8 PRICE DIFFERENTIALS BY STATE FOR PROPANE (LPG) RELATIVE TO GASOLINE
LPG Price DifferenceRelative to Gasoline
Negative numbers represent average propane prices that are lower than gasoline on a $gal basis
TABLE 8
13
CLEAN CITIES ALTERNATIVE FUEL PRICE REPORT JANUARY 2016
2010 2012 20142009 2011 lsquo162013 2015lsquo07 2008O J A J O J A J O J A J O J A J O J A J O J A J O J A J O OJ A J J
PropaneGasoline
Propane (LPG) cont
FIGURE 9 HISTORICAL PROPANE (LPG) PRICES VERSUS GASOLINE
LPG
CLEAN CITIES ALTERNATIVE FUEL PRICE REPORT JANUARY 2016
14
Biodiesel Blends B20
B20 is a blend of 20 biodiesel and 80 conventional diesel B20 contains only about 2 less energy (BTUs) per volume than 100 diesel The appendix at the end of this report provides conversion factors for calculating B20 prices on a GGE and DGE basis
BIODIESEL (B20) AND DIESEL AVERAGE RETAIL PRICES BY REGION
Region B20 Prices ($gal)
Diesel Prices ($gal)
PriceDifference
New England $249 $250 -$001
Central Atlantic $233 $227 $006
Lower Atlantic $228 $219 $009
Midwest $230 $205 $025
Gulf Coast $210 $201 $009
Rocky Mountain $221 $205 $016
West Coast $274 $255 $019
NATIONAL AVERAGE $241 $223 $018
The prices shown in Table 9 were submitted by Clean Cities coordinators fuel providers and other stakeholders on a voluntary basis between January 1 and January 15 2016
On a national average basis during this reporting period B20 cost about $018 more than diesel on a per gallon basis
In this map negative numbers represent prices for B20 that are lower than diesel on a per gallon basis States not highlighted with
a color did not have any B20 data points in the current report
FIGURE 10 PRICE DIFFERENTIALS BY STATE FOR B20 RELATIVE TO DIESEL
B20 Price DifferenceRelative to Diesel
Negative numbers represent average B20 prices that are lower than diesel on a $GAL basis
Note that B20 prices in many regions track very closely with diesel prices
TABLE 9
15
CLEAN CITIES ALTERNATIVE FUEL PRICE REPORT JANUARY 2016
2010 2012 20142009 2011 lsquo162013 2015lsquo07 2008O J A J O J A J O J A J O J A J O J A J O J A J O J A J O OJ A J J
$175
$200
$225
$250
$275
$300
$325
$350
$375
$400
$425
$450
$475
B20Diesel
Biodiesel Blends B20 cont
FIGURE 11 HISTORICAL B20 PRICES VERSUS DIESEL
CLEAN CITIES ALTERNATIVE FUEL PRICE REPORT JANUARY 2016
16
Biodiesel Blends B99B100
B100 contains about 10 less energy (BTUs) per volume than 100 diesel
The appendix at the end of this report provides conversion factors for calculating B100 prices on a GGE and DGE basis
BIODIESEL (B99B100) AND DIESEL AVERAGE RETAIL PRICES BY REGION
Region B99B100 Prices ($gal)
Diesel Prices ($gal)
PriceDifference
New England 235 250 -015
Central Atlantic 430 227 203
Lower Atlantic 312 219 093
Midwest --- 205 ---
Gulf Coast 228 201 027
Rocky Mountain 240 205 035
West Coast 339 255 084
NATIONAL AVERAGE 321 223 098
The prices shown in Table 10 were submitted by Clean Cities coordinators fuel providers and other stakeholders on a voluntary basis between January 1 and January 15 2016
On average during this reporting period B99B100 cost about $098 more than diesel on a per gallon basis
In this map negative numbers represent prices for B99B100 that
are lower than diesel on a per gallon basis States not highlighted with
a color did not have any B99B100 data points in the current report
FIGURE 12 PRICE DIFFERENTIALS BY STATE FOR B99B100 RELATIVE TO DIESEL
B99B100 Price Difference
Relative to Diesel
Negative numbers represent average B99B100 prices that are lower than diesel on a $GAL basis
TABLE 10
17
CLEAN CITIES ALTERNATIVE FUEL PRICE REPORT JANUARY 2016
2010 2012 20142009 2011 lsquo162013 2015lsquo07 2008O J A J O J A J O J A J O J A J O J A J O J A J O J A J O OJ A J J$200
$225
$250
$275
$300
$325
$350
$375
$400
$425
$450
$475
$500
B99B100Diesel
Biodiesel Blends B99B100 cont
FIGURE 13 HISTORICAL B99B100 PRICES VERSUS DIESEL
CLEAN CITIES ALTERNATIVE FUEL PRICE REPORT JANUARY 2016
18
Comparison Of Prices This Report Versus Last ReportThe following tables summarize the average retail prices submitted for this report by region and compare them to prices submitted for the October 2015 Alternative Fuel Price Report It should be noted that a portion of the price changes may be attributed to differing sample sizes and locations between the two reports
GASOLINE ($ per gallon)
Region Price for October 2015
Price for January 2016 Difference in $ Difference in
New England 241 212 -029 -1203
Central Atlantic 220 201 -019 -864
Lower Atlantic 215 193 -022 -1023
Midwest 236 183 -053 -2246
Gulf Coast 197 166 -031 -1574
Rocky Mountain 235 184 -051 -2170
West Coast 276 260 -016 -580
NATIONAL AVERAGE 235 198 -037 -1574
Region Price for October 2015
Price for January 2016 Difference in $ Difference in
New England 272 250 -022 -809
Central Atlantic 273 227 -046 -1685
Lower Atlantic 248 219 -029 -1169
Midwest 247 205 -042 -1700
Gulf Coast 227 201 -026 -1145
Rocky Mountain 246 205 -041 -1667
West Coast 280 255 -025 -893
NATIONAL AVERAGE 259 223 -036 -1390
DIESEL ($ per gallon)
CNG ($ per GGE)
Region Price for October 2015
Price for January 2016 Difference in $ Difference in
New England 244 245 001 041
Central Atlantic 199 197 -002 -101
Lower Atlantic 207 206 -001 -048
Midwest 203 195 -008 -394
Gulf Coast 204 203 -001 -049
Rocky Mountain 189 191 002 106
West Coast 237 240 003 127
NATIONAL AVERAGE 209 209 000 000
CNG
TABLE 11 a
TABLE 11 b
TABLE 11 c
19
CLEAN CITIES ALTERNATIVE FUEL PRICE REPORT JANUARY 2016
Comparison Of Prices This Report Versus Last Report cont
Region Price for Oct 2015 Price for January 2016 Difference in $ Difference in
New England 278 251 -027 -971
Central Atlantic 241 212 -029 -1203
Lower Atlantic 207 192 -015 -725
Midwest 211 169 -042 -1991
Gulf Coast 192 159 -033 -1719
Rocky Mountain 220 187 -033 -1500
West Coast 262 237 -025 -954
NATIONAL AVERAGE 218 186 -032 -1468
Region Price for Oct 2015 Price for January 2016 Difference in $ Difference in
New England 284 289 005 176
Central Atlantic 268 279 011 410
Lower Atlantic 296 285 -011 -372
Midwest 270 245 -025 -926
Gulf Coast 299 304 005 167
Rocky Mountain 291 288 -003 -103
West Coast 296 294 -002 -068
NATIONAL AVERAGE 290 285 -005 -172
Region Price for Oct 2015 Price for January 2016 Difference in $ Difference in
New England 270 249 -021 -778
Central Atlantic 260 233 -027 -1038
Lower Atlantic 256 228 -028 -1094
Midwest 253 230 -023 -909
Gulf Coast 251 210 -041 -1633
Rocky Mountain 255 221 -034 -1333
West Coast 296 274 -022 -743
NATIONAL AVERAGE 266 241 -025 -940
Region Price for Oct 2015 Price for January 2016 Difference in $ Difference in
New England 262 235 -027 -1031
Central Atlantic 582 430 -152 -2612
Lower Atlantic 333 312 -021 -631
Midwest 246 --- --- ---
Gulf Coast 249 228 -021 -843
Rocky Mountain 259 240 -019 -734
West Coast 353 339 -014 -397
NATIONAL AVERAGE 340 321 -019 -559
ETHANOL (E85)
($ per gallon)
PROPANE ($ per gallon)
BIODIESELB20
($ per gallon)
LPG
BIODIESELB99B100
($ per gallon)
TABLE 11 d
TABLE 11 e
TABLE 11 f
TABLE 11 g
CLEAN CITIES ALTERNATIVE FUEL PRICE REPORT JANUARY 2016
20
Price Comparison By Region For Public amp Private Refueling StationsThe tables below summarize average retail fuel prices contained in this report sorted by type of refueling station ie ldquoprivaterdquo or ldquopublicrdquo The stations classified as ldquopublicrdquo are open to the general public The majority of the stations classified as ldquoprivaterdquo are operated by state or local government agencies transit agencies utility districts colleges or universities or military facilities They serve the host agencyrsquos fleets and may have contractual or other arrangements in place to sell fuel to other government agencies andor selected other fleets In some cases contracts may include billing accounting or fleet service management fees that are rolled into the price of the fuel
For this report there were 3101 prices submitted from ldquopublicrdquo refueling stations and 360 prices submitted from ldquoprivaterdquo refueling stations for a total of 3461 prices
As with the other prices in this report these prices include state and federal taxes as described in the Methodology section of this document
Region PRIVATE PUBLIC
New England $213 $212
Central Atlantic $199 $201
Lower Atlantic $200 $193
Midwest $221 $181
Gulf Coast --- $166
Rocky Mountain $187 $184
West Coast $263 $259
NATIONAL AVERAGE $223 $196
Region PRIVATE PUBLIC
New England $202 $250
Central Atlantic $182 $204
Lower Atlantic $075 $213
Midwest $189 $197
Gulf Coast $177 $206
Rocky Mountain $176 $201
West Coast $207 $244
NATIONAL AVERAGE $182 $216
Region PRIVATE PUBLIC
New England $253 $250
Central Atlantic $207 $238
Lower Atlantic $199 $220
Midwest $167 $206
Gulf Coast --- $201
Rocky Mountain $162 $206
West Coast $239 $256
NATIONAL AVERAGE $214 $224
Region PRIVATE PUBLIC
New England --- $251
Central Atlantic $217 $211
Lower Atlantic $231 $192
Midwest $192 $167
Gulf Coast $199 $158
Rocky Mountain $167 $188
West Coast $244 $237
NATIONAL AVERAGE $205 $185
TABLE 12 a - GasolineAverage Retail Price by Refueling Station Type ($gal)
TABLE 12 b - DieselAverage Retail Price by Refueling Station Type ($gal)
TABLE 12 c - CNGAverage Retail Price by Refueling Station Type ($GGE)
TABLE 12 d - E85Average Retail Price by Refueling Station Type ($gal)
--- indicates no data points were submitted for this region
21
CLEAN CITIES ALTERNATIVE FUEL PRICE REPORT JANUARY 2016
Region PRIVATE PUBLIC
New England $258 $290
Central Atlantic $134 $320
Lower Atlantic $382 $284
Midwest $161 $249
Gulf Coast $131 $315
Rocky Mountain $243 $289
West Coast $302 $293
NATIONAL AVERAGE $200 $291
Region PRIVATE PUBLIC
New England $214 $270
Central Atlantic $221 $270
Lower Atlantic $204 $232
Midwest $205 $232
Gulf Coast $199 $212
Rocky Mountain --- $221
West Coast $228 $293
NATIONAL AVERAGE $220 $252
Comparison Of Prices By Region For Public amp Private Refueling Stations cont
Region PRIVATE PUBLIC
New England --- $235
Central Atlantic $161 $698
Lower Atlantic $350 $289
Midwest --- ---
Gulf Coast --- $227
Rocky Mountain --- $240
West Coast $341 $339
NATIONAL AVERAGE $326 $320
TABLE 12 e - PropaneAverage Retail Price by Refueling Station Type ($gal)
TABLE 12 f - B20Average Retail Price by Refueling Station Type ($gal)
TABLE 12 g - B99B100Average Retail Price by Refueling Station Type ($gal)
--- indicates no data points were submitted for this region
CLEAN CITIES ALTERNATIVE FUEL PRICE REPORT JANUARY 2016
22
Historical Alternative Fuel Prices From Previous ReportsThe following graphs illustrate historical prices for the alternative fuels included in the Alternative Fuel Price Report from 2007 to the present relative to gasoline and diesel Compressed natural gas (in GGE) propane and ethanol (E85) have been graphed against gasoline prices while compressed natural gas (in DGE) and biodiesel blends (B20 and B99B100) have been graphed against diesel prices
2010 2012 20142009 2011 lsquo162013 2015lsquo07 2008O J A J O J A J O J A J O J A J O J A J O J A J O J A J O OJ A J J
Natural Gas (GGE)Gasoline Ethanol (E85) Propane
$150
$175
$200
$225
$250
$275
$300
$325
$350
$375
$400
Pric
e pe
r gal
lon
2010 2012 20142009 2011 lsquo162013 2015lsquo07 2008O J A J O J A J O J A J O J A J O J A J O J A J O J A J O OJ A J J
Natural Gas (DGE)Diesel Biodiesel (B20) Biodiesel (B2B5)
$175
$200
$225
$250
$275
$300
$325
$350
$375
$400
$425
$450
$475
$500
Pric
e pe
r gal
lon
B99B100
FIGURE 14 ALTERNATIVE FUEL PRICES VERSUS GASOLINE
FIGURE 15 ALTERNATIVE FUEL PRICES VERSUS DIESEL
23
CLEAN CITIES ALTERNATIVE FUEL PRICE REPORT JANUARY 2016
Illustration of Conversion Factors for Fuels
9 httpctaornlgovdata10 According to the National Renewable Energy Laboratory (NREL) Alternative Fuels Data Center the energy content of common gasoline baseline references (E0 E10 and indolene) varies between 112114 and 116090 Btugal We chose 114300 Btugal for the E10 energy content consistent with the Transportation Energy Data Book (TEDB) energy content of CNG in GGEs See next footnote11 (566 lbs of CNGGGE) x (20200 BTUlb) = 114332 rounded to 11430012 Most gasoline available throughout the United States today is a blend of 90 gasoline and up to 10 ethanol or E10 Additionally the E85 that is sold in the United States today actually contains on average approximately 70 ethanol E85 energy content for this report is therefore calculated as [(70) x (E100 energy content)] + [(30) x (E0 energy content)] to more closely reflect the actual energy content of E85 fuel available today13 See footnote 12 above
Fuel Lower Heating Value
Gasoline (E0) 115400 BTUgal
Gasoline (E10)10 114300 BTUgal
Diesel 128700 BTUgal
Biodiesel (B100) 117100 BTUgal
Compressed Natural Gas (CNG)11 114300 BTUGGE
Ethanol (E100) 75700 BTUgal
Propane 83500 BTUgal
TABLE 13 Lower Heating Values
Conversion to GGE
The conversion factor used to convert the price of an alternative fuel from $gallon to $GGE is determined as follows
Conversion factor = BTUgal of gasoline (E10) BTUgal of alternative fuel
To calculate the price of an alternative fuel in $GGE multiply the price per gallon of the alternative fuel by the relevant conversion factor from Table 14
Fuel Conversion Factor
Biodiesel (B20) 090
Biodiesel (B100) 098
CNG 100
Ethanol (E85)12 130
Propane 137
TABLE 14 Conversion Factors $gal to $GGE
Fuel Conversion Factor
Biodiesel (B20) 102
Biodiesel (B100) 110
CNG 113
Ethanol (E85) 13 147
Propane 154
TABLE 15 Conversion Factors $gal to $DGE
Conversion factors used to establish prices in dollars per gasoline gallon equivalent ($GGE) and dollars per diesel gallon equivalent ($DGE) were developed using the lower heating values from the Transportation Energy Data Book Edition 339 and are listed to the left
In the case of CNG prices are provided to us in GGE so no conversion is necessary The representative heating value of CNG is provided in Table 13 as a reference
Conversion to DGE
The conversion factor used to convert the price of an alternative fuel from $gallon to $DGE is determined as follows
Conversion factor = BTUgal of diesel BTUgal of alternative fuel
For example the conversion factor used to convert a B100 price from $gal to $DGE is determined as follows
128700 BTUgal of diesel = 1099 rounded to 110 117100 BTUgal of B100
To calculate the price of an alternative fuel in $DGE multiply the price per gallon of the alternative fuel by the relevant conversion factor from Table 15
For example if the price of B100 is given as $300gal the $DGE is determined as follows ($300gal) x 110 = $330DGE
CLEAN CITIES ALTERNATIVE FUEL PRICE REPORT JANUARY 2016
24
ETHANOL (E85) AND GASOLINE AVERAGE RETAIL PRICES BY REGION (GGE)
Region E85 Prices ($GGE)
Gasoline Prices ($gal)
Price Difference
New England $326 $212 $114
Central Atlantic $276 $201 $075
Lower Atlantic $250 $193 $057
Midwest $220 $183 $037
Gulf Coast $207 $166 $041
Rocky Mountain $243 $184 $059
West Coast $308 $260 $048
NATIONAL AVERAGE
$242 $198 $044
TABLE 16aPROPANE (LPG) AND GASOLINE AVERAGE RETAIL PRICES
BY REGION (GGE)
Region LPG Prices ($GGE)
Gasoline Prices ($gal)
Price Difference
New England $396 $212 $184
Central Atlantic $382 $201 $181
Lower Atlantic $390 $193 $197
Midwest $336 $183 $153
Gulf Coast $416 $166 $250
Rocky Mountain $395 $184 $211
West Coast $403 $260 $143
NATIONAL AVERAGE
$390 $198 $192
TABLE 16b
BIODIESEL (B20) AND DIESEL AVERAGE RETAIL PRICES BY REGION (DGE)
Region B20 Prices ($DGE)
Diesel Prices ($gal)
Price Difference
New England $254 $250 $004
Central Atlantic $238 $227 $011
Lower Atlantic $233 $219 $014
Midwest $235 $205 $030
Gulf Coast $214 $201 $013
Rocky Mountain $225 $205 $020
West Coast $279 $255 $024
NATIONAL AVERAGE
$246 $223 $023
TABLE 16c
Negative numbers represent average E85 prices that are lower than gasoline on a $GGE basis Negative numbers represent average propane prices that are lower than gasoline on a $GGE basis
Negative numbers represent average B20 prices that are lower than gasoline on a $DGE basis
BIODIESEL (B99B100) AND DIESEL AVERAGE RETAIL PRICES BY REGION (DGE)
Region B99B100 Prices ($DGE)
Diesel Prices ($gal)
Price Difference
New England $258 $250 $009
Central Atlantic $473 $227 $246
Lower Atlantic $343 $219 $124
Midwest --- $205 ---
Gulf Coast $251 $201 $050
Rocky Mountain $264 $205 $059
West Coast $373 $255 $118
NATIONAL AVERAGE
$353 $223 $130
TABLE 16d
Negative numbers represent average B99B100 prices that are lower than gasoline on a $DGE basis
Comparison of Prices on an Energy-Equivalent BasisThe following tables compare prices for E85 propane B20 and B99B100 to conventional fuels (gasoline and diesel) on an energy-equivalent basis (Natural gas is generally sold in gasoline gallon equivalents or diesel gallon equivalents so the natural gas ldquoprice at the pumprdquo can be directly compared to the price of the corresponding conventional fuel as shown in Tables 5 and 6)
25
CLEAN CITIES ALTERNATIVE FUEL PRICE REPORT JANUARY 2016
AcknowledgementsThe authors would like to acknowledge all of the contributors from the Clean Cities community who have provided prices for this report we sincerely appreciate your continued dedication to the success of this report The authors would also like to acknowledge the continued support of DOE for developing this report
Would You Like To ParticipateIf you would like to provide prices for alternative fuels in your region and be part of the data collection effort for this report or if you have any questions please contact
US DOE Clean CitiesEE-3V1000 Independence Avenue SWWashington DC 20585Phone (202) 586-6459afprnwttechcom
DISCLAIMERThis document highlights work sponsored by agencies of the US Government Neither the US Government nor any agency thereof nor any of their employees makes any warranty express or implied or assumes any legal liability or responsibility for the accuracy completeness or usefulness of any information apparatus product or process disclosed or represents that its use would not infringe privately owned rights Reference herein to any specific commercial product process or ser-vice by trade name trademark manufacturer or otherwise does not necessarily constitute or imply its endorsement recommendation or favoring by the US Govern-ment or any agency thereof The views and opinions of authors expressed herein do not necessarily state or reflect those of the US Government or any agency thereof
For more information on this and other Clean Cities publications visit wwwcleancitiesenergygov or contact the Clean Cities Technical Response Service at 800-254-6735

CLEAN CITIES ALTERNATIVE FUEL PRICE REPORT JANUARY 2016
8
Compressed Natural Gas (Relative to Diesel)7
Table 6 shows the prices from Table 5 converted to $diesel gallon equivalent ($DGE) for easy comparison with diesel prices
As with other fuels the energy content of natural gas can vary CNG dispensers are calibrated for local gas compositions and dispense an accurate GGE for the actual gas being sold
COMPRESSED NATURAL GAS (CNG) AND DIESEL AVERAGE RETAIL PRICES BY REGION
Region CNG Prices ($DGE)
Diesel Prices ($gal)
PriceDifference
New England $277 $250 $027
Central Atlantic $223 $227 -$004
Lower Atlantic $233 $219 $014
Midwest $221 $205 $016
Gulf Coast $229 $201 $028
Rocky Mountain $216 $205 $011
West Coast $271 $255 $016
NATIONAL AVERAGE $236 $223 $013
The prices shown in Table 6 were submitted by Clean Cities coordinators fuel providers and other stakeholders on a voluntary basis between January 1 and January 15 2016
On average during this reporting period CNG cost about $013 more than diesel on a per diesel gallon equivalent basis
In this map negative numbers represent prices for CNG that are lower
than diesel on a per diesel gallon equivalent basis States not highlighted with a color did not have any CNG data
points in the current report
FIGURE 4 PRICE DIFFERENTIALS BY STATE FOR COMPRESSED NATURAL GAS (CNG) RELATIVE TO DIESEL
CNG Price DifferenceRelative to Diesel
DGE = diesel gallon equivalent Negative numbers represent average CNG prices that are lower than diesel on a $DGE basis
7 A total of 43 liquefied natural gas (LNG) prices were submitted with an average fuel price of $245DGE Because of the small number of price points this data is not reflected in the report
TABLE 6
Note The Alternative Fuel Price Report is a snapshot in time of retail fuel prices Alternative fuel fleets can obtain significantly lower fuel prices than those reported in the AFPR by entering into contracts directly with local fuel suppliers Contract prices will vary depending on fleet size and amount of fuel to be purchased distance from the supplier region of the country and other factors
9
CLEAN CITIES ALTERNATIVE FUEL PRICE REPORT JANUARY 2016
2010 2012 20142009 2011 lsquo162013 2015lsquo07 2008O J A J O J A J O J A J O J A J O J A J O J A J O J A J O OJ A J J
Natural Gas (DGE)Diesel
$175
$200
$225
$250
$275
$300
$325
$350
$375
$400
$425
$450
$475
Pric
e pe
r die
sel g
allo
n eq
uiva
lent
($
DG
E)
Compressed Natural Gas (CNG) cont
FIGURE 5 HISTORICAL COMPRESSED NATURAL GAS (CNG) PRICES VERSUS DIESEL
CNG
CLEAN CITIES ALTERNATIVE FUEL PRICE REPORT JANUARY 2016
10
Ethanol (E85)
Most gasoline available throughout the United States today is a blend of 90 gasoline and up to 10 ethanol or E10 Additionally the E85 that is sold in the United States today actually contains on average approximately 70 ethanol
E85 energy content for this report is therefore calculated as (70)(E100 energy content) + (30)(E0 energy content) to more closely reflect the actual energy content of E85 fuel available today
ETHANOL (E85) AND GASOLINE AVERAGE RETAIL PRICES BY REGION
Region E85 Prices ($gal)
Gasoline Prices ($gal)
PriceDifference
New England $251 $212 $039
Central Atlantic $212 $201 $011
Lower Atlantic $192 $193 -$001
Midwest $169 $183 -$014
Gulf Coast $159 $166 -$007
Rocky Mountain $187 $184 $003
West Coast $237 $260 -$023
NATIONAL AVERAGE $186 $198 -$012
The prices shown in Table 7 were submitted by Clean Cities coordinators fuel providers and other stakeholders on a voluntary basis between January 1 and January 15 2016
On average during this reporting period E85 cost about $012 less than gasoline on a per gallon basis
In this map negative numbers represent prices for E85 that are
lower than gasoline on a per gallon basis States not highlighted with a color did not have any E85 data
points in the current report
FIGURE 6 PRICE DIFFERENTIALS BY STATE FOR E85 RELATIVE TO GASOLINE
E85 Price DifferenceRelative to Gasoline
Negative numbers represent average E85 prices that are lower than gasoline on a $gal basis
TABLE 7
11
CLEAN CITIES ALTERNATIVE FUEL PRICE REPORT JANUARY 2016
2010 2012 20142009 2011 lsquo162013 2015lsquo07 2008O J A J O J A J O J A J O J A J O J A J O J A J O J A J O OJ A J J
$175
$200
$225
$250
$275
$300
$325
$350
$375
$400
EthanolGasoline
Ethanol (E85) cont
FIGURE 7 HISTORICAL ETHANOL (E85) PRICES VERSUS GASOLINE
CLEAN CITIES ALTERNATIVE FUEL PRICE REPORT JANUARY 2016
12
Propane (LPG)
Propane prices in this report are from both private fleet refueling stations and public refueling sites that can provide propane for vehicles and for other uses8
Note The Alternative Fuel Price Report is a snapshot in time of retail fuel prices Alternative fuel fleets can obtain significantly lower fuel prices than those reported in the AFPR by entering into contracts directly with local fuel suppliers Contract prices will vary depending on fleet size and amount of fuel to be purchased distance from the supplier region of the country and other factors
PROPANE (LPG) AND GASOLINE AVERAGE RETAIL PRICES BY REGION
Region LPG Prices ($gal)
Gasoline Prices ($gal)
PriceDifference
New England $289 $212 $077
Central Atlantic $279 $201 $078
Lower Atlantic $285 $193 $092
Midwest $245 $183 $062
Gulf Coast $304 $166 $138
Rocky Mountain $288 $184 $104
West Coast $294 $260 $034
NATIONAL AVERAGE $285 $198 $087
The prices shown in Table 8 were submitted by Clean Cities coordinators fuel providers and other stakeholders on a voluntary basis between January 1 and January 15 2016
On average during this reporting period propane cost about $087 more than gasoline on a per (liquid) gallon basis
8 Because many propane retailers provide fuel for non-vehicle uses (camping stoves gas grills etc) the National Renewable Energy Laboratory (NREL) has worked with suppliers to clarify the differences On the AFDC Station Locator website (httpwwwafdcenergygovlocatorstations) each public propane station is designated as a ldquoprimaryrdquo or ldquosecondaryrdquo service type Both types are able to fuel vehicles however stations designated as ldquoprimaryrdquo have indicated they have facilities and billing procedures specifically designed for vehicle customers They may also offer special vehicle pricing and most accept major credit cards similar to traditional gasolinediesel retailers Propane pricing reported in this guide reflects a sampling of both primary and secondary stations
In this map negative numbers represent prices for propane that are
lower than gasoline on a per gallon basis States not highlighted with a
color did not have any propane data points in the current report
FIGURE 8 PRICE DIFFERENTIALS BY STATE FOR PROPANE (LPG) RELATIVE TO GASOLINE
LPG Price DifferenceRelative to Gasoline
Negative numbers represent average propane prices that are lower than gasoline on a $gal basis
TABLE 8
13
CLEAN CITIES ALTERNATIVE FUEL PRICE REPORT JANUARY 2016
2010 2012 20142009 2011 lsquo162013 2015lsquo07 2008O J A J O J A J O J A J O J A J O J A J O J A J O J A J O OJ A J J
PropaneGasoline
Propane (LPG) cont
FIGURE 9 HISTORICAL PROPANE (LPG) PRICES VERSUS GASOLINE
LPG
CLEAN CITIES ALTERNATIVE FUEL PRICE REPORT JANUARY 2016
14
Biodiesel Blends B20
B20 is a blend of 20 biodiesel and 80 conventional diesel B20 contains only about 2 less energy (BTUs) per volume than 100 diesel The appendix at the end of this report provides conversion factors for calculating B20 prices on a GGE and DGE basis
BIODIESEL (B20) AND DIESEL AVERAGE RETAIL PRICES BY REGION
Region B20 Prices ($gal)
Diesel Prices ($gal)
PriceDifference
New England $249 $250 -$001
Central Atlantic $233 $227 $006
Lower Atlantic $228 $219 $009
Midwest $230 $205 $025
Gulf Coast $210 $201 $009
Rocky Mountain $221 $205 $016
West Coast $274 $255 $019
NATIONAL AVERAGE $241 $223 $018
The prices shown in Table 9 were submitted by Clean Cities coordinators fuel providers and other stakeholders on a voluntary basis between January 1 and January 15 2016
On a national average basis during this reporting period B20 cost about $018 more than diesel on a per gallon basis
In this map negative numbers represent prices for B20 that are lower than diesel on a per gallon basis States not highlighted with
a color did not have any B20 data points in the current report
FIGURE 10 PRICE DIFFERENTIALS BY STATE FOR B20 RELATIVE TO DIESEL
B20 Price DifferenceRelative to Diesel
Negative numbers represent average B20 prices that are lower than diesel on a $GAL basis
Note that B20 prices in many regions track very closely with diesel prices
TABLE 9
15
CLEAN CITIES ALTERNATIVE FUEL PRICE REPORT JANUARY 2016
2010 2012 20142009 2011 lsquo162013 2015lsquo07 2008O J A J O J A J O J A J O J A J O J A J O J A J O J A J O OJ A J J
$175
$200
$225
$250
$275
$300
$325
$350
$375
$400
$425
$450
$475
B20Diesel
Biodiesel Blends B20 cont
FIGURE 11 HISTORICAL B20 PRICES VERSUS DIESEL
CLEAN CITIES ALTERNATIVE FUEL PRICE REPORT JANUARY 2016
16
Biodiesel Blends B99B100
B100 contains about 10 less energy (BTUs) per volume than 100 diesel
The appendix at the end of this report provides conversion factors for calculating B100 prices on a GGE and DGE basis
BIODIESEL (B99B100) AND DIESEL AVERAGE RETAIL PRICES BY REGION
Region B99B100 Prices ($gal)
Diesel Prices ($gal)
PriceDifference
New England 235 250 -015
Central Atlantic 430 227 203
Lower Atlantic 312 219 093
Midwest --- 205 ---
Gulf Coast 228 201 027
Rocky Mountain 240 205 035
West Coast 339 255 084
NATIONAL AVERAGE 321 223 098
The prices shown in Table 10 were submitted by Clean Cities coordinators fuel providers and other stakeholders on a voluntary basis between January 1 and January 15 2016
On average during this reporting period B99B100 cost about $098 more than diesel on a per gallon basis
In this map negative numbers represent prices for B99B100 that
are lower than diesel on a per gallon basis States not highlighted with
a color did not have any B99B100 data points in the current report
FIGURE 12 PRICE DIFFERENTIALS BY STATE FOR B99B100 RELATIVE TO DIESEL
B99B100 Price Difference
Relative to Diesel
Negative numbers represent average B99B100 prices that are lower than diesel on a $GAL basis
TABLE 10
17
CLEAN CITIES ALTERNATIVE FUEL PRICE REPORT JANUARY 2016
2010 2012 20142009 2011 lsquo162013 2015lsquo07 2008O J A J O J A J O J A J O J A J O J A J O J A J O J A J O OJ A J J$200
$225
$250
$275
$300
$325
$350
$375
$400
$425
$450
$475
$500
B99B100Diesel
Biodiesel Blends B99B100 cont
FIGURE 13 HISTORICAL B99B100 PRICES VERSUS DIESEL
CLEAN CITIES ALTERNATIVE FUEL PRICE REPORT JANUARY 2016
18
Comparison Of Prices This Report Versus Last ReportThe following tables summarize the average retail prices submitted for this report by region and compare them to prices submitted for the October 2015 Alternative Fuel Price Report It should be noted that a portion of the price changes may be attributed to differing sample sizes and locations between the two reports
GASOLINE ($ per gallon)
Region Price for October 2015
Price for January 2016 Difference in $ Difference in
New England 241 212 -029 -1203
Central Atlantic 220 201 -019 -864
Lower Atlantic 215 193 -022 -1023
Midwest 236 183 -053 -2246
Gulf Coast 197 166 -031 -1574
Rocky Mountain 235 184 -051 -2170
West Coast 276 260 -016 -580
NATIONAL AVERAGE 235 198 -037 -1574
Region Price for October 2015
Price for January 2016 Difference in $ Difference in
New England 272 250 -022 -809
Central Atlantic 273 227 -046 -1685
Lower Atlantic 248 219 -029 -1169
Midwest 247 205 -042 -1700
Gulf Coast 227 201 -026 -1145
Rocky Mountain 246 205 -041 -1667
West Coast 280 255 -025 -893
NATIONAL AVERAGE 259 223 -036 -1390
DIESEL ($ per gallon)
CNG ($ per GGE)
Region Price for October 2015
Price for January 2016 Difference in $ Difference in
New England 244 245 001 041
Central Atlantic 199 197 -002 -101
Lower Atlantic 207 206 -001 -048
Midwest 203 195 -008 -394
Gulf Coast 204 203 -001 -049
Rocky Mountain 189 191 002 106
West Coast 237 240 003 127
NATIONAL AVERAGE 209 209 000 000
CNG
TABLE 11 a
TABLE 11 b
TABLE 11 c
19
CLEAN CITIES ALTERNATIVE FUEL PRICE REPORT JANUARY 2016
Comparison Of Prices This Report Versus Last Report cont
Region Price for Oct 2015 Price for January 2016 Difference in $ Difference in
New England 278 251 -027 -971
Central Atlantic 241 212 -029 -1203
Lower Atlantic 207 192 -015 -725
Midwest 211 169 -042 -1991
Gulf Coast 192 159 -033 -1719
Rocky Mountain 220 187 -033 -1500
West Coast 262 237 -025 -954
NATIONAL AVERAGE 218 186 -032 -1468
Region Price for Oct 2015 Price for January 2016 Difference in $ Difference in
New England 284 289 005 176
Central Atlantic 268 279 011 410
Lower Atlantic 296 285 -011 -372
Midwest 270 245 -025 -926
Gulf Coast 299 304 005 167
Rocky Mountain 291 288 -003 -103
West Coast 296 294 -002 -068
NATIONAL AVERAGE 290 285 -005 -172
Region Price for Oct 2015 Price for January 2016 Difference in $ Difference in
New England 270 249 -021 -778
Central Atlantic 260 233 -027 -1038
Lower Atlantic 256 228 -028 -1094
Midwest 253 230 -023 -909
Gulf Coast 251 210 -041 -1633
Rocky Mountain 255 221 -034 -1333
West Coast 296 274 -022 -743
NATIONAL AVERAGE 266 241 -025 -940
Region Price for Oct 2015 Price for January 2016 Difference in $ Difference in
New England 262 235 -027 -1031
Central Atlantic 582 430 -152 -2612
Lower Atlantic 333 312 -021 -631
Midwest 246 --- --- ---
Gulf Coast 249 228 -021 -843
Rocky Mountain 259 240 -019 -734
West Coast 353 339 -014 -397
NATIONAL AVERAGE 340 321 -019 -559
ETHANOL (E85)
($ per gallon)
PROPANE ($ per gallon)
BIODIESELB20
($ per gallon)
LPG
BIODIESELB99B100
($ per gallon)
TABLE 11 d
TABLE 11 e
TABLE 11 f
TABLE 11 g
CLEAN CITIES ALTERNATIVE FUEL PRICE REPORT JANUARY 2016
20
Price Comparison By Region For Public amp Private Refueling StationsThe tables below summarize average retail fuel prices contained in this report sorted by type of refueling station ie ldquoprivaterdquo or ldquopublicrdquo The stations classified as ldquopublicrdquo are open to the general public The majority of the stations classified as ldquoprivaterdquo are operated by state or local government agencies transit agencies utility districts colleges or universities or military facilities They serve the host agencyrsquos fleets and may have contractual or other arrangements in place to sell fuel to other government agencies andor selected other fleets In some cases contracts may include billing accounting or fleet service management fees that are rolled into the price of the fuel
For this report there were 3101 prices submitted from ldquopublicrdquo refueling stations and 360 prices submitted from ldquoprivaterdquo refueling stations for a total of 3461 prices
As with the other prices in this report these prices include state and federal taxes as described in the Methodology section of this document
Region PRIVATE PUBLIC
New England $213 $212
Central Atlantic $199 $201
Lower Atlantic $200 $193
Midwest $221 $181
Gulf Coast --- $166
Rocky Mountain $187 $184
West Coast $263 $259
NATIONAL AVERAGE $223 $196
Region PRIVATE PUBLIC
New England $202 $250
Central Atlantic $182 $204
Lower Atlantic $075 $213
Midwest $189 $197
Gulf Coast $177 $206
Rocky Mountain $176 $201
West Coast $207 $244
NATIONAL AVERAGE $182 $216
Region PRIVATE PUBLIC
New England $253 $250
Central Atlantic $207 $238
Lower Atlantic $199 $220
Midwest $167 $206
Gulf Coast --- $201
Rocky Mountain $162 $206
West Coast $239 $256
NATIONAL AVERAGE $214 $224
Region PRIVATE PUBLIC
New England --- $251
Central Atlantic $217 $211
Lower Atlantic $231 $192
Midwest $192 $167
Gulf Coast $199 $158
Rocky Mountain $167 $188
West Coast $244 $237
NATIONAL AVERAGE $205 $185
TABLE 12 a - GasolineAverage Retail Price by Refueling Station Type ($gal)
TABLE 12 b - DieselAverage Retail Price by Refueling Station Type ($gal)
TABLE 12 c - CNGAverage Retail Price by Refueling Station Type ($GGE)
TABLE 12 d - E85Average Retail Price by Refueling Station Type ($gal)
--- indicates no data points were submitted for this region
21
CLEAN CITIES ALTERNATIVE FUEL PRICE REPORT JANUARY 2016
Region PRIVATE PUBLIC
New England $258 $290
Central Atlantic $134 $320
Lower Atlantic $382 $284
Midwest $161 $249
Gulf Coast $131 $315
Rocky Mountain $243 $289
West Coast $302 $293
NATIONAL AVERAGE $200 $291
Region PRIVATE PUBLIC
New England $214 $270
Central Atlantic $221 $270
Lower Atlantic $204 $232
Midwest $205 $232
Gulf Coast $199 $212
Rocky Mountain --- $221
West Coast $228 $293
NATIONAL AVERAGE $220 $252
Comparison Of Prices By Region For Public amp Private Refueling Stations cont
Region PRIVATE PUBLIC
New England --- $235
Central Atlantic $161 $698
Lower Atlantic $350 $289
Midwest --- ---
Gulf Coast --- $227
Rocky Mountain --- $240
West Coast $341 $339
NATIONAL AVERAGE $326 $320
TABLE 12 e - PropaneAverage Retail Price by Refueling Station Type ($gal)
TABLE 12 f - B20Average Retail Price by Refueling Station Type ($gal)
TABLE 12 g - B99B100Average Retail Price by Refueling Station Type ($gal)
--- indicates no data points were submitted for this region
CLEAN CITIES ALTERNATIVE FUEL PRICE REPORT JANUARY 2016
22
Historical Alternative Fuel Prices From Previous ReportsThe following graphs illustrate historical prices for the alternative fuels included in the Alternative Fuel Price Report from 2007 to the present relative to gasoline and diesel Compressed natural gas (in GGE) propane and ethanol (E85) have been graphed against gasoline prices while compressed natural gas (in DGE) and biodiesel blends (B20 and B99B100) have been graphed against diesel prices
2010 2012 20142009 2011 lsquo162013 2015lsquo07 2008O J A J O J A J O J A J O J A J O J A J O J A J O J A J O OJ A J J
Natural Gas (GGE)Gasoline Ethanol (E85) Propane
$150
$175
$200
$225
$250
$275
$300
$325
$350
$375
$400
Pric
e pe
r gal
lon
2010 2012 20142009 2011 lsquo162013 2015lsquo07 2008O J A J O J A J O J A J O J A J O J A J O J A J O J A J O OJ A J J
Natural Gas (DGE)Diesel Biodiesel (B20) Biodiesel (B2B5)
$175
$200
$225
$250
$275
$300
$325
$350
$375
$400
$425
$450
$475
$500
Pric
e pe
r gal
lon
B99B100
FIGURE 14 ALTERNATIVE FUEL PRICES VERSUS GASOLINE
FIGURE 15 ALTERNATIVE FUEL PRICES VERSUS DIESEL
23
CLEAN CITIES ALTERNATIVE FUEL PRICE REPORT JANUARY 2016
Illustration of Conversion Factors for Fuels
9 httpctaornlgovdata10 According to the National Renewable Energy Laboratory (NREL) Alternative Fuels Data Center the energy content of common gasoline baseline references (E0 E10 and indolene) varies between 112114 and 116090 Btugal We chose 114300 Btugal for the E10 energy content consistent with the Transportation Energy Data Book (TEDB) energy content of CNG in GGEs See next footnote11 (566 lbs of CNGGGE) x (20200 BTUlb) = 114332 rounded to 11430012 Most gasoline available throughout the United States today is a blend of 90 gasoline and up to 10 ethanol or E10 Additionally the E85 that is sold in the United States today actually contains on average approximately 70 ethanol E85 energy content for this report is therefore calculated as [(70) x (E100 energy content)] + [(30) x (E0 energy content)] to more closely reflect the actual energy content of E85 fuel available today13 See footnote 12 above
Fuel Lower Heating Value
Gasoline (E0) 115400 BTUgal
Gasoline (E10)10 114300 BTUgal
Diesel 128700 BTUgal
Biodiesel (B100) 117100 BTUgal
Compressed Natural Gas (CNG)11 114300 BTUGGE
Ethanol (E100) 75700 BTUgal
Propane 83500 BTUgal
TABLE 13 Lower Heating Values
Conversion to GGE
The conversion factor used to convert the price of an alternative fuel from $gallon to $GGE is determined as follows
Conversion factor = BTUgal of gasoline (E10) BTUgal of alternative fuel
To calculate the price of an alternative fuel in $GGE multiply the price per gallon of the alternative fuel by the relevant conversion factor from Table 14
Fuel Conversion Factor
Biodiesel (B20) 090
Biodiesel (B100) 098
CNG 100
Ethanol (E85)12 130
Propane 137
TABLE 14 Conversion Factors $gal to $GGE
Fuel Conversion Factor
Biodiesel (B20) 102
Biodiesel (B100) 110
CNG 113
Ethanol (E85) 13 147
Propane 154
TABLE 15 Conversion Factors $gal to $DGE
Conversion factors used to establish prices in dollars per gasoline gallon equivalent ($GGE) and dollars per diesel gallon equivalent ($DGE) were developed using the lower heating values from the Transportation Energy Data Book Edition 339 and are listed to the left
In the case of CNG prices are provided to us in GGE so no conversion is necessary The representative heating value of CNG is provided in Table 13 as a reference
Conversion to DGE
The conversion factor used to convert the price of an alternative fuel from $gallon to $DGE is determined as follows
Conversion factor = BTUgal of diesel BTUgal of alternative fuel
For example the conversion factor used to convert a B100 price from $gal to $DGE is determined as follows
128700 BTUgal of diesel = 1099 rounded to 110 117100 BTUgal of B100
To calculate the price of an alternative fuel in $DGE multiply the price per gallon of the alternative fuel by the relevant conversion factor from Table 15
For example if the price of B100 is given as $300gal the $DGE is determined as follows ($300gal) x 110 = $330DGE
CLEAN CITIES ALTERNATIVE FUEL PRICE REPORT JANUARY 2016
24
ETHANOL (E85) AND GASOLINE AVERAGE RETAIL PRICES BY REGION (GGE)
Region E85 Prices ($GGE)
Gasoline Prices ($gal)
Price Difference
New England $326 $212 $114
Central Atlantic $276 $201 $075
Lower Atlantic $250 $193 $057
Midwest $220 $183 $037
Gulf Coast $207 $166 $041
Rocky Mountain $243 $184 $059
West Coast $308 $260 $048
NATIONAL AVERAGE
$242 $198 $044
TABLE 16aPROPANE (LPG) AND GASOLINE AVERAGE RETAIL PRICES
BY REGION (GGE)
Region LPG Prices ($GGE)
Gasoline Prices ($gal)
Price Difference
New England $396 $212 $184
Central Atlantic $382 $201 $181
Lower Atlantic $390 $193 $197
Midwest $336 $183 $153
Gulf Coast $416 $166 $250
Rocky Mountain $395 $184 $211
West Coast $403 $260 $143
NATIONAL AVERAGE
$390 $198 $192
TABLE 16b
BIODIESEL (B20) AND DIESEL AVERAGE RETAIL PRICES BY REGION (DGE)
Region B20 Prices ($DGE)
Diesel Prices ($gal)
Price Difference
New England $254 $250 $004
Central Atlantic $238 $227 $011
Lower Atlantic $233 $219 $014
Midwest $235 $205 $030
Gulf Coast $214 $201 $013
Rocky Mountain $225 $205 $020
West Coast $279 $255 $024
NATIONAL AVERAGE
$246 $223 $023
TABLE 16c
Negative numbers represent average E85 prices that are lower than gasoline on a $GGE basis Negative numbers represent average propane prices that are lower than gasoline on a $GGE basis
Negative numbers represent average B20 prices that are lower than gasoline on a $DGE basis
BIODIESEL (B99B100) AND DIESEL AVERAGE RETAIL PRICES BY REGION (DGE)
Region B99B100 Prices ($DGE)
Diesel Prices ($gal)
Price Difference
New England $258 $250 $009
Central Atlantic $473 $227 $246
Lower Atlantic $343 $219 $124
Midwest --- $205 ---
Gulf Coast $251 $201 $050
Rocky Mountain $264 $205 $059
West Coast $373 $255 $118
NATIONAL AVERAGE
$353 $223 $130
TABLE 16d
Negative numbers represent average B99B100 prices that are lower than gasoline on a $DGE basis
Comparison of Prices on an Energy-Equivalent BasisThe following tables compare prices for E85 propane B20 and B99B100 to conventional fuels (gasoline and diesel) on an energy-equivalent basis (Natural gas is generally sold in gasoline gallon equivalents or diesel gallon equivalents so the natural gas ldquoprice at the pumprdquo can be directly compared to the price of the corresponding conventional fuel as shown in Tables 5 and 6)
25
CLEAN CITIES ALTERNATIVE FUEL PRICE REPORT JANUARY 2016
AcknowledgementsThe authors would like to acknowledge all of the contributors from the Clean Cities community who have provided prices for this report we sincerely appreciate your continued dedication to the success of this report The authors would also like to acknowledge the continued support of DOE for developing this report
Would You Like To ParticipateIf you would like to provide prices for alternative fuels in your region and be part of the data collection effort for this report or if you have any questions please contact
US DOE Clean CitiesEE-3V1000 Independence Avenue SWWashington DC 20585Phone (202) 586-6459afprnwttechcom
DISCLAIMERThis document highlights work sponsored by agencies of the US Government Neither the US Government nor any agency thereof nor any of their employees makes any warranty express or implied or assumes any legal liability or responsibility for the accuracy completeness or usefulness of any information apparatus product or process disclosed or represents that its use would not infringe privately owned rights Reference herein to any specific commercial product process or ser-vice by trade name trademark manufacturer or otherwise does not necessarily constitute or imply its endorsement recommendation or favoring by the US Govern-ment or any agency thereof The views and opinions of authors expressed herein do not necessarily state or reflect those of the US Government or any agency thereof
For more information on this and other Clean Cities publications visit wwwcleancitiesenergygov or contact the Clean Cities Technical Response Service at 800-254-6735
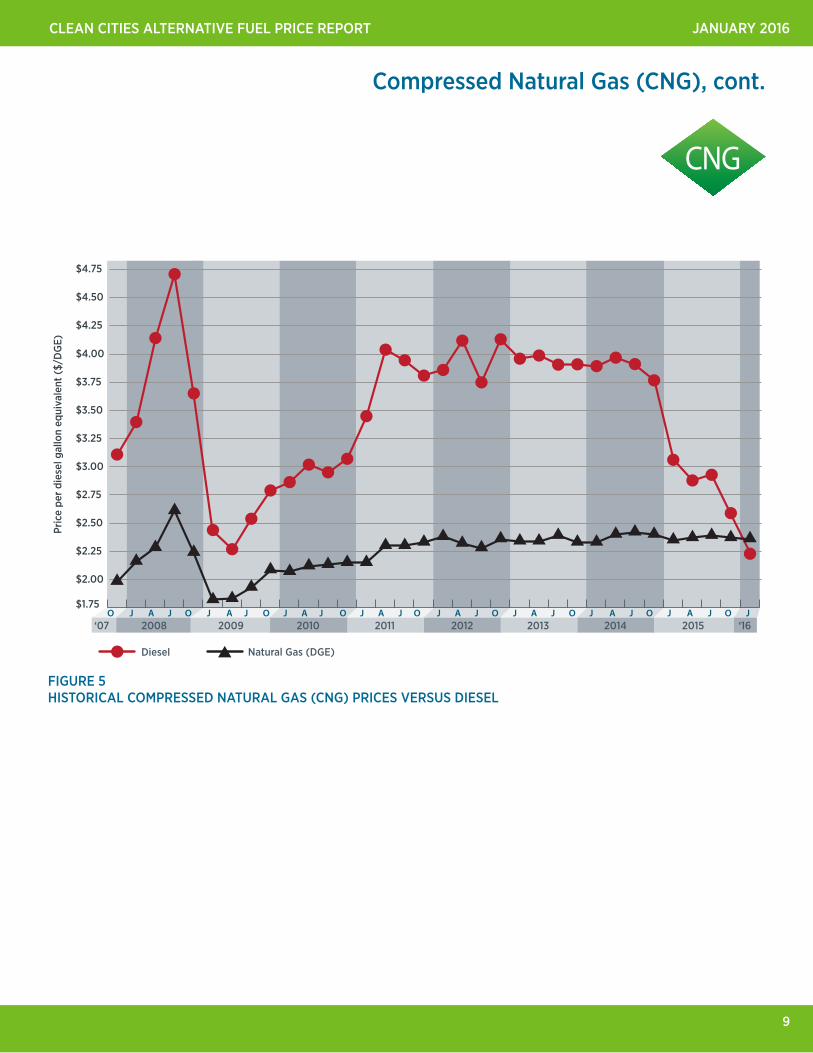

CLEAN CITIES ALTERNATIVE FUEL PRICE REPORT JANUARY 2016
10
Ethanol (E85)
Most gasoline available throughout the United States today is a blend of 90 gasoline and up to 10 ethanol or E10 Additionally the E85 that is sold in the United States today actually contains on average approximately 70 ethanol
E85 energy content for this report is therefore calculated as (70)(E100 energy content) + (30)(E0 energy content) to more closely reflect the actual energy content of E85 fuel available today
ETHANOL (E85) AND GASOLINE AVERAGE RETAIL PRICES BY REGION
Region E85 Prices ($gal)
Gasoline Prices ($gal)
PriceDifference
New England $251 $212 $039
Central Atlantic $212 $201 $011
Lower Atlantic $192 $193 -$001
Midwest $169 $183 -$014
Gulf Coast $159 $166 -$007
Rocky Mountain $187 $184 $003
West Coast $237 $260 -$023
NATIONAL AVERAGE $186 $198 -$012
The prices shown in Table 7 were submitted by Clean Cities coordinators fuel providers and other stakeholders on a voluntary basis between January 1 and January 15 2016
On average during this reporting period E85 cost about $012 less than gasoline on a per gallon basis
In this map negative numbers represent prices for E85 that are
lower than gasoline on a per gallon basis States not highlighted with a color did not have any E85 data
points in the current report
FIGURE 6 PRICE DIFFERENTIALS BY STATE FOR E85 RELATIVE TO GASOLINE
E85 Price DifferenceRelative to Gasoline
Negative numbers represent average E85 prices that are lower than gasoline on a $gal basis
TABLE 7
11
CLEAN CITIES ALTERNATIVE FUEL PRICE REPORT JANUARY 2016
2010 2012 20142009 2011 lsquo162013 2015lsquo07 2008O J A J O J A J O J A J O J A J O J A J O J A J O J A J O OJ A J J
$175
$200
$225
$250
$275
$300
$325
$350
$375
$400
EthanolGasoline
Ethanol (E85) cont
FIGURE 7 HISTORICAL ETHANOL (E85) PRICES VERSUS GASOLINE
CLEAN CITIES ALTERNATIVE FUEL PRICE REPORT JANUARY 2016
12
Propane (LPG)
Propane prices in this report are from both private fleet refueling stations and public refueling sites that can provide propane for vehicles and for other uses8
Note The Alternative Fuel Price Report is a snapshot in time of retail fuel prices Alternative fuel fleets can obtain significantly lower fuel prices than those reported in the AFPR by entering into contracts directly with local fuel suppliers Contract prices will vary depending on fleet size and amount of fuel to be purchased distance from the supplier region of the country and other factors
PROPANE (LPG) AND GASOLINE AVERAGE RETAIL PRICES BY REGION
Region LPG Prices ($gal)
Gasoline Prices ($gal)
PriceDifference
New England $289 $212 $077
Central Atlantic $279 $201 $078
Lower Atlantic $285 $193 $092
Midwest $245 $183 $062
Gulf Coast $304 $166 $138
Rocky Mountain $288 $184 $104
West Coast $294 $260 $034
NATIONAL AVERAGE $285 $198 $087
The prices shown in Table 8 were submitted by Clean Cities coordinators fuel providers and other stakeholders on a voluntary basis between January 1 and January 15 2016
On average during this reporting period propane cost about $087 more than gasoline on a per (liquid) gallon basis
8 Because many propane retailers provide fuel for non-vehicle uses (camping stoves gas grills etc) the National Renewable Energy Laboratory (NREL) has worked with suppliers to clarify the differences On the AFDC Station Locator website (httpwwwafdcenergygovlocatorstations) each public propane station is designated as a ldquoprimaryrdquo or ldquosecondaryrdquo service type Both types are able to fuel vehicles however stations designated as ldquoprimaryrdquo have indicated they have facilities and billing procedures specifically designed for vehicle customers They may also offer special vehicle pricing and most accept major credit cards similar to traditional gasolinediesel retailers Propane pricing reported in this guide reflects a sampling of both primary and secondary stations
In this map negative numbers represent prices for propane that are
lower than gasoline on a per gallon basis States not highlighted with a
color did not have any propane data points in the current report
FIGURE 8 PRICE DIFFERENTIALS BY STATE FOR PROPANE (LPG) RELATIVE TO GASOLINE
LPG Price DifferenceRelative to Gasoline
Negative numbers represent average propane prices that are lower than gasoline on a $gal basis
TABLE 8
13
CLEAN CITIES ALTERNATIVE FUEL PRICE REPORT JANUARY 2016
2010 2012 20142009 2011 lsquo162013 2015lsquo07 2008O J A J O J A J O J A J O J A J O J A J O J A J O J A J O OJ A J J
PropaneGasoline
Propane (LPG) cont
FIGURE 9 HISTORICAL PROPANE (LPG) PRICES VERSUS GASOLINE
LPG
CLEAN CITIES ALTERNATIVE FUEL PRICE REPORT JANUARY 2016
14
Biodiesel Blends B20
B20 is a blend of 20 biodiesel and 80 conventional diesel B20 contains only about 2 less energy (BTUs) per volume than 100 diesel The appendix at the end of this report provides conversion factors for calculating B20 prices on a GGE and DGE basis
BIODIESEL (B20) AND DIESEL AVERAGE RETAIL PRICES BY REGION
Region B20 Prices ($gal)
Diesel Prices ($gal)
PriceDifference
New England $249 $250 -$001
Central Atlantic $233 $227 $006
Lower Atlantic $228 $219 $009
Midwest $230 $205 $025
Gulf Coast $210 $201 $009
Rocky Mountain $221 $205 $016
West Coast $274 $255 $019
NATIONAL AVERAGE $241 $223 $018
The prices shown in Table 9 were submitted by Clean Cities coordinators fuel providers and other stakeholders on a voluntary basis between January 1 and January 15 2016
On a national average basis during this reporting period B20 cost about $018 more than diesel on a per gallon basis
In this map negative numbers represent prices for B20 that are lower than diesel on a per gallon basis States not highlighted with
a color did not have any B20 data points in the current report
FIGURE 10 PRICE DIFFERENTIALS BY STATE FOR B20 RELATIVE TO DIESEL
B20 Price DifferenceRelative to Diesel
Negative numbers represent average B20 prices that are lower than diesel on a $GAL basis
Note that B20 prices in many regions track very closely with diesel prices
TABLE 9
15
CLEAN CITIES ALTERNATIVE FUEL PRICE REPORT JANUARY 2016
2010 2012 20142009 2011 lsquo162013 2015lsquo07 2008O J A J O J A J O J A J O J A J O J A J O J A J O J A J O OJ A J J
$175
$200
$225
$250
$275
$300
$325
$350
$375
$400
$425
$450
$475
B20Diesel
Biodiesel Blends B20 cont
FIGURE 11 HISTORICAL B20 PRICES VERSUS DIESEL
CLEAN CITIES ALTERNATIVE FUEL PRICE REPORT JANUARY 2016
16
Biodiesel Blends B99B100
B100 contains about 10 less energy (BTUs) per volume than 100 diesel
The appendix at the end of this report provides conversion factors for calculating B100 prices on a GGE and DGE basis
BIODIESEL (B99B100) AND DIESEL AVERAGE RETAIL PRICES BY REGION
Region B99B100 Prices ($gal)
Diesel Prices ($gal)
PriceDifference
New England 235 250 -015
Central Atlantic 430 227 203
Lower Atlantic 312 219 093
Midwest --- 205 ---
Gulf Coast 228 201 027
Rocky Mountain 240 205 035
West Coast 339 255 084
NATIONAL AVERAGE 321 223 098
The prices shown in Table 10 were submitted by Clean Cities coordinators fuel providers and other stakeholders on a voluntary basis between January 1 and January 15 2016
On average during this reporting period B99B100 cost about $098 more than diesel on a per gallon basis
In this map negative numbers represent prices for B99B100 that
are lower than diesel on a per gallon basis States not highlighted with
a color did not have any B99B100 data points in the current report
FIGURE 12 PRICE DIFFERENTIALS BY STATE FOR B99B100 RELATIVE TO DIESEL
B99B100 Price Difference
Relative to Diesel
Negative numbers represent average B99B100 prices that are lower than diesel on a $GAL basis
TABLE 10
17
CLEAN CITIES ALTERNATIVE FUEL PRICE REPORT JANUARY 2016
2010 2012 20142009 2011 lsquo162013 2015lsquo07 2008O J A J O J A J O J A J O J A J O J A J O J A J O J A J O OJ A J J$200
$225
$250
$275
$300
$325
$350
$375
$400
$425
$450
$475
$500
B99B100Diesel
Biodiesel Blends B99B100 cont
FIGURE 13 HISTORICAL B99B100 PRICES VERSUS DIESEL
CLEAN CITIES ALTERNATIVE FUEL PRICE REPORT JANUARY 2016
18
Comparison Of Prices This Report Versus Last ReportThe following tables summarize the average retail prices submitted for this report by region and compare them to prices submitted for the October 2015 Alternative Fuel Price Report It should be noted that a portion of the price changes may be attributed to differing sample sizes and locations between the two reports
GASOLINE ($ per gallon)
Region Price for October 2015
Price for January 2016 Difference in $ Difference in
New England 241 212 -029 -1203
Central Atlantic 220 201 -019 -864
Lower Atlantic 215 193 -022 -1023
Midwest 236 183 -053 -2246
Gulf Coast 197 166 -031 -1574
Rocky Mountain 235 184 -051 -2170
West Coast 276 260 -016 -580
NATIONAL AVERAGE 235 198 -037 -1574
Region Price for October 2015
Price for January 2016 Difference in $ Difference in
New England 272 250 -022 -809
Central Atlantic 273 227 -046 -1685
Lower Atlantic 248 219 -029 -1169
Midwest 247 205 -042 -1700
Gulf Coast 227 201 -026 -1145
Rocky Mountain 246 205 -041 -1667
West Coast 280 255 -025 -893
NATIONAL AVERAGE 259 223 -036 -1390
DIESEL ($ per gallon)
CNG ($ per GGE)
Region Price for October 2015
Price for January 2016 Difference in $ Difference in
New England 244 245 001 041
Central Atlantic 199 197 -002 -101
Lower Atlantic 207 206 -001 -048
Midwest 203 195 -008 -394
Gulf Coast 204 203 -001 -049
Rocky Mountain 189 191 002 106
West Coast 237 240 003 127
NATIONAL AVERAGE 209 209 000 000
CNG
TABLE 11 a
TABLE 11 b
TABLE 11 c
19
CLEAN CITIES ALTERNATIVE FUEL PRICE REPORT JANUARY 2016
Comparison Of Prices This Report Versus Last Report cont
Region Price for Oct 2015 Price for January 2016 Difference in $ Difference in
New England 278 251 -027 -971
Central Atlantic 241 212 -029 -1203
Lower Atlantic 207 192 -015 -725
Midwest 211 169 -042 -1991
Gulf Coast 192 159 -033 -1719
Rocky Mountain 220 187 -033 -1500
West Coast 262 237 -025 -954
NATIONAL AVERAGE 218 186 -032 -1468
Region Price for Oct 2015 Price for January 2016 Difference in $ Difference in
New England 284 289 005 176
Central Atlantic 268 279 011 410
Lower Atlantic 296 285 -011 -372
Midwest 270 245 -025 -926
Gulf Coast 299 304 005 167
Rocky Mountain 291 288 -003 -103
West Coast 296 294 -002 -068
NATIONAL AVERAGE 290 285 -005 -172
Region Price for Oct 2015 Price for January 2016 Difference in $ Difference in
New England 270 249 -021 -778
Central Atlantic 260 233 -027 -1038
Lower Atlantic 256 228 -028 -1094
Midwest 253 230 -023 -909
Gulf Coast 251 210 -041 -1633
Rocky Mountain 255 221 -034 -1333
West Coast 296 274 -022 -743
NATIONAL AVERAGE 266 241 -025 -940
Region Price for Oct 2015 Price for January 2016 Difference in $ Difference in
New England 262 235 -027 -1031
Central Atlantic 582 430 -152 -2612
Lower Atlantic 333 312 -021 -631
Midwest 246 --- --- ---
Gulf Coast 249 228 -021 -843
Rocky Mountain 259 240 -019 -734
West Coast 353 339 -014 -397
NATIONAL AVERAGE 340 321 -019 -559
ETHANOL (E85)
($ per gallon)
PROPANE ($ per gallon)
BIODIESELB20
($ per gallon)
LPG
BIODIESELB99B100
($ per gallon)
TABLE 11 d
TABLE 11 e
TABLE 11 f
TABLE 11 g
CLEAN CITIES ALTERNATIVE FUEL PRICE REPORT JANUARY 2016
20
Price Comparison By Region For Public amp Private Refueling StationsThe tables below summarize average retail fuel prices contained in this report sorted by type of refueling station ie ldquoprivaterdquo or ldquopublicrdquo The stations classified as ldquopublicrdquo are open to the general public The majority of the stations classified as ldquoprivaterdquo are operated by state or local government agencies transit agencies utility districts colleges or universities or military facilities They serve the host agencyrsquos fleets and may have contractual or other arrangements in place to sell fuel to other government agencies andor selected other fleets In some cases contracts may include billing accounting or fleet service management fees that are rolled into the price of the fuel
For this report there were 3101 prices submitted from ldquopublicrdquo refueling stations and 360 prices submitted from ldquoprivaterdquo refueling stations for a total of 3461 prices
As with the other prices in this report these prices include state and federal taxes as described in the Methodology section of this document
Region PRIVATE PUBLIC
New England $213 $212
Central Atlantic $199 $201
Lower Atlantic $200 $193
Midwest $221 $181
Gulf Coast --- $166
Rocky Mountain $187 $184
West Coast $263 $259
NATIONAL AVERAGE $223 $196
Region PRIVATE PUBLIC
New England $202 $250
Central Atlantic $182 $204
Lower Atlantic $075 $213
Midwest $189 $197
Gulf Coast $177 $206
Rocky Mountain $176 $201
West Coast $207 $244
NATIONAL AVERAGE $182 $216
Region PRIVATE PUBLIC
New England $253 $250
Central Atlantic $207 $238
Lower Atlantic $199 $220
Midwest $167 $206
Gulf Coast --- $201
Rocky Mountain $162 $206
West Coast $239 $256
NATIONAL AVERAGE $214 $224
Region PRIVATE PUBLIC
New England --- $251
Central Atlantic $217 $211
Lower Atlantic $231 $192
Midwest $192 $167
Gulf Coast $199 $158
Rocky Mountain $167 $188
West Coast $244 $237
NATIONAL AVERAGE $205 $185
TABLE 12 a - GasolineAverage Retail Price by Refueling Station Type ($gal)
TABLE 12 b - DieselAverage Retail Price by Refueling Station Type ($gal)
TABLE 12 c - CNGAverage Retail Price by Refueling Station Type ($GGE)
TABLE 12 d - E85Average Retail Price by Refueling Station Type ($gal)
--- indicates no data points were submitted for this region
21
CLEAN CITIES ALTERNATIVE FUEL PRICE REPORT JANUARY 2016
Region PRIVATE PUBLIC
New England $258 $290
Central Atlantic $134 $320
Lower Atlantic $382 $284
Midwest $161 $249
Gulf Coast $131 $315
Rocky Mountain $243 $289
West Coast $302 $293
NATIONAL AVERAGE $200 $291
Region PRIVATE PUBLIC
New England $214 $270
Central Atlantic $221 $270
Lower Atlantic $204 $232
Midwest $205 $232
Gulf Coast $199 $212
Rocky Mountain --- $221
West Coast $228 $293
NATIONAL AVERAGE $220 $252
Comparison Of Prices By Region For Public amp Private Refueling Stations cont
Region PRIVATE PUBLIC
New England --- $235
Central Atlantic $161 $698
Lower Atlantic $350 $289
Midwest --- ---
Gulf Coast --- $227
Rocky Mountain --- $240
West Coast $341 $339
NATIONAL AVERAGE $326 $320
TABLE 12 e - PropaneAverage Retail Price by Refueling Station Type ($gal)
TABLE 12 f - B20Average Retail Price by Refueling Station Type ($gal)
TABLE 12 g - B99B100Average Retail Price by Refueling Station Type ($gal)
--- indicates no data points were submitted for this region
CLEAN CITIES ALTERNATIVE FUEL PRICE REPORT JANUARY 2016
22
Historical Alternative Fuel Prices From Previous ReportsThe following graphs illustrate historical prices for the alternative fuels included in the Alternative Fuel Price Report from 2007 to the present relative to gasoline and diesel Compressed natural gas (in GGE) propane and ethanol (E85) have been graphed against gasoline prices while compressed natural gas (in DGE) and biodiesel blends (B20 and B99B100) have been graphed against diesel prices
2010 2012 20142009 2011 lsquo162013 2015lsquo07 2008O J A J O J A J O J A J O J A J O J A J O J A J O J A J O OJ A J J
Natural Gas (GGE)Gasoline Ethanol (E85) Propane
$150
$175
$200
$225
$250
$275
$300
$325
$350
$375
$400
Pric
e pe
r gal
lon
2010 2012 20142009 2011 lsquo162013 2015lsquo07 2008O J A J O J A J O J A J O J A J O J A J O J A J O J A J O OJ A J J
Natural Gas (DGE)Diesel Biodiesel (B20) Biodiesel (B2B5)
$175
$200
$225
$250
$275
$300
$325
$350
$375
$400
$425
$450
$475
$500
Pric
e pe
r gal
lon
B99B100
FIGURE 14 ALTERNATIVE FUEL PRICES VERSUS GASOLINE
FIGURE 15 ALTERNATIVE FUEL PRICES VERSUS DIESEL
23
CLEAN CITIES ALTERNATIVE FUEL PRICE REPORT JANUARY 2016
Illustration of Conversion Factors for Fuels
9 httpctaornlgovdata10 According to the National Renewable Energy Laboratory (NREL) Alternative Fuels Data Center the energy content of common gasoline baseline references (E0 E10 and indolene) varies between 112114 and 116090 Btugal We chose 114300 Btugal for the E10 energy content consistent with the Transportation Energy Data Book (TEDB) energy content of CNG in GGEs See next footnote11 (566 lbs of CNGGGE) x (20200 BTUlb) = 114332 rounded to 11430012 Most gasoline available throughout the United States today is a blend of 90 gasoline and up to 10 ethanol or E10 Additionally the E85 that is sold in the United States today actually contains on average approximately 70 ethanol E85 energy content for this report is therefore calculated as [(70) x (E100 energy content)] + [(30) x (E0 energy content)] to more closely reflect the actual energy content of E85 fuel available today13 See footnote 12 above
Fuel Lower Heating Value
Gasoline (E0) 115400 BTUgal
Gasoline (E10)10 114300 BTUgal
Diesel 128700 BTUgal
Biodiesel (B100) 117100 BTUgal
Compressed Natural Gas (CNG)11 114300 BTUGGE
Ethanol (E100) 75700 BTUgal
Propane 83500 BTUgal
TABLE 13 Lower Heating Values
Conversion to GGE
The conversion factor used to convert the price of an alternative fuel from $gallon to $GGE is determined as follows
Conversion factor = BTUgal of gasoline (E10) BTUgal of alternative fuel
To calculate the price of an alternative fuel in $GGE multiply the price per gallon of the alternative fuel by the relevant conversion factor from Table 14
Fuel Conversion Factor
Biodiesel (B20) 090
Biodiesel (B100) 098
CNG 100
Ethanol (E85)12 130
Propane 137
TABLE 14 Conversion Factors $gal to $GGE
Fuel Conversion Factor
Biodiesel (B20) 102
Biodiesel (B100) 110
CNG 113
Ethanol (E85) 13 147
Propane 154
TABLE 15 Conversion Factors $gal to $DGE
Conversion factors used to establish prices in dollars per gasoline gallon equivalent ($GGE) and dollars per diesel gallon equivalent ($DGE) were developed using the lower heating values from the Transportation Energy Data Book Edition 339 and are listed to the left
In the case of CNG prices are provided to us in GGE so no conversion is necessary The representative heating value of CNG is provided in Table 13 as a reference
Conversion to DGE
The conversion factor used to convert the price of an alternative fuel from $gallon to $DGE is determined as follows
Conversion factor = BTUgal of diesel BTUgal of alternative fuel
For example the conversion factor used to convert a B100 price from $gal to $DGE is determined as follows
128700 BTUgal of diesel = 1099 rounded to 110 117100 BTUgal of B100
To calculate the price of an alternative fuel in $DGE multiply the price per gallon of the alternative fuel by the relevant conversion factor from Table 15
For example if the price of B100 is given as $300gal the $DGE is determined as follows ($300gal) x 110 = $330DGE
CLEAN CITIES ALTERNATIVE FUEL PRICE REPORT JANUARY 2016
24
ETHANOL (E85) AND GASOLINE AVERAGE RETAIL PRICES BY REGION (GGE)
Region E85 Prices ($GGE)
Gasoline Prices ($gal)
Price Difference
New England $326 $212 $114
Central Atlantic $276 $201 $075
Lower Atlantic $250 $193 $057
Midwest $220 $183 $037
Gulf Coast $207 $166 $041
Rocky Mountain $243 $184 $059
West Coast $308 $260 $048
NATIONAL AVERAGE
$242 $198 $044
TABLE 16aPROPANE (LPG) AND GASOLINE AVERAGE RETAIL PRICES
BY REGION (GGE)
Region LPG Prices ($GGE)
Gasoline Prices ($gal)
Price Difference
New England $396 $212 $184
Central Atlantic $382 $201 $181
Lower Atlantic $390 $193 $197
Midwest $336 $183 $153
Gulf Coast $416 $166 $250
Rocky Mountain $395 $184 $211
West Coast $403 $260 $143
NATIONAL AVERAGE
$390 $198 $192
TABLE 16b
BIODIESEL (B20) AND DIESEL AVERAGE RETAIL PRICES BY REGION (DGE)
Region B20 Prices ($DGE)
Diesel Prices ($gal)
Price Difference
New England $254 $250 $004
Central Atlantic $238 $227 $011
Lower Atlantic $233 $219 $014
Midwest $235 $205 $030
Gulf Coast $214 $201 $013
Rocky Mountain $225 $205 $020
West Coast $279 $255 $024
NATIONAL AVERAGE
$246 $223 $023
TABLE 16c
Negative numbers represent average E85 prices that are lower than gasoline on a $GGE basis Negative numbers represent average propane prices that are lower than gasoline on a $GGE basis
Negative numbers represent average B20 prices that are lower than gasoline on a $DGE basis
BIODIESEL (B99B100) AND DIESEL AVERAGE RETAIL PRICES BY REGION (DGE)
Region B99B100 Prices ($DGE)
Diesel Prices ($gal)
Price Difference
New England $258 $250 $009
Central Atlantic $473 $227 $246
Lower Atlantic $343 $219 $124
Midwest --- $205 ---
Gulf Coast $251 $201 $050
Rocky Mountain $264 $205 $059
West Coast $373 $255 $118
NATIONAL AVERAGE
$353 $223 $130
TABLE 16d
Negative numbers represent average B99B100 prices that are lower than gasoline on a $DGE basis
Comparison of Prices on an Energy-Equivalent BasisThe following tables compare prices for E85 propane B20 and B99B100 to conventional fuels (gasoline and diesel) on an energy-equivalent basis (Natural gas is generally sold in gasoline gallon equivalents or diesel gallon equivalents so the natural gas ldquoprice at the pumprdquo can be directly compared to the price of the corresponding conventional fuel as shown in Tables 5 and 6)
25
CLEAN CITIES ALTERNATIVE FUEL PRICE REPORT JANUARY 2016
AcknowledgementsThe authors would like to acknowledge all of the contributors from the Clean Cities community who have provided prices for this report we sincerely appreciate your continued dedication to the success of this report The authors would also like to acknowledge the continued support of DOE for developing this report
Would You Like To ParticipateIf you would like to provide prices for alternative fuels in your region and be part of the data collection effort for this report or if you have any questions please contact
US DOE Clean CitiesEE-3V1000 Independence Avenue SWWashington DC 20585Phone (202) 586-6459afprnwttechcom
DISCLAIMERThis document highlights work sponsored by agencies of the US Government Neither the US Government nor any agency thereof nor any of their employees makes any warranty express or implied or assumes any legal liability or responsibility for the accuracy completeness or usefulness of any information apparatus product or process disclosed or represents that its use would not infringe privately owned rights Reference herein to any specific commercial product process or ser-vice by trade name trademark manufacturer or otherwise does not necessarily constitute or imply its endorsement recommendation or favoring by the US Govern-ment or any agency thereof The views and opinions of authors expressed herein do not necessarily state or reflect those of the US Government or any agency thereof
For more information on this and other Clean Cities publications visit wwwcleancitiesenergygov or contact the Clean Cities Technical Response Service at 800-254-6735

CLEAN CITIES ALTERNATIVE FUEL PRICE REPORT JANUARY 2016
12
Propane (LPG)
Propane prices in this report are from both private fleet refueling stations and public refueling sites that can provide propane for vehicles and for other uses8
Note The Alternative Fuel Price Report is a snapshot in time of retail fuel prices Alternative fuel fleets can obtain significantly lower fuel prices than those reported in the AFPR by entering into contracts directly with local fuel suppliers Contract prices will vary depending on fleet size and amount of fuel to be purchased distance from the supplier region of the country and other factors
PROPANE (LPG) AND GASOLINE AVERAGE RETAIL PRICES BY REGION
Region LPG Prices ($gal)
Gasoline Prices ($gal)
PriceDifference
New England $289 $212 $077
Central Atlantic $279 $201 $078
Lower Atlantic $285 $193 $092
Midwest $245 $183 $062
Gulf Coast $304 $166 $138
Rocky Mountain $288 $184 $104
West Coast $294 $260 $034
NATIONAL AVERAGE $285 $198 $087
The prices shown in Table 8 were submitted by Clean Cities coordinators fuel providers and other stakeholders on a voluntary basis between January 1 and January 15 2016
On average during this reporting period propane cost about $087 more than gasoline on a per (liquid) gallon basis
8 Because many propane retailers provide fuel for non-vehicle uses (camping stoves gas grills etc) the National Renewable Energy Laboratory (NREL) has worked with suppliers to clarify the differences On the AFDC Station Locator website (httpwwwafdcenergygovlocatorstations) each public propane station is designated as a ldquoprimaryrdquo or ldquosecondaryrdquo service type Both types are able to fuel vehicles however stations designated as ldquoprimaryrdquo have indicated they have facilities and billing procedures specifically designed for vehicle customers They may also offer special vehicle pricing and most accept major credit cards similar to traditional gasolinediesel retailers Propane pricing reported in this guide reflects a sampling of both primary and secondary stations
In this map negative numbers represent prices for propane that are
lower than gasoline on a per gallon basis States not highlighted with a
color did not have any propane data points in the current report
FIGURE 8 PRICE DIFFERENTIALS BY STATE FOR PROPANE (LPG) RELATIVE TO GASOLINE
LPG Price DifferenceRelative to Gasoline
Negative numbers represent average propane prices that are lower than gasoline on a $gal basis
TABLE 8
13
CLEAN CITIES ALTERNATIVE FUEL PRICE REPORT JANUARY 2016
2010 2012 20142009 2011 lsquo162013 2015lsquo07 2008O J A J O J A J O J A J O J A J O J A J O J A J O J A J O OJ A J J
PropaneGasoline
Propane (LPG) cont
FIGURE 9 HISTORICAL PROPANE (LPG) PRICES VERSUS GASOLINE
LPG
CLEAN CITIES ALTERNATIVE FUEL PRICE REPORT JANUARY 2016
14
Biodiesel Blends B20
B20 is a blend of 20 biodiesel and 80 conventional diesel B20 contains only about 2 less energy (BTUs) per volume than 100 diesel The appendix at the end of this report provides conversion factors for calculating B20 prices on a GGE and DGE basis
BIODIESEL (B20) AND DIESEL AVERAGE RETAIL PRICES BY REGION
Region B20 Prices ($gal)
Diesel Prices ($gal)
PriceDifference
New England $249 $250 -$001
Central Atlantic $233 $227 $006
Lower Atlantic $228 $219 $009
Midwest $230 $205 $025
Gulf Coast $210 $201 $009
Rocky Mountain $221 $205 $016
West Coast $274 $255 $019
NATIONAL AVERAGE $241 $223 $018
The prices shown in Table 9 were submitted by Clean Cities coordinators fuel providers and other stakeholders on a voluntary basis between January 1 and January 15 2016
On a national average basis during this reporting period B20 cost about $018 more than diesel on a per gallon basis
In this map negative numbers represent prices for B20 that are lower than diesel on a per gallon basis States not highlighted with
a color did not have any B20 data points in the current report
FIGURE 10 PRICE DIFFERENTIALS BY STATE FOR B20 RELATIVE TO DIESEL
B20 Price DifferenceRelative to Diesel
Negative numbers represent average B20 prices that are lower than diesel on a $GAL basis
Note that B20 prices in many regions track very closely with diesel prices
TABLE 9
15
CLEAN CITIES ALTERNATIVE FUEL PRICE REPORT JANUARY 2016
2010 2012 20142009 2011 lsquo162013 2015lsquo07 2008O J A J O J A J O J A J O J A J O J A J O J A J O J A J O OJ A J J
$175
$200
$225
$250
$275
$300
$325
$350
$375
$400
$425
$450
$475
B20Diesel
Biodiesel Blends B20 cont
FIGURE 11 HISTORICAL B20 PRICES VERSUS DIESEL
CLEAN CITIES ALTERNATIVE FUEL PRICE REPORT JANUARY 2016
16
Biodiesel Blends B99B100
B100 contains about 10 less energy (BTUs) per volume than 100 diesel
The appendix at the end of this report provides conversion factors for calculating B100 prices on a GGE and DGE basis
BIODIESEL (B99B100) AND DIESEL AVERAGE RETAIL PRICES BY REGION
Region B99B100 Prices ($gal)
Diesel Prices ($gal)
PriceDifference
New England 235 250 -015
Central Atlantic 430 227 203
Lower Atlantic 312 219 093
Midwest --- 205 ---
Gulf Coast 228 201 027
Rocky Mountain 240 205 035
West Coast 339 255 084
NATIONAL AVERAGE 321 223 098
The prices shown in Table 10 were submitted by Clean Cities coordinators fuel providers and other stakeholders on a voluntary basis between January 1 and January 15 2016
On average during this reporting period B99B100 cost about $098 more than diesel on a per gallon basis
In this map negative numbers represent prices for B99B100 that
are lower than diesel on a per gallon basis States not highlighted with
a color did not have any B99B100 data points in the current report
FIGURE 12 PRICE DIFFERENTIALS BY STATE FOR B99B100 RELATIVE TO DIESEL
B99B100 Price Difference
Relative to Diesel
Negative numbers represent average B99B100 prices that are lower than diesel on a $GAL basis
TABLE 10
17
CLEAN CITIES ALTERNATIVE FUEL PRICE REPORT JANUARY 2016
2010 2012 20142009 2011 lsquo162013 2015lsquo07 2008O J A J O J A J O J A J O J A J O J A J O J A J O J A J O OJ A J J$200
$225
$250
$275
$300
$325
$350
$375
$400
$425
$450
$475
$500
B99B100Diesel
Biodiesel Blends B99B100 cont
FIGURE 13 HISTORICAL B99B100 PRICES VERSUS DIESEL
CLEAN CITIES ALTERNATIVE FUEL PRICE REPORT JANUARY 2016
18
Comparison Of Prices This Report Versus Last ReportThe following tables summarize the average retail prices submitted for this report by region and compare them to prices submitted for the October 2015 Alternative Fuel Price Report It should be noted that a portion of the price changes may be attributed to differing sample sizes and locations between the two reports
GASOLINE ($ per gallon)
Region Price for October 2015
Price for January 2016 Difference in $ Difference in
New England 241 212 -029 -1203
Central Atlantic 220 201 -019 -864
Lower Atlantic 215 193 -022 -1023
Midwest 236 183 -053 -2246
Gulf Coast 197 166 -031 -1574
Rocky Mountain 235 184 -051 -2170
West Coast 276 260 -016 -580
NATIONAL AVERAGE 235 198 -037 -1574
Region Price for October 2015
Price for January 2016 Difference in $ Difference in
New England 272 250 -022 -809
Central Atlantic 273 227 -046 -1685
Lower Atlantic 248 219 -029 -1169
Midwest 247 205 -042 -1700
Gulf Coast 227 201 -026 -1145
Rocky Mountain 246 205 -041 -1667
West Coast 280 255 -025 -893
NATIONAL AVERAGE 259 223 -036 -1390
DIESEL ($ per gallon)
CNG ($ per GGE)
Region Price for October 2015
Price for January 2016 Difference in $ Difference in
New England 244 245 001 041
Central Atlantic 199 197 -002 -101
Lower Atlantic 207 206 -001 -048
Midwest 203 195 -008 -394
Gulf Coast 204 203 -001 -049
Rocky Mountain 189 191 002 106
West Coast 237 240 003 127
NATIONAL AVERAGE 209 209 000 000
CNG
TABLE 11 a
TABLE 11 b
TABLE 11 c
19
CLEAN CITIES ALTERNATIVE FUEL PRICE REPORT JANUARY 2016
Comparison Of Prices This Report Versus Last Report cont
Region Price for Oct 2015 Price for January 2016 Difference in $ Difference in
New England 278 251 -027 -971
Central Atlantic 241 212 -029 -1203
Lower Atlantic 207 192 -015 -725
Midwest 211 169 -042 -1991
Gulf Coast 192 159 -033 -1719
Rocky Mountain 220 187 -033 -1500
West Coast 262 237 -025 -954
NATIONAL AVERAGE 218 186 -032 -1468
Region Price for Oct 2015 Price for January 2016 Difference in $ Difference in
New England 284 289 005 176
Central Atlantic 268 279 011 410
Lower Atlantic 296 285 -011 -372
Midwest 270 245 -025 -926
Gulf Coast 299 304 005 167
Rocky Mountain 291 288 -003 -103
West Coast 296 294 -002 -068
NATIONAL AVERAGE 290 285 -005 -172
Region Price for Oct 2015 Price for January 2016 Difference in $ Difference in
New England 270 249 -021 -778
Central Atlantic 260 233 -027 -1038
Lower Atlantic 256 228 -028 -1094
Midwest 253 230 -023 -909
Gulf Coast 251 210 -041 -1633
Rocky Mountain 255 221 -034 -1333
West Coast 296 274 -022 -743
NATIONAL AVERAGE 266 241 -025 -940
Region Price for Oct 2015 Price for January 2016 Difference in $ Difference in
New England 262 235 -027 -1031
Central Atlantic 582 430 -152 -2612
Lower Atlantic 333 312 -021 -631
Midwest 246 --- --- ---
Gulf Coast 249 228 -021 -843
Rocky Mountain 259 240 -019 -734
West Coast 353 339 -014 -397
NATIONAL AVERAGE 340 321 -019 -559
ETHANOL (E85)
($ per gallon)
PROPANE ($ per gallon)
BIODIESELB20
($ per gallon)
LPG
BIODIESELB99B100
($ per gallon)
TABLE 11 d
TABLE 11 e
TABLE 11 f
TABLE 11 g
CLEAN CITIES ALTERNATIVE FUEL PRICE REPORT JANUARY 2016
20
Price Comparison By Region For Public amp Private Refueling StationsThe tables below summarize average retail fuel prices contained in this report sorted by type of refueling station ie ldquoprivaterdquo or ldquopublicrdquo The stations classified as ldquopublicrdquo are open to the general public The majority of the stations classified as ldquoprivaterdquo are operated by state or local government agencies transit agencies utility districts colleges or universities or military facilities They serve the host agencyrsquos fleets and may have contractual or other arrangements in place to sell fuel to other government agencies andor selected other fleets In some cases contracts may include billing accounting or fleet service management fees that are rolled into the price of the fuel
For this report there were 3101 prices submitted from ldquopublicrdquo refueling stations and 360 prices submitted from ldquoprivaterdquo refueling stations for a total of 3461 prices
As with the other prices in this report these prices include state and federal taxes as described in the Methodology section of this document
Region PRIVATE PUBLIC
New England $213 $212
Central Atlantic $199 $201
Lower Atlantic $200 $193
Midwest $221 $181
Gulf Coast --- $166
Rocky Mountain $187 $184
West Coast $263 $259
NATIONAL AVERAGE $223 $196
Region PRIVATE PUBLIC
New England $202 $250
Central Atlantic $182 $204
Lower Atlantic $075 $213
Midwest $189 $197
Gulf Coast $177 $206
Rocky Mountain $176 $201
West Coast $207 $244
NATIONAL AVERAGE $182 $216
Region PRIVATE PUBLIC
New England $253 $250
Central Atlantic $207 $238
Lower Atlantic $199 $220
Midwest $167 $206
Gulf Coast --- $201
Rocky Mountain $162 $206
West Coast $239 $256
NATIONAL AVERAGE $214 $224
Region PRIVATE PUBLIC
New England --- $251
Central Atlantic $217 $211
Lower Atlantic $231 $192
Midwest $192 $167
Gulf Coast $199 $158
Rocky Mountain $167 $188
West Coast $244 $237
NATIONAL AVERAGE $205 $185
TABLE 12 a - GasolineAverage Retail Price by Refueling Station Type ($gal)
TABLE 12 b - DieselAverage Retail Price by Refueling Station Type ($gal)
TABLE 12 c - CNGAverage Retail Price by Refueling Station Type ($GGE)
TABLE 12 d - E85Average Retail Price by Refueling Station Type ($gal)
--- indicates no data points were submitted for this region
21
CLEAN CITIES ALTERNATIVE FUEL PRICE REPORT JANUARY 2016
Region PRIVATE PUBLIC
New England $258 $290
Central Atlantic $134 $320
Lower Atlantic $382 $284
Midwest $161 $249
Gulf Coast $131 $315
Rocky Mountain $243 $289
West Coast $302 $293
NATIONAL AVERAGE $200 $291
Region PRIVATE PUBLIC
New England $214 $270
Central Atlantic $221 $270
Lower Atlantic $204 $232
Midwest $205 $232
Gulf Coast $199 $212
Rocky Mountain --- $221
West Coast $228 $293
NATIONAL AVERAGE $220 $252
Comparison Of Prices By Region For Public amp Private Refueling Stations cont
Region PRIVATE PUBLIC
New England --- $235
Central Atlantic $161 $698
Lower Atlantic $350 $289
Midwest --- ---
Gulf Coast --- $227
Rocky Mountain --- $240
West Coast $341 $339
NATIONAL AVERAGE $326 $320
TABLE 12 e - PropaneAverage Retail Price by Refueling Station Type ($gal)
TABLE 12 f - B20Average Retail Price by Refueling Station Type ($gal)
TABLE 12 g - B99B100Average Retail Price by Refueling Station Type ($gal)
--- indicates no data points were submitted for this region
CLEAN CITIES ALTERNATIVE FUEL PRICE REPORT JANUARY 2016
22
Historical Alternative Fuel Prices From Previous ReportsThe following graphs illustrate historical prices for the alternative fuels included in the Alternative Fuel Price Report from 2007 to the present relative to gasoline and diesel Compressed natural gas (in GGE) propane and ethanol (E85) have been graphed against gasoline prices while compressed natural gas (in DGE) and biodiesel blends (B20 and B99B100) have been graphed against diesel prices
2010 2012 20142009 2011 lsquo162013 2015lsquo07 2008O J A J O J A J O J A J O J A J O J A J O J A J O J A J O OJ A J J
Natural Gas (GGE)Gasoline Ethanol (E85) Propane
$150
$175
$200
$225
$250
$275
$300
$325
$350
$375
$400
Pric
e pe
r gal
lon
2010 2012 20142009 2011 lsquo162013 2015lsquo07 2008O J A J O J A J O J A J O J A J O J A J O J A J O J A J O OJ A J J
Natural Gas (DGE)Diesel Biodiesel (B20) Biodiesel (B2B5)
$175
$200
$225
$250
$275
$300
$325
$350
$375
$400
$425
$450
$475
$500
Pric
e pe
r gal
lon
B99B100
FIGURE 14 ALTERNATIVE FUEL PRICES VERSUS GASOLINE
FIGURE 15 ALTERNATIVE FUEL PRICES VERSUS DIESEL
23
CLEAN CITIES ALTERNATIVE FUEL PRICE REPORT JANUARY 2016
Illustration of Conversion Factors for Fuels
9 httpctaornlgovdata10 According to the National Renewable Energy Laboratory (NREL) Alternative Fuels Data Center the energy content of common gasoline baseline references (E0 E10 and indolene) varies between 112114 and 116090 Btugal We chose 114300 Btugal for the E10 energy content consistent with the Transportation Energy Data Book (TEDB) energy content of CNG in GGEs See next footnote11 (566 lbs of CNGGGE) x (20200 BTUlb) = 114332 rounded to 11430012 Most gasoline available throughout the United States today is a blend of 90 gasoline and up to 10 ethanol or E10 Additionally the E85 that is sold in the United States today actually contains on average approximately 70 ethanol E85 energy content for this report is therefore calculated as [(70) x (E100 energy content)] + [(30) x (E0 energy content)] to more closely reflect the actual energy content of E85 fuel available today13 See footnote 12 above
Fuel Lower Heating Value
Gasoline (E0) 115400 BTUgal
Gasoline (E10)10 114300 BTUgal
Diesel 128700 BTUgal
Biodiesel (B100) 117100 BTUgal
Compressed Natural Gas (CNG)11 114300 BTUGGE
Ethanol (E100) 75700 BTUgal
Propane 83500 BTUgal
TABLE 13 Lower Heating Values
Conversion to GGE
The conversion factor used to convert the price of an alternative fuel from $gallon to $GGE is determined as follows
Conversion factor = BTUgal of gasoline (E10) BTUgal of alternative fuel
To calculate the price of an alternative fuel in $GGE multiply the price per gallon of the alternative fuel by the relevant conversion factor from Table 14
Fuel Conversion Factor
Biodiesel (B20) 090
Biodiesel (B100) 098
CNG 100
Ethanol (E85)12 130
Propane 137
TABLE 14 Conversion Factors $gal to $GGE
Fuel Conversion Factor
Biodiesel (B20) 102
Biodiesel (B100) 110
CNG 113
Ethanol (E85) 13 147
Propane 154
TABLE 15 Conversion Factors $gal to $DGE
Conversion factors used to establish prices in dollars per gasoline gallon equivalent ($GGE) and dollars per diesel gallon equivalent ($DGE) were developed using the lower heating values from the Transportation Energy Data Book Edition 339 and are listed to the left
In the case of CNG prices are provided to us in GGE so no conversion is necessary The representative heating value of CNG is provided in Table 13 as a reference
Conversion to DGE
The conversion factor used to convert the price of an alternative fuel from $gallon to $DGE is determined as follows
Conversion factor = BTUgal of diesel BTUgal of alternative fuel
For example the conversion factor used to convert a B100 price from $gal to $DGE is determined as follows
128700 BTUgal of diesel = 1099 rounded to 110 117100 BTUgal of B100
To calculate the price of an alternative fuel in $DGE multiply the price per gallon of the alternative fuel by the relevant conversion factor from Table 15
For example if the price of B100 is given as $300gal the $DGE is determined as follows ($300gal) x 110 = $330DGE
CLEAN CITIES ALTERNATIVE FUEL PRICE REPORT JANUARY 2016
24
ETHANOL (E85) AND GASOLINE AVERAGE RETAIL PRICES BY REGION (GGE)
Region E85 Prices ($GGE)
Gasoline Prices ($gal)
Price Difference
New England $326 $212 $114
Central Atlantic $276 $201 $075
Lower Atlantic $250 $193 $057
Midwest $220 $183 $037
Gulf Coast $207 $166 $041
Rocky Mountain $243 $184 $059
West Coast $308 $260 $048
NATIONAL AVERAGE
$242 $198 $044
TABLE 16aPROPANE (LPG) AND GASOLINE AVERAGE RETAIL PRICES
BY REGION (GGE)
Region LPG Prices ($GGE)
Gasoline Prices ($gal)
Price Difference
New England $396 $212 $184
Central Atlantic $382 $201 $181
Lower Atlantic $390 $193 $197
Midwest $336 $183 $153
Gulf Coast $416 $166 $250
Rocky Mountain $395 $184 $211
West Coast $403 $260 $143
NATIONAL AVERAGE
$390 $198 $192
TABLE 16b
BIODIESEL (B20) AND DIESEL AVERAGE RETAIL PRICES BY REGION (DGE)
Region B20 Prices ($DGE)
Diesel Prices ($gal)
Price Difference
New England $254 $250 $004
Central Atlantic $238 $227 $011
Lower Atlantic $233 $219 $014
Midwest $235 $205 $030
Gulf Coast $214 $201 $013
Rocky Mountain $225 $205 $020
West Coast $279 $255 $024
NATIONAL AVERAGE
$246 $223 $023
TABLE 16c
Negative numbers represent average E85 prices that are lower than gasoline on a $GGE basis Negative numbers represent average propane prices that are lower than gasoline on a $GGE basis
Negative numbers represent average B20 prices that are lower than gasoline on a $DGE basis
BIODIESEL (B99B100) AND DIESEL AVERAGE RETAIL PRICES BY REGION (DGE)
Region B99B100 Prices ($DGE)
Diesel Prices ($gal)
Price Difference
New England $258 $250 $009
Central Atlantic $473 $227 $246
Lower Atlantic $343 $219 $124
Midwest --- $205 ---
Gulf Coast $251 $201 $050
Rocky Mountain $264 $205 $059
West Coast $373 $255 $118
NATIONAL AVERAGE
$353 $223 $130
TABLE 16d
Negative numbers represent average B99B100 prices that are lower than gasoline on a $DGE basis
Comparison of Prices on an Energy-Equivalent BasisThe following tables compare prices for E85 propane B20 and B99B100 to conventional fuels (gasoline and diesel) on an energy-equivalent basis (Natural gas is generally sold in gasoline gallon equivalents or diesel gallon equivalents so the natural gas ldquoprice at the pumprdquo can be directly compared to the price of the corresponding conventional fuel as shown in Tables 5 and 6)
25
CLEAN CITIES ALTERNATIVE FUEL PRICE REPORT JANUARY 2016
AcknowledgementsThe authors would like to acknowledge all of the contributors from the Clean Cities community who have provided prices for this report we sincerely appreciate your continued dedication to the success of this report The authors would also like to acknowledge the continued support of DOE for developing this report
Would You Like To ParticipateIf you would like to provide prices for alternative fuels in your region and be part of the data collection effort for this report or if you have any questions please contact
US DOE Clean CitiesEE-3V1000 Independence Avenue SWWashington DC 20585Phone (202) 586-6459afprnwttechcom
DISCLAIMERThis document highlights work sponsored by agencies of the US Government Neither the US Government nor any agency thereof nor any of their employees makes any warranty express or implied or assumes any legal liability or responsibility for the accuracy completeness or usefulness of any information apparatus product or process disclosed or represents that its use would not infringe privately owned rights Reference herein to any specific commercial product process or ser-vice by trade name trademark manufacturer or otherwise does not necessarily constitute or imply its endorsement recommendation or favoring by the US Govern-ment or any agency thereof The views and opinions of authors expressed herein do not necessarily state or reflect those of the US Government or any agency thereof
For more information on this and other Clean Cities publications visit wwwcleancitiesenergygov or contact the Clean Cities Technical Response Service at 800-254-6735

CLEAN CITIES ALTERNATIVE FUEL PRICE REPORT JANUARY 2016
14
Biodiesel Blends B20
B20 is a blend of 20 biodiesel and 80 conventional diesel B20 contains only about 2 less energy (BTUs) per volume than 100 diesel The appendix at the end of this report provides conversion factors for calculating B20 prices on a GGE and DGE basis
BIODIESEL (B20) AND DIESEL AVERAGE RETAIL PRICES BY REGION
Region B20 Prices ($gal)
Diesel Prices ($gal)
PriceDifference
New England $249 $250 -$001
Central Atlantic $233 $227 $006
Lower Atlantic $228 $219 $009
Midwest $230 $205 $025
Gulf Coast $210 $201 $009
Rocky Mountain $221 $205 $016
West Coast $274 $255 $019
NATIONAL AVERAGE $241 $223 $018
The prices shown in Table 9 were submitted by Clean Cities coordinators fuel providers and other stakeholders on a voluntary basis between January 1 and January 15 2016
On a national average basis during this reporting period B20 cost about $018 more than diesel on a per gallon basis
In this map negative numbers represent prices for B20 that are lower than diesel on a per gallon basis States not highlighted with
a color did not have any B20 data points in the current report
FIGURE 10 PRICE DIFFERENTIALS BY STATE FOR B20 RELATIVE TO DIESEL
B20 Price DifferenceRelative to Diesel
Negative numbers represent average B20 prices that are lower than diesel on a $GAL basis
Note that B20 prices in many regions track very closely with diesel prices
TABLE 9
15
CLEAN CITIES ALTERNATIVE FUEL PRICE REPORT JANUARY 2016
2010 2012 20142009 2011 lsquo162013 2015lsquo07 2008O J A J O J A J O J A J O J A J O J A J O J A J O J A J O OJ A J J
$175
$200
$225
$250
$275
$300
$325
$350
$375
$400
$425
$450
$475
B20Diesel
Biodiesel Blends B20 cont
FIGURE 11 HISTORICAL B20 PRICES VERSUS DIESEL
CLEAN CITIES ALTERNATIVE FUEL PRICE REPORT JANUARY 2016
16
Biodiesel Blends B99B100
B100 contains about 10 less energy (BTUs) per volume than 100 diesel
The appendix at the end of this report provides conversion factors for calculating B100 prices on a GGE and DGE basis
BIODIESEL (B99B100) AND DIESEL AVERAGE RETAIL PRICES BY REGION
Region B99B100 Prices ($gal)
Diesel Prices ($gal)
PriceDifference
New England 235 250 -015
Central Atlantic 430 227 203
Lower Atlantic 312 219 093
Midwest --- 205 ---
Gulf Coast 228 201 027
Rocky Mountain 240 205 035
West Coast 339 255 084
NATIONAL AVERAGE 321 223 098
The prices shown in Table 10 were submitted by Clean Cities coordinators fuel providers and other stakeholders on a voluntary basis between January 1 and January 15 2016
On average during this reporting period B99B100 cost about $098 more than diesel on a per gallon basis
In this map negative numbers represent prices for B99B100 that
are lower than diesel on a per gallon basis States not highlighted with
a color did not have any B99B100 data points in the current report
FIGURE 12 PRICE DIFFERENTIALS BY STATE FOR B99B100 RELATIVE TO DIESEL
B99B100 Price Difference
Relative to Diesel
Negative numbers represent average B99B100 prices that are lower than diesel on a $GAL basis
TABLE 10
17
CLEAN CITIES ALTERNATIVE FUEL PRICE REPORT JANUARY 2016
2010 2012 20142009 2011 lsquo162013 2015lsquo07 2008O J A J O J A J O J A J O J A J O J A J O J A J O J A J O OJ A J J$200
$225
$250
$275
$300
$325
$350
$375
$400
$425
$450
$475
$500
B99B100Diesel
Biodiesel Blends B99B100 cont
FIGURE 13 HISTORICAL B99B100 PRICES VERSUS DIESEL
CLEAN CITIES ALTERNATIVE FUEL PRICE REPORT JANUARY 2016
18
Comparison Of Prices This Report Versus Last ReportThe following tables summarize the average retail prices submitted for this report by region and compare them to prices submitted for the October 2015 Alternative Fuel Price Report It should be noted that a portion of the price changes may be attributed to differing sample sizes and locations between the two reports
GASOLINE ($ per gallon)
Region Price for October 2015
Price for January 2016 Difference in $ Difference in
New England 241 212 -029 -1203
Central Atlantic 220 201 -019 -864
Lower Atlantic 215 193 -022 -1023
Midwest 236 183 -053 -2246
Gulf Coast 197 166 -031 -1574
Rocky Mountain 235 184 -051 -2170
West Coast 276 260 -016 -580
NATIONAL AVERAGE 235 198 -037 -1574
Region Price for October 2015
Price for January 2016 Difference in $ Difference in
New England 272 250 -022 -809
Central Atlantic 273 227 -046 -1685
Lower Atlantic 248 219 -029 -1169
Midwest 247 205 -042 -1700
Gulf Coast 227 201 -026 -1145
Rocky Mountain 246 205 -041 -1667
West Coast 280 255 -025 -893
NATIONAL AVERAGE 259 223 -036 -1390
DIESEL ($ per gallon)
CNG ($ per GGE)
Region Price for October 2015
Price for January 2016 Difference in $ Difference in
New England 244 245 001 041
Central Atlantic 199 197 -002 -101
Lower Atlantic 207 206 -001 -048
Midwest 203 195 -008 -394
Gulf Coast 204 203 -001 -049
Rocky Mountain 189 191 002 106
West Coast 237 240 003 127
NATIONAL AVERAGE 209 209 000 000
CNG
TABLE 11 a
TABLE 11 b
TABLE 11 c
19
CLEAN CITIES ALTERNATIVE FUEL PRICE REPORT JANUARY 2016
Comparison Of Prices This Report Versus Last Report cont
Region Price for Oct 2015 Price for January 2016 Difference in $ Difference in
New England 278 251 -027 -971
Central Atlantic 241 212 -029 -1203
Lower Atlantic 207 192 -015 -725
Midwest 211 169 -042 -1991
Gulf Coast 192 159 -033 -1719
Rocky Mountain 220 187 -033 -1500
West Coast 262 237 -025 -954
NATIONAL AVERAGE 218 186 -032 -1468
Region Price for Oct 2015 Price for January 2016 Difference in $ Difference in
New England 284 289 005 176
Central Atlantic 268 279 011 410
Lower Atlantic 296 285 -011 -372
Midwest 270 245 -025 -926
Gulf Coast 299 304 005 167
Rocky Mountain 291 288 -003 -103
West Coast 296 294 -002 -068
NATIONAL AVERAGE 290 285 -005 -172
Region Price for Oct 2015 Price for January 2016 Difference in $ Difference in
New England 270 249 -021 -778
Central Atlantic 260 233 -027 -1038
Lower Atlantic 256 228 -028 -1094
Midwest 253 230 -023 -909
Gulf Coast 251 210 -041 -1633
Rocky Mountain 255 221 -034 -1333
West Coast 296 274 -022 -743
NATIONAL AVERAGE 266 241 -025 -940
Region Price for Oct 2015 Price for January 2016 Difference in $ Difference in
New England 262 235 -027 -1031
Central Atlantic 582 430 -152 -2612
Lower Atlantic 333 312 -021 -631
Midwest 246 --- --- ---
Gulf Coast 249 228 -021 -843
Rocky Mountain 259 240 -019 -734
West Coast 353 339 -014 -397
NATIONAL AVERAGE 340 321 -019 -559
ETHANOL (E85)
($ per gallon)
PROPANE ($ per gallon)
BIODIESELB20
($ per gallon)
LPG
BIODIESELB99B100
($ per gallon)
TABLE 11 d
TABLE 11 e
TABLE 11 f
TABLE 11 g
CLEAN CITIES ALTERNATIVE FUEL PRICE REPORT JANUARY 2016
20
Price Comparison By Region For Public amp Private Refueling StationsThe tables below summarize average retail fuel prices contained in this report sorted by type of refueling station ie ldquoprivaterdquo or ldquopublicrdquo The stations classified as ldquopublicrdquo are open to the general public The majority of the stations classified as ldquoprivaterdquo are operated by state or local government agencies transit agencies utility districts colleges or universities or military facilities They serve the host agencyrsquos fleets and may have contractual or other arrangements in place to sell fuel to other government agencies andor selected other fleets In some cases contracts may include billing accounting or fleet service management fees that are rolled into the price of the fuel
For this report there were 3101 prices submitted from ldquopublicrdquo refueling stations and 360 prices submitted from ldquoprivaterdquo refueling stations for a total of 3461 prices
As with the other prices in this report these prices include state and federal taxes as described in the Methodology section of this document
Region PRIVATE PUBLIC
New England $213 $212
Central Atlantic $199 $201
Lower Atlantic $200 $193
Midwest $221 $181
Gulf Coast --- $166
Rocky Mountain $187 $184
West Coast $263 $259
NATIONAL AVERAGE $223 $196
Region PRIVATE PUBLIC
New England $202 $250
Central Atlantic $182 $204
Lower Atlantic $075 $213
Midwest $189 $197
Gulf Coast $177 $206
Rocky Mountain $176 $201
West Coast $207 $244
NATIONAL AVERAGE $182 $216
Region PRIVATE PUBLIC
New England $253 $250
Central Atlantic $207 $238
Lower Atlantic $199 $220
Midwest $167 $206
Gulf Coast --- $201
Rocky Mountain $162 $206
West Coast $239 $256
NATIONAL AVERAGE $214 $224
Region PRIVATE PUBLIC
New England --- $251
Central Atlantic $217 $211
Lower Atlantic $231 $192
Midwest $192 $167
Gulf Coast $199 $158
Rocky Mountain $167 $188
West Coast $244 $237
NATIONAL AVERAGE $205 $185
TABLE 12 a - GasolineAverage Retail Price by Refueling Station Type ($gal)
TABLE 12 b - DieselAverage Retail Price by Refueling Station Type ($gal)
TABLE 12 c - CNGAverage Retail Price by Refueling Station Type ($GGE)
TABLE 12 d - E85Average Retail Price by Refueling Station Type ($gal)
--- indicates no data points were submitted for this region
21
CLEAN CITIES ALTERNATIVE FUEL PRICE REPORT JANUARY 2016
Region PRIVATE PUBLIC
New England $258 $290
Central Atlantic $134 $320
Lower Atlantic $382 $284
Midwest $161 $249
Gulf Coast $131 $315
Rocky Mountain $243 $289
West Coast $302 $293
NATIONAL AVERAGE $200 $291
Region PRIVATE PUBLIC
New England $214 $270
Central Atlantic $221 $270
Lower Atlantic $204 $232
Midwest $205 $232
Gulf Coast $199 $212
Rocky Mountain --- $221
West Coast $228 $293
NATIONAL AVERAGE $220 $252
Comparison Of Prices By Region For Public amp Private Refueling Stations cont
Region PRIVATE PUBLIC
New England --- $235
Central Atlantic $161 $698
Lower Atlantic $350 $289
Midwest --- ---
Gulf Coast --- $227
Rocky Mountain --- $240
West Coast $341 $339
NATIONAL AVERAGE $326 $320
TABLE 12 e - PropaneAverage Retail Price by Refueling Station Type ($gal)
TABLE 12 f - B20Average Retail Price by Refueling Station Type ($gal)
TABLE 12 g - B99B100Average Retail Price by Refueling Station Type ($gal)
--- indicates no data points were submitted for this region
CLEAN CITIES ALTERNATIVE FUEL PRICE REPORT JANUARY 2016
22
Historical Alternative Fuel Prices From Previous ReportsThe following graphs illustrate historical prices for the alternative fuels included in the Alternative Fuel Price Report from 2007 to the present relative to gasoline and diesel Compressed natural gas (in GGE) propane and ethanol (E85) have been graphed against gasoline prices while compressed natural gas (in DGE) and biodiesel blends (B20 and B99B100) have been graphed against diesel prices
2010 2012 20142009 2011 lsquo162013 2015lsquo07 2008O J A J O J A J O J A J O J A J O J A J O J A J O J A J O OJ A J J
Natural Gas (GGE)Gasoline Ethanol (E85) Propane
$150
$175
$200
$225
$250
$275
$300
$325
$350
$375
$400
Pric
e pe
r gal
lon
2010 2012 20142009 2011 lsquo162013 2015lsquo07 2008O J A J O J A J O J A J O J A J O J A J O J A J O J A J O OJ A J J
Natural Gas (DGE)Diesel Biodiesel (B20) Biodiesel (B2B5)
$175
$200
$225
$250
$275
$300
$325
$350
$375
$400
$425
$450
$475
$500
Pric
e pe
r gal
lon
B99B100
FIGURE 14 ALTERNATIVE FUEL PRICES VERSUS GASOLINE
FIGURE 15 ALTERNATIVE FUEL PRICES VERSUS DIESEL
23
CLEAN CITIES ALTERNATIVE FUEL PRICE REPORT JANUARY 2016
Illustration of Conversion Factors for Fuels
9 httpctaornlgovdata10 According to the National Renewable Energy Laboratory (NREL) Alternative Fuels Data Center the energy content of common gasoline baseline references (E0 E10 and indolene) varies between 112114 and 116090 Btugal We chose 114300 Btugal for the E10 energy content consistent with the Transportation Energy Data Book (TEDB) energy content of CNG in GGEs See next footnote11 (566 lbs of CNGGGE) x (20200 BTUlb) = 114332 rounded to 11430012 Most gasoline available throughout the United States today is a blend of 90 gasoline and up to 10 ethanol or E10 Additionally the E85 that is sold in the United States today actually contains on average approximately 70 ethanol E85 energy content for this report is therefore calculated as [(70) x (E100 energy content)] + [(30) x (E0 energy content)] to more closely reflect the actual energy content of E85 fuel available today13 See footnote 12 above
Fuel Lower Heating Value
Gasoline (E0) 115400 BTUgal
Gasoline (E10)10 114300 BTUgal
Diesel 128700 BTUgal
Biodiesel (B100) 117100 BTUgal
Compressed Natural Gas (CNG)11 114300 BTUGGE
Ethanol (E100) 75700 BTUgal
Propane 83500 BTUgal
TABLE 13 Lower Heating Values
Conversion to GGE
The conversion factor used to convert the price of an alternative fuel from $gallon to $GGE is determined as follows
Conversion factor = BTUgal of gasoline (E10) BTUgal of alternative fuel
To calculate the price of an alternative fuel in $GGE multiply the price per gallon of the alternative fuel by the relevant conversion factor from Table 14
Fuel Conversion Factor
Biodiesel (B20) 090
Biodiesel (B100) 098
CNG 100
Ethanol (E85)12 130
Propane 137
TABLE 14 Conversion Factors $gal to $GGE
Fuel Conversion Factor
Biodiesel (B20) 102
Biodiesel (B100) 110
CNG 113
Ethanol (E85) 13 147
Propane 154
TABLE 15 Conversion Factors $gal to $DGE
Conversion factors used to establish prices in dollars per gasoline gallon equivalent ($GGE) and dollars per diesel gallon equivalent ($DGE) were developed using the lower heating values from the Transportation Energy Data Book Edition 339 and are listed to the left
In the case of CNG prices are provided to us in GGE so no conversion is necessary The representative heating value of CNG is provided in Table 13 as a reference
Conversion to DGE
The conversion factor used to convert the price of an alternative fuel from $gallon to $DGE is determined as follows
Conversion factor = BTUgal of diesel BTUgal of alternative fuel
For example the conversion factor used to convert a B100 price from $gal to $DGE is determined as follows
128700 BTUgal of diesel = 1099 rounded to 110 117100 BTUgal of B100
To calculate the price of an alternative fuel in $DGE multiply the price per gallon of the alternative fuel by the relevant conversion factor from Table 15
For example if the price of B100 is given as $300gal the $DGE is determined as follows ($300gal) x 110 = $330DGE
CLEAN CITIES ALTERNATIVE FUEL PRICE REPORT JANUARY 2016
24
ETHANOL (E85) AND GASOLINE AVERAGE RETAIL PRICES BY REGION (GGE)
Region E85 Prices ($GGE)
Gasoline Prices ($gal)
Price Difference
New England $326 $212 $114
Central Atlantic $276 $201 $075
Lower Atlantic $250 $193 $057
Midwest $220 $183 $037
Gulf Coast $207 $166 $041
Rocky Mountain $243 $184 $059
West Coast $308 $260 $048
NATIONAL AVERAGE
$242 $198 $044
TABLE 16aPROPANE (LPG) AND GASOLINE AVERAGE RETAIL PRICES
BY REGION (GGE)
Region LPG Prices ($GGE)
Gasoline Prices ($gal)
Price Difference
New England $396 $212 $184
Central Atlantic $382 $201 $181
Lower Atlantic $390 $193 $197
Midwest $336 $183 $153
Gulf Coast $416 $166 $250
Rocky Mountain $395 $184 $211
West Coast $403 $260 $143
NATIONAL AVERAGE
$390 $198 $192
TABLE 16b
BIODIESEL (B20) AND DIESEL AVERAGE RETAIL PRICES BY REGION (DGE)
Region B20 Prices ($DGE)
Diesel Prices ($gal)
Price Difference
New England $254 $250 $004
Central Atlantic $238 $227 $011
Lower Atlantic $233 $219 $014
Midwest $235 $205 $030
Gulf Coast $214 $201 $013
Rocky Mountain $225 $205 $020
West Coast $279 $255 $024
NATIONAL AVERAGE
$246 $223 $023
TABLE 16c
Negative numbers represent average E85 prices that are lower than gasoline on a $GGE basis Negative numbers represent average propane prices that are lower than gasoline on a $GGE basis
Negative numbers represent average B20 prices that are lower than gasoline on a $DGE basis
BIODIESEL (B99B100) AND DIESEL AVERAGE RETAIL PRICES BY REGION (DGE)
Region B99B100 Prices ($DGE)
Diesel Prices ($gal)
Price Difference
New England $258 $250 $009
Central Atlantic $473 $227 $246
Lower Atlantic $343 $219 $124
Midwest --- $205 ---
Gulf Coast $251 $201 $050
Rocky Mountain $264 $205 $059
West Coast $373 $255 $118
NATIONAL AVERAGE
$353 $223 $130
TABLE 16d
Negative numbers represent average B99B100 prices that are lower than gasoline on a $DGE basis
Comparison of Prices on an Energy-Equivalent BasisThe following tables compare prices for E85 propane B20 and B99B100 to conventional fuels (gasoline and diesel) on an energy-equivalent basis (Natural gas is generally sold in gasoline gallon equivalents or diesel gallon equivalents so the natural gas ldquoprice at the pumprdquo can be directly compared to the price of the corresponding conventional fuel as shown in Tables 5 and 6)
25
CLEAN CITIES ALTERNATIVE FUEL PRICE REPORT JANUARY 2016
AcknowledgementsThe authors would like to acknowledge all of the contributors from the Clean Cities community who have provided prices for this report we sincerely appreciate your continued dedication to the success of this report The authors would also like to acknowledge the continued support of DOE for developing this report
Would You Like To ParticipateIf you would like to provide prices for alternative fuels in your region and be part of the data collection effort for this report or if you have any questions please contact
US DOE Clean CitiesEE-3V1000 Independence Avenue SWWashington DC 20585Phone (202) 586-6459afprnwttechcom
DISCLAIMERThis document highlights work sponsored by agencies of the US Government Neither the US Government nor any agency thereof nor any of their employees makes any warranty express or implied or assumes any legal liability or responsibility for the accuracy completeness or usefulness of any information apparatus product or process disclosed or represents that its use would not infringe privately owned rights Reference herein to any specific commercial product process or ser-vice by trade name trademark manufacturer or otherwise does not necessarily constitute or imply its endorsement recommendation or favoring by the US Govern-ment or any agency thereof The views and opinions of authors expressed herein do not necessarily state or reflect those of the US Government or any agency thereof
For more information on this and other Clean Cities publications visit wwwcleancitiesenergygov or contact the Clean Cities Technical Response Service at 800-254-6735
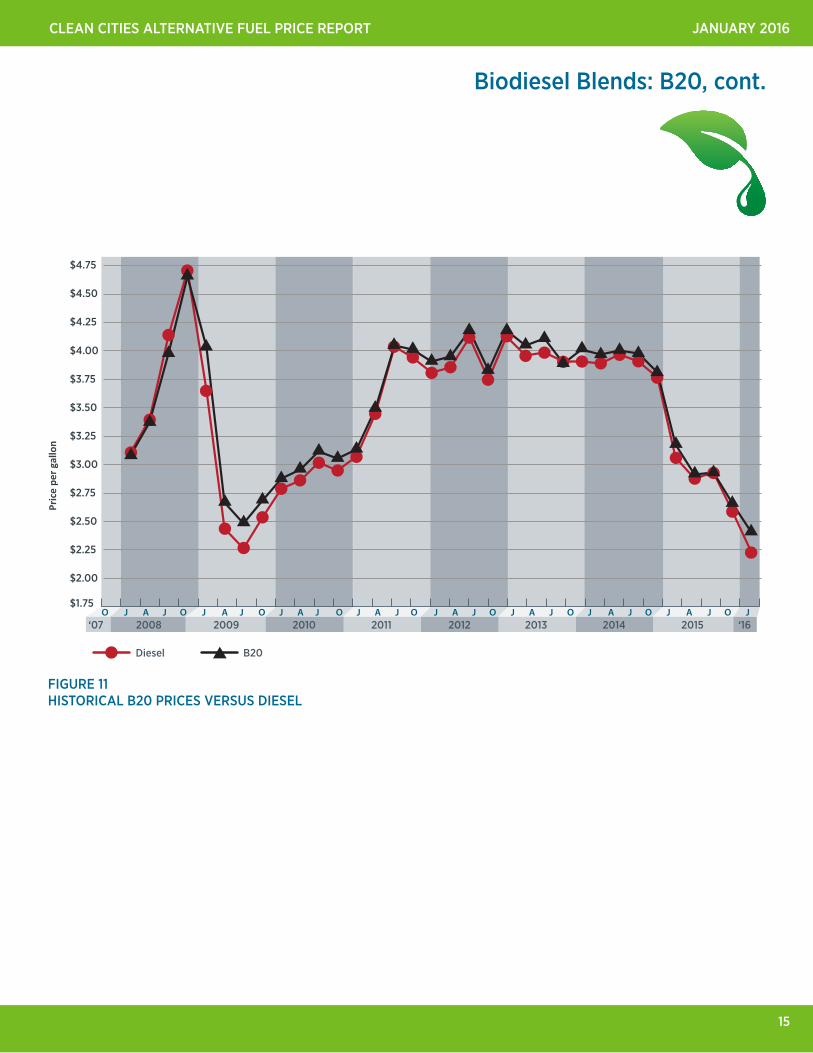

CLEAN CITIES ALTERNATIVE FUEL PRICE REPORT JANUARY 2016
16
Biodiesel Blends B99B100
B100 contains about 10 less energy (BTUs) per volume than 100 diesel
The appendix at the end of this report provides conversion factors for calculating B100 prices on a GGE and DGE basis
BIODIESEL (B99B100) AND DIESEL AVERAGE RETAIL PRICES BY REGION
Region B99B100 Prices ($gal)
Diesel Prices ($gal)
PriceDifference
New England 235 250 -015
Central Atlantic 430 227 203
Lower Atlantic 312 219 093
Midwest --- 205 ---
Gulf Coast 228 201 027
Rocky Mountain 240 205 035
West Coast 339 255 084
NATIONAL AVERAGE 321 223 098
The prices shown in Table 10 were submitted by Clean Cities coordinators fuel providers and other stakeholders on a voluntary basis between January 1 and January 15 2016
On average during this reporting period B99B100 cost about $098 more than diesel on a per gallon basis
In this map negative numbers represent prices for B99B100 that
are lower than diesel on a per gallon basis States not highlighted with
a color did not have any B99B100 data points in the current report
FIGURE 12 PRICE DIFFERENTIALS BY STATE FOR B99B100 RELATIVE TO DIESEL
B99B100 Price Difference
Relative to Diesel
Negative numbers represent average B99B100 prices that are lower than diesel on a $GAL basis
TABLE 10
17
CLEAN CITIES ALTERNATIVE FUEL PRICE REPORT JANUARY 2016
2010 2012 20142009 2011 lsquo162013 2015lsquo07 2008O J A J O J A J O J A J O J A J O J A J O J A J O J A J O OJ A J J$200
$225
$250
$275
$300
$325
$350
$375
$400
$425
$450
$475
$500
B99B100Diesel
Biodiesel Blends B99B100 cont
FIGURE 13 HISTORICAL B99B100 PRICES VERSUS DIESEL
CLEAN CITIES ALTERNATIVE FUEL PRICE REPORT JANUARY 2016
18
Comparison Of Prices This Report Versus Last ReportThe following tables summarize the average retail prices submitted for this report by region and compare them to prices submitted for the October 2015 Alternative Fuel Price Report It should be noted that a portion of the price changes may be attributed to differing sample sizes and locations between the two reports
GASOLINE ($ per gallon)
Region Price for October 2015
Price for January 2016 Difference in $ Difference in
New England 241 212 -029 -1203
Central Atlantic 220 201 -019 -864
Lower Atlantic 215 193 -022 -1023
Midwest 236 183 -053 -2246
Gulf Coast 197 166 -031 -1574
Rocky Mountain 235 184 -051 -2170
West Coast 276 260 -016 -580
NATIONAL AVERAGE 235 198 -037 -1574
Region Price for October 2015
Price for January 2016 Difference in $ Difference in
New England 272 250 -022 -809
Central Atlantic 273 227 -046 -1685
Lower Atlantic 248 219 -029 -1169
Midwest 247 205 -042 -1700
Gulf Coast 227 201 -026 -1145
Rocky Mountain 246 205 -041 -1667
West Coast 280 255 -025 -893
NATIONAL AVERAGE 259 223 -036 -1390
DIESEL ($ per gallon)
CNG ($ per GGE)
Region Price for October 2015
Price for January 2016 Difference in $ Difference in
New England 244 245 001 041
Central Atlantic 199 197 -002 -101
Lower Atlantic 207 206 -001 -048
Midwest 203 195 -008 -394
Gulf Coast 204 203 -001 -049
Rocky Mountain 189 191 002 106
West Coast 237 240 003 127
NATIONAL AVERAGE 209 209 000 000
CNG
TABLE 11 a
TABLE 11 b
TABLE 11 c
19
CLEAN CITIES ALTERNATIVE FUEL PRICE REPORT JANUARY 2016
Comparison Of Prices This Report Versus Last Report cont
Region Price for Oct 2015 Price for January 2016 Difference in $ Difference in
New England 278 251 -027 -971
Central Atlantic 241 212 -029 -1203
Lower Atlantic 207 192 -015 -725
Midwest 211 169 -042 -1991
Gulf Coast 192 159 -033 -1719
Rocky Mountain 220 187 -033 -1500
West Coast 262 237 -025 -954
NATIONAL AVERAGE 218 186 -032 -1468
Region Price for Oct 2015 Price for January 2016 Difference in $ Difference in
New England 284 289 005 176
Central Atlantic 268 279 011 410
Lower Atlantic 296 285 -011 -372
Midwest 270 245 -025 -926
Gulf Coast 299 304 005 167
Rocky Mountain 291 288 -003 -103
West Coast 296 294 -002 -068
NATIONAL AVERAGE 290 285 -005 -172
Region Price for Oct 2015 Price for January 2016 Difference in $ Difference in
New England 270 249 -021 -778
Central Atlantic 260 233 -027 -1038
Lower Atlantic 256 228 -028 -1094
Midwest 253 230 -023 -909
Gulf Coast 251 210 -041 -1633
Rocky Mountain 255 221 -034 -1333
West Coast 296 274 -022 -743
NATIONAL AVERAGE 266 241 -025 -940
Region Price for Oct 2015 Price for January 2016 Difference in $ Difference in
New England 262 235 -027 -1031
Central Atlantic 582 430 -152 -2612
Lower Atlantic 333 312 -021 -631
Midwest 246 --- --- ---
Gulf Coast 249 228 -021 -843
Rocky Mountain 259 240 -019 -734
West Coast 353 339 -014 -397
NATIONAL AVERAGE 340 321 -019 -559
ETHANOL (E85)
($ per gallon)
PROPANE ($ per gallon)
BIODIESELB20
($ per gallon)
LPG
BIODIESELB99B100
($ per gallon)
TABLE 11 d
TABLE 11 e
TABLE 11 f
TABLE 11 g
CLEAN CITIES ALTERNATIVE FUEL PRICE REPORT JANUARY 2016
20
Price Comparison By Region For Public amp Private Refueling StationsThe tables below summarize average retail fuel prices contained in this report sorted by type of refueling station ie ldquoprivaterdquo or ldquopublicrdquo The stations classified as ldquopublicrdquo are open to the general public The majority of the stations classified as ldquoprivaterdquo are operated by state or local government agencies transit agencies utility districts colleges or universities or military facilities They serve the host agencyrsquos fleets and may have contractual or other arrangements in place to sell fuel to other government agencies andor selected other fleets In some cases contracts may include billing accounting or fleet service management fees that are rolled into the price of the fuel
For this report there were 3101 prices submitted from ldquopublicrdquo refueling stations and 360 prices submitted from ldquoprivaterdquo refueling stations for a total of 3461 prices
As with the other prices in this report these prices include state and federal taxes as described in the Methodology section of this document
Region PRIVATE PUBLIC
New England $213 $212
Central Atlantic $199 $201
Lower Atlantic $200 $193
Midwest $221 $181
Gulf Coast --- $166
Rocky Mountain $187 $184
West Coast $263 $259
NATIONAL AVERAGE $223 $196
Region PRIVATE PUBLIC
New England $202 $250
Central Atlantic $182 $204
Lower Atlantic $075 $213
Midwest $189 $197
Gulf Coast $177 $206
Rocky Mountain $176 $201
West Coast $207 $244
NATIONAL AVERAGE $182 $216
Region PRIVATE PUBLIC
New England $253 $250
Central Atlantic $207 $238
Lower Atlantic $199 $220
Midwest $167 $206
Gulf Coast --- $201
Rocky Mountain $162 $206
West Coast $239 $256
NATIONAL AVERAGE $214 $224
Region PRIVATE PUBLIC
New England --- $251
Central Atlantic $217 $211
Lower Atlantic $231 $192
Midwest $192 $167
Gulf Coast $199 $158
Rocky Mountain $167 $188
West Coast $244 $237
NATIONAL AVERAGE $205 $185
TABLE 12 a - GasolineAverage Retail Price by Refueling Station Type ($gal)
TABLE 12 b - DieselAverage Retail Price by Refueling Station Type ($gal)
TABLE 12 c - CNGAverage Retail Price by Refueling Station Type ($GGE)
TABLE 12 d - E85Average Retail Price by Refueling Station Type ($gal)
--- indicates no data points were submitted for this region
21
CLEAN CITIES ALTERNATIVE FUEL PRICE REPORT JANUARY 2016
Region PRIVATE PUBLIC
New England $258 $290
Central Atlantic $134 $320
Lower Atlantic $382 $284
Midwest $161 $249
Gulf Coast $131 $315
Rocky Mountain $243 $289
West Coast $302 $293
NATIONAL AVERAGE $200 $291
Region PRIVATE PUBLIC
New England $214 $270
Central Atlantic $221 $270
Lower Atlantic $204 $232
Midwest $205 $232
Gulf Coast $199 $212
Rocky Mountain --- $221
West Coast $228 $293
NATIONAL AVERAGE $220 $252
Comparison Of Prices By Region For Public amp Private Refueling Stations cont
Region PRIVATE PUBLIC
New England --- $235
Central Atlantic $161 $698
Lower Atlantic $350 $289
Midwest --- ---
Gulf Coast --- $227
Rocky Mountain --- $240
West Coast $341 $339
NATIONAL AVERAGE $326 $320
TABLE 12 e - PropaneAverage Retail Price by Refueling Station Type ($gal)
TABLE 12 f - B20Average Retail Price by Refueling Station Type ($gal)
TABLE 12 g - B99B100Average Retail Price by Refueling Station Type ($gal)
--- indicates no data points were submitted for this region
CLEAN CITIES ALTERNATIVE FUEL PRICE REPORT JANUARY 2016
22
Historical Alternative Fuel Prices From Previous ReportsThe following graphs illustrate historical prices for the alternative fuels included in the Alternative Fuel Price Report from 2007 to the present relative to gasoline and diesel Compressed natural gas (in GGE) propane and ethanol (E85) have been graphed against gasoline prices while compressed natural gas (in DGE) and biodiesel blends (B20 and B99B100) have been graphed against diesel prices
2010 2012 20142009 2011 lsquo162013 2015lsquo07 2008O J A J O J A J O J A J O J A J O J A J O J A J O J A J O OJ A J J
Natural Gas (GGE)Gasoline Ethanol (E85) Propane
$150
$175
$200
$225
$250
$275
$300
$325
$350
$375
$400
Pric
e pe
r gal
lon
2010 2012 20142009 2011 lsquo162013 2015lsquo07 2008O J A J O J A J O J A J O J A J O J A J O J A J O J A J O OJ A J J
Natural Gas (DGE)Diesel Biodiesel (B20) Biodiesel (B2B5)
$175
$200
$225
$250
$275
$300
$325
$350
$375
$400
$425
$450
$475
$500
Pric
e pe
r gal
lon
B99B100
FIGURE 14 ALTERNATIVE FUEL PRICES VERSUS GASOLINE
FIGURE 15 ALTERNATIVE FUEL PRICES VERSUS DIESEL
23
CLEAN CITIES ALTERNATIVE FUEL PRICE REPORT JANUARY 2016
Illustration of Conversion Factors for Fuels
9 httpctaornlgovdata10 According to the National Renewable Energy Laboratory (NREL) Alternative Fuels Data Center the energy content of common gasoline baseline references (E0 E10 and indolene) varies between 112114 and 116090 Btugal We chose 114300 Btugal for the E10 energy content consistent with the Transportation Energy Data Book (TEDB) energy content of CNG in GGEs See next footnote11 (566 lbs of CNGGGE) x (20200 BTUlb) = 114332 rounded to 11430012 Most gasoline available throughout the United States today is a blend of 90 gasoline and up to 10 ethanol or E10 Additionally the E85 that is sold in the United States today actually contains on average approximately 70 ethanol E85 energy content for this report is therefore calculated as [(70) x (E100 energy content)] + [(30) x (E0 energy content)] to more closely reflect the actual energy content of E85 fuel available today13 See footnote 12 above
Fuel Lower Heating Value
Gasoline (E0) 115400 BTUgal
Gasoline (E10)10 114300 BTUgal
Diesel 128700 BTUgal
Biodiesel (B100) 117100 BTUgal
Compressed Natural Gas (CNG)11 114300 BTUGGE
Ethanol (E100) 75700 BTUgal
Propane 83500 BTUgal
TABLE 13 Lower Heating Values
Conversion to GGE
The conversion factor used to convert the price of an alternative fuel from $gallon to $GGE is determined as follows
Conversion factor = BTUgal of gasoline (E10) BTUgal of alternative fuel
To calculate the price of an alternative fuel in $GGE multiply the price per gallon of the alternative fuel by the relevant conversion factor from Table 14
Fuel Conversion Factor
Biodiesel (B20) 090
Biodiesel (B100) 098
CNG 100
Ethanol (E85)12 130
Propane 137
TABLE 14 Conversion Factors $gal to $GGE
Fuel Conversion Factor
Biodiesel (B20) 102
Biodiesel (B100) 110
CNG 113
Ethanol (E85) 13 147
Propane 154
TABLE 15 Conversion Factors $gal to $DGE
Conversion factors used to establish prices in dollars per gasoline gallon equivalent ($GGE) and dollars per diesel gallon equivalent ($DGE) were developed using the lower heating values from the Transportation Energy Data Book Edition 339 and are listed to the left
In the case of CNG prices are provided to us in GGE so no conversion is necessary The representative heating value of CNG is provided in Table 13 as a reference
Conversion to DGE
The conversion factor used to convert the price of an alternative fuel from $gallon to $DGE is determined as follows
Conversion factor = BTUgal of diesel BTUgal of alternative fuel
For example the conversion factor used to convert a B100 price from $gal to $DGE is determined as follows
128700 BTUgal of diesel = 1099 rounded to 110 117100 BTUgal of B100
To calculate the price of an alternative fuel in $DGE multiply the price per gallon of the alternative fuel by the relevant conversion factor from Table 15
For example if the price of B100 is given as $300gal the $DGE is determined as follows ($300gal) x 110 = $330DGE
CLEAN CITIES ALTERNATIVE FUEL PRICE REPORT JANUARY 2016
24
ETHANOL (E85) AND GASOLINE AVERAGE RETAIL PRICES BY REGION (GGE)
Region E85 Prices ($GGE)
Gasoline Prices ($gal)
Price Difference
New England $326 $212 $114
Central Atlantic $276 $201 $075
Lower Atlantic $250 $193 $057
Midwest $220 $183 $037
Gulf Coast $207 $166 $041
Rocky Mountain $243 $184 $059
West Coast $308 $260 $048
NATIONAL AVERAGE
$242 $198 $044
TABLE 16aPROPANE (LPG) AND GASOLINE AVERAGE RETAIL PRICES
BY REGION (GGE)
Region LPG Prices ($GGE)
Gasoline Prices ($gal)
Price Difference
New England $396 $212 $184
Central Atlantic $382 $201 $181
Lower Atlantic $390 $193 $197
Midwest $336 $183 $153
Gulf Coast $416 $166 $250
Rocky Mountain $395 $184 $211
West Coast $403 $260 $143
NATIONAL AVERAGE
$390 $198 $192
TABLE 16b
BIODIESEL (B20) AND DIESEL AVERAGE RETAIL PRICES BY REGION (DGE)
Region B20 Prices ($DGE)
Diesel Prices ($gal)
Price Difference
New England $254 $250 $004
Central Atlantic $238 $227 $011
Lower Atlantic $233 $219 $014
Midwest $235 $205 $030
Gulf Coast $214 $201 $013
Rocky Mountain $225 $205 $020
West Coast $279 $255 $024
NATIONAL AVERAGE
$246 $223 $023
TABLE 16c
Negative numbers represent average E85 prices that are lower than gasoline on a $GGE basis Negative numbers represent average propane prices that are lower than gasoline on a $GGE basis
Negative numbers represent average B20 prices that are lower than gasoline on a $DGE basis
BIODIESEL (B99B100) AND DIESEL AVERAGE RETAIL PRICES BY REGION (DGE)
Region B99B100 Prices ($DGE)
Diesel Prices ($gal)
Price Difference
New England $258 $250 $009
Central Atlantic $473 $227 $246
Lower Atlantic $343 $219 $124
Midwest --- $205 ---
Gulf Coast $251 $201 $050
Rocky Mountain $264 $205 $059
West Coast $373 $255 $118
NATIONAL AVERAGE
$353 $223 $130
TABLE 16d
Negative numbers represent average B99B100 prices that are lower than gasoline on a $DGE basis
Comparison of Prices on an Energy-Equivalent BasisThe following tables compare prices for E85 propane B20 and B99B100 to conventional fuels (gasoline and diesel) on an energy-equivalent basis (Natural gas is generally sold in gasoline gallon equivalents or diesel gallon equivalents so the natural gas ldquoprice at the pumprdquo can be directly compared to the price of the corresponding conventional fuel as shown in Tables 5 and 6)
25
CLEAN CITIES ALTERNATIVE FUEL PRICE REPORT JANUARY 2016
AcknowledgementsThe authors would like to acknowledge all of the contributors from the Clean Cities community who have provided prices for this report we sincerely appreciate your continued dedication to the success of this report The authors would also like to acknowledge the continued support of DOE for developing this report
Would You Like To ParticipateIf you would like to provide prices for alternative fuels in your region and be part of the data collection effort for this report or if you have any questions please contact
US DOE Clean CitiesEE-3V1000 Independence Avenue SWWashington DC 20585Phone (202) 586-6459afprnwttechcom
DISCLAIMERThis document highlights work sponsored by agencies of the US Government Neither the US Government nor any agency thereof nor any of their employees makes any warranty express or implied or assumes any legal liability or responsibility for the accuracy completeness or usefulness of any information apparatus product or process disclosed or represents that its use would not infringe privately owned rights Reference herein to any specific commercial product process or ser-vice by trade name trademark manufacturer or otherwise does not necessarily constitute or imply its endorsement recommendation or favoring by the US Govern-ment or any agency thereof The views and opinions of authors expressed herein do not necessarily state or reflect those of the US Government or any agency thereof
For more information on this and other Clean Cities publications visit wwwcleancitiesenergygov or contact the Clean Cities Technical Response Service at 800-254-6735

CLEAN CITIES ALTERNATIVE FUEL PRICE REPORT JANUARY 2016
18
Comparison Of Prices This Report Versus Last ReportThe following tables summarize the average retail prices submitted for this report by region and compare them to prices submitted for the October 2015 Alternative Fuel Price Report It should be noted that a portion of the price changes may be attributed to differing sample sizes and locations between the two reports
GASOLINE ($ per gallon)
Region Price for October 2015
Price for January 2016 Difference in $ Difference in
New England 241 212 -029 -1203
Central Atlantic 220 201 -019 -864
Lower Atlantic 215 193 -022 -1023
Midwest 236 183 -053 -2246
Gulf Coast 197 166 -031 -1574
Rocky Mountain 235 184 -051 -2170
West Coast 276 260 -016 -580
NATIONAL AVERAGE 235 198 -037 -1574
Region Price for October 2015
Price for January 2016 Difference in $ Difference in
New England 272 250 -022 -809
Central Atlantic 273 227 -046 -1685
Lower Atlantic 248 219 -029 -1169
Midwest 247 205 -042 -1700
Gulf Coast 227 201 -026 -1145
Rocky Mountain 246 205 -041 -1667
West Coast 280 255 -025 -893
NATIONAL AVERAGE 259 223 -036 -1390
DIESEL ($ per gallon)
CNG ($ per GGE)
Region Price for October 2015
Price for January 2016 Difference in $ Difference in
New England 244 245 001 041
Central Atlantic 199 197 -002 -101
Lower Atlantic 207 206 -001 -048
Midwest 203 195 -008 -394
Gulf Coast 204 203 -001 -049
Rocky Mountain 189 191 002 106
West Coast 237 240 003 127
NATIONAL AVERAGE 209 209 000 000
CNG
TABLE 11 a
TABLE 11 b
TABLE 11 c
19
CLEAN CITIES ALTERNATIVE FUEL PRICE REPORT JANUARY 2016
Comparison Of Prices This Report Versus Last Report cont
Region Price for Oct 2015 Price for January 2016 Difference in $ Difference in
New England 278 251 -027 -971
Central Atlantic 241 212 -029 -1203
Lower Atlantic 207 192 -015 -725
Midwest 211 169 -042 -1991
Gulf Coast 192 159 -033 -1719
Rocky Mountain 220 187 -033 -1500
West Coast 262 237 -025 -954
NATIONAL AVERAGE 218 186 -032 -1468
Region Price for Oct 2015 Price for January 2016 Difference in $ Difference in
New England 284 289 005 176
Central Atlantic 268 279 011 410
Lower Atlantic 296 285 -011 -372
Midwest 270 245 -025 -926
Gulf Coast 299 304 005 167
Rocky Mountain 291 288 -003 -103
West Coast 296 294 -002 -068
NATIONAL AVERAGE 290 285 -005 -172
Region Price for Oct 2015 Price for January 2016 Difference in $ Difference in
New England 270 249 -021 -778
Central Atlantic 260 233 -027 -1038
Lower Atlantic 256 228 -028 -1094
Midwest 253 230 -023 -909
Gulf Coast 251 210 -041 -1633
Rocky Mountain 255 221 -034 -1333
West Coast 296 274 -022 -743
NATIONAL AVERAGE 266 241 -025 -940
Region Price for Oct 2015 Price for January 2016 Difference in $ Difference in
New England 262 235 -027 -1031
Central Atlantic 582 430 -152 -2612
Lower Atlantic 333 312 -021 -631
Midwest 246 --- --- ---
Gulf Coast 249 228 -021 -843
Rocky Mountain 259 240 -019 -734
West Coast 353 339 -014 -397
NATIONAL AVERAGE 340 321 -019 -559
ETHANOL (E85)
($ per gallon)
PROPANE ($ per gallon)
BIODIESELB20
($ per gallon)
LPG
BIODIESELB99B100
($ per gallon)
TABLE 11 d
TABLE 11 e
TABLE 11 f
TABLE 11 g
CLEAN CITIES ALTERNATIVE FUEL PRICE REPORT JANUARY 2016
20
Price Comparison By Region For Public amp Private Refueling StationsThe tables below summarize average retail fuel prices contained in this report sorted by type of refueling station ie ldquoprivaterdquo or ldquopublicrdquo The stations classified as ldquopublicrdquo are open to the general public The majority of the stations classified as ldquoprivaterdquo are operated by state or local government agencies transit agencies utility districts colleges or universities or military facilities They serve the host agencyrsquos fleets and may have contractual or other arrangements in place to sell fuel to other government agencies andor selected other fleets In some cases contracts may include billing accounting or fleet service management fees that are rolled into the price of the fuel
For this report there were 3101 prices submitted from ldquopublicrdquo refueling stations and 360 prices submitted from ldquoprivaterdquo refueling stations for a total of 3461 prices
As with the other prices in this report these prices include state and federal taxes as described in the Methodology section of this document
Region PRIVATE PUBLIC
New England $213 $212
Central Atlantic $199 $201
Lower Atlantic $200 $193
Midwest $221 $181
Gulf Coast --- $166
Rocky Mountain $187 $184
West Coast $263 $259
NATIONAL AVERAGE $223 $196
Region PRIVATE PUBLIC
New England $202 $250
Central Atlantic $182 $204
Lower Atlantic $075 $213
Midwest $189 $197
Gulf Coast $177 $206
Rocky Mountain $176 $201
West Coast $207 $244
NATIONAL AVERAGE $182 $216
Region PRIVATE PUBLIC
New England $253 $250
Central Atlantic $207 $238
Lower Atlantic $199 $220
Midwest $167 $206
Gulf Coast --- $201
Rocky Mountain $162 $206
West Coast $239 $256
NATIONAL AVERAGE $214 $224
Region PRIVATE PUBLIC
New England --- $251
Central Atlantic $217 $211
Lower Atlantic $231 $192
Midwest $192 $167
Gulf Coast $199 $158
Rocky Mountain $167 $188
West Coast $244 $237
NATIONAL AVERAGE $205 $185
TABLE 12 a - GasolineAverage Retail Price by Refueling Station Type ($gal)
TABLE 12 b - DieselAverage Retail Price by Refueling Station Type ($gal)
TABLE 12 c - CNGAverage Retail Price by Refueling Station Type ($GGE)
TABLE 12 d - E85Average Retail Price by Refueling Station Type ($gal)
--- indicates no data points were submitted for this region
21
CLEAN CITIES ALTERNATIVE FUEL PRICE REPORT JANUARY 2016
Region PRIVATE PUBLIC
New England $258 $290
Central Atlantic $134 $320
Lower Atlantic $382 $284
Midwest $161 $249
Gulf Coast $131 $315
Rocky Mountain $243 $289
West Coast $302 $293
NATIONAL AVERAGE $200 $291
Region PRIVATE PUBLIC
New England $214 $270
Central Atlantic $221 $270
Lower Atlantic $204 $232
Midwest $205 $232
Gulf Coast $199 $212
Rocky Mountain --- $221
West Coast $228 $293
NATIONAL AVERAGE $220 $252
Comparison Of Prices By Region For Public amp Private Refueling Stations cont
Region PRIVATE PUBLIC
New England --- $235
Central Atlantic $161 $698
Lower Atlantic $350 $289
Midwest --- ---
Gulf Coast --- $227
Rocky Mountain --- $240
West Coast $341 $339
NATIONAL AVERAGE $326 $320
TABLE 12 e - PropaneAverage Retail Price by Refueling Station Type ($gal)
TABLE 12 f - B20Average Retail Price by Refueling Station Type ($gal)
TABLE 12 g - B99B100Average Retail Price by Refueling Station Type ($gal)
--- indicates no data points were submitted for this region
CLEAN CITIES ALTERNATIVE FUEL PRICE REPORT JANUARY 2016
22
Historical Alternative Fuel Prices From Previous ReportsThe following graphs illustrate historical prices for the alternative fuels included in the Alternative Fuel Price Report from 2007 to the present relative to gasoline and diesel Compressed natural gas (in GGE) propane and ethanol (E85) have been graphed against gasoline prices while compressed natural gas (in DGE) and biodiesel blends (B20 and B99B100) have been graphed against diesel prices
2010 2012 20142009 2011 lsquo162013 2015lsquo07 2008O J A J O J A J O J A J O J A J O J A J O J A J O J A J O OJ A J J
Natural Gas (GGE)Gasoline Ethanol (E85) Propane
$150
$175
$200
$225
$250
$275
$300
$325
$350
$375
$400
Pric
e pe
r gal
lon
2010 2012 20142009 2011 lsquo162013 2015lsquo07 2008O J A J O J A J O J A J O J A J O J A J O J A J O J A J O OJ A J J
Natural Gas (DGE)Diesel Biodiesel (B20) Biodiesel (B2B5)
$175
$200
$225
$250
$275
$300
$325
$350
$375
$400
$425
$450
$475
$500
Pric
e pe
r gal
lon
B99B100
FIGURE 14 ALTERNATIVE FUEL PRICES VERSUS GASOLINE
FIGURE 15 ALTERNATIVE FUEL PRICES VERSUS DIESEL
23
CLEAN CITIES ALTERNATIVE FUEL PRICE REPORT JANUARY 2016
Illustration of Conversion Factors for Fuels
9 httpctaornlgovdata10 According to the National Renewable Energy Laboratory (NREL) Alternative Fuels Data Center the energy content of common gasoline baseline references (E0 E10 and indolene) varies between 112114 and 116090 Btugal We chose 114300 Btugal for the E10 energy content consistent with the Transportation Energy Data Book (TEDB) energy content of CNG in GGEs See next footnote11 (566 lbs of CNGGGE) x (20200 BTUlb) = 114332 rounded to 11430012 Most gasoline available throughout the United States today is a blend of 90 gasoline and up to 10 ethanol or E10 Additionally the E85 that is sold in the United States today actually contains on average approximately 70 ethanol E85 energy content for this report is therefore calculated as [(70) x (E100 energy content)] + [(30) x (E0 energy content)] to more closely reflect the actual energy content of E85 fuel available today13 See footnote 12 above
Fuel Lower Heating Value
Gasoline (E0) 115400 BTUgal
Gasoline (E10)10 114300 BTUgal
Diesel 128700 BTUgal
Biodiesel (B100) 117100 BTUgal
Compressed Natural Gas (CNG)11 114300 BTUGGE
Ethanol (E100) 75700 BTUgal
Propane 83500 BTUgal
TABLE 13 Lower Heating Values
Conversion to GGE
The conversion factor used to convert the price of an alternative fuel from $gallon to $GGE is determined as follows
Conversion factor = BTUgal of gasoline (E10) BTUgal of alternative fuel
To calculate the price of an alternative fuel in $GGE multiply the price per gallon of the alternative fuel by the relevant conversion factor from Table 14
Fuel Conversion Factor
Biodiesel (B20) 090
Biodiesel (B100) 098
CNG 100
Ethanol (E85)12 130
Propane 137
TABLE 14 Conversion Factors $gal to $GGE
Fuel Conversion Factor
Biodiesel (B20) 102
Biodiesel (B100) 110
CNG 113
Ethanol (E85) 13 147
Propane 154
TABLE 15 Conversion Factors $gal to $DGE
Conversion factors used to establish prices in dollars per gasoline gallon equivalent ($GGE) and dollars per diesel gallon equivalent ($DGE) were developed using the lower heating values from the Transportation Energy Data Book Edition 339 and are listed to the left
In the case of CNG prices are provided to us in GGE so no conversion is necessary The representative heating value of CNG is provided in Table 13 as a reference
Conversion to DGE
The conversion factor used to convert the price of an alternative fuel from $gallon to $DGE is determined as follows
Conversion factor = BTUgal of diesel BTUgal of alternative fuel
For example the conversion factor used to convert a B100 price from $gal to $DGE is determined as follows
128700 BTUgal of diesel = 1099 rounded to 110 117100 BTUgal of B100
To calculate the price of an alternative fuel in $DGE multiply the price per gallon of the alternative fuel by the relevant conversion factor from Table 15
For example if the price of B100 is given as $300gal the $DGE is determined as follows ($300gal) x 110 = $330DGE
CLEAN CITIES ALTERNATIVE FUEL PRICE REPORT JANUARY 2016
24
ETHANOL (E85) AND GASOLINE AVERAGE RETAIL PRICES BY REGION (GGE)
Region E85 Prices ($GGE)
Gasoline Prices ($gal)
Price Difference
New England $326 $212 $114
Central Atlantic $276 $201 $075
Lower Atlantic $250 $193 $057
Midwest $220 $183 $037
Gulf Coast $207 $166 $041
Rocky Mountain $243 $184 $059
West Coast $308 $260 $048
NATIONAL AVERAGE
$242 $198 $044
TABLE 16aPROPANE (LPG) AND GASOLINE AVERAGE RETAIL PRICES
BY REGION (GGE)
Region LPG Prices ($GGE)
Gasoline Prices ($gal)
Price Difference
New England $396 $212 $184
Central Atlantic $382 $201 $181
Lower Atlantic $390 $193 $197
Midwest $336 $183 $153
Gulf Coast $416 $166 $250
Rocky Mountain $395 $184 $211
West Coast $403 $260 $143
NATIONAL AVERAGE
$390 $198 $192
TABLE 16b
BIODIESEL (B20) AND DIESEL AVERAGE RETAIL PRICES BY REGION (DGE)
Region B20 Prices ($DGE)
Diesel Prices ($gal)
Price Difference
New England $254 $250 $004
Central Atlantic $238 $227 $011
Lower Atlantic $233 $219 $014
Midwest $235 $205 $030
Gulf Coast $214 $201 $013
Rocky Mountain $225 $205 $020
West Coast $279 $255 $024
NATIONAL AVERAGE
$246 $223 $023
TABLE 16c
Negative numbers represent average E85 prices that are lower than gasoline on a $GGE basis Negative numbers represent average propane prices that are lower than gasoline on a $GGE basis
Negative numbers represent average B20 prices that are lower than gasoline on a $DGE basis
BIODIESEL (B99B100) AND DIESEL AVERAGE RETAIL PRICES BY REGION (DGE)
Region B99B100 Prices ($DGE)
Diesel Prices ($gal)
Price Difference
New England $258 $250 $009
Central Atlantic $473 $227 $246
Lower Atlantic $343 $219 $124
Midwest --- $205 ---
Gulf Coast $251 $201 $050
Rocky Mountain $264 $205 $059
West Coast $373 $255 $118
NATIONAL AVERAGE
$353 $223 $130
TABLE 16d
Negative numbers represent average B99B100 prices that are lower than gasoline on a $DGE basis
Comparison of Prices on an Energy-Equivalent BasisThe following tables compare prices for E85 propane B20 and B99B100 to conventional fuels (gasoline and diesel) on an energy-equivalent basis (Natural gas is generally sold in gasoline gallon equivalents or diesel gallon equivalents so the natural gas ldquoprice at the pumprdquo can be directly compared to the price of the corresponding conventional fuel as shown in Tables 5 and 6)
25
CLEAN CITIES ALTERNATIVE FUEL PRICE REPORT JANUARY 2016
AcknowledgementsThe authors would like to acknowledge all of the contributors from the Clean Cities community who have provided prices for this report we sincerely appreciate your continued dedication to the success of this report The authors would also like to acknowledge the continued support of DOE for developing this report
Would You Like To ParticipateIf you would like to provide prices for alternative fuels in your region and be part of the data collection effort for this report or if you have any questions please contact
US DOE Clean CitiesEE-3V1000 Independence Avenue SWWashington DC 20585Phone (202) 586-6459afprnwttechcom
DISCLAIMERThis document highlights work sponsored by agencies of the US Government Neither the US Government nor any agency thereof nor any of their employees makes any warranty express or implied or assumes any legal liability or responsibility for the accuracy completeness or usefulness of any information apparatus product or process disclosed or represents that its use would not infringe privately owned rights Reference herein to any specific commercial product process or ser-vice by trade name trademark manufacturer or otherwise does not necessarily constitute or imply its endorsement recommendation or favoring by the US Govern-ment or any agency thereof The views and opinions of authors expressed herein do not necessarily state or reflect those of the US Government or any agency thereof
For more information on this and other Clean Cities publications visit wwwcleancitiesenergygov or contact the Clean Cities Technical Response Service at 800-254-6735
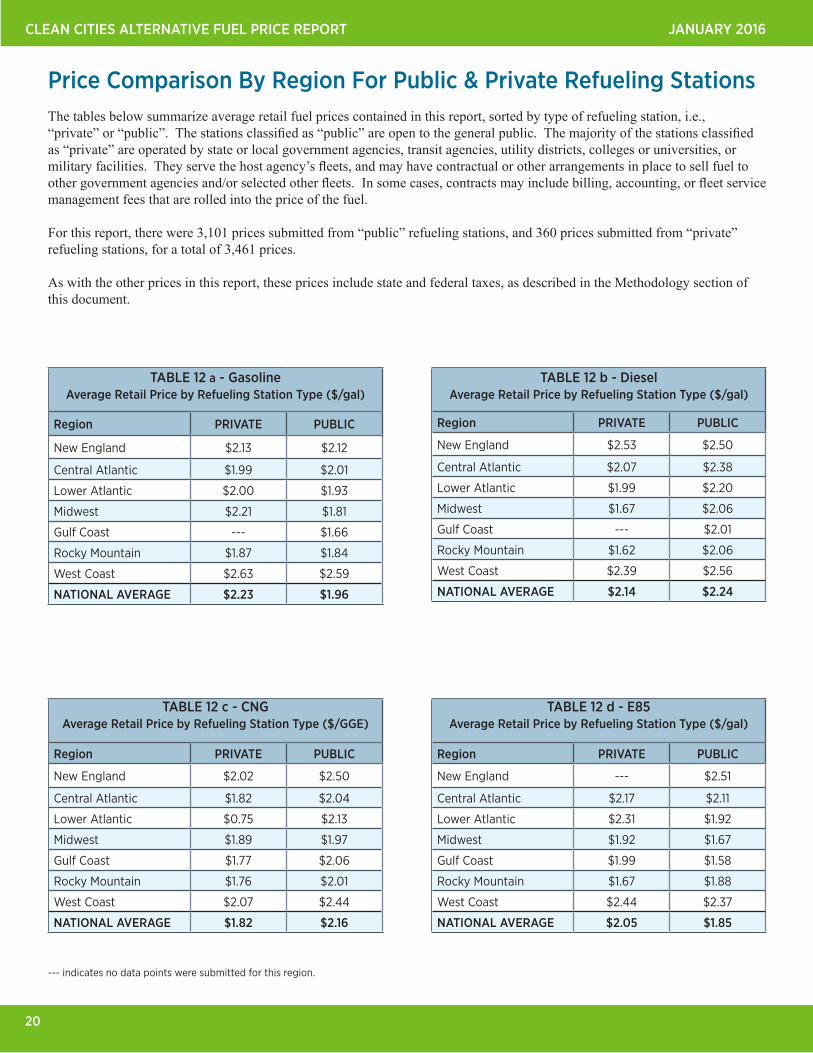
CLEAN CITIES ALTERNATIVE FUEL PRICE REPORT JANUARY 2016
20
Price Comparison By Region For Public amp Private Refueling StationsThe tables below summarize average retail fuel prices contained in this report sorted by type of refueling station ie ldquoprivaterdquo or ldquopublicrdquo The stations classified as ldquopublicrdquo are open to the general public The majority of the stations classified as ldquoprivaterdquo are operated by state or local government agencies transit agencies utility districts colleges or universities or military facilities They serve the host agencyrsquos fleets and may have contractual or other arrangements in place to sell fuel to other government agencies andor selected other fleets In some cases contracts may include billing accounting or fleet service management fees that are rolled into the price of the fuel
For this report there were 3101 prices submitted from ldquopublicrdquo refueling stations and 360 prices submitted from ldquoprivaterdquo refueling stations for a total of 3461 prices
As with the other prices in this report these prices include state and federal taxes as described in the Methodology section of this document
Region PRIVATE PUBLIC
New England $213 $212
Central Atlantic $199 $201
Lower Atlantic $200 $193
Midwest $221 $181
Gulf Coast --- $166
Rocky Mountain $187 $184
West Coast $263 $259
NATIONAL AVERAGE $223 $196
Region PRIVATE PUBLIC
New England $202 $250
Central Atlantic $182 $204
Lower Atlantic $075 $213
Midwest $189 $197
Gulf Coast $177 $206
Rocky Mountain $176 $201
West Coast $207 $244
NATIONAL AVERAGE $182 $216
Region PRIVATE PUBLIC
New England $253 $250
Central Atlantic $207 $238
Lower Atlantic $199 $220
Midwest $167 $206
Gulf Coast --- $201
Rocky Mountain $162 $206
West Coast $239 $256
NATIONAL AVERAGE $214 $224
Region PRIVATE PUBLIC
New England --- $251
Central Atlantic $217 $211
Lower Atlantic $231 $192
Midwest $192 $167
Gulf Coast $199 $158
Rocky Mountain $167 $188
West Coast $244 $237
NATIONAL AVERAGE $205 $185
TABLE 12 a - GasolineAverage Retail Price by Refueling Station Type ($gal)
TABLE 12 b - DieselAverage Retail Price by Refueling Station Type ($gal)
TABLE 12 c - CNGAverage Retail Price by Refueling Station Type ($GGE)
TABLE 12 d - E85Average Retail Price by Refueling Station Type ($gal)
--- indicates no data points were submitted for this region
21
CLEAN CITIES ALTERNATIVE FUEL PRICE REPORT JANUARY 2016
Region PRIVATE PUBLIC
New England $258 $290
Central Atlantic $134 $320
Lower Atlantic $382 $284
Midwest $161 $249
Gulf Coast $131 $315
Rocky Mountain $243 $289
West Coast $302 $293
NATIONAL AVERAGE $200 $291
Region PRIVATE PUBLIC
New England $214 $270
Central Atlantic $221 $270
Lower Atlantic $204 $232
Midwest $205 $232
Gulf Coast $199 $212
Rocky Mountain --- $221
West Coast $228 $293
NATIONAL AVERAGE $220 $252
Comparison Of Prices By Region For Public amp Private Refueling Stations cont
Region PRIVATE PUBLIC
New England --- $235
Central Atlantic $161 $698
Lower Atlantic $350 $289
Midwest --- ---
Gulf Coast --- $227
Rocky Mountain --- $240
West Coast $341 $339
NATIONAL AVERAGE $326 $320
TABLE 12 e - PropaneAverage Retail Price by Refueling Station Type ($gal)
TABLE 12 f - B20Average Retail Price by Refueling Station Type ($gal)
TABLE 12 g - B99B100Average Retail Price by Refueling Station Type ($gal)
--- indicates no data points were submitted for this region
CLEAN CITIES ALTERNATIVE FUEL PRICE REPORT JANUARY 2016
22
Historical Alternative Fuel Prices From Previous ReportsThe following graphs illustrate historical prices for the alternative fuels included in the Alternative Fuel Price Report from 2007 to the present relative to gasoline and diesel Compressed natural gas (in GGE) propane and ethanol (E85) have been graphed against gasoline prices while compressed natural gas (in DGE) and biodiesel blends (B20 and B99B100) have been graphed against diesel prices
2010 2012 20142009 2011 lsquo162013 2015lsquo07 2008O J A J O J A J O J A J O J A J O J A J O J A J O J A J O OJ A J J
Natural Gas (GGE)Gasoline Ethanol (E85) Propane
$150
$175
$200
$225
$250
$275
$300
$325
$350
$375
$400
Pric
e pe
r gal
lon
2010 2012 20142009 2011 lsquo162013 2015lsquo07 2008O J A J O J A J O J A J O J A J O J A J O J A J O J A J O OJ A J J
Natural Gas (DGE)Diesel Biodiesel (B20) Biodiesel (B2B5)
$175
$200
$225
$250
$275
$300
$325
$350
$375
$400
$425
$450
$475
$500
Pric
e pe
r gal
lon
B99B100
FIGURE 14 ALTERNATIVE FUEL PRICES VERSUS GASOLINE
FIGURE 15 ALTERNATIVE FUEL PRICES VERSUS DIESEL
23
CLEAN CITIES ALTERNATIVE FUEL PRICE REPORT JANUARY 2016
Illustration of Conversion Factors for Fuels
9 httpctaornlgovdata10 According to the National Renewable Energy Laboratory (NREL) Alternative Fuels Data Center the energy content of common gasoline baseline references (E0 E10 and indolene) varies between 112114 and 116090 Btugal We chose 114300 Btugal for the E10 energy content consistent with the Transportation Energy Data Book (TEDB) energy content of CNG in GGEs See next footnote11 (566 lbs of CNGGGE) x (20200 BTUlb) = 114332 rounded to 11430012 Most gasoline available throughout the United States today is a blend of 90 gasoline and up to 10 ethanol or E10 Additionally the E85 that is sold in the United States today actually contains on average approximately 70 ethanol E85 energy content for this report is therefore calculated as [(70) x (E100 energy content)] + [(30) x (E0 energy content)] to more closely reflect the actual energy content of E85 fuel available today13 See footnote 12 above
Fuel Lower Heating Value
Gasoline (E0) 115400 BTUgal
Gasoline (E10)10 114300 BTUgal
Diesel 128700 BTUgal
Biodiesel (B100) 117100 BTUgal
Compressed Natural Gas (CNG)11 114300 BTUGGE
Ethanol (E100) 75700 BTUgal
Propane 83500 BTUgal
TABLE 13 Lower Heating Values
Conversion to GGE
The conversion factor used to convert the price of an alternative fuel from $gallon to $GGE is determined as follows
Conversion factor = BTUgal of gasoline (E10) BTUgal of alternative fuel
To calculate the price of an alternative fuel in $GGE multiply the price per gallon of the alternative fuel by the relevant conversion factor from Table 14
Fuel Conversion Factor
Biodiesel (B20) 090
Biodiesel (B100) 098
CNG 100
Ethanol (E85)12 130
Propane 137
TABLE 14 Conversion Factors $gal to $GGE
Fuel Conversion Factor
Biodiesel (B20) 102
Biodiesel (B100) 110
CNG 113
Ethanol (E85) 13 147
Propane 154
TABLE 15 Conversion Factors $gal to $DGE
Conversion factors used to establish prices in dollars per gasoline gallon equivalent ($GGE) and dollars per diesel gallon equivalent ($DGE) were developed using the lower heating values from the Transportation Energy Data Book Edition 339 and are listed to the left
In the case of CNG prices are provided to us in GGE so no conversion is necessary The representative heating value of CNG is provided in Table 13 as a reference
Conversion to DGE
The conversion factor used to convert the price of an alternative fuel from $gallon to $DGE is determined as follows
Conversion factor = BTUgal of diesel BTUgal of alternative fuel
For example the conversion factor used to convert a B100 price from $gal to $DGE is determined as follows
128700 BTUgal of diesel = 1099 rounded to 110 117100 BTUgal of B100
To calculate the price of an alternative fuel in $DGE multiply the price per gallon of the alternative fuel by the relevant conversion factor from Table 15
For example if the price of B100 is given as $300gal the $DGE is determined as follows ($300gal) x 110 = $330DGE
CLEAN CITIES ALTERNATIVE FUEL PRICE REPORT JANUARY 2016
24
ETHANOL (E85) AND GASOLINE AVERAGE RETAIL PRICES BY REGION (GGE)
Region E85 Prices ($GGE)
Gasoline Prices ($gal)
Price Difference
New England $326 $212 $114
Central Atlantic $276 $201 $075
Lower Atlantic $250 $193 $057
Midwest $220 $183 $037
Gulf Coast $207 $166 $041
Rocky Mountain $243 $184 $059
West Coast $308 $260 $048
NATIONAL AVERAGE
$242 $198 $044
TABLE 16aPROPANE (LPG) AND GASOLINE AVERAGE RETAIL PRICES
BY REGION (GGE)
Region LPG Prices ($GGE)
Gasoline Prices ($gal)
Price Difference
New England $396 $212 $184
Central Atlantic $382 $201 $181
Lower Atlantic $390 $193 $197
Midwest $336 $183 $153
Gulf Coast $416 $166 $250
Rocky Mountain $395 $184 $211
West Coast $403 $260 $143
NATIONAL AVERAGE
$390 $198 $192
TABLE 16b
BIODIESEL (B20) AND DIESEL AVERAGE RETAIL PRICES BY REGION (DGE)
Region B20 Prices ($DGE)
Diesel Prices ($gal)
Price Difference
New England $254 $250 $004
Central Atlantic $238 $227 $011
Lower Atlantic $233 $219 $014
Midwest $235 $205 $030
Gulf Coast $214 $201 $013
Rocky Mountain $225 $205 $020
West Coast $279 $255 $024
NATIONAL AVERAGE
$246 $223 $023
TABLE 16c
Negative numbers represent average E85 prices that are lower than gasoline on a $GGE basis Negative numbers represent average propane prices that are lower than gasoline on a $GGE basis
Negative numbers represent average B20 prices that are lower than gasoline on a $DGE basis
BIODIESEL (B99B100) AND DIESEL AVERAGE RETAIL PRICES BY REGION (DGE)
Region B99B100 Prices ($DGE)
Diesel Prices ($gal)
Price Difference
New England $258 $250 $009
Central Atlantic $473 $227 $246
Lower Atlantic $343 $219 $124
Midwest --- $205 ---
Gulf Coast $251 $201 $050
Rocky Mountain $264 $205 $059
West Coast $373 $255 $118
NATIONAL AVERAGE
$353 $223 $130
TABLE 16d
Negative numbers represent average B99B100 prices that are lower than gasoline on a $DGE basis
Comparison of Prices on an Energy-Equivalent BasisThe following tables compare prices for E85 propane B20 and B99B100 to conventional fuels (gasoline and diesel) on an energy-equivalent basis (Natural gas is generally sold in gasoline gallon equivalents or diesel gallon equivalents so the natural gas ldquoprice at the pumprdquo can be directly compared to the price of the corresponding conventional fuel as shown in Tables 5 and 6)
25
CLEAN CITIES ALTERNATIVE FUEL PRICE REPORT JANUARY 2016
AcknowledgementsThe authors would like to acknowledge all of the contributors from the Clean Cities community who have provided prices for this report we sincerely appreciate your continued dedication to the success of this report The authors would also like to acknowledge the continued support of DOE for developing this report
Would You Like To ParticipateIf you would like to provide prices for alternative fuels in your region and be part of the data collection effort for this report or if you have any questions please contact
US DOE Clean CitiesEE-3V1000 Independence Avenue SWWashington DC 20585Phone (202) 586-6459afprnwttechcom
DISCLAIMERThis document highlights work sponsored by agencies of the US Government Neither the US Government nor any agency thereof nor any of their employees makes any warranty express or implied or assumes any legal liability or responsibility for the accuracy completeness or usefulness of any information apparatus product or process disclosed or represents that its use would not infringe privately owned rights Reference herein to any specific commercial product process or ser-vice by trade name trademark manufacturer or otherwise does not necessarily constitute or imply its endorsement recommendation or favoring by the US Govern-ment or any agency thereof The views and opinions of authors expressed herein do not necessarily state or reflect those of the US Government or any agency thereof
For more information on this and other Clean Cities publications visit wwwcleancitiesenergygov or contact the Clean Cities Technical Response Service at 800-254-6735
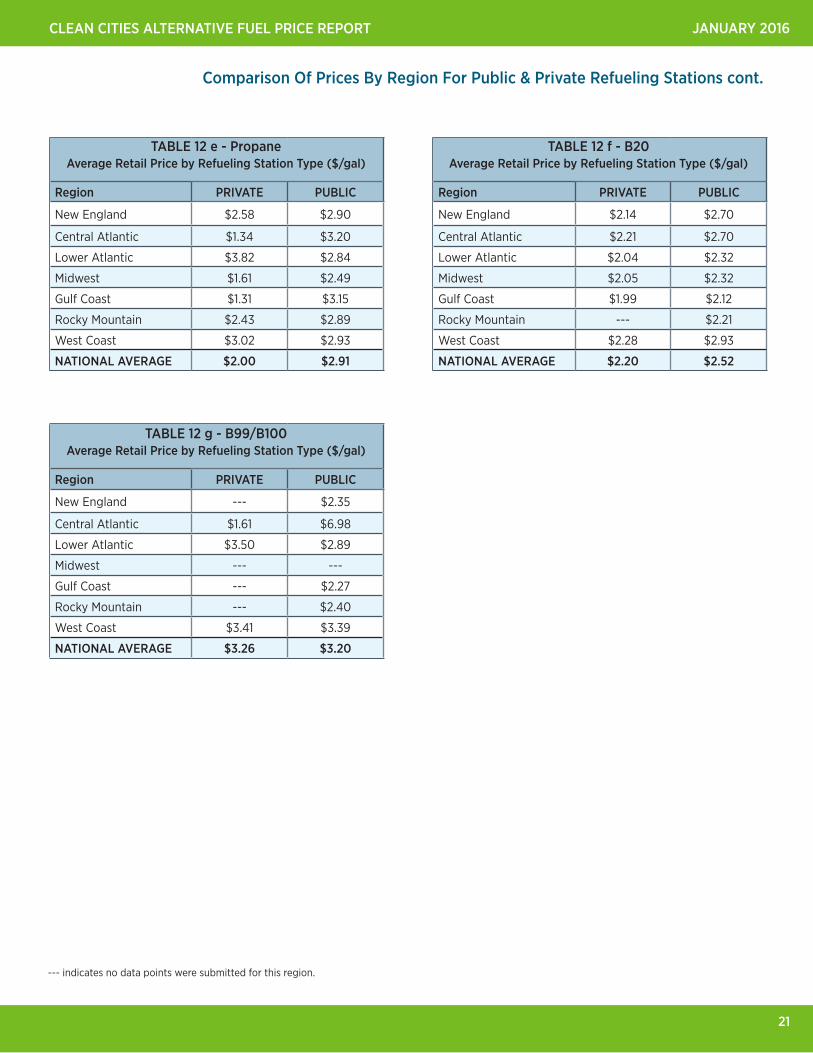
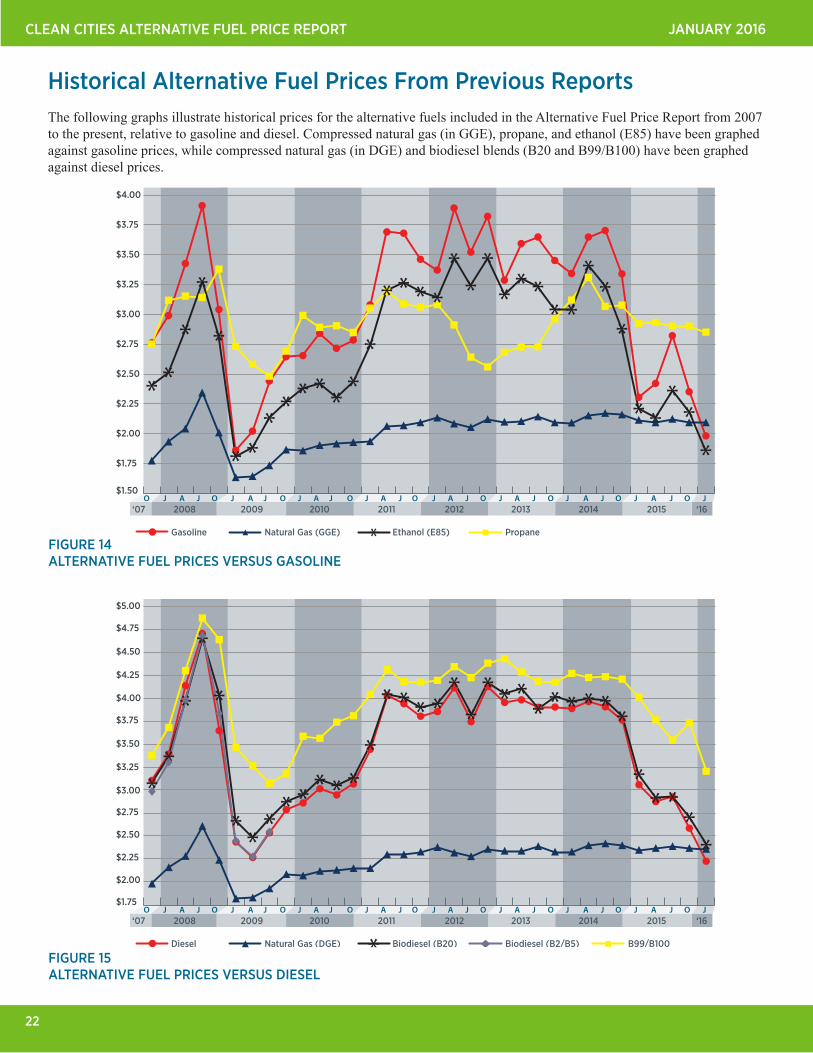
CLEAN CITIES ALTERNATIVE FUEL PRICE REPORT JANUARY 2016
22
Historical Alternative Fuel Prices From Previous ReportsThe following graphs illustrate historical prices for the alternative fuels included in the Alternative Fuel Price Report from 2007 to the present relative to gasoline and diesel Compressed natural gas (in GGE) propane and ethanol (E85) have been graphed against gasoline prices while compressed natural gas (in DGE) and biodiesel blends (B20 and B99B100) have been graphed against diesel prices
2010 2012 20142009 2011 lsquo162013 2015lsquo07 2008O J A J O J A J O J A J O J A J O J A J O J A J O J A J O OJ A J J
Natural Gas (GGE)Gasoline Ethanol (E85) Propane
$150
$175
$200
$225
$250
$275
$300
$325
$350
$375
$400
Pric
e pe
r gal
lon
2010 2012 20142009 2011 lsquo162013 2015lsquo07 2008O J A J O J A J O J A J O J A J O J A J O J A J O J A J O OJ A J J
Natural Gas (DGE)Diesel Biodiesel (B20) Biodiesel (B2B5)
$175
$200
$225
$250
$275
$300
$325
$350
$375
$400
$425
$450
$475
$500
Pric
e pe
r gal
lon
B99B100
FIGURE 14 ALTERNATIVE FUEL PRICES VERSUS GASOLINE
FIGURE 15 ALTERNATIVE FUEL PRICES VERSUS DIESEL
23
CLEAN CITIES ALTERNATIVE FUEL PRICE REPORT JANUARY 2016
Illustration of Conversion Factors for Fuels
9 httpctaornlgovdata10 According to the National Renewable Energy Laboratory (NREL) Alternative Fuels Data Center the energy content of common gasoline baseline references (E0 E10 and indolene) varies between 112114 and 116090 Btugal We chose 114300 Btugal for the E10 energy content consistent with the Transportation Energy Data Book (TEDB) energy content of CNG in GGEs See next footnote11 (566 lbs of CNGGGE) x (20200 BTUlb) = 114332 rounded to 11430012 Most gasoline available throughout the United States today is a blend of 90 gasoline and up to 10 ethanol or E10 Additionally the E85 that is sold in the United States today actually contains on average approximately 70 ethanol E85 energy content for this report is therefore calculated as [(70) x (E100 energy content)] + [(30) x (E0 energy content)] to more closely reflect the actual energy content of E85 fuel available today13 See footnote 12 above
Fuel Lower Heating Value
Gasoline (E0) 115400 BTUgal
Gasoline (E10)10 114300 BTUgal
Diesel 128700 BTUgal
Biodiesel (B100) 117100 BTUgal
Compressed Natural Gas (CNG)11 114300 BTUGGE
Ethanol (E100) 75700 BTUgal
Propane 83500 BTUgal
TABLE 13 Lower Heating Values
Conversion to GGE
The conversion factor used to convert the price of an alternative fuel from $gallon to $GGE is determined as follows
Conversion factor = BTUgal of gasoline (E10) BTUgal of alternative fuel
To calculate the price of an alternative fuel in $GGE multiply the price per gallon of the alternative fuel by the relevant conversion factor from Table 14
Fuel Conversion Factor
Biodiesel (B20) 090
Biodiesel (B100) 098
CNG 100
Ethanol (E85)12 130
Propane 137
TABLE 14 Conversion Factors $gal to $GGE
Fuel Conversion Factor
Biodiesel (B20) 102
Biodiesel (B100) 110
CNG 113
Ethanol (E85) 13 147
Propane 154
TABLE 15 Conversion Factors $gal to $DGE
Conversion factors used to establish prices in dollars per gasoline gallon equivalent ($GGE) and dollars per diesel gallon equivalent ($DGE) were developed using the lower heating values from the Transportation Energy Data Book Edition 339 and are listed to the left
In the case of CNG prices are provided to us in GGE so no conversion is necessary The representative heating value of CNG is provided in Table 13 as a reference
Conversion to DGE
The conversion factor used to convert the price of an alternative fuel from $gallon to $DGE is determined as follows
Conversion factor = BTUgal of diesel BTUgal of alternative fuel
For example the conversion factor used to convert a B100 price from $gal to $DGE is determined as follows
128700 BTUgal of diesel = 1099 rounded to 110 117100 BTUgal of B100
To calculate the price of an alternative fuel in $DGE multiply the price per gallon of the alternative fuel by the relevant conversion factor from Table 15
For example if the price of B100 is given as $300gal the $DGE is determined as follows ($300gal) x 110 = $330DGE
CLEAN CITIES ALTERNATIVE FUEL PRICE REPORT JANUARY 2016
24
ETHANOL (E85) AND GASOLINE AVERAGE RETAIL PRICES BY REGION (GGE)
Region E85 Prices ($GGE)
Gasoline Prices ($gal)
Price Difference
New England $326 $212 $114
Central Atlantic $276 $201 $075
Lower Atlantic $250 $193 $057
Midwest $220 $183 $037
Gulf Coast $207 $166 $041
Rocky Mountain $243 $184 $059
West Coast $308 $260 $048
NATIONAL AVERAGE
$242 $198 $044
TABLE 16aPROPANE (LPG) AND GASOLINE AVERAGE RETAIL PRICES
BY REGION (GGE)
Region LPG Prices ($GGE)
Gasoline Prices ($gal)
Price Difference
New England $396 $212 $184
Central Atlantic $382 $201 $181
Lower Atlantic $390 $193 $197
Midwest $336 $183 $153
Gulf Coast $416 $166 $250
Rocky Mountain $395 $184 $211
West Coast $403 $260 $143
NATIONAL AVERAGE
$390 $198 $192
TABLE 16b
BIODIESEL (B20) AND DIESEL AVERAGE RETAIL PRICES BY REGION (DGE)
Region B20 Prices ($DGE)
Diesel Prices ($gal)
Price Difference
New England $254 $250 $004
Central Atlantic $238 $227 $011
Lower Atlantic $233 $219 $014
Midwest $235 $205 $030
Gulf Coast $214 $201 $013
Rocky Mountain $225 $205 $020
West Coast $279 $255 $024
NATIONAL AVERAGE
$246 $223 $023
TABLE 16c
Negative numbers represent average E85 prices that are lower than gasoline on a $GGE basis Negative numbers represent average propane prices that are lower than gasoline on a $GGE basis
Negative numbers represent average B20 prices that are lower than gasoline on a $DGE basis
BIODIESEL (B99B100) AND DIESEL AVERAGE RETAIL PRICES BY REGION (DGE)
Region B99B100 Prices ($DGE)
Diesel Prices ($gal)
Price Difference
New England $258 $250 $009
Central Atlantic $473 $227 $246
Lower Atlantic $343 $219 $124
Midwest --- $205 ---
Gulf Coast $251 $201 $050
Rocky Mountain $264 $205 $059
West Coast $373 $255 $118
NATIONAL AVERAGE
$353 $223 $130
TABLE 16d
Negative numbers represent average B99B100 prices that are lower than gasoline on a $DGE basis
Comparison of Prices on an Energy-Equivalent BasisThe following tables compare prices for E85 propane B20 and B99B100 to conventional fuels (gasoline and diesel) on an energy-equivalent basis (Natural gas is generally sold in gasoline gallon equivalents or diesel gallon equivalents so the natural gas ldquoprice at the pumprdquo can be directly compared to the price of the corresponding conventional fuel as shown in Tables 5 and 6)
25
CLEAN CITIES ALTERNATIVE FUEL PRICE REPORT JANUARY 2016
AcknowledgementsThe authors would like to acknowledge all of the contributors from the Clean Cities community who have provided prices for this report we sincerely appreciate your continued dedication to the success of this report The authors would also like to acknowledge the continued support of DOE for developing this report
Would You Like To ParticipateIf you would like to provide prices for alternative fuels in your region and be part of the data collection effort for this report or if you have any questions please contact
US DOE Clean CitiesEE-3V1000 Independence Avenue SWWashington DC 20585Phone (202) 586-6459afprnwttechcom
DISCLAIMERThis document highlights work sponsored by agencies of the US Government Neither the US Government nor any agency thereof nor any of their employees makes any warranty express or implied or assumes any legal liability or responsibility for the accuracy completeness or usefulness of any information apparatus product or process disclosed or represents that its use would not infringe privately owned rights Reference herein to any specific commercial product process or ser-vice by trade name trademark manufacturer or otherwise does not necessarily constitute or imply its endorsement recommendation or favoring by the US Govern-ment or any agency thereof The views and opinions of authors expressed herein do not necessarily state or reflect those of the US Government or any agency thereof
For more information on this and other Clean Cities publications visit wwwcleancitiesenergygov or contact the Clean Cities Technical Response Service at 800-254-6735

CLEAN CITIES ALTERNATIVE FUEL PRICE REPORT JANUARY 2016
24
ETHANOL (E85) AND GASOLINE AVERAGE RETAIL PRICES BY REGION (GGE)
Region E85 Prices ($GGE)
Gasoline Prices ($gal)
Price Difference
New England $326 $212 $114
Central Atlantic $276 $201 $075
Lower Atlantic $250 $193 $057
Midwest $220 $183 $037
Gulf Coast $207 $166 $041
Rocky Mountain $243 $184 $059
West Coast $308 $260 $048
NATIONAL AVERAGE
$242 $198 $044
TABLE 16aPROPANE (LPG) AND GASOLINE AVERAGE RETAIL PRICES
BY REGION (GGE)
Region LPG Prices ($GGE)
Gasoline Prices ($gal)
Price Difference
New England $396 $212 $184
Central Atlantic $382 $201 $181
Lower Atlantic $390 $193 $197
Midwest $336 $183 $153
Gulf Coast $416 $166 $250
Rocky Mountain $395 $184 $211
West Coast $403 $260 $143
NATIONAL AVERAGE
$390 $198 $192
TABLE 16b
BIODIESEL (B20) AND DIESEL AVERAGE RETAIL PRICES BY REGION (DGE)
Region B20 Prices ($DGE)
Diesel Prices ($gal)
Price Difference
New England $254 $250 $004
Central Atlantic $238 $227 $011
Lower Atlantic $233 $219 $014
Midwest $235 $205 $030
Gulf Coast $214 $201 $013
Rocky Mountain $225 $205 $020
West Coast $279 $255 $024
NATIONAL AVERAGE
$246 $223 $023
TABLE 16c
Negative numbers represent average E85 prices that are lower than gasoline on a $GGE basis Negative numbers represent average propane prices that are lower than gasoline on a $GGE basis
Negative numbers represent average B20 prices that are lower than gasoline on a $DGE basis
BIODIESEL (B99B100) AND DIESEL AVERAGE RETAIL PRICES BY REGION (DGE)
Region B99B100 Prices ($DGE)
Diesel Prices ($gal)
Price Difference
New England $258 $250 $009
Central Atlantic $473 $227 $246
Lower Atlantic $343 $219 $124
Midwest --- $205 ---
Gulf Coast $251 $201 $050
Rocky Mountain $264 $205 $059
West Coast $373 $255 $118
NATIONAL AVERAGE
$353 $223 $130
TABLE 16d
Negative numbers represent average B99B100 prices that are lower than gasoline on a $DGE basis
Comparison of Prices on an Energy-Equivalent BasisThe following tables compare prices for E85 propane B20 and B99B100 to conventional fuels (gasoline and diesel) on an energy-equivalent basis (Natural gas is generally sold in gasoline gallon equivalents or diesel gallon equivalents so the natural gas ldquoprice at the pumprdquo can be directly compared to the price of the corresponding conventional fuel as shown in Tables 5 and 6)
25
CLEAN CITIES ALTERNATIVE FUEL PRICE REPORT JANUARY 2016
AcknowledgementsThe authors would like to acknowledge all of the contributors from the Clean Cities community who have provided prices for this report we sincerely appreciate your continued dedication to the success of this report The authors would also like to acknowledge the continued support of DOE for developing this report
Would You Like To ParticipateIf you would like to provide prices for alternative fuels in your region and be part of the data collection effort for this report or if you have any questions please contact
US DOE Clean CitiesEE-3V1000 Independence Avenue SWWashington DC 20585Phone (202) 586-6459afprnwttechcom
DISCLAIMERThis document highlights work sponsored by agencies of the US Government Neither the US Government nor any agency thereof nor any of their employees makes any warranty express or implied or assumes any legal liability or responsibility for the accuracy completeness or usefulness of any information apparatus product or process disclosed or represents that its use would not infringe privately owned rights Reference herein to any specific commercial product process or ser-vice by trade name trademark manufacturer or otherwise does not necessarily constitute or imply its endorsement recommendation or favoring by the US Govern-ment or any agency thereof The views and opinions of authors expressed herein do not necessarily state or reflect those of the US Government or any agency thereof
For more information on this and other Clean Cities publications visit wwwcleancitiesenergygov or contact the Clean Cities Technical Response Service at 800-254-6735