Class Attendance and University Performance - …cege/Diskussionspapiere/DP286.pdfattendance on...
26
ISSN: 1439-2305 Number 286 – July 2016 CLASS ATTENDANCE AND UNIVERSITY PERFORMANCE Anna-Lena Hoffmann Katharina Lerche
Transcript of Class Attendance and University Performance - …cege/Diskussionspapiere/DP286.pdfattendance on...

ISSN: 1439-2305
Number 286 – July 2016
CLASS ATTENDANCE AND
UNIVERSITY PERFORMANCE
Anna-Lena Hoffmann Katharina Lerche

Class Attendance and University Performance∗
Anna-Lena Hoffmann† Katharina Lerche‡
July 2016
Abstract
Using survey data collected at Gottingen University, Germany, this paper evalu-
ates the effect of attending the lecture and/or tutorial on the grade achieved in
two basic courses in business administration and economics. The analysis shows
that going to class has no significant impact on student performance in most
specifications. Although the identification of a causal effect may not be possible
with the data at hand, the results suggest that, in the given framework, attending
class and studying on one’s own may be substitutes.
Keywords: class attendance, economic education, tertiary education, university
performance
JEL classification: A22, H00, I21
∗We thank Robert Schwager for his support and advice and Madhinee Valeyatheepillay for carefullyproof-reading the text. Katharina Lerche gratefully acknowledges financial support by the GermanFederal Ministry of Education and Research under grant number 01PW11004. Responsibility for thecontent remains with the authors.
†Chair of Management, Innovation and International Business, University of Augsburg, [email protected]
‡Chair of Public Economics, Georg-August University Gottingen, [email protected]
1

1 Introduction
When it comes to the question of how to enhance students’ performance at university,
the solution seems often to be more teaching. In particular, the provision of small group
tutorials where students apply the methods taught in the lecture, solve problem sets and
ask questions is seen as a magic bullet. However, it is not clear whether students who
attend lectures or tutorials actually achieve better grades than students who abstain
from class. When students have access to the teaching material irrespective of class
attendance, or when the content of the lecture can be found in text books, going to
class and studying on one’s own may in fact be substitutes. Since this may especially
be true for lectures where students adopt a rather passive role, the gains from attending
class may also differ between types of teaching.
This paper addresses these issues by evaluating the effect of attending the lecture
and/or tutorial on the grade achieved in two basic courses in business administration
and economics. The analysis finds no significant impact of going to class on student
performance in most specifications, and thereby supports the idea that attending class
and studying on one’s own are substitutes. In the given framework, there may simply
be no difference between going to class and listening to the lecturer and studying on
one’s own or with friends.
There already exists literature on the effect of class attendance on student perfor-
mance. Thereby, many studies identify a positive relationship between going to class
and academic performance. Romer (1993) finds that absenteeism has a negative impact
on student performance using ordinary least squares regressions. Moreover, looking at
descriptive statistics, he shows that students more often attend small classes and classes
that focus on mathematical skills. Evaluating the impact on specific examinations in
principles of micro- and macroeconomics at a university in the U.S., Marburger (2001,
2006) shows that students who were absent a given day have a lower probability of an-
swering correctly to questions concerning material that was covered in this class. Beltz
et al. (2011) evaluate the implementation of tutorials at a German university and find a
positive effect on the achieved grade. Furthermore, students seem to be more satisfied
when a course not only consists of a lecture but also of accompanying tutorials.
In addition to these findings, Cohn and Johnson (2006) as well as Durden and
Ellis (1995) point out that the extent of absenteeism matters: excessive absenteeism
leads to lower student performance while missing only a few classes has no impact.
Arulampalam et al. (2012) also show that the effect of class attendance may not be
2

homogeneous. Using quantile regressions, they find that abstaining from class has a
significant negative impact on grades for higher-performing students only.
Some studies use panel data to take unobserved heterogeneity among students into
account. Martins and Walker (2006) analyze how attendance, class size, peer group and
teacher influence students’ performance in undergraduate classes at a major university
in the UK. They show that once controlling for student fixed effects, the different class
characteristics have no significant impact on the students’ grades. In particular, there
is no significant effect of class attendance on student achievement. In contrast to these
results, Stanca (2006) shows that attending either lecture or classes of an introductory
microeconomics course at Milan University has a positive impact on student learning.
Similarly, Cohn and Johnson (2006) find a positive and significant impact of class
attendance on student performance in principles of economics courses at a university
in the U.S. also when controlling for individual heterogeneity.
Dobkin et al. (2010) apply a regression discontinuity design in order to evaluate the
effect of class attendance on exam performance. To do so, they make use of a regulation
stating that students who score below the median on the midterm examination are
required to attend class in the second half of the semester. The authors find that
students who scored just below the threshold on the midterm examination, and therefore
had to attend class, have a better grade on the final examination than students who
were just above the median.
We contribute to this literature in two ways: firstly, we look at two basic courses
in business administration and economics that differ with regard to their content and
required skills. Course 1 focusses on methodological knowledge that is relevant for
different following courses at the faculty of economic sciences, while course 2 teaches
basics in business administration. Secondly, since both courses consist of a lecture as
well as tutorials (small groups), we are able to assess whether the role of class attendance
differs between these types of teaching.
Using survey data collected at Gottingen University, Germany, we find that attend-
ing a course’s lecture, tutorial or both mainly has no significant impact on students’
performance in the respective class. Only students who always go to the lecture of
course 1 achieve better grades than students who never attend class. We are aware
that identifying a causal effect of class attendance on students’ performance is not
possible with the data at hand. Nevertheless, the analysis shows that the students’
educational production functions are more complex and diverse than often believed.
Therefore, the results do not contradict the positive link between class attendance and
3

student performance found by other studies on the topic. On the one hand, studies
from different countries may not be comparable as the educational system and student
body most likely differs. For example, students in our sample are on average older than
the students in studies from the U.S. (see e.g. Cohn and Johnson, 2006; Marburger,
2006). Since more mature students may be better in learning on their own this fact can
be a reason for the different results. On the other hand, it is likely that differences in
teaching concepts play an important role. Students may simply benefit to a larger ex-
tent from attending classes with a more interactive teaching and learning environment,
such as assessed by Beltz et al. (2011). Nevertheless, the argumentation underlines
that the idea of enhancing students’ performance by simply providing more teaching or
reducing class size may be a false conclusion. Instead, the benefits from going to class
are likely to depend on a variety of factors.
The paper is structured as follows: Section 2 gives information on the institutional
background. Then, Section 3 describes the data and presents summary statistics. Sec-
tion 4 shows and interprets our empirical results. Finally, Section 5 summarizes the
main findings and concludes.
2 Institutional Background
At the faculty of economic sciences at Gottingen University, bachelor courses of the
first and second semester (first study period) have a similar structure. Besides lectures
where rather theoretical knowledge is taught, tutorials on a weekly basis are offered,
too. The aim of these tutorials is to practice and apply the subject material of the
corresponding lecture. For each lecture, there are several accompanying tutorials in
order to ensure small groups for each tutorial. The tutorials are held by students who
already passed the respective course. As attendance is not mandatory both for the
lectures and the tutorials, the students can choose themselves if and how often they
want to participate in the learning offer. Furthermore, they can choose the specific
tutorial and thus the tutor and size of the tutorial themselves.
For our analysis, we choose two courses of the first study period: course 1 focuses on
methodological knowledge that is relevant for different following courses, while course 2
deals with basics in business administration. Besides the thematic difference, a reason
for this choice also lies in the different structure of the tutorials. For course 1, the
students are supposed to prepare the given exercises themselves, either in advance or
4

during class. Although the final solution is available for all students irrespective of
class attendance, the tutorial gives the opportunity to ask the teaching assistant for
help with solving the exercises. Additionally, problem sets which are difficult to solve
for many students are presented by the tutor. In contrast, course 2 offers tutorials
where preparation is recommended, but not a precondition for attendance. In class,
the tutor presents the approach and solution to every problem set in the manner of a
lecture. Moreover, the students have the opportunity to ask questions. For both the
lecture and the tutorial of course 1 and 2, the learning material, such as syllabus, text
books and problem sets, are available for all students irrespective of class attendance.
3 Data
Data was collected using a standardized paper and pencil-based questionnaire that was
given to students of Gottingen University at the beginning of selected classes within
business administration and economics. Since these courses were more advanced, it
was expected that most students attending them had already passed the two courses
under analysis. Besides, the selected courses aim at different student groups, thereby
making it possible to address many students from different peer groups. Filling out the
two pages questionnaire took approximately ten minutes. The questionnaire contained
close-ended as well as half-open-ended questions with the possibility to give either one
or several answers.
The questions are grouped into four sequences: sequences one and two deal with
the two different courses (one sequence for each) and ask questions on e.g. the semester
the student completed the respective course in, the achieved grade and how often she
attended class. Sequence three is about individual learning behavior, in particular where
and how the students study. Sequence four contains questions on personal details such
as the grade of the high school leaving certificate and the mother’s level of education.
The questionnaire as well as further information on data processing can be found in
the appendix.
In the analysis, the following dependent and independent variables are used to
evaluate the influence of class attendance on student performance. The corresponding
summary statistics are shown in Table 1.
Dependent Variables. As a measure of student performance, we use the grade
that the student achieved in course 1 and course 2, respectively. Thereby, all grades
5

Table 1: Summary Statistics
Variable Observations Mean Std. Dev. Min Max
Grade class 1 349 2.154 1.034 0 4Lecture 1 never 349 0.092 0.289 0 1Lecture 1 rarely 349 0.324 0.469 0 1Lecture 1 frequently 349 0.324 0.469 0 1Lecture 1 always 349 0.261 0.440 0 1Lecture 1 349 0.585 0.494 0 1Tutorial 1 never 349 0.172 0.378 0 1Tutorial 1 rarely 349 0.266 0.443 0 1Tutorial 1 frequently 349 0.203 0.403 0 1Tutorial 1 always 349 0.358 0.480 0 1Tutorial 1 349 0.562 0.497 0 1Semester 1 class 1 349 0.003 0.054 0 1Semester 2 class 1 349 0.295 0.457 0 1Semester 3 class 1 349 0.415 0.494 0 1Semester 4 class 1 349 0.117 0.322 0 1Semester 5 class 1 349 0.169 0.375 0 1
Grade class 2 277 2.250 0.932 0 4Lecture 2 never 277 0.036 0.187 0 1Lecture 2 rarely 277 0.141 0.348 0 1Lecture 2 frequently 277 0.350 0.478 0 1Lecture 2 always 277 0.473 0.500 0 1Lecture 2 277 0.823 0.382 0 1Tutorial 2 never 277 0.051 0.219 0 1Tutorial 2 rarely 277 0.025 0.157 0 1Tutorial 2 frequently 277 0.199 0.400 0 1Tutorial 2 always 277 0.726 0.447 0 1Tutorial 2 277 0.924 0.265 0 1Semester 1 class 2 277 0.014 0.120 0 1Semester 2 class 2 277 0.412 0.493 0 1Semester 3 class 2 277 0.274 0.447 0 1Semester 4 class 2 277 0.159 0.366 0 1Semester 5 class 2 277 0.141 0.348 0 1
High school GPA 383 2.582 0.503 1.5 4Male 383 0.561 0.497 0 1Higher education (mother) 383 0.543 0.499 0 1Age 383 23.282 2.666 20 43
Grades transformed to 1-4 Scale, with 4 being the best grade and 1 being the worst gradethat is still considered a pass. A grade of 0 means that the student failed the respectivecourse.
6

were converted into the U.S. grading scheme with 4.0 being the best and 1.0 the worst
grade that is still considered a pass.1 A grade of 0.0 means that the student failed the
respective course. For course 1, the mean-value for a sample of 349 students is 2.154.
For course 2, the mean-value for a sample of 277 students is 2.250 and consequently
only slightly higher, meaning better, than the mean-value of the first course.
Independent Variables. In the questionnaire, the students were asked how often
they attended the lecture and tutorial of course 1 and course 2. The possible answers
were never, rarely, frequently and always. In addition to including these four categories
in our analysis, the levels of attendance were grouped by creating an indicator variable
that equals one when the student frequently or always went to class and zero otherwise.
For course 1, around 9 percent of the students in our sample state that they never,
around 32 percent they rarely, around 32 percent they frequently and around 26 percent
they always attended the lecture. This means that around 59 percent frequently or
always went to the lecture of course 1 (Lecture 1 ). The tutorial of course 1 was never
attended by around 17 percent, rarely attended by 27 percent, frequently attended by
20 percent and always attended by 36 percent of the students in our sample. Overall,
around 56 percent of the students frequently or always went to the tutorial (Tutorial
1 ). Compared to this, the attendance rates for course 2 look very different: the lecture
of course 2 was never attended by around 3 percent, rarely attended by 14 percent,
frequently attended by 35 percent and always attended by 47 percent of the students
in our sample. Overall, around 82 percent of the students frequently or always went
to the lecture of course 2 (Lecture 2 ). For the tutorial of course 2, around 5 percent
never, 2 percent rarely, 20 percent frequently and 73 always went to the tutorial. This
means that approximately 92 percent of the students in our sample frequently or always
attended the tutorial of course 2 (Tutorial 2 ).
The summary statistics show that there is a higher attendance rate both for the
lecture and the tutorial of course 2 compared to course 1. Possible explanations for
these differences concerning class attendance can be derived from the different topics
and teaching concepts. Basics of course 1 were already treated in high school, while
basic knowledge of course 2 can only be expected from students who have previous
business experience, e.g. because they did an apprenticeship before starting university.
Thus, on the one hand, students may think that course 1 is easier to study on one’s
own as part of the learning content is already known. On the other hand, it may be
1Grades are transformed into the U. S. grading scheme by subtracting the original grade from five.
7

that students with a lower high school grade have more difficulties to follow the lecture
and the tutorial of course 1 because the treated content is based on knowledge obtained
in high school. As a result, they may either feel discouraged because they do not
understand the taught material or decide to study on their own and review previous
content when needed.
Another possible explanation for the diverse attendance rates are the tutorials’
different teaching concepts. The tutorials of course 1 give the students the opportunity
to ask for help if they cannot solve the given problem sets or did not understand what
was taught in the lecture. This implies that class attendance is only helpful when the
students regularly prepare the exercises in advance or during class. If the students have
no questions as they can solve the exercises on their own, going to the tutorial is not
necessary either. This is different for course 2 where the tutor presents the approach
and the solution to every problem set during class. As a result, attending class is helpful
for all students irrespective of whether or not they prepared the exercises by themselves.
The additional control variables are listed at the bottom of Table 1. The high
school grade is used to control for general ability and motivation. In this context, the
literature has shown that the grade of the high school leaving certificate is a strong
predictor for university success in general (Cyrenne and Chan, 2012; Danilowicz-Gosele
et al., 2014; Girves and Wemmerus, 1988). Similar to the grades achieved in course 1
and 2, the high school grades are converted to the U.S. grading scheme. In our sample
the mean-value is approximately 2.6 which is higher, meaning better, than the mean of
the grades obtained in course 1 and 2, respectively. This can be explained by the fact
that a grade of 0.0, meaning failed, is not possible for the high school leaving certificate.
Administrative data on bachelor students enrolled at the faculty of economic sciences
at Gottingen university between the winter term 2005 and the winter term 2011 reveal
a mean high school GPA of 2.43. Assuming some kind of consistency of high school
grades over the years, this indicates that the students in our sample on average have a
slightly higher academic ability than the overall student body at the faculty.
We account for gender differences by using an indicator variable that equals one if the
student is male and zero otherwise. The summary statistics show that 56 percent of the
students in our sample are male. This number is slightly lower than the average share
of male students at the faculty of economic sciences, which was 61 percent for students
who enrolled between the winter term 2005 and the winter term 2011. Furthermore,
the student’s socio-economic background is controlled for by including the mother’s
highest level of academic qualification. The indicator variable equals one if the mother
8
obtained a high school leaving certificate that permits access to tertiary education or
finished university with a degree or a Ph.D., and zero otherwise. Around 54 percent
of the students’ mothers either achieved a high school leaving certificate that permits
access to tertiary education or finished university with a degree or a Ph.D. Furthermore,
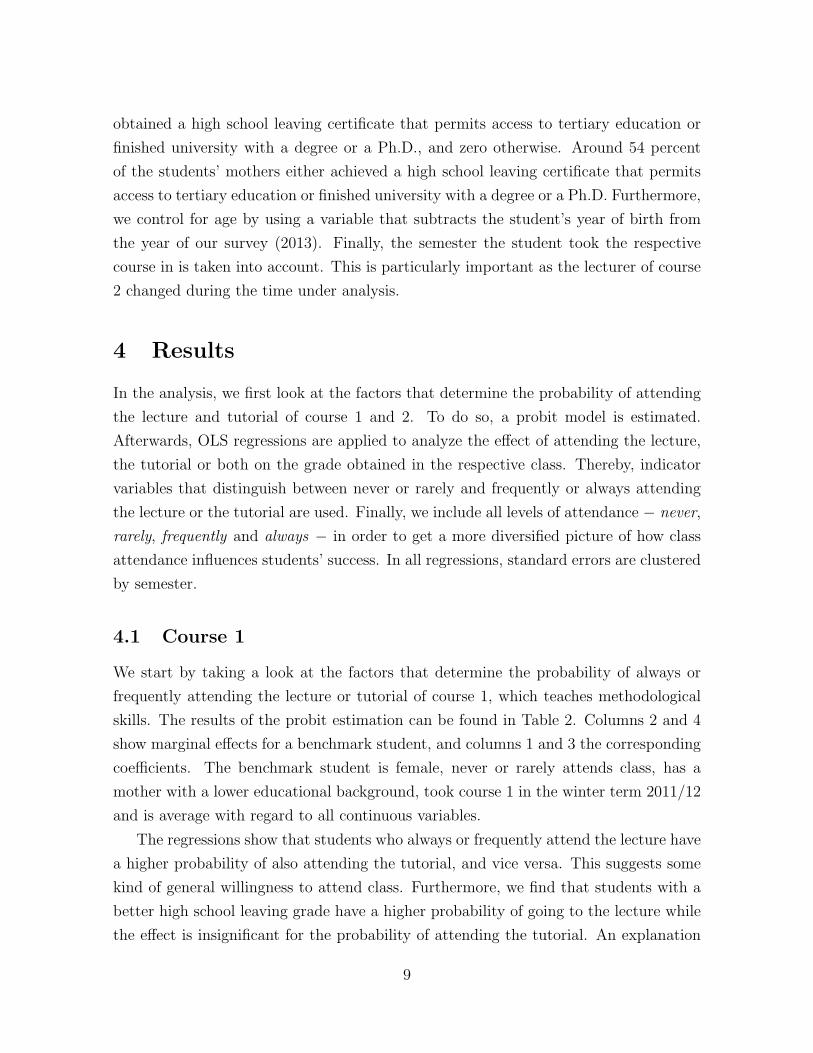
we control for age by using a variable that subtracts the student’s year of birth from
the year of our survey (2013). Finally, the semester the student took the respective
course in is taken into account. This is particularly important as the lecturer of course
2 changed during the time under analysis.
4 Results
In the analysis, we first look at the factors that determine the probability of attending
the lecture and tutorial of course 1 and 2. To do so, a probit model is estimated.
Afterwards, OLS regressions are applied to analyze the effect of attending the lecture,
the tutorial or both on the grade obtained in the respective class. Thereby, indicator
variables that distinguish between never or rarely and frequently or always attending
the lecture or the tutorial are used. Finally, we include all levels of attendance − never,
rarely, frequently and always − in order to get a more diversified picture of how class
attendance influences students’ success. In all regressions, standard errors are clustered
by semester.
4.1 Course 1
We start by taking a look at the factors that determine the probability of always or
frequently attending the lecture or tutorial of course 1, which teaches methodological
skills. The results of the probit estimation can be found in Table 2. Columns 2 and 4
show marginal effects for a benchmark student, and columns 1 and 3 the corresponding
coefficients. The benchmark student is female, never or rarely attends class, has a
mother with a lower educational background, took course 1 in the winter term 2011/12
and is average with regard to all continuous variables.
The regressions show that students who always or frequently attend the lecture have
a higher probability of also attending the tutorial, and vice versa. This suggests some
kind of general willingness to attend class. Furthermore, we find that students with a
better high school leaving grade have a higher probability of going to the lecture while
the effect is insignificant for the probability of attending the tutorial. An explanation
9

Table 2: Probability of Attending Course 1
Dependent variable Lecture 1 Tutorial 1(1) (2) (3) (4)
Lecture 1 0.732*** 0.285***(0.17) (0.06)
Tutorial 1 0.726*** 0.260***(0.18) (0.06)
High school GPA 0.542*** 0.216*** 0.143 0.052(0.14) (0.06) (0.10) (0.03)
Male 0.278* 0.109* -0.130 -0.045(0.14) (0.06) (0.08) (0.03)
Higher education (mother) -0.380*** -0.149*** -0.067 -0.024(0.11) (0.04) (0.09) (0.03)
Age 0.035 0.014 -0.017 -0.006(0.03) (0.01) (0.02) (0.01)
Constant -2.146* -0.417(0.93) (0.56)
Semester included yes yes yes yes
Pseudo R2 0.112 0.112 0.086 0.086Log Likelihood -210.4 -210.4 -218.7 -218.7Observations 349 349 349 349
Probit estimation; column (1), (3): coefficients; column (2), (4): marginal effects for benchmarkstudent (female, never or rarely attends the tutorial/lecture, mother has a lower educational back-ground, took the course in the winter term 2011/12 and is average with regard to all continuousvariables); standard errors in parentheses; clustered by semester; levels of significance for marginaleffects refer to p-values of the underlying coefficients; *p < 0.05,**p < 0.01,***p < 0.001.
10

for this may be that in the lecture of course 1, the subject matter is taught in a more
general and theoretical way. In contrast to the tutorial, the students do not apply the
explained methods themselves. Students with lower academic ability might have more
difficulties to understand what is taught, and therefore abstain from going to class.
The insignificant effect of the high school leaving grade on attending the tutorial is
more surprising. In the tutorial, the students have the opportunity to ask for help if
they do not know how to solve the provided problem sets. Therefore, one might expect
that students with lower academic ability are more likely to attend class. However, it
may be that the problem sets also contain questions that are challenging for high-ability
students. Moreover, students may see the tutorial as a fixed time in the week where
they repeat and apply the learned material. This may be true for all students.
Besides the high school leaving grade, the student’s socio-economic background
also has a significant impact on the probability of attending the lecture of course 1.
The coefficient has a minus sign implying that students with a higher socio-economic
background are less likely to frequently or always attend the lecture.
In a second step, the effect of always or frequently attending the lecture and/or
tutorial on the grade achieved in course 1 is estimated. The results are shown in Table
3. In the full specification, always or frequently attending the lecture, the tutorial or
both has no significant impact on the obtained grade. This means that being present
in class does not influence the achieved grade. When using indicator variables for all
categories of class attendance in Table 4, we find a significant effect of always attending
the lecture. This suggests that students who always go to the lecture achieve a higher,
meaning better grade in this course than students who never attend class. In contrast,
frequently or rarely going to the lecture has no significant impact on the grade achieved
in this course. For the tutorial, all categories of class attendance are insignificant.
With regard to the other controls, we find a positive and highly significant coefficient
of the high school leaving grade in the regressions shown in Table 3 and Table 4. The
higher the high school leaving grade, the better the grade the student achieves in course
1. This is in line with what the literature finds for the impact of the high school leaving
grade on university success in general (Cyrenne and Chan, 2012; Danilowicz-Gosele
et al., 2014; Girves and Wemmerus, 1988). The comparably big size of the coefficient
may be explained by the fact that the content taught in this course is based on skills
and methods already learned in high school. Since contents may overlap or build on
one another, the course may simply be easier for students who already achieved a good
grade in high school.
11

Table 3: Course 1
Dependent variable: Grade class 1(1) (2)
Lecture 1 0.395** 0.253(0.07) (0.13)
Tutorial 1 0.054 0.038(0.09) (0.05)
Lecture 1 # Tutorial 1 -0.104 -0.081(0.12) (0.11)
High school GPA 0.724**(0.10)
Male 0.176*(0.06)
Higher education (Mother) 0.081(0.09)
Age -0.021(0.01)
Constant 1.934*** 0.591(0.13) (0.33)
Semester included yes yes
R2 0.027 0.181Observations 349 349
OLS, standard errors in parentheses; clustered by semester; *p < 0.05,**p < 0.01, ***p < 0.001.
12

Table 4: Course 1 - All Categories
Dependent variable: Grade class 1(1)
Lecture 1 always 0.217*(0.06)
Lecture 1 frequently 0.164(0.12)
Lecture 1 rarely -0.015(0.13)
Tutorial 1 always -0.046(0.14)
Tutorial 1 frequently -0.191(0.07)
Tutorial 1 rarely -0.152(0.12)
High school GPA 0.707**(0.10)
Male 0.160(0.07)
Higher education (mother) 0.087(0.10)
Age -0.019(0.01)
Constant 0.727(0.45)
Semester included yes
R2 0.186Observations 349
OLS, standard errors in parentheses; clustered by semester;base categories: lecture 1 never, tutorial 1 never; *p < 0.05,**p < 0.01, ***p < 0.001.
13

In Table 3, we find a significant effect for male, but the coefficient turns slightly
insignificant at the 5%-level when using all categories of attendance in the regression in
Table 4. The socio-economic variable, education of the student’s mother, does not show
a significant effect in all specifications. This is in line with the findings of Danilowicz-
Gosele et al. (2014) suggesting that socio-economic factors only have a minor effect on
university performance, if at all. Moreover, the coefficient of the student’s age is also
insignificant in all specifications.
4.2 Course 2
Table 5 presents the results for the probit estimation of frequently or always attending
the lecture or the tutorial of course 2, which focuses on basics in business administration.
Columns 2 and 4 show marginal effects for a benchmark student, and columns 1 and 3
the corresponding coefficients. For this course, the benchmark student is female, never
or rarely attends class, has a mother with a lower educational background, took course
2 in the summer term 2012 and is average with regard to all continuous variables.
We find that frequently or always going to the tutorial has a positive impact on
the probability of attending the lecture, but not vice versa. The effect of the high
school leaving grade is significant for both types of teaching. However, the coefficient
has a plus sign for the lecture and a minus sign for the tutorial. This means that
the higher, implying better, the high school leaving grade, the higher the probability
of attending the lecture and the lower the probability of attending the tutorial. The
effect we find for the probability of going to the lecture is in line with the results for
course 1. Students with lower academic ability abstain from going to the lecture where
the content is presented in a more general and theoretical way. On the other hand, in
the tutorial, students are taught how to solve problem sets that are similar to what is
asked in the later examination. Therefore, one would expect that all students attend
the tutorial in order to be prepared for the examination. However, students may copy
each other’s notes and take turns in going to class. Since students with higher academic
ability may not have as many questions about the taught learning content, they may
prefer to learn on their own and abstain from attending the tutorial.
The effect of age on the probability of attending the tutorial of course 2 is negative
and significant. A reason for this may be that students who start university at a later
point in time, and therefore are older than their peers, often did an apprenticeship after
finishing high school. If they worked in a company or bank, they achieved commercial
14

Table 5: Probability of Attending Course 2
Dependent variable: Lecture 2 Tutorial 2(1) (2) (3) (4)
Lecture 2 0.710 0.159(0.47) (0.18)
Tutorial 2 0.879* 0.189*(0.43) (0.10)
High school GPA 0.353** 0.112** -0.299* -0.092*(0.12) (0.05) (0.12) (0.08)
Male -0.178 -0.060 -0.307 -0.104(0.11) (0.04) (0.29) (0.07)
Higher education (mother) -0.124 -0.041 0.407 0.106(0.11) (0.04) (0.44) (0.16)
Age -0.048 -0.015 -0.103** -0.032**(0.06) (0.02) (0.04) (0.01)
Constant 0.895 3.883**(1.79) (1.41)
Semester included yes yes yes yes
Pseudo R2 0.108 0.108 0.177 0.177Log Likelihood -115.3 -115.3 -61.2 -61.2Observations 277 277 277 277
Probit estimation; column (1), (3): coefficients; column (2), (4): marginal effects for bench-mark student (female, never or rarely attends the tutorial/lecture, mother has a lower ed-ucational background, took the course in the summer term 2012 and is average with re-gard to all continuous variables); standard errors in parentheses; clustered by semester;levels of significance for marginal effects refer to p-values of the underlying coefficients;*p < 0.05,**p < 0.01,***p < 0.001.
skills which are relevant for course 2. These students may simply be able to solve the
provided problem sets on their own, and therefore do not go to class.
Moreover, for course 2, the effect of attending the lecture, tutorial or both on the
achieved grade is estimated. The results of the OLS regressions are presented in Table
6. In the shown specification, the indicator variables for the lecture and the tutorial
distinguish between never or rarely and frequently or always attending class. Neither
for the lecture, for the tutorial or for the interaction term, we find a significant effect
on the grade achieved in this course. This holds true for the specification that includes
all categories of attendance in Table 7.
Similar to the results of course 1, we find a highly significant effect of the high school
15

Table 6: Course 2
Dependent variable: Grade class 2(1) (2)
Lecture 2 0.147 0.302(0.18) (0.37)
Tutorial 2 -0.127 0.235(0.21) (0.13)
Lecture 2 # Tutorial 2 -0.126 -0.387(0.24) (0.22)
High school GPA 0.644*(0.15)
Male -0.065(0.10)
Higher education (mother) -0.142(0.10)
Age 0.028**(0.01)
Constant 2.344*** -0.050(0.15) (0.28)
Semester included yes yes
R2 0.004 0.149Observations 277 277
OLS, standard errors in parentheses; clustered by semester; *p < 0.05,**p < 0.01, ***p < 0.001.
leaving grade, implying that the better the grade of the high school leaving certificate,
the better the grade achieved in course 2. Although the size of the coefficient is smaller
than for course 1, it is still comparatively large.
The effect of age is positive and significant in the full specification in Table 6,
suggesting that more mature students achieve a higher grade in this course. This result
can be explained in the same way as the lower probability of older students to attend
the tutorial. They may have completed an apprenticeship before going to university,
for example in a bank or a company, and thereby achieved commercial skills that are
relevant for course 2. However, the coefficient turns slightly insignificant at the 5%-level
when including all categories of attendance. The students’ gender and socio-economic
background have no significant impact on the achieved grade in all specifications.
16

Table 7: Course 2 - All Categories
Dependent variable: Grade class 2(1)
Lecture 2 always 0.387(0.44)
Lecture 2 frequently 0.211(0.41)
Lecture 2 rarely 0.455(0.41)
Tutorial 2 always -0.020(0.27)
Tutorial 2 frequently -0.202(0.35)
Tutorial 2 rarely 0.007(0.58)
High school GPA 0.604*(0.16)
Male -0.043(0.09)
Higher education (mother) -0.120(0.10)
Age 0.021(0.01)
Constant 0.075(0.76)
Semester included yes
R2 0.169Observations 277
OLS, standard errors in parentheses; clustered by semester;base categories: lecture 2 never, tutorial 2 never; *p < 0.05,**p < 0.01, ***p < 0.001.
17

4.3 Discussion
Besides the impact of always attending the lecture of course 1, we do not find any
significant effect of class attendance on the grade achieved in the respective course.
A reason for this sobering result may be that, especially in case of the lecture, it
is comparatively easy to study on one’s own: the learning content can be found in
textbooks and the syllabus, as well as other study material is available for all students
irrespective of class attendance. Given that in the lecture, students do not apply the
taught learning material themselves but adopt a rather passive role, attending class
and reading a textbook may be substitutes. Consequently, there may simply be no
difference between attending class and listening to the lecturer or staying at home or
going to the library and reading the argumentation on one’s own.
In the tutorials, the students apply the methods themselves, learn how to solve
problem sets that are similar to the examinations and have the opportunity to ask
questions. Therefore, the non-significant effect is more surprising. In the tutorial of
course 1, the teaching assistant does not show how to solve the problem sets, but
helps when students have questions. However, the final solution to every exercise is
provided to all students. Consequently, abstaining from class and trying to figure out
the approach by oneself or with friends may be just as effective as asking the teaching
assistant.
In the tutorial of course 2, the teaching assistants show and explain how to solve the
provided question sets. This means that students who attend class get a perfect solution
to the respective problem, and additionally, have the opportunity to ask questions.
Nevertheless, some students may prefer to copy a friend’s notes and study on their
own. Students may also form study groups where they take turns in going to class, and
afterwards discuss the learning material with each other. In particular, when students
do not take an active role in class, but only listen to the teaching assistant and take
down notes, the difference between a lecture and a tutorial turns out to be rather small.
Nevertheless, the insignificant effect of class attendance may also appear due to iden-
tification problems. If, for example, students who do not go to class are systematically
more motivated than their peers who attend the lecture or tutorial and motivation is
not fully captured by controlling for the high school leaving grade, our results would be
biased due to a negative self-selection into class attendance. However, it is not obvious
why more motivated students should abstain from going to class, especially under the
assumption that motivation and academic ability are only partially correlated.
18
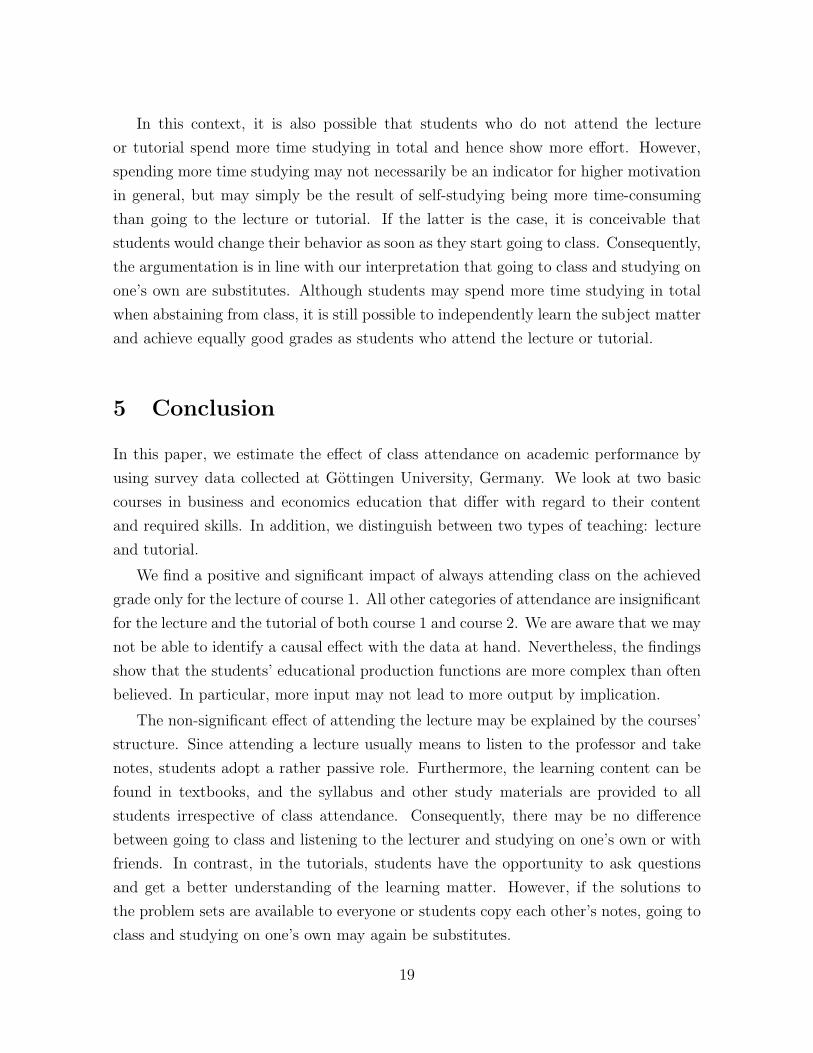
In this context, it is also possible that students who do not attend the lecture
or tutorial spend more time studying in total and hence show more effort. However,
spending more time studying may not necessarily be an indicator for higher motivation
in general, but may simply be the result of self-studying being more time-consuming
than going to the lecture or tutorial. If the latter is the case, it is conceivable that
students would change their behavior as soon as they start going to class. Consequently,
the argumentation is in line with our interpretation that going to class and studying on
one’s own are substitutes. Although students may spend more time studying in total
when abstaining from class, it is still possible to independently learn the subject matter
and achieve equally good grades as students who attend the lecture or tutorial.
5 Conclusion
In this paper, we estimate the effect of class attendance on academic performance by
using survey data collected at Gottingen University, Germany. We look at two basic
courses in business and economics education that differ with regard to their content
and required skills. In addition, we distinguish between two types of teaching: lecture
and tutorial.
We find a positive and significant impact of always attending class on the achieved
grade only for the lecture of course 1. All other categories of attendance are insignificant
for the lecture and the tutorial of both course 1 and course 2. We are aware that we may
not be able to identify a causal effect with the data at hand. Nevertheless, the findings
show that the students’ educational production functions are more complex than often
believed. In particular, more input may not lead to more output by implication.
The non-significant effect of attending the lecture may be explained by the courses’
structure. Since attending a lecture usually means to listen to the professor and take
notes, students adopt a rather passive role. Furthermore, the learning content can be
found in textbooks, and the syllabus and other study materials are provided to all
students irrespective of class attendance. Consequently, there may be no difference
between going to class and listening to the lecturer and studying on one’s own or with
friends. In contrast, in the tutorials, students have the opportunity to ask questions
and get a better understanding of the learning matter. However, if the solutions to
the problem sets are available to everyone or students copy each other’s notes, going to
class and studying on one’s own may again be substitutes.
19

The argumentation underlines that teaching concepts may play a crucial role when
analyzing the effect of class attendance on university performance. It is conceivable
that a positive link between going to class and student performance can be found when
the teaching and learning environment is more interactive and encourages students
to discuss and develop own solutions. For example, Beltz et al. (2011) analyze the
effect of attending small group tutorials that accompany a basic lecture in business
administration at a German university. In contrast to the tutorials that we assess, the
students need to take a more active role in class. They have to present homework,
solve question sets in groups and discuss the results afterwards. In addition, they have
the possibility to take voluntary tests in the course of the semester. Contrary to our
study, Beltz et al. (2011) find a positive link between class attendance and student
performance. However, this does not contradict our results due to the differences in
teaching concepts. In fact, the different results underline the complexity of the students’
educational production function where simply providing more teaching or reducing class
size may not lead to more output by implication. Instead, a variety of class specific
factors such as teaching concepts should be taken into account when analyzing the effect
of attendance on student performance.
20

Technical Appendix
Since students may attend several of the courses where the questionnaires were dis-
tributed, it was important to avoid that they filled out more than one copy. To do
so, a question asking whether the students had already filled out the questionnaire was
included. All questionnaires with a tick for “yes”, meaning that it had been filled out
before, were not considered in the analyses.
In some cases, decisions on how to handle specific answers given by the students had
to be made in order to ensure standardization. In general, the option “no answer” was
transferred into a missing value. The same was done for grades that do not correspond
to the German grading scheme as well as the answer “Abitur” (name of the German
high school leaving certificate) instead of a grade.
Concerning the mother’s level of education, a student filled in the name of a certifi-
cate which does not exist in Germany any longer. In this case, a corresponding level of
qualification was registered. Furthermore, the answer “I do not know” to the question
on the mother’s academic qualification was coded as missing value. In the case where
more than one answer was given to a specific question, all answers were taken into
account. Only questionnaires containing contradictory answers were dropped.
Students are allowed to repeat the examination either because they failed or in order
to improve the obtained grade. For this reason, the questionnaire asked if the student
repeated the examination and if so, which grade she achieved. In the analysis, only the
grade of the first examination is used to measure student performance.
Students with missing data concerning course 1 (course 2) were excluded from the
analysis of the respective course only. The same was done for students who had not yet
taken the examination or did not take the respective course at all, as well as for those
who took the respective course at a different university. Students with missing data
regarding personal information, such as the grade of the high school leaving certificate,
were removed from the overall sample. Furthermore, we excluded students who stated
that their home address is outside of Germany. This is done as the provided grade of the
high school leaving certificate may not be transformed into the German grading scheme,
and hence not comparable. Moreover, foreign students may face additional challenges
with regard to language and culture that influence their university performance.
In total, there were 613 questionnaires out of which 383 were used for the final
analyses. 349 questionnaires included all information relevant to evaluate course 1; 277
questionnaires were used to analyze course 2.
21

Forschungsumfrage zum Studienverhalten
Haben Sie den vorliegenden Fragebogen bereits in einer anderen Lehrveranstaltung ausgefüllt?
☐Ja ☐Nein
1. Lehrveranstaltung Course 1
1.1 In welchem Semester haben Sie zum ersten Mal an der Klausur zu der Lehrveranstaltung Course 1 teilgenommen?
☐WiSe 2012/2013 ☐SoSe 2012 ☐WiSe 2011/2012
☐SoSe 2011 ☐WiSe 2010/2011 und früher
☐Ich habe die Lehrveranstaltung noch nicht besucht, habe aber vor, sie zu besuchen. ☐Anerkannte Leistung
☐Keine Pflichtveranstaltung und ich habe auch nicht vor, sie zu besuchen. ☐Keine Antwort
1.2 Wie häufig haben Sie in jenem Semester die Vorlesung zu der Lehrveranstaltung Course 1 besucht?
☐Nie ☐Selten ☐Häufig ☐Immer ☐Keine Antwort
1.3 Wie häufig haben Sie in jenem Semester das Tutorium (Kleingruppenübung) zu der Lehrveranstaltung Course 1 besucht?
☐Nie ☐Selten ☐Häufig ☐Immer ☐Keine Antwort
1.4 Welches Tutorium zu der Lehrveranstaltung Course 1 haben Sie vorrangig besucht? Bitte kreuzen Sie in dem Stundenplan das entsprechende Feld an (Tag und Uhrzeit).
1.5 Wie viele Studierende haben durchschnittlich dieses Tutorium besucht?
☐ Weniger als 5 ☐5-15 ☐16-30 ☐Mehr als 30 ☐Keine Antwort
1.6 Haben Sie innerhalb des Semesters das Tutorium gewechselt?
☐Nein ☐Einmal ☐Zweimal ☐Mehr als zweimal ☐Keine Antwort
1.7 Aus welchem Grund haben Sie sich für das von Ihnen vorrangig besuchte Tutorium entschieden?
(Auswahl mehrerer Antworten möglich.)
☐Besuch desselben Tutoriums durch Freunde ☐Uhrzeit ☐Tutor/in
☐Gute Einbindung in den Stundenplan ☐ Anderer Grund: ________________ ☐Keine Antwort
1.8 Welche Prüfungsleistung haben Sie in jenem Semester in der Klausur erzielt (Note)? _________
1.9 Wenn Sie die Prüfungsleistung in einem späteren Semester wiederholt haben, geben Sie bitte an, wie sich Ihr Lernverhalten geändert
hat. (Auswahl mehrerer Antworten möglich.)
☐Vorlesung häufiger besucht ☐Vorlesung seltener besucht ☐Tutorium häufiger besucht
☐Tutorium seltener besucht ☐Bewusste Wahl einer anderen Tutorin/ eines anderen Tutors
☐Inanspruchnahme von Nachhilfe ☐Intensiveres Selbststudium ☐Weniger Selbststudium
☐Gemeinsame Vorbereitung mit Kommilitonen ☐Keine Änderung des Lernverhaltens ☐Keine Antwort
1.10 Welche Prüfungsleistung haben Sie in der Klausur des späteren Semesters erzielt (Note)? _________
2. Lehrveranstaltung Course 2
2.1 In welchem Semester haben Sie zum ersten Mal an der Klausur zu der Lehrveranstaltung Course 2 teilgenommen?
☐WiSe 2012/2013 ☐SoSe 2012 ☐WiSe 2011/2012
☐SoSe 2011 ☐WiSe 2010/2011 und früher
☐Ich habe die Lehrveranstaltung noch nicht besucht, habe aber vor, sie zu besuchen. ☐Anerkannte Leistung
☐Keine Pflichtveranstaltung und ich habe auch nicht vor, sie zu besuchen. ☐Keine Antwort
2.2 Wie häufig haben Sie in jenem Semester die Vorlesung zu der Lehrveranstaltung Course 2 besucht?
☐Nie ☐Selten ☐Häufig ☐Immer ☐Keine Antwort
2.3 Wie häufig haben Sie in jenem Semester das Tutorium (Kleingruppenübung) zu der Lehrveranstaltung Course 2 besucht?
☐Nie ☐Selten ☐Häufig ☐Immer ☐Keine Antwort
2.4 Welches Tutorium zu der Lehrveranstaltung Course 2 haben Sie vorrangig besucht? Bitte kreuzen Sie in dem Stundenplan das entsprechende Feld an (Tag und Uhrzeit).
Uhrzeit / Tag
Montag Dienstag Mittwoch Donnerstag Freitag
8.00-10.00
10.00-12.00
12.00-14.00
14.00-16.00
16.00-18.00
18.00-20.00
Uhrzeit / Tag
Montag Dienstag Mittwoch Donnerstag Freitag
8.00-10.00
10.00-12.00
12.00-14.00
14.00-16.00
16.00-18.00
18.00-20.00
Questionnaire2
2The presented questionnaire is an anonymized version of the original questionnaire.
22

2.5 Wie viele Studierende haben durchschnittlich dieses Tutorium besucht?
☐ Weniger als 5 ☐5-15 ☐16-30 ☐Mehr als 30 ☐Keine Antwort
2.6 Haben Sie innerhalb des Semesters das Tutorium gewechselt?
☐Nein ☐Einmal ☐Zweimal ☐Mehr als zweimal ☐Keine Antwort
2.7 Aus welchem Grund haben Sie sich für das von Ihnen vorrangig besuchte Tutorium entschieden?
(Auswahl mehrerer Antworten möglich.)
☐Besuch desselben Tutoriums durch Freunde ☐Uhrzeit ☐Tutor/in
☐Gute Einbindung in den Stundenplan ☐ Anderer Grund: ________________ ☐Keine Antwort
2.8 Welche Prüfungsleistung haben Sie in jenem Semester in der Klausur erzielt (Note)?__________
2.9 Wenn Sie die Prüfungsleistung in einem späteren Semester wiederholt haben, geben Sie bitte an, wie sich Ihr Lernverhalten geändert
hat. (Auswahl mehrerer Antworten möglich.)
☐Vorlesung häufiger besucht ☐Vorlesung seltener besucht ☐Tutorium häufiger besucht
☐Tutorium seltener besucht ☐Bewusste Wahl einer anderen Tutorin/ eines anderen Tutors
☐Inanspruchnahme von Nachhilfe ☐Intensiveres Selbststudium ☐Weniger Selbststudium
☐Gemeinsame Vorbereitung mit Kommilitonen ☐Keine Änderung des Lernverhaltens ☐Keine Antwort
2.10 Welche Prüfungsleistung haben Sie in der Klausur des späteren Semesters erzielt (Note)?__________
3. Individuelles Lernverhalten
Wenn Sie lernen,…
3.1 …wie oft nutzen Sie die Lernräume (inkl. Bibliotheken) der Universität?
☐Nie ☐Selten ☐Häufig ☐Immer ☐Keine Antwort
3.2 …wie oft lernen Sie zuhause?
☐Nie ☐Selten ☐Häufig ☐Immer ☐Keine Antwort
3.3 …wie oft lernen Sie alleine?
☐Nie ☐Selten ☐Häufig ☐Immer ☐Keine Antwort
3.4 …wie oft lernen Sie mit einer anderen Person zusammen?
☐Nie ☐Selten ☐Häufig ☐Immer ☐Keine Antwort
3.5 …wie oft lernen Sie in einer Gruppe mit mehr als einer anderen Person?
☐Nie ☐Selten ☐Häufig ☐Immer ☐Keine Antwort
4. Persönliche Angaben
4.1 Wie lautet Ihr Geschlecht?
☐Weiblich ☐Männlich ☐Keine Antwort
4.2 Wie lautet Ihr Geburtsjahr?_____________
4.3 Wie lautet die Postleitzahl Ihrer Heimatanschrift? (Wenn Sie die Postleitzahl nicht kennen, geben Sie bitte den Ort an.)
__________________
4.4 Seit welchem Semester studieren Sie an der Georg-August-Universität Göttingen?
☐WiSe 2012/2013 ☐SoSe 2012 ☐WiSe 2011/2012
☐SoSe 2011 ☐WiSe 2010/2011 ☐SoSe 2010
☐WiSe 2009/2010 ☐SoSe 2009 ☐WiSe 2008/2009
☐SoSe 2008 ☐WiSe 2007/2008 und früher ☐Keine Antwort
4.5 In welchem Studiengang sind Sie immatrikuliert?
☐Betriebswirtschaftslehre ☐Volkswirtschaftslehre ☐Wirtschaftsinformatik
☐Wirtschaftspädagogik ☐Volkswirtschaftslehre im Rahmen eines Zwei-Fach-Bachelor-Studiengangs
☐anderer Studiengang: ____________________________ ☐Keine Antwort
4.6 Wenn Sie Volkswirtschaftslehre im Rahmen eines Zwei-Fach-Bachelor-Studiengangs studieren, geben Sie bitte Ihr zweites Fach an:
________________________________
4.7 Wie lautet die Note Ihrer Hochschulzugangsberechtigung (meist Abitur)? _________
4.8 Welches ist der höchste Bildungsabschluss Ihrer Mutter?
☐Kein Abschluss ☐Volks-/Hauptschulabschluss ☐Realschulabschluss
☐Fachhochschulreife ☐Allgemeine Hochschulreife ☐Hochschulabschluss
☐Promotion ☐Keine Antwort
23

References
Arulampalam, W., Naylor, R. A., Smith, J., 2012. Am i missing something? The effects
of absence from class on student performance. Economics of Education Review 31 (4),
363–375.
Beltz, P., Link, S., Ostermaier, A., 2011. Konnen Studienbeitrage die Lehre in der
BWL verbessern? Eine empirische Analyse der wirkungen studienbeitragsfinanzierter
Tutorien. Zeitschrift fur Betriebswirtschaft 81 (11), 1205–1223.
Cohn, E., Johnson, E., 2006. Class attendance and performance in principles of eco-
nomics. Education Economics 14 (2), 211–233.
Cyrenne, P., Chan, A., 2012. High school grades and university performance: A case
study. Economics of Education Review 31 (5), 524–542.
Danilowicz-Gosele, K., Meya, J., Schwager, R., Suntheim, K., 2014. Determinants of
students success at university. Gottingen.
Dobkin, C., Gil, R., Marion, J., 2010. Skipping class in college and exam performance:
Evidence from a regression discontinuity classroom experiment. Economics of Edu-
cation Review 29 (4), 566–575.
Durden, G. C., Ellis, L. V., 1995. The effects of attendance on student learning in
principles of economics. The American Economic Review Papers and Proceedings
85 (2), 343–346.
Girves, J. E., Wemmerus, V., 1988. Developing models of graduate student degree
progress. The Journal of Higher Education (59), 163–189.
Marburger, D. R., 2001. Absenteeism and undergraduate exam performance. Journal
of Economic Education 32 (2), 99–109.
Marburger, D. R., 2006. Does mandatory attendance improve student performance?
Journal of Economic Education 37 (2), 248–255.
Martins, P. S., Walker, I., 2006. Student achievement and university classes: Effects of
attendance, size, peers, and teachers. IZA Discussion Paper (2490), bonn.
Romer, D., 1993. Do students go to class? Should they? The Journal of Economic
Perspectives 7 (3), 167–174.
24

Stanca, L., 2006. The effects of attendance on academic performance: Panel data evi-
dence for introductory microeconomics. The Journal of Economic Education 37 (3),
251–266.
25