
CIWM 2013 President’s Report
60
CIWM Report 2013 Commercial and Industrial Waste in the UK and Republic of Ireland Report for CIWM Ricardo-AEA/R/ED58810 Issue Number 4 Date 15/10/2013
Transcript of CIWM 2013 President’s Report

CIWM Report 2013
Commercial and Industrial Waste
in the UK and Republic of Ireland
Report for CIWM
Ricardo-AEA/R/ED58810 Issue Number 4 Date 15/10/2013
CIWM Report 2013
i Ref: Ricardo-AEA/R/ED58810/Issue Number 4
Customer: Contact:
Chartered Institution of Wastes Management Maria Vinogradova Ricardo-AEA Ltd Gemini Building, Harwell, Didcot, OX11 0QR
t: 01235 75 3281
Ricardo-AEA is certificated to ISO9001 and ISO14001
Confidentiality, copyright & reproduction:
This report is the Copyright of Ricardo-AEA Ltd and has been prepared by Ricardo-AEA Ltd under contract to CIWM dated 03.06.2013. The contents of this report may not be reproduced in whole or in part, nor passed to any organisation or person without the specific prior written permission of CIWM. Ricardo-AEA Ltd accepts no liability whatsoever to any third party for any loss or damage arising from any interpretation or use of the information contained in this report, or reliance on any views expressed therein.
Authors:
Maria Vinogradova, Simon Gandy, Simone Aplin
Approved By:
Adam Read
Date:
14th October 2013
Signed:
Ricardo-AEA reference:
Ref: ED58810- Issue Number 4
CIWM Report 2013
ii Ref: Ricardo-AEA/R/ED58810/Issue Number 4
Table of contents
1 Introduction ................................................................................................................ 2 1.1 Structure of This Report ..................................................................................... 3
2 The Issues with Existing C&I Data ............................................................................ 5 2.1 England .............................................................................................................. 5 2.2 Wales ................................................................................................................. 8 2.3 Scotland ............................................................................................................. 9 2.4 Northern Ireland ................................................................................................10 2.5 Republic of Ireland ............................................................................................11 2.6 Reviewing the Energy Technologies Institute Commercial and Industrial Waste Study …………………………………………………………………………………………..12 2.7 Key Findings – the State of Existing C&I Data ...................................................14
3 Current Commercial and Industrial Waste Arisings and Future Projections ........16 3.1 England .............................................................................................................17 3.2 Wales ................................................................................................................20 3.3 Scotland ............................................................................................................22 3.4 Northern Ireland ................................................................................................23 3.5 Republic of Ireland ............................................................................................25 3.6 Key Findings .....................................................................................................27
4 Treatment Capacity Assessment .............................................................................29 4.1 Introduction .......................................................................................................29 4.2 Existing UK Infrastructure ..................................................................................30 4.3 New Facilities ....................................................................................................31 4.4 “Other” Facilities ................................................................................................35 4.5 Analysing Total Capacity for C&I Waste Treatment ...........................................35 4.6 Republic of Ireland ............................................................................................37 4.7 The Export Solution ...........................................................................................39 4.8 Key Findings .....................................................................................................41
5 Discussion and Stakeholder Views..........................................................................45 5.1 Commentary on Future C&I Waste Arisings ......................................................45 5.2 Stakeholder Views ............................................................................................45 5.3 Key Findings from the Stakeholders ..................................................................51
6 Conclusions and Recommendations .......................................................................53 6.1 The Consequences ...........................................................................................53 6.2 Recommendations ............................................................................................55
Appendices
Appendix 1 Methodological Note

CIWM Report 2013
1 Ref: Ricardo-AEA/R/ED58810/Issue Number 4
Commercial and industrial waste is a key feedstock for the waste management sector in the UK and Republic of Ireland. Yet it remains the “known unknown” of the industry; just how much is arising, where is it arising and how will this change in the future?
Commercial and industrial waste is the final piece of the puzzle in the rapidly developing waste infrastructure landscape of the UK and Ireland, but delivering facilities is increasingly challenging without a proper understanding of the nature and future of this feedstock.
The Chartered Institution of Wastes Management has commissioned this report to review current available datasets, forecast future arisings, determine the likely required treatment and processing capacity, and liaise with industry stakeholders on what is happening and what needs to happen.
Introduction
CIWM Report 2013
2 Ref: Ricardo-AEA/R/ED58810/Issue Number 4
1 Introduction
Over the last ten years the waste management landscape in the UK and Republic of Ireland has changed significantly. A range of waste infrastructure for material and energy recovery, as well as diversion from landfill has been developed in the UK and Republic of Ireland in order to achieve targets set by the EU Landfill1 and Waste Framework Directives2. This infrastructure includes a many of processing facilities developed as a result of local authority household waste contracts. Occasionally these facilities have been developed with greater capacity than required to treat the household waste available, which enables them to receive ‘third party’ waste, either from non-contracted waste disposal authorities (WDAs), or from commercial sources. Other facilities have been developed on a purely ‘merchant’ basis, receiving various tonnages through short term contracts. The feedstock risk associated with this model means it relates more to materials recovery facilities or plants with smaller capacities, which do not always take full advantage of economies of scale, rather than major residual waste treatment facilities.
The withdrawal of PFI funding for waste projects in England and the redefinition in 2010 of municipal solid waste (MSW) under EU regulations to include waste arising from businesses of similar composition to household waste has led to multiple commercial opportunities, and the potential for significant landfill diversion. However, a major obstacle to realising these opportunities is that C&I waste remains a “known unknown”. Data on C&I waste is extremely poor with operators and regulators alike having a much less certain, understanding of the volumes and composition of this key waste stream unlike local authority collected MSW (LACMSW3) data which is recorded by UK local authorities to government through WasteDataFlow. This has hindered the development of new infrastructure, as third party funding has been harder to secure, and contracts are usually short-term in nature than long term household waste deals. Risk profiles for merchant facilities with limited data and multiple feedstock sources, are too great for many funders and developers. This reflects a general trend in the market where long term debt is challenging to secure, even for municipal projects
The growing importance of C&I waste, coupled with uncertainty surrounding its present and future arisings and composition make it one of the unconquered frontiers of the waste industry. The waste stream is reported by numerous dated surveys and incongruent studies, which are not widely used by operators in their business planning decisions. A data vacuum surrounding C&I waste has created a reactive market with limited strategic future planning.
The Environment Agency’s European Pathway to Zero Waste programme (EP0W Task 5, 2012)4, Defra’s investor forum (2013)5, and many other debates and platforms in the last 18 months have highlighted the perception of waste infrastructure as a high risk investment area due to the lack of certainty in feedstock. This lack of certainty arises in part from the nature of the C&I feedstock itself. Historically tied to economic growth, C&I waste arisings are highly variable year on year. As businesses continue to implement resource efficient practices, C&I waste per unit of production or employment may reduce. However, this will not necessarily constitute an overall reduction in a growing, and recovering economy. Contracts for C&I waste tend to be short term spot market arrangements with multiple waste contractors serving neighbouring businesses.
1 Council Directive 99/31/EC, available from http://eur-lex.europa.eu/LexUriServ/LexUriServ.do?uri=CELEX:31999L0031:EN:NOT
2 Council Directive 2008/98/EC, available from http://eur-lex.europa.eu/LexUriServ/LexUriServ.do?uri=CELEX:32008L0098:EN:NOT
3 For the purposes of this report, household and local authority waste is referred to as LACMSW. Where the term “MSW” is used, unless otherwise
stated, this refers to MSW as defined by EU regulations (i.e. household waste and business waste of similar composition). 4 Background to EP0W Task 5 available from http://www.ricardo-aea.com/cms/developing-business-waste-infrastructure-in-london-and-the-south-
east/ 5 Defra waste industry growth summit, http://www.letsrecycle.com/news/latest-news/business/defra-hosts-waste-sector-growth-summit

CIWM Report 2013
3 Ref: Ricardo-AEA/R/ED58810/Issue Number 4
As the leading professional body for the waste and resource sector, the Chartered Institution of Wastes Management (CIWM) sees its mission as the continuous improvement in sustainable management of resources and wastes. The sustainable management of C&I waste is based on the ability to project, plan and provide facilities for this feedstock. The Chartered Institution of Wastes Management has commissioned this report to review current available datasets, forecast future arisings, determine the likely required treatment and processing capacity, and liaise with industry stakeholders on what is presently happening and what needs to happen in the future.
1.1 Structure of This Report
This report begins by presenting currently available datasets on C&I waste arising in England, Wales, Scotland, Northern Ireland and the Republic of Ireland. Investigating historical studies reveals a number of differences in their methodological approach, as well inconsistencies in the assumptions made.
The second chapter presents the outcome of a range of bespoke models which attempt to bring together these disparate datasets, extrapolate from them and derive results for current and future arisings of C&I and the potential capacity to process it. These results are subject to the caveats associated with their input data, as well as a range of compounding factors and future uncertainties, which are outlined in the chapter.
The final section presents a discussion of the identified issues and the implications for the future projection, planning and provision for C&I waste. The discussion has been informed by the data analysis, Ricardo-AEA’s project experience and insights, and interviews conducted with a number of key stakeholders.

CIWM Report 2013
4 Ref: Ricardo-AEA/R/ED58810/Issue Number 4
Commercial and industrial waste is a vastly complex waste stream, the volume and composition of which is dependent on many interconnected factors. Analysing arisings has historically been a challenging task.
Regulators and government agencies in the UK and Ireland have made many attempts to survey, collect and record data. However, each dataset is subject to a myriad of caveats and assumptions.
The cumulative effect of uncertainties and disparate methodologies is that the commercial and industrial waste data publically available does not, on the whole, provide a robust picture of this waste stream.
Overall, the reliability, representativeness and accuracy of available data is highly uncertain.
The Issue With Existing C&I Data

CIWM Report 2013
5 Ref: Ricardo-AEA/R/ED58810/Issue Number 4
2 The Issues with Existing C&I Data
Commercial and industrial waste has a number of inherent qualities as a waste stream which undermine any successful data collection and modelling, unlike municipal solid waste data associated with local authority contracts and household waste arisings:
C&I waste is highly dependent on the economic stability of the business sector in which it arises;
C&I waste is organised in a patchwork of short term spot market collection and treatment contracts driven by competitive gate fees;
C&I waste producers do not have the same obligations as Local Authority Waste Managers to track and report their arising waste;
C&I waste producers are a highly diverse group, with many more variables than householders; the C&I waste stream encompasses producers ranging from large manufacturing installations, to hotels, offices and caterers as well as vast numbers of small and medium enterprises (SMEs);
C&I waste is collected and managed by a wide variety of operators, ranging from national waste management companies to small local brokers; and,
C&I waste producers are subject to mandatory waste regulations and targets in Scotland in terms of recycling, but only voluntary codes and practices in the rest of the UK and the Republic of Ireland. Although many businesses now recognise the economic and sustainability advantages of implementing resource efficient practices, the speed and scale of their uptake is vastly variable, unpredictable and underreported.
Nevertheless, national agencies and regulators have made several attempts to collect and model data on C&I waste arisings. The following sections review the key studies in each country and identify issues which make using this data challenging.
2.1 England
England is the largest economy, and the largest C&I waste generating country out of those investigated by this study. It has also had the greatest number of reports and investigations carried out into C&I waste. Therefore, caveats applicable to data in England are often applicable to the data in other countries, especially where the England findings have been used to benchmark regional studies, as is the case in Northern Ireland.
2.1.1 Commercial and industrial waste arising
A number of studies have attempted to gather C&I arising information for England.
1) The Environment Agency undertook a survey of commercial and industrial waste arisings in 1998/9.
2) The Environment Agency undertook a slightly smaller survey in 2002/36. The survey collected data from 4,500 commercial and industrial businesses which included information on the type of waste, quantity of waste, and waste disposal or recovery method. It should be noted that the estimate of industrial waste includes bottom ash, blast furnace and steel slag. Overall, the survey estimated that England generated approximately 68 million tonnes of C&I waste.
3) In the following years, the 2002/3 estimates were used to produce new estimates of C&I waste arisings using current business demographics at the time.
6 Environment Agency, 2003, Commercial and Industrial Waste Survey 2002/3, details available from
http://archive.defra.gov.uk/evidence/statistics/environment/waste/wrindustry.htm

CIWM Report 2013
6 Ref: Ricardo-AEA/R/ED58810/Issue Number 4
4) ADAS undertook a study based on primary source data in 2006/7. The report, ‘Study into C&I Waste Arisings’, 20097 was based on a survey of commercial and industrial businesses in the North West undertaken by Urban Mines in 2006/78. This dataset was used to estimate the waste produced per employee for each sector. This factor was then applied to the business demographic data for the other regions in England to generate a new estimate of approximately 59 million tonnes of C&I waste arising in this period.
The most recent estimate of C&I waste arisings was completed in 2009. The report, ‘Commercial & Industrial Waste Survey 2009’, Defra (Jacobs)9 estimated that approximately 48 million tonnes of C&I waste was generated in the period with an error threshold of +/-5% at a 95% confidence interval. The survey collected data from just over 6,000 businesses, combined it with a similar survey for the North West and was augmented with data from published datasets including the Pollution Inventory10 and corporate information.
Table 1 shows the estimated arisings by sector for each of the surveys discussed above. They show that the general trend is a reducing one, with significant falls in the quantity of waste produced by manufacturing. It is likely that this reduction is due to a number of factors including the economic downturn causing lower production, and a move towards better resource efficiency and cost recovery, driven in turn by increasing commodity prices and waste management costs. However, the converging methodologies, data collection methods and definitions of these studies make the trend less certain.
Table 1: Estimates of C&I waste arisings from previous surveys, England, 2002-2009 (tonnes)
Description 2002/3 2006/7 2009
Manufacture of food products, beverages and tobacco 7,230,000 4,789,988 4,667,000
Manufacture of textiles + Manufacture of leather and leather products 1,234,000
4,466,615
241,500
Manufacture of wood and wood products 1,471,000 1,173,000
Manufacture of pulp, paper & paper products; publishing & printing 3,996,000 2,035,500
Manufacture of chemicals, chemical products, man-made fibres + manufacture of rubber and plastic products 5,257,000
5,734,922
2,192,790
Manufacture of other non-metallic mineral products 2,272,000 1,654,210
Manufacture of basic metal and fabricated metal products 6,340,000 3,764,111 4,235,000
Manufacture of machinery and equipment, manufacture of electrical and optical equipment & manufacture of transport equipment 2,929,000 3,213,614 2,164,000
Manufacture of furniture; jewellery, musical instruments, toys; repair and installation of machinery and equipment 675,000
Electricity, gas, steam and hot water and water supply 6,182,000 6,360,979 5,720,000
Retail & wholesale 12,753,000 11,899,631 9,212,000
Hotels & catering 3,352,000 2,671,000
Public administration, education & social work 3,329,000 4,111,600 4,371,000
Transport, communications & storage 2,182,000 2,189,000
Other services 8,704,000 14,991,050 5,402,000
Total of C&I waste generated 67,906,000 59,332,510 47,928,000
7 Study into C&I Waste Arisings, ADAS, 2009 (2006/7 data year)
8 Urban Mines, Commercial and Industrial Waste data analysis of the North West Region, December 2008, available from
http://www.urbanmines.org.uk/?i=2138&s=1111 9 Commercial & Industrial Waste Survey 2009, Defra (Jacobs), May 2011, available from
http://archive.defra.gov.uk/evidence/statistics/environment/waste/documents/commercial-industrial-waste101216.pdf 10
Environment Agency, Pollution Inventory Reporting, available from http://www.environment-agency.gov.uk/business/topics/pollution/32272.aspx
CIWM Report 2013
7 Ref: Ricardo-AEA/R/ED58810/Issue Number 4
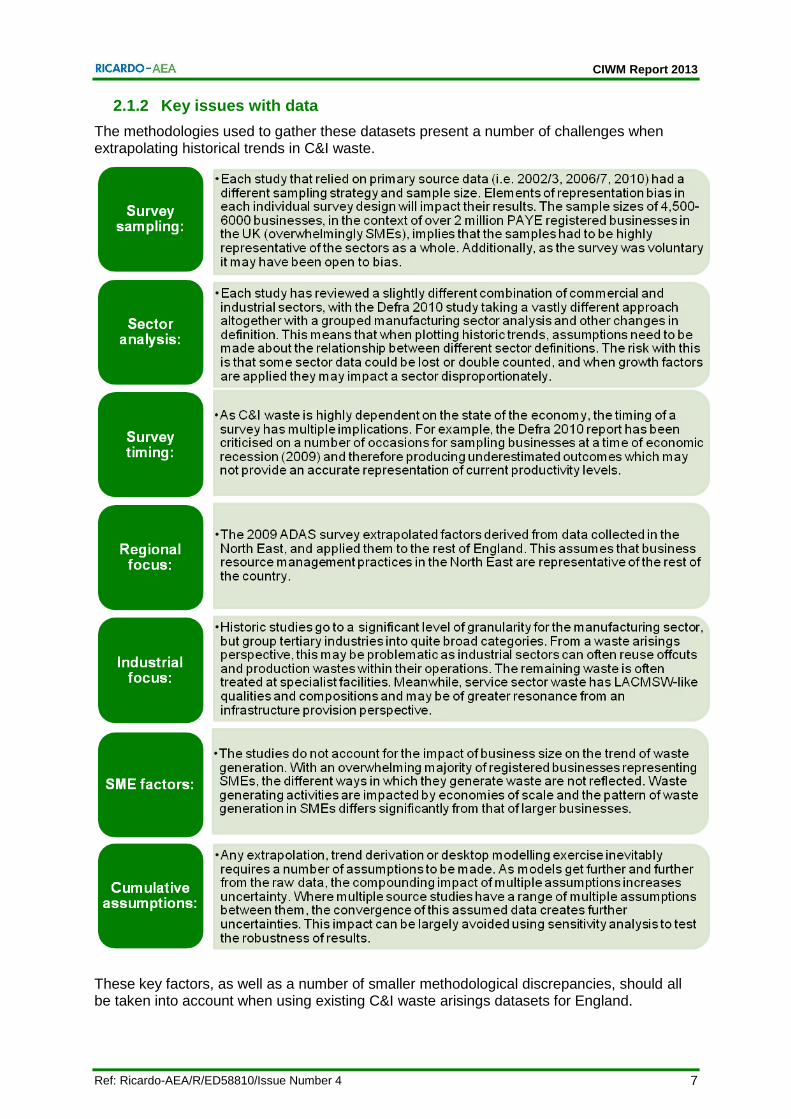
2.1.2 Key issues with data
The methodologies used to gather these datasets present a number of challenges when extrapolating historical trends in C&I waste.
These key factors, as well as a number of smaller methodological discrepancies, should all be taken into account when using existing C&I waste arisings datasets for England.

CIWM Report 2013
8 Ref: Ricardo-AEA/R/ED58810/Issue Number 4
2.1.3 Commercial and industrial waste managed
Data on the quantity, type and fate of waste managed by sites that hold an Environmental Permit is published by the Environment Agency on an annual basis in the form of the Waste Data Interrogator. The Interrogator contains information provided by site operators in the site returns that they are required to submit by the conditions of their permit. The Interrogator is an annual release tool, with the most recent version available being 201111.
The Interrogator can be queried using a number of parameters including area, waste type, waste fate and site type to give a detailed insight into the way waste is managed in England and Wales.
The data reported by the Interrogator is subject to a number of key caveats:
site returns specify the origin of the waste geographically, but not by producer type. Although an EWC code designation can identify many industrial wastes, a lot of commercial waste streams are classed under EWC Chapter 20, together with LACMSW of similar composition12. Therefore, extracting C&I waste tonnages involves carefully taking away reported LACMSW from the Interrogator outputs;
site returns only trace waste origin to one degree of the supply chain. This means that when waste travels through an intermediary facility, like a transfer station, its district of generation is lost. The impact of intermediary facilities presents the risk of double counting waste in the analysis. Tonnages of waste need to be modelled as a material flow through multi-facility supply chain, rather than a step by step assessment. However, it is almost inevitable that a degree of double counting creeps in to such a dataset; and,
site returns data is only as accurate as the person compiling it. It requires a skill of classifying waste by EWC code and operations by treatment type. Incomplete or inaccurate site returns, whether for reasons of negligence, misinterpretation or malpractice, will introduce inaccuracies which will persist throughout the Interrogator and subsequent analyses.
2.1.4 Data certainty
The list of caveats presented for England C&I data is largely applicable to the datasets gathered in other countries. Compounding assumptions, sector definitions, sample size, and extrapolation are the drawbacks of any C&I dataset. Therefore, the following sections present datasets from other countries, with the assumption that the above caveats apply, unless stated. Specific issues associated with individual studies are described in more detail.
2.2 Wales
The key C&I waste survey for Wales was completed in 2007 by Urban Mines managed by Environment Agency Wales, and funded by Welsh Assembly Government13.
The survey updated the previous surveys in relation to C&I waste arisings and how they are managed, undertaken in 1998/99 and 2002/3, as mentioned in Section 2.1.1.
To inform the survey waste production data was collected from a sample matrix of 1,547 businesses throughout Wales from different sectors, and sizes (by number of employees). The data was collected at business premises using a structured interview process, and grossed up using business population data to regional and national levels in Wales.
11
Environment Agency, 2011, Waste Data 2011, details and downloads available from http://www.environment-agency.gov.uk/research/library/data/142511.aspx 12
The Environment Agency advises classifying business waste under EWC Chapter 20 Municipal waste when other EWC codes do not apply, see p.4 of “Using the List of Wastes to Code Wastes”, available from http://www.environment-agency.gov.uk/static/documents/Business/low_guide_v1.2_1397222.pdf 13
Environment Agency Wales, 2007, ‘Survey of Industrial and Commercial Waste Arising in Wales’, available from http://www.environment-agency.gov.uk/research/library/publications/107692.aspx

CIWM Report 2013
9 Ref: Ricardo-AEA/R/ED58810/Issue Number 4
The confidence limits for the total Wales waste arisings (including non-wastes) was reported to be +/-4.7% at 90% confidence and at regional level the arisings were of a similar precision.
C&I waste arisings were classified by Substance Oriented Classification (SOC) code, in preference to using the European Waste Catalogue, with weight data calculated using volume to weight conversion factors where documentary evidence was not available from the business being surveyed.
The 2007 survey estimated that Welsh industrial and commercial sectors generated an estimated 3.6 million tonnes of waste, split 53%:47% between industrial and commercial businesses. The 2002/3 survey reported that sectors produced 5.3 million tonnes of waste (split 79%:21% between industrial and commercial business). The waste arising figures for the two surveys reflect a decrease in total waste produced, a marked decline in the activity of the industrial sector, and an increase in commercial sector activity.
A new C&I survey for Wales is currently being undertaken for 2012, which is due to be published March 2014. It is managed by National Resources Wales14 and will sample 1,500 businesses. This survey will also include an assessment of construction and demolition (C&D) wastes (500 survey samples).) The new data will review the progress made towards the National Waste Management Strategy targets and inform on the number of future processing facilities needed in Wales for C&I waste. Natural Resources Wales also published data from waste permit returns.
2.3 Scotland
2.3.1 Commercial and industrial waste arising
The Scottish Environment Protection Agency (SEPA) has commissioned periodic reports in 2004, 2006, and 2010 specifically considering commercial and industrial waste.
The 2004 report was produced for SEPA by Napier University15 was based on business waste surveys carried out by EnviroCentre and which used weighted sampling. This study estimated C&I arisings at 8.95 million tonnes. Municipal and Similar Wastes (as defined in the EWC) were calculated to represent up 67.8%. The authors state several issues with the data available/collected which reduced the quality of the analysis. These included the use of weighted sampling rather than stratified sampling and some streams being amalgamated into Municipal and Similar Waste EWC code. The authors conclude that “the estimates that have been produced from the data collected by the EnviroCentre survey are meaningful, if somewhat imprecise, as indicated by the wide confidence intervals.” 16
The 2006 report was also produced for SEPA by Napier University17, who also took on the data gathering exercise for 2006, this time using a stratified sample and sample size 63% larger than used in 2004. The returns were statistically analysed and grossed up to produce overall totals for Scotland of 7.64 million tonnes.
In 2010, no new data was gathered, rather the report, produced for SEPA by WRc18, was based on statistical analysis of the 2006 survey, grossed up to produce estimated figures for 2010. SEPA regard these figures as “indicative”, with a total for Scotland estimated at 6.5 million tonnes.
14
Welsh Government, ‘Wales industrial and commercial and construction and demolition waste survey’. Available from, http://wales.gov.uk/topics/environmentcountryside/epq/waste_recycling/bysector/industrial-and-construction-survey/?lang=en 15
Napier University (2006) Estimation of commercial and industrial waste produced in Scotland in 2004 – Final report to the Scottish Environment Protection Agency 16
SEPA business waste data report 2004 p32 17
Napier University, 2008, ‘Estimation of commercial and industrial waste produced in Scotland in 2006 – Final report to the Scottish Environment Protection Agency’ 18
WRc (2012) Statistical analysis of Scotland business waste survey data for 2010

CIWM Report 2013
10 Ref: Ricardo-AEA/R/ED58810/Issue Number 4
All three of the waste arisings surveys used slightly different business sector groupings.
SEPA also produce an annual Waste Data Digest19 which summarises key waste and recycling data.
In terms of C&I waste, the SEPA Waste Data Digest notes that from 2006/7 to 2010/11 the total tonnage disposed of in Scotland declined from 8.1 to 6.5 Mt per year, as shown in Table 2. These figures correspond to the estimated figures produced as a result of the waste arisings surveys rather than on waste deposited information.
Table 2: SEPA Waste Data Digest; Commercial and Industrial Waste Arisings in Scotland 2006/7 to 2010/11 (millions of tonnes)
Waste source 2006 2007 2008 2009 2010
Commercial 4.92 5.33 5.47 4.75 4.70
Industrial 2.72 2.76 2.34 1.82 1.80
Total 7.64 8.09 7.81 6.57 6.50
This trend of waste reduction reflects improved resource efficiency and recycling, driven by the landfill tax escalator, producer responsibility legislation and the effects of the recession. These factors are also likely to weaken the historical relationship between increases in GDP and increases in waste arisings.
Agriculture and forestry figures, as well as estimates of construction waste were not collected through the business waste surveys conducted and were not incorporated into the 2010 report.
2.3.2 Commercial and industrial waste managed
SEPA has figures from waste returns as reported by operators as well as data on estimated waste arisings gathered through business surveys. Previously, SEPA has used the waste arisings data, based on survey returns, as the basis for their Waste Data Digest information on Commercial and Industrial waste as this information was considered to be the more accurate of the two sources.
In 2013, SEPA prepared a new methodology for the collection of waste deposited data based on consolidating site waste returns. The publication of the first figures based on this methodology is imminent. SEPA has indicated that this information is considerably more reliable than it has been previously due to the new, more robust, methodology. Previous years’ waste deposited information has not been used to generate predictions for this report due to the success of the new methodology and the improvements in estimating waste deposits which this will bring with it.
2.4 Northern Ireland
As is the case in much of the UK, robust data on C&I waste arisings and treatment / management routes is limited. The most recent published quantifications are discussed below.
The 2011 WRAP report Northern Ireland C&I Waste Estimates20, provides an estimation of C&I waste in Northern Ireland (NI) in 2009. Projections have been formed by applying the waste-per-business factors provided in Defra’s 2010 C&I waste survey21 to Northern Ireland’s business profile in 2009. Arisings are split by sector, business size, materials, waste management route and district council.
19
SEPA Waste Data Digest; Commercial and Industrial Waste Arisings in Scotland 2006/7 to 2010/11 20
Waste and Resources Action Programme (2011) Northern Ireland Commercial & Industrial (C&I) Waste Estimates [online]. Available from: http://www.doeni.gov.uk/niea/northern_ireland_ci_waste_estimates_2009_v4_2.pdf [Accessed 19 August 2013]. 21
Department of Food, Environment and Rural Affairs (2010) Commercial and Industrial Waste Survey 2009- Final Report [online]. Available from: http://archive.defra.gov.uk/evidence/statistics/environment/waste/documents/commercial-industrial-waste101216.pdf [Accessed 22 August 2013].

CIWM Report 2013
11 Ref: Ricardo-AEA/R/ED58810/Issue Number 4
The report estimated total C&I arisings of 1.3m tonnes. The report is subject to the same caveats as the Defra 2010 study for England, with the added uncertainty over the variance between C&I waste arisings from businesses based in NI and England. There is also thought to be a degree of uncertainty regarding the waste management data, with the report stating that “waste management results from this methodology… should be heavily caveated”.
A report by Capita Symonds in 200822 collated data on the quantities and types of C&I waste managed at licensed waste management facilities during that year. Information was collected from both quarterly administrative returns and hazardous waste consignment notes, achieving a 69.5% response rate from licensed waste management facilities. The report recorded C&I waste arisings of over 2.4m tonnes. The significant difference from the WRAP report is thought to be due to the inclusion of wastes arising from the waste treatment and disposal sector, which was not included from the WRAP study, and constituted approximately 45% of the total. The Capita Symonds report acknowledges that this may have resulted in some double counting, where waste has been treated / disposed of by two waste management facilities. The report acknowledges assumptions and potential inaccuracies where non-sampling errors occur. Similar to the 2009 WRAP report, Capita Symonds recommend that their C&I waste management data is interpreted with caution due to limitations in the methodology applied.
2.5 Republic of Ireland
The Environmental Protection Agency (EPA) of Ireland has published the National Waste Report 201123 which provides the most recent waste forecast. These projections are based on the Sustainable Development Model for Ireland, produced by the Economic and Social Research Institute24. These forecasts project an increase in LACMSW of 825,000 tonnes within 15 years of the report’s publication.
The report also concludes that “the predicted growth of municipal waste within the coming decade will necessitate investment in waste management infrastructure” confirming the treatment capacity shortfall in Ireland, which is identified by this report in chapter 4.6.
The total commercial waste arisings are provided in the National Waste Report 2011, as a fraction of municipal waste. This figure includes non-process industrial waste, for example that which arises from canteens within industrial sites.
Table 3: Total industrial waste arisings in 2011 as estimated by the EPA in the report; “Ireland’s Environment – An Assessment” (2012) (millions of tonnes)
Republic of Ireland waste arisings (2011 estimate)
Household waste 1.4
Street Cleansing waste 0.025
Uncollected waste 0.2
Commercial waste 1.1
Industrial process waste 6.4
National statistics for the generation and management of wastes in the Republic of Ireland are provided by the EPA through its National Waste Prevention Programme (NWPP).
22
Capita Symonds (2008) Northern Ireland 2008 C&I Report [online]. Available from: http://www.doeni.gov.uk/niea/niea_2008_c_i_report.pdf [Accessed 22 August 2013]. 23
EPA (2011) National Waste Report 2011 [online]. Available from http://www.epa.ie/pubs/reports/waste/stats/National%20Waste%202011_web.pdf [Accessed 20 July 2013]. 24
EPA (2013) Irish Sustainable Development Model [online]. Available from: http://www.epa.ie/irelandsenvironment/socio-economic/irishsustainabledevelopmentmodel/ [Accessed 22 August 2013].

CIWM Report 2013
12 Ref: Ricardo-AEA/R/ED58810/Issue Number 4
Datasets include:
MSW;
Hazardous;
Construction and demolition; and
Waste subject to Producer Responsibility Initiatives.
An estimated 7,000 datasets are captured from a number of sources, including:
Local Authorities;
Waste operators licensed by the EPA;
Waste operators permitted by Local Authorities;
Integrated pollution and prevention control activities licensed by the EPA; and
Compliance schemes and self-complying producers.
A summary of this data is provided in the National Waste Reports, which are published annually. The waste figures in the report have a variance of +/- 1 tonnes and the survey does not include materials in temporary storage or in transition23.
The National Waste Reports have certain limitations when being used to form C&I forecasts. Firstly, the report does not provide a breakdown by sector of arisings of commercial wastes. Secondly, the report does not provide exact figures regarding both the arisings and management of industrial wastes.
2.6 Reviewing the Energy Technologies Institute Commercial and Industrial Waste Study
The Energy Technologies Institute (ETI) is a public-private partnership between global industries – BP, Caterpillar, EDF, E.ON, Rolls-Royce and Shell – and the UK Government. Public sector representation is through the Department for Business Innovation and Skills (BIS), the Technology Strategy Board (TSB), the Engineering and Physical Sciences Research Council (EPSRC) and the Department of Energy and Climate Change (DECC). As a public-private partnership the ETI brings together the collective knowledge, expertise and experience of its diverse members to address future energy challenges - accelerating the development of affordable, clean, secure technologies needed to help the UK meet its’ legally binding 2050 targets.
The ETI commissioned the Energy from Waste Flexible Research Project in September 2009 to undertake a review of UK waste arisings. It assessed energy from waste technologies for the whole energy value chain from waste input to power and / or heat output, in order to identify technologies suitable for development and demonstration opportunities. This study was used, in combination with in-house analysis and other external work, to inform the objectives of the ETI’s Waste Gasification project, launched in April 2013. This project seeks to design and demonstrate an integrated waste gasification system with >25% net electrical efficiency and 80% availability at the 5-20 MWe commercial scale.
The ETI study addressed the precise knowledge gap identified in this report; it developed a set of arisings and fuel potential data which was robust enough to support development of facilities as part of the Waste gasification project, by confirming feedstock markets. It is an example of how advanced modelling can compensate for the uncertainty inherent in the baseline.
The arisings study part of the project was conducted by AEA Technology (now Ricardo-AEA, part of Ricardo Group) in 2008 with the overall aim to estimate the amount and type of residual waste arising from the C&I and LACMSW streams combined with data on actual and planned infrastructure to show the potential waste fuel fraction available over time.

CIWM Report 2013
13 Ref: Ricardo-AEA/R/ED58810/Issue Number 4
2.6.1 Methodology
The project looked at residual waste tonnages and compositions from the C&I and LACMSW streams for each waste disposal authority region in the UK. The tonnage of each fraction was summed to provide an overall residual waste arising and residual waste arising in each region.
Capacity data (both current and planned) for each region was then entered into to the Combined Residual Waste Model. This allowed the expected amount of residual waste arising to be matched to existing and planned capacity thus identifying available residual waste (and associated fuel potential).
The capacity data was entered according to the type of residual waste process – thermal treatment processes (incineration, gasification) and intermediate treatment processes (MBT/MHT). A further calculation estimated the amount of Refuse Derived Fuel (RDF) likely to be produced from the intermediate treatments. Some RDF was already known to have a market secured within the region at one of the identified thermal treatment plant, but any unmatched RDF becomes available as a potential fuel. Thermal capacity taken up by the RDF was also subtracted from the available capacity to give a more complete picture of residual waste treatment capacity.
The final step was to combine the compositional data of the remaining residual waste with information on the Calorific Value of each of the waste fractions. The overall output of the model was an estimate of the amount and type of residual waste arising from the C&I and LACMSW streams (taken from the initial waste flow models) combined with data on actual and planned infrastructure to show the potential waste fuel fraction available over time.
Figure 1 taken from the report presents an overview of the modelling approach for the Combined Residual Waste Model described above.
Figure 1: Overview of the combined residual waste model for the UK
Residual MSW
from MSW model
Calculate
total residual
by fraction
Residual C&I
from C&I modelEnter existing
and planned
capacities
Elemental
Composition
data
Available
residual
wasteCalculate
net CV
Available fuel
CV basis
Enter identified
RDF markets
Define RDF
production rates
by MBT type
Subtract
identified
RDF capacities
from EfW
Available
MBT capacity
Available
EfW capacity
Calculate
residual at
planned MBT
Calculate
residual
at planned
EfW
Total available
residual
by fraction
Calculate
available
RDF
Available
RDF

CIWM Report 2013
14 Ref: Ricardo-AEA/R/ED58810/Issue Number 4
2.7 Key Findings – the State of Existing C&I Data
From the above summaries, it can be seen that the various publically available datasets reflect a number of common issues which present uncertainty for any subsequent analysis. The key issues with the existing surveys are:
Figure 2: Factors contributing to the paucity of available C&I data
Due to the multiple factors affecting the quality of data, C&I surveys can often be:
Inaccurate;
Unrepresentative;
Inappropriate;
Unreliable;
Biased; and,
Unrealistic.
In this context of significant data uncertainty, any modelling exercise and projection based on existing datasets should be heavily caveated. Without a common and thorough approach to gathering data, extreme caution must be applied in drawing any clear conclusions about current and future feedstocks and their potential fates.
The following chapter attempts to reconcile some of the uncertainties in a set of commercial and industrial waste arisings projections.
Unreliable C&I waste
data
Sampling size and strategy:
issues of representation, accuracy and
appropriateness
Survey timing and context:
issues of compounding
economic factors
Sector definition and relevance:
issues of bias and double counting
Cumulative and compounding assumptions:
issues of reliability and sensitivity
CIWM Report 2013
15 Ref: Ricardo-AEA/R/ED58810/Issue Number 4
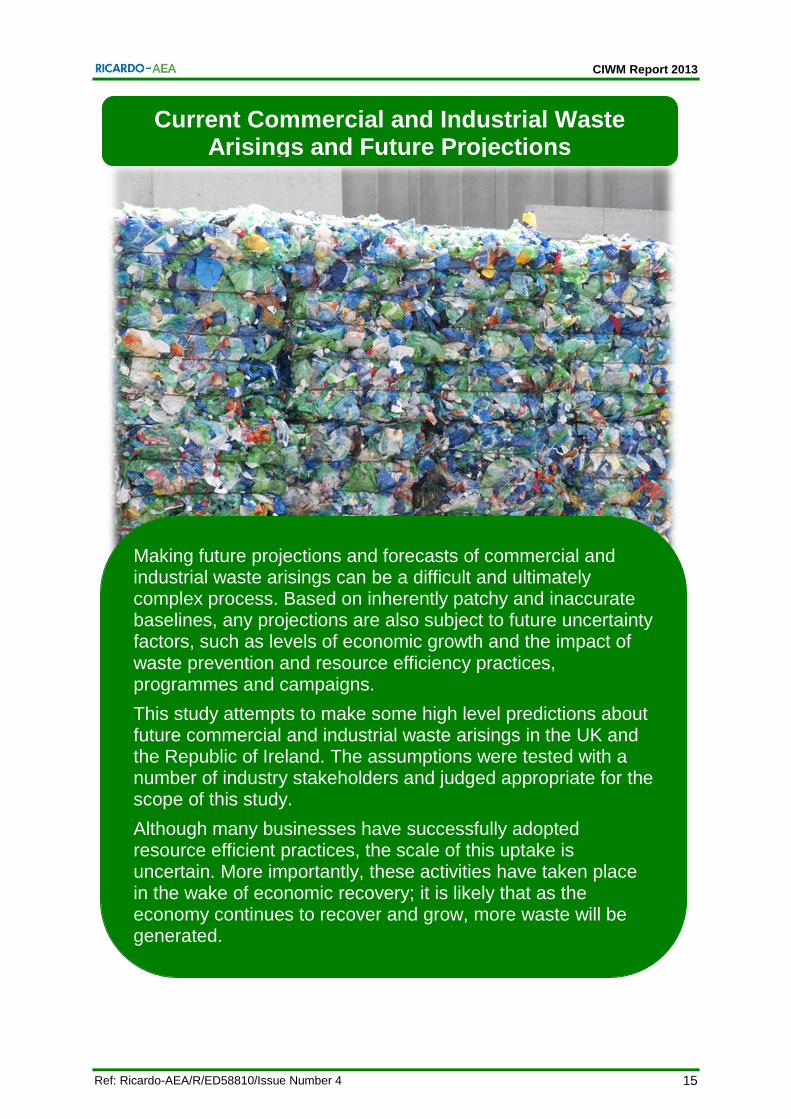
Current Commercial and Industrial Waste Arisings and Future Projections
Making future projections and forecasts of commercial and industrial waste arisings can be a difficult and ultimately complex process. Based on inherently patchy and inaccurate baselines, any projections are also subject to future uncertainty factors, such as levels of economic growth and the impact of waste prevention and resource efficiency practices, programmes and campaigns.
This study attempts to make some high level predictions about future commercial and industrial waste arisings in the UK and the Republic of Ireland. The assumptions were tested with a number of industry stakeholders and judged appropriate for the scope of this study.
Although many businesses have successfully adopted resource efficient practices, the scale of this uptake is uncertain. More importantly, these activities have taken place in the wake of economic recovery; it is likely that as the economy continues to recover and grow, more waste will be generated.
CIWM Report 2013
16 Ref: Ricardo-AEA/R/ED58810/Issue Number 4
3 Current Commercial and Industrial Waste Arisings and Future Projections
Predicting future waste generation is an inexact science. There is a vast array of compounding factors which influence the strength of assumptions and future projections. These can be overcome with sensitivity analysis and the comparison to similar analyses and datasets to identify key discrepancies. The key caveats associated with projecting C&I waste are listed below. Overall, the results should be treated with caution due to some inherent uncertainties in the data used, and the assumptions made to generate the projections.
•Quality of analysis is predicated on the quality of the underpinning data. The uncertainties inherent to the studies described in Section 2 will permeate through the analysis and will need to be accounted for.
Data quality
•The economic downturn, from circa 2008, has had a severe depleting influence on C&I waste generation due to the closure of many businesses and the decreased production levels of others. This had the impact of creating an artificial temporary“dip” in historic waste generation.
• It is impossible to separate this effect out from the impact of resource efficient business practices inthe long term and waste minimisation. It is also difficult to predict when the recovery surge will end leaving only incremental growth. Furthermore, some of the recent trends can be attributed to businesses, especially SMEs needing to be leaner to survive.
Economic context
•Although many businesses have adopted policies and practices for waste minimisation, the extent of this commitment is not reported and its overall impact on waste generation is largely impossible to track, especially in the context of economic recovery.
Waste prevention and minimisation activities on-site
•This study has based waste generation projections on the rates of employment change. Although employment growth rate is often used as a proxy for waste generation growth rate, it carries a number of caveats.
•Firstly, employment change forecasts are themselves based on a range of assumptions and can be impacted by changes in the economic climate. The economic downturn has had a significant impact on the level of employment over the last five years . Therefore projections will be accompanied with a certain degree of uncertainty, due to the absence of linear growth.
•Secondly, although employment trends are a good indicator of the direction and magnitude of growth, this will vary for different sectors of production. Using employment change implies that waste generation varies on a per capita basis i.e. more workers produce more waste. This will not, however, be the case for some automated manufacturing sectors, where units of production will dictate waste growth. In the absence of clear productivity forecasts, employment has been used as the closest proxy indicator of sector growth. However, the results should be treated with caution.
Employment as an indicator of growth rate
•Within the source data, both waste surveys and employment forecasts, there are significant discrepancies in the ways business sectors are defined and reported. The methodological note in Appendix 1 summarises the assumptions made in relating sectors to each other, accounting for some sectors within others and consolidating the data. This has been done to avoid double counting as far as possible.
Sector definitions

CIWM Report 2013
17 Ref: Ricardo-AEA/R/ED58810/Issue Number 4
3.1 England
3.1.1 C&I waste managed
Although the data in the Waste Data Interrogator is detailed, there are a few limitations that should be considered. The type of waste accepted by sites is reported in the Interrogator using the Substance Oriented Classification (SOC) and European Waste Catalogue (EWC)25. Neither of these systems have a separate code for LACMSW therefore the Interrogator cannot be used to accurately quantify the amount of LACMSW managed at these sites. To address this, the amount of LACMSW managed at sites in England has been taken from WasteDataFlow. This has then been deducted from the total waste managed by sites, by type, in England to ensure that the LACMSW fraction has been discounted.
It should also be noted that waste may be managed at more than one site. For example, mixed waste might be accepted by a transfer station, sorted and then be transported to a recycling facility or for final recovery or disposal. For this reason, waste managed is not analogous to waste arisings and no direct comparison can be made. For the purpose of this report, duplication has been removed as much as possible by looking at the fate of waste leaving permitted sites (where it is reported) and deducting this from the tonnage of waste they accepted. As the quality and quantity of data on waste leaving sites is less that that received, i.e. not all operators provide detailed information, it is likely that not all waste that passes through one site to another is captured and therefore the overall waste managed figure is likely to be an overestimation.
Table 4 shows the results of this analysis. It should be noted that this includes construction and demolition waste as site returns do not require operators to report the source of waste they accept. For the purpose of this report it is reasonable to exclude ‘SOC Chapter 12’ wastes – mineral wastes, as these are unlikely to be generated by commerce or industry. When these wastes are removed, the data suggests that approximately 47,785,000 tonnes of C&I type waste was managed by permitted sites in 2011. This is broadly similar to the estimates of waste arisings in the same year and the fact that it is slightly higher is to be expected given that not all double counting can be excluded from the data.
25
Environment Agency, 2005, ‘New Reporting Categories for 2005’, details on SOC and EWC, available form http://www.environment-agency.gov.uk/research/library/data/34203.aspx

CIWM Report 2013
18 Ref: Ricardo-AEA/R/ED58810/Issue Number 4
Table 4: C&I waste managed at permitted waste management sites in England, 2011, (tonnes)
Waste Type
Fate
01
-Ch
em
ica
l
co
mp
ou
nd
wa
ste
s
02
-Ch
em
ica
l
pre
pa
rati
on
wa
ste
s
03
-Oth
er
ch
em
ica
l
wa
ste
s
05
-Hea
lth
ca
re
an
d
bio
log
ica
l
wa
ste
s
06
-Me
tall
ic
wa
ste
s
07
-No
n-
me
tall
ic
wa
ste
s
08
-Dis
ca
rde
d
eq
uip
me
nt
09
-An
imal
an
d
ve
ge
tab
le
wa
ste
s
10
-Mix
ed
wa
ste
**
11
-Co
mm
on
slu
dg
es
13
-So
lid
ifie
d,
sta
bil
ise
d o
r
vit
rifi
ed
wa
ste
To
tal
Incineration (unspecified waste)
1,606,222
Landfill 76,481 17,327 (244,588) 98,580 4,332 130,131 4,285 181,427 10,607,740 23,776 98,997 10,998,486
Disposal in or on land - - (5,482) - (20) 2,976 - 95,585 271 2,736 - 96,066
Recycled/recovered by transfer stations
103,150 64,980 98,321 2,843 543,953 2,395,549 239,954 1,614,005 3,464,399 140,382 (2,452) 8,665,083
Recycled/recovered by metal recycling sites
4,759 255 (472) 119 13,350,519 84,925 1,430,659 33 5,658 (32) - 14,876,422
Recycled/recovered by Treatment sites
435,967 82,358 4,100,712 43,187 183,459 2,704,831 437,189 4,247,333 (5,541,057) 4,935,634 (101,392) 11,528,221
Recycled/recovered through 'Use of Waste'
- 17 40 - 2,265 - - 9 12,649 - - 14,980
Total 620,356 164,936 3,948,530 144,728 14,084,508 5,318,412 2,112,086 6,138,393 8,549,660 5,102,497 (4,847) 47,785,482
* MSW (C&I remainder) sent directly to incineration has been deducted from this figure. ** MSW (C&I remainder) sent directly to landfill has been deducted the landfill figure, MSW sent to 'other disposal routes' has been deducted from the transfer station figure, MSW sent to composing, recycling and re-use has been deducted from the treatment figure. Source: Waste Data Interrogator 2011, Environment Agency
CIWM Report 2013
19 Ref: Ricardo-AEA/R/ED58810/Issue Number 4
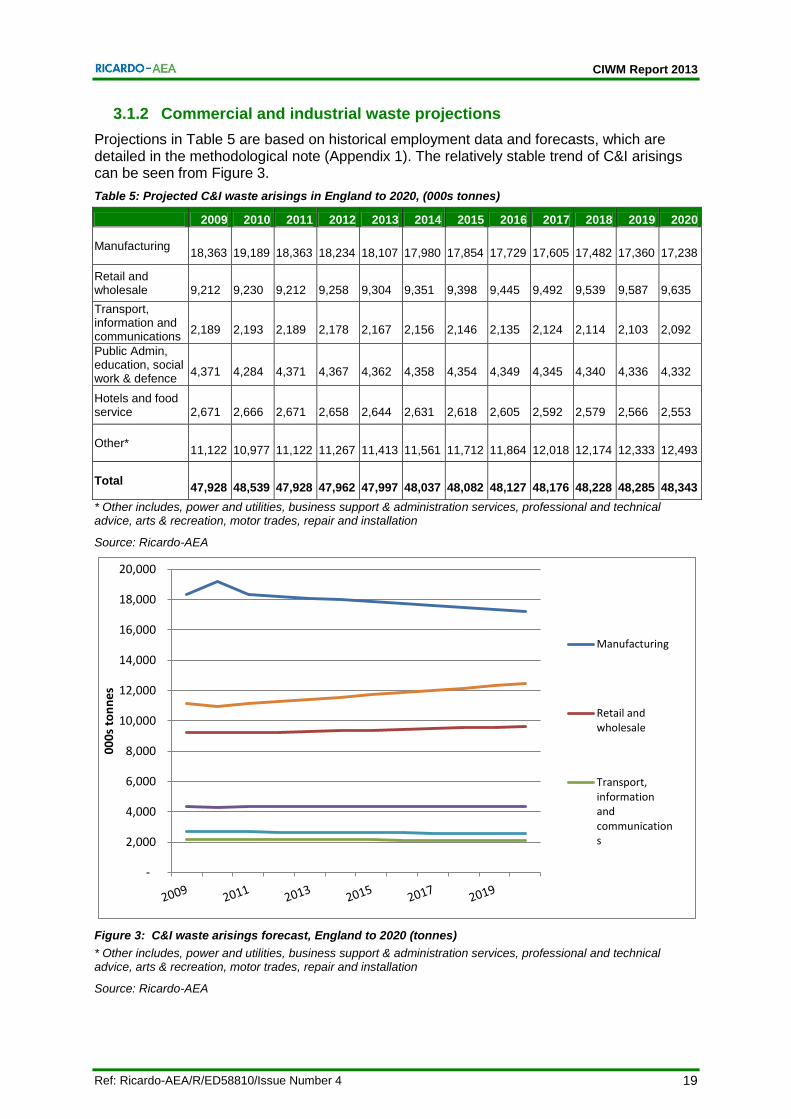
3.1.2 Commercial and industrial waste projections
Projections in Table 5 are based on historical employment data and forecasts, which are detailed in the methodological note (Appendix 1). The relatively stable trend of C&I arisings can be seen from Figure 3.
Table 5: Projected C&I waste arisings in England to 2020, (000s tonnes)
2009 2010 2011 2012 2013 2014 2015 2016 2017 2018 2019 2020
Manufacturing 18,363
19,189
18,363
18,234
18,107
17,980
17,854
17,729
17,605
17,482
17,360
17,238
Retail and wholesale
9,212
9,230
9,212
9,258
9,304
9,351
9,398
9,445
9,492
9,539
9,587
9,635
Transport, information and communications
2,189
2,193
2,189
2,178
2,167
2,156
2,146
2,135
2,124
2,114
2,103
2,092
Public Admin, education, social work & defence
4,371
4,284
4,371
4,367
4,362
4,358
4,354
4,349
4,345
4,340
4,336
4,332
Hotels and food service
2,671
2,666
2,671
2,658
2,644
2,631
2,618
2,605
2,592
2,579
2,566
2,553
Other* 11,122
10,977
11,122
11,267
11,413
11,561
11,712
11,864
12,018
12,174
12,333
12,493
Total 47,928
48,539
47,928
47,962
47,997
48,037
48,082
48,127
48,176
48,228
48,285
48,343
* Other includes, power and utilities, business support & administration services, professional and technical advice, arts & recreation, motor trades, repair and installation
Source: Ricardo-AEA
Figure 3: C&I waste arisings forecast, England to 2020 (tonnes)
* Other includes, power and utilities, business support & administration services, professional and technical advice, arts & recreation, motor trades, repair and installation
Source: Ricardo-AEA
-
2,000
4,000
6,000
8,000
10,000
12,000
14,000
16,000
18,000
20,000
00
0s
ton
ne
s
Manufacturing
Retail andwholesale
Transport,informationandcommunications

CIWM Report 2013
20 Ref: Ricardo-AEA/R/ED58810/Issue Number 4
3.1.3 Discussion
The projections show a small reduction in the quantity of C&I waste generated between 2010 and 2011 as a result of the changes in employment forecasts in this year attributable in the main to a reduction in employment in the manufacturing sector. Waste generated by the manufacturing sector continues to decline but increases in employment in retail and wholesale and sectors classed as ‘other’ results in a small increase in the tonnage of C&I waste arising year on year although the rise is less than 1% per annum.
Commentary from some ESA members suggests that in fact waste operators have witnessed reducing waste volumes over the last 3-4 years. Whether this is a residual impact of the financial downturn, the implementation of resource efficiency or simply a reflection of volume shift between market operators, cannot be ascertained from existing data. Modelling based on existing baselines cannot reflect this as the baselines themselves are uncertain. When reviewing the projections with key stakeholders, it was confirmed that slow incremental growth in C&I waste should be expected, as modelled, and is the most likely future scenario.
It should be noted that this forecast is a high level estimate and does not take into account any significant effect of waste prevention measures, increasing resource efficiency and the drive towards a circular economy on the waste produced per employee.
3.2 Wales
3.2.1 Commercial and industrial waste projections
This section presents the C&I waste projections for Wales. Two projections are included:
a projection based on long term employment forecasts to 2050, using the 2007 survey of C&I waste arisings in Wales baseline data;
a projection combining baseline waste arisings, employment forecasts and a 1.5% reduction per annum, in accordance with the Wales Waste Strategy26, which envisages this waste reduction across all sectors to achieve One Wales: One Planet goal levels by 2050. This translates annual waste prevention targets of -1.2% for commercial waste and around -1.4% for industrial waste, but a the overall target was used for these projections for simplicity.
The projection for commercial and industrial waste arisings in Wales is based on employment figures. To project a waste arisings figure onto future workplace employment by industry sector, baseline waste arisings data for 2007 was used to calculate a waste arisings figure per employee (tonnes).
The Working Futures report27 published in 2012 projects long term employment change in Wales to vary from – 4.0% in the manufacturing sector, to + 0.8% in hotel and food services, retail and wholesale, transport and communications.
Applying these growth rates to the 2007 baseline waste data produces the results detailed in Table 6. The totals represent the employment only forecast (Projection 1) and the forecast with the 1.5% annual waste prevention target applied (Projection 2). The two decreasing waste trends are presented in Figure 4. For the remainder of this study, Projection 2 (waste prevention target) is used to calculate total C&I waste arisings.
26
Welsh Government, 2009, Sector plans available from http://wales.gov.uk/topics/environmentcountryside/epq/waste_recycling/bysector/?lang=en 27
Working Futures 2010-2020, August 2012, available from http://www.ukces.org.uk/publications/er41-working-futures-2010-2020

CIWM Report 2013
21 Ref: Ricardo-AEA/R/ED58810/Issue Number 4
Table 6: Projected C&I waste arisings in Wales to 2020, (000s tonnes)28
Sector 2007 2008 2009 2010 2011 2012 2013 2014 2015 2016 2017 2018 2019 2020
Manufacturing 1881 1795 1712 1633 1542 1480 1421 1364 1310 1257 1207 1159 1112 1068
Power and utilities 15 15 14 14 51 52 52 52 53 53 53 54 54 55
Hotels and food services
315 321 326 332 290 292 294 297 299 301 304 306 309 311
Retail and wholesale
649 660 671 683 523 527 531 536 540 544 549 553 557 562
Public admin and social work
107 109 111 112 100 100 100 100 100 100 100 100 100 100
Education 138 141 143 145 135 135 135 135 135 135 134 134 134 134
Transport and communications
129 131 134 136 143 144 145 147 148 149 150 151 153 154
Financial services and real estate
18 18 18 18 4 4 4 5 5 5 5 5 5 5
Human health and social work
48 49 49 50 52 52 52 52 52 52 52 52 52 52
Other services 272 277 281 285 666 674 681 688 696 704 711 719 727 735
Projection 1 Total
3573 3514 3460 3409 3507 3461 3417 3375 3336 3299 3265 3233 3202 3174
Projection 2 Total
3573 3461 3356 3258 3301 3209 3120 3036 2956 2880 2807 2737 2671 2608
Figure 4: C&I waste arisings forecast for Wales to 2020 (000s tonnes)
28
Survey data from Wales illustrates the challenge of non-uniform sector definitions across studies. The significant rise in Other Services waste in 2011 is parallel to the fall in waste from Retail and Wholesale and Hotel and Food Services, as well as other sector shifts. This is likely to be due to a redefinition of sectors, as the overall total waste arising does not change significantly
0
500
1000
1500
2000
2500
3000
3500
4000
00
0s
ton
ne
s Projection 1
Projection 2
Welsh Governmentprojections

CIWM Report 2013
22 Ref: Ricardo-AEA/R/ED58810/Issue Number 4
3.3 Scotland
Waste projections for Scotland have also been based on employment forecasts. Economic data for Scotland have been gathered from two main sources:
The Office for National Statistics (ONS)29 for historic and current employment level;
Scottish ITEM Club30 for forecasted employment levels per sector up to 2016; and
Working Futures Report (2012)31 on employment projections to 2020.
The statistics and factors used are detailed in the methodological note found in Appendix 1.
3.3.1 Commercial and industrial waste projections
The Working Futures report estimated the average rate of change in employment for each relevant sector, with an average increase on 0.2% annually. This rate has been applied to the corresponding simplified waste arisings projections in order to predict the change in quantity of waste produced (in tonnes) between 2010 and 2020. The results are presented in Table 7. It can be seen from Figure 5 that the projected trend in Scotland is very stable with minor changes predicted to 2020. It should be noted that with no prescriptive waste prevention targets in Scotland, the impact of potential prevention and minimisation has not been modelled.
Table 7: Projected C&I waste arisings in Scotland to 2020, (000s tonnes)
Sector 2004 2006 2010 2011 2012 2013 2014 2015 2016 2017 2018 2019 2020
Other* 1,487 1,170 964 972 980 988 996 1,004 1,012 1,020 1,028 1,036 1,044
Education 665 311 301 300 300 299 298 298 297 297 296 295 295
Finance & real estate
124 77 71 72 72 73 74 74 75 75 76 77 77
Hotels and food service
1,216 592 685 688 691 693 696 699 702 704 707 710 713
Health 461 520 409 408 407 406 406 405 404 403 402 402 401
Transport, information and communication
219 187 323 324 325 327 328 329 331 332 333 335 336
Public admin, social work and defence
0 258 167 167 167 166 166 166 165 165 165 164 164
Retail and wholesale
1,640 1,672 1,781 1,796 1,810 1,825 1,839 1,854 1,869 1,884 1,899 1,914 1,929
Manufacturing 2,003 1,918 1,381 1,360 1,340 1,320 1,300 1,281 1,261 1,243 1,224 1,206 1,187
Power and utilities 540 647 246 243 240 237 234 231 228 225 222 219 216
Agriculture and forestry
0 18 21 20 20 20 20 19 19 19 19 18 18
TOTAL 8,357 7,370 6,350 6,350 6,352 6,353 6,356 6,359 6,362 6,366 6,370 6,375 6,381
(*) Other including business support & administration services, Professional and technical advice, arts & recreation, motor trades, repair and installation
29
ONS regional reports, Scotland, available from http://www.ons.gov.uk/ons/regional-statistics/region.html?region=Scotland 30
Ernst & Young, 2013, Scottish ITEM club forecasting, available from http://www.ey.com/UK/en/Issues/Business-environment/Financial-markets-and-economy/ITEM-Club-Scotland 31
Working Futures 2010-2020, August 2012, available from http://www.ukces.org.uk/publications/er41-working-futures-2010-2020
http://www.ey.com/UK/en/Issues/Business-environment/Financial-markets-and-economy/ITEM-Club-Scotland

CIWM Report 2013
23 Ref: Ricardo-AEA/R/ED58810/Issue Number 4
Figure 5: C&I waste arisings forecast, Scotland to 2020 (000s tonnes)
It is not known how the Waste (Scotland) Regulations 201232 and the push towards meeting the ambitions of Scotland’s Zero Waste Plan33 will affect the quantity of commercial and industrial waste produced. It is understood that SEPA and ZWS have an internal estimate of likely waste prevention that will be seen in the C&I sectors, however this is not published and is used as an internal figure only.
Although neither the regulations nor the Zero Waste Plan prescribe a waste prevention or waste reduction target for C&I waste, there is a considerable drive to improve business resource efficiency. This can be seen by the new Resource Efficient Scotland Programme34 being delivered by Zero Waste Scotland.
There is also likely to be a decrease in total waste arisings as a result of the requirement on businesses to separate materials for recycling. This will be due to a desire to reduce any increase in waste collection costs as a result of the regulations and also due to a greater understanding of how much waste is being produced and of what nature.
There are some difficulties in determining an appropriate sector split to use for the different data set because of the lack of consistency between years, reports and regions. All appear to report in a different manner, grouping different sectors together for reporting.
3.4 Northern Ireland
3.4.1 Commercial and industrial waste arising
The Northern Ireland C&I waste projections have been based on two separate employment growth forecasts for the region:
1. Oxford Economics (OE): ‘Forecasting Future Skill Needs in Northern Ireland’35. This report presents two scenarios. The first is a high employment growth scenario, which sees Northern Ireland’s economic growth targets met by growing sectors, specifically power and utilities. This is presented as Projection A in this report.
32
Waste (Scotland) Regulations 2012, available from http://www.sepa.org.uk/waste/moving_towards_zero_waste/zero_waste_regulations.aspx 33
Scotland's Zero Waste Plan 2011, available from http://www.scotland.gov.uk/Resource/Doc/314168/0099749.pdf 34
Resource Efficient Scotland Programme, 2013, details available from http://www.scotland.gov.uk/Topics/Business-Industry/Energy/Action/energy-efficiency-policy/ResourceEfficientScotland 35
Forecasting Future Skill Needs in Northern Ireland (2009) Oxford Economics - Department for Employment and Learning [online]. Available from: http://www.delni.gov.uk/index/publications/r-and-s-stats/skills-reports/forecastingfutureskills.htm [Accessed 29 July 2013].
6,000
6,050
6,100
6,150
6,200
6,250
6,300
6,350
6,400
6,450
6,5000
00
s to
nn
es

CIWM Report 2013
24 Ref: Ricardo-AEA/R/ED58810/Issue Number 4
The second is a baseline scenario which predicts short term employment falling and a gradual growth thereafter. This rate of change is reflected in Projection B.
2. European Commission (EC): ‘The 2012 Ageing Report36’. An alternative approach to growth projections, which creates waste generation Projection C. Details can be found in the methodological Appendix 1.
Waste per employee tonnages have been calculated for the following sectors groupings:
power and utilities (excluding the waste management sector);
manufacturing; and,
wholesale and retail trade, restaurants, business services, public administration and other services.
Using these figures, high, medium and low rates of growth based on the three projections have been applied to the C&I waste baseline provided by the Capita Symonds 2008 ‘Northern Ireland C&I Report’37. Table 8 presents the results.
Although the UK growth factors provided in the EC’s Ageing Report (Projection C) offer a useful basis for comparison, Projections A and B provided in the Oxford Economics report are likely to be a more reliable foundation for the forecast. The two primary reasons for this are that the UK economy is not reflective of that in NI, which has consistently been one of the poorest performing regions in the country, and that the forecast provided by OE is sector specific, whereas the EC report provides an overall growth estimation.
Projection B is judged to be the most representative, as it uses sensible employment forecasts, not driven by targets. Projection B will be used in the overall calculations; it represents a very stable C&I trend, as can be seen from Figure 6.
Table 8: Projected C&I waste arisings in Northern Ireland to 2020, (tonnes)
2011 2012 2013 2014 2015 2016 2017 2018 2019 2020
Pro
jec
tio
n
A -
Hig
h
Power & Utilities
89,751 90,059 90,367 90,675 90,983 91,290 91,598 91,906 92,214 92,522
Manufacturing 69,368 68,742 68,117 67,491 66,866 66,240 65,614 64,989 64,363 63,738
Other* 418,825 419,371 419,917 420,463 421,009 421,555 422,101 422,647 423,193 423,739
Pro
jec
tio
n
B-
Cen
tral Power &
Utilities 89,751 90,059 90,367 90,675 90,983 91,290 91,598 91,906 92,214 92,522
Manufacturing 69,368 68,591 67,815 67,039 66,263 65,486 64,710 63,934 63,157 62,381
Other* 418,825 419,237 419,648 420,060 420,471 420,883 421,295 421,706 422,118 422,529
Pro
jec
tio
n C
-
UK
Nati
on
al Power &
Utilities 89,751 90,124 90,497 90,869 91,242 91,491 91,739 91,988 92,237 92,486
Manufacturing 69,368 69,656 69,944 70,232 70,520 70,712 70,904 71,096 71,289 71,481
Other* 418,825 420,564 422,302 424,041 425,780 426,941 428,102 429,262 430,423 431,584
To
tal
Projection A
577,944 578,172 578,401 578,629 578,857 579,085 579,313 579,542 579,770 579,998
Projection B
577,944 577,887 577,830 577,773 577,717 577,660 577,603 577,546 577,489 577,432
Projection C
577,944 580,343 582,743 585,142 587,542 589,143 590,745 592,347 593,949 595,550
(*) Other - Wholesale and retail trade, restaurants, business services, public administration and other services
36
EC Ageing Report, 2012, available from http://ec.europa.eu/economy_finance/publications/european_economy/2012/pdf/ee-2012-2_en.pdf 37
Capita Symonds, 2008, ‘Northern Ireland C&I Report’, available from http://www.doeni.gov.uk/niea/niea_2008_c_i_report.pdf

CIWM Report 2013
25 Ref: Ricardo-AEA/R/ED58810/Issue Number 4
Figure 6: C&I waste arisings forecast, Northern Ireland to 2020 (tonnes)
Looking in detail at the individual sector groupings, there is a predicted a downturn in the numbers employed in the manufacturing industry in Northern Ireland over the course of this decade. This has a noticeable impact on the arisings of waste projected from this sector. However if this reduced labour force occurs due to the automation of industry, rather than a fall in production, this may prove an overestimation. The projection for the Services sector grouping has provided the most consistent output, with all economic estimations showing an increase in this waste stream.
3.5 Republic of Ireland
The C&I waste forecast for the Republic of Ireland (RoI) has been based on projected changes in labour force up to 2035 (see methodological note in Appendix 1). Using the following baseline data, tonnages of C&I waste have been calculated per employee.
Industrial: Calculated by dividing the estimated total industrial waste tonnage arisings in 2012 by the industrial employment statistics for the RoI, between April and June, 201238.
Commercial: Calculated by dividing the estimated total commercial waste tonnage arisings in 2011 by commercial employment statistics for the RoI, between April and June, 2011.
As the Central Statistics Office and the Environmental Protection Agency apply differing sector divisions, it has been necessary to consolidate these in to a standardised sector list, in line with the other countries within this report (see Appendix 1).
Per sector waste tonnages have then been multiplied by the anticipated economic growth factors for 2013, 2014 and 2015, as stated by the Nevin Economic Research Institute (NERI)39. Between 2015 and 2020 waste tonnages have been scaled to the estimated labour force growth factors provided by the European Commission in ‘The 2012 Ageing Report’40.
38
Central Statistics Office (2013) Employment and Unemployment (ILO) '000s [online]. Available from: http://www.cso.ie/en/statistics/labourmarket/principalstatistics/ [Accessed 18 August 2013]. 39
The Nevin Economic Research Institute (2013) Quarterly Economic Observer, available from http://www.nerinstitute.net/research/quarterly-economic-observer-spring-2013/ 40
European Commission (2012) The 2012 Ageing Report – Economic and budgetary projections for the 27 EU Member States (2010 – 2060) [online]. Available from: http://ec.europa.eu/economy_finance/publications/european_economy/2012/pdf/ee-2012-2_en.pdf [Accessed 19 August 2013].
565,000
570,000
575,000
580,000
585,000
590,000
595,000
600,000
20
11
20
12
20
13
20
14
20
15
20
16
20
17
20
18
20
19
20
20
Ton
ne
s
Projection A - High
Projection B - Central
Projection C - UKNational

CIWM Report 2013
26 Ref: Ricardo-AEA/R/ED58810/Issue Number 4
The results of the modelling show a fairly stable waste generation, as can be seen from Table 9.
Table 9: Projected C&I waste arisings in the Republic of Ireland to 2020, (tonnes)
Sector 2012 2013 2014 2015 2016 2017 2018 2019 2020
Manufacturing 2,641,691 2,625,841 2,625,841 2,628,466 2,636,352 2,644,237 2,652,123 2,660,008 2,667,893
Agriculture & forestry
59,584 59,227 59,227 59,286 59,464 59,642 59,820 59,998 60,175
Retail and wholesale
190,851 189,706 189,706 189,895 190,465 191,035 191,604 192,174 192,744
Power and utilities 191,558 190,409 190,409 190,599 191,171 191,743 192,315 192,886 193,458
Education 101,578 100,969 100,969 101,070 101,373 101,676 101,980 102,283 102,586
Health 169,158 168,143 168,143 168,312 168,817 169,321 169,826 170,331 170,836
Financial & Real Estate
73,073 72,634 72,634 72,707 72,925 73,143 73,361 73,579 73,797
Transport , information and communications
120,698 119,974 119,974 120,094 120,454 120,815 121,175 121,535 121,895
Public Admin, social work & Defence
68,901 68,488 68,488 68,556 68,762 68,967 69,173 69,379 69,584
Hotels and food service
79,539 79,061 79,061 79,140 79,378 79,615 79,853 80,090 80,327
Other* 188,990 187,856 187,856 188,044 188,608 189,172 189,736 190,300 190,864
Total 3,885,621 3,862,307 3,862,307 3,866,169 3,877,768 3,889,366 3,900,965 3,912,563 3,924,162
(*)’Other’ includes business support & administration services, professional and technical advice, arts & recreation, motor trades, repair and installation
Figure 7: C&I waste arisings forecast, Republic of Ireland to 2020 (tonnes)
Waste arisings in all sectors have been forecast to follow the trend set by the employment projections; with a small contraction in the short-term, followed by a gradual growth past 2015, as can be seen from Figure 7.
Industrial wastes outweigh commercial arisings, with the difference between the two projected to increase from 4,694,615 tonnes in 2012, to 4,741,181 tonnes in 2020. This is largely due to the contributions made by the manufacturing sector, estimated to remain above 4,000,000 tonnes per annum throughout the decade.
3,750,000
3,800,000
3,850,000
3,900,000
3,950,000
4,000,000
Ton
ne
s

CIWM Report 2013
27 Ref: Ricardo-AEA/R/ED58810/Issue Number 4
3.6 Key Findings
The projections for all five countries show a moderately stable commercial and industrial waste generation level, with an overall fall of circa 0.2%. Some projections, like those used for Northern Ireland, report a likely drop in waste. All regions show a reduction in manufacturing waste; although this is caveated with employment not being the most appropriate trend indicator for manufacturing, it reflects the trend towards more resource efficient production and the overall contraction of employment in the sector.
The future treatment options for commercial and industrial waste are a crucial question. To be able to divert as much waste as possible from landfill, and recover its resource and energy potential, we need to understand how much treatment capacity will be required to accommodate this vast and untapped waste stream.
• It is clear that England is generating the greatest amount of C&I waste, at a fairly stable production of circa 50 million tonnes per annum.
England
• Significant tonnages of C&I waste are produced in Wales (circa three million tonnes).
Wales
• Significant tonnages of C&I waste are also produced in Scotland (circa six million tonnes).
Scotland
• Northern Ireland is producing circa 0.5 million tonnes of C&I waste.
Northern Ireland
• About 3.8 million tonnes of C&I waste are produced in the Republic of Ireland
Republic of Ireland

CIWM Report 2013
28 Ref: Ricardo-AEA/R/ED58810/Issue Number 4
Effective planning for future infrastructure is predicated on a thorough understanding of future need for processing facilities, which in turn depends on a robust understanding of future feedstock volumes. These solid baselines are not currently available, however, a high level assessment of capacity need has been made in this chapter.
Capacity projections are based on an detailed understanding of the current waste facility pipeline and the likelihood (probability) of these facilities making from proposal through planning and licensing / permitting to fully operational.
This is another forecast which is dependent on a wide range on interconnected factors, and almost all projects will assess their own local competition and regional feedstock availability on a case by case basis before progressing too far with investment.
However, a high level assessment of pipeline national capacity for sorting, organic and thermal treatment infrastructure suggests that if no new projects came forward, significant amounts of commercial and industrial waste will end up in landfill by 2020.
Treatment Capacity Assessment

CIWM Report 2013
29 Ref: Ricardo-AEA/R/ED58810/Issue Number 4
4 Treatment Capacity Assessment
Waste management infrastructure delivery and its ability to manage the scale of arising waste has been a hotly debated topic in the waste sector over the last 18 months. Focusing predominantly on residual waste treatment capacity and whether there is sufficient need for further development, the issue has dominated the trade press and conference programmes with diametrically opposing stances often cited. There has been a feeling amongst commentators that claims of potential surplus capacity in the infrastructure delivery pipeline have shaken the confidence of investors in the waste industry’s ability to deliver plants which will operate properly and profitably. On the other hand, overestimating waste arisings and ignoring compounding factors, such as export trends and competition can leave developers in a high risk situation. Waste treatment capacity assessment is a complex and nebulous task, but any conclusions must be communicated responsibly with a full set of caveats.
This report does this by considering overall total waste arisings as opposed to purely residual waste treatment. It identifies a need for a technologically diverse infrastructure landscape for the management of C&I and other waste streams. The relative proportions and sizes of required facilities are not within the scope of this report, however total waste management need is assessed and thoroughly documented in this chapter. The initial analysis considers the treatment capacity in the UK, with section 4.6 looking separately at the Republic of Ireland.
4.1 Introduction
Towards the end of the last century, the emissions limits within the Waste Incineration Directive41 precipitated the closure of many older incinerators. Since then, the Landfill Directive42 ,which limits the amount of biodegradable municipal solid waste that can be sent to landfill and the Landfill Tax/Levy, which has increased the cost of landfilling, have been the two principal drivers behind the development of new waste management facilities in the UK. Against this policy background, new waste management facilities have been opened at a steady rate for several years.
There are several ways to determine the number of waste management facilities that are currently operational. Ricardo-AEA’s approach involves collating data from many published sources, operator websites and academic articles including data from the regulators and bodies such as WRAP. Determining their associated waste throughput is more difficult: the permitted/licensed capacity specified by the regulators can be quite different from the tonnage accepted in practice. This analysis base current capacity estimates on permitted capacities in the first instance, and reported capacities where such data exists. However, this difference should be taken into account when interpreting the results.
Predicting how much waste management infrastructure there will be in the future, and how much waste it is likely to process is significantly more difficult. Knowledge of plants that developers are intending to build is far from sufficient for predicting future waste capacities, the likelihood of a plant being funded, awarded planning permission and permitted/licensed also needs to be taken into consideration.
This section of the report discusses the current landscape of waste management infrastructure in the UK, and investigates what can be predicted about the future and the associated uncertainties. A separate Section (4.6) looks into waste treatment and reducing landfill void in the Republic of Ireland where fewer waste processing facilities are currently operational leaving less doubt about capacity need.
41
Council Directive 2000/76/EC http://eur-lex.europa.eu/LexUriServ/LexUriServ.do?uri=CELEX:32000L0076:EN:NOT 42
Council Directive 1999/21/EChttp://eur-lex.europa.eu/LexUriServ/LexUriServ.do?uri=OJ:L:1999:182:0001:0001:EN:PDF
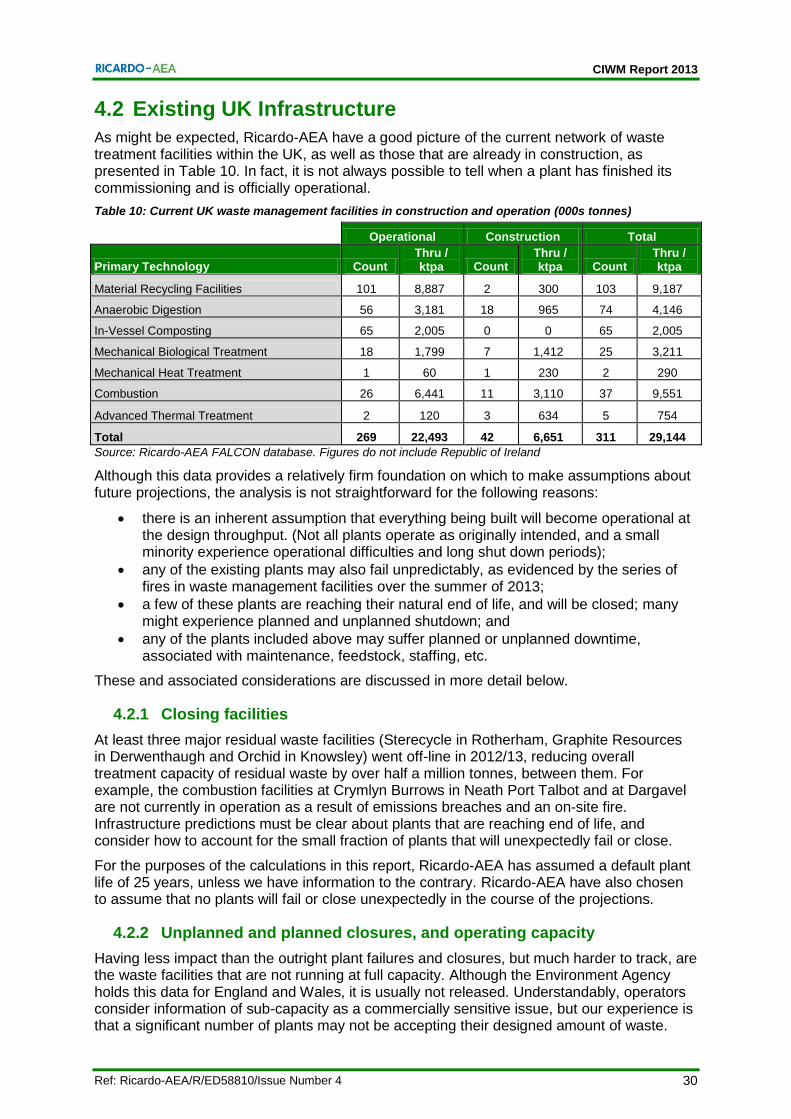
CIWM Report 2013
30 Ref: Ricardo-AEA/R/ED58810/Issue Number 4
4.2 Existing UK Infrastructure
As might be expected, Ricardo-AEA have a good picture of the current network of waste treatment facilities within the UK, as well as those that are already in construction, as presented in Table 10. In fact, it is not always possible to tell when a plant has finished its commissioning and is officially operational.
Table 10: Current UK waste management facilities in construction and operation (000s tonnes)
Operational Construction Total
Primary Technology Count Thru / ktpa Count
Thru / ktpa Count
Thru / ktpa
Material Recycling Facilities 101 8,887 2 300 103 9,187
Anaerobic Digestion 56 3,181 18 965 74 4,146
In-Vessel Composting 65 2,005 0 0 65 2,005
Mechanical Biological Treatment 18 1,799 7 1,412 25 3,211
Mechanical Heat Treatment 1 60 1 230 2 290
Combustion 26 6,441 11 3,110 37 9,551
Advanced Thermal Treatment 2 120 3 634 5 754
Total 269 22,493 42 6,651 311 29,144
Source: Ricardo-AEA FALCON database. Figures do not include Republic of Ireland
Although this data provides a relatively firm foundation on which to make assumptions about future projections, the analysis is not straightforward for the following reasons:
there is an inherent assumption that everything being built will become operational at the design throughput. (Not all plants operate as originally intended, and a small minority experience operational difficulties and long shut down periods);
any of the existing plants may also fail unpredictably, as evidenced by the series of fires in waste management facilities over the summer of 2013;
a few of these plants are reaching their natural end of life, and will be closed; many might experience planned and unplanned shutdown; and
any of the plants included above may suffer planned or unplanned downtime, associated with maintenance, feedstock, staffing, etc.
These and associated considerations are discussed in more detail below.
4.2.1 Closing facilities
At least three major residual waste facilities (Sterecycle in Rotherham, Graphite Resources in Derwenthaugh and Orchid in Knowsley) went off-line in 2012/13, reducing overall treatment capacity of residual waste by over half a million tonnes, between them. For example, the combustion facilities at Crymlyn Burrows in Neath Port Talbot and at Dargavel are not currently in operation as a result of emissions breaches and an on-site fire. Infrastructure predictions must be clear about plants that are reaching end of life, and consider how to account for the small fraction of plants that will unexpectedly fail or close.
For the purposes of the calculations in this report, Ricardo-AEA has assumed a default plant life of 25 years, unless we have information to the contrary. Ricardo-AEA have also chosen to assume that no plants will fail or close unexpectedly in the course of the projections.
4.2.2 Unplanned and planned closures, and operating capacity
Having less impact than the outright plant failures and closures, but much harder to track, are the waste facilities that are not running at full capacity. Although the Environment Agency holds this data for England and Wales, it is usually not released. Understandably, operators consider information of sub-capacity as a commercially sensitive issue, but our experience is that a significant number of plants may not be accepting their designed amount of waste.

CIWM Report 2013
31 Ref: Ricardo-AEA/R/ED58810/Issue Number 4
Some facilities are aging, while others (particularly some of the MBT plants but also the thermal plants) are receiving waste that varies in composition from what they were designed to accept. This leads to planned and unplanned down time, and operation at lower than design rates. Other facilities are struggling to secure a full feedstock palette due to uncompetitive gate fees they presume to charge; the high cost of project delivery pushed up gate fees at new facilities, however they often get undercut by small plants. Large facilities can overcome this issue due to the fixed price specified in their associated municipal contract.
It is not easy to estimate the overall effect of these inefficiencies However, to give an example, if such factors across the country led to the above list of plants operating on average at 97.5% of their capacity, the total combined plant capacity would fall by over 700 ktpa, the equivalent of two large treatment facilities.
Again, for the purposes of our calculations, Ricardo-AEA have assumed in the first instance that there will be 100% plant availability. There is evidence from the stakeholders that on average available capacity at a facility is lower than this rate (in some cases 75-85%), however applying a case by case reduction was inappropriate for the purposes of this model. As such, a 100% plant availability rate assumption has been applied at this stage of the modelling. Later sections of this chapter describe in detail how probabilities of delivery reduce the stated permitted capacity for plants not yet operational – so this has been factored into the overall predicted capacities.
4.3 New Facilities
The majority of the waste management infrastructure in the UK is relatively modern, and can be expected to operate for at least another 10 years. Similarly, modern maintenance regimes are able to pre-emptively replace wearing parts before their failure causes unforeseen breakdowns, so the issue of unplanned downtime can be largely kept under control.
With these issues being more or less predictable and relatively minor in their impact, the far more significant consideration is the construction of new facilities, and this is where underlying assumptions have greater impact.
The infrastructure in the pipeline for waste management facilities is extensive, as it can take many years to get the more contentious residual treatment facilities funded, consented, permitted/licensed and built. It is easiest to register new projects as soon as they are announced, which is typically far ahead of when planning permission is even sought. It is from this point that Ricardo-AEA tracks projects through the subsequent phases of development. At the end of August 2013, the distribution of facilities by technology and development stage was as presented in Table 11. (Waste treatment in the Republic of Ireland is addressed in section 4.6).
Table 11: Current UK (Aug ‘13) waste management facilities in all development stages
Primary Tech Operational Construction Consented Planning Proposed Total
MRF 101 2 1 1 3 108
AD 56 18 22 5 18 119
IVC 65 0 4 4 1 74
MBT 18 7 10 3 4 42
MHT 1 1 1 0 1 4
Combustion 26 11 29 3 21 90
ATT 2 3 19 2 11 37
Total 269 42 86 18 59 474
Source: Ricardo-AEA FALCON database Acronyms: MRF – Materials Recovery Facility, AD – Anaerobic Digestion, IVC – In-Vessel Composting, MBT – Mechanical Biological Treatment, MHT – Mechanical Heat Treatment, ATT – Advanced Thermal Treatment

CIWM Report 2013
32 Ref: Ricardo-AEA/R/ED58810/Issue Number 4
It is interesting to review the historical trend in this information, which Ricardo-AEA has been recording for some time. The historical data was collected on a slightly different basis (the table above records the primary technology type at each site, whereas the historical data recorded the total number of plants of a given technology, accounting for additional plants at multi-technology sites), so the numbers do not perfectly correlate to those in Table 11. Nevertheless, the trends that emerge are very clear to see, as depicted in Figure 8.
The number of operational anaerobic digestion plants in the UK is growing rapidly, with a relatively stable and healthy number of plants in the development pipeline. In contrast, almost all other technologies are seeing the numbers of projects diminish, or, at best, barely maintained levels. It is likely that the AD pipeline will also begin to diminish after most of the plants are delivered.
Figure 8: Number of UK waste plants (2011-13), by technology and status
4.3.1 The infrastructure development process
Modern waste management companies have learnt hard lessons about the need to engage the local community at the earliest stages. The risks associated with forewarning dissenters and campaign groups and enabling them to co-ordinate their opposition are always outweighed by the benefits of being seen to be engaging with the community and taking their opinions into account.
Announcing an intention to build a new facility is also an excellent means of raising awareness among financial institutions that a new investment opportunity is on the horizon. At the point of first announcement, few plants have all the funding secured that they will need.
In the early stages of the project, developers may be highly optimistic and ambitious about the performance of their potential plant, in order to attract investors. Investors are not easily convinced, however, and lack of funding remains the most frequent cause for proposed projects to fail. In reality, a significant fraction of these plants (circa 40% by Ricardo-AEA estimates) will never even submit a planning application, which is the second stage in of the Ricardo-AEA tracking process.

CIWM Report 2013
33 Ref: Ricardo-AEA/R/ED58810/Issue Number 4
There is no doubt that planning is significant challenge for developers, but recent experience and industry trends have shown that it is not the critical block that many perceived. Although the process is long and drawn-out, more experienced project teams draw up timescales that account for the likely delays. Still aspects of the planning system impose obstacles which are impossible to predict or overcome, when projects are called in or highly contested. Ricardo-AEA estimates is that almost two thirds of projects that submit a planning application do not reach consented status, whether because the planning application is rejected (on grounds of site, sizing, or ecology) or for other reasons – like a competing facility nearby opening. The most common reason for project failure is the inability to secure funding for the facility, which is often a consequence of poor data and business case .
In contrast to the planning stage, obtaining an environmental permit/licence appears to be less of a sticking point, although this is in part due to the fact that enquiries about the permit/licence often take place during the planning stage, and plants that are having insurmountable issues with their permit/licence will not proceed to the planning application stage. Anecdotal evidence suggests that there is a trend towards “speculative permissions” within the industry, where projects apply for planning and permitting without the full intention of delivery. However, these incidents are difficult to track and identify and as such have not been considered as a sensitivity in the model. For these reasons, Ricardo-AEA estimates that over 90% of plants with planning consent go on to get their environmental permits / licence.
With the planning consented and the environmental permit / licence in place, it would appear that all the necessary hurdles have been overcome, and the plant can be built. In practice, however, Ricardo-AEA data shows that a very large number of projects stall at this point. Consent has been granted and the permit is in place, but nothing happens. Projects that were regularly making news suddenly drop off the radar, and sit in the database awaiting construction to start.
Enquiries reveal that developers usually have sufficient funding to get them to this point, but then must go back to the markets to raise the necessary capital to fund construction. The on-going economic downturn has been particularly effective at trapping projects at this intermediate stage, and it can be hard to determine whether the project is still live but seeking funds, or has ceased to be a live opportunity. Often the key obstacle to securing funding is the ability to convince financial backers that there is a capacity need for the facility and that feedstock will be available in order to make a return on investment. The lack of data is a key contributor to this development barrier and is discussed further in section 6.1. Ricardo-AEA models that only 75% of projects with consent and permit go on to the construction phase, based on our analysis of market trends over the last 5 years.
As already discussed above, Ricardo-AEA assumes (slightly optimistically, and subject to a particular caveat about advanced thermal treatment plants which is discussed below) that all plants that enter the construction phase will go on to become operational.
The various percentages mentioned in the text above can be combined to give an overall assessment of the average likelihood (probability) of a facility reaching completion, given its current status. The figures involved are presented in Table 12.
Table 12: Summary of estimated likelihoods of success for waste facilities in the UK
Current Development Stage
Likelihood of Reaching Next Stage
Likelihood of Reaching Operation
Proposed 60% 15%
Planning 36% 25%
Consented 93% 70%
Permitted 75% 75%
Construction 100% 100%
Source: Ricardo-AEA

CIWM Report 2013
34 Ref: Ricardo-AEA/R/ED58810/Issue Number 4
These probabilities are used within Ricardo-AEA’s modelling assumptions and are subject to a number of caveats as described above. They are based on industry observation and analysis, but are ultimately expert opinion which has been balanced out using sensitivity testing. Overall, Ricardo-AEA assumptions tend to be conservative, placing more confidence in projects than may be deemed appropriate in practice, leaving our estimation of the deliverable pipeline potentially higher than what will be delivered in practice.
4.3.1.1 Advanced Thermal Treatment Plants
Ricardo-AEA’s database has the capability to adjust the probabilities of success of individual opportunities, based on their unique characteristics (site, history, etc.). However, in general, the above percentages are applied to all technology types, as Ricardo-AEA consider that they have relatively similar chances of success in each generic case.
The single exception currently applied to this rule is in the case of advanced thermal treatment plants, which are all downgraded in probability of success across the development cycle because of their poor track record to date. Experience has shown that issues with the preparation of the waste feedstock prior to treatment, and then clean-up of the emerging gases afterwards have repeatedly placed fatal technical and / or financial pressure on ATT projects. Additionally, strong competition from RDF export markets offering lower gate fees than available UK facilities make it challenging to build a business case for these facilities. For this reason, the probabilities assigned to these technologies are lower than their alternatives.
4.3.2 Impact of probabilities
Applying the probabilities described above to the matrix of facilities presented in Table 11 has the effect of reducing the number of facilities that are ultimately expected to reach operation, from 474 to 378 (or by 20%), as shown in Table 13.
Table 13: Total number of UK facilities and how probabilities of reaching operation reduce the numbers
Primary technology Total number Number weighted on
probability
MRF 108 104
AD 119 93
IVC 74 69
MBT 42 33
MHT 4 3
Combustion 90 61
ATT 37 15
Total 474 378
Source: Ricardo-AEA FALCON database
The same analysis can be applied to the total capacity of the plants, and the results are presented in Table 14, below. This reveals that, of the almost 54 Mt of waste facility capacity potentially to be developed in the UK, only 75% (40.6 Mt) is anticipated to reach operation.
Table 14: Current UK (Aug ‘13) Waste Capacity in All Development Stages (000s tonnes)
Primary Tech Operational Construction Consented Planning Proposed Total Weighted
on probability
MRF 8,887 300 30 130 31 9,378 9,246
AD 3,181 965 1,495 256 674 6,570 5,357
IVC 2,005 0 275 225 45 2,550 2,260
MBT 1,799 1,412 1,479 635 765 6,090 4,519
MHT 60 230 160 0 160 610 426
Combustion 6,441 3,110 8,877 1,058 3,300 22,786 16,525
ATT 120 634 2,767 155 2,232 5,908 2,265
Total 22,439 6,651 15,083 2,459 7,207 53,892 40,598
Source: Ricardo-AEA FALCON database. Figures do not include Republic of Ireland.

CIWM Report 2013
35 Ref: Ricardo-AEA/R/ED58810/Issue Number 4
4.4 “Other” Facilities
Despite the obvious complexity and implicit uncertainty in the figures presented above, there are still a number of other factors that have to be taken into consideration. While it is true that the bulk of waste will be treated in waste treatment plants built (or planned to be built) around the UK, there are two further sets of facilities that must be accounted for.
4.4.1 Co-combustion and cement kilns
Firstly, co-combustion of solid recovered fuel (SRF) in cement kilns must be considered. Cement kilns are potentially able to receive a range of wastes, including liquid wastes and tyres, as well as RDF/SRF, and have historically shown a tendency to short-term contracts in order to drive down their costs. In recent years, several cement kilns have closed or been mothballed for the time being. However, Cemex in Rugby has chosen an alternative course, work with SITA to develop an MBT plant designed to produce a fuel for the kiln.
It is also possible that Waste Incineration Directive (WID) compliant biomass plants may be permitted to take RDF, SRF or residual waste, too. Having spent the capital to make their facilities WID-compliant, a decent gate fee can be earned from accepting such materials. Acting against that, RDF and residual waste are significantly more difficult feedstocks to handle successfully at WID compliant plants, in comparison with homogeneous biomass materials, or even waste wood. For this reason, Ricardo-AEA considers that WID-compliant biomass plants are not likely to make a particularly significant impact on the treatment of residual household waste.
This point is important, because some of the biomass plants proposed have very substantial plant capacities, and their impact on the overall figures could quickly become distorting, even if a low probability factor is applied. For example the Dalkia biomass facility in Yorkshire could be delivered at 360,000 tpa processing capacity, which would be a substantial addition to regional capacity availability if it were to process residual waste or RDF.
Other waste facilities potentially providing additional capacity are those located abroad that are looking to boost their throughputs with foreign / imported waste. The Transfrontier Shipment of Wastes Regulations43 prevent waste from being exported for disposal, but such movements, are permitted for treatment judged to be recycling or energy recovery. This is a subject in its own right, however, and is addressed in more detail in section 0.
4.5 Analysing Total Capacity for C&I Waste Treatment
This review has demonstrated that there are a very large number of factors that come into play when trying to estimate the future capacity of waste facilities for the treatment of LACMSW and C&I waste. While it is possible to make estimations to take account of all these variables, it has to be accepted that any results must come with a fair degree of uncertainty.
The overarching equation for calculations is as follows:
Capacity of
Available Facilities
= Existing
Infrastructure –
Closing Facilities
–
Losses from
Reduced Availability
+ Anticipated
New Facilities
+ Capacity
from Other Facilities
Putting aside capacity in other facilities, and taking into account facilities that might be expected to close in years to come, Ricardo-AEA’s best estimate of the waste capacity of the UK is presented in Figure 9, and shows waste treatment capacity rising to about 38 Mt in 2023, which includes thermal, organic and sorting facilities for C&I and LACMSW.
43
Transfrontier Shipment of Wastes Regulations, 2007, available from http://www.legislation.gov.uk/uksi/2007/1711/contents/made
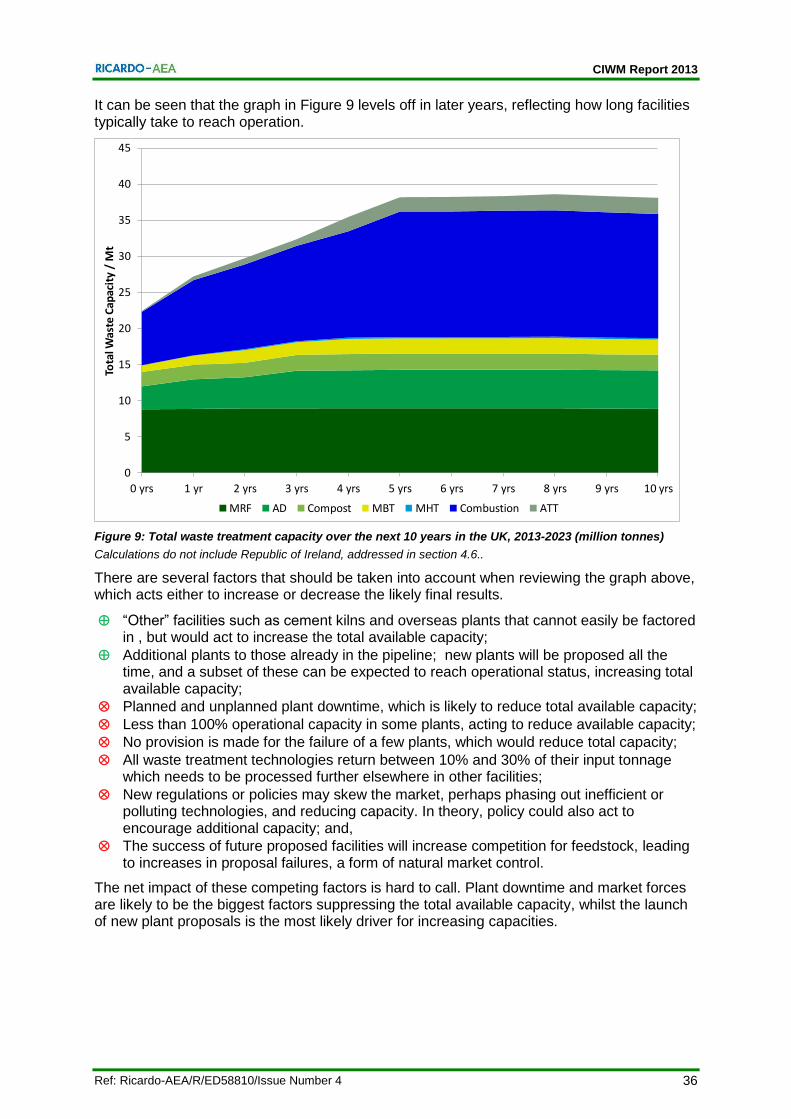
CIWM Report 2013
36 Ref: Ricardo-AEA/R/ED58810/Issue Number 4
It can be seen that the graph in Figure 9 levels off in later years, reflecting how long facilities typically take to reach operation.
Figure 9: Total waste treatment capacity over the next 10 years in the UK, 2013-2023 (million tonnes)
Calculations do not include Republic of Ireland, addressed in section 4.6..
There are several factors that should be taken into account when reviewing the graph above, which acts either to increase or decrease the likely final results.
“Other” facilities such as cement kilns and overseas plants that cannot easily be factored in , but would act to increase the total available capacity;
Additional plants to those already in the pipeline; new plants will be proposed all the time, and a subset of these can be expected to reach operational status, increasing total available capacity;
Planned and unplanned plant downtime, which is likely to reduce total available capacity;
Less than 100% operational capacity in some plants, acting to reduce available capacity;
No provision is made for the failure of a few plants, which would reduce total capacity;
All waste treatment technologies return between 10% and 30% of their input tonnage which needs to be processed further elsewhere in other facilities;
New regulations or policies may skew the market, perhaps phasing out inefficient or polluting technologies, and reducing capacity. In theory, policy could also act to encourage additional capacity; and,
The success of future proposed facilities will increase competition for feedstock, leading to increases in proposal failures, a form of natural market control.
The net impact of these competing factors is hard to call. Plant downtime and market forces are likely to be the biggest factors suppressing the total available capacity, whilst the launch of new plant proposals is the most likely driver for increasing capacities.
0
5
10
15
20
25
30
35
40
45
0 yrs 1 yr 2 yrs 3 yrs 4 yrs 5 yrs 6 yrs 7 yrs 8 yrs 9 yrs 10 yrs
Tota
l Was
te C
apac
ity
/ M
t
MRF AD Compost MBT MHT Combustion ATT

CIWM Report 2013
37 Ref: Ricardo-AEA/R/ED58810/Issue Number 4
4.6 Republic of Ireland
The Republic of Ireland (RoI) maintains a data register for activities licensed by the Environmental Protection Agency (EPA) and waste collection permits, however the reporting of all types of waste arisings and management in the RoI is restricted by the lack of a national register of authorised waste facilities and their treatment capacities. Biennial data on the capacity of waste recovery and incineration operations is required under the Waste Statistics Regulation44.
The EPA produces an annual report on total waste arisings, the most recent of which is the National Waste Report 201123. In this report the EPA listed the total annual MSW arisings for 2011 as 2,823,242 tonnes, of which 47% was recovered. Due to a shortfall in recovery capacity, a large proportion of recovery occurs overseas, with 91% of exported waste travelling to the United Kingdom, Belgium, Germany and the Netherlands.
In 2013 the RoI’s Department for the Environment, Community and Local Government confirmed the new Food Waste Regulations 45, which provide an important tool in meeting the objectives of the Landfill Directive, by placing obligations to segregate household food waste. There is also some commercial food waste segregation happening where this makes financial sense for the business.
The capacity of existing treatment and disposal facilities has also been considered in this study. In Ireland there are no significant AD, MBT, MHT or ATT plants and only one combustion EfW plant. There are some MRFs but they have been focused on RDF production due to the rising landfill levy. A forecast of available landfill space and its future potential distribution was calculated using the MSW (household and C&I) disposal capacities and estimated number of operational years, listed in the 2011 National Waste Report.
All landfills listed as having an approximate remaining life expectancy of 1 year or less were excluded from this projection. Furthermore, projections have been created with and without the operation of the Bottlehill Landfill near Cork, which has a current capacity of approximately 5 million tonnes over an estimated 20 year lifespan. However this facility is currently not operational, with question marks remaining over its inception date46. Existing recovery facilities and the current levels of exported waste have also been factored into the projection.
This projection considers commercial waste (including non-process industrial waste) as a fraction of MSW. As a reported 68% of industrial wastes in the RoI are treated on-site47, with a further 4% exported, it has not been possible to forecast an accurate capacity for treatment. However estimated tonnages of disposal/recovery have been calculated based on the existing split and forecast waste arisings. The forecast is presented in Figure 10.
44
EIONET (2013) Reporting Obligations Database (ROD) [online]. Available from: http://rod.eionet.europa.eu/instruments/528 [Accessed 19 August 2013]. 45
Resource (2013) Ireland commits to separate food waste [online]. Available from: http://www.resource.uk.com/article/UK/Ireland_commits_separate_food_waste-2833#.UhISoX7VDX5 [Accessed 19 August 2013]. 46
The Corkman (2011) Bottlehill landfill may be put on hold [online]. Available from: http://www.independent.ie/regionals/corkman/news/bottlehill-landfill-may-be-put-on-hold-27088707.html [Accessed 19 August 2013]. 47
National Waste Report (2008) Environmental Protection Agency [online]. Available from: http://www.epa.ie/pubs/reports/waste/stats/EPA_National_Waste_Report_2008.pdf [Accessed 01 August 2013].
In summary, a wide range of factors influence the chances of a new waste management facility reaching operation. Naturally, a suitable location for the facility must be secured, but this is perfectly possible. Beyond that, our experience is that, of the many other factors involved, raising finance is the most critical. This in turn can be linked to an assessment of the security of a suitable feedstock for the facility. While this national review of capacities is informative, such decisions on individual plants are (and must be) taken on a local basis.

CIWM Report 2013
38 Ref: Ricardo-AEA/R/ED58810/Issue Number 4
Figure 10: Republic of Ireland projected waste and treatment/disposal capacity, 2012-2020, (tonnes)
Further development of waste processing infrastructure in the Republic of Ireland is dependent on several factors, above and beyond those identified for the UK. The exchequer deficit in Ireland has meant that there is no money in the public purse to fund new infrastructure, and the development initiative falls onto the private sector. However, historically, the waste industry in Ireland has never invested significant money (>10M euros) in any recovery infrastructure; the general trend has been short term investment to meet market demand or lowest price treatment routes.
The rising landfill tax in the Republic of Ireland and the reorganisation into three waste regions which must each provide an infrastructure plan provides the policy context for resource recovery. However, the industry does not have the funds to respond to these drivers at present. It is therefore likely that any facilities developed in the future will be large scale, tried and tested technologies.
CIWM Report 2013
39 Ref: Ricardo-AEA/R/ED58810/Issue Number 4
4.7 The Export Solution
End users of RDF/SRF produced in the UK and Ireland include the cement industry and in dedicated energy from waste facilities. However, many of the existing EfW facilities in the UK have been designed, and have contracts for, ‘untreated’ black bag waste. Therefore current UK markets for RDF/is limited. This is also the case in Ireland, where the first energy from waste facility was opened in 2011. As identified in section 4.5, the UK market for RDF/SRF is expected to grow significantly with a range of energy recovery facilities which are currently in planning, development and/or construction. However, this capacity will take time to come to fruition, and in the meantime other non-landfill solutions have been sought, predominantly the export of RDF/SRF to Europe.
In the Republic of Ireland, the industry produces RDF more than SRF. The lack of thermal treatment capacity means much of this material is currently exported. Some RDF has been allowed to be interred in landfill as “engineering material” although it has few suitable qualities. Platin Cement Works, near Drogheda, Republic of Ireland has replaced some of its coal input with SRF, including tonnage exported from Wales. Further domestic RDF treatment facilities are also far down the line, and export remains the cheapest economic route for this material.
4.7.1 Export trends
In order to meet landfill diversion targets, we have seen significant investment in facilities such as Mechanical Biological Treatment (MBT) plants and Materials Recycling Facilities (MRFs). Outputs from these facilities will almost always include a residual fraction which is not suitable for further recycling and the options for this residual material are either landfill or energy recovery. However compared to some European countries, the EfW market in the UK and Ireland is relatively immature. Therefore the UK and Ireland have been utilising European markets for RDF/SRF in order to ensure landfill diversion targets are met.
The export of RDF to Europe has been underway for some time, but in recent years has seen rapid growth. Earlier this year, CIWM commissioned a study which examined the export of SRF and RDF from the UK and Ireland to other European countries.
The report identified that in 2012, almost 868,000 tonnes of RDF/SRF was exported to other European countries from the UK and Ireland, see Table 15 below.
Table 15: Summary of RDF/SRF exports from UK and Ireland48
(tonnes)
RDF/SRF exports 2010 2011 2012
England and Wales 34,733 680,631 739,535
Scotland49
Not known 11,000 25,000
Northern Ireland50
Not known Not known ~22,000
Ireland 45,000 86,000 81,000
TOTAL 79,733 777,631 867,535
The most common destinations for RDF exports were identified as Denmark, Germany, the Netherlands, Norway and Sweden, all of whom currently have over-capacity in their EfW plants. The export of SRF was predominantly for use in cement kilns in Estonia and Latvia.
The source of this waste is predominantly from household or other municipal sources, which accounted for over 85% of the RDF/SRF exported. However, as the economics of export continue to be a driver, it is anticipated that an increased quantity of C&I waste will be exported as RDF/SRF in future.
48
Data summarised from Research into SRF and RDF Exports to Other EU Countries, CIWM, 2013 49
Limited data from SEPA 50
Limited data from NI EA
CIWM Report 2013
40 Ref: Ricardo-AEA/R/ED58810/Issue Number 4
The number of companies involved in the export of RDF/SRF was also reported to have increased, with both small and large companies involved. In January 2012, the Environment Agency for England and Wales reported notifications ranging from as little as 49 tonnes up to over 13,000 tonnes were received at sites in the Netherlands51.
4.7.2 The future of RDF/SRF export
The debate as to whether the planned waste infrastructure capacity will meet or exceed demand continues. There also remains considerable uncertainty about how the markets for the export of RDF and SRF will develop and whether the growth in exports will continue.
In the short-term, it has been widely accepted that exporting RDF has been essential for the UK and Ireland to meet these targets, but in the long term new infrastructure capacity within UK and Ireland may make it more economically sound to retain the feedstock. The economics of RDF export are making companies invest in this solution, which is made more attractive by relatively low market-entry costs and low European gate fees.
There is a risk that the over-capacity in Northern European EfW facilities may not continue long term. If economic recovery begins in earnest in EU27 countries, waste arisings may increase and over-capacity reduce. In addition, some plants in Europe are approaching their end of life and may close.
A further risk is that some UK councils are seeking to procure shorter term contracts for residual waste treatment, some as short as 5 years. This could make the investment in UK EfW facilities even more risky and securing funding in this scenario will be challenging.
Gate-fees for imported RDF are currently low compared to UK thermal treatment gate-fees, with many facilities in Europe operating under capacity and competing for feedstock from the UK and Ireland. For example, a recent study52 commissioned into the situation in Norfolk with the development of a contentious thermal treatment facility, identified savings if waste was to be exported, over its thermal treatment in the County. As long as this remains the case, then it is likely that the export of RDF/SRF will continue to grow and market forces alone could dictate the continued export of RDF/SRF despite increases in local capacity. New facilities in the UK and Ireland will need to be able to compete with this market, particularly those that are not directly involved in the collection and treatment of their own waste feedstocks.
In addition to having an over-capacity, another reason why some EfW operators in Northern Europe are able to offer such competitive gate-fees is their ability to benefit from higher thermal conversion efficiencies. This is particularly true in countries such as Sweden and Denmark where high heat demand and the sale of heat through established district heating networks make energy recovery from waste even more economically viable.
RDF and its use in energy recovery could reduce our dependence on fossil fuels, generate energy, and help meet our landfill diversion targets. However, short term landfill diversion can be achieved, exporting the RDF means that the benefits of fossil fuel reduction and energy generation are exported together with the RDF/SRF. Although the fraction of biogenic content in RDF is decreasing, this abatement loss remains significant.
It is evident that the export of RDF is currently meeting a demand for non-landfill solutions for the UK’s and Ireland’s residual waste and is being driven both by economic drivers like landfill tax and the lack of domestic EfW infrastructure. However, building facilities in the UK and Ireland will enable the benefits of recovering energy from this valuable resource to be realised. It will contribute to both energy security and renewable energy targets, in addition to other economic benefits that utilising waste streams locally can bring in both the UK and Ireland.
51
Data available from the Environment Agency on request, summarised in an article available from http://www.letsrecycle.com/news/latest-news/energy/sharp-rise-in-rdf-exports-during-2012 52
“Exporting waste 'cheaper than King's Lynn incinerator'”, BBC News Norfolk, 02/10/2013. Available from: http://www.bbc.co.uk/news/uk-england-norfolk-24362629

CIWM Report 2013
41 Ref: Ricardo-AEA/R/ED58810/Issue Number 4
4.8 Key Findings
The table below summarises the key findings of the models presented in this report.
Table 16: summary of results (tonnes p.a.)53
Key findings 2013 estimate 2020 projection
England C&I arisings 47,997,000 48,343,000
Wales C&I arisings 3,120,000 2,608,000
Scotland C&I arisings 6,654,000 6,381,000
Northern Ireland C&I arisings 577,830 577,773
UK total C&I arisings 58,047,830 57,909,773
Republic of Ireland C&I arisings 3,862,307 3,866,169
Other relevant waste streams
UK and Ireland RDF/SRF export -868,000 -868,00054
UK LACMSW arisings 30,128,000 29,820,00055
Republic of Ireland LACMSW arisings 2,539,000 2,531,000
England C&D arisings requiring treatment 15,399,000 15,399,00056
Total potentially requiring treatment (UK approx) 102,707,000 103,129,000
Potential capacity gap
Assumption 1: 10% unavoidable landfill rejects 10,270,000 10,312,000
Assumption 2: Industrial waste in need of alternative treatment at 50% of C&I total
29,024,000 28,955,000
Assumption 3: Commercial waste collected separately for reprocessing (card & glass) @ 15.5%
4,499,000 4,488,000
Assumption 4: Household recyclables collected separately for reprocessing @50%
6,026,000 8,946,000
Remaining waste in need of thermal, organic of sorting treatment - UK
52,887,000 50,427,000
Remaining waste in need of thermal, organic of sorting treatment – Republic of Ireland
3,232,000 3,000,000
UK treatment capacity (weighted) 22,493,000 38,129,00057
Potential capacity gap (high end estimate) 33,626,000 15,298,000
Table 16 provides a summary of the 2013 estimated arisings per country and the projections for 2020. The figures highlight relatively stable waste generation, with increases and decreases across the board.
53
All figures to rounded nearest thousand tonnes 54
With uncertainty over the future scale of export, the calculation was based on constant volumes. This is recognised as a limitation of the analysis, as exports are likely to grow in the medium (5-7) year term. However, in the context of the large totals, this limitation is balanced out by other estimates of the analysis. 55
Calculation based on WasteDataFlow and Defra household waste projection factors, presented in the methodological note (Appendix 1) 56
Based on national C&D surveys, detailed in Appendix 1. No growth was assumed for this waste stream. 57
Probability weighted estimate based on current facilities in the pipeline, facilities not yet announced are not accounted for. Delivery likelihood is discounted based on stage and technology of a pipeline plant.
Based on the assumptions made in this study, future waste treatment capacity in the UK will not be enough to manage the volumes of arising waste from household, commercial and industrial sources. With limited residual waste management infrastructure currently operational in the Republic of Ireland, here too there is a need to develop further facilities, especially in the context of reducing landfill capacity. The capacity gap may be anywhere up to 15M tpa, and is likely to be more than 5M tpa by 2020.

CIWM Report 2013
42 Ref: Ricardo-AEA/R/ED58810/Issue Number 4
Figure 11: Waste facilities in the context of total arisings (million tonnes)
To assess the potential capacity gap, it is necessary to understand the rough composition of each waste stream. For the purposes of this report, a number of tentative, high level assumptions were made.
0
20
40
60
80
100
120
2013 estimate 2020 projection
Cap
acit
y in
to
nn
es
(mill
ion
s)
UK treatment capacity (weighted)
England C&D arisings requiringtreatment
UK LACMSW arisings
UK total C&I arisings
• The analysis assumes that it is preferable to minimise waste to landfill. The analysis consigns just 10% of the total arising waste to landfill. This is an ambitious assumption which assumes moving beyond 2020 EU targets. If landfilling is maintained at the EU target level, there will be no capacity shortfall.
Assumption 1: Landfill
• The analysis assumes that most waste arising from industrial processes will not be treated at the same facilities as commercial and household waste due to its significant difference in composition. This is a conservative assumption, as it is likely that a lot of industrial waste will continue to enter the MSW processing market. Nevertheless, this discounts 50% of total C&I waste from the gap analysis, assuming the split between commercial and industrial arisings is roughly equal.
Assumption 2: Industrial Waste
• The analysis assumes that some recyclables are collected separately from commercial premises and do not need to be treated at thermal, organic or sorting facilities. For the purposes of this study, it is assumed that cardboard and glass are two such waste streams, which together comprise circa 15% of the commercial half of the C&I stream. This is a conservative assumption as many businesses will still use a mixed recyclables system.
Assumption 3: Commercial Recyclables
• The analysis assumes that LACMSW collected through a kerb side sort system will not need sorting capacity. This is assumed to be half of all recyclable LACMSW collected, as currently kerb side sort and co-mingled systems are roughly equally popular with local authorities. To reflect trends in recycling, the 50% kerb side sort is applied to 40% of the total LACMSW (as per England’s current recycling performance) and 60% of LACMSW in 2020 (as an ambitious leap beyond EU targets and closer to targets from Scotland and Wales). Again, this is a conservative assumption, as practice suggests that incremental gains in recycling are likely to be the result of further co-mingling in the future.
Assumption 4: Kerb Side Sort
The assumptions leave between 50-55 million tonnes of waste in need of treatment. This figure includes household, commercial and some construction waste. Based on the current capacity projections, this is about 15 million tonnes more than the current mix operational and deliverable projects.
CIWM Report 2013
43 Ref: Ricardo-AEA/R/ED58810/Issue Number 4
Sensitivity analysis shows that, whilst retaining all of the conservative assumptions which underestimate the amount of waste in need of treatment, and changing the only ambitious assumption on landfilled waste, still leaves circa 3 million tonnes untreated in 2020. Nevertheless, if landfill tax continues to grow, the cost of landfill will become more and more prohibitive; the ambitious minimal landfill assumption is likely to be the most cost-effective scenario in the future.
Although each of the assumptions can be scrutinised individually, the overall scale of the results in the context of known facilities and projects has been tested using sensitivity analysis and confirmed by key industry stakeholders.
This prediction will be dependent on a number of factors including:
what other facilities may get built to provide additional capacity;
the future levels of waste derived fuel export; and
waste prevention activities.
Crucially, the analysis is based on the assumption that the resource and energy value of waste should be recovered as much as possible, increasing landfill diversion beyond the EU 2020 targets. In a scenario of continued high volumes of landfilling, there may not be any capacity gap; however this would mean that targets and opportunities are missed.
Even if the number of proposed and permitted new facilities is underestimated, there is plenty of feedstock going to be available for new infrastructure, whether this is in the form of residual treatment or, ideally, recycling or organics processing. The movement of waste and materials up the waste management hierarchy will be required if we are to achieve optimal landfill diversion and recovery potential.
In the Republic of Ireland, where 53% of MSW waste is still disposed to landfill, there is similar potential for a growing infrastructure development pipeline in the context of relatively stable waste generation. Landfill capacity in the Republic of Ireland is decreasing, making the need for materials and energy recovery facilities more acute each year.
In conclusion, based on the projections made as part of this study, and the assumption that materials and energy recovery facilities need to treat as much C&I, LACMSW and active C&D waste as possible, the current outlook for 2020 clearly suggests that a significant amount of additional infrastructure will need to be developed, beyond what is already planned and proposed. There may be opportunity for anything up to 15 million tonnes of capacity, and very likely more than 5 million tonnes. If this new capacity is to be operational by 2020 or soon after, it needs to be identified, with sites and funding agreed immediately; the challenge is on to close this gap.

CIWM Report 2013
44 Ref: Ricardo-AEA/R/ED58810/Issue Number 4
Discussion and Stakeholder Views
There are many opinions on the future of commercial and industrial waste streams and processing capacities which are regularly voiced at conferences and in the industry press. This waste stream is more important to some operators than others, although its importance is growing for all.
Some waste management operators collect and analyse their own waste data through their collection services, whilst others commission independent studies and modelling exercises.
It was important for this project to engage with operators and find out what different parts of the industry consider to be the key issues with commercial and industrial waste and its treatment capacity.
The report presents the opinions of several industry representatives on the shortfalls of available data and the consequences for facility development and financing.
CIWM Report 2013
45 Ref: Ricardo-AEA/R/ED58810/Issue Number 4
5 Discussion and Stakeholder Views
5.1 Commentary on Future C&I Waste Arisings
The C&I waste stream is becoming a key feedstock for treatment within the waste and resource management sector. Many sector stakeholders have a keen interest in how this waste stream is changing and how this will impact the industry. As part of this project, Ricardo-AEA undertook an engagement exercise consulting operators, planners, and other experts on the methodology applied to the study, their views on existing C&I datasets, and their approach to collecting and using such data.
The aim of the consultation was to gather views about how the waste management sector should approach the issue of C&I data in the future, and how the quality of this data impacts the future development and financing of infrastructure to treat this waste stream.
5.2 Stakeholder Views
5.2.1 Methodology
As part of this assessment, a number of key stakeholders in the waste management industry were consulted to collect their views on C&I waste arisings, the existing data and how this might be improved in the future. The stakeholders were asked a set list of key questions to stimulate discussion and the responses are captured in the core themes presented below. The views presented are the stakeholders own, or those held by the majority of interviewees, with no additional points from Ricardo-AEA or CIWM.
Stakeholders participating in face to face interviews were:
Stuart Hayward-Higham, Technical Development Director, SITA UK;
Gloria Rampton, Director of Waste and Operations, Advanced Plasma Power (APP);
Peter Jones O.B.E, Independent Consultant;
Peter Scholes, Urban Mines;
Andrew Reidy, General Manager: North London, Veolia Environmental Services;
David Williams, Director, Enviroparks Wales;
Cindy Lee, Zero Waste Scotland;
Neil Bennett, Sector Head: Waste to Energy, M+W UK; and,
Dan Cooke, Director of External Affairs, Viridor.
5.2.2 The importance of C&I waste to waste management businesses
All of the stakeholders agreed that C&I waste is an important waste stream for waste management businesses. Smaller businesses including APP see it as a target feedstock as it is more ‘accessible’ than LACMSW which is typically controlled by the ‘big six’58 waste management companies and is tied up in long term contracts. Whilst the quantity of LACMSW going to landfill has declined steeply in the last few years, one consultee considered that this was not the case for C&I waste, which continues to be managed, in the main, through landfill disposal and makes it a potential target for more sustainable and low cost treatment options. The consultancy, Urban Mines, confirmed this saying that C&I waste is seen by their clients as “the next big opportunity”.
58
A term often used in the waste industry to denote the largest operators, operating several facilities and holding multiple large contracts, i.e. any of SITA, Veolia, Viridor, FCC, Biffa, Shanks, Cory, etc

CIWM Report 2013
46 Ref: Ricardo-AEA/R/ED58810/Issue Number 4
The composition of C&I waste was also highlighted as being of increasing importance in terms of planning and operating treatment facilities. This is particularly the case for operators of treatment technologies that might be vulnerable to changes in the composition of their feedstock over time. Some operators are taking steps to protect against this risk by investing in pre-treatment facilities to produce SRF and RDF to a required specification.
5.2.3 Anticipated changes in C&I waste in the future and how this might impact the industry
The stakeholders did not expect the quantity of C&I waste produced in the UK and Ireland to reduce significantly in the foreseeable future. Most stakeholders felt that even if businesses embrace ‘green growth’, resource efficiency and waste prevention measures, this might not result in a cumulative decrease in waste arisings due to the countering effect of a growing economy.
The most significant change is expected to be in the composition of C&I waste. It was widely acknowledged that an anticipated increase in recycling, towards and beyond EU targets, could reduce the amount of paper, plastics and card in the waste stream. Peter Jones OBE, considered that the recovery of materials might be more extensive if the demand for wood (as a fuel) and food waste (as feedstock for AD) expands. Depending on the mix of materials in residual C&I waste, this could have a significant effect on the calorific value (CV) and impact on treatment technology selection and suitability.
One stakeholder, Stuart Hayward-Higham, explained that his company SITA UK has developed an extensive system of data collection from their operations with information on the weight and to some extent, composition, of the waste many of their customers discard. In the future, active bin sensors may also play a role in this data gathering process. Although they need some time to analyse this data to identify trends, they have identified potential regional changes in composition driven by the business demographics of an area. For instance, differences in business activity (service or manufacturing) between London and Birmingham drive subtle but significant differences in the type and volumes of the various waste streams. Looking forward, with this data they will increasingly be able to predict future waste arising through local structural changes, such as economic growth by sector.
5.2.4 Experience of existing C&I waste data, the sources, how it is used and the challenges encountered
The stakeholders were all aware of the data that is available from intermittent surveys and site returns from facilities with environmental permits/licences. They understood the limitations of each, especially Urban Mines who regularly use these datasets to undertake market assessments and feedstock studies for their clients. The main criticisms centred on the time it takes for the data to become available, meaning it quickly becomes out of date, is of limited accuracy, and rarely available at sub-regional level.
As a result of these limitations, it is necessary to develop and apply a significant number of assumptions to use this data for business planning. Waste management companies , for example , Enviroparks Wales have had to engage expert advisors to undertake analyses using the data as David Williams stated it is “thin, variable and not very reliable”, particularly in regard to composition. This is because the data is published as annual totals, there is little detail on seasonal variation in waste arisings in terms of quantity and also characteristics such as moisture content which is increasingly important to advanced treatment technologies is not included.
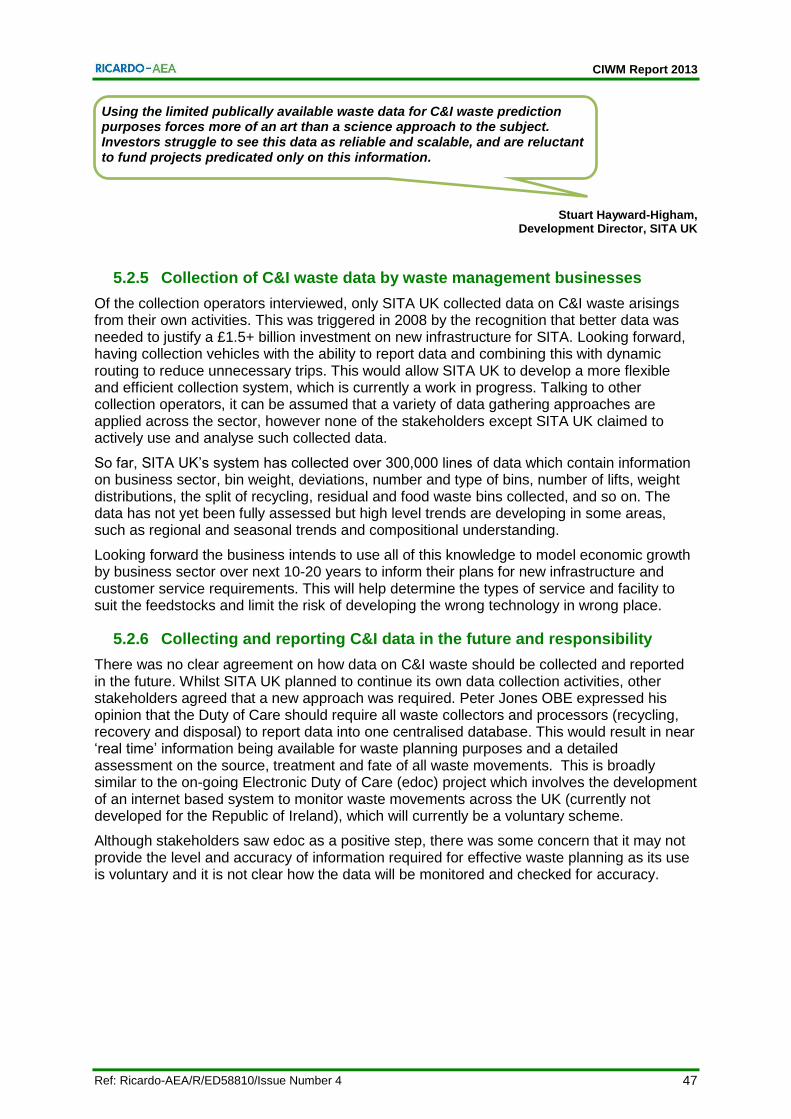
CIWM Report 2013
47 Ref: Ricardo-AEA/R/ED58810/Issue Number 4
Stuart Hayward-Higham, Development Director, SITA UK
5.2.5 Collection of C&I waste data by waste management businesses
Of the collection operators interviewed, only SITA UK collected data on C&I waste arisings from their own activities. This was triggered in 2008 by the recognition that better data was needed to justify a £1.5+ billion investment on new infrastructure for SITA. Looking forward, having collection vehicles with the ability to report data and combining this with dynamic routing to reduce unnecessary trips. This would allow SITA UK to develop a more flexible and efficient collection system, which is currently a work in progress. Talking to other collection operators, it can be assumed that a variety of data gathering approaches are applied across the sector, however none of the stakeholders except SITA UK claimed to actively use and analyse such collected data.
So far, SITA UK’s system has collected over 300,000 lines of data which contain information on business sector, bin weight, deviations, number and type of bins, number of lifts, weight distributions, the split of recycling, residual and food waste bins collected, and so on. The data has not yet been fully assessed but high level trends are developing in some areas, such as regional and seasonal trends and compositional understanding.
Looking forward the business intends to use all of this knowledge to model economic growth by business sector over next 10-20 years to inform their plans for new infrastructure and customer service requirements. This will help determine the types of service and facility to suit the feedstocks and limit the risk of developing the wrong technology in wrong place.
5.2.6 Collecting and reporting C&I data in the future and responsibility
There was no clear agreement on how data on C&I waste should be collected and reported in the future. Whilst SITA UK planned to continue its own data collection activities, other stakeholders agreed that a new approach was required. Peter Jones OBE expressed his opinion that the Duty of Care should require all waste collectors and processors (recycling, recovery and disposal) to report data into one centralised database. This would result in near ‘real time’ information being available for waste planning purposes and a detailed assessment on the source, treatment and fate of all waste movements. This is broadly similar to the on-going Electronic Duty of Care (edoc) project which involves the development of an internet based system to monitor waste movements across the UK (currently not developed for the Republic of Ireland), which will currently be a voluntary scheme.
Although stakeholders saw edoc as a positive step, there was some concern that it may not provide the level and accuracy of information required for effective waste planning as its use is voluntary and it is not clear how the data will be monitored and checked for accuracy.
Using the limited publically available waste data for C&I waste prediction purposes forces more of an art than a science approach to the subject. Investors struggle to see this data as reliable and scalable, and are reluctant to fund projects predicated only on this information.

CIWM Report 2013
48 Ref: Ricardo-AEA/R/ED58810/Issue Number 4
The national Electronic Duty of Care (edoc) programme, due to be rolled out from January 2014, aims
to help businesses take more responsibility for their (non-hazardous) waste. Co-financed by the EU LIFE+ programme, the existing paper based system of waste transfer notes, will be replaced with an electronic system (accessed via web portal or an application planning interface) to monitor the collection, transportation and disposal of waste materials.
The programme will modernise the way in which waste data is collected, reducing illegal and inappropriate waste disposal, to make good quality data available to businesses regulators and government.
While the benefits of waste transfer notes are clear, the current paper-based system presents a number of challenges. Over 25 million waste transfer notes are produced every year and need to be stored for at least two years. The cost of creation, storage and retrieval can be very high and often, these waste transfer notes are not completed correctly, making accurate waste monitoring very difficult indeed.
Edoc will seek to address each of these issues and improve the way that business waste is monitored across the UK by creating a large document management system that can be accessed via a web portal. An application programming interface (API) will also be provided to enable companies to integrate directly with their existing waste management systems.
The edoc system will include a number of key features, and will allow business to create, share, edit, sign and record waste transfers electronically. Users will also be able to search and retrieve information, and run reports for business planning as well as waste and resource management.
For waste producers edoc will improve data capture and quality, provide real time data on waste movements, including mapping, and support business waste management systems to further compliance and reduce administrative costs. Waste management companies and operators that use edoc will also benefit from reduced administrative costs, whilst supporting their customers’ needs in terms of data reporting, and boosting their corporate image.
Regulators and government are expected to have access to an improved quality of duty of care information that is input into the edoc system, which could also provide an alternative to completion of extensive waste (arisings) surveys.
Streamlining waste transfer recordings in the future through the edoc system is expected to significantly improve the quality of waste arisings data in the UK. Waste arisings surveys are complex and costly and completed infrequently, with the Waste Interrogator database provided by the Environment Agency often used to provide an estimate of type and quantity of waste handled by operators of regulated waste management facilities (i.e. waste received into site and waste sent on from site to other facilities or processes). This data is used to monitor compliance but has historically been used by the EC, DEFRA and local authorities to assist in planning for new waste facilities and for monitoring against statutory targets.
The Waste Interrogator database does not include a breakdown of waste produced by business type, or provide information on the origin of waste handled by operators.
In terms of forecasting future waste arisings, the edoc system will provide real time access to data of the type and quantity of waste produced by business, as well as that which is handled by waste management operators. More accurate data recording provided by the functionality of the edoc system will allow a baseline waste arisings figures to be calculated at any given time, reducing reliance on historic waste data outputs of surveys.

CIWM Report 2013
49 Ref: Ricardo-AEA/R/ED58810/Issue Number 4
There has been good progress in recent years in driving more recycling and recovery, but there are without doubt gaps and shortfalls. There are real challenges in securing investment and planning in this highly dynamic market. Better data and clear, strong
policies will help reduce risks to address these.
One respondent, Enviroparks Wales, raised the issue of the suitability of EWC codes for providing the information required. In some cases, codes cover a broad and variable waste stream. This is particularly true for general waste which can be extremely variable depending on the industry or company that produces it.
Most stakeholders felt that the responsibility for collecting, checking and reporting waste data should lie with central organisations these being either Defra or associated government departments in other countries, with the possibility of a third party or an independent body being contracted or set up to take on the role. Urban Mines felt that local authorities may have a role to play, as the data required by government departments is often very high level, with local authorities better placed to collect detailed data.
The Viridor spokesperson shared a concern over C&I waste “treated” at poorly operated and poorly regulated ‘RDF’ facilities, targeting export markets for short term profits. The false 'zero landfill' offering of some of these solutions have appealed to some waste producers. Regulatory bodies should focus on these operations to ensure they are fit for purpose and present the best solution for waste generated in the UK and Ireland. Waste producers should fulfil their duty and responsibility to ensure best practice for their own waste streams.
SITA UK is aware that the data it collects would be of use to Defra and other stakeholders but is reticent to share the information with others unless it could leverage other information that would add value to the data it collects. Whilst unable to confirm, it may be assumed that the larger waste management businesses collect their own data (whether per business or consolidated) in order to manage their business prudently and plan future projects. One stakeholder suggested that as it is the waste management businesses that want this information, they should play a part in collecting it and making it available for others.
5.2.7 Communicating the importance of data to waste producers
Most stakeholders were in agreement that data on the quantity and composition of C&I waste arisings is extremely important and that this ought to be communicated to waste producers and those that collect and manage it. Although C&I waste producers have achieved significant improvements in levels of waste separated for recycling in recent years, there is still much to be done. Viridor continues to work proactively with its customers to change established practices and move to greater resource efficiency.
Having accurate data will reduce the risk associated with investment decisions and ensure that facilities of the appropriate technology and scale are located in the right place at the right time. This could lead to benefits for waste producers in terms of lower gate fees as supply will meet demand.
Dan Cooke Director of External Affairs, Viridor
On a small scale, a move towards charging for collections by weight rather than by ‘lift’ or volume could also reduce costs whilst generating the detailed data that the industry would find so useful. One incentive for the waste industry to share data would be that it would help businesses understand their place in the market similar to other industries that record and publish market share information.

CIWM Report 2013
50 Ref: Ricardo-AEA/R/ED58810/Issue Number 4
The money needed to be invested to meet government landfill diversion targets needs to come from somewhere and will need to be funded by someone – but we can’t get funding without data. I can’t emphasise enough the need for reliable data, it is essential for new business and new business growth.
5.2.8 Other comments
Stakeholders offered other comments when asked whether there was anything else that they would like to add. A summary of these points is set out in the list below.
David Williams, Director, Enviroparks Wales
SITA UK has found that the detailed data that they collect on behalf of customers often shows that less waste is being recycled than the business expects. This is because the assumptions the businesses make on weight and volume are often inaccurate. This might be an unpalatable message in the short term but the long term value of detailed data is significant.
The value of accurate data on C&I waste is not just for waste infrastructure planning but also to inform and drive the move towards a circular economy and increased resource efficiency.
Defra, other UK government departments and the Irish EPA need to act soon to improve data or there is a risk that the infrastructure required to treat C&I waste will not be available. SITA UK estimate that it would take approximately 6 years for the UK’s waste transport fleet to be fitted with equipment to weigh bins and report data. Although this adds to the cost of replacing vehicles, it is not expensive to collect and record the data generated.
Waste management companies should be encouraged to collect, record and share data, as they will benefit from the data and have the resources and expertise to do it.

CIWM Report 2013
51 Ref: Ricardo-AEA/R/ED58810/Issue Number 4
This report sends out a clear message that expresses the industry’s need for accurate, reliable and timely data. We need to understand future feedstock volumes and composition to predict our output fuel and energy products. This is essential to planning for future facilities and in securing the appropriate funding for these facilities.
Governments and regulators must work together to consolidate and standardise waste data, addressing this dire situation head on.
Despite patchy data and the challenges of servicing spot markets, there rains a clearly defined need for more and better infrastructure to recover
more and better quality materials and more energy from C&I waste streams.
5.3 Key Findings from the Stakeholders
Overall, stakeholders confirmed the importance of timely, accurate and detailed data to their operations and future growth. It is not only the quantity of C&I waste arising that is important for business planning but also detailed information on the composition of the waste and, if possible, seasonal variations. This is increasingly important for technology selection, especially for those technologies that are particularly sensitive to variations in composition and characteristics.
The data that is currently available was unanimously considered to be unfit for purpose as it is relatively old when it is published, of variable accuracy and does not have the detail or granularity to assist in commercial business decision making. It is also clear that investors do not consider the data to be a reliable source of information and many waste management businesses are incurring additional costs engaging expert advisors to analyse and interpret the sparse information available. SITA UK has made the decision to invest in collecting this data themselves and is seeing the benefits of this both internally and for clients
It is clear that all stakeholders see a role for Defra, Natural Resources Wales, Welsh Government, and DOENI or the Environment Agency, SEPA, and the Irish EPA, or local authorities in collecting and publishing detailed data.
Most consider that businesses involved in the collection, transport and management of waste should report more detailed information to a centralised database. It is anticipated that the Electronic Duty of Care (edoc) programme will go part of the way to achieving centralisation of accurate data. Although edoc should collect some information, there as some scepticism as to the accuracy of the data this will generate. The completeness of edoc data is also uncertain as the scheme will not be enforced and will be on a voluntary basis.
Gloria Rampton, Director of Waste and Operations Advanced Plasma Power
Peter Jones, OBE
Dan Cooke Director of External Affairs, Viridor
CIWM Report 2013
52 Ref: Ricardo-AEA/R/ED58810/Issue Number 4
This study has reviewed existing commercial and industrial waste surveys and found them too uncertain for the waste industry to rely on for their business cases and decision-making.
It also attempted to make future projections for commercial and industrial waste arisings, identifying largely stable waste generation levels to 2020. Assessing capacity need for sorting, organic and thermal treatment has shown that there is likely to be a significant capacity shortfall in the UK and Ireland in 2020 (up to 15 Mtpa, more than likely over 5 Mtpa) unless more new projects come forward in the short term - the next 12-24 months - if they are to stand a chance of being operational in time.
However, the success of new infrastructure projects depends on effective negotiation of planning and financing systems. The issue of data paucity, as well as a number of other closely connected obstacles, create significant uncertainty for the investment community. As a result, projects are stalling and critical treatment capacity remains undeliverable. This is a failing system that needs addressing.
The waste and resource management sector in the UK and Ireland faces a critical challenge to improve data provision and overall confidence in the sector.
Conclusions and Recommendations

CIWM Report 2013
53 Ref: Ricardo-AEA/R/ED58810/Issue Number 4
6 Conclusions and Recommendations
In conclusion, C&I waste remains a complex and under-reported waste stream; this significantly affects the time and success of any planned new infrastructure delivery, even though this infrastructure will clearly continue to be needed over the next ten years and beyond.
The estimated 38-40 million tonnes of treatment capacity, which includes residual, MRF, and organic treatment capacity currently operational and planned, cannot accommodate the total arising waste in the UK. Putting together the circa 58 million tonnes of expected C&I waste, a further 33 million tonnes of LACMSW, and potential C&D feedstock treated at similar facilities of about 15 million tonnes, shows a significant amount of waste needing treatment. Applying a range of assumptions, between 50 and 55 million tonnes of waste from multiple sources remains untreated. If 40 million tonnes of this can be accommodated at current or future plants, anything up to 15 million tonnes, and very likely at least 5 million tonnes remains untreated and in need of capacity.
Even if the development of waste infrastructure is underestimated, there is plenty of feedstock for new facilities, whether residual treatment, recycling or organic, to achieve optimal landfill diversion and recovery potential.
6.1 The Consequences
The findings of this report conclude that, based on the current known infrastructure proposed, it is highly likely that there will be a shortfall in recycling, organic and thermal treatment capacity by 2020. Unless more developments come forward, it is inevitable that the UK and Ireland will be sending waste to landfill which could have been recovered as resource or energy.
A key barrier to progress is the risk to investment in new waste infrastructure, which is putting the investment community off funding further capacity. The lack of appropriate data and clear forecasts is one of the reasons for limited financing of new infrastructure.
Figure 12: Layers of investment risk – the lack of sound data and agreed forecasts creates a ripple effect
It is difficult for a developer to convince an investor that a plant is going to win back its investment.
It is difficult to assess capacity need, and therefore it is difficult for planners to be convinced of need.
The challenge of turning poor data into a reliable forecast is at the heart of the nervousness about feedstock reliability.
Investment risk
perception
Uncertainty in policies and plans
Feedstock uncertainty
Poor
data
CIWM Report 2013
54 Ref: Ricardo-AEA/R/ED58810/Issue Number 4
We can’t get funding without data. I can’t emphasise enough the need for reliable data, it is essential for new business and new business growth.
Waste infrastructure development is encircled in a wheel of risk: policy change risk; risk of planning refusal and negative public perception; risks around future feedstock availability; technology performance risk, and so on. Often there are simply too many layers of risk for the finance sector to get the comfort they need to invest.
One of the key linchpins in this complex risk framework is the fact that it is difficult to forecast future processing capacity demand and no agreed way of turning waste data into a robust forecast.
David Williams, Director, Enviroparks Wales
There are three key tiers within the “wheel of risk”:
1) The challenge of turning poor data into a reliable forecast is at the heart of the
sector’s nervousness about feedstock reliability;
2) Thus, it is difficult to assess future capacity need, and planning authorities find it
challenging to account realistically for waste infrastructure and therefore permit new
builds; and as such
3) It is difficult for a developer to convince an investor that a plant can realistically be
delivered within time and budget and will ultimately repay its investment in an
acceptable timeframe.
Currently, with poor data, poor forecasting, and a poor understanding of future competition the waste industry is repelling investment. The overwhelming barrier is the struggle to persuade the finance sector that the feedstock and the ‘need for treatment’ will be there.
Improving the available data on commercial and industrial waste arisings will solve much of this impact. The concerns about data and forecasting has permeated through many other barriers to development, creating a ripple effect through the multiple tiers of development risk.
Stuart Hayward-Higham, Development Director, SITA UK
However, better data and forecasting is far from the only element of development needed to help the waste sector move forward on C&I wastes. Strategic thinking is required to address each tier of risk, generating confidence in future policy, engaging with stakeholders for positive public perception, assisting and advising planners and helping developers deliver technological solutions which can prove themselves and become effective case studies for future developments. Strong leadership, industry consensus and shared recognition of the challenges ahead are necessary to create a consolidated and sufficient waste sector for 2020.
A professional approach to the current and future market, based on fact and data, correctly analysed and forecast, is essential to deliver the confidence from all stakeholders that will allow the service changes and new infrastructure to be funded and deployed for the commercial and industrial sector.
CIWM Report 2013
55 Ref: Ricardo-AEA/R/ED58810/Issue Number 4
6.2 Recommendations
Having examined the existing datasets, modelled the infrastructure capacity gap, and consulted key stakeholders, this report provides the following key recommendations to drive forward better data and thus better planning and delivery of C&I waste infrastructure.
Neil Bennett, Sector Head, Waste & Energy, M+W UK
1) Existing C&I datasets are not good enough for making well informed decisions about the future planning of waste management infrastructure at any level (local, national etc.). Some waste management businesses have invested significantly in collecting valuable data which will inform their future business planning, however many businesses and local authorities have not. Future data gathering needs to avoid cumulative assumptions and rely on raw data as much as possible. Consistency of approach would be beneficial and a requirement (ideally), or voluntary code for waste management businesses and local authorities to report data should be considered. This approach and the systems to record data would need to be developed by central government and national agencies in the UK and Ireland, with the CIWM and other key stakeholders providing advice.
2) A common methodological approach to waste data collection, analysis, and forecasting across all five of the countries covered in this report and all business sectors would ensure consistency of assumptions and reduce the multitude of voices claiming under or over capacity risks. A best practice methodology needs to be created for developing assumptions and defining parameters, working in a joined up way with government agencies in the UK and Ireland. Standards developed in this way should apply as widely as possible – at least across the four UK countries and preferably Ireland too. Ideally, data and reporting standards should be applied across the whole of the EU and this is an issue which should be promoted within the Commission by UK and Irish Governments.
3) It is important to engage with operators who collect much of their own waste arisings data. Although much of it is confidential, operators are data experts with first-hand experience who can contribute to the analysis and development of assumptions. The key industry bodies should be represented on any steering group developing a new methodology or protocol and it should be tested by some of the members of those key bodies to ensure it is valid, appropriate and robust.
4) Careful monitoring and recording of waste arisings over the next 3-5 years is crucial, especially for C&I waste, as the UK and Ireland emerge from the global financial downturn. In the near future we should be able to witness whether there has in fact been a decoupling of waste generation from economic growth, but only if this data is recorded diligently based on a set of clear agreed assumptions. The report recommends that improved waste data collection and analysis as above should be used by governments on a routine basis to monitor infrastructure provision as well as the effectiveness of government policy and programmes for waste prevention.
5) Supporting and promoting the effective and best practice use of edoc can ensure successful integration of this system generating much needed real-time data which can be carefully analysed and utilised by all those interested in future capacity needs and infrastructure delivery.
A norm for forecasting is needed: centralised, perhaps CIWM-led, benchmark.

CIWM Report 2013
56 Ref: Ricardo-AEA/R/ED58810/Issue Number 4
6) In order to secure support for future infrastructure development, potential value of a strong secondary materials market in country, as well as the potential contribution of energy from waste to the UK and Ireland energy mix, needs to be clearly communicated to all stakeholders, decision makers and the media. The CIWM already has a crucial role in this process, and the role grows ever more important as the need for new facilities grows daily.
7) The waste industry had also indicated a major weakness of short term contracts in the C&I market. Even where the feedstock exists it could shift from contract to contract driven by today’s price or customer choice. This is exacerbated by a poorly defined “Duty to Cooperate” between Local Planning Authorities. There is no market maker for C&I wastes and this compounds project and contract uncertainty for developers, planners and financiers.
8) The pursuit of actions in line with these recommendations, should lead to an overall effort to communicate better the need for infrastructure to the investment community. With clearer forecasts, centralised data collation and better understanding of the waste stream, business cases for new facilities will become more convincing and realistic.
It is clear that current available C&I waste data is insufficient to support strong business cases for new facilities. Uncertainties in forecasts of waste feedstocks undermine confidence in both planning and financing of additional waste treatment infrastructure. This includes waste types, amounts and locations and the current or likely future existence of alternative treatment capacity. The multitude of independent and commercially sensitive datasets has created an uneven market landscape with many points of view – some predicting under-provision of waste treatment facility capacity – others warning of over-provision. Our analysis shows that a significant shortfall of waste treatment capacity of anything up to 15 million tonnes and likely above 5 million tonnes exists and is likely to continue over the next 7-10 years without a co-ordinated response by governments, local authorities, the waste and resources management sector and the finance sector. The picture is confused, leaving the UK and Ireland in danger of having to resort to expensive landfilling or unpredictable export solutions. This is a potential weakness for the future of the UK & Irish economies, and a major concern for many of those working in the UK and Ireland waste sector at present.
Strong leadership, standardised methodologies and cross-sector engagement is needed to enable the waste industry to effectively plan, project and provide for the management of commercial and industrial waste streams. This need is current and urgent, and must be met in the near future to avoid the processing gap expanding, and reliance on unpredictable exports increasing.
Poor data is undermining the UK and Irish waste management sector, in particular the development of new C&I waste processing capacity, and Governments and other key stakeholders must act to address this.
David Palmer-Jones, Chairman, Environmental Services Association
The report identifies the UK's Commercial & Industrial waste market as having significant growth potential for investors and operators in the run-up to 2020 and beyond. ESA supports the call for improved data gathering systems to capture more reliable information on current waste arisings and trends, because supply risk is such a key issue in unlocking this potential in planning for future treatment capacity with greater confidence.

The Gemini Building Fermi Avenue Harwell Didcot Oxfordshire OX11 0QR
Tel: 01235 75 3000 Web: www.ricardo-aea.com


