Chesapeake Bay TMDL Phase II Watershed Implementation Planning for Hampton Roads

City of Richmond, Virginia
Chesapeake Bay TMDL
Action Plan
Permit No. VAR040005
2013-2018
Department of Public Utilities

Chesapeake Bay TMDL Action Plan Permit No. VAR040005
2013-2018
Department of Public Utilities, Richmond, Virginia September 2015
City of Richmond Chesapeake Bay TMDL Action Plan Table of Contents
ii
Use of contents on this sheet is subject to the limitations specified at the end of this document.
Final Richmond Chesapeake Bay TMDL AP - final
Table of Contents
List of Figures .............................................................................................................................................. iii
List of Tables ............................................................................................................................................... iv
List of Abbreviations .................................................................................................................................... v
Executive Summary .................................................................................................................................... vi
1. Introduction ....................................................................................................................................... 1-1
2. Legal Authority for TMDL Implementation ....................................................................................... 2-1
2.1 Current Program and Existing Legal Authority ...................................................................... 2-1
2.2 New or Modified Legal Authority ............................................................................................ 2-1
2.3 Means and Methods to Address Discharges from New Sources ........................................ 2-1
3. POC Loads and Required Reductions .............................................................................................. 3-1
3.1 Definition of the MS4 Service Area ........................................................................................ 3-1
3.1.1 City of Richmond Boundary ...................................................................................... 3-2
3.1.2 2000 US Census Urban Areas ................................................................................. 3-2
3.1.3 Combined Sewer System ......................................................................................... 3-2
3.1.4 VPDES Permittees .................................................................................................... 3-2
3.1.5 Other MS4 Permittees ............................................................................................. 3-4
3.1.6 Forested Lands and Wetlands ................................................................................. 3-5
3.1.7 Agricultural Lands ..................................................................................................... 3-6
3.1.8 James River and Open Waters ................................................................................ 3-6
3.1.9 Stormwater Runoff between Jurisdictions .............................................................. 3-6
3.1.10 Delineation of the Final MS4 Service Area ............................................................. 3-7
3.2 Estimated Existing Source Loads........................................................................................... 3-8
3.2.1 2009 Pervious and Impervious Land Cover ........................................................... 3-8
3.2.2 Annual POC Load Calculations – Existing Sources as of 2009 .......................... 3-10
3.3 Calculated Pollutant of Concern Required Reductions ..................................................... 3-11
3.4 Additional Source Loads and Required Reductions .......................................................... 3-12
3.4.1 Means and Methods to Offset Increased Loads from New Sources Initiating
Construction between July 1, 2009 and June 30, 2014 ................................... 3-12
3.4.2 Means and Methods to Offset Increased Loads from Grandfathered Projects that
Begin Construction after July 1, 2014 ................................................................ 3-14
3.5 Total First Permit Term Required Reductions .................................................................... 3-15
4. Means and Methods to Meet Required Reductions and Schedule ............................................... 4-1
4.1 Historical BMP Data ................................................................................................................ 4-1
4.2 Pollutant Reduction Project Types ......................................................................................... 4-1
4.3 Projects for Pollutant Removal Credit.................................................................................... 4-1
4.3.1 Reedy Creek Stream Restoration ............................................................................ 4-2

City of Richmond Chesapeake Bay TMDL Action Plan Table of Contents
iii
Use of contents on this sheet is subject to the limitations specified at the end of this document.
Final Richmond Chesapeake Bay TMDL AP - final
4.3.2 Rattlesnake Creek Stream Restoration ..................................................................4-3
4.3.3 Albro Creek Stream Restoration ..............................................................................4-4
4.3.4 Pocosham Creek Stream Restoration .....................................................................4-5
4.3.5 Maury Cemetery Stream Restoration ......................................................................4-7
4.3.6 First Permit Term Pollutant Reduction Credit .........................................................4-8
4.3.7 Other Water Quality Projects in Planning or Implementation ................................4-9
4.4 Implementation Schedule and Estimated Cost to Complete ...............................................4-9
4.5 A List of Future Projects and Associated Acreage that Qualify as Grandfathered ..............4-9
5. Public Comments on Draft Action Plan ............................................................................................5-1
6. Conclusion .........................................................................................................................................6-1
7. Limitations .........................................................................................................................................7-1
8. References ........................................................................................................................................8-1
Appendix A: Maps.......................................................................................................................................A-1
Appendix B: Source Data…………………………………………………………………………………………………………....B-1
Appendix C: List of Existing Legal Authority..............................................................................................C-1
Appendix D: BMPs Constructed Between June 30, 2009 and July 1, 2014……………………………….…..D-1
Appendix E: Modifications to the Plan ......................................................................................................E-1
List of Figures
Figure ES-1. City of Richmond MS4 service area ...................................................................................... vii
Figure ES-2. Current condition of Pocosham Creek (dated October 2013) ............................................. x
Figure ES-3. Current condition of Maury Cemetery Creek (dated December 2013) ............................... xi
Figure 1-1. Richmond and the extents of the James River Basin. .........................................................1-1
Figure 3-1. VPDES Permits within the City ...............................................................................................3-4
Figure 3-2. VDOT ROW within the City ......................................................................................................3-5
Figure 3-3. Forested land within the City .................................................................................................3-6
Figure 3-4. Impervious areas within the MS4 service area ....................................................................3-8
Figure 4-1. Approximate location of Reedy Creek stream restoration ...................................................4-2
Figure4-2. Approximate location of the Rattlesnake Creek stream restoration ....................................4-3
Figure 4-3. Approximate location of the Albro Creek stream restoration ..............................................4-5
Figure 4-4. Approximate location of the Pocosham Creek stream restoration .....................................4-6
Figure 4-5. Approximate location of the Maury Cemetery Creek stream restoration ...........................4-7
Figure 1: MS4 Service Area Delineation ..................................................................................................... 2
Figure 2: First Permit Term Projects ........................................................................................................... 2
City of Richmond Chesapeake Bay TMDL Action Plan Table of Contents
iv
Use of contents on this sheet is subject to the limitations specified at the end of this document.
Final Richmond Chesapeake Bay TMDL AP - final
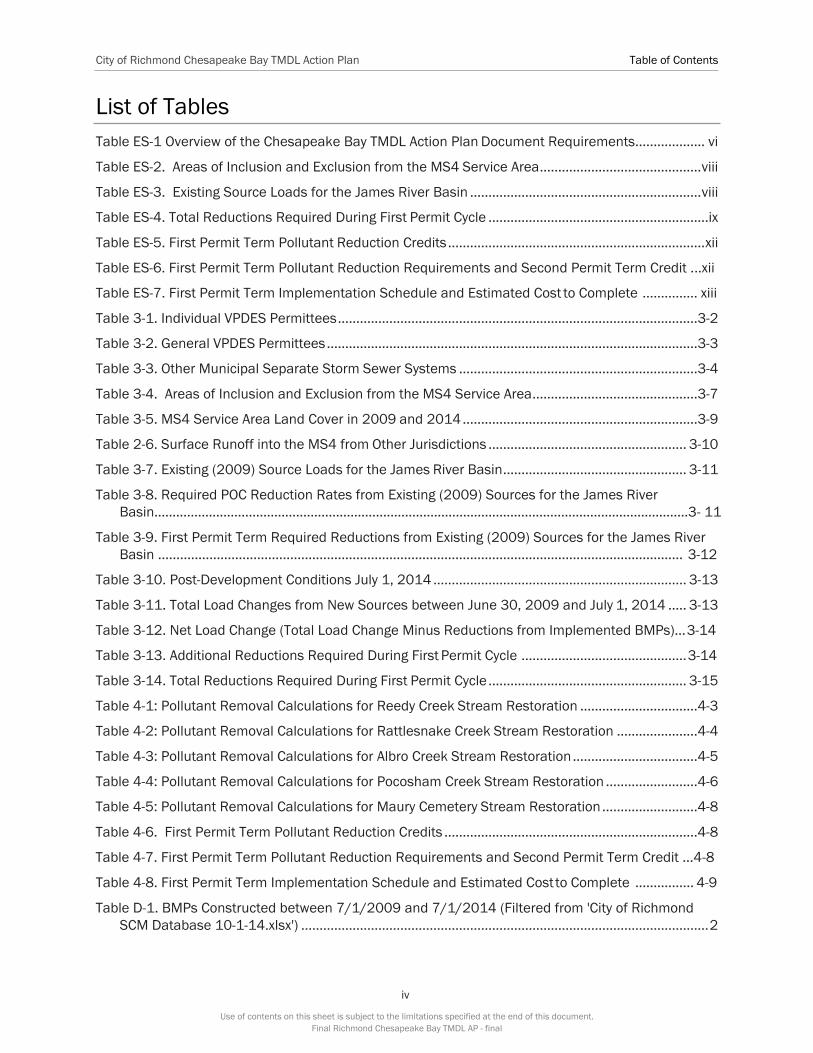
List of Tables
Table ES-1 Overview of the Chesapeake Bay TMDL Action Plan Document Requirements................... vi
Table ES-2. Areas of Inclusion and Exclusion from the MS4 Service Area ............................................ viii
Table ES-3. Existing Source Loads for the James River Basin ............................................................... viii
Table ES-4. Total Reductions Required During First Permit Cycle ............................................................ ix
Table ES-5. First Permit Term Pollutant Reduction Credits ...................................................................... xii
Table ES-6. First Permit Term Pollutant Reduction Requirements and Second Permit Term Credit ...xii
Table ES-7. First Permit Term Implementation Schedule and Estimated Cost to Complete ............... xiii
Table 3-1. Individual VPDES Permittees ..................................................................................................3-2
Table 3-2. General VPDES Permittees .....................................................................................................3-3
Table 3-3. Other Municipal Separate Storm Sewer Systems .................................................................3-4
Table 3-4. Areas of Inclusion and Exclusion from the MS4 Service Area .............................................3-7
Table 3-5. MS4 Service Area Land Cover in 2009 and 2014 ................................................................3-9
Table 2-6. Surface Runoff into the MS4 from Other Jurisdictions ...................................................... 3-10
Table 3-7. Existing (2009) Source Loads for the James River Basin .................................................. 3-11
Table 3-8. Required POC Reduction Rates from Existing (2009) Sources for the James River
Basin…………………………………………………………………………………………………………………………………3- 11
Table 3-9. First Permit Term Required Reductions from Existing (2009) Sources for the James River
Basin ............................................................................................................................................... 3-12
Table 3-10. Post-Development Conditions July 1, 2014 ..................................................................... 3-13
Table 3-11. Total Load Changes from New Sources between June 30, 2009 and July 1, 2014 ..... 3-13
Table 3-12. Net Load Change (Total Load Change Minus Reductions from Implemented BMPs)... 3-14
Table 3-13. Additional Reductions Required During First Permit Cycle ............................................. 3-14
Table 3-14. Total Reductions Required During First Permit Cycle ...................................................... 3-15
Table 4-1: Pollutant Removal Calculations for Reedy Creek Stream Restoration ................................4-3
Table 4-2: Pollutant Removal Calculations for Rattlesnake Creek Stream Restoration ......................4-4
Table 4-3: Pollutant Removal Calculations for Albro Creek Stream Restoration ..................................4-5
Table 4-4: Pollutant Removal Calculations for Pocosham Creek Stream Restoration .........................4-6
Table 4-5: Pollutant Removal Calculations for Maury Cemetery Stream Restoration ..........................4-8
Table 4-6. First Permit Term Pollutant Reduction Credits .....................................................................4-8
Table 4-7. First Permit Term Pollutant Reduction Requirements and Second Permit Term Credit ...4-8
Table 4-8. First Permit Term Implementation Schedule and Estimated Cost to Complete ................ 4-9
Table D-1. BMPs Constructed between 7/1/2009 and 7/1/2014 (Filtered from 'City of Richmond
SCM Database 10-1-14.xlsx') ............................................................................................................... 2

City of Richmond Chesapeake Bay TMDL Action Plan Table of Contents
v
Use of contents on this sheet is subject to the limitations specified at the end of this document.
Final Richmond Chesapeake Bay TMDL AP - final
List of Abbreviations
1 Ac acre(s) 21 Plan Chesapeake Bay TMDL Action Plan
2 Ac-ft acre-foot(feet) 22 POC pollutant of concern
3 BMP best management practice 23 ROW right-of-way
4 CIP Capital Improvement Plan 24 SLAF Stormwater Local Assistance Fund
5 City City of Richmond 25 TMDL total maximum daily load
6 CSS combined sewer system 26 TN total nitrogen
7 DEQ Virginia Department of Environmental 27 TP total phosphorus
8 Quality
9 DOF Virginia Department of Forestry
10 EOS edge of stream
11 FIA Forest Inventory and Analysis
12 FWS Fish and Wildlife Service
13 GIS geographic information system
14 lb pound(s)
15 lf linear foot/feet
16 MS4 municipal separate storm sewer
17 system
18 NED National Elevation Dataset
19 NLCD National Land Cover Dataset
20 NWI National Wetlands Inventory
28 TSS total suspended solids
29 USFS United States Forest Service
30 USGS United States Geological Survey
31 VAG11 General VPDES Permit for Concrete
32 Products Facilities
33 VAG84 Nonmetallic Mineral Processing
34 General Permit
35 VAR05 General VPDES Permit for Stormwater
36 Associated with an Industrial Activity
37 VDOT Virginia Department of Transportation
38 VPDES Virginia Pollutant Discharge Elimination
39 System
40 yr year(s)
41

vi
Use of contents on this sheet is subject to the limitations specified at the end of this document.
Final Richmond Chesapeake Bay TMDL AP - final
City of Richmond Chesapeake Bay TMDL Action Plan Executive Summary
Executive Summary
The City of Richmond (City) has developed this first permit term Chesapeake Bay Total Maximum
Daily Load (TMDL) Action Plan (Plan) as required in the 2013-2018 General Permit for Discharges of
Stormwater from Small Municipal Separate Storm Sewer Systems (Permit Term II MS4 Permit) and in
accordance with the Virginia Department of Environmental Quality (DEQ) Chesapeake Bay TMDL
Action Plan Guidance Document (Guidance Document) dated May 18, 2015. This Plan required an
evaluation of the 2009 MS4 boundary, calculation of the pollutant of concern (POC) loading and first
permit term required reductions, projects to meet the reductions, a legal authority review of the City’s
ordinances and other documents that allow the City to meet the requirements of the Plan, and a
summary of the public comment process. Table ES-1 provides an overview of the Phase II MS4
Permit requirements and the corresponding section where the requirement is addressed.
Table ES-1 Overview of the Chesapeake Bay TMDL Action Plan Document Requirements
General Permit Section
Description of Requirement Corresponding Section(s)/Appendix of
this TMDL Action Plan Page Number(s)
I.C.2.a.(1) Current program and existing legal authority Section 2.1 2-1
I.C.2.a.(2) New or modified legal authority Section 2.2 2-1
I.C.2.a.(3) Means and methods to address discharges from new sources Section 2.3 2-1
I.C.2.a.(4) Estimated existing source loads Section 3.2 3-8
I.C.2.a.(5) Calculated total pollutant of concern required reductions Section 3.3 3-11
I.C.2.a.(6) Means and Methods to meet the required reductions and schedule Sections 4.3 and 4.4 4-1 and 4-9
I.C.2.a.(7) Means and methods to offset increased loads from new sources initiating construction between July 1, 2009 and June 30, 2014
Sections 3.4.1 and 4.3 3-13 and 4-1
I.C.2.a.(8) Means and methods to offset increased loads from grandfathered
projects that begin construction after July 1, 2014 Section 3.4.2 3-15
I.C.2.a.(9) Modifications to the TMDL or watershed implementation plan Appendix D D-1
I.C.2.a.(10) A list of future projects and associated acreage that qualify as
grandfathered Section 4.5 4-9
I.C.2.a.(11) An estimate of the expected cost to implement the necessary
reductions Section 4.4 4-9
I.C.2.a.(12) Public comments on the draft action plan Section 5 5-1
The 2009 MS4 service area was delineated with spatial data provided by the City, as well as
datasets obtained from the US Census Bureau, DEQ, and US Geological Survey (USGS) National
Elevation Dataset (NED). The list of datasets collected for this Plan is included in Appendix B. The
service area is the City boundary, excluding the combined sewer system (CSS) service area, VPDES
permittees and other MS4s, forested areas greater than half an acre, open water, and areas that
drain by surface runoff out of the MS4 service area. The areas of direct surface runoff into the MS4
from other jurisdictions were delineated and added to the MS4 service area. Figure ES-1 shows the
exclusion areas and the MS4 service area. Table ES-2 lists each exclusion type and the incremental
change in the MS4 service area.

City of Richmond Chesapeake Bay TMDL Action Plan Executive Summary
vii
Use of contents on this sheet is subject to the limitations specified at the end of this document.
Final Richmond Chesapeake Bay TMDL AP - final
Figure ES-1. City of Richmond MS4 service area

City of Richmond Chesapeake Bay TMDL Action Plan Executive Summary
viii
Use of contents on this sheet is subject to the limitations specified at the end of this document.
Final Richmond Chesapeake Bay TMDL AP - final
Table ES-2. Areas of Inclusion and Exclusion from the MS4 Service Area
Area Category Area (Ac)
City of Richmond Boundary 40,011
Exclusion Areas
CSS 10,618
VPDES permits and other MS4s (excluding VDOT) 1,043
VDOT Roads 597
Forested Lands and Wetlands 5,188
Agricultural Lands 0
Open Water 2,222
Surface Flow 483
Total Exclusion Area (Non-Overlapping)a 18,631
Total MS4 Service Area within the City Boundary 21,380
Inclusion Areas:
Surface Inflow 22
Total Inclusion Area 22
Total MS4 Service Area 21,402
a. The total exclusion area is less than the sum of the individual exclusion areas because some of the individual exclusion
areas overlap.
The 2009 land cover characteristics were estimated from the current (2014) impervious land cover
provided by the City in geographic information systems (GIS) files. The annual POC loads for existing
development were calculated from the 2009 land cover using the edge of stream (EOS) loading rates
provided in the Phase II MS4 Permit for the James River Basin, as shown in Table ES-3.
Table ES-3. Existing Source Loads for the James River Basin
Subsource
Pollutant
Total Existing Acres
Served by MS4
(06/30/09)
2009 EOS
Loading Rate
(lb/Ac/yr)
Estimated Total POC
Load Based on 2009
Progress Run (lb/yr)
Estimated Total
POC Load
(lb/yr)
Regulated Urban
impervious
Total Nitrogen
7,231.38
9.39
67,902.69
166,955.30
Regulated Urban Pervious 14,170.62 6.99 99,052.51
Regulated Urban
impervious
Total
Phosphorus
7,231.38
1.76
12,727.23
19,812.54
Regulated Urban Pervious 14,170.62 0.5 7,085.31
Regulated Urban
impervious Total
Suspended
Solids
7,231.38
676.94
4,895,212.70
6,327,578.62
Regulated Urban Pervious 14,170.62 101.08 1,432,365.92
After the existing source loads were calculated, the first permit term progress of five percent was
calculated for existing development and new sources initiating construction between July 1, 2009,
and June 30, 2014 (Special Condition 7).
City of Richmond Chesapeake Bay TMDL Action Plan Executive Summary
ix
Use of contents on this sheet is subject to the limitations specified at the end of this document.
Final Richmond Chesapeake Bay TMDL AP - final
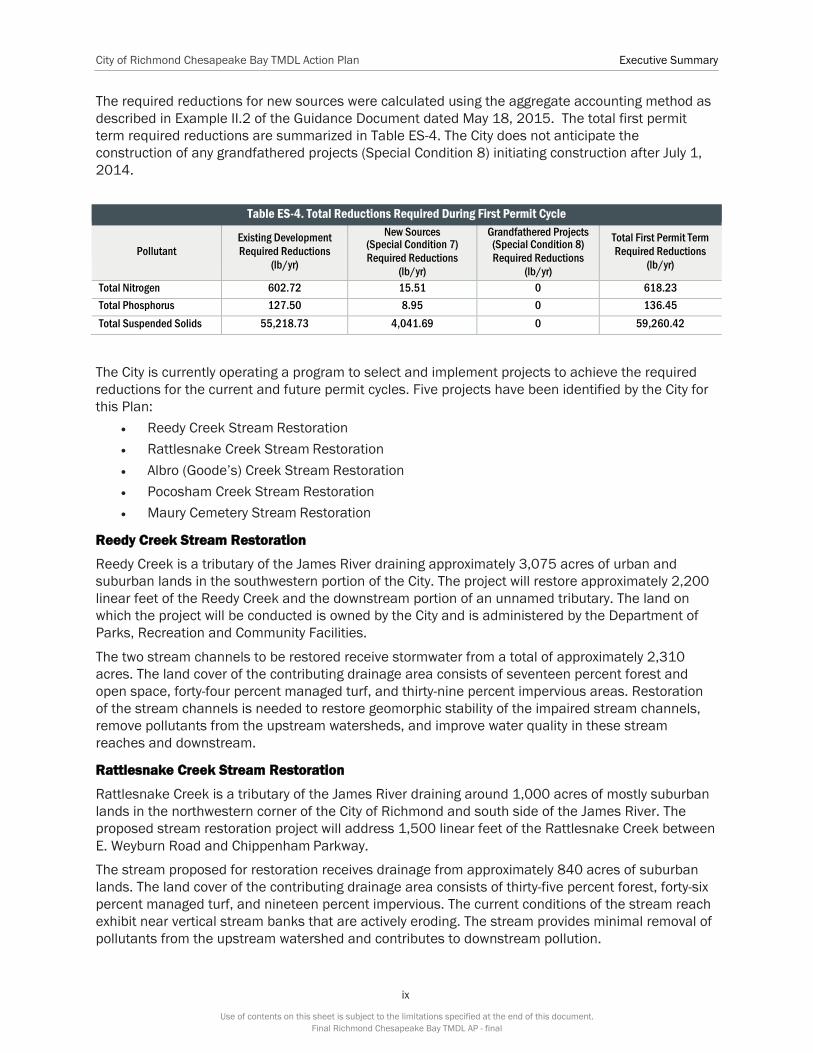
The required reductions for new sources were calculated using the aggregate accounting method as
described in Example II.2 of the Guidance Document dated May 18, 2015. The total first permit
term required reductions are summarized in Table ES-4. The City does not anticipate the
construction of any grandfathered projects (Special Condition 8) initiating construction after July 1,
2014.
Table ES-4. Total Reductions Required During First Permit Cycle
Pollutant
Existing Development
Required Reductions
(lb/yr)
New Sources (Special Condition 7)
Required Reductions
(lb/yr)
Grandfathered Projects (Special Condition 8)
Required Reductions
(lb/yr)
Total First Permit Term
Required Reductions
(lb/yr)
Total Nitrogen 602.72 15.51 0 618.23
Total Phosphorus 127.50 8.95 0 136.45
Total Suspended Solids 55,218.73 4,041.69 0 59,260.42
The City is currently operating a program to select and implement projects to achieve the required
reductions for the current and future permit cycles. Five projects have been identified by the City for
this Plan:
Reedy Creek Stream Restoration
Rattlesnake Creek Stream Restoration
Albro (Goode’s) Creek Stream Restoration
Pocosham Creek Stream Restoration
Maury Cemetery Stream Restoration
Reedy Creek Stream Restoration
Reedy Creek is a tributary of the James River draining approximately 3,075 acres of urban and
suburban lands in the southwestern portion of the City. The project will restore approximately 2,200
linear feet of the Reedy Creek and the downstream portion of an unnamed tributary. The land on
which the project will be conducted is owned by the City and is administered by the Department of
Parks, Recreation and Community Facilities.
The two stream channels to be restored receive stormwater from a total of approximately 2,310
acres. The land cover of the contributing drainage area consists of seventeen percent forest and
open space, forty-four percent managed turf, and thirty-nine percent impervious areas. Restoration
of the stream channels is needed to restore geomorphic stability of the impaired stream channels,
remove pollutants from the upstream watersheds, and improve water quality in these stream
reaches and downstream.
Rattlesnake Creek Stream Restoration
Rattlesnake Creek is a tributary of the James River draining around 1,000 acres of mostly suburban
lands in the northwestern corner of the City of Richmond and south side of the James River. The
proposed stream restoration project will address 1,500 linear feet of the Rattlesnake Creek between
E. Weyburn Road and Chippenham Parkway.
The stream proposed for restoration receives drainage from approximately 840 acres of suburban
lands. The land cover of the contributing drainage area consists of thirty-five percent forest, forty-six
percent managed turf, and nineteen percent impervious. The current conditions of the stream reach
exhibit near vertical stream banks that are actively eroding. The stream provides minimal removal of
pollutants from the upstream watershed and contributes to downstream pollution.

City of Richmond Chesapeake Bay TMDL Action Plan Executive Summary
x
Use of contents on this sheet is subject to the limitations specified at the end of this document.
Final Richmond Chesapeake Bay TMDL AP - final
Restoration of the stream channel is needed to restore geomorphic stability of the impaired stream
channel and remove pollutants from stormwater and the upstream watershed.
Albro Creek Stream Restoration
The Albro Creek project will restore approximately 1,281 linear feet of stream and create 3.0 acres
of wetlands to restore and improve the water quality of Albro Creek (also called Bellemeade Creek),
which flows to the James River via Goode’s Creek. The local project site is separated from the
upstream section of Albro Creek by a large diversion pipe. The local drainage area upstream of the
restoration site is 35.17 acres, and the upstream portion of Albro Creek drains approximately 1,200
acres. Because the restored stream will have the potential to remove more nutrients than the local
drainage area (35.17 acres) is generating, a flow splitting structure will be utilized to convey
additional flows to the restored section of Albro Creek during wet weather events. Opportunities may
also exist for establishment of a conservation buffer around this tributary of Goode’s Creek. This
project is intended to improve water quality, provide flood protection, and reduce bank erosion.
Pocosham Creek Stream Restoration
The Pocosham Creek stream restoration project (Project) is located on a tributary of Pocoshock
Creek that flows into Falling Creek, which ultimately flows to the James River. This tributary drains
approximately 3,625 acres of mostly suburban and forest lands in the southwestern side of the City,
west of the James River. Approximately half of the watershed is located within the City-limits and the
other half is located in Chesterfield County. The restoration project will restore approximately a
5,990 linear feet of stream channel. Figure ES-2 is an example of the current condition of the creek.
Figure ES-2. Current condition of Pocosham Creek (dated October 2013).
A 6-foot wide trail will be constructed as part of the Pocosham Creek Stream Restoration project.

City of Richmond Chesapeake Bay TMDL Action Plan Executive Summary
xi
Use of contents on this sheet is subject to the limitations specified at the end of this document.
Final Richmond Chesapeake Bay TMDL AP - final
The path will run the length of the restoration segment (approximately 6,000 linear feet) and will
utilize the access corridor created by the Contractor to construct the project. Access to the path will
be from the multiple construction entrances at the various locations along the project.
Maury Cemetery Creek Stream Restoration
The Maury Cemetery Stream Restoration project is located within the City’s Maury Cemetery and will
restore approximately 1,980 linear feet of stream channel. The project is bounded to the north by
Maury Street, to the south by North Hopkins Road, to the east by an existing CSX railroad, and to the
west by Maury Cemetery. This work is being performed to improve the overall function of the Maury
Cemetery Stream, including but not limited to preventing erosion, restoring habitat, and improving
the water quality function of the stream. Figure ES-3 is an example of the current condition of the
creek. The project is expected to include the following elements:
Modifying grades of the existing Maury Cemetery Stream
Demolition and removal of existing masonry and stone structures
Installation of new storm sewer pipe and/or extending existing storm sewer pipe
Installation of in-stream structures such as log J-hooks and fieldstone cross vanes
Vertical off setting of existing waterline
Adjusting rim of existing sanitary structures
Landscaping and restoration of all disturbed areas
Figure ES-3. Current condition of Maury Cemetery Creek (dated December 2013).
Each project is currently in design or in the planning process. The POC reduction for each project is
shown in Table ES-5. At a minimum, the City will ensure that projects will be in construction by June
30, 2018 to meet the five percent required progress. Progress greater than five percent will be
credited toward the second permit term Plan.

City of Richmond Chesapeake Bay TMDL Action Plan Executive Summary
xii
Use of contents on this sheet is subject to the limitations specified at the end of this document.
Final Richmond Chesapeake Bay TMDL AP - final
Table ES-5. First Permit Term Pollutant Reduction Credits
Project
Total
Nitrogen
(lb/yr)
Total
Phosphorus
(lb/yr)
Total
Suspended
Solids
(lb/yr)
Reedy Creek Stream Restoration
165.00
149.60
98,736.00
Rattlesnake Creek Stream Restoration
112.50
102.00
67,320.00
Albro Creek Stream Restoration
96.08
87.11
57,491.28
Pocosham Creek Stream Restoration
449.25
407.32
268,831.20
Maury Cemetery Stream Restoration
148.50
134.64
88,862.40
Total
919.58
833.75
550,273.68
The first permit term required reductions will be exceeded and the additional credit will be included
in the second permit term Plan. The second permit term will require that the City meet a 35 percent
reduction requirement. The credit from this Plan to be applied in the second permit term includes
2.44 percent TN, 25.55 percent TP, and 41.43 percent TSS, as shown in Table ES-6.
Table ES-6. First Permit Term Pollutant Reduction Requirements and Second Permit Term Credit
Project
Total
Nitrogen
(lb /yr)
Total
Phosphorus
(lb /yr)
Total
Suspended
Solids
(lb /yr)
First Permit Term Reduction Credit 919.58 833.75 550,273.68
First Permit Term Required Reduction 618.23 136.45 59,260.42
Credit to be Applied in Second Permit Term 301.35 697.30 491,013.26
Percent Reduction to be Applied in Second Permit Term 2.44% 25.55% 41.43%
Table ES-7 provides the current project status, implementation schedule, and cost estimate for each
project. Pocosham Creek Stream Restoration and Maury Cemetery Stream Restoration are in the
planning process and anticipated to begin construction in August 2015. Reedy Creek, Rattlesnake
Creek, and Albro Creek are currently in design with construction anticipated to begin in late 2015.
The total cost of implementation is approximately $7 million.

City of Richmond Chesapeake Bay TMDL Action Plan Executive Summary
xiii
Use of contents on this sheet is subject to the limitations specified at the end of this document.
Final Richmond Chesapeake Bay TMDL AP - final
Table ES-7. First Permit Term Implementation Schedule and Estimated Cost to Complete
Project
Project Status
Estimated
Construction Start
Date
Estimated Cost to
Complete
Reedy Creek Stream Restoration In Design October 2015 $1,270,000
Rattlesnake Creek Stream Restoration In Design December 2015 $1,104,000
Albro Creek Stream Restoration In Design December 2015 $1,432,000
Pocosham Creek Stream Restoration Design Complete August 2015 $2,500,000
Maury Cemetery Stream Restoration Design Complete August 2015 $905,000
Total Estimated Cost to Complete Projects $7,211,000
In addition to the stream restoration projects described previously, the City is currently implementing
or planning to implement other projects throughout the City. The City currently conducts a street
sweeping program City-wide. The City is also conducting a green alleys program. This program is
creating buffer strips and other pervious areas in highly impervious areas throughout the City.
The City is also planning additional projects in fiscal years 2016 and 2017. Specific project data is
not yet available for inclusion in the first permit term Plan; however, the City will document these
projects as they are designed and constructed and incorporate them into future Plans.
In addition to the development of the MS4 service area and projects to meet the five percent
required reduction, the City has provided a review of the legal authority it has to implement the
Chesapeake Bay TMDL. This review is provided in Section 2. An overview of the public review
process is included in Section 5.
This first permit term TMDL Action Plan will become effective within 90 days of its submittal to DEQ,
unless the City is otherwise notified. It represents the City’s plan for meeting its Phase II MS4 Permit
requirements for the Chesapeake Bay TMDL Special Condition through 2018.

1-1
DRAFT for review purposes only. Use of contents on this sheet is subject to the limitations specified at the end of this document.
Richmond Chesapeake Bay TMDL AP - final
Section 1
Introduction
The City of Richmond (City) has developed this first permit term Total Maximum Daily Load (TMDL)
Action Plan (Plan) for the Chesapeake Bay nutrient and sediment TMDL, as required by the 2013-
2018 General Permit for Discharges of Stormwater from Small (Phase II) Municipal Separate Storm
Sewer Systems (MS4s) Number VAR040005. This Plan was developed following the Virginia
Department of Environmental Quality (DEQ) Chesapeake Bay TMDL Action Plan Guidance Document
(Guidance Document) dated May 18, 2015. This Plan is the first of three permit terms of
Chesapeake Bay TMDL Action Plans to be developed by the City to reduce the total nitrogen (TN),
total phosphorus (TP), and total suspended solids (TSS) loads from urban stormwater runoff.
The City is located within the James River Basin in central Virginia, and has a total land area of
40,011 acres, as shown in Figure 1-1. It is bordered by Chesterfield and Henrico Counties, and is
bisected by the James River. The City is located within the 2000 US Census Urban Cluster named
Richmond, Virginia.
Figure 1-1. Richmond and the extents of the James River Basin.

1-2
DRAFT for review purposes only. Use of contents on this sheet is subject to the limitations specified at the end of this document.
Richmond Chesapeake Bay TMDL AP - final
City of Richmond Chesapeake Bay TMDL Action Plan Section 1
The following sections explain the methods for the delineation of the 2009 City MS4 service area,
calculation of the pollutant of concern (POC) loads and reduction requirements, and the projects that
the City plans to implement to meet the reductions.
Maps of the MS4 service area and a list of the spatial datasets used for this evaluation are provided
in Appendices A and B, respectively. In addition, this Plan includes an evaluation of the current and
future legal authority to implement the Plan, a description of the public comment process, and an
estimate of implementation costs.

Section 2
2-1
Use of contents on this sheet is subject to the limitations specified at the end of this document.
Richmond Chesapeake Bay TMDL AP - final
Legal Authority for TMDL
Implementation
The Phase II MS4 Permit requires that the Plan document the current program and legal authority,
new or modified legal authority, and the means and methods to address discharges from the new
sources.
2.1 Current Program and Existing Legal Authority
Richmond has reviewed its current MS4 Program Plan and has determined that the authority as
stated in the current MS4 Program Plan is sufficient for compliance with this special condition.
Please refer to Appendix C for a list of relevant existing legal authority.
A list of the current program and existing legal authority will be provided by the City in the final Plan.
2.2 New or Modified Legal Authority
As described in Section 2.1, existing authority is sufficient for compliance with this special condition.
Therefore, no new or modified legal authority is considered necessary to meet the requirements of
this special condition.
2.3 Means and Methods to Address Discharges from New Sources
Richmond will adhere to the VSMP regulations for the implementation of post-development
stormwater management facilities.

3-1
Use of contents on this sheet is subject to the limitations specified at the end of this document.
Richmond Chesapeake Bay TMDL AP - final
Section 3
POC Loads and Required
Reductions
In accordance with the MS4 permit and Guidance Document dated May 18, 2015, POC loads and
first permit required reductions were calculated from the City’s MS4 service area and land cover as
of June 30, 2009. The MS4 service area was developed from the City boundary and 2000 US
Census Urban Area; excluding the combined sewer system (CSS) service area, other MS4 and VPDES
permittees, forested areas, open water bodies, and areas of surface runoff away from the MS4.
After the MS4 service area was delineated, the surrounding areas were reviewed for areas of surface
runoff into the MS4. Figure 1 in Appendix A identifies the final MS4 service area and exclusion and
inclusion areas.
After the MS4 service area was defined, the land cover characteristics as of June 30, 2009 were
estimated, and POC loads and reductions were calculated based upon the James River Basin rates
provided in the Phase II MS4 Permit. Finally, additional loads from new sources were evaluated and
the total first permit term required reduction was calculated. Each of these steps is described
further in sections below.
3.1 Definition of the MS4 Service Area
The Guidance Document dated May 18, 2015 defines the initial MS4 service area as the 2000 US
Census Urban Areas within the municipality’s boundary. Areas occupied by the CSS, other MS4 and
VPDES permittees, forested areas, and open water bodies may be excluded from the MS4 service
area. Land areas that drain by surface runoff away from the MS4 may be excluded from calculations
of the City’s pollutant removal requirement. Similarly, areas that drain by surface runoff onto lands
currently served by the City MS4 must be included in calculations of the City’s pollutant removal
requirement.
The MS4 service area was delineated using spatial data provided by the City or obtained from other
sources, as documented in Appendix B. In accordance with the Guidance Document dated May 18,
2015, the initial MS4 service area was defined using the 2000 US Census Urban Areas and the City
boundary. Individual exclusion area files were created for VPDES and other MS4 permittees,
forested areas and wetlands, agricultural lands, and open waters. Some areas fall into more than
one exclusion category, and so exclusion areas are partially overlapping. The initial MS4 service area
was clipped in geographic information systems (GIS) program using each of the exclusion area files
to create an interim MS4 service area.
After the interim MS4 service area was developed, areas that drain by surface flow away from the
City MS4 were delineated in GIS and excluded from calculations of the City’s pollutant removal
requirement. Similarly, land areas outside of the City boundary that drain by surface flow onto lands
currently served by the City MS4 were delineated, because they contribute to the City’s pollutant
removal requirement. These surface flows out of and into the MS4 service area were subtracted
from or added to the interim service area to create the final MS4 service area for the first permit
term Plan.

City of Richmond Chesapeake Bay TMDL Action Plan Section 3
3-2
Use of contents on this sheet is subject to the limitations specified at the end of this document.
Richmond Chesapeake Bay TMDL AP - final
3.1.1 City of Richmond Boundary
The City boundary GIS file was downloaded from the City’s website in March 2014. This file consists
of a single polygon that represents the entire City including the James River. The total area of the
City, as represented in this file, is approximately 40,011 acres.
3.1.2 2000 US Census Urban Areas
The US Census Bureau defined urban areas during the 2000 census as a core of census blocks with
a minimum population density of 1,000 people per square mile and surrounding census blocks with
a minimum population density of 500 people per square mile. The 2000 US Census urban areas, as
revised in 2011, were downloaded from the US Census website in January 2015. The City boundary
is located entirely within the Richmond, Virginia Urban Cluster.
3.1.3 Combined Sewer System
Although the CSS service area is not specifically listed in Guidance Document dated May 18, 2015
as an exclusion area from the MS4, the CSS service areas are not part of the MS4, and are regulated
separately by DEQ. The CSS service area is delineated in a GIS file provided by the City in March
2014. The GIS file includes revisions dated February 2014 and represents the current system.
The CSS is primarily located in the northeastern portion of the City including the Virginia
Commonwealth University campus, with a smaller CSS located across the James River. The CSS
area encompasses approximately 10,618 acres of the City. Figure 1 in Appendix A displays the CSS
service area.
3.1.4 VPDES Permittees
Lands regulated under an Individual VPDES Permit for Industrial Stormwater Discharges—or any
General VPDES Permit that addresses industrial stormwater—may be excluded from the City MS4
service area. These permittees must meet stormwater discharge requirements as stated in their
permits. DEQ documents individual and general VPDES Permits in a statewide database and
provides permittee data on the DEQ website in Microsoft Excel spreadsheets. The spreadsheets
were accessed from the DEQ website in January 2015, and active permits located within the City
were selected from the files for GIS mapping.
There are five Individual VPDES permittees located within the City, as shown in Table 3-1. The table
includes permit number, facility name and address, permit type, and facility type.
Table 3-1. Individual VPDES Permittees
Permit No. Facility Address Permit Type Facility Type
VA0087734 Dominion - Materials and Metering Services Center 4307 Castlewood Rd Minor Industrial
VA0058378 Kinder Morgan Southeast Terminals LLC - Richmond 2 4110 Deepwater Terminal Rd Minor Industrial
VA0086151 Kinder Morgan Transmix Company LLC 3302 Deepwater Terminal Rd Minor Industrial
VA0063177 Richmond WWTP 1400 Brander St Major Municipal
VA0085499 Spruance Genco LLC 5001 Commerce Rd Minor Industrial
There are three types of General VPDES permits that may be excluded from the MS4 service area;
the General VPDES Permit for Stormwater Associated with Industrial Activity (VAR05), the General
VPDES Permit for Concrete Products Facilities (VAG11), and the General VPDES Permit for
Nonmetallic Mineral Mining (VAG84).

City of Richmond Chesapeake Bay TMDL Action Plan Section 3
3-3
Use of contents on this sheet is subject to the limitations specified at the end of this document.
Richmond Chesapeake Bay TMDL AP - final
Each of these permits addresses industrial stormwater discharge requirements that the operator
must achieve prior to discharging stormwater runoff from the permitted facility. The concrete
products facilities and nonmetallic mineral mining permits were added to the allowable exclusions in
the Guidance Document dated May 18, 2015. There are twenty-three general permittees within the
City, as shown in Table 3-2. Twenty of the permits are for industrial activities, one permit is for
concrete products facilities, and two permits are for nonmetallic mineral mining.
Table 3-2. General VPDES Permittees
Permit No. Facility Address Permit Type
VAR050554 Spruance Genco LLC 5001 Commerce Rd Industrial Activity
VAR050563 Smith Iron and Metal Company Inc. 3000 Bells Rd Industrial Activity
VAR050588 SMM Southeast LLC - Richmond 3220 Deepwater Terminal Rd Industrial Activity
VAR050603 Eubank Trucks Incorporated 3708 N Hopkins Rd Industrial Activity
VAR050613 Carpenter Company Richmond Division 2400 Jefferson Davis Hwy Industrial Activity
VAR050657 UPS Freight - Richmond 5401 Midlothian Tpke Industrial Activity
VAR050910 Upaco Adhesives - Division of Worthen Industries 4105 Castlewood Rd Industrial Activity
VAR051019 Philip Morris USA Incorporated - Manufacturing Ctr 3601 Commerce Rd Industrial Activity
VAR051020 Port of Richmond 5000 Deepwater Terminal Rd Industrial Activity
VAR051027 Liphart Steel Company Incorporated 3308 Rosedale Ave Industrial Activity
VAR051103 Sonoco Products Company 1850 Commerce Rd Industrial Activity
VAR051133 Estes Express Lines 1200 Commerce Rd Industrial Activity
VAR051151 Packaging Corporation of America 2000 Jefferson Davis Hwy Industrial Activity
VAR051176 International Paper Company - Richmond Plant 2811 Cofer Rd Industrial Activity
VAR051484 Branscome Richmond - Deepwater Terminal Rd 2106 Deepwater Terminal Rd Industrial Activity
VAR051549 International Paper - Richmond Recycling Center 1308 Jefferson Davis Hwy Industrial Activity
VAR051818 Richmond Recycling Company 2500 Decatur St Industrial Activity
VAR051888 Kenan Transport LLC - 506 E Clopton St 506 E Clopton St Industrial Activity
VAR052028 Greater Richmond Transit Co – O/M 301 E Belt Blvd Industrial Activity
VAR052128 Alloy Polymers Incorporated 3310 Deepwater Terminal Rd Industrial Activity
VAG110308 Hanson Pipe and Precast - Richmond 2900 Terminal Dr Concrete Products Facility
VAG840078 Luck Stone - South Richmond Plant 2100 Deepwater Terminal Rd Nonmetallic Mineral Mining
VAG840120 Vulcan Construction Materials LP - Richmond Quarry 1500 Goodes St Nonmetallic Mineral Mining
A VPDES Permittee GIS file was developed from the City parcel GIS file and the VPDES permittee
spreadsheets. The City parcel GIS file was downloaded from the City website in January 2015. The
permittees were located by property address in GIS using the City parcel attributes and the permit
number and permit type were added as new attribute fields. The permit locations were then
reviewed with aerial imagery and surrounding parcel ownership data to determine whether
neighboring parcels appear to be contiguous permittee lands of the same land use. Figure 3-1
displays the locations of the land areas associated with the permits.

City of Richmond Chesapeake Bay TMDL Action Plan Section 3
3-4
Use of contents on this sheet is subject to the limitations specified at the end of this document.
Richmond Chesapeake Bay TMDL AP - final
Figure 3-1. VPDES Permits within the City.
3.1.5 Other MS4 Permittees
In addition to removing the VPDES permittees from the MS4 service area, other MS4 permittees
were identified within the City boundary. The MS4 permittees Excel spreadsheet was accessed from
the DEQ website in January 2015. Two other Phase II General MS4 permittees are located within the
City, as shown in Table 3-3. The Hunter Homes McGuire Veteran Affairs Hospital was identified using
the same process as the VPDES permittees, as discussed in Section 3.1.4 and shown in Figure 3-1.
Table 3-3. Other Municipal Separate Storm Sewer Systems
Permit No. Owner/Operator Designation Type
VAR040133 Virginia Department of Transportation Phase II State
VAR040074 Hunter Homes McGuire Veteran Affairs Hospital Phase II Federal
The roadways maintained by the Virginia Department of Transportation (VDOT), which owns a
statewide Phase II MS4 permit, were identified in two stages. First, the City parcel GIS file and the
City boundary GIS file were evaluated to identify undelineated areas in the parcel file. These voids
are typically roadway rights-of-way (ROWs), including VDOT-maintained roads. A VDOT ROW GIS file
was created by clipping a copy of the City boundary GIS file with the parcel information so that only
the roadway ROWs remained.
Next, the interstates within the City were identified. These include I-64, I-95, and I-195 and
associated on and off ramps. It is assumed that VDOT will be responsible for all stormwater within
their ROW areas, so no other modifications were made to the GIS file. The VDOT ROWs are
approximately 597 acres within the City boundary. Figure 3-2 includes the location of the VDOT
ROWs.

City of Richmond Chesapeake Bay TMDL Action Plan Section 3
3-5
Use of contents on this sheet is subject to the limitations specified at the end of this document.
Richmond Chesapeake Bay TMDL AP - final
Figure 3-2. VDOT ROW within the City.
3.1.6 Forested Lands and Wetlands
A raster image file was downloaded from VA Department of Forestry (DOF) website in April 2015.
The VA DOF file was created in 2005 using 2004 aerial imagery to identify forests that meet the US
Forest Service (USFS) Forest Inventory and Analysis (FIA) Program. The raster image classifies land
in three categories; water, forest, and non-forest. The resolution of the raster image is a 30 meter
grid.
The US Fish and Wildlife Service (FWS) National Wetlands Inventory (NWI) GIS file was downloaded
from the FWS website in June 2014. The FWS NWI metadata indicates that the wetlands within the
City were identified between 1994 and 2000. A review of the locations of NWI wetlands within the
City boundary indicated that the same locations were also included in the VA DOF raster image or the
open waters GIS files discussed in Section 3.1.8. As such, the FWS and NWI GIS file was not needed
for this analysis.
The raster image file was converted into a polygon GIS file and clipped to the City boundary. The
resulting file was then evaluated to isolate the forest land category and remove polygons that are
less than 0.5 acres. The final GIS file indicates approximately 5,188 acres of forested lands within
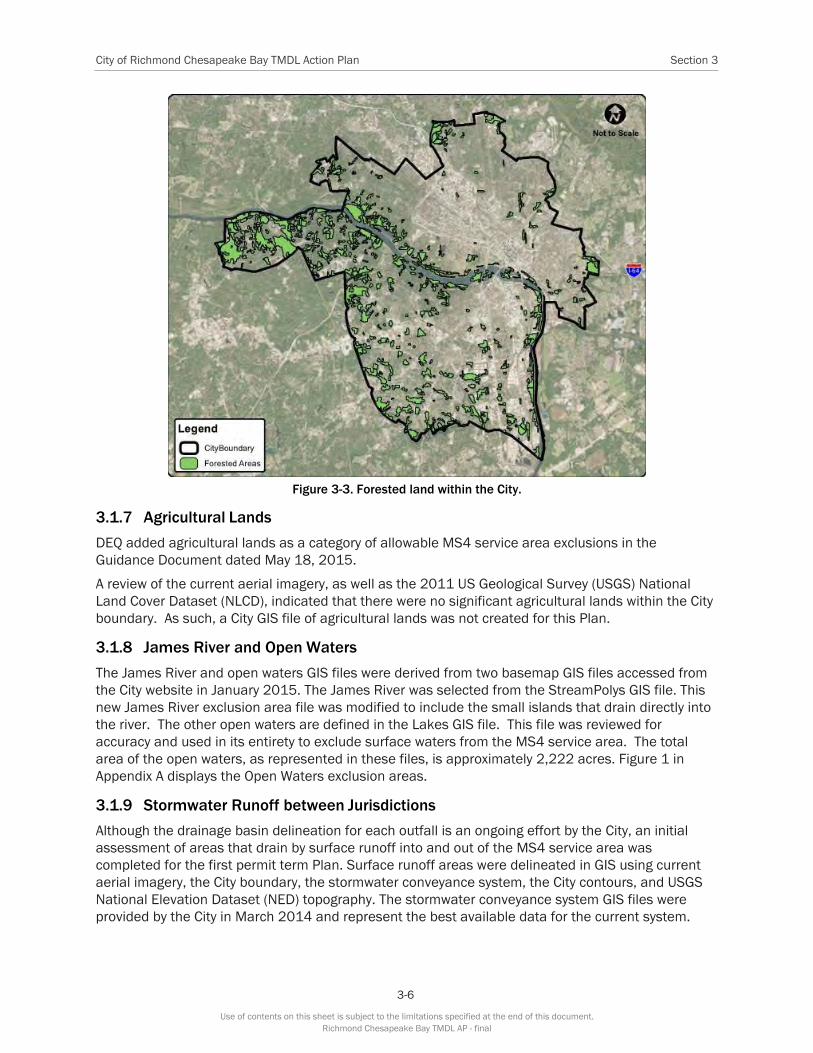
the City boundary. Figure 3-3 displays the locations of forested lands.
City of Richmond Chesapeake Bay TMDL Action Plan Section 3
3-6
Use of contents on this sheet is subject to the limitations specified at the end of this document.
Richmond Chesapeake Bay TMDL AP - final
3.1.7 Agricultural Lands
Figure 3-3. Forested land within the City.
DEQ added agricultural lands as a category of allowable MS4 service area exclusions in the
Guidance Document dated May 18, 2015.
A review of the current aerial imagery, as well as the 2011 US Geological Survey (USGS) National
Land Cover Dataset (NLCD), indicated that there were no significant agricultural lands within the City
boundary. As such, a City GIS file of agricultural lands was not created for this Plan.
3.1.8 James River and Open Waters
The James River and open waters GIS files were derived from two basemap GIS files accessed from
the City website in January 2015. The James River was selected from the StreamPolys GIS file. This
new James River exclusion area file was modified to include the small islands that drain directly into
the river. The other open waters are defined in the Lakes GIS file. This file was reviewed for
accuracy and used in its entirety to exclude surface waters from the MS4 service area. The total
area of the open waters, as represented in these files, is approximately 2,222 acres. Figure 1 in
Appendix A displays the Open Waters exclusion areas.
3.1.9 Stormwater Runoff between Jurisdictions
Although the drainage basin delineation for each outfall is an ongoing effort by the City, an initial
assessment of areas that drain by surface runoff into and out of the MS4 service area was
completed for the first permit term Plan. Surface runoff areas were delineated in GIS using current
aerial imagery, the City boundary, the stormwater conveyance system, the City contours, and USGS
National Elevation Dataset (NED) topography. The stormwater conveyance system GIS files were
provided by the City in March 2014 and represent the best available data for the current system.

City of Richmond Chesapeake Bay TMDL Action Plan Section 3
3-7
Use of contents on this sheet is subject to the limitations specified at the end of this document.
Richmond Chesapeake Bay TMDL AP - final
Contour lines were also provided by the City in March 2014 and represent the topography in two foot
intervals within the City boundary. The USGS NED files were accessed in January 2015 from the
USGS NED website. The NED GIS file is a regional raster image containing elevation data on a ten
meter grid. This file allowed for the review of locations outside of the County boundary.
Some areas within City boundary drain by surface runoff away from the City’s conveyance system
and out of the City, and thus are not served by the City MS4. These areas were excluded from the
POC load and required reduction calculations. Most of these areas are along the James River,
whereas others drain into the Chesterfield or Henrico MS4 service areas. The outflow areas
recommended for removal from the MS4 area are shown on Figure 1 in Appendix A. The total area
that drains by surface runoff out of the system is approximately 483 acres.
The City is responsible for treating the POC loads and meeting the required reductions for any area
served by the MS4, including those areas outside of the City boundary that reach the stormwater
conveyance system by surface runoff. Contour data and the USGS NED DEM were used to identify
these areas, which are displayed on Figure 1 in Appendix A. The total area that drains by surface
runoff into the system is approximately twenty-two acres.
The areas that drain by surface runoff incorporated into this first permit term Plan are an initial
assessment of the MS4 service area and drainage areas. It is recommended that the surface flow
GIS files be reevaluated after the outfall drainage basin delineation is complete, and that the revised
surface flows are included in the second permit term Plan.
3.1.10 Delineation of the Final MS4 Service Area
The development of the final MS4 service area was completed in GIS using the datasets described in
Sections 3.1 through 3.1.9 (Table 3-4). The first step was to evaluate the City boundary and the
2000 US Census Urban Areas, because the entire City boundary is included in the Urban Areas. The
initial MS4 service area is identical to the City area.
Table 3-4. Areas of Inclusion and Exclusion from the MS4 Service Area
Area Category Area (Ac)
City of Richmond Boundary 40,011
Exclusion Areas
CSS 10,618
VPDES permits and other MS4s (excluding VDOT) 1,043
VDOT Roads 597
Forested Lands and Wetlands 5,188
Agricultural Lands 0
Open Water 2,222
Surface Flow 483
Total Exclusion Area (Non-Overlapping)b 18,631
Total MS4 Service Area within the City Boundary 21,380
Inclusion Areas:
Surface Inflow 22
Total Inclusion Area 22
Total MS4 Service Area 21,402
b. The total exclusion area is less than the sum of the individual exclusion areas because some of the individual exclusion
areas overlap.

City of Richmond Chesapeake Bay TMDL Action Plan Section 3
3-8
Use of contents on this sheet is subject to the limitations specified at the end of this document.
Richmond Chesapeake Bay TMDL AP - final
The second step in delineation of the MS4 service area was to remove the exclusion areas from the
initial MS4 service area because the exclusion areas overlap. The sum of the individual exclusion
areas is greater than the total of the exclusions, as noted in Table 2-4. The final step to delineate
the MS4 service area was to add the surface flow inclusion area, also shown in Table 2-4. The final
MS4 service area to be used in the POC load and required reduction calculations is 21,402 acres.
3.2 Estimated Existing Source Loads
The baseline (2009) annual POC loading rates, as documented in the Phase II MS4 Permit and the
Guidance Document dated May 18, 2015, were estimated by the Chesapeake Bay Program using
the Watershed Model Phase 5.3.2. The 2009 pervious and impervious land cover within the service
area was estimated using the current impervious land cover and the historical USGS NLCD land
cover GIS files. The annual POC loads for the City were then calculated using the 2009 pervious and
impervious lands cover conditions within the MS4 service area.
3.2.1 2009 Pervious and Impervious Land Cover
The 2009 land cover characteristics were estimated from the 2014 impervious area in the City and
an estimate of the annual average change in land cover, which itself was derived from the 2006 and
2011 USGS NLCD GIS files. First, the current impervious cover GIS files within the City boundary was
accessed from the City website in January 2015. The City impervious areas are shown in three GIS
files: transportation surfaces, buildings, and road edge. Each type of impervious area was
delineated from aerial imagery. The road edge GIS file included lines at the edge of the pavement.
This file was converted to polygons and reviewed for accuracy. The impervious cover files were
clipped to the MS4 service area and the pervious cover was calculated as the remaining area, as
shown in Figure 3-4 and Table 3-5.
Figure 3-4. Impervious areas within the MS4 service area.

City of Richmond Chesapeake Bay TMDL Action Plan Section 3
3-9
Use of contents on this sheet is subject to the limitations specified at the end of this document.
Richmond Chesapeake Bay TMDL AP - final
Table 3-5. MS4 Service Area Land Cover in 2009 and 2014
Land Cover
2014 MS4
Land Cover
(ac)c
2006 NLCD
Land Cover
(ac)d
2011 NLCD
Land Cover
(ac)d
2006-2011
USGS Average
Annual Change
Estimated
2009 MS4
Land Cover
(ac)e
Impervious 7,378 5,799 5,953 0.144% 7,224
Pervious 14,002 15,544 15,390 -0.144% 14,156
Total Area 21,380 21,343 21,343 21,380
c. Impervious land cover provided by the City from the GIS basemap dataset. Impervious land cover was digitized from
aerial imagery.
d. Pervious and Impervious land covers calculated from USGS land cover raster imagery. Data resolution is a 30 meter
grid.
e. Dataset is an estimate of the historical land cover. GIS datasets from 2009 were not available.
The next step required evaluating the 2006 and 2011 USGS NLCD GIS files to calculate an annual
average change in land cover. These files were accessed from the NLCD website in January 2015.
The files contain raster images on a thirty meter grid that are classified as one of twenty land cover
types. The raster images were clipped to the MS4 service area and the raster images were
converted to polygons. The land cover within the City MS4 service area includes fifteen land cover
classifications:
Open Water
Developed Open Space
Developed, Low Intensity
Developed, Medium Intensity
Developed, High Intensity
Barren Land
Deciduous Forest
Evergreen Forest
Mixed Forest
Shrub/Scrub
Grassland/Herbaceous
Pasture/Hay
Cultivated Crops
Woody Wetlands
Emergent Herbaceous Wetlands.
Each location identified as the pasture/hay or cultivated crops land cover classifications were
evaluated with aerial imagery, and determined to be sites that were under construction. Therefore,
these sites were categorized as their pre-development land cover (pervious land cover types) for this
calculation. The impervious area for each dataset was calculated from the four developed land
cover classes and the open water land cover.

City of Richmond Chesapeake Bay TMDL Action Plan Section 3
3-10
Use of contents on this sheet is subject to the limitations specified at the end of this document.
Richmond Chesapeake Bay TMDL AP - final
The average impervious area for each developed land cover was estimated for each land cover type
based upon the NLCD definition; ten percent for Developed Open Space, thirty-five percent for
Developed Low Intensity, sixty-five percent for Developed Medium Intensity, and ninety percent for
Developed High Intensity. The percentage of impervious area was multiplied by the total area of
each developed classification and the open water area was added to the developed acreage. The
open water areas are locations that do not align with the more accurate lakes file which was used to
delineate the open water exclusion area, as described in Section 3.1.8. The pervious area included
all other land cover classifications and the remaining developed areas. The results are shown in
columns 3 and 4 of Table 2-5. Due to the raster image clipping, some edge areas were not included
in the polygon GIS files, but the small excluded area (thirty-seven acres) was consistent between
both datasets.
After calculating the land cover in 2006 and 2011, the average annual change in land cover was
calculated, as shown in Table 2-5. The average annual change was applied to the 2014 City land
cover to estimate the land cover conditions in 2009. The total impervious area within the MS4
service area in 2009 was estimated to be 7,224 acres, which is approximately thirty-four percent of
the MS4 service area. The urban pervious cover in 2009 was estimated to be 14,156 acres, which
is approximately sixty-six percent of the MS4 service area.
Based upon a review of aerial imagery, areas that surface runoff into the MS4 surface area from
outside of the City boundary were estimated to have the same proportion of pervious and impervious
land cover as areas within the City. These areas included seven acres of impervious cover and
fifteen acres of pervious cover, as shown in Table 3-6.
Table 2-6. Surface Runoff into the MS4
from Other Jurisdictions
Land Cover 2009
% Land Cover
Estimated 2009 Surface
Runoff Area (Ac)
Impervious 34% 7
Pervious 66% 15
Total Area 22
3.2.2 Annual POC Load Calculations – Existing Sources as of 2009
The final MS4 service area defined in Section 3.1.10, and the land cover estimates described in
Section 3.2.1, were used to calculate the annual pollutant loads for existing sources under 2009
conditions. The annual pollutant loading rates are prescribed in the Phase II MS4 Permit by drainage
basin. Pollutant loading rates have been defined for pervious and impervious urban lands for TN, TP,
and TSS at the edge of stream (EOS).
Table 3-7 presents the existing source loads for the City, within the James River Basin, as calculated
from loading rates in Table 2a of the Phase II MS4 Permit. The existing source loads are 166,956
pounds per year of TN, 19,812 pounds per year of TP, and 6,327,579 pounds per year of TSS.

City of Richmond Chesapeake Bay TMDL Action Plan Section 3
3-11
Use of contents on this sheet is subject to the limitations specified at the end of this document.
Richmond Chesapeake Bay TMDL AP - final
Table 3-7. Existing (2009) Source Loads for the James River Basin
Subsource
Pollutant
Total Existing
Acres Served by
MS4 (06/30/09)
2009 EOS
Loading Rate
(lb/Ac/yr)
Estimated Total POC
Load Based on 2009
Progress Run (lb/yr)
Estimated
Total POC Load
(lb/yr)
Regulated Urban
impervious
Total
Nitrogen
7,231.38
9.39
67,902.69
166,955.30
Regulated Urban
Pervious
14,170.62
6.99
99,052.51
Regulated Urban
impervious
Total
Phosphorus
7,231.38
1.76
12,727.23
19,812.54
Regulated Urban
Pervious
14,170.62
0.5
7,085.31
Regulated Urban
impervious
Total
Suspended
Solids
7,231.38
676.94
4,895,212.70
6,327,578.62
Regulated Urban
Pervious
14,170.62
101.08
1,432,365.92
3.3 Calculated Pollutant of Concern Required Reductions
The required reductions of POCs from existing (2009) sources in the Phase II MS4 Permit are
consistent with the Chesapeake Bay TMDL and the Virginia Permit Terms I and II Watershed
Improvement Plans, and are based on the Chesapeake Bay Model Phase 5.3.2 L2 scoping run for
existing developed lands. The total required reductions from the annual pollutant loading rates vary
for each pollutant and land cover. As specified in the Virginia Permit Term I Watershed Improvement
Plan, the required first permit term pollutant reductions are five percent of the total required
reductions specified in the L2 scoping run. The City has identified projects to achieve the required
pollution reductions to the maximum extent practicable for the first permit term as detailed in
Section 4 of this Plan. The total required reductions and first permit term reductions for the James
River Basin are identified in Table 3-8.
Table 3-8. Required POC Reduction Rates from Existing (2009) Sources for the James River Basin
Subsource
Pollutant
2009 EOS Loading
Rate (lb/ac/yr)
Total % Required
Reduction
Total Required
Reduction
(lb/ac/yr)
First Permit Term
Required Reduction
(lb/ac/yr)
Regulated Urban
impervious
Total Nitrogen
9.39
9%
0.8451
0.042255
Regulated Urban Pervious 6.99 6% 0.4194 0.02097
Regulated Urban
impervious
Total Phosphorus
1.76
16%
0.2816
0.01408
Regulated Urban Pervious 0.5 7.25% 0.03625 0.0018125
Regulated Urban
impervious
Total Suspended
Solids
676.94
20%
135.388
6.7694
Regulated Urban Pervious 101.08 8.75% 8.8445 0.442225

City of Richmond Chesapeake Bay TMDL Action Plan Section 3
3-12
Use of contents on this sheet is subject to the limitations specified at the end of this document.
Richmond Chesapeake Bay TMDL AP - final
Table 3-9 presents the required reductions from existing sources, as calculated from reduction rates
in Table 3a of the Phase II MS4 Permit. The first permit term required reductions for existing sources
within the City are 602.72 pounds of TN, 127.50 pounds of TP, and 55,218.73 pounds of TSS.
Table 3-9. First Permit Term Required Reductions from Existing (2009) Sources for the James River Basin
Subsource
Pollutant
Total Existing Acres
Served by MS4
(06/30/09)
First Permit Cycle
Required Reduction
in Loading Rate
(lb/ac/yr)
Total Reduction
Required First
Permit Cycle (lb/yr)
Total Reduction
Required First
Permit Cycle
(lb/yr)
Regulated Urban
impervious
Total Nitrogen
7,231.38
0.042255
305.56
602.72
Regulated Urban
Pervious
14,170.62
0.02097
297.16
Regulated Urban
impervious
Total Phosphorus
7,231.38
0.01408
101.82
127.50
Regulated Urban
Pervious
14,170.62
0.0018125
25.68
Regulated Urban
impervious
Total Suspended
Solids
7,231.38
6.7694
48,952.13
55,218.73
Regulated Urban
Pervious
14,170.62
0.442225
6,266.60
3.4 Additional Source Loads and Required Reductions
In addition to the required pollution reductions for existing development, the City must account for
any increased pollutant loads from new sources and grandfathered projects. New sources are
addressed under Phase II MS4 Permit Special Condition 7 and grandfathered projects are addressed
under Phase II MS4 Permit Special Condition 8. For the first permit term Plan, the City is required to
provide additional treatment to remove five percent of the net increase in pollutant loads for any
developments that meet the criteria of Special Condition 7. The City must provide treatment for the
net increase in pollutant loads for any project that meets the criteria of Special Condition 8.
3.4.1 Means and Methods to Offset Increased Loads from New Sources Initiating
Construction between July 1, 2009 and June 30, 2014
Special Condition 7 is a Phase II MS4 permit requirement that pertains to certain projects that
initiated construction between July 1, 2009 and June 30, 2014 and meet the following criteria:
Greater than one acre land disturbance
Increase in the POC loads from existing condition
An impervious land cover condition greater than 16 percent for the design of post-
development stormwater management facilities
The City is required to provide additional POC load reductions for any project that meets the Special
Condition 7 criteria. The aggregate accounting method was selected to determine the additional
treatment requirements from new sources, as described in Example II.2 in the Guidance Document
dated May 18, 2015.
The additional POC reductions associated Special Condition 7 were calculated by several steps.

City of Richmond Chesapeake Bay TMDL Action Plan Section 3
3-13
Use of contents on this sheet is subject to the limitations specified at the end of this document.
Richmond Chesapeake Bay TMDL AP - final
First, the “post-development” POC loads as of July 1, 2014 were calculated with the 2014 land cover
within the City shown in Table 3-5 and the estimated surface water runoff from other jurisdictions
shown in Table 3-6, using the same EOS loading rates as the 2009 “pre-development” condition
included in Table 3-7. Table 3-10 shows the estimated “post-development” POC loading within the
MS4 service area.
Table 3-10. Post-Development Conditions July 1, 2014
Subsource
Pollutant Total Existing Acres Served by the MS4
(07/01/14)
2009 EOS Loading
Rate (lb/Ac)
Estimated Total POC Load as of
07/01/1
4 Regulated Urban
Impervious
Total Nitrogen
7,385.59 9.39 69,350.71
Regulated Urban
Pervious 14,016.41 6.99 97,974.69
Regulated Urban
Impervious
Total Phosphorus
7,385.59 1.76 12,998.64
Regulated Urban
Pervious 14,016.41 0.50 7,008.20
Regulated Urban
Impervious
Total Suspended
Solids
7,385.59 676.94 4,999,602.62
Regulated Urban
Pervious 14,016.41 101.08 1,416,778.53
After the pre and post development POC loads were defined, the total change in loads was
calculated. Table 3-11 shows the estimated change in loads from June 30, 2009 to July 1, 2014.
The estimated loads increased due to the increase in impervious area from 2009 to 2014.
Table 3-11. Total Load Changes from New Sources between June 30, 2009 and July 1, 2014
Subsource
Pollutant
Estimated Total POC Load
as of 07/01/14 (lb/yr)
Estimated Total POC Load
as of 06/30/09 (lb/yr)
Load Change
(lb/yr)
Total Load
Change (lb/yr)
Regulated Urban
Impervious
Total Nitrogen
69,350.71 67,902.69 1,448.02
370.10 Regulated Urban
Pervious 97,974.69 99,052.51 (1,077.92)
Regulated Urban
Impervious
Total Phosphorus
12,998.64 12,727.23 271.41
194.30 Regulated Urban
Pervious 7,008.20 7,085.31 (77.10)
Regulated Urban
Impervious
Total Suspended
Solids
4,999,602.62 4,895,212.70 104,389.91
88,802.52 Regulated Urban
Pervious 1,416,778.53 1,432,365.92 (15,587.40)
Next, the best management practices (BMPs) that were implemented between June 30, 2009 and
July 1, 2014 were evaluated to determine the total treatment provided. The City provided a
spreadsheet of all known BMPs within the City boundary in January 2015.

City of Richmond Chesapeake Bay TMDL Action Plan Section 3
3-14
Use of contents on this sheet is subject to the limitations specified at the end of this document.
Richmond Chesapeake Bay TMDL AP - final
The BMP list was filtered to remove sites within the CSS service area and to remove sites that were
constructed outside of the new sources timeframe. The filtered BMP list is included in Appendix D.
The total POC reduction from BMPs is 59.90 pounds for TN, 15.40 pounds for TP, and 7,968.70
pounds for TSS. The POC reduction from BMPs was subtracted from the total change in loads, as
shown in Table 3-12.
Table 3-12. Net Load Change
(Total Load Change Minus Reductions from Implemented BMPs)
Pollutant Total Load Change
(lb/yr)
Reductions from on-site
BMPs (lb/yr)
Net Load Change
(lb/yr)
Total Nitrogen 370.10 59.90 310.2
Total Phosphorus 194.30 15.40 178.90
Total Suspended Solids 88,802.52 7,968.70 80,833.82
The City will be required to treat the entire net load change to the maximum extent practicable during
the three permit terms in 5 percent, 35 percent, and 60 percent increments. In the current permit
term, the City is required to offset five percent of the net load change to the maximum extent
practicable (Table 3-13) associated with new sources. The method utilized by the City to achieve the
required reductions is discussed in Section 4.
Table 3-13. Additional Reductions Required During First Permit Cycle
Pollutant
Net Load
Change(lb/yr)
Required Reduction
during first permit cycle
Additional Reductions Required during First
Permit Cycle
(lb/yr)
Total Nitrogen 310.2 5% 15.51
Total Phosphorus 178.90 5% 8.95
Total Suspended Solids 80,833.82 5% 4,041.69
3.4.2 Means and Methods to Offset Increased Loads from Grandfathered Projects that
Begin Construction after July 1, 2014
Special Condition 8 is a Phase II MS4 permit requirement that applies to all projects with
construction initiated after July 1, 2014 and designs that meet the following requirements:
Greater than one acre land disturbance
Increase in the pollutant loads from existing condition
An impervious land cover condition greater than 16 percent for the design of post-
development stormwater management facilities
The City is required to provide additional pollutant load reductions for any project that meets the
Special Condition 8 requirements above prior to project construction completion. The reduction
requirement is calculated as the difference between (1) the post-development loading rate; and (2)
the loading rate associated with sixteen percent impervious cover.
The City revised its VSMP requirements to meet the 16 percent impervious land cover requirements
for the design of post-development stormwater management facilities in 2009, as discussed in the
Legal Authority Review in Section 2. Since the requirements were revised in 2009, the City does not
anticipate that any projects will meet the criteria for Special Condition 8.

City of Richmond Chesapeake Bay TMDL Action Plan Section 3
3-15
Use of contents on this sheet is subject to the limitations specified at the end of this document.
Richmond Chesapeake Bay TMDL AP - final
3.5 Total First Permit Term Required Reductions
The total required reductions during the first permit cycle are the combined total POC loads from
existing developments and new sources. The total first permit term required reductions are 618.23
pounds of TN, 136.45 pounds of TP, and 59,260.42 pounds of TSS, as shown in Table 3-14.
Table 3-14. Total Reductions Required During First Permit Cycle
Pollutant
Existing Development
Required Reductions
(lb/yr)
New Sources (Special Condition 7)
Required Reductions
(lb/yr)
Grandfathered Projects (Special Condition 8)
Required Reductions
(lb/yr)
Total First Permit Term
Required Reductions
(lb/yr)
Total Nitrogen 602.72 15.51 0 618.23
Total Phosphorus 127.50 8.95 0 136.45
Total Suspended Solids 55,218.73 4,041.69 0 59,260.42

4-1
Use of contents on this sheet is subject to the limitations specified at the end of this document.
Richmond Chesapeake Bay TMDL AP - final
Section 4
Means and Methods to Meet
Required Reductions and Schedule
The Phase II MS4 permit requires that the Plan identify the means and methods to meet the required
reductions. The City will primarily rely on stream restoration projects to meet the first permit term
required reductions. All methods discussed in this Plan are prescribed by expert panels approved by
the Chesapeake Bay Program. The following sections discuss projects in planning, design or
construction to meet the first permit term pollutant reduction requirement.
4.1 Historical BMP Data
The City previously provided DEQ with information on BMPs installed prior to July 1, 2009. No
additional historical projects are provided as a part of this Plan.
4.2 Pollutant Reduction Project Types
The City intends to achieve the required reductions of TN, TP, and TSS through five urban stream
restoration because these projects have been initiated after January 1, 2006. Pollutant reduction
credits have been calculated using the interim approved removal rates developed by the Bay
Program Stream Restoration Expert Panel, as presented in Appendix V.I of the Guidance Document
dated May 18, 2015. The removal rates are 0.075 lb/lf/yr for TN, 0.068 lb/lf/yr for TP, and 44.88
lb/lf/yr for TSS. All the streams are 0-3rd order streams and not tidally influenced. These efficiencies
are the minimum efficiencies for stream restoration projects within this Plan and these removal rates
may be adjusted to reflect future increases in efficiency rates. All the project sites are within the
city’s MS4 service area and, therefore, no adjustments to computed credits are required.
4.3 Projects for Pollutant Removal Credit
The City is currently conducting a program to select and implement projects to achieve the required
reductions for the current and future permit cycles. Five projects have been identified by the City for
this Plan:
Reedy Creek Stream Restoration
Rattlesnake Creek Stream Restoration
Albro (Goode’s) Creek Stream Restoration
Pocosham Creek Stream Restoration
Maury Cemetery Stream Restoration
These projects are currently in design or planning process at a minimum. The City anticipates
beginning construction of projects prior to the end of the current permit term to achieve the five
percent first permit term required reduction. All projects will have funds approved as a part of an
adopted Capital Improvement Plan (CIP) by the end of the current Phase II MS4 Permit term in 2018
in order to maintain the current POC reductions calculated in the following sections.

City of Richmond Chesapeake Bay TMDL Action Plan Section 4
4-2
Use of contents on this sheet is subject to the limitations specified at the end of this document.
Richmond Chesapeake Bay TMDL AP - final
Each project location is identified on Figure 2 in Appendix A. Alternative projects may be substituted
during the current permit cycle at the City’s discretion to achieve the POC reductions.
4.3.1 Reedy Creek Stream Restoration
Reedy Creek is a tributary of the James River draining approximately 3,075 acres of urban and
suburban lands in the southwestern portion of the City. The project will restore approximately 2,200
linear feet of the Reedy Creek and the downstream portion of an unnamed tributary. The land on
which the project will be conducted is owned by the City and is administered by the Department of
Parks, Recreation and Community Facilities. The approximate project location is shown in
Figure 4-1.
Figure 4-1. Approximate location of Reedy Creek stream restoration.
The two stream channels to be restored receive stormwater from a total of approximately 2,310
acres. The land cover of the contributing drainage area consists of seventeen percent forest and
open space, forty-four percent managed turf, and thirty-nine percent impervious areas. Restoration
of the stream channels is needed to restore geomorphic stability of the impaired stream channels,
remove pollutants from the upstream watersheds, and improve water quality in these stream
reaches and downstream.
The Reedy Creek stream restoration project is included in the City’s Stormwater Master Plan, and will
be partially funded using DEQ’s matching Stormwater Local Assistance Fund (SLAF) Grant. The
project will employ natural channel design practices to emphasize contribution to stream functional
improvements while reducing stormwater pollutants. The Reedy Creek project will also include the
creation of constructed wetlands and reconnection of the stream channels with the floodplain.

City of Richmond Chesapeake Bay TMDL Action Plan Section 4
4-3
Use of contents on this sheet is subject to the limitations specified at the end of this document.
Richmond Chesapeake Bay TMDL AP - final
Using the approved pollutant removal rates, it is estimated that the project will remove 165.00 lb/yr
of TN, 149.60 lb/yr of TP, and 98,736.00 lb/yr of TSS as shown in Table 4-1.
Table 4-1: Pollutant Removal Calculations for Reedy Creek Stream Restoration
Pollutant Total Nitrogen Total Phosphorus Total Suspended
Solids
Approved Removal Rates (lb/lf/yr) 0.075 0.068 44.88
Stream length (lf) 2,200 2,200 2,200
Pollutant Removal (lb/yr) 165.00 149.60 98,736.00
The project design began in January 2015 and construction is anticipated to be completed in June
2016, with an estimated total cost of $1,270,000.
4.3.2 Rattlesnake Creek Stream Restoration
Rattlesnake Creek is a tributary of the James River draining around 1,000 acres of mostly suburban
lands in the northwestern corner of the City of Richmond and south side of the James River. The
proposed stream restoration project will address 1,500 linear feet of the Rattlesnake Creek between
E. Weyburn Road and Chippenham Parkway. The approximate project location is included in Figure
4-2.
Figure4-2. Approximate location of the Rattlesnake Creek stream restoration.

City of Richmond Chesapeake Bay TMDL Action Plan Section 4
4-4
Use of contents on this sheet is subject to the limitations specified at the end of this document.
Richmond Chesapeake Bay TMDL AP - final
The stream proposed for restoration receives drainage from approximately 840 acres of suburban
lands. The land cover of the contributing drainage area consists of thirty-five percent forest, forty-six
percent managed turf, and nineteen percent impervious. The current conditions of the stream reach
exhibit near vertical stream banks that are actively eroding. The stream provides minimal removal of
pollutants from the upstream watershed and contributes downstream pollution. Restoration of the
stream channel is needed to restore geomorphic stability of the impaired stream channel and
remove pollutants from stormwater and the upstream watershed.
The restoration project is included in the City’s Stormwater Master Plan and will be partially funded
using DEQ’s matching SLAF Grant. The project will employ natural channel design practices to
emphasize contribution to stream functional improvements while reducing stormwater pollutants.
Stream restoration efforts will involve grading the stream channel banks, installing in-channel flow
and re-directive and grade control boulder structures, as well as riparian plantings. These restorative
measures are intended to provide pollutant abatement and improve water quality, improve diversity
of aquatic habitat areas, reduce bank erosion, and enhance riparian habitats.
Using the approved pollutant removal rates, it is estimated that the project will remove 112.50 lb/yr
of TN, 102.00 lb/yr of TP, and 67,320.00 lb/yr of TSS as shown in Table 4-2.
Table 4-2: Pollutant Removal Calculations for Rattlesnake Creek Stream Restoration
Pollutant Total
Nitrogen
Total
Phosphorus
Total Suspended
Solids
Approved Removal Rates (lb/lf/yr) 0.075 0.068 44.88
Stream length (lf) 1,500 1,500 1,500
Pollutant Removal (lb/yr) 112.50 102.00 67,320.00
The project design began in October 2014 and construction is anticipated to be completed in July
2016 with an estimated total cost of $1,104,000.
4.3.3 Albro Creek Stream Restoration
The Albro Creek project will restore approximately 1,281 linear feet of stream and create of 3.0
acres of wetlands to restore and improve the water quality of Albro Creek (also called Bellemeade
Creek), which flows to the James River via Goode’s Creek. The local project site is separated from the
upstream section of Albro Creek by a large diversion pipe. The local drainage area upstream of the
restoration site is 35.17 acres, and the upstream portion of Albro Creek drains approximately 1,200
acres. Because the restored stream will have the potential to remove more nutrients than the local
drainage area (35.17 acres) is generating, a flow splitting structure will be utilized to convey
additional flows to the restored section of Albro Creek during wet weather events. Opportunities may
also exist for establishment of a conservation buffer around this tributary of Goode’s Creek. This
project is intended to improve water quality, provide flood protection, and reduce bank erosion. The
approximate project location is shown in Figure 4-3.

City of Richmond Chesapeake Bay TMDL Action Plan Section 4
4-5
Use of contents on this sheet is subject to the limitations specified at the end of this document.
Richmond Chesapeake Bay TMDL AP - final
Figure 4-3. Approximate location of the Albro Creek stream restoration.
Using the approved pollutant removal rates, it is estimated that the project will remove 96.08 lb/yr of
TN, 87.11 lb/yr of TP, and 57,491.28 lb/yr of TSS as shown in Table 4-3.
Table 4-3: Pollutant Removal Calculations for Albro Creek Stream Restoration
Pollutant Total
Nitrogen
Total
Phosphorus
Total Suspended
Solids
Approved Removal Rates (lb/lf/yr) 0.075 0.068 44.88
Stream length (lf) 1,281 1,281 1,281
Pollutant Removal (lb/yr) 96.08 87.11 57,491.28
The project design began in October 2014 and construction is anticipated to be completed in
October 2016, with an estimated total cost of $1,432,000.
4.3.4 Pocosham Creek Stream Restoration
The Pocosham Creek stream restoration project (Project) is located on a larger tributary of
Pocoshock Creek that flows into Falling Creek, which ultimately flows to the James River. This larger
tributary drains approximately 3,625 acres of mostly suburban and forest lands in the southwestern
side of the City, west of the James River. Approximately half of the watershed is located within the
City-limits and the other half is located in Chesterfield County. The restoration project will restore
approximately a 5,990 linear feet of stream channel. The approximate project location is shown in
Figure 4-4.

City of Richmond Chesapeake Bay TMDL Action Plan Section 4
4-6
Use of contents on this sheet is subject to the limitations specified at the end of this document.
Richmond Chesapeake Bay TMDL AP - final
Figure 4-4. Approximate location of the Pocosham Creek stream restoration.
A 6-foot wide trail will be constructed as part of the Pocosham Creek Stream Restoration project.
The path will run the length of the restoration segment (approximately 6,000 linear feet) and will
utilize the access corridor created by the Contractor to construct the project. Access to the path will
be from the multiple construction entrances at the various locations along the project.
This project is included in the City’s Stormwater Master Plan. The goals of this project are to reduce
pollutants in the watershed by repairing the eroding sections of the creek and adding a bankfull
floodplain bench to reduce velocities and erosion. In-stream structures, such as cross vanes, j-hook
vanes, and vanes will be implemented into the project to improve stability and create and enhance
habitat within the creek corridor. The project will also incorporate walking trails to improve access
and amenities in Pocosham Park.
Using the approved pollutant removal rates, it is estimated that completion of the Pocosham Creek
stream restoration project will remove 449.25 lb/yr of TN, 407.32 lb/yr of TP, and 268,831.20 lb/yr
of TSS as shown in Table 4-4.
Table 4-4: Pollutant Removal Calculations for Pocosham Creek Stream Restoration
Pollutant Total
Nitrogen
Total
Phosphorus
Total Suspended
Solids
Approved Removal Rates (lb/lf/yr) 0.075 0.068 44.88
Stream length (lf) 5,990 5,990 5,990
Pollutant Removal (lb/yr) 449.25 407.32 268,831.20

City of Richmond Chesapeake Bay TMDL Action Plan Section 4
4-7
Use of contents on this sheet is subject to the limitations specified at the end of this document.
Richmond Chesapeake Bay TMDL AP - final
Construction is planned to begin in August 2015 and is anticipated to be completed in April 2016
with estimate total cost of $2,500,000.
4.3.5 Maury Cemetery Stream Restoration
The Maury Cemetery Stream Restoration project is located within the City’s Maury Cemetery and will
restore approximately 1,980 linear feet of stream channel. The project is bounded to the north by
Maury Street, to the south by North Hopkins Road, to the east by an existing CSX railroad, and to the
west by Maury Cemetery. This work is being performed to improve the overall function of the Maury
Cemetery Stream, including but not limited to preventing erosion, restoring habitat, and improving
the water quality function of the stream. The approximate project location is shown in Figure 4-5.
The project is expected to include the following elements:
Modifying grades of the existing Maury Cemetery Stream
Demolition and removal of existing masonry and stone structures
Installation of new storm sewer pipe and/or extending existing storm sewer pipe
Installation of in-stream structures such as log J-hooks and fieldstone cross vanes
Vertical off setting of existing waterline
Adjusting rim of existing sanitary structures
Landscaping and restoration of all disturbed areas
Figure 4-5. Approximate location of the Maury Cemetery Creek stream restoration.
Using the approved pollutant removal rates, it is estimated that completion of the Maury Cemetery
stream restoration project will remove 148.50 lb/yr of TN, 134.64 lb/yr of TP, and 88,862.40 lb/yr
of TSS as shown in Table 4-5.
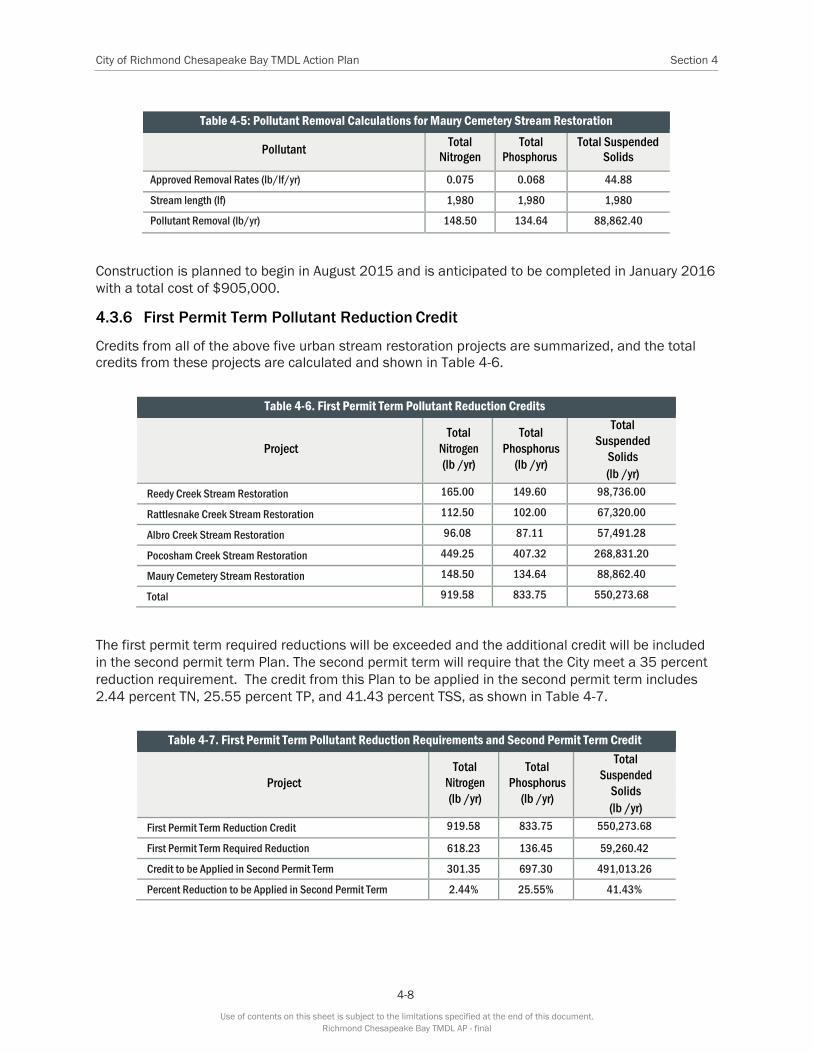
City of Richmond Chesapeake Bay TMDL Action Plan Section 4
4-8
Use of contents on this sheet is subject to the limitations specified at the end of this document.
Richmond Chesapeake Bay TMDL AP - final
Table 4-5: Pollutant Removal Calculations for Maury Cemetery Stream Restoration
Pollutant Total
Nitrogen
Total
Phosphorus
Total Suspended
Solids
Approved Removal Rates (lb/lf/yr) 0.075 0.068 44.88
Stream length (lf) 1,980 1,980 1,980
Pollutant Removal (lb/yr) 148.50 134.64 88,862.40
Construction is planned to begin in August 2015 and is anticipated to be completed in January 2016
with a total cost of $905,000.
4.3.6 First Permit Term Pollutant Reduction Credit
Credits from all of the above five urban stream restoration projects are summarized, and the total
credits from these projects are calculated and shown in Table 4-6.
Table 4-6. First Permit Term Pollutant Reduction Credits
Project
Total
Nitrogen
(lb /yr)
Total
Phosphorus
(lb /yr)
Total
Suspended
Solids
(lb /yr)
Reedy Creek Stream Restoration 165.00 149.60 98,736.00
Rattlesnake Creek Stream Restoration 112.50 102.00 67,320.00
Albro Creek Stream Restoration 96.08 87.11 57,491.28
Pocosham Creek Stream Restoration 449.25 407.32 268,831.20
Maury Cemetery Stream Restoration 148.50 134.64 88,862.40
Total 919.58 833.75 550,273.68
The first permit term required reductions will be exceeded and the additional credit will be included
in the second permit term Plan. The second permit term will require that the City meet a 35 percent
reduction requirement. The credit from this Plan to be applied in the second permit term includes
2.44 percent TN, 25.55 percent TP, and 41.43 percent TSS, as shown in Table 4-7.
Table 4-7. First Permit Term Pollutant Reduction Requirements and Second Permit Term Credit
Project
Total
Nitrogen
(lb /yr)
Total
Phosphorus
(lb /yr)
Total
Suspended
Solids
(lb /yr)
First Permit Term Reduction Credit 919.58 833.75 550,273.68
First Permit Term Required Reduction 618.23 136.45 59,260.42
Credit to be Applied in Second Permit Term 301.35 697.30 491,013.26
Percent Reduction to be Applied in Second Permit Term 2.44% 25.55% 41.43%

City of Richmond Chesapeake Bay TMDL Action Plan Section 4
4-9
Use of contents on this sheet is subject to the limitations specified at the end of this document.
Richmond Chesapeake Bay TMDL AP - final
4.3.7 Other Water Quality Projects in Planning or Implementation
In addition to the stream restoration projects described previously, the City is currently implementing
or planning to implement other projects throughout the City. The City current completes a street
sweeping program City-wide. The City is also completing a green alleys program. This program is
creating buffer strips and other pervious areas in highly impervious areas throughout the City.
The City is also planning additional projects in fiscal years 2016 and 2017. Specific project data is
not yet available for inclusion in the first permit term Plan; however, the City will document these
projects as they are designed and constructed and incorporate them into future Plans.
4.4 Implementation Schedule and Estimated Cost to Complete
Table 4-8 shows the current project status, anticipated construction start date and the cost of
construction for each of the stream restoration projects. All projects are currently in design or ready
for construction. The total cost to complete the projects is approximately $7,200,000.
Table 4-8. First Permit Term Implementation Schedule and Estimated Cost to Complete
Project
Project Status
Estimated
Construction Start
Date
Estimated Cost to Complete
Reedy Creek Stream Restoration In Design October 2015 $1,270,000
Rattlesnake Creek Stream Restoration In Design December 2015 $1,104,000
Albro Creek Stream Restoration In Design December 2015 $1,432,000
Pocosham Creek Stream Restoration In Design August 2015 $2,500,000
Maury Cemetery Stream Restoration In Design August 2015 $905,000
Total Estimated Cost to Complete Projects $7,211,000
4.5 A List of Future Projects and Associated Acreage that Qualify as
Grandfathered
The City does not anticipate any developments that will meet the criteria for grandfathered projects,
as defined in Section 3.4.2.

Section 5
5-1
Use of contents on this sheet is subject to the limitations specified at the end of this document.
Richmond Chesapeake Bay TMDL AP - final
Public Comments on Draft Action
Plan
The City plans to make the draft Plan available for comment on the website at
http://www.richmondgov.com/PublicUtilities/StormwaterUtility/index.aspx during June 2015 and
advertise the plan through a public announcement in several local newspapers. The City will also
publicize the plan via announcements on the web and distribution through social media (utility blogs,
twitter and Facebook).
The summary of comments received will be addressed through the plan update submitted with the
Annual Report in September 2015 and posted on the city’s website.
September 2015 update: The city received no comments on the Action Plan during the public
comment period which ended August 1, 2015. We were asked for two extensions, which were
agreed to. No comments were submitted during the extended period, which ended August 15, 2015.
We did receive comments on September 21, 2015 from the Reedy Creek Coalition
(www.reedycreekcoaltion.org) with concerns about the ultimate success of the stream restoration in
Reedy Creek. Even though the comments were received outside the allotted public comment period,
the city provided a response to the organization and since we are a partner with them in analyzing
the samples collected in the creek, we hope that we can address the concerns expressed by them
with future communication on the stream restoration.

6-1
Use of contents on this sheet is subject to the limitations specified at the end of this document.
Richmond Chesapeake Bay TMDL AP - final
Section 6
Conclusion
The City developed this first permit term Plan as required in the 2013-2018 Phase II MS4 Permit
Number VAR040005 and in accordance with the DEQ Guidance Document dated May 18, 2015.
This Plan concludes that the first permit term pollutant reduction requirements calculated in Section
3 are met by the five stream projects identified in Section 4 of the Plan. Modifications to this Plan
will be documented in Appendix E.
During the second permit cycle, permittees will be required to reduce meet and additional thirty-five
percent POC reductions to the maximum extent practicable. The existing projects identified in this
first permit term Plan exceed the required five percent reductions and the additional reductions will
be applied toward achieving the additional 35 percent reductions required by the second permit
term. The City will continue to plan for compliance and the Plan will be updated accordingly.

7-1
Use of contents on this sheet is subject to the limitations specified at the end of this document.
Richmond Chesapeake Bay TMDL AP - final
Section 7
Limitations
This document was prepared solely for the City of Richmond in accordance with professional
standards at the time the services were performed, and in accordance with the contract between the
City of Richmond and Brown and Caldwell dated December 4, 2014. This document is governed by
the specific scope of work authorized by the City of Richmond; it is not intended to be relied upon by
any other party except for regulatory authorities contemplated by the scope of work. We have relied
on information or instructions provided by the City of Richmond and other parties and, unless
otherwise expressly indicated, have made no independent investigation as to the validity,
completeness, or accuracy of such information.

8-1
Use of contents on this sheet is subject to the limitations specified at the end of this document.
Richmond Chesapeake Bay TMDL AP - final
Section 8
References
Brown and Caldwell. Site Plans: Maury Cemetery Creek Stream Restoration. December 23, 2014
Brown and Caldwell. Site Plans: Pocosham Creek Stream Restoration. November 25, 2014
Schueler, Tom and Bill Stack. Recommendations of the Expert Panel to Define Removal Rates for Individual Stream
Restoration Projects, Chesapeake Bay Program, September 8, 2014.
Virginia Department of Environmental Quality. SLAF Grant Application: Albro Creek Stream Restoration. October 24,
2014.
Virginia Department of Environmental Quality. SLAF Grant Application: Albro Creek Stream Restoration. October 24,
2014.
Virginia Department of Environmental Quality. SLAF Grant Application: Pocosham Creek Stream Restoration. October
24, 2014.
Virginia Department of Environmental Quality. SLAF Grant Application: Rattlesnake Creek Stream Restoration.
October 24, 2014.
Virginia Department of Environmental Quality. SLAF Grant Application: Reedy Creek Stream Restoration. October 24,
2014.
Virginia Department of Environmental Quality Water Division, Chesapeake Bay TMDL Special Condition Guidance,
August 18, 2015, draft revisions March 19, 2015.

City of Richmond Chesapeake Bay TMDL
Plan Appendix A
A-1
Use of contents on this sheet is subject to the limitations specified at the end of this document.
Richmond Chesapeake Bay TMDL AP - final Action Plan - Final
Appendix A: Maps
Maps
Figure 1: MS4 Service Area Delineation
Figure 2: First Permit Term Projects

I-64
US 60
US 360
0 1 2
Miles
City of RichmondFigure 1Figure 1
MS4 Service Area MS4 Service Area DelineationDelineation
June 2015
LegendCityBoundary
CSS Service Areas
Forested Areas
MS4 Boundary
Surface Runoff into MS4
Surface Runoff Out
Surface Waters
VDOT Right of Way
VA Hospital
VPDES Concrete ProductsFacilities General Permit
VPDES Individual Permit
VPDES Nonmetallic MineralMining General Permit
VPDES Stormwater GeneralPermit
James River
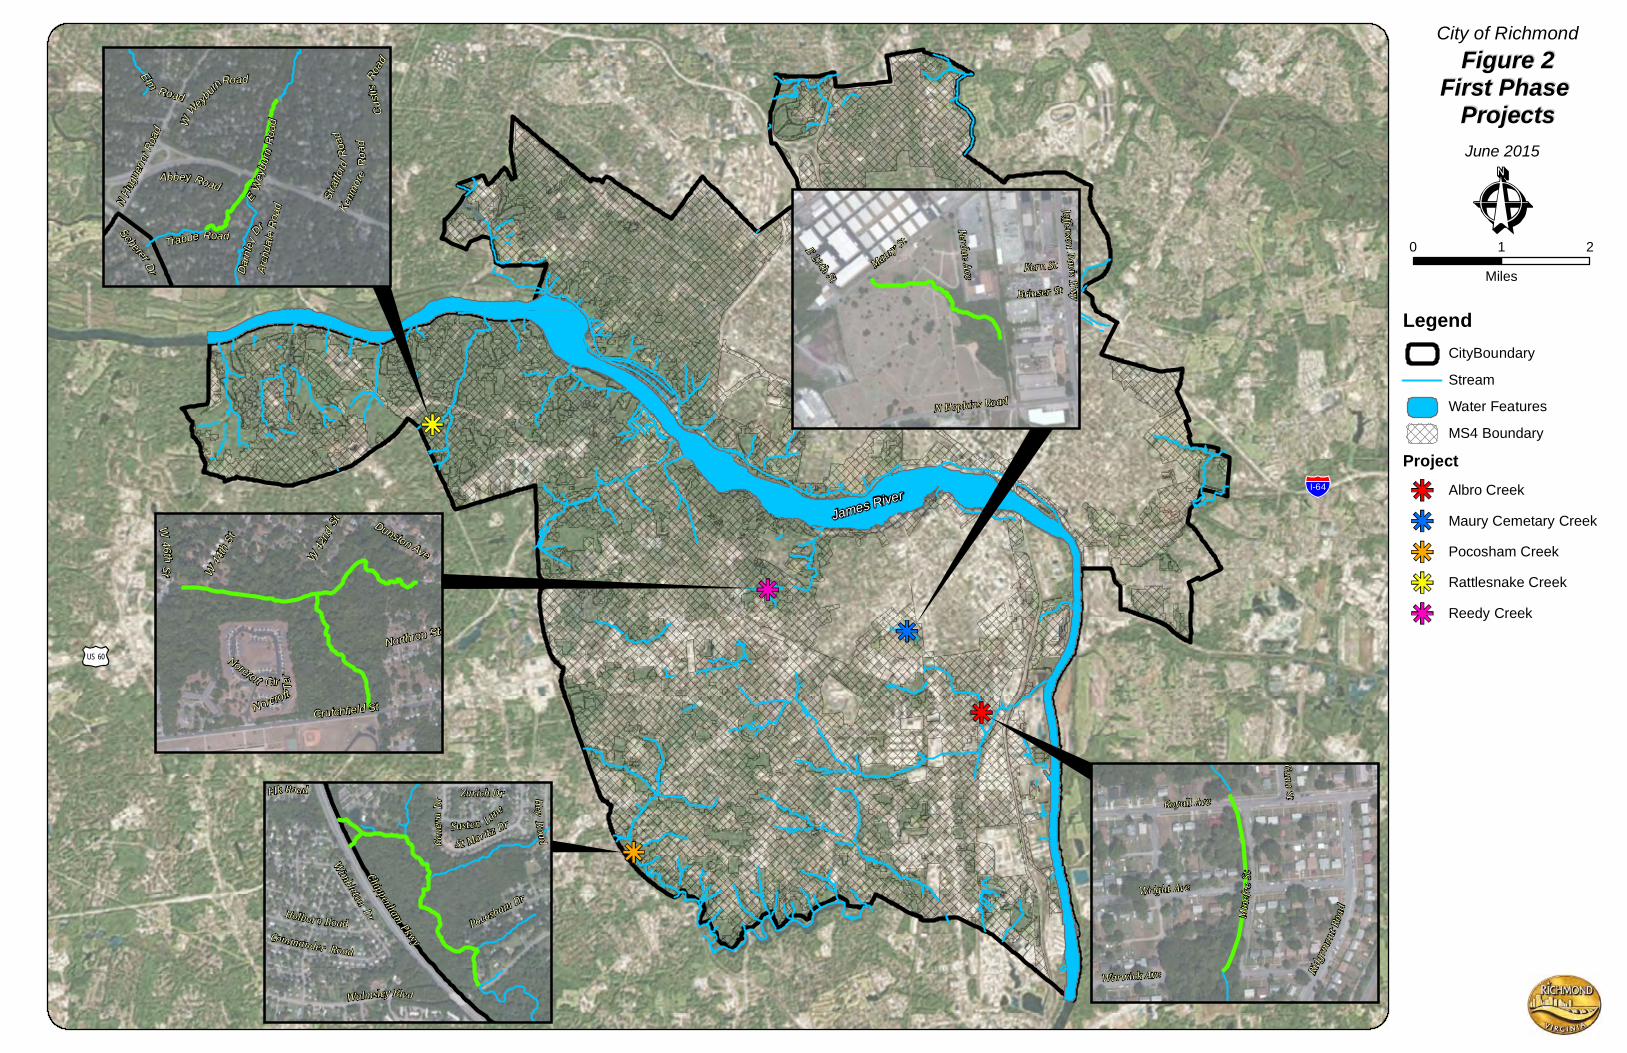
I-64
US 60
0 1 2
Miles
City of RichmondFigure 2Figure 2
First Phase First Phase ProjectsProjectsJune 2015
LegendCityBoundary
Stream
Water Features
MS4 Boundary
ProjectAlbro Creek
Maury Cemetary Creek
Pocosham Creek
Rattlesnake Creek
Reedy Creek
James River
Scherer Dr
N Hugu
enot
Road
Arch
dale
Road
Elm
Road
WWeyb
urn
Road
Custi
sRoad
Trabue Road
Abbey Road
Kenm
oreRo
ad
Stratf
ordRo
ad
E Weyb
urnRo
ad
Darnl
eyDr
Genev
a DrElk Road
Walmsley Blvd
Wimbleton Dr Pocosham Dr
Zurich Dr
Holborn Road
Susten Lane
Commander Road
Chippenham Pkwy
HeyRoadSt Moritz Dr
W 42nd
St Dunston Ave
Norcroft Ter
Northrop St
Crutchfield St
W 44th
St
Norcroft Cir
W46thSt
Royall Ave
Gunn St
Minef
eeSt
Wright Ave
Warwick Ave Ridgem
ontRo
ad
Jefferson Davis Hwy
N Hopkins Road
Maury StE 29th St Kern St
Brinser St
Perdue Ave

City of Richmond Chesapeake Bay TMDL Plan Appendix B
B-1
Use of contents on this sheet is subject to the limitations specified at the end of this document.
Richmond Chesapeake Bay TMDL AP - final Action Plan - Final
Appendix B: Source Data
Source Data
The following is a list of the GIS datasets, dates, and sources of GIS data used to develop the TMDL
Action Plan.
Data Collected from the City
Basemap Files – Downloaded January 2015
City Boundary – dated January 2015
Road Edge – dated January 2015
Structures – dated January 2015
Stream Polygons – dated January 2015
Transportation Surfaces – dated January 2015
Parcels – Downloaded January 2015
Parcels ASR – dated January 2015
Parcels PINS – dated January 2015
Utility Data – Received April 2014
Combined Sewer Area – dated February 2014
Storm Canals – dated March 2014
Storm Culverts – dated January 2014
Storm Drop Inlets – dated March 2014
Storm Manholes – dated March 2014
Storm Open Channels – dated February 2014
Storm Pipes – dated March 2014
Utility Data – Received January 2015
Storm Outfalls – dated January 2015
BMP Excel Spreadsheet – dated October 2014
Data Collected from Tiger Census
2000 Census – Downloaded January 2015
Census Urban Area – dated June 2002
2010 Census – Downloaded January 2015
Census Urban Area – dated 2012Data Collected from DEQ

City of Richmond Chesapeake Bay TMDL Plan Appendix B
B-2
Use of contents on this sheet is subject to the limitations specified at the end of this document.
Richmond Chesapeake Bay TMDL AP - final Action Plan - Final
VPDES Permittees – Downloaded January 2015
Individual Permittees Spreadsheet – dated January 2015
Stormwater General Permittees Spreadsheet – dated January 2015
Individual MS4s – Downloaded January 2015
Phase I and Phase II MS4s Spreadsheet – dated January 2015
Data Collected from USGS NED
National Elevation Dataset– Downloaded January 2015
Regional Elevation Raster Imagery – Dated 2013
Data Collected from VA DOF
Forested Lands– Downloaded April 2015
Virginia Forest Cover Map 2005 – dated May 2005

C-1
Use of contents on this sheet is subject to the limitations specified at the end of this document.
Richmond Chesapeake Bay TMDL AP - final
City of Richmond Chesapeake Bay TMDL Action Plan Appendix C
Appendix C: Existing Legal Authority
List of Existing Legal Authority
Chapter 50 Richmond City code: Floodplain Management, Erosion and Sediment Control, and
Drainage Generally
(Includes Floodplain management, Erosion and Sediment Control, Chesapeake Bay Preservation
Areas, and Richmond Stormwater Management Program)
https://www.municode.com/library/va/richmond/codes/code_of_ordinances?nodeId=CH50FLMAE
RSECODRGE
Chapter 106 Richmond City code: Utilities
(Includes Wastewater Sewers and Collection System, Stormwater)
https://www.municode.com/library/va/richmond/codes/code_of_ordinances?nodeId=CH106UT_AR
TVIIIST
Chapter 90 Richmond City Code: Streets, Sidewalks and Public Ways
https://www.municode.com/library/va/richmond/codes/code_of_ordinances?nodeId=CH90STSIPU
WA
Chapter 46.1 Richmond City code: Fire Protection and Protection
(Includes spill abatement)
https://www.municode.com/library/va/richmond/codes/code_of_ordinances?nodeId=CH46.1FIPRP
R

City of Richmond Chesapeake Bay TMDL Plan Appendix D
D-1
Use of contents on this sheet is subject to the limitations specified at the end of this document.
Richmond Chesapeake Bay TMDL AP - final
Appendix D: BMPs Constructed Between June 30,
2009 and July 1, 2014
Table D-1. BMPs Constructed between 7/1/2009 and 7/1/2014 (Filtered from 'City of Richmond SCM
Database 10-1- 14.xlsx')

City of Richmond Chesapeake Bay TMDL Action Plan Appendix E
E-1
Use of contents on this sheet is subject to the limitations specified at the end of this document.
Richmond Chesapeake Bay TMDL AP - final
Appendix E: Modifications to the Plan
Reserved for future use
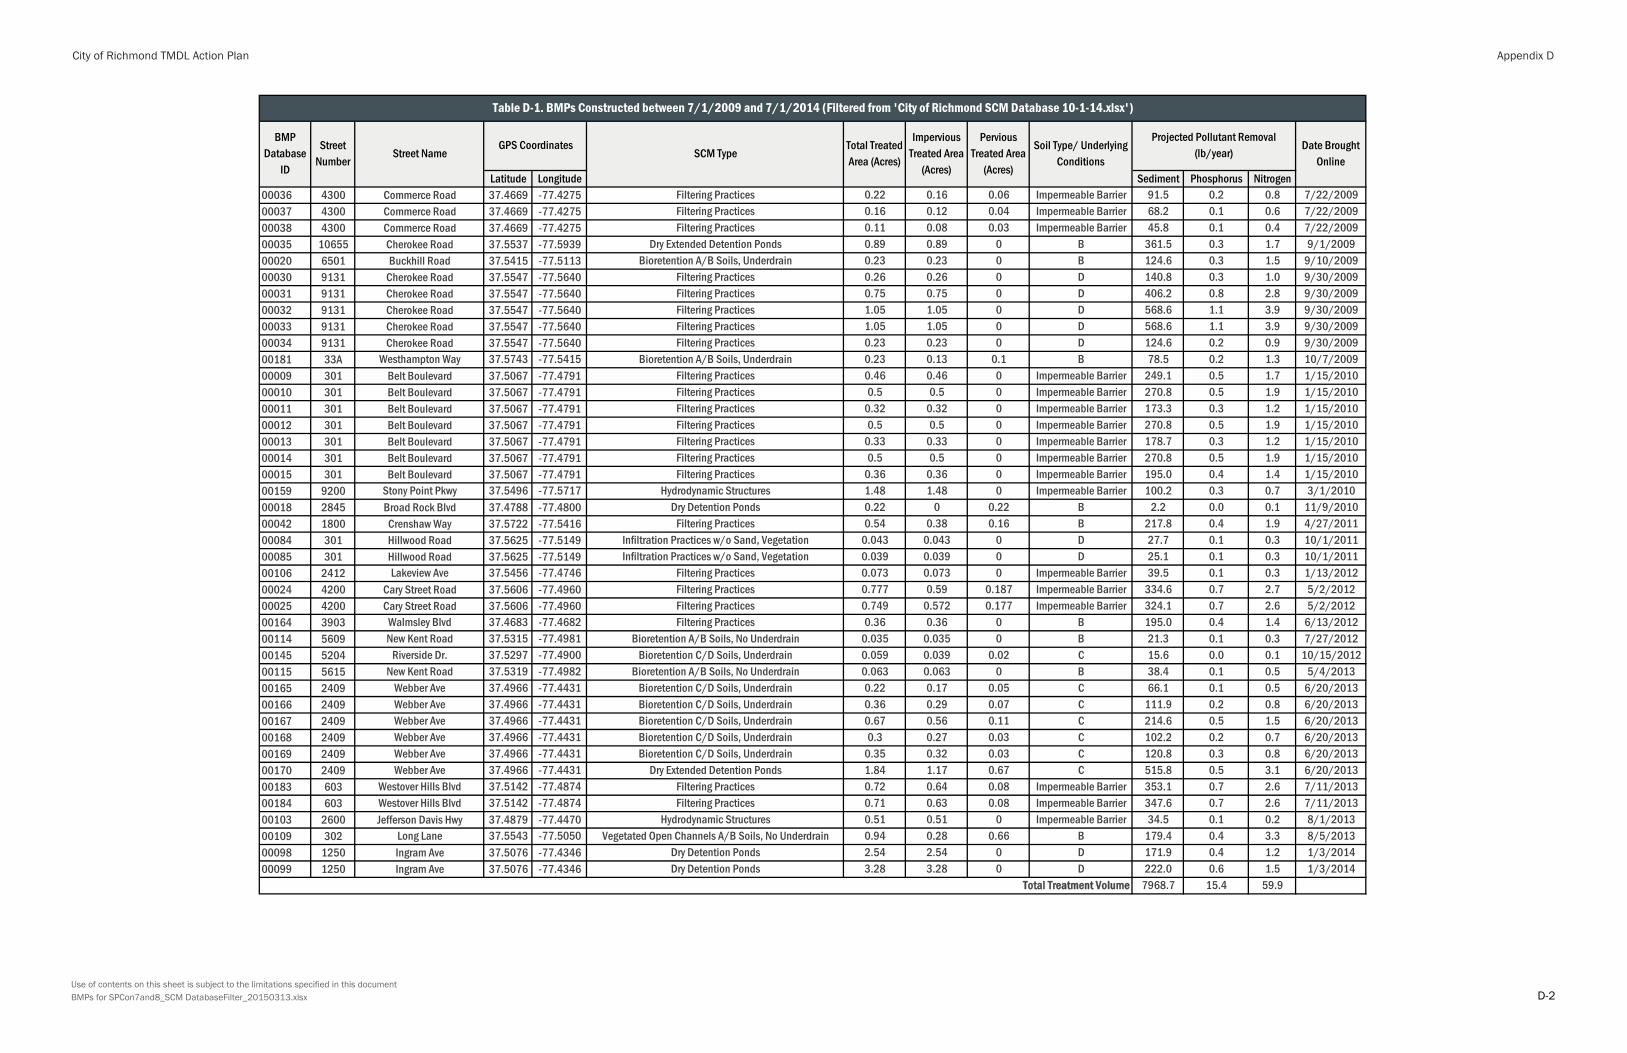
City of Richmond TMDL Action Plan Appendix D
Use of contents on this sheet is subject to the limitations specified in this documentBMPs for SPCon7and8_SCM DatabaseFilter_20150313.xlsx D-2
Latitude Longitude Sediment Phosphorus Nitrogen00036 4300 Commerce Road 37.4669 -77.4275 Filtering Practices 0.22 0.16 0.06 Impermeable Barrier 91.5 0.2 0.8 7/22/200900037 4300 Commerce Road 37.4669 -77.4275 Filtering Practices 0.16 0.12 0.04 Impermeable Barrier 68.2 0.1 0.6 7/22/200900038 4300 Commerce Road 37.4669 -77.4275 Filtering Practices 0.11 0.08 0.03 Impermeable Barrier 45.8 0.1 0.4 7/22/200900035 10655 Cherokee Road 37.5537 -77.5939 Dry Extended Detention Ponds 0.89 0.89 0 B 361.5 0.3 1.7 9/1/200900020 6501 Buckhill Road 37.5415 -77.5113 Bioretention A/B Soils, Underdrain 0.23 0.23 0 B 124.6 0.3 1.5 9/10/200900030 9131 Cherokee Road 37.5547 -77.5640 Filtering Practices 0.26 0.26 0 D 140.8 0.3 1.0 9/30/200900031 9131 Cherokee Road 37.5547 -77.5640 Filtering Practices 0.75 0.75 0 D 406.2 0.8 2.8 9/30/200900032 9131 Cherokee Road 37.5547 -77.5640 Filtering Practices 1.05 1.05 0 D 568.6 1.1 3.9 9/30/200900033 9131 Cherokee Road 37.5547 -77.5640 Filtering Practices 1.05 1.05 0 D 568.6 1.1 3.9 9/30/200900034 9131 Cherokee Road 37.5547 -77.5640 Filtering Practices 0.23 0.23 0 D 124.6 0.2 0.9 9/30/200900181 33A Westhampton Way 37.5743 -77.5415 Bioretention A/B Soils, Underdrain 0.23 0.13 0.1 B 78.5 0.2 1.3 10/7/200900009 301 Belt Boulevard 37.5067 -77.4791 Filtering Practices 0.46 0.46 0 Impermeable Barrier 249.1 0.5 1.7 1/15/201000010 301 Belt Boulevard 37.5067 -77.4791 Filtering Practices 0.5 0.5 0 Impermeable Barrier 270.8 0.5 1.9 1/15/201000011 301 Belt Boulevard 37.5067 -77.4791 Filtering Practices 0.32 0.32 0 Impermeable Barrier 173.3 0.3 1.2 1/15/201000012 301 Belt Boulevard 37.5067 -77.4791 Filtering Practices 0.5 0.5 0 Impermeable Barrier 270.8 0.5 1.9 1/15/201000013 301 Belt Boulevard 37.5067 -77.4791 Filtering Practices 0.33 0.33 0 Impermeable Barrier 178.7 0.3 1.2 1/15/201000014 301 Belt Boulevard 37.5067 -77.4791 Filtering Practices 0.5 0.5 0 Impermeable Barrier 270.8 0.5 1.9 1/15/201000015 301 Belt Boulevard 37.5067 -77.4791 Filtering Practices 0.36 0.36 0 Impermeable Barrier 195.0 0.4 1.4 1/15/201000159 9200 Stony Point Pkwy 37.5496 -77.5717 Hydrodynamic Structures 1.48 1.48 0 Impermeable Barrier 100.2 0.3 0.7 3/1/201000018 2845 Broad Rock Blvd 37.4788 -77.4800 Dry Detention Ponds 0.22 0 0.22 B 2.2 0.0 0.1 11/9/201000042 1800 Crenshaw Way 37.5722 -77.5416 Filtering Practices 0.54 0.38 0.16 B 217.8 0.4 1.9 4/27/201100084 301 Hillwood Road 37.5625 -77.5149 Infiltration Practices w/o Sand, Vegetation 0.043 0.043 0 D 27.7 0.1 0.3 10/1/201100085 301 Hillwood Road 37.5625 -77.5149 Infiltration Practices w/o Sand, Vegetation 0.039 0.039 0 D 25.1 0.1 0.3 10/1/201100106 2412 Lakeview Ave 37.5456 -77.4746 Filtering Practices 0.073 0.073 0 Impermeable Barrier 39.5 0.1 0.3 1/13/201200024 4200 Cary Street Road 37.5606 -77.4960 Filtering Practices 0.777 0.59 0.187 Impermeable Barrier 334.6 0.7 2.7 5/2/201200025 4200 Cary Street Road 37.5606 -77.4960 Filtering Practices 0.749 0.572 0.177 Impermeable Barrier 324.1 0.7 2.6 5/2/201200164 3903 Walmsley Blvd 37.4683 -77.4682 Filtering Practices 0.36 0.36 0 B 195.0 0.4 1.4 6/13/201200114 5609 New Kent Road 37.5315 -77.4981 Bioretention A/B Soils, No Underdrain 0.035 0.035 0 B 21.3 0.1 0.3 7/27/201200145 5204 Riverside Dr. 37.5297 -77.4900 Bioretention C/D Soils, Underdrain 0.059 0.039 0.02 C 15.6 0.0 0.1 10/15/201200115 5615 New Kent Road 37.5319 -77.4982 Bioretention A/B Soils, No Underdrain 0.063 0.063 0 B 38.4 0.1 0.5 5/4/201300165 2409 Webber Ave 37.4966 -77.4431 Bioretention C/D Soils, Underdrain 0.22 0.17 0.05 C 66.1 0.1 0.5 6/20/201300166 2409 Webber Ave 37.4966 -77.4431 Bioretention C/D Soils, Underdrain 0.36 0.29 0.07 C 111.9 0.2 0.8 6/20/201300167 2409 Webber Ave 37.4966 -77.4431 Bioretention C/D Soils, Underdrain 0.67 0.56 0.11 C 214.6 0.5 1.5 6/20/201300168 2409 Webber Ave 37.4966 -77.4431 Bioretention C/D Soils, Underdrain 0.3 0.27 0.03 C 102.2 0.2 0.7 6/20/201300169 2409 Webber Ave 37.4966 -77.4431 Bioretention C/D Soils, Underdrain 0.35 0.32 0.03 C 120.8 0.3 0.8 6/20/201300170 2409 Webber Ave 37.4966 -77.4431 Dry Extended Detention Ponds 1.84 1.17 0.67 C 515.8 0.5 3.1 6/20/201300183 603 Westover Hills Blvd 37.5142 -77.4874 Filtering Practices 0.72 0.64 0.08 Impermeable Barrier 353.1 0.7 2.6 7/11/201300184 603 Westover Hills Blvd 37.5142 -77.4874 Filtering Practices 0.71 0.63 0.08 Impermeable Barrier 347.6 0.7 2.6 7/11/201300103 2600 Jefferson Davis Hwy 37.4879 -77.4470 Hydrodynamic Structures 0.51 0.51 0 Impermeable Barrier 34.5 0.1 0.2 8/1/201300109 302 Long Lane 37.5543 -77.5050 Vegetated Open Channels A/B Soils, No Underdrain 0.94 0.28 0.66 B 179.4 0.4 3.3 8/5/201300098 1250 Ingram Ave 37.5076 -77.4346 Dry Detention Ponds 2.54 2.54 0 D 171.9 0.4 1.2 1/3/201400099 1250 Ingram Ave 37.5076 -77.4346 Dry Detention Ponds 3.28 3.28 0 D 222.0 0.6 1.5 1/3/2014
7968.7 15.4 59.9
Table D-1. BMPs Constructed between 7/1/2009 and 7/1/2014 (Filtered from 'City of Richmond SCM Database 10-1-14.xlsx')
BMP Database
ID
Street Number
Street NameGPS Coordinates
SCM TypeTotal Treated Area (Acres)
Impervious Treated Area
(Acres)
Pervious Treated Area
(Acres)
Soil Type/ Underlying Conditions
Projected Pollutant Removal (lb/year)
Date Brought Online
Total Treatment Volume