Chesapeake Bay TMDL: Development and ImplementationChesapeake Bay TMDL: Development and...
26
4/5/2010 1 Chesapeake Bay TMDL: Development and Implementation Suzanne Hall Bob Koroncai EPA Region III
Transcript of Chesapeake Bay TMDL: Development and ImplementationChesapeake Bay TMDL: Development and...

4/5/2010 1
Chesapeake Bay TMDL:
Development andImplementation
Suzanne Hall
Bob Koroncai
EPA Region III

What is a TMDL?• Pollution ‘budget’ or ‘diet’• Total Maximum Daily Load=
allowable point source load+
allowable non-point source load+
allowable air load+
margin of safety
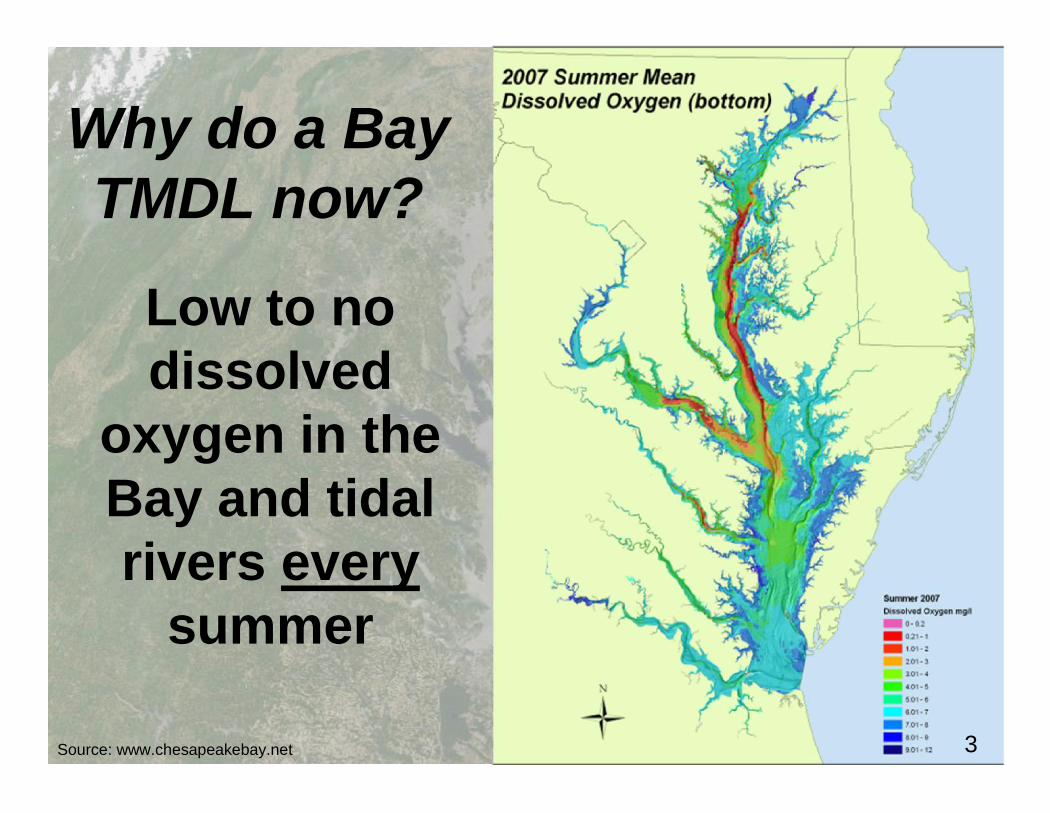
Low to nodissolved
oxygen in theBay and tidalrivers every
summer
3
Why do a BayTMDL now?
Source: www.chesapeakebay.net

Nutrient Sources ofPennsylvania
Wastewater25%
Forest13%
Agriculture50%
Developed12%
Sources of Nitrogenfrom PA
Sources of Phosphorusfrom PA
N and P values from 2008 Scenario of Phase 5.2 Watershed Model
4
Agriculture52%
Developed20%
Forest17%
Wastewater11%

5
The Chesapeake BayTMDL
All 6 states and the District ofColumbia are covered.
Caps on nitrogen,phosphorus, and sediment
Caps on point sources andnon point source sectors
Draft TMDL August 2010Round 2 of publicmeetings Aug – October,2010
Final TMDL December 2010

Bay TMDL Development:How are states involved?
What total loadingfor nitrogen,
phosphorus, andsediment can theBay assimilate?
What is anequitable
distribution of thewatershed-wideloadings to thestates/basins?
How should thestate/basin load be sub-allocated to: individual
point sources,non- point sourcesectors, and sub-
watersheds or counties?6
WIP

Guidelines for Distributing theBasinwide Target Loads
• Water quality and living resource goalsshould be achieved.
• Waters that contribute the most to theproblem should achieve the mostreductions (on a per pound basis).
• All previous reductions in nutrient loadsare credited toward achieving final caploads.
7

Current State Target Loads
283.15
7.77
72.82
114.40
16.71
58.00
9.91
3.54
2008Load
197.76195.75Total
5.715.93WV
59.2156.75VA
73.6473.48PA
10.548.68NY
41.0442.37MD
5.256.43DE
2.372.12DC
TargetLoad
TributaryStrategyState
16.28
0.70
7.18
3.99
0.83
3.10
0.34
0.14
2008Load
14.8413.39Total
0.620.43WV
7.056.41VA
3.163.10PA
0.560.56NY
3.042.54MD
0.280.25DE
0.130.10DC
TargetLoad
TributaryStrategyState
Nitrogen Phosphorus
All loads are in millions of pounds per year

Pa loads in the Bay TMDL
• For Pa (and upland states), onlyaggregate loads will be in the TMDL forNPS and PS*
• Those aggregate loads will be split into thePotomac Drainage and the Susquehannadrainage
* Only if the state WIP provides more detail on loadingsfrom individual sources or source sectors

The Bay TMDL and Performanceand Accountability System will..
• …Learn from lessons of the past– Bay Program
• Long term goals• Planning and commitment
– TMDL Program• Point source implementation
+ short term goals+ accountability
+ non-point sourceimplementation

Mandatory Pollution Diet at Work
Employ FederalActions orConsequences
DevelopWatershed
ImplementationPlans
EstablishBay TMDL:
Set 2-YearMilestones
11
MonitorProgress
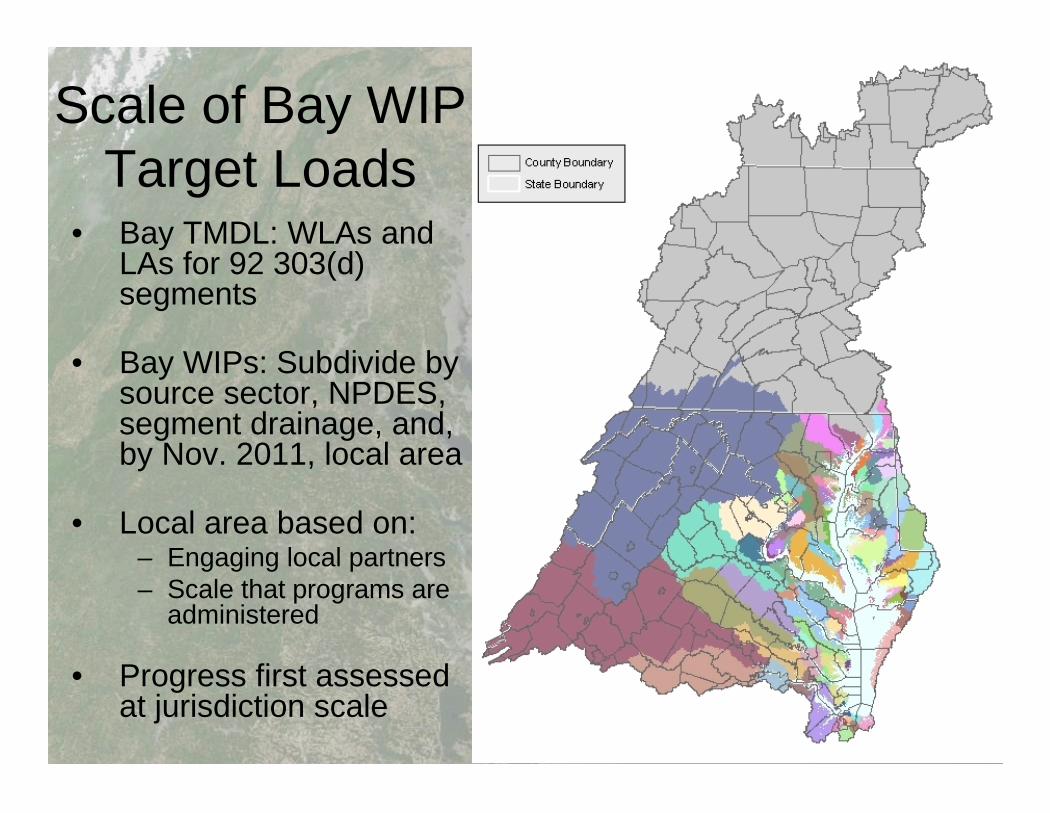
Scale of Bay WIPTarget Loads
• Bay TMDL: WLAs andLAs for 92 303(d)segments
• Bay WIPs: Subdivide bysource sector, NPDES,segment drainage, and,by Nov. 2011, local area
• Local area based on:– Engaging local partners– Scale that programs are
administered
• Progress first assessedat jurisdiction scale

Watershed Implementation Plans(WIPs)
• Stage 1: 60% reductions achieved by 2017• Stage 2: All controls in place no later than 2025

Example: Projected N Delivery by Source Sector for MajorBasin/Jurisdiction
Attaining specific load reductions by the interim target would be required Jurisdiction would determine desired reduction schedule to meet load reduction EPA would first evaluate milestones based on whether consistent with major basin/jurisdiction load target.
EPA accepts shifts among source sectors, segment drainages, and local targets as long as majorbasin/jurisdiction target is met and local and Bay water quality goals are achieved
35
27.5
2020
15
10
54
66
5.57
1.520.50
5
10
15
20
25
30
35
40
2009 2011 2013 2015 2017 2019 2021 2023 2025Year
Nitr
ogen
Loa
ds D
eliv
ered
to B
ay
TOTALAgricultureDevelopedWastewaterOnsite
9.5
6.5
3.5
10.5
9
12
7.5
5.5
10
3
3.5
2
0
5
10
15
20
25
30
35
40
2009 2011 2013 2015 2017 2019 2021 2023 2025Year
Nitro
gen
Load
s De
liver
ed to
Bay
OnsiteWastewaterDevelopedAgriculture
Proposeincreased budget
to legislature
Increasedprogrambudget
Increasedcontrols
Propose newlegislativeauthorities
RulemakingImplementregulatorycontrols
GeneralDescriptionof PlannedControls
LoadReductionSchedule
InterimTargets
FinalTargets
35
26
20
Stage 1Implementation
Stage 2Implementation

Bay TMDL Watershed ImplementationPlans Will Include 8 Elements:
1. Interim and Final Target Loads
2. Current Program Capacity
3. Mechanisms to Account for Growth
4. Gap Analysis
5. Commitment to Fill Gaps: Policies, Rules, Dates for Key Actions
6. Tracking and Reporting Protocols
7. Contingencies for Failed, Delayed or Incomplete Implementation
8. Appendix with:a. Loads divided by 303(d) segment drainage and source sectorb. 2-year milestone loads by jurisdiction – EPA will use to assess milestonesc. No later than November 2011: Update to include loads divided by local area
and controls to meet 2017 interim target loadSource: EPA November 2009 Ltr to States available at www.epa.gov/chesapeakebaytmdl

Specific controls/practices to beimplemented by 2025
Refined point source and NPS loads
To extentpossible
Specific controls/practices to beimplemented by 2017
Point source and NPS loads by local area
Actions and specific controls to achievepoint source and NPS target loads
Loads for nonpoint source (NPS) sectors
Loads for individual point sources, oraggregate point sources
PhaseIII
2017
PhaseII
11/2011
PhaseI
11/2010
WIP Phase ComparisonTaken from Table B1 of the 11/4/09 letter

2 year milestones
• Commitment on what will be accomplishedfor the next 2 years– source controls– loading reductions– program enhancements
Federal Actions*• For state failure to:
– submit WIPs consistent with EPA expectations
– submit 2-year milestones consistent with EPAexpectations
– achieve 2 year milestone target loads
18
*From EPA letter to states of December 29,2009
Federal Actions Include…*
• Expand NPDES permit coverage tounregulated sources
• Require net improvement offsets• Require additional reductions from PS’s• Increased federal enforcement• Condition or redirect federal grants• Promulgation of local nutrient standards
*From EPA letter to states of December 29,2009
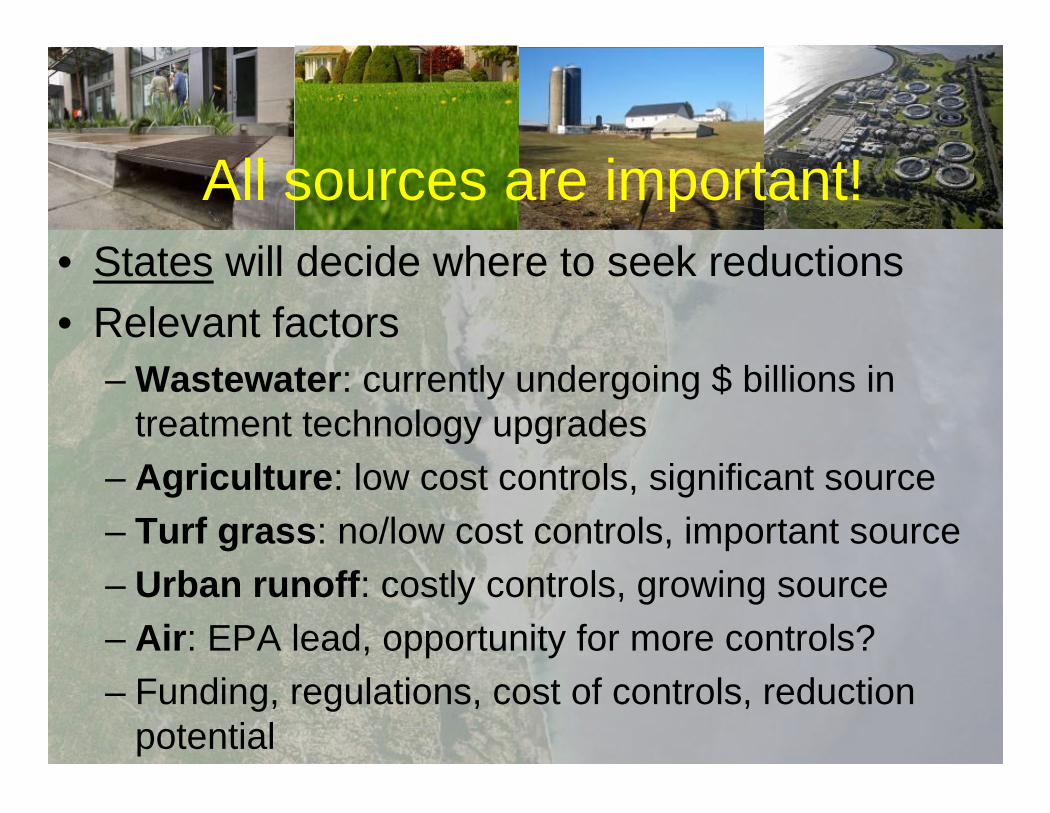
• States will decide where to seek reductions• Relevant factors
– Wastewater: currently undergoing $ billions intreatment technology upgrades
– Agriculture: low cost controls, significant source– Turf grass: no/low cost controls, important source– Urban runoff: costly controls, growing source– Air: EPA lead, opportunity for more controls?– Funding, regulations, cost of controls, reduction
potential
All sources are important!

TMDL & WIP ScheduleTMDL Development
– 11/2009 Nutrient targets released
– 4/2010 Revised nutrient and sedimenttargets
– 6-7/2010 EPA Plan Review– 8-10/2010 Draft TMDL for Public
Comment
– 10/2010 TMDL Revisions
– 12/2010 Final TMDL
– 1/2012 and on: 2-year milestones
Watershed Implementation Plan– 11/2009 Expectations released
– 6/2010 Initial Plan
– 8/2010 Draft Phase I Plan
– 10/2010 Phase I Plan Revisions– 11/2010 Final Phase I Plan
…
– 11/2011 Final Phase II Plan…
– By 2017 Phase III Plan

EPA Support to States WIPs
• Doubling of the Chesapeake Bay funding• Contractor support to each state• Contractor support for local pilots• Identified extensive WIP expectations• Modeling and other technical support• Regulatory actions to further support the
control of stormwater and animal runoff.
Tetra Tech WIP Support• Watershed Implementation Plan Assistance
– Data analysis to assist with loadingcalculations
– Support translating reduction strategies intomodel scenarios
– Support for model set up on state computers– Effectiveness of management activities and
controls– Programmatic research and support– Programmatic and data analysis support for
Local Implementation Pilot Projects
Tetra Tech WIP Support cont’d
• Develop a methodology to establishcurrent loads– CAFO/Non-CAFO– Significant/Non-significant wastewater– MS4/non MS4 urban runoff– Industrial and Construction
• Permit identification/confirmation• Permit based vs. Land Use based
determinations

Further Information
• Chesapeake Bay TMDL web sitewww.epa.gov/chesapeakebaytmdl
• U.S. EPA Region 3 Contacts– Water Protection Division
• Bob Koroncai– 215-814-5730; [email protected]
• Jennifer Sincock ([email protected])• Suzanne Hall ([email protected])
– Chesapeake Bay Program Office• Rich Batiuk
– 410-267-5731; [email protected]• Katherine Antos ([email protected])
25

Questions & CommentsQuestions & Comments
26