City of Los Angeles 2018 Local Hazard Mitigation Plan · Mitigation Plan Eric Garcetti, Mayor Aram...
198
City of Los Angeles 2018 Local Hazard Mitigation Plan Eric Garcetti, Mayor Aram Sahakian, General Manager Emergency Management Department FINAL—January 2018
Transcript of City of Los Angeles 2018 Local Hazard Mitigation Plan · Mitigation Plan Eric Garcetti, Mayor Aram...
City of Los Angeles 2018 Local Hazard
Mitigation Plan
Eric Garcetti, Mayor Aram Sahakian, General Manager
Emergency Management Department
FINAL—January 2018

City of Los Angeles 2018 Local Hazard Mitigation Plan January 2018
PREPARED FOR PREPARED BY
City of Los Angeles Emergency Management Department Tetra Tech 200 N. Spring Street Room 1533 Los Angeles, California 90012
1999 Harrison Street Suite 500 Oakland, CA 94612
Phone: 510.302.6300 Fax: 510.433.0830 tetratech.com
Tetra Tech Project # 103S4869 J:\EMCR_Projects\California\LosAngeles_City\HMP_2016_103S4869\Draft Plan\2018-02-09_Final\2018_LA_HMP_Final_2018-02-09.docx


City of Los Angeles 2018 Local Hazard Mitigation Plan Contents
v
CONTENTS
Executive Summary ............................................................................................................ xxii PART 1— PLANNING PROCESS AND COMMUNITY PROFILE
1. Introduction to Hazard Mitigation Planning ................................................................... 1-1 1.1 Why Prepare This Plan? ............................................................................................................................. 1-1
1.1.1 The Big Picture ................................................................................................................................. 1-1 1.1.2 Purposes for Planning ....................................................................................................................... 1-1
1.2 Who Will Benefit From This Plan? ........................................................................................................... 1-2 1.3 Contents of This Plan ................................................................................................................................. 1-2
2. Plan Update—What Has Changed ................................................................................... 2-1 2.1 The Previous Plan ...................................................................................................................................... 2-1 2.2 Why Update? ............................................................................................................................................. 2-2
2.2.1 Federal Eligibility ............................................................................................................................. 2-2 2.2.2 Changes in Development .................................................................................................................. 2-2
2.3 The Updated Plan—What Is Different? ..................................................................................................... 2-2
3. Plan Update Approach ..................................................................................................... 3-1 3.1 Grant Funding ............................................................................................................................................ 3-1 3.2 Formation of the Planning Team ............................................................................................................... 3-1 3.3 Defining the Planning Area........................................................................................................................ 3-1 3.4 The Steering Committee ............................................................................................................................ 3-3 3.5 Coordination with Other Agencies ............................................................................................................ 3-3 3.6 Review of Existing Programs .................................................................................................................... 3-5 3.7 Public Involvement .................................................................................................................................... 3-5
3.7.1 Strategy ............................................................................................................................................. 3-5 3.7.2 Public Involvement Results ............................................................................................................ 3-10
3.8 Plan Development Chronology/Milestones ............................................................................................. 3-11
4. City of Los Angeles Profile .............................................................................................. 4-1 4.1 Geographic Overview ................................................................................................................................ 4-1 4.2 Historical Overview ................................................................................................................................... 4-1 4.3 Major Past Hazard Events .......................................................................................................................... 4-2 4.4 Physical Setting .......................................................................................................................................... 4-3
4.4.1 Topography ...................................................................................................................................... 4-3 4.4.2 Soils and Geology ............................................................................................................................ 4-3 4.4.3 Climate ............................................................................................................................................. 4-4
4.5 Development Profile .................................................................................................................................. 4-6 4.5.1 Land Use ........................................................................................................................................... 4-6 4.5.2 Critical Facilities and Infrastructure ................................................................................................. 4-7 4.5.3 Future Trends in Development ....................................................................................................... 4-22
4.6 Community Demographic profile ............................................................................................................ 4-23 4.6.1 Population Characteristics .............................................................................................................. 4-23 4.6.2 Age Distribution ............................................................................................................................. 4-25 4.6.3 Race, Ethnicity and Language ........................................................................................................ 4-26 4.6.4 Individuals with Disabilities or Access and Functional Needs ...................................................... 4-26
City of Los Angeles 2018 Local Hazard Mitigation Plan Contents
vi
4.7 Economy .................................................................................................................................................. 4-27 4.7.1 Income ............................................................................................................................................ 4-27 4.7.2 Industry, Businesses and Institutions ............................................................................................. 4-27 4.7.3 Employment Trends and Occupations ............................................................................................ 4-29
4.8 Vulnerable Communities ......................................................................................................................... 4-30 4.8.1 Westlake Community ..................................................................................................................... 4-32 4.8.2 Historic South-Central Community ................................................................................................ 4-32 4.8.3 South Park Community .................................................................................................................. 4-32 4.8.4 Central-Alameda Community ........................................................................................................ 4-32 4.8.5 Pico Union Community .................................................................................................................. 4-33 4.8.6 Florence Community ...................................................................................................................... 4-33 4.8.7 Watts Community ........................................................................................................................... 4-33 4.8.8 Boyle Heights Community ............................................................................................................. 4-33 4.8.9 Koreatown Community .................................................................................................................. 4-33
4.9 Laws and Ordinances ............................................................................................................................... 4-33 4.9.1 Federal ............................................................................................................................................ 4-34 4.9.2 State ................................................................................................................................................ 4-41 4.9.3 City of Los Angeles ........................................................................................................................ 4-46 4.9.4 Capability Assessment.................................................................................................................... 4-53
PART 2— RISK ASSESSMENT
5. Hazards of Concern, Risk Assessment Methodology ................................................... 5-1 5.1 Identified Hazards of Concern ................................................................................................................... 5-1 5.2 Risk Assessment Tools .............................................................................................................................. 5-2
5.2.1 Mapping ............................................................................................................................................ 5-2 5.2.2 Hazus ................................................................................................................................................ 5-2
5.3 Risk Assessment Approach ........................................................................................................................ 5-3 5.3.1 Dam Failure, Earthquake, Tsunami, Sea Level Rise and Flood ....................................................... 5-3 5.3.2 Drought ............................................................................................................................................. 5-4 5.3.3 All Other Assessed Hazards ............................................................................................................. 5-4
5.4 Sources of Data Used in Hazus Modeling ................................................................................................. 5-4 5.4.1 Building and Cost Data .................................................................................................................... 5-4 5.4.2 Hazus Data Inputs............................................................................................................................. 5-4 5.4.3 Other Local Hazard Data .................................................................................................................. 5-5 5.4.4 Data Source Summary ...................................................................................................................... 5-5
5.5 Limitations ................................................................................................................................................. 5-5
6. Adverse Weather ............................................................................................................. 6-1 6.1 General Background .................................................................................................................................. 6-1
6.1.1 Extreme Heat .................................................................................................................................... 6-1 6.1.2 High Winds ....................................................................................................................................... 6-2 6.1.3 Tornadoes ......................................................................................................................................... 6-3
6.2 Hazard Profile ............................................................................................................................................ 6-5 6.2.1 Past Events ....................................................................................................................................... 6-5 6.2.2 Location ............................................................................................................................................ 6-5 6.2.3 Frequency ......................................................................................................................................... 6-6 6.2.4 Severity ............................................................................................................................................. 6-6 6.2.5 Warning Time ................................................................................................................................... 6-6
6.3 Secondary Impacts ..................................................................................................................................... 6-8
City of Los Angeles 2018 Local Hazard Mitigation Plan Contents
vii
6.4 Exposure .................................................................................................................................................... 6-8 6.4.1 Population ......................................................................................................................................... 6-8 6.4.2 Property ............................................................................................................................................ 6-8 6.4.3 Critical Facilities and Infrastructure ................................................................................................. 6-9 6.4.4 Environment ..................................................................................................................................... 6-9
6.5 Vulnerability .............................................................................................................................................. 6-9 6.5.1 Population ......................................................................................................................................... 6-9 6.5.2 Property ............................................................................................................................................ 6-9 6.5.3 Critical Facilities and Infrastructure ............................................................................................... 6-10 6.5.4 Environment ................................................................................................................................... 6-10
6.6 Future Trends in Development ................................................................................................................ 6-10 6.7 Scenario.................................................................................................................................................... 6-10 6.8 Issues ........................................................................................................................................................ 6-10
7. Dam Failure ....................................................................................................................... 7-1 7.1 General Background .................................................................................................................................. 7-1
7.1.1 Causes of Dam Failure ..................................................................................................................... 7-1 7.1.2 Regulatory Oversight........................................................................................................................ 7-2
7.2 Hazard Profile ............................................................................................................................................ 7-4 7.2.1 Past Events ....................................................................................................................................... 7-4 7.2.2 Location ............................................................................................................................................ 7-5 7.2.3 Frequency ......................................................................................................................................... 7-7 7.2.4 Severity ............................................................................................................................................. 7-7 7.2.5 Warning Time ................................................................................................................................... 7-7
7.3 Secondary Impacts ..................................................................................................................................... 7-8 7.4 Exposure .................................................................................................................................................... 7-8
7.4.1 Population ......................................................................................................................................... 7-8 7.4.2 Property ............................................................................................................................................ 7-8 7.4.3 Critical Facilities .............................................................................................................................. 7-9 7.4.4 Environment ................................................................................................................................... 7-10
7.5 Vulnerability ............................................................................................................................................ 7-10 7.5.1 Population ....................................................................................................................................... 7-10 7.5.2 Property .......................................................................................................................................... 7-10 7.5.3 Critical Facilities ............................................................................................................................ 7-10 7.5.4 Environment ................................................................................................................................... 7-11
7.6 Future Trends in Development ................................................................................................................ 7-11 7.7 Scenario.................................................................................................................................................... 7-12 7.8 Issues ........................................................................................................................................................ 7-12
8. Drought .............................................................................................................................. 8-1 8.1 General Background .................................................................................................................................. 8-1
8.1.1 Monitoring Drought.......................................................................................................................... 8-1 8.1.2 Drought in California ....................................................................................................................... 8-4 8.1.3 Local Water Supply .......................................................................................................................... 8-5 8.1.4 Defined Drought Stages ................................................................................................................... 8-6
8.2 Hazard Profile ............................................................................................................................................ 8-6 8.2.1 Past Events ....................................................................................................................................... 8-6 8.2.2 Location ............................................................................................................................................ 8-8 8.2.3 Frequency ......................................................................................................................................... 8-8 8.2.4 Severity ............................................................................................................................................. 8-8

City of Los Angeles 2018 Local Hazard Mitigation Plan Contents
viii
8.2.5 Warning Time ................................................................................................................................... 8-9 8.3 Secondary Impacts ..................................................................................................................................... 8-9 8.4 Exposure .................................................................................................................................................... 8-9 8.5 Vulnerability .............................................................................................................................................. 8-9
8.5.1 Population ......................................................................................................................................... 8-9 8.5.2 Property .......................................................................................................................................... 8-10 8.5.3 Critical Facilities ............................................................................................................................ 8-10 8.5.4 Environment ................................................................................................................................... 8-10 8.5.5 Economic Impact ............................................................................................................................ 8-10
8.6 Future Trends in Development ................................................................................................................ 8-10 8.7 Scenario.................................................................................................................................................... 8-11 8.8 Issues ........................................................................................................................................................ 8-11
9. Earthquake ........................................................................................................................ 9-1 9.1 General Background .................................................................................................................................. 9-1
9.1.1 Earthquake Classifications ............................................................................................................... 9-1 9.1.2 Ground Motion ................................................................................................................................. 9-2 9.1.3 Effect of Soil Types .......................................................................................................................... 9-5
9.2 Hazard Profile ............................................................................................................................................ 9-5 9.2.1 Past Events ....................................................................................................................................... 9-5 9.2.2 Location ............................................................................................................................................ 9-6 9.2.3 Frequency ......................................................................................................................................... 9-9 9.2.4 Severity ........................................................................................................................................... 9-29 9.2.5 Warning Time ................................................................................................................................. 9-30
9.3 Secondary Impacts ................................................................................................................................... 9-30 9.4 Exposure .................................................................................................................................................. 9-30
9.4.1 Population ....................................................................................................................................... 9-30 9.4.2 Property .......................................................................................................................................... 9-30 9.4.3 Critical Facilities and Infrastructure ............................................................................................... 9-30 9.4.4 Environment ................................................................................................................................... 9-31
9.5 Vulnerability ............................................................................................................................................ 9-31 9.5.1 Population ....................................................................................................................................... 9-31 9.5.2 Property .......................................................................................................................................... 9-32 9.5.3 Critical Facilities and Infrastructure ............................................................................................... 9-35 9.5.4 Environment ................................................................................................................................... 9-35
9.6 Future Trends in Development ................................................................................................................ 9-44 9.7 Scenario.................................................................................................................................................... 9-44 9.8 Issues ........................................................................................................................................................ 9-45
10. Flood .............................................................................................................................. 10-1 10.1 General Background .............................................................................................................................. 10-1
10.1.1 Measuring Floods and Floodplains .............................................................................................. 10-1 10.1.2 Floodplain Ecosystems ................................................................................................................. 10-2 10.1.3 Effects of Human Activities ......................................................................................................... 10-2 10.1.4 Federal Flood Programs ............................................................................................................... 10-2
10.2 Hazard Profile ........................................................................................................................................ 10-3 10.2.1 Flood Types and Areas in City of Los Angeles ............................................................................ 10-3 10.2.2 Principal Flooding Sources ........................................................................................................... 10-5 10.2.3 Past Events ................................................................................................................................... 10-5 10.2.4 Location ........................................................................................................................................ 10-7

City of Los Angeles 2018 Local Hazard Mitigation Plan Contents
ix
10.2.5 Frequency ..................................................................................................................................... 10-7 10.2.6 Severity ......................................................................................................................................... 10-7 10.2.7 Warning Time ............................................................................................................................. 10-17
10.3 Flood Control System .......................................................................................................................... 10-18 10.3.1 Los Angeles County Drainage Area Project ............................................................................... 10-19 10.3.2 City Drainage System ................................................................................................................. 10-20 10.3.3 Summary .................................................................................................................................... 10-20
10.4 Secondary Impacts ............................................................................................................................... 10-20 10.5 Exposure .............................................................................................................................................. 10-21
10.5.1 Population ................................................................................................................................... 10-21 10.5.2 Property ...................................................................................................................................... 10-21 10.5.3 Critical Facilities and Infrastructure ........................................................................................... 10-23 10.5.4 Environment ............................................................................................................................... 10-25
10.6 Vulnerability ........................................................................................................................................ 10-26 10.6.1 Population ................................................................................................................................... 10-26 10.6.2 Property ...................................................................................................................................... 10-28 10.6.3 Critical Facilities and Infrastructure ........................................................................................... 10-38 10.6.4 Environment ............................................................................................................................... 10-38
10.7 Future Trends ....................................................................................................................................... 10-38 10.8 Scenario................................................................................................................................................ 10-39 10.9 Issues .................................................................................................................................................... 10-39
11. Landslide / Debris Flow ................................................................................................ 11-1 11.1 General Background .............................................................................................................................. 11-1
11.1.1 Landslide Types ........................................................................................................................... 11-1 11.1.2 Landslide Modeling ...................................................................................................................... 11-2 11.1.3 Landslide Causes .......................................................................................................................... 11-3 11.1.4 Landslide Management ................................................................................................................ 11-4
11.2 Hazard Profile ........................................................................................................................................ 11-5 11.2.1 Past Events ................................................................................................................................... 11-5 11.2.2 Location ........................................................................................................................................ 11-5 11.2.3 Frequency ................................................................................................................................... 11-14 11.2.4 Severity ....................................................................................................................................... 11-14 11.2.5 Warning Time ............................................................................................................................. 11-14
11.3 Secondary Impacts ............................................................................................................................... 11-15 11.4 Exposure .............................................................................................................................................. 11-15
11.4.1 Population ................................................................................................................................... 11-15 11.4.2 Property ...................................................................................................................................... 11-15 11.4.3 Critical Facilities and Infrastructure ........................................................................................... 11-17 11.4.4 Environment ............................................................................................................................... 11-19
11.5 Vulnerability ........................................................................................................................................ 11-19 11.5.1 Population ................................................................................................................................... 11-19 11.5.2 Property ...................................................................................................................................... 11-19 11.5.3 Critical Facilities and Infrastructure ........................................................................................... 11-19 11.5.4 Environment ............................................................................................................................... 11-20
11.6 Future Trends in Development ............................................................................................................ 11-20 11.7 Scenario................................................................................................................................................ 11-20 11.8 Issues .................................................................................................................................................... 11-21
12. Tsunami ......................................................................................................................... 12-1

City of Los Angeles 2018 Local Hazard Mitigation Plan Contents
x
12.1 General Background .............................................................................................................................. 12-1 12.1.1 Tsunami Behavior ........................................................................................................................ 12-1 12.1.2 Tsunami Causes ............................................................................................................................ 12-2
12.2 Hazard Profile ........................................................................................................................................ 12-2 12.2.1 Past Events ................................................................................................................................... 12-2 12.2.2 Location ........................................................................................................................................ 12-3 12.2.3 Frequency ..................................................................................................................................... 12-3 12.2.4 Severity ......................................................................................................................................... 12-6 12.2.5 Warning Time ............................................................................................................................... 12-6
12.3 Secondary Impacts ................................................................................................................................. 12-7 12.4 Exposure ................................................................................................................................................ 12-8
12.4.1 Population ..................................................................................................................................... 12-8 12.4.2 Property ........................................................................................................................................ 12-8 12.4.3 Critical Facilities and Infrastructure ............................................................................................. 12-9 12.4.4 Environment ............................................................................................................................... 12-10
12.5 Vulnerability ........................................................................................................................................ 12-10 12.5.1 Population ................................................................................................................................... 12-10 12.5.2 Property ...................................................................................................................................... 12-11 12.5.3 Critical Facilities and Infrastructure ........................................................................................... 12-11 12.5.4 Environment ............................................................................................................................... 12-11
12.6 Future Trends in Development ............................................................................................................ 12-12 12.7 Scenario................................................................................................................................................ 12-12 12.8 Issues .................................................................................................................................................... 12-12
13. Urban / Wildland Interface Fire .................................................................................... 13-1 13.1 General Background .............................................................................................................................. 13-1 13.2 Hazard Profile ........................................................................................................................................ 13-1
13.2.1 Past Events ................................................................................................................................... 13-1 13.2.2 Location ........................................................................................................................................ 13-2 13.2.3 Frequency ..................................................................................................................................... 13-3 13.2.4 Severity ......................................................................................................................................... 13-3 13.2.5 Warning Time ............................................................................................................................... 13-3
13.3 Secondary Impacts ............................................................................................................................... 13-11 13.4 Exposure .............................................................................................................................................. 13-11
13.4.1 Population ................................................................................................................................... 13-11 13.4.2 Property ...................................................................................................................................... 13-11 13.4.3 Critical Facilities and Infrastructure ........................................................................................... 13-12 13.4.4 Environment ............................................................................................................................... 13-13
13.5 Vulnerability ........................................................................................................................................ 13-13 13.5.1 Population ................................................................................................................................... 13-13 13.5.2 Property ...................................................................................................................................... 13-14 13.5.3 Critical Facilities and Infrastructure ........................................................................................... 13-14
13.6 Future Trends in Development ............................................................................................................ 13-14 13.7 Scenario................................................................................................................................................ 13-14 13.8 Issues .................................................................................................................................................... 13-15
14. Climate Change and Sea Level Rise ........................................................................... 14-1 14.1 General Background .............................................................................................................................. 14-1
14.1.1 What is Climate Change? ............................................................................................................. 14-1 14.1.2 How Climate Change Affects Hazard Mitigation ........................................................................ 14-1

City of Los Angeles 2018 Local Hazard Mitigation Plan Contents
xi
14.1.3 Current Indicators of Climate Change .......................................................................................... 14-2 14.1.4 Projected Future Impacts .............................................................................................................. 14-3 14.1.5 Responses to Climate Change ...................................................................................................... 14-6
14.2 Vulnerability Assessment— Hazards of Concern.................................................................................. 14-7 14.2.1 Adverse Weather .......................................................................................................................... 14-7 14.2.2 Dam Failure .................................................................................................................................. 14-8 14.2.3 Drought ......................................................................................................................................... 14-9 14.2.4 Earthquake .................................................................................................................................. 14-10 14.2.5 Flood ........................................................................................................................................... 14-11 14.2.6 Landslide .................................................................................................................................... 14-12 14.2.7 Tsunami ...................................................................................................................................... 14-13 14.2.8 Wildfire ...................................................................................................................................... 14-13
14.3 Vulnerability Assessment—Sea Level Rise ........................................................................................ 14-14 14.3.1 Climate Change Impacts on the Hazard ..................................................................................... 14-14 14.3.2 Exposure, Sensitivity and Vulnerability ..................................................................................... 14-14
14.4 Issues .................................................................................................................................................... 14-24
15. Critical Infrastructure, High-Rise/High-Occupancy Building Fire, Special Events . 15-1 15.1 General Background .............................................................................................................................. 15-1
15.1.1 Critical Infrastructure ................................................................................................................... 15-1 15.1.2 High-Rise/High-Occupancy Building Fire ................................................................................... 15-3 15.1.3 Special Events Incidents ............................................................................................................... 15-4
15.2 Hazard Profile ........................................................................................................................................ 15-6 15.2.1 Past Events ................................................................................................................................... 15-6 15.2.2 Location ........................................................................................................................................ 15-7 15.2.3 Frequency ..................................................................................................................................... 15-8 15.2.4 Severity ......................................................................................................................................... 15-8 15.2.5 Warning Time ............................................................................................................................... 15-9
15.3 Secondary Impacts ................................................................................................................................. 15-9 15.3.1 Critical Infrastructure ................................................................................................................... 15-9 15.3.2 High-Rise/High-Occupancy Building Fire ................................................................................... 15-9 15.3.3 Special Events Incidents ............................................................................................................... 15-9
15.4 Exposure .............................................................................................................................................. 15-10 15.4.1 Critical Infrastructure ................................................................................................................. 15-10 15.4.2 High-Rise/High-Occupancy Building Fire ................................................................................. 15-10 15.4.3 Special Events Incidents ............................................................................................................. 15-10
15.5 Vulnerability ........................................................................................................................................ 15-10 15.5.1 Critical Infrastructure ................................................................................................................. 15-10 15.5.2 High-Rise/High-Occupancy Building Fire ................................................................................. 15-11 15.5.3 Special Event Incidents .............................................................................................................. 15-11
15.6 Future Trends in Development ............................................................................................................ 15-11 15.6.1 Critical Infrastructure ................................................................................................................. 15-11 15.6.2 High-Rise/High-Occupancy Building Fire ................................................................................. 15-11 15.6.3 Special Events Incidents ............................................................................................................. 15-12
15.7 Scenario................................................................................................................................................ 15-12 15.7.1 Critical Infrastructure ................................................................................................................. 15-12 15.7.2 High-Rise/High-Occupancy Building Fire ................................................................................. 15-12 15.7.3 Special Events Incidents ............................................................................................................. 15-12
15.8 Issues .................................................................................................................................................... 15-12

City of Los Angeles 2018 Local Hazard Mitigation Plan Contents
xii
16. Cyber-Attack and Space Weather (Technology-Impacted Hazards) ........................ 16-1 16.1 General Background .............................................................................................................................. 16-1
16.1.1 Cyber-Attack ................................................................................................................................ 16-1 16.1.2 Cyber-Terrorism ........................................................................................................................... 16-3 16.1.3 Space Weather .............................................................................................................................. 16-4
16.2 Hazard Profile ........................................................................................................................................ 16-6 16.2.1 Past Events ................................................................................................................................... 16-6 16.2.2 Location ........................................................................................................................................ 16-7 16.2.3 Frequency ..................................................................................................................................... 16-7 16.2.4 Severity ......................................................................................................................................... 16-7 16.2.5 Warning Time ............................................................................................................................... 16-8
16.3 Secondary Impacts ................................................................................................................................. 16-8 16.4 Exposure ................................................................................................................................................ 16-8
16.4.1 Population ..................................................................................................................................... 16-8 16.4.2 Property ........................................................................................................................................ 16-8 16.4.3 Critical Facilities and Infrastructure ............................................................................................. 16-8 16.4.4 Environment ................................................................................................................................. 16-8
16.5 Vulnerability .......................................................................................................................................... 16-9 16.5.1 Population ..................................................................................................................................... 16-9 16.5.2 Property ........................................................................................................................................ 16-9 16.5.3 Critical Facilities and Infrastructure ............................................................................................. 16-9 16.5.4 Environment ................................................................................................................................. 16-9 16.5.5 Economic Impacts ........................................................................................................................ 16-9
16.6 Future Trends in Development ............................................................................................................ 16-10 16.7 Scenario................................................................................................................................................ 16-10 16.8 Issues .................................................................................................................................................... 16-10
17. Hazardous Material, Transportation and Radiological Incidents ............................. 17-1 17.1 General Background .............................................................................................................................. 17-1
17.1.1 Hazardous Materials ..................................................................................................................... 17-1 17.1.2 Transportation .............................................................................................................................. 17-2 17.1.3 Radiological Incidents .................................................................................................................. 17-3
17.2 Hazard Profile ........................................................................................................................................ 17-3 17.2.1 Past Events ................................................................................................................................... 17-3 17.2.2 Location ........................................................................................................................................ 17-6 17.2.3 Frequency ..................................................................................................................................... 17-8 17.2.4 Severity ......................................................................................................................................... 17-8 17.2.5 Warning Time ............................................................................................................................. 17-10
17.3 Secondary Impacts ............................................................................................................................... 17-10 17.3.1 Hazardous Materials ................................................................................................................... 17-10 17.3.2 Transportation Incidents ............................................................................................................. 17-10 17.3.3 Radiological Incidents ................................................................................................................ 17-10
17.4 Exposure .............................................................................................................................................. 17-10 17.4.1 Population ................................................................................................................................... 17-10 17.4.2 Property ...................................................................................................................................... 17-11 17.4.3 Critical Facilities and Infrastructure ........................................................................................... 17-11 17.4.4 Environment ............................................................................................................................... 17-11
17.5 Vulnerability ........................................................................................................................................ 17-11 17.5.1 Population ................................................................................................................................... 17-11
City of Los Angeles 2018 Local Hazard Mitigation Plan Contents
xiii
17.5.2 Property ...................................................................................................................................... 17-12 17.5.3 Critical Facilities and Infrastructure ........................................................................................... 17-12 17.5.4 Environment ............................................................................................................................... 17-12 17.5.5 Economic Impacts ...................................................................................................................... 17-12
17.6 Future Trends in Development ............................................................................................................ 17-13 17.7 Scenario................................................................................................................................................ 17-13 17.8 Issues .................................................................................................................................................... 17-13
18. Public Health Hazards .................................................................................................. 18-1 18.1 General Background .............................................................................................................................. 18-1
18.1.1 Influenza ....................................................................................................................................... 18-1 18.1.2 Smallpox ....................................................................................................................................... 18-2 18.1.3 Viral Hemorrhagic Fevers ............................................................................................................ 18-2 18.1.4 Plague ........................................................................................................................................... 18-3 18.1.5 Tick-Borne Disease ...................................................................................................................... 18-4 18.1.6 Mosquito-Borne Disease .............................................................................................................. 18-5 18.1.7 Anthrax ......................................................................................................................................... 18-6 18.1.8 Severe Acute Respiratory Syndrome ............................................................................................ 18-7 18.1.9 Adverse Weather .......................................................................................................................... 18-7
18.2 Hazard Profile ........................................................................................................................................ 18-9 18.2.1 Past Events ................................................................................................................................... 18-9 18.2.2 Location ...................................................................................................................................... 18-10 18.2.3 Frequency ................................................................................................................................... 18-10 18.2.4 Severity ....................................................................................................................................... 18-10 18.2.5 Warning Time ............................................................................................................................. 18-10
18.3 Secondary Impacts ............................................................................................................................... 18-10 18.4 Exposure .............................................................................................................................................. 18-11
18.4.1 Population ................................................................................................................................... 18-11 18.4.2 Property ...................................................................................................................................... 18-11 18.4.3 Critical Facilities and Infrastructure ........................................................................................... 18-11 18.4.4 Environment ............................................................................................................................... 18-11
18.5 Vulnerability ........................................................................................................................................ 18-11 18.5.1 Population ................................................................................................................................... 18-11 18.5.2 Property ...................................................................................................................................... 18-11 18.5.3 Critical Facilities and Infrastructure ........................................................................................... 18-11 18.5.4 Environment ............................................................................................................................... 18-12
18.6 Future Trends in Development ............................................................................................................ 18-12 18.7 Scenario................................................................................................................................................ 18-12 18.8 Issues .................................................................................................................................................... 18-12
19. Terrorism and Weapons of Mass Destruction, Civil Unrest ...................................... 19-1 19.1 General Background .............................................................................................................................. 19-1
19.1.1 Terrorism and Weapons of Mass Destruction .............................................................................. 19-1 19.1.2 Civil Unrest .................................................................................................................................. 19-5
19.2 Hazard Profile ........................................................................................................................................ 19-5 19.2.1 Past Events ................................................................................................................................... 19-5 19.2.2 Location ........................................................................................................................................ 19-7 19.2.3 Frequency ..................................................................................................................................... 19-7 19.2.4 Severity ......................................................................................................................................... 19-7 19.2.5 Warning Time ............................................................................................................................... 19-8
City of Los Angeles 2018 Local Hazard Mitigation Plan Contents
xiv
19.3 Secondary Impacts ................................................................................................................................. 19-8 19.3.1 Terrorism and WMD .................................................................................................................... 19-8 19.3.2 Civil Unrest .................................................................................................................................. 19-8
19.4 Exposure ................................................................................................................................................ 19-8 19.4.1 Population ..................................................................................................................................... 19-8 19.4.2 Property ........................................................................................................................................ 19-9 19.4.3 Critical Facilities and Infrastructure ............................................................................................. 19-9 19.4.4 Environment ............................................................................................................................... 19-10
19.5 Vulnerability ........................................................................................................................................ 19-10 19.5.1 Population ................................................................................................................................... 19-10 19.5.2 Property ...................................................................................................................................... 19-11 19.5.3 Critical Facilities and Infrastructure ........................................................................................... 19-11 19.5.4 Environment ............................................................................................................................... 19-11 19.5.5 Economic Impacts ...................................................................................................................... 19-12
19.6 Future Trends in Development ............................................................................................................ 19-12 19.6.1 Terrorism and WMD .................................................................................................................. 19-12 19.6.2 Civil Unrest ................................................................................................................................ 19-12
19.7 Scenario................................................................................................................................................ 19-12 19.8 Issues .................................................................................................................................................... 19-13
20. Risk Ranking ................................................................................................................. 20-1 20.1 Probability of Occurrence ...................................................................................................................... 20-1 20.2 Impact .................................................................................................................................................... 20-1 20.3 Risk Rating and Ranking ....................................................................................................................... 20-4
PART 3— MITIGATION STRATEGY
21. Goals and Objectives ................................................................................................... 21-1
22. Mitigation Alternatives ................................................................................................. 22-1
23. Action Plan and Implementation ................................................................................. 23-1 23.1 Status of Previous Plan Actions ............................................................................................................. 23-1
23.1.1 Status of Plan Incorporation Actions ............................................................................................ 23-1 23.2 Action Plan............................................................................................................................................. 23-1
23.2.1 Benefit-Cost Review .................................................................................................................... 23-2 23.2.2 Action Plan Prioritization ........................................................................................................... 23-13 23.2.3 Analysis of Actions .................................................................................................................... 23-17
23.3 Plan Adoption ...................................................................................................................................... 23-21 23.4 Plan Maintenance Strategy................................................................................................................... 23-21
23.4.1 Plan Implementation ................................................................................................................... 23-22 23.4.2 Steering Committee .................................................................................................................... 23-22 23.4.3 Annual Progress Report .............................................................................................................. 23-22 23.4.4 Plan Update ................................................................................................................................ 23-23 23.4.5 Continuing Public Involvement .................................................................................................. 23-23 23.4.6 Integration with Other Planning Mechanisms ............................................................................ 23-24
References ............................................................................................................................... 1
Glossary ................................................................................................................................... 1

City of Los Angeles 2018 Local Hazard Mitigation Plan Contents
xv
Appendices
Appendix A. Outreach Survey & Results Appendix B. Data Sources and Methods Used for Mapping Appendix C. Review of Previous Plan Actions Appendix D. Progress Report Template Appendix E. City of Los Angeles Adoption Resolution
Tables
Table 2-1. Risk Ratings for All Hazards and Vulnerabilities ................................................................................. 2-1 Table 2-2. Plan Changes Crosswalk ....................................................................................................................... 2-3
Table 3-1. Steering Committee Members ............................................................................................................... 3-4 Table 3-2. Summary of Public Meetings .............................................................................................................. 3-10 Table 3-3. Plan Development Chronology/Milestones ........................................................................................ 3-12
Table 4-1. Presidential Disaster Declarations Applying to Los Angeles County ................................................... 4-2 Table 4-2. Identified Soil Types in the Los Angeles Area ..................................................................................... 4-3 Table 4-3. Average Los Angeles Climate Data ...................................................................................................... 4-4 Table 4-4. General Plan Land Use within the Planning Area ................................................................................. 4-6 Table 4-5. Planning Area Critical Facilities ......................................................................................................... 4-22 Table 4-6. Annual Population Data ...................................................................................................................... 4-24 Table 4-7. Vulnerable Neighborhood Community Assets ................................................................................... 4-31 Table 4-8. Vulnerable Neighborhood Hazards ..................................................................................................... 4-31 Table 4-9. Vulnerable Neighborhood Race/Ethnicity, Educational Attainment, and Language Ability ............. 4-32 Table 4-10. Legal and Regulatory Capability ...................................................................................................... 4-53 Table 4-11. Administrative and Technical Capability .......................................................................................... 4-56 Table 4-12. Fiscal Capability ............................................................................................................................... 4-56 Table 4-13. Community Classifications ............................................................................................................... 4-56 Table 4-14. Development and Permitting Capability ........................................................................................... 4-56 Table 4-15. National Flood Insurance Program Compliance ............................................................................... 4-57 Table 4-16. Education and Outreach .................................................................................................................... 4-57 Table 4-17. Adaptive Capacity for Climate Change ............................................................................................ 4-58
Table 5-1. Hazus Model Data Documentation ....................................................................................................... 5-6
Table 6-1. The Fujita Scale and Enhanced Fujita Scale ......................................................................................... 6-3 Table 6-2. Loss Potential for Adverse Weather ................................................................................................... 6-10
Table 7-1. Los Angeles County Dam Inspection Dates ......................................................................................... 7-3 Table 7-2. Dams in Los Angeles County with Potential to Impact City of Los Angeles ....................................... 7-5 Table 7-3. Corps of Engineers Hazard Potential Classification ............................................................................. 7-7 Table 7-4. Exposure and Value of Structures in Dam Failure Inundation Areas ................................................... 7-9 Table 7-5. General Plan Land Use in Dam Failure Inundation Areas .................................................................... 7-9 Table 7-6. Critical Facilities and Infrastructure in Dam Failure Inundation Areas ................................................ 7-9 Table 7-7. Loss Estimates for Dam Failure .......................................................................................................... 7-11

City of Los Angeles 2018 Local Hazard Mitigation Plan Contents
xvi
Table 7-8. Estimated Debris ................................................................................................................................. 7-11 Table 7-9. Potential Damage to Critical Facilities in Dam Failure Inundation Area ........................................... 7-11
Table 8-1. State Drought Management Program .................................................................................................... 8-6
Table 9-1. Richter Magnitude Scale ....................................................................................................................... 9-2 Table 9-2. Moment Magnitude Class ..................................................................................................................... 9-2 Table 9-3. Modified Mercalli Intensity Scale ......................................................................................................... 9-3 Table 9-4. Mercalli Scale and Peak Ground Acceleration Comparison ................................................................. 9-4 Table 9-5. NEHRP Soil Classification System ...................................................................................................... 9-5 Table 9-6. Earthquakes Magnitude 5.0 or Larger Within 100-mile Radius of the Planning Area ......................... 9-6 Table 9-7. Northridge Earthquake Estimated Damages ......................................................................................... 9-6 Table 9-8. Earthquake Exposure by Area Planning Commission ........................................................................ 9-31 Table 9-9. Estimated Earthquake Impact on Persons and Households ................................................................ 9-32 Table 9-10. Age of Structures in Planning Area .................................................................................................. 9-32 Table 9-11. Loss Estimates for Newport-Inglewood Fault Scenario ................................................................... 9-33 Table 9-12. Loss Estimates for Palos Verde Fault Scenario ................................................................................ 9-33 Table 9-13. Loss Estimates for Puente Hills Fault Scenario ................................................................................ 9-33 Table 9-14. Loss Estimates for San Andreas Fault Scenario................................................................................ 9-34 Table 9-15. Loss Estimates for Santa Monica Fault Scenario .............................................................................. 9-34 Table 9-16. Estimated Earthquake-Caused Debris ............................................................................................... 9-34 Table 9-17. Estimated Number of Critical Facilities Damaged, by Damage Level—Newport/Inglewood Scenario .............................................................................................................................................................................. 9-35 Table 9-18. Estimated Number of Critical Facilities Damaged, by Damage Level—Palos Verdes Scenario ..... 9-36 Table 9-19. Estimated Number of Critical Facilities Damaged, by Damage Level—Puente Hills Scenario ....... 9-37 Table 9-20. Estimated Number of Critical Facilities Damaged, by Damage Level—San Andreas Scenario ...... 9-38 Table 9-21. Estimated Number of Critical Facilities Damaged, by Damage Level—Santa Monica Scenario .... 9-39 Table 9-22. Functionality of Critical Facilities—Newport/Inglewood Scenario ................................................. 9-40 Table 9-23. Functionality of Critical Facilities—Palos Verdes Scenario ............................................................. 9-41 Table 9-24. Functionality of Critical Facilities—Puente Hills Scenario .............................................................. 9-42 Table 9-25. Functionality of Critical Facilities—San Andreas Scenario ............................................................. 9-43 Table 9-26. Functionality of Critical Facilities—Santa Monica Scenario ........................................................... 9-44
Table 10-1. History of Flood Events .................................................................................................................... 10-6 Table 10-2. Summary of Peak Discharges Within the Planning Area ............................................................... 10-15 Table 10-3. Flood Control System Features in the City of Los Angeles ............................................................ 10-20 Table 10-4. Area and Structures in the 1-Percent-Annual-Chance Floodplain .................................................. 10-22 Table 10-5. Area and Structures in the 0.2-Percent-Annual-Chance Floodplain ............................................... 10-22 Table 10-6. Value of Structures in the 1-Percent-Annual-Chance Floodplain ................................................... 10-22 Table 10-7. Value of Structures in the 0.2-Percent-Annual-Chance Floodplain ................................................ 10-23 Table 10-8. Land Use Within the Floodplain ..................................................................................................... 10-23 Table 10-9. Critical Facilities in the Floodplain ................................................................................................. 10-24 Table 10-10. Estimated 1-Percent-Annual-Chance Flood Impact on Persons and Households ......................... 10-26 Table 10-11. Estimated 0.2-Percent-Annual-Chance Flood Impact on Persons and Households ...................... 10-26 Table 10-12. Loss Estimates for 1-Percent-Annual-Chance Flood .................................................................... 10-28 Table 10-13. Loss Estimates for 0.2-Percent-Annual-Chance Flood ................................................................. 10-29 Table 10-14. Estimated Flood-Caused Debris .................................................................................................... 10-29 Table 10-15. Potential Flood Damage to Critical Facilities in Flood Hazard Areas .......................................... 10-39
Table 11-1. Landslide Events in and near the City of Los Angeles Planning Area ............................................. 11-6 Table 11-2. Exposure and Value of Structures in Moderate Landslide Risk Areas ........................................... 11-16 Table 11-3. Exposure and Value of Structures in High Landslide Risk Areas .................................................. 11-16
City of Los Angeles 2018 Local Hazard Mitigation Plan Contents
xvii
Table 11-4. Exposure and Value of Structures in Very High Landslide Risk Areas ......................................... 11-16 Table 11-5. Land Use in Landslide Risk Areas .................................................................................................. 11-17 Table 11-6. Critical Facilities and Infrastructure in Landslide Risk Areas ........................................................ 11-18 Table 11-7. Loss Potential for Landslide (Aggregate from Very High and High Risk Areas) .......................... 11-19
Table 12-1. Exposure and Value of Structures in Tsunami Inundation Zone ...................................................... 12-8 Table 12-2. General Plan Land Use within the Tsunami Inundation Area........................................................... 12-9 Table 12-3. Critical Facilities and Infrastructure in Tsunami Inundation Zone ................................................... 12-9 Table 12-4. Loss Estimates for Tsunami ............................................................................................................ 12-11 Table 12-5. Potential Damage to Critical Facilities in Tsunami Inundation Area ............................................. 12-11
Table 13-1. Population Within Very High Wildfire Hazard Area ...................................................................... 13-11 Table 13-2. Exposure and Value of Structures in Very High Wildfire Hazard Area ......................................... 13-12 Table 13-3. Land Use Within the Very High Wildfire Hazard Area .................................................................. 13-12 Table 13-4. Critical Facilities and Infrastructure in Wildfire Hazard Areas ...................................................... 13-12 Table 13-5. Loss Estimates for Very High Wildfire Zone ................................................................................. 13-14
Table 14-1. Summary of Primary and Secondary Impacts Likely to Affect the City of Los Angeles ................. 14-4 Table 14-2. Estimated Population Residing Sea Level Rise Inundation Areas .................................................. 14-19 Table 14-3. Area and Structures in 25-cm with 100-year Storm Inundation Areas ........................................... 14-19 Table 14-4. Area and Structures in 150-cm with 100-year Storm Inundation Areas ......................................... 14-19 Table 14-5. Structure and Contents Value in 25-cm with 100-year Storm Sea Level Rise Inundation Areas ... 14-20 Table 14-6. Structure and Contents Value in 150-cm with 100-year Storm Sea Level Rise Inundation Areas . 14-20 Table 14-7. Land Use Within the Sea Level Rise Inundation Scenarios ............................................................ 14-20 Table 14-8. Critical Facilities in Sea Level Rise Inundation Areas ................................................................... 14-21 Table 14-9. Estimated Sea Level Rise with 100-year Storm Impacts on People ............................................... 14-22 Table 14-10. Loss Estimates for 25-cm Sea Level Rise with 100-Year Storm .................................................. 14-22 Table 14-11. Loss Estimates for 150-cm Sea Level Rise with 100-Year Storm ................................................ 14-22 Table 14-12. Estimated Coastal Flood-Caused Debris ....................................................................................... 14-23 Table 14-13. Potential Damage to Critical Facilities in Areas Affected by Sea Level Rise .............................. 14-23
Table 15-1. FEMA Standard Value for Loss of Service for Utilities and Roads/Bridges .................................. 15-10 Table 15-2. Analysis of High-Rise Buildings .................................................................................................... 15-11
Table 16-1. Common Mechanisms for Cyber-Attacks ......................................................................................... 16-2 Table 16-2. Past Space Weather Events ............................................................................................................... 16-6
Table 17-1. Hazard Materials Spills in the City of Los Angles Reported to Cal OES ......................................... 17-4 Table 17-2. Injuries and Fatalities from Hazardous Materials Spills in the City of Los Angles, Reported to Cal OES ...................................................................................................................................................................... 17-8
Table 19-1. Event Profiles for Terrorism ............................................................................................................. 19-2 Table 19-2. Criticality Factors .............................................................................................................................. 19-9 Table 19-3. Vulnerability Criteria ...................................................................................................................... 19-10
Table 20-1. Probability of Hazards....................................................................................................................... 20-1 Table 20-2. Impact on People from Hazards ........................................................................................................ 20-3 Table 20-3. Impact on Property from Hazards ..................................................................................................... 20-3 Table 20-4. Impact on Economy from Hazards ................................................................................................... 20-3 Table 20-5. Hazard Risk Rating ........................................................................................................................... 20-4 Table 20-6. Hazard Risk Ranking ........................................................................................................................ 20-4
Table 22-1. Alternatives to Mitigate the Adverse Weather Hazard ..................................................................... 22-2 Table 22-2. Alternatives to Mitigate the Dam Failure Hazard ............................................................................. 22-3
City of Los Angeles 2018 Local Hazard Mitigation Plan Contents
xviii
Table 22-3. Alternatives to Mitigate the Drought Hazard .................................................................................... 22-4 Table 22-4. Alternatives to Mitigate the Earthquake Hazard ............................................................................... 22-5 Table 22-5. Alternatives to Mitigate the Flood Hazard ........................................................................................ 22-6 Table 22-6. Alternatives to Mitigate the Landslide Hazard ................................................................................. 22-7 Table 22-7. Alternatives to Mitigate the Tsunami Hazard ................................................................................... 22-8 Table 22-8. Alternatives to Mitigate the Wildfire Hazard .................................................................................... 22-9
Table 23-1. Action Plan ........................................................................................................................................ 23-3 Table 23-2. Prioritization of Actions .................................................................................................................. 23-14 Table 23-3. Analysis of Actions ......................................................................................................................... 23-18
Figures
Figure 3-1. Planning Area for This Hazard Mitigation Plan .................................................................................. 3-2 Figure 3-2. Sample Page from Survey Distributed to the Public ........................................................................... 3-7 Figure 3-3. Abilities Expo Event ............................................................................................................................ 3-8 Figure 3-4. Seismic Retrofit Resource Fair ............................................................................................................ 3-8 Figure 3-5. QuakeSmart Preparedness Workshop for Businesses and Organizations ........................................... 3-8 Figure 3-6. QuakeSmart Preparedness Workshop for Businesses and Organizations ........................................... 3-8 Figure 3-7. Hazard Mitigation Plan Webpage on the Emergency Management Department Website .................. 3-9
Figure 4-1. Los Angeles Geologic Features ........................................................................................................... 4-5 Figure 4-2. Critical Facilities in the Central APC .................................................................................................. 4-8 Figure 4-3. Critical Facilities in the East Los Angeles APC .................................................................................. 4-9 Figure 4-4. Critical Facilities in the Harbor APC ................................................................................................. 4-10 Figure 4-5. Critical Facilities in the North Valley APC ....................................................................................... 4-11 Figure 4-6. Critical Facilities in the South Los Angeles APC .............................................................................. 4-12 Figure 4-7. Critical Facilities in the South Valley APC ....................................................................................... 4-13 Figure 4-8. Critical Facilities in the West Los Angeles APC ............................................................................... 4-14 Figure 4-9. Critical Infrastructure in the Central APC ......................................................................................... 4-15 Figure 4-10. Critical Infrastructure in the East Los Angeles APC ....................................................................... 4-16 Figure 4-11. Critical Infrastructure in the Harbor APC ........................................................................................ 4-17 Figure 4-12. Critical Infrastructure in the North Valley APC .............................................................................. 4-18 Figure 4-13. Critical Infrastructure in the South Los Angeles APC ..................................................................... 4-19 Figure 4-14. Critical Infrastructure in the South Valley APC .............................................................................. 4-20 Figure 4-15. Critical Infrastructure in the West Los Angeles APC ...................................................................... 4-21 Figure 4-16. Residential Building Permit Trends, 2005 to 2015 .......................................................................... 4-23 Figure 4-17. California and City of Los Angeles Population Growth .................................................................. 4-24 Figure 4-18. Planning Area Age Distribution ...................................................................................................... 4-25 Figure 4-19. Planning Area Race Distribution ..................................................................................................... 4-26 Figure 4-20. Industry in the Planning Area .......................................................................................................... 4-28 Figure 4-21. California and City of Los Angeles Unemployment Rate ............................................................... 4-29 Figure 4-22. Occupations in the City of Los Angeles .......................................................................................... 4-30 Figure 4-23. CRS Communities by Class Nationwide as of October 2016 .......................................................... 4-35
Figure 6-1. Potential Impact and Damage from a Tornado .................................................................................... 6-4 Figure 6-2. NWS HeatRisk Forecasting System .................................................................................................... 6-7
Figure 7-1. Dam Locations Within the Planning Area ........................................................................................... 7-6
City of Los Angeles 2018 Local Hazard Mitigation Plan Contents
xix
Figure 8-1. Palmer Crop Moisture Index for Week Ending March 11, 2017 ......................................................... 8-2 Figure 8-2. Palmer Z Index Short-Term Drought Conditions (February 2017) ..................................................... 8-2 Figure 8-3. Palmer Drought Severity Index (March 11, 2017) .............................................................................. 8-3 Figure 8-4. Palmer Hydrological Drought Index (February 2017) ......................................................................... 8-3 Figure 8-5. 24-Month Standardized Precipitation Index (March 2015 – February 2017) ...................................... 8-4 Figure 8-6. Primary Water Supply Sources for City of Los Angeles ..................................................................... 8-5
Figure 9-1. Peak Acceleration (%g) with 10% Probability of Exceedance in 50 Years ........................................ 9-4 Figure 9-2. Earthquake Fault Locations ................................................................................................................. 9-7 Figure 9-3. Newport-Inglewood Fault Scenario Peak Ground Acceleration........................................................ 9-10 Figure 9-4. Palos Verde Fault Scenario Peak Ground Acceleration..................................................................... 9-11 Figure 9-5. Puente Hills Fault Scenario Peak Ground Acceleration .................................................................... 9-12 Figure 9-6. San Andreas Fault Scenario Peak Ground Acceleration .................................................................... 9-13 Figure 9-7. Santa Monica Fault Scenario Peak Ground Acceleration .................................................................. 9-14 Figure 9-8. Central APC NEHRP Soils ............................................................................................................... 9-15 Figure 9-9. East Los Angeles APC NEHRP Soils ............................................................................................... 9-16 Figure 9-10. Harbor APC NEHRP Soils ............................................................................................................. 9-17 Figure 9-11. North Valley APC NEHRP Soils .................................................................................................... 9-18 Figure 9-12. South Los Angeles APC NEHRP Soils .......................................................................................... 9-19 Figure 9-13. South Valley APC NEHRP Soils .................................................................................................... 9-20 Figure 9-14. West Los Angeles APC NEHRP Soils ........................................................................................... 9-21 Figure 9-15. Central APC Liquefaction Zones ..................................................................................................... 9-22 Figure 9-16. East Los Angeles APC Liquefaction Zones .................................................................................... 9-23 Figure 9-17. Harbor APC Liquefaction Zones ..................................................................................................... 9-24 Figure 9-18. North Valley APC Liquefaction Zones ........................................................................................... 9-25 Figure 9-19. South Los Angeles APC Liquefaction Zones .................................................................................. 9-26 Figure 9-20. South Valley APC Liquefaction Zones ........................................................................................... 9-27 Figure 9-21. West Los Angeles APC Liquefaction Zones ................................................................................... 9-28 Figure 9-22. PGA with 2-Percent Probability of Exceedance in 50 Years........................................................... 9-29
Figure 10-1. Mapped Flood Hazard Areas in Central APC .................................................................................. 10-8 Figure 10-2. Mapped Flood Hazard Areas in East Los Angeles APC ................................................................. 10-9 Figure 10-3. Mapped Flood Hazard Areas in Harbor APC ................................................................................ 10-10 Figure 10-4. Mapped Flood Hazard Areas in North Valley APC ...................................................................... 10-11 Figure 10-5. Mapped Flood Hazard Areas in South Los Angeles APC ............................................................. 10-12 Figure 10-6. Mapped Flood Hazard Areas in South Valley APC ...................................................................... 10-13 Figure 10-7. Mapped Flood Hazard Areas in West Los Angeles APC .............................................................. 10-14 Figure 10-8. Example Hydrograph ..................................................................................................................... 10-18 Figure 10-9. Repetitive Loss Areas in the Central APC ..................................................................................... 10-31 Figure 10-10. Repetitive Loss Areas in the East Los Angeles APC .................................................................. 10-32 Figure 10-11. Repetitive Loss Areas in the Harbor APC ................................................................................... 10-33 Figure 10-12. Repetitive Loss Areas in the North Valley APC ......................................................................... 10-34 Figure 10-13. Repetitive Loss Areas in the South Los Angeles APC ................................................................ 10-35 Figure 10-14. Repetitive Loss Areas in the South Valley APC ......................................................................... 10-36 Figure 10-15. Repetitive Loss Areas in the West Los Angeles APC ................................................................. 10-37
Figure 11-1. Deep Seated Slide ............................................................................................................................ 11-1 Figure 11-2. Shallow Colluvial Slide ................................................................................................................... 11-1 Figure 11-3. Bench Slide ...................................................................................................................................... 11-2 Figure 11-4. Large Slide ....................................................................................................................................... 11-2 Figure 11-5. Typical Debris Avalanche Scar and Track ...................................................................................... 11-3
City of Los Angeles 2018 Local Hazard Mitigation Plan Contents
xx
Figure 11-6. Landslide Hazard Areas in the Central APC ................................................................................... 11-7 Figure 11-7. Landslide Hazard Areas in the East Los Angeles APC ................................................................... 11-8 Figure 11-8. Landslide Hazard Areas in the Harbor APC .................................................................................... 11-9 Figure 11-9. Landslide Hazard Areas in the North Valley APC ........................................................................ 11-10 Figure 11-10. Landslide Hazard Areas in the South Los Angeles APC ............................................................. 11-11 Figure 11-11. Landslide Hazard Areas in the South Valley APC ...................................................................... 11-12 Figure 11-12. Landslide Hazard Areas in the West Los Angeles APC .............................................................. 11-13
Figure 12-1. Mapped Tsunami Inundation Area in the Harbor APC ................................................................... 12-4 Figure 12-2. Mapped Tsunami Inundation Area in the West Los Angeles APC ................................................. 12-5 Figure 12-3. Potential Tsunami Travel Times in the Pacific Ocean, in Hours ..................................................... 12-7
Figure 13-1. Station Fire, October 2009 ............................................................................................................... 13-2 Figure 13-2. Wildfire Severity Zones in the Central APC ................................................................................... 13-4 Figure 13-3. Wildfire Severity Zones in the East Los Angeles APC ................................................................... 13-5 Figure 13-4. Wildfire Severity Zones in the Harbor APC .................................................................................... 13-6 Figure 13-5. Wildfire Severity Zones in the North Valley APC .......................................................................... 13-7 Figure 13-6. Wildfire Severity Zones in the South Los Angeles APC ................................................................. 13-8 Figure 13-7. Wildfire Severity Zones in the South Valley APC .......................................................................... 13-9 Figure 13-8. Wildfire Severity Zones in the West Los Angeles APC ................................................................ 13-10
Figure 14-1. Global Carbon Dioxide Concentrations Over Time ........................................................................ 14-2 Figure 14-2. Observed and Projected Average Temperatures for City of Los Angeles ....................................... 14-5 Figure 14-3. Projected Number of Extreme Heat Days by Year for City of Los Angeles ................................... 14-5 Figure 14-4. Projected Changes in Fire Risk for City of Los Angeles, Relative to 2010 Levels ......................... 14-6 Figure 14-5. Sea Level Rise; 25-cm with 100-Year Storm Scenario; Harbor APC ........................................... 14-15 Figure 14-6. Sea Level Rise; 25-cm with 100-Year Storm Scenario; West Los Angeles APC ......................... 14-16 Figure 14-7. Sea Level Rise; 150-cm with 100-Year Storm Scenario; Harbor APC ......................................... 14-17 Figure 14-8. Sea Level Rise; 150-cm with 100-Year Storm Scenario; West Los Angeles APC ....................... 14-18
Figure 16-1. Pop-Up Message Indicating Ransomware Infection........................................................................ 16-2 Figure 16-2. NOAA Space Weather Scales.......................................................................................................... 16-5
Figure 17-1. City of Los Angeles Traffic Accident Fatalities and Severe Injuries, 2003-2015 ........................... 17-5 Figure 17-2. Transportation Infrastructure in the City of Los Angeles ................................................................ 17-7

City of Los Angeles 2018 Local Hazard Mitigation Plan Acknowledgments
xxi
ACKNOWLEDGMENTS
City of Los Angeles
• Carol Parks, Special Projects Officer, Emergency Management Department • Faye Cousin, Emergency Management Coordinator I/Special Projects • Amrita Spencer, Administrative Intern I. • Erricka Peden, Secretary
Consultants
• Rob Flaner, CFM, Tetra Tech, Inc., Project Manager • Denise Davis, Tetra Tech, Inc., Planner • Jessica Cerutti, CFM, Tetra Tech, Inc., Project Planner • Carol Bauman, GISP, Tetra Tech, Inc., Risk Assessment Lead • Stephen Veith, MUP, Tetra Tech, Inc., GIS/Hazus Analyst • Kari Valentine, CFM, Tetra Tech, Inc., Planner • Dan Portman, Tetra Tech, Inc., Technical Editor
Stakeholders
• Hassan Baroon, Geosciences and Environment, California State University, Los Angeles • Eric Boldt, National Oceanic and Atmospheric Administration National Weather Service • Roy Forbes, Neighborhood Council District 4 • Ken Hudnut, United States Geological Survey • Steve LaDochy, Geosciences and Environment, California State University, Los Angeles • Alyssa Newton-Mann, USC Sea Grant • Nick Sadrpour, USC Sea Grant • Clint Simmons, West Adams Neighborhood Council • Dr. Lin Wu, Department of Geography and Anthropology, California State Polytechnic University,
Pomona
Special Acknowledgments
Development of this plan would not have been possible without the commitment of the City of Los Angeles Hazard Mitigation Plan Steering Committee. The dedication of this committee’s volunteer members to allocate their time to developing the plan is greatly appreciated. Also, residents of Los Angeles are commended for their participation in the outreach strategy identified by the Steering Committee. This outreach success will set the course to successful implementation of this plan during its next performance period.

xxii
EXECUTIVE SUMMARY
HAZARD MITIGATION OVERVIEW Hazard mitigation is the use of long-term and short-term policies, programs, projects, and other activities to alleviate the death, injury, and property damage that can result from a disaster. The City of Los Angeles has developed a hazard mitigation plan to reduce risks from disasters to the people, property, economy and environment within the city. The plan complies with federal and state hazard mitigation planning requirements to establish eligibility for funding under Federal Emergency Management Agency (FEMA) grant programs.
UPDATING THE CITY OF LOS ANGELES PLAN The City of Los Angeles 2018 Local Hazard Mitigation Plan is the second comprehensive update to the City’s hazard mitigation plan, meeting federal requirements for regular review and update of hazard mitigation plans. The City of Los Angeles prepared its initial local hazard mitigation plan in 2004, and FEMA approved that plan in 2005. A revision was developed in 2010 and approved in July 2011. The 2018 update includes a number of significant changes and enhancements:
• A reorganization and repackaging of the plan to be more user-friendly and conducive to updates • An enhanced risk assessment • A new risk ranking methodology • Updated mission, goals and objectives • Updated and enhanced public outreach • A revised mitigation action plan prioritization protocol • An enhanced definition of critical facilities and infrastructure.
This planning effort was supplemented by a FEMA Hazard Mitigation Assistance grant that covered 75 percent of the cost for development of this plan, with the balance achieved through in-kind contributions. The City of Los Angeles Emergency Management Department managed the project.
PLAN DEVELOPMENT APPROACH A core planning team was assembled to facilitate the update of this plan, consisting of City of Los Angeles Emergency Management Department staff and a contract consultant. A 27-member steering committee was assembled to oversee the plan update, consisting of both governmental and non-governmental stakeholders within the planning area, which was defined as the incorporated area of the City of Los Angeles. Coordination with other local, state, and federal agencies involved in hazard mitigation occurred throughout the plan update process. The planning team and Steering Committee reviewed the existing hazard mitigation plan, the California statewide hazard mitigation plan, and existing programs that may support hazard mitigation actions.
The planning team implemented a multi-media public involvement strategy that was approved by the Steering Committee. The strategy included participation at popular community events to make the public aware of the
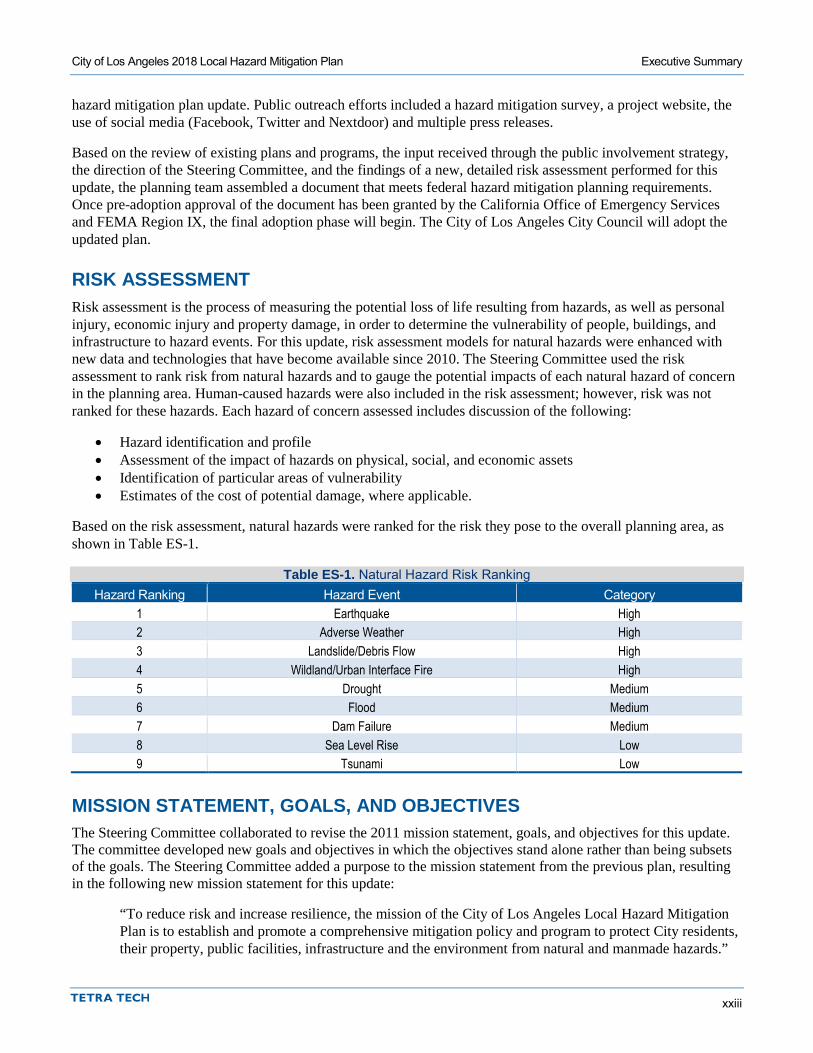
City of Los Angeles 2018 Local Hazard Mitigation Plan Executive Summary
xxiii
hazard mitigation plan update. Public outreach efforts included a hazard mitigation survey, a project website, the use of social media (Facebook, Twitter and Nextdoor) and multiple press releases.
Based on the review of existing plans and programs, the input received through the public involvement strategy, the direction of the Steering Committee, and the findings of a new, detailed risk assessment performed for this update, the planning team assembled a document that meets federal hazard mitigation planning requirements. Once pre-adoption approval of the document has been granted by the California Office of Emergency Services and FEMA Region IX, the final adoption phase will begin. The City of Los Angeles City Council will adopt the updated plan.
RISK ASSESSMENT Risk assessment is the process of measuring the potential loss of life resulting from hazards, as well as personal injury, economic injury and property damage, in order to determine the vulnerability of people, buildings, and infrastructure to hazard events. For this update, risk assessment models for natural hazards were enhanced with new data and technologies that have become available since 2010. The Steering Committee used the risk assessment to rank risk from natural hazards and to gauge the potential impacts of each natural hazard of concern in the planning area. Human-caused hazards were also included in the risk assessment; however, risk was not ranked for these hazards. Each hazard of concern assessed includes discussion of the following:
• Hazard identification and profile • Assessment of the impact of hazards on physical, social, and economic assets • Identification of particular areas of vulnerability • Estimates of the cost of potential damage, where applicable.
Based on the risk assessment, natural hazards were ranked for the risk they pose to the overall planning area, as shown in Table ES-1.
Table ES-1. Natural Hazard Risk Ranking Hazard Ranking Hazard Event Category
1 Earthquake High 2 Adverse Weather High 3 Landslide/Debris Flow High 4 Wildland/Urban Interface Fire High 5 Drought Medium 6 Flood Medium 7 Dam Failure Medium 8 Sea Level Rise Low 9 Tsunami Low
MISSION STATEMENT, GOALS, AND OBJECTIVES The Steering Committee collaborated to revise the 2011 mission statement, goals, and objectives for this update. The committee developed new goals and objectives in which the objectives stand alone rather than being subsets of the goals. The Steering Committee added a purpose to the mission statement from the previous plan, resulting in the following new mission statement for this update:
“To reduce risk and increase resilience, the mission of the City of Los Angeles Local Hazard Mitigation Plan is to establish and promote a comprehensive mitigation policy and program to protect City residents, their property, public facilities, infrastructure and the environment from natural and manmade hazards.”
City of Los Angeles 2018 Local Hazard Mitigation Plan Executive Summary
xxiv
Of five goals in the 2011 hazard mitigation plan, two were unchanged for this update and three were modified; one new goal was added, resulting in the following set of goals:
1. Protect life, property, and cultural resources. 2. Increase public awareness. 3. Coordinate with other programs that can support or enhance hazard mitigation. 4. Increase emergency services effectiveness. 5. Pursue cost-effective and environmentally sound mitigation measures. 6. Strive to increase adaptive capacity to reduce risk from hazard impacts based on future conditions.
Individual Steering Committee members identified 50 plan objectives, of which the following 16 were selected by 50 percent or more of the participants:
1. Reduce repetitive property losses due to flood, fire and earthquake by updating land use, design, and construction policies.
2. Identify natural and manmade hazards that threaten life and property in the City. 3. Use hazard data while reviewing proposed development opportunities. 4. Encourage the incorporation of mitigation measures into repairs, major alterations, new development, and
redevelopment practices, especially in areas subject to substantial hazard risk. 5. Encourage and support leadership within the private sector, non-profit agencies and community-based
organizations to promote and implement local hazard mitigation activities. 6. Incorporate risk reduction considerations in new and updated infrastructure and development plans to
reduce the impacts of hazards. 7. Continue providing City emergency services with training and equipment to address all identified
hazards. 8. Develop and provide updated information about threats, hazards, vulnerabilities, and mitigation strategies
to state, regional, and local agencies, as well as private sector groups. 9. Establish and maintain partnerships among all levels of government, private sector, community groups,
and institutions of higher learning that improve and implement methods to protect life and property. 10. Create financial and regulatory incentives to motivate stakeholders such as homeowners, private sector
businesses, and nonprofit community organizations to mitigate hazards and risk. 11. Continue developing and strengthening inter-jurisdictional coordination and cooperation in the area of
emergency services. 12. Support the protection of vital records, and strengthening or replacement of buildings, infrastructure, and
lifelines to minimize post-disaster disruption and facilitate short-term and long-term recovery. 13. Coordinate state and local efforts to reduce greenhouse gas emissions and implement climate adaptation
strategies through hazard mitigation plans and actions. 14. Implement mitigation programs and projects that protect not only life and property, but the environment
as well. 15. Promote and implement hazard mitigation plans and projects that are consistent with state, regional and
local climate action and adaptation goals, policies, and programs. 16. Advance community resilience through preparation, adoption, and implementation of state, regional and
local multi-hazard mitigation plans and projects.
MITIGATION ACTION PLAN Mitigation actions presented in this update are designed to reduce or eliminate losses resulting from hazard events. The update process resulted in the identification of 113 mitigation actions to be led by 16 departments. The majority of these actions are within the current capabilities of the City of Los Angeles, resulting in high implementation priority over the next five years.
City of Los Angeles 2018 Local Hazard Mitigation Plan Executive Summary
xxv
IMPLEMENTATION AND MAINTENANCE Plan implementation will occur over the next five years as City departments begin to implement the actions identified in this plan. Full implementation of the recommendations of this plan will require time and resources. The measure of the plan’s success will be its ability to adapt to changing conditions. The City of Los Angeles assumes responsibility for adopting the recommendations of this plan and committing resources toward implementation. The framework established by this plan prioritizes actions whose benefits exceed their cost. The planning team and Steering Committee developed this plan with extensive public input, and public support of the actions identified in this plan will help ensure the plan’s success.
The Steering Committee developed a plan maintenance strategy that includes annual progress reporting, a strategy for continued public involvement, a commitment to plan integration with other relevant plans and programs, and continued oversight from a plan maintenance steering committee.

City of Los Angeles 2018 Local Hazard Mitigation Plan
PART 1—PLANNING PROCESS AND COMMUNITY PROFILE

1-1
1. INTRODUCTION TO HAZARD MITIGATION PLANNING
1.1 WHY PREPARE THIS PLAN?
1.1.1 The Big Picture Hazard mitigation is defined as any action taken to reduce or alleviate the loss of life, personal injury, and property damage that can result from a disaster. It involves long- and short-term actions implemented before, during and after disasters. Hazard mitigation activities include planning efforts, policy changes, programs, studies, improvement projects, and other steps to reduce the impacts of hazards.
For many years, federal disaster funding focused on relief and recovery after disasters occurred, with limited funding for hazard mitigation planning in advance. The Disaster Mitigation Act (DMA; Public Law 106-390), passed in 2000, shifted the federal emphasis toward planning for disasters before they occur. The DMA requires state and local governments to develop hazard mitigation plans as a condition for federal disaster grant assistance. Regulations developed to fulfill the DMA’s requirements are included in Title 44 of the Code of Federal Regulations (44 CFR).
The responsibility for hazard mitigation lies with many, including private property owners, commercial interests, and local, state and federal governments. The DMA encourages cooperation among state and local authorities in pre-disaster planning. The enhanced planning network called for by the DMA helps local government articulate accurate needs for mitigation, resulting in faster allocation of funding and more cost-effective risk-reduction projects.
The DMA also promotes sustainability in hazard mitigation. To be sustainable, hazard mitigation needs to incorporate sound management of natural resources and address hazards and mitigation in the largest possible social and economic context.
1.1.2 Purposes for Planning The City of Los Angeles prepared a hazard mitigation plan in compliance with the DMA that was adopted and approved in July 2011 (City of Los Angeles, 2011). This update to the 2011 plan fulfills a DMA requirement that hazard mitigation plans be regularly updated. It identifies resources, information, and strategies for reducing risk from natural hazards. Elements and strategies in the plan were selected because they meet a program requirement and because they best meet the needs of the City of Los Angeles and its residents. The plan will help guide and coordinate mitigation activities throughout the planning area. It was developed to meet the following objectives:
• Meet or exceed program requirements specified under the DMA. • Enable the City of Los Angeles to continue using federal grant funding to reduce hazard risk through
mitigation. • Meet the needs of the City of Los Angeles as well as state and federal requirements. • Create a risk assessment that focuses on City of Los Angeles hazards of concern. • Meet the planning requirements of the Federal Emergency Management Agency’s (FEMA’s) Community
Rating System (CRS), allowing the City of Los Angeles to maintain or enhance its CRS classification.

City of Los Angeles 2018 Local Hazard Mitigation Plan Introduction to Hazard Mitigation Planning
1-2
• Coordinate existing plans and programs so that high-priority projects to mitigate possible disaster impacts are funded and implemented.
1.2 WHO WILL BENEFIT FROM THIS PLAN? All residents and businesses of the City of Los Angeles are the ultimate beneficiaries of this hazard mitigation plan. The plan reduces risk for those who live in, work in, and visit the City of Los Angeles. It provides a viable planning framework for all foreseeable natural hazards. Participation in development of the plan by key stakeholders helped ensure that outcomes will be mutually beneficial. The plan’s goals and recommendations can lay groundwork for the development and implementation of local mitigation activities and partnerships.
1.3 CONTENTS OF THIS PLAN This hazard mitigation plan is organized into three primary parts:
• Part 1—Planning Process and Community Profile • Part 2—Risk Assessment • Part 3—Mitigation Strategy.
Each part includes elements required under federal guidelines. DMA compliance requirements are cited at the beginning of subsections as appropriate to illustrate compliance.
The following appendices provided at the end of the plan include information or explanations to support the main content of the plan:
• Appendix A—Public outreach information used in preparation of this update • Appendix B—Descriptions of the sources and methods used to generate hazard maps for this plan • Appendix C—Review of mitigation actions recommended in the City’s previous hazard mitigation plan • Appendix D— Template for progress reports to be completed as this plan is implemented
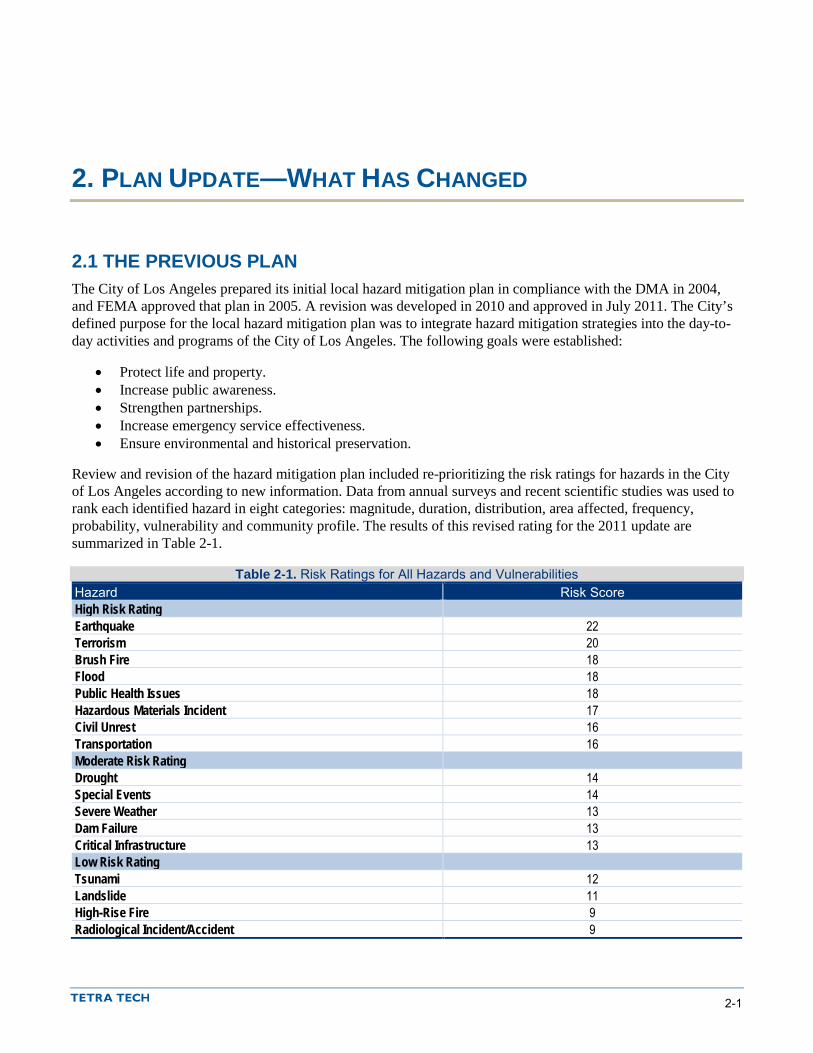
2-1
2. PLAN UPDATE—WHAT HAS CHANGED
2.1 THE PREVIOUS PLAN The City of Los Angeles prepared its initial local hazard mitigation plan in compliance with the DMA in 2004, and FEMA approved that plan in 2005. A revision was developed in 2010 and approved in July 2011. The City’s defined purpose for the local hazard mitigation plan was to integrate hazard mitigation strategies into the day-to-day activities and programs of the City of Los Angeles. The following goals were established:
• Protect life and property. • Increase public awareness. • Strengthen partnerships. • Increase emergency service effectiveness. • Ensure environmental and historical preservation.
Review and revision of the hazard mitigation plan included re-prioritizing the risk ratings for hazards in the City of Los Angeles according to new information. Data from annual surveys and recent scientific studies was used to rank each identified hazard in eight categories: magnitude, duration, distribution, area affected, frequency, probability, vulnerability and community profile. The results of this revised rating for the 2011 update are summarized in Table 2-1.
Table 2-1. Risk Ratings for All Hazards and Vulnerabilities Hazard Risk Score High Risk Rating Earthquake 22 Terrorism 20 Brush Fire 18 Flood 18 Public Health Issues 18 Hazardous Materials Incident 17 Civil Unrest 16 Transportation 16 Moderate Risk Rating Drought 14 Special Events 14 Severe Weather 13 Dam Failure 13 Critical Infrastructure 13 Low Risk Rating Tsunami 12 Landslide 11 High-Rise Fire 9 Radiological Incident/Accident 9
City of Los Angeles 2018 Local Hazard Mitigation Plan Plan Update—What Has Changed
2-2
The 2011 plan recommended actions for mitigating the risks these hazards present. City departments and agencies were given specific responsibilities for implementing specific mitigation actions, using a mitigation strategy project worksheet created during the 2010 update process.
2.2 WHY UPDATE?
2.2.1 Federal Eligibility Title 44 of the Code of Federal Regulations (44 CFR) stipulates that hazard mitigation plans must present a schedule for being monitored, evaluated and updated. This provides an opportunity to reevaluate recommendations, monitor the impacts of actions that have been accomplished, and determine if there is a need to change the focus of mitigation strategies. A jurisdiction covered by a plan that has expired is not able to pursue federal funding for which a current hazard mitigation plan is a prerequisite.
2.2.2 Changes in Development Hazard mitigation plan updates must reflect development changes in the planning area since approval of the previous plan (44 CFR Section 201.6(d)(3)). The update must describe development changes in hazard-prone areas that increased or decreased vulnerability. If no development changes impacted the jurisdiction’s overall vulnerability, plan updates may validate the information in the previously approved plan. This requirement ensures that the mitigation strategy continues to address the risk and vulnerability of existing and potential development and takes into consideration possible future conditions that could impact vulnerability.
The City of Los Angeles planning area experienced a 6.28-percent increase in population between 2010 and 2016, an average annual growth rate of 0.90 percent per year. The City has adopted a general plan that governs land-use decisions and policy-making, as well as a building code and specialty ordinances based on state and federal mandates. This hazard mitigation plan update assumes that some new development triggered by the increase in population occurred in hazard areas. All such new development would have been regulated pursuant to local programs and codes. Therefore, it is assumed that hazard vulnerability did not measurably increase even if exposure did. Any new development would have accounted for potential hazard impacts under codes and standards such as the International Building Code and flood damage prevention requirements of the National Flood Insurance Program (NFIP).
2.3 THE UPDATED PLAN—WHAT IS DIFFERENT? The updated 2018 plan differs from the initial plan in a variety of ways:
• It is reorganized into three parts:
Planning process and community profile Risk assessment Hazard mitigation strategy.
• The risk assessment has been enhanced. • The following new hazards were added to the risk assessment:
Critical infrastructure High-rise/high-occupancy building fire Special events Cyber-attack Space weather

City of Los Angeles 2018 Local Hazard Mitigation Plan Plan Update—What Has Changed
2-3
Hazardous material, transportation and radiological incidents Public health hazards Terrorism and weapons of mass destruction Civil unrest.
• The impacts of climate change on the natural hazards of concern were profiled • A new risk ranking methodology was used. • The plan mission statement, goals and objectives were refined. • An enhanced public outreach effort was conducted. • A revised mitigation action plan prioritization protocol was used. • The definition of critical facilities and infrastructure was enhanced.
Table 2-2 indicates the major changes between the two plans as they relate to 44 CFR planning requirements.
Table 2-2. Plan Changes Crosswalk 44 CFR Requirement Previous Plan Updated Plan §201.6(b): In order to develop a more comprehensive approach to reducing the effects of natural disasters, the planning process shall include: (1) An opportunity for the public to comment on the plan during the drafting stage and prior to plan approval; (2) An opportunity for neighboring communities, local and regional agencies involved in hazard mitigation activities, and agencies that have the authority to regulate development, as well as businesses, academia and other private and non-profit interests to be involved in the planning process; and (3) Review and incorporation, if appropriate, of existing plans, studies, reports, and technical information.
The 2011 plan update was facilitated through a Local Hazard Mitigation Plan advisory task force made up of representatives from City departments, outside government agencies, special districts within the City limits, educational institutions, private and non-profit business organizations, and community-based organizations. Seventeen neighboring jurisdictions, educational institutions, government agencies, social service and business groups were invited to participate in the initial planning process. All but three invited organizations played active roles in the plan development. Involvement included: • Membership on and participation in Task Force
meetings • Provision of technical information • Expert advice and consultation • Assistance in outreach activities • Review of plan components during development. The 2011 plan includes no reference to a formal public engagement strategy for public access to the plan update process.
The plan development process for this update followed the Community Rating System (CRS) 10-step planning process, which features the facilitation of a planning process through an organized steering committee. The process included a robust commitment to public engagement through all phases using multiple media. Chapter 3 of this plan describes the planning process.
§201.6(c)(2): The plan shall include a risk assessment that provides the factual basis for activities proposed in the strategy to reduce losses from identified hazards. Local risk assessments must provide sufficient information to enable the jurisdiction to identify and prioritize appropriate mitigation actions to reduce losses from identified hazards.
The 2011 plan includes a risk assessment of 17 natural and non-natural hazards of concern. These are primarily qualitative risk assessments, except for quantitative modeling for the earthquake hazard using Hazus.
Significant enhancements were made to the risk assessment for the 2018 update. Over 20 hazards of concern were grouped into 14 categories covering both that natural and non-natural hazard spectrum. The risk assessment includes multiple-scenario modeling for dam failure, earthquake, flood and sea-level rise. Hazard profiles are standardized for each hazard of concern, so that there is uniformity in the discussion of each hazard and the information provided can support ranking of risk for each jurisdiction.
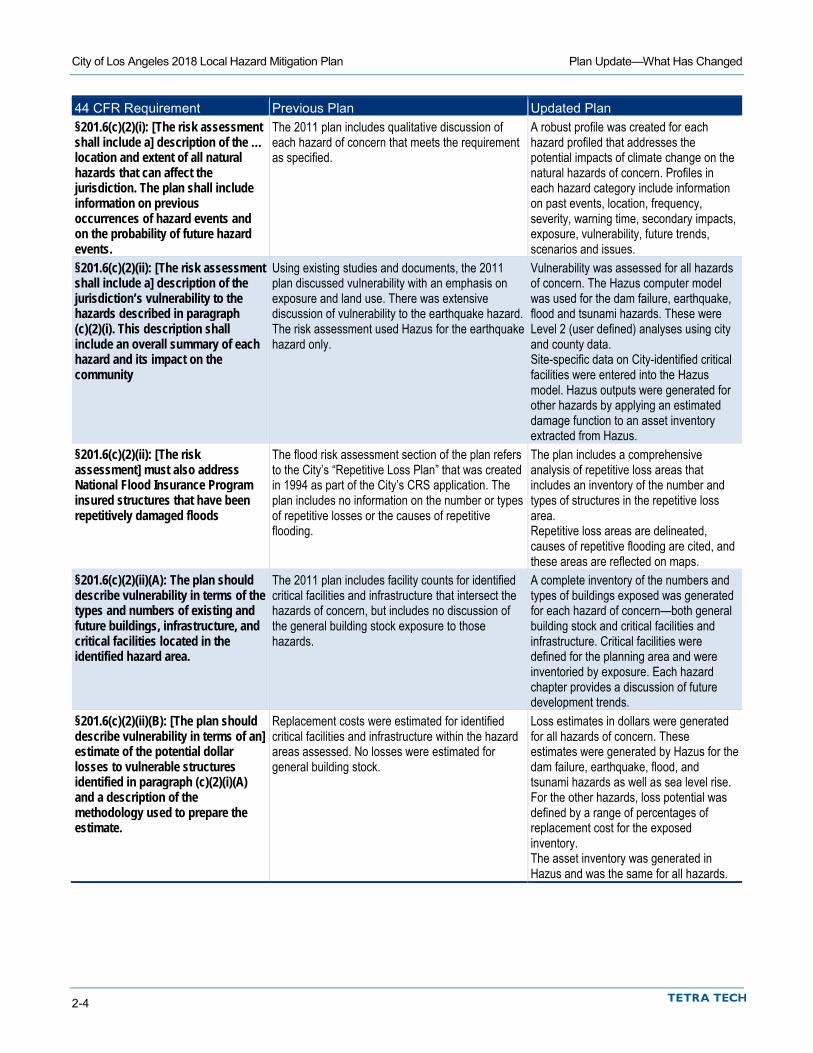
City of Los Angeles 2018 Local Hazard Mitigation Plan Plan Update—What Has Changed
2-4
44 CFR Requirement Previous Plan Updated Plan §201.6(c)(2)(i): [The risk assessment shall include a] description of the … location and extent of all natural hazards that can affect the jurisdiction. The plan shall include information on previous occurrences of hazard events and on the probability of future hazard events.
The 2011 plan includes qualitative discussion of each hazard of concern that meets the requirement as specified.
A robust profile was created for each hazard profiled that addresses the potential impacts of climate change on the natural hazards of concern. Profiles in each hazard category include information on past events, location, frequency, severity, warning time, secondary impacts, exposure, vulnerability, future trends, scenarios and issues.
§201.6(c)(2)(ii): [The risk assessment shall include a] description of the jurisdiction’s vulnerability to the hazards described in paragraph (c)(2)(i). This description shall include an overall summary of each hazard and its impact on the community
Using existing studies and documents, the 2011 plan discussed vulnerability with an emphasis on exposure and land use. There was extensive discussion of vulnerability to the earthquake hazard. The risk assessment used Hazus for the earthquake hazard only.
Vulnerability was assessed for all hazards of concern. The Hazus computer model was used for the dam failure, earthquake, flood and tsunami hazards. These were Level 2 (user defined) analyses using city and county data. Site-specific data on City-identified critical facilities were entered into the Hazus model. Hazus outputs were generated for other hazards by applying an estimated damage function to an asset inventory extracted from Hazus.
§201.6(c)(2)(ii): [The risk assessment] must also address National Flood Insurance Program insured structures that have been repetitively damaged floods
The flood risk assessment section of the plan refers to the City’s “Repetitive Loss Plan” that was created in 1994 as part of the City’s CRS application. The plan includes no information on the number or types of repetitive losses or the causes of repetitive flooding.
The plan includes a comprehensive analysis of repetitive loss areas that includes an inventory of the number and types of structures in the repetitive loss area. Repetitive loss areas are delineated, causes of repetitive flooding are cited, and these areas are reflected on maps.
§201.6(c)(2)(ii)(A): The plan should describe vulnerability in terms of the types and numbers of existing and future buildings, infrastructure, and critical facilities located in the identified hazard area.
The 2011 plan includes facility counts for identified critical facilities and infrastructure that intersect the hazards of concern, but includes no discussion of the general building stock exposure to those hazards.
A complete inventory of the numbers and types of buildings exposed was generated for each hazard of concern—both general building stock and critical facilities and infrastructure. Critical facilities were defined for the planning area and were inventoried by exposure. Each hazard chapter provides a discussion of future development trends.
§201.6(c)(2)(ii)(B): [The plan should describe vulnerability in terms of an] estimate of the potential dollar losses to vulnerable structures identified in paragraph (c)(2)(i)(A) and a description of the methodology used to prepare the estimate.
Replacement costs were estimated for identified critical facilities and infrastructure within the hazard areas assessed. No losses were estimated for general building stock.
Loss estimates in dollars were generated for all hazards of concern. These estimates were generated by Hazus for the dam failure, earthquake, flood, and tsunami hazards as well as sea level rise. For the other hazards, loss potential was defined by a range of percentages of replacement cost for the exposed inventory. The asset inventory was generated in Hazus and was the same for all hazards.
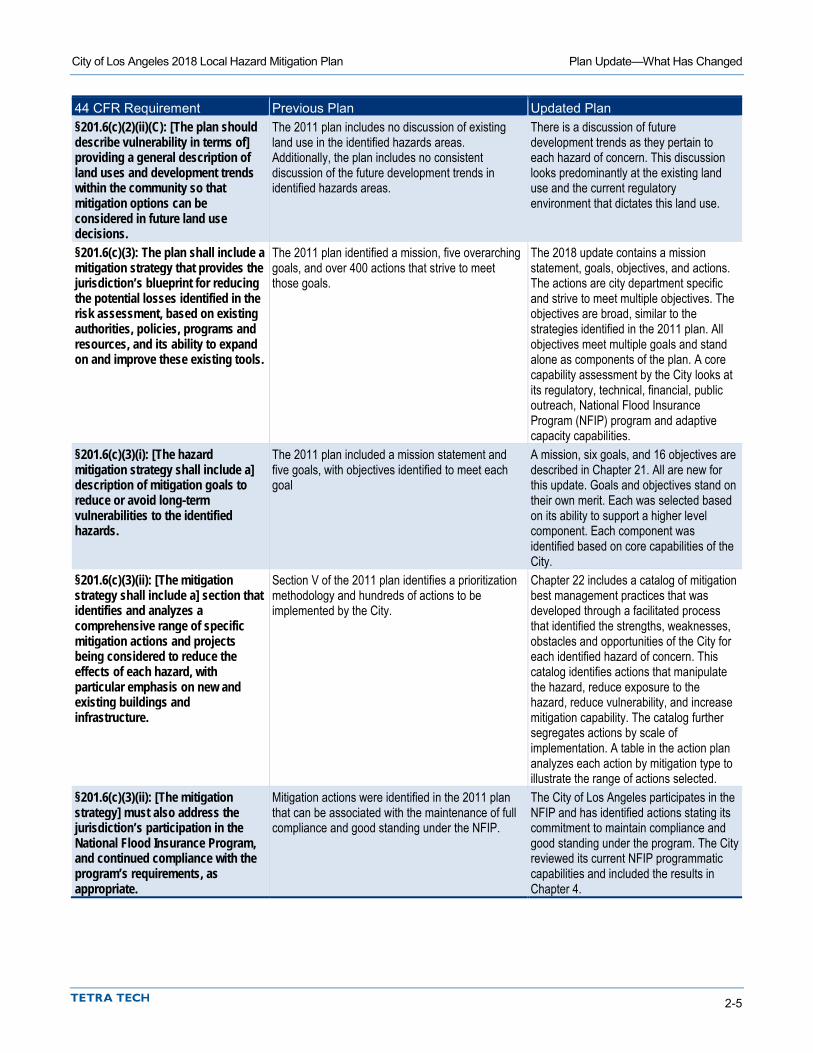
City of Los Angeles 2018 Local Hazard Mitigation Plan Plan Update—What Has Changed
2-5
44 CFR Requirement Previous Plan Updated Plan §201.6(c)(2)(ii)(C): [The plan should describe vulnerability in terms of] providing a general description of land uses and development trends within the community so that mitigation options can be considered in future land use decisions.
The 2011 plan includes no discussion of existing land use in the identified hazards areas. Additionally, the plan includes no consistent discussion of the future development trends in identified hazards areas.
There is a discussion of future development trends as they pertain to each hazard of concern. This discussion looks predominantly at the existing land use and the current regulatory environment that dictates this land use.
§201.6(c)(3): The plan shall include a mitigation strategy that provides the jurisdiction’s blueprint for reducing the potential losses identified in the risk assessment, based on existing authorities, policies, programs and resources, and its ability to expand on and improve these existing tools.
The 2011 plan identified a mission, five overarching goals, and over 400 actions that strive to meet those goals.
The 2018 update contains a mission statement, goals, objectives, and actions. The actions are city department specific and strive to meet multiple objectives. The objectives are broad, similar to the strategies identified in the 2011 plan. All objectives meet multiple goals and stand alone as components of the plan. A core capability assessment by the City looks at its regulatory, technical, financial, public outreach, National Flood Insurance Program (NFIP) program and adaptive capacity capabilities.
§201.6(c)(3)(i): [The hazard mitigation strategy shall include a] description of mitigation goals to reduce or avoid long-term vulnerabilities to the identified hazards.
The 2011 plan included a mission statement and five goals, with objectives identified to meet each goal
A mission, six goals, and 16 objectives are described in Chapter 21. All are new for this update. Goals and objectives stand on their own merit. Each was selected based on its ability to support a higher level component. Each component was identified based on core capabilities of the City.
§201.6(c)(3)(ii): [The mitigation strategy shall include a] section that identifies and analyzes a comprehensive range of specific mitigation actions and projects being considered to reduce the effects of each hazard, with particular emphasis on new and existing buildings and infrastructure.
Section V of the 2011 plan identifies a prioritization methodology and hundreds of actions to be implemented by the City.
Chapter 22 includes a catalog of mitigation best management practices that was developed through a facilitated process that identified the strengths, weaknesses, obstacles and opportunities of the City for each identified hazard of concern. This catalog identifies actions that manipulate the hazard, reduce exposure to the hazard, reduce vulnerability, and increase mitigation capability. The catalog further segregates actions by scale of implementation. A table in the action plan analyzes each action by mitigation type to illustrate the range of actions selected.
§201.6(c)(3)(ii): [The mitigation strategy] must also address the jurisdiction’s participation in the National Flood Insurance Program, and continued compliance with the program’s requirements, as appropriate.
Mitigation actions were identified in the 2011 plan that can be associated with the maintenance of full compliance and good standing under the NFIP.
The City of Los Angeles participates in the NFIP and has identified actions stating its commitment to maintain compliance and good standing under the program. The City reviewed its current NFIP programmatic capabilities and included the results in Chapter 4.
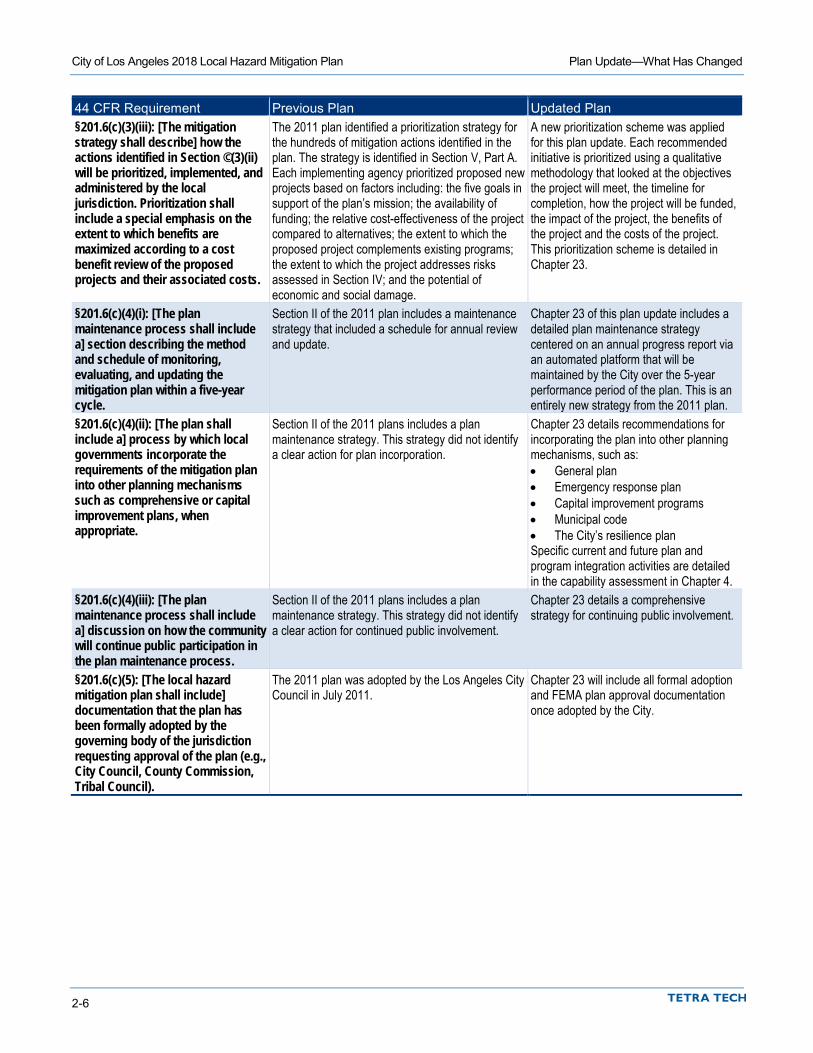
City of Los Angeles 2018 Local Hazard Mitigation Plan Plan Update—What Has Changed
2-6
44 CFR Requirement Previous Plan Updated Plan §201.6(c)(3)(iii): [The mitigation strategy shall describe] how the actions identified in Section ©(3)(ii) will be prioritized, implemented, and administered by the local jurisdiction. Prioritization shall include a special emphasis on the extent to which benefits are maximized according to a cost benefit review of the proposed projects and their associated costs.
The 2011 plan identified a prioritization strategy for the hundreds of mitigation actions identified in the plan. The strategy is identified in Section V, Part A. Each implementing agency prioritized proposed new projects based on factors including: the five goals in support of the plan’s mission; the availability of funding; the relative cost-effectiveness of the project compared to alternatives; the extent to which the proposed project complements existing programs; the extent to which the project addresses risks assessed in Section IV; and the potential of economic and social damage.
A new prioritization scheme was applied for this plan update. Each recommended initiative is prioritized using a qualitative methodology that looked at the objectives the project will meet, the timeline for completion, how the project will be funded, the impact of the project, the benefits of the project and the costs of the project. This prioritization scheme is detailed in Chapter 23.
§201.6(c)(4)(i): [The plan maintenance process shall include a] section describing the method and schedule of monitoring, evaluating, and updating the mitigation plan within a five-year cycle.
Section II of the 2011 plan includes a maintenance strategy that included a schedule for annual review and update.
Chapter 23 of this plan update includes a detailed plan maintenance strategy centered on an annual progress report via an automated platform that will be maintained by the City over the 5-year performance period of the plan. This is an entirely new strategy from the 2011 plan.
§201.6(c)(4)(ii): [The plan shall include a] process by which local governments incorporate the requirements of the mitigation plan into other planning mechanisms such as comprehensive or capital improvement plans, when appropriate.
Section II of the 2011 plans includes a plan maintenance strategy. This strategy did not identify a clear action for plan incorporation.
Chapter 23 details recommendations for incorporating the plan into other planning mechanisms, such as: • General plan • Emergency response plan • Capital improvement programs • Municipal code • The City’s resilience plan Specific current and future plan and program integration activities are detailed in the capability assessment in Chapter 4.
§201.6(c)(4)(iii): [The plan maintenance process shall include a] discussion on how the community will continue public participation in the plan maintenance process.
Section II of the 2011 plans includes a plan maintenance strategy. This strategy did not identify a clear action for continued public involvement.
Chapter 23 details a comprehensive strategy for continuing public involvement.
§201.6(c)(5): [The local hazard mitigation plan shall include] documentation that the plan has been formally adopted by the governing body of the jurisdiction requesting approval of the plan (e.g., City Council, County Commission, Tribal Council).
The 2011 plan was adopted by the Los Angeles City Council in July 2011.
Chapter 23 will include all formal adoption and FEMA plan approval documentation once adopted by the City.

3-1
3. PLAN UPDATE APPROACH
The process followed to develop the City of Los Angeles 2018 Local Hazard Mitigation Plan had the following primary objectives:
• Secure grant funding • Form a planning team • Define the planning area • Establish a steering committee • Coordinate with other agencies • Review existing programs • Engage the public.
These objectives are discussed in the following sections.
3.1 GRANT FUNDING This planning effort was supplemented by a FEMA Hazard Mitigation Assistance grant in fiscal year 2014. The City of Los Angeles Emergency Management Department was designated to manage the project. It covered 75 percent of the cost for development of this plan, with the balance achieved through in-kind contributions.
3.2 FORMATION OF THE PLANNING TEAM The City of Los Angeles hired Tetra Tech, Inc. to assist with development and implementation of the plan. The Tetra Tech project manager assumed the role of the lead planner, reporting directly to the City of Los Angeles project manager. A planning team was formed to lead the planning effort, made up of the following members:
• Carol Parks, City of Los Angeles Emergency Management Department • Faye Cousin, City of Los Angeles Emergency Management Department • Amrita Spencer, City of Los Angeles Emergency Management Department • Rob Flaner, Tetra Tech (project manager) • Jessica Cerutti, Tetra Tech (lead project planner) • Denise Davis, Tetra Tech (planner/public outreach discipline lead) • Carol Baumann, Tetra Tech (risk assessment discipline lead)
This planning team coordinated regularly during the course of this project to track plan development milestones and to identify meeting content for a working group established to help with development of the update.
3.3 DEFINING THE PLANNING AREA The planning area consists of the incorporated limits for City of Los Angeles. Relevant planning area characteristics are described in Chapter 4. The defined planning area is shown in Figure 3-1.

§¦605
§¦405
§¦405
§¦10
§¦10
§¦105
§¦710
§¦110
§¦5
§¦5
§¦210
ÄÆÅ1
ÄÆÅ22
ÄÆÅ1
ÄÆÅ1
ÄÆÅ91
ÄÆÅ110
ÄÆÅ170
ÄÆÅ2
ÄÆÅ60
ÄÆÅ134
ÄÆÅ118
£¤101
£¤101
3RD ST
ROSCOE BLVD
VANOWEN ST
6TH STPICO BLVD
VICTORY BLVD
SATICOY ST
FOOTHILL
BLVD
DEVONSHIRE ST
PARTHENIA ST
ADAMS BLVDSUNS ET
BLVD
RINALDI ST
BURBANK BLVD
SHERMAN WAY
FIG
UE
RO
A
STM
AIN
ST
SEPU
LVE
DA
BLV
D
WES
TERN
AVE
BA
LBO
AB
LVD North
Valley APC
SouthValley APC
Central APCEast LosAngeles
APCWestLos Angeles
APC
South LosAngeles APC
Harbor APC
Area Planning Commission(APC) Boundary
Water Bodies & Channels
Major Highways &Transportation Corridors
Map Data Sources: City of Los Angeles,Caltrans, USDA
City of Los Angeles
0 6 123
Miles
/
Planning Area
Sa n t a M o n i c a B a y
Figure 3-1
City of Los Angeles 2017 Local Hazard Mitigation Plan Plan Update Approach
3-2
City of Los Angeles 2018 Local Hazard Mitigation Plan Plan Update Approach
3-3
3.4 THE STEERING COMMITTEE Hazard mitigation planning enhances collaboration and support among diverse parties whose interests can be affected by hazard losses. A steering committee was formed to oversee all phases of the plan. The members of this committee included key City of Los Angeles staff, residents, and other stakeholders from within the planning area. The planning team assembled a list of candidates representing interests within the planning area that could have recommendations for the plan or be impacted by its recommendations. The team confirmed a committee of 27 members at the kickoff meeting. Seven alternate members were also named. Table 3-1 lists the Steering Committee members.
Leadership roles and ground rules were established during the Steering Committee’s initial meeting on January 11, 2017. The Steering Committee agreed to meet twice in the first month of the planning process, and monthly afterward throughout the course of the plan’s development. The planning team facilitated each Steering Committee meeting, which addressed a set of objectives based on the work plan established for the planning process. The Steering Committee met seven times from January through July. Meeting agendas, meeting summaries and sign-in sheets are available for review upon request. All Steering Committee meetings were open to the public, and agendas and meeting summaries were posted to the hazard mitigation plan website.
3.5 COORDINATION WITH OTHER AGENCIES Opportunities for involvement in the planning process must be provided to neighboring communities, local and regional agencies involved in hazard mitigation, agencies with authority to regulate development, businesses, academia, and other private and nonprofit interests (44 CFR, Section 201.6(b)(2)). This task was accomplished by the planning team as follows:
• Steering Committee Involvement—Agency representatives were invited to join the Steering Committee. • Agency Notification—The following agencies were invited to participate in the plan development
process from the beginning and were kept apprised of plan development milestones:
California Office of Emergency Services (Cal OES) California Department of Water Resources (DWR) FEMA Region IX National Oceanic and Atmospheric Administration (NOAA) United States Geological Survey (USGS) University of Southern California, Sea Grant California State University, Pomona California State University, Los Angeles Los Angeles County Office of Emergency Management Residents within Council Districts Community Emergency Response Team (CERT) Neighborhood Council Coalition These agencies received meeting announcements, meeting agendas, and meeting minutes by e-mail throughout the plan development process. Some of these agencies supported the effort by attending meetings or providing feedback on issues.
• Pre-Adoption Review—All the agencies listed above were provided an opportunity to review and comment on this plan during the public comment period, primarily through the hazard mitigation plan website. Each agency was sent an e-mail message informing them that draft portions of the plan were available for review. In addition, the complete draft plan was sent to Cal OES and FEMA for a pre-adoption review to ensure program compliance.
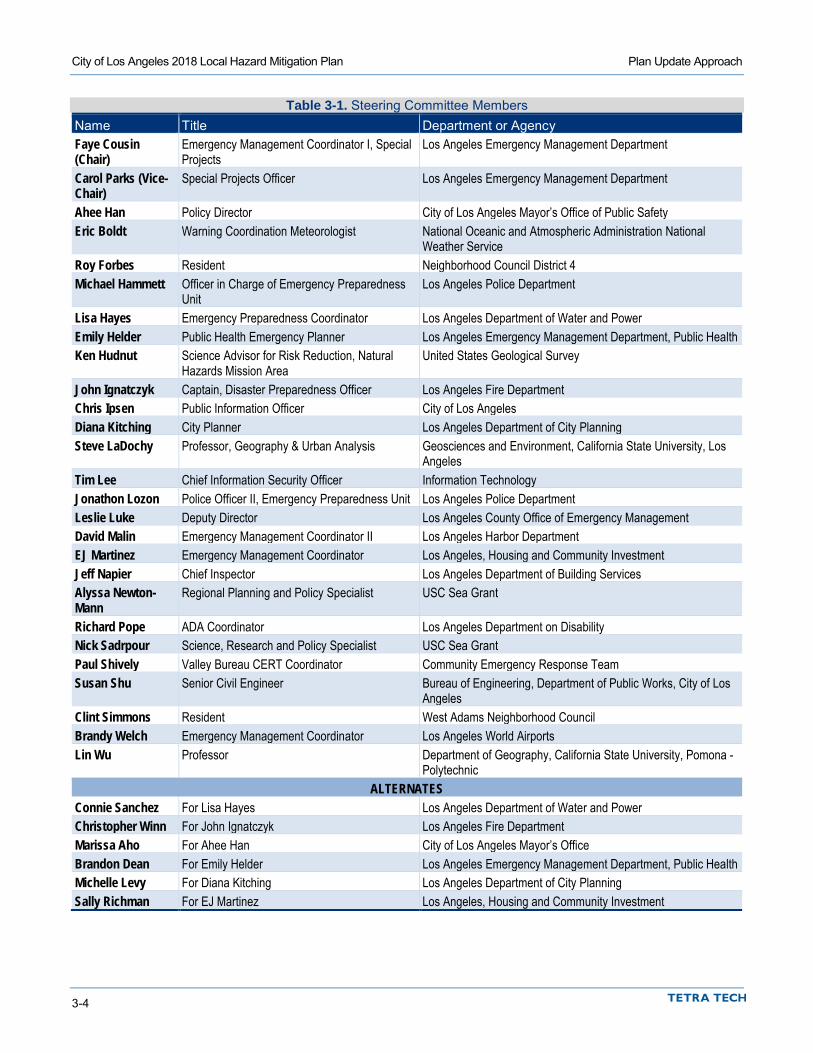
City of Los Angeles 2018 Local Hazard Mitigation Plan Plan Update Approach
3-4
Table 3-1. Steering Committee Members Name Title Department or Agency Faye Cousin (Chair)
Emergency Management Coordinator I, Special Projects
Los Angeles Emergency Management Department
Carol Parks (Vice-Chair)
Special Projects Officer Los Angeles Emergency Management Department
Ahee Han Policy Director City of Los Angeles Mayor’s Office of Public Safety Eric Boldt Warning Coordination Meteorologist National Oceanic and Atmospheric Administration National
Weather Service Roy Forbes Resident Neighborhood Council District 4 Michael Hammett Officer in Charge of Emergency Preparedness
Unit Los Angeles Police Department
Lisa Hayes Emergency Preparedness Coordinator Los Angeles Department of Water and Power Emily Helder Public Health Emergency Planner Los Angeles Emergency Management Department, Public Health Ken Hudnut Science Advisor for Risk Reduction, Natural
Hazards Mission Area United States Geological Survey
John Ignatczyk Captain, Disaster Preparedness Officer Los Angeles Fire Department Chris Ipsen Public Information Officer City of Los Angeles Diana Kitching City Planner Los Angeles Department of City Planning Steve LaDochy Professor, Geography & Urban Analysis Geosciences and Environment, California State University, Los
Angeles Tim Lee Chief Information Security Officer Information Technology Jonathon Lozon Police Officer II, Emergency Preparedness Unit Los Angeles Police Department Leslie Luke Deputy Director Los Angeles County Office of Emergency Management David Malin Emergency Management Coordinator II Los Angeles Harbor Department EJ Martinez Emergency Management Coordinator Los Angeles, Housing and Community Investment Jeff Napier Chief Inspector Los Angeles Department of Building Services Alyssa Newton-Mann
Regional Planning and Policy Specialist USC Sea Grant
Richard Pope ADA Coordinator Los Angeles Department on Disability Nick Sadrpour Science, Research and Policy Specialist USC Sea Grant Paul Shively Valley Bureau CERT Coordinator Community Emergency Response Team Susan Shu Senior Civil Engineer Bureau of Engineering, Department of Public Works, City of Los
Angeles Clint Simmons Resident West Adams Neighborhood Council Brandy Welch Emergency Management Coordinator Los Angeles World Airports Lin Wu Professor Department of Geography, California State University, Pomona -
Polytechnic ALTERNATES
Connie Sanchez For Lisa Hayes Los Angeles Department of Water and Power Christopher Winn For John Ignatczyk Los Angeles Fire Department Marissa Aho For Ahee Han City of Los Angeles Mayor’s Office Brandon Dean For Emily Helder Los Angeles Emergency Management Department, Public Health Michelle Levy For Diana Kitching Los Angeles Department of City Planning Sally Richman For EJ Martinez Los Angeles, Housing and Community Investment
City of Los Angeles 2018 Local Hazard Mitigation Plan Plan Update Approach
3-5
3.6 REVIEW OF EXISTING PROGRAMS Hazard mitigation planning must include review and incorporation, if appropriate, of existing plans, studies, reports and technical information (44 CFR, Section 201.6(b)(3)). Chapter 4 of this plan provides a review of laws and ordinances in effect within the planning area that can affect hazard mitigation actions. In addition, the following programs can affect mitigation within the planning area:
• City of Los Angeles Resilience Plan • Regional Adapt LA: Coastal Impacts Planning for the Los Angeles Region • Sustainable City Plan • Resilience by Design • California Fire Code • 2016 California Building Code • California State Hazard Mitigation Forum • City Capital Improvement Programs • City Emergency Operations Plan • City General Plan • The Framework Element • Housing Element • Safety Element • City Zoning Ordinances • City Coastal Program Policies.
An assessment of all City of Los Angeles regulatory, technical and financial capabilities to implement hazard mitigation actions is presented in Chapter 4.
3.7 PUBLIC INVOLVEMENT Broad public participation in the planning process helps ensure that diverse points of view about the planning area’s needs are considered and addressed. The public must have opportunities to comment on disaster mitigation plans during the drafting stages and prior to plan approval (44 CFR, Section 201.6(b)(1)).
3.7.1 Strategy The strategy for involving the public in this plan emphasized the following elements:
• Include members of the public on the Steering Committee (two residents served on Steering Committee throughout the planning process).
• Use a survey to determine if the public’s perception of risk and support of hazard mitigation has changed since the initial planning process.
• Attempt to reach as many planning area residents as possible through the following activities:
Development of a public outreach plan, approved by the Steering Committee Attendance at advertised public outreach events and meetings with live interaction Development of a hazard mitigation plan webpage on the City Emergency Management Department
website and additional City department websites Use of social media, such as Nextdoor, Instagram, Facebook and Twitter Development and advertisement of a public survey posted on Survey Monkey to collect pertinent
information from residents and the business community.
City of Los Angeles 2018 Local Hazard Mitigation Plan Plan Update Approach
3-6
Stakeholders and the Steering Committee Stakeholders are the individuals, departments, agencies and jurisdictions that have a vested interest in the recommendations of the hazard mitigation plan. The effort to include stakeholders in this process included stakeholder participation on the Steering Committee. The following federal, state, regional, and local stakeholders also played a role in the planning process:
• Federal Agencies—FEMA Region IX provided updated planning guidance, provided summary and detailed data for the City from the National Flood Insurance Program (including repetitive loss information), and conducted a plan review. Representatives from NOAA and the USGS served as subject matter experts and advisors on the Steering Committee.
• State Agencies—Cal OES provided updated planning guidance and reviewed the draft and final versions of the plan update as part of their state hazard mitigation planning process required by the DMA.
• Academia—Representatives from the University of Southern California, California State University, Pomona, and California State University, Los Angeles provided subject matter expertise and data on sea level rise, climate change, earthquake faults and probability. They also served in advisory positions on the Steering Committee.
• Local Stakeholders—Jurisdictions within Los Angeles County were given the opportunity to review the draft version of the plan update and remain informed about the planning process. The following organizations received information about the planning process and invitations to provide input: • Los Angeles County • Alliance of River Communities • City of Los Angeles Neighborhood Councils • Los Angeles Fire Department Community Emergency Response Teams (CERT) • California Coastal Commission • Friends of the Los Angeles River • Los Angeles Area Chamber of Commerce • Water Committee, Sierra Club Angeles Chapter
Survey A hazard mitigation plan survey (see Figure 3-2) was developed by the planning team with guidance from the Steering Committee. The survey was used to gauge preparedness for all hazards and the level of knowledge of tools and techniques that assist in reducing risk and loss from natural hazards. This survey was designed to help identify areas vulnerable to one or more hazards. The answers to its 21 questions helped guide the Steering Committee in determining planning goals, objectives and mitigation strategies. Surveys were distributed at public-outreach events, and a web-based version of the survey was made available on the hazard mitigation plan website. The complete survey and an analysis of its findings can be found in Appendix A.
Public Events The planning team attended public events selected by the Steering Committee to make the public aware of the update to the hazard mitigation plan, and invite residents, business owners, and employees to take the online public survey (see Figure 3-3 through Figure 3-6). Residents who attended the events were asked to complete a survey, and each was given an opportunity to provide comments for the Steering Committee. Local media outlets were informed of the events by City press releases.
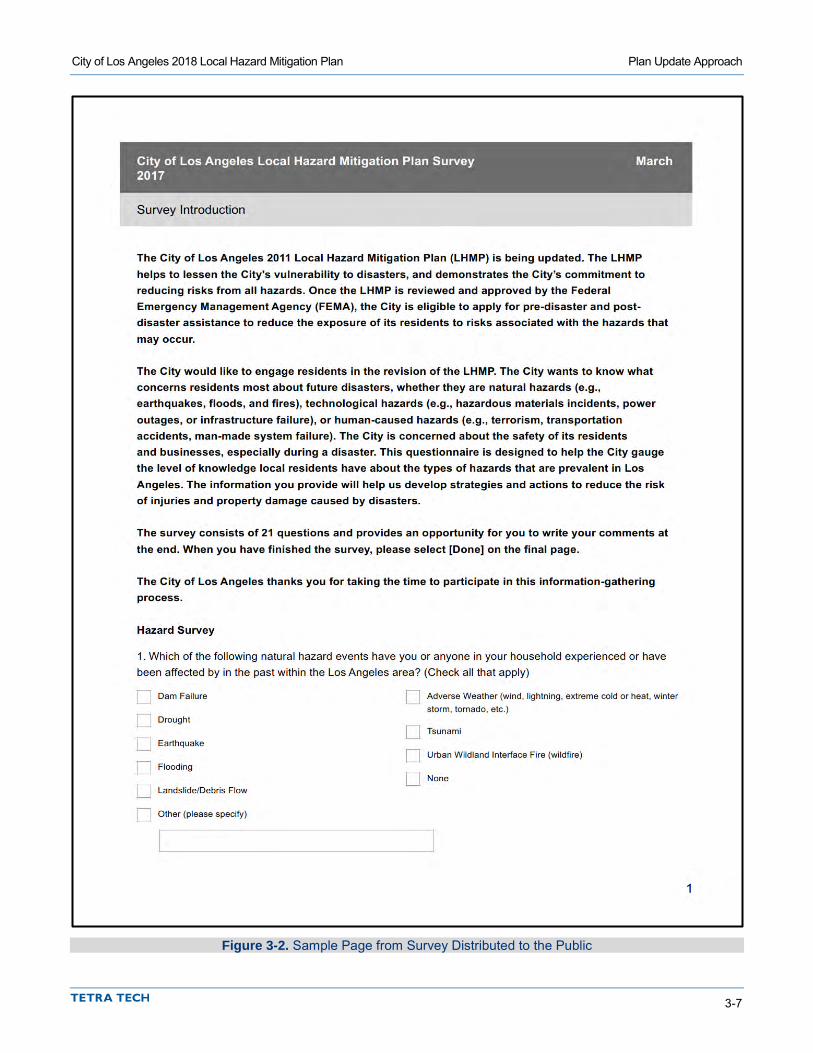
City of Los Angeles 2018 Local Hazard Mitigation Plan Plan Update Approach
3-7
Figure 3-2. Sample Page from Survey Distributed to the Public

City of Los Angeles 2018 Local Hazard Mitigation Plan Plan Update Approach
3-8
Figure 3-3. Abilities Expo Event Figure 3-4. Seismic Retrofit Resource Fair
Figure 3-5. QuakeSmart Preparedness Workshop
for Businesses and Organizations Figure 3-6. QuakeSmart Preparedness Workshop for
Businesses and Organizations
The first event was the Abilities Expo, held at the Los Angeles Convention Center on March 25, 2017. The Abilities Expo was a convention of exhibitors for the community of people with disabilities, their families, seniors, veterans and healthcare professionals. The planning team provided emergency and disaster information and spoke with attendees about the plan update process and the public survey.
The Seismic Retrofit Resource Fair was the second event the planning team attended. This event provided resources, information, and materials for owners of soft-story and concrete non-ductile buildings who must comply with a recent mandatory retrofit ordinance for these types of buildings. This event took place at the Los Angeles Convention Center on April 17, 2017. Approximately 10,000 residents were notified of the event via letter from the City of Los Angeles. The planning team provided information to attendees about the public survey and the plan update process. A Hazus work station was present so that property owners could view and receive information about hazards for their specific property address.

City of Los Angeles 2018 Local Hazard Mitigation Plan Plan Update Approach
3-9
The QuakeSmart Preparedness Workshop for Businesses and Organizations was the third live event the planning team attended. This event was a conference for business owners to identify preparedness and mitigation actions needed for business continuity, disaster response, and the cost benefit of preparing for earthquakes and other business interruptions. This event took place on May 18, 2017 at the Cathedral of Our Lady of the Angels. The planning team provided information to attendees about hazards for their specific business address, and spoke with them about the public survey and plan update process. The Hazus work station allowed residents to see information on their property, including exposure and damage estimates for earthquake and flood hazard events. Participating property and business owners were provided printouts of this information for their properties. This tool was effective in illustrating risk to the public. Planning team members were present to answer questions.
On June 17, 2017 the planning team gave a presentation to the Neighborhood Council Coalition - Sierra Club Angeles Chapter at the City of Los Angeles’ Emergency Operations Center. The meeting allowed attendees to examine maps and handouts and have direct conversations with project staff. Reasons for planning and information generated for the risk assessment were shared with attendees. This meeting was conducted during the advertised public comment period and was an opportunity to provide comment in person on the proposed draft plan.
Hazard Mitigation Plan Website During the planning process, a webpage was created on the City of Los Angeles Emergency Management Department website to introduce the hazard mitigation plan update and keep the public apprised of upcoming outreach events, meeting dates and times, public survey, and plan update process (see Figure 3-7). The website address is: http://emergency.lacity.org/hazard-mitigation-plan.
Figure 3-7. Hazard Mitigation Plan Webpage on the Emergency Management Department Website
The site’s address was publicized at all public meetings and in all social media releases. Information on the plan development process, the Steering Committee, the survey and drafts of the plan were made available to the public on the website throughout the process. The City of Los Angeles intends to keep a website active after the plan’s completion to keep the public informed about successful mitigation projects and future plan updates.

City of Los Angeles 2018 Local Hazard Mitigation Plan Plan Update Approach
3-10
3.7.2 Public Involvement Results The public involvement strategy used for the plan update introduced the concept of mitigation to the public and provided the Steering Committee with feedback to use in developing the plan. All residents of the planning area had opportunities to provide comment during all phases of the plan update process. Attendance and survey distribution at the public meetings are summarized in Table 3-2.
Table 3-2. Summary of Public Meetings
Date Location Number of Public
Contacts Number of Survey Flyers Distributed
March 25, 2017 Abilities Expo, 1201 S Figueroa St, Los Angeles 60 40 April 17, 2017 Seismic Retrofit Fair, 1201 S Figueroa St, Los Angeles 50 30 May 18, 2017 QuakeSmart Conference, 555 West Temple, Los Angeles 35 30 June 17, 2017 Neighborhood Council Coalition, 500 E. Temple Street, Los Angeles 15 15 Total 160 115
Survey Outreach Completed surveys were received from 2,328 respondents. Of these respondents, over 79 percent have experienced an earthquake, 57 percent have been affected by drought, and another 40 percent have been affected by adverse weather. Regarding non-natural hazards, 57 percent of the respondents have experienced civil unrest and 50 percent have experienced critical infrastructure failure. Survey results were shared with the Steering Committee. Detailed survey results are provided in Appendix A. Key results are summarized as follows:
• Survey respondents ranked earthquake as the hazard of highest concern, followed by critical infrastructure failure, terrorism, and drought.
• The majority of respondents believe that the best method to receive emergency preparedness information is from the internet, followed by social media and TV news.
• Over 60 percent of respondents who indicated that they live near an earthquake fault do not have earthquake insurance.
• Over 70 percent of respondents indicated that the presence of a hazard risk zone was not disclosed to them when they purchased their home.
• Over 75 percent of the respondents indicated that disclosure of this type of information would have influenced their decision to purchase or move into a home.
• Most respondents stated that incentives would entice them to spend money to mitigate their property. The two most popular incentives were property tax incentives and insurance premium discounts.
Survey responses included 533 “write in” comments. All of these comments were reviewed by the planning team, though many were determined not to be relevant to the plan or its content.
Public Comments on the Draft Plan A formal, 14 day public comment period was initiated on June 15, 2017. During this comment period, the public was asked to review the proposed draft of the hazard mitigation plan and provide comments to the Planning Team by June 29, 2017. The public comment period was advertised on the hazard mitigation plan website as well as a press release to all media outlets and social media blast through outlets used by the City.
An opportunity to provide public comment in person was provided at the Neighborhood Council Coalition meeting on June 17, 2017 at the Los Angeles Emergency Operations Center on East Temple Street. During this outreach event, members of the public received a handout outlining the basic purpose of the plan and containing a link to view the plan. The handout also included a link to a form to provide comments on the draft plan. The

City of Los Angeles 2018 Local Hazard Mitigation Plan Plan Update Approach
3-11
Planning Team received 10 comments during the public comment period. Those that were deemed relevant to the overall plan by the planning team were incorporated into the final submittal draft of the plan. Most of the comments fell outside the scope of this plan update and were noted by the planning team for consideration under other emergency management programs of the City. Copies of the comments were retained by the planning team and are available upon request.
3.8 PLAN DEVELOPMENT CHRONOLOGY/MILESTONES Table 3-3 summarizes important milestones in the plan update process.
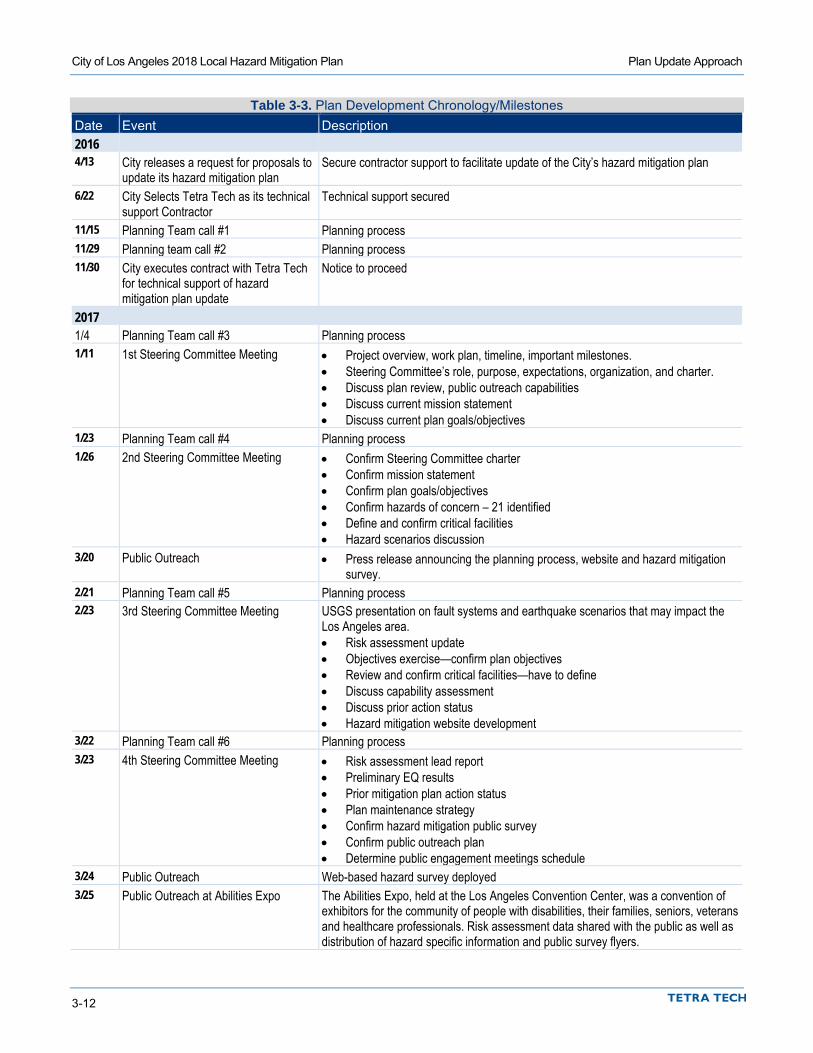
City of Los Angeles 2018 Local Hazard Mitigation Plan Plan Update Approach
3-12
Table 3-3. Plan Development Chronology/Milestones Date Event Description 2016 4/13 City releases a request for proposals to
update its hazard mitigation plan Secure contractor support to facilitate update of the City’s hazard mitigation plan
6/22 City Selects Tetra Tech as its technical support Contractor
Technical support secured
11/15 Planning Team call #1 Planning process 11/29 Planning team call #2 Planning process 11/30 City executes contract with Tetra Tech
for technical support of hazard mitigation plan update
Notice to proceed
2017 1/4 Planning Team call #3 Planning process 1/11 1st Steering Committee Meeting • Project overview, work plan, timeline, important milestones.
• Steering Committee’s role, purpose, expectations, organization, and charter. • Discuss plan review, public outreach capabilities • Discuss current mission statement • Discuss current plan goals/objectives
1/23 Planning Team call #4 Planning process 1/26 2nd Steering Committee Meeting • Confirm Steering Committee charter
• Confirm mission statement • Confirm plan goals/objectives • Confirm hazards of concern – 21 identified • Define and confirm critical facilities • Hazard scenarios discussion
3/20 Public Outreach • Press release announcing the planning process, website and hazard mitigation survey.
2/21 Planning Team call #5 Planning process 2/23 3rd Steering Committee Meeting USGS presentation on fault systems and earthquake scenarios that may impact the
Los Angeles area. • Risk assessment update • Objectives exercise—confirm plan objectives • Review and confirm critical facilities—have to define • Discuss capability assessment • Discuss prior action status • Hazard mitigation website development
3/22 Planning Team call #6 Planning process 3/23 4th Steering Committee Meeting • Risk assessment lead report
• Preliminary EQ results • Prior mitigation plan action status • Plan maintenance strategy • Confirm hazard mitigation public survey • Confirm public outreach plan • Determine public engagement meetings schedule
3/24 Public Outreach Web-based hazard survey deployed 3/25 Public Outreach at Abilities Expo The Abilities Expo, held at the Los Angeles Convention Center, was a convention of
exhibitors for the community of people with disabilities, their families, seniors, veterans and healthcare professionals. Risk assessment data shared with the public as well as distribution of hazard specific information and public survey flyers.
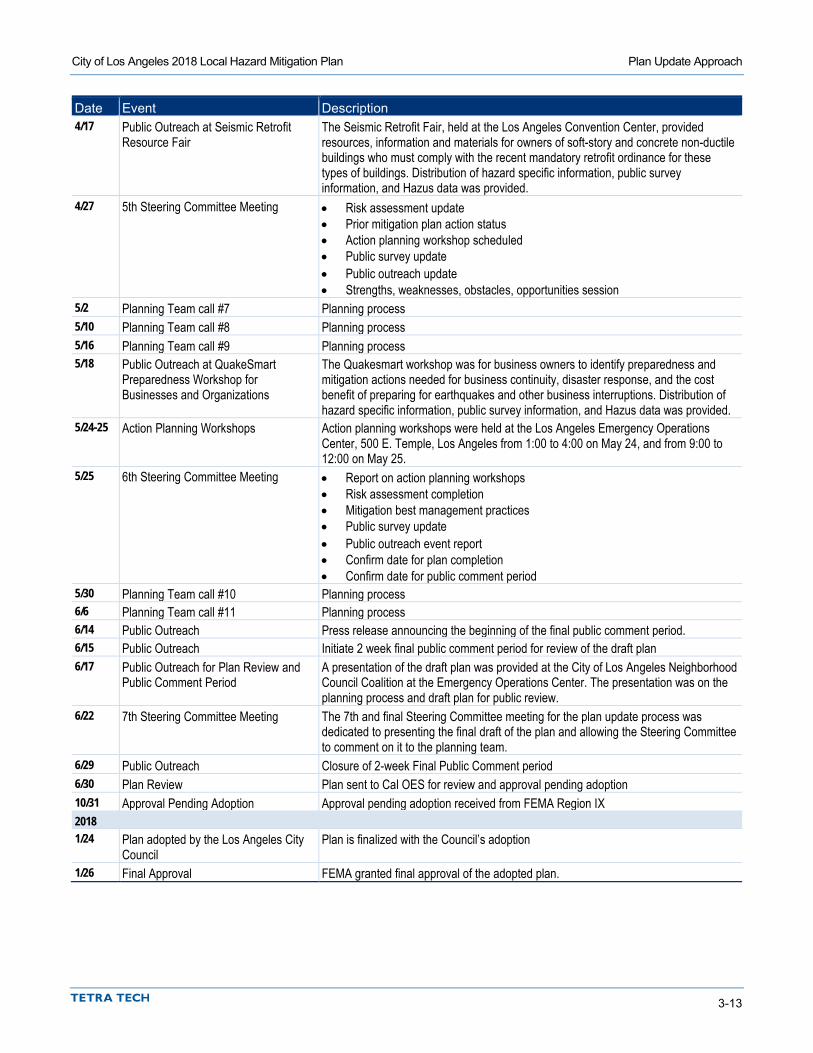
City of Los Angeles 2018 Local Hazard Mitigation Plan Plan Update Approach
3-13
Date Event Description 4/17 Public Outreach at Seismic Retrofit
Resource Fair The Seismic Retrofit Fair, held at the Los Angeles Convention Center, provided resources, information and materials for owners of soft-story and concrete non-ductile buildings who must comply with the recent mandatory retrofit ordinance for these types of buildings. Distribution of hazard specific information, public survey information, and Hazus data was provided.
4/27 5th Steering Committee Meeting • Risk assessment update • Prior mitigation plan action status • Action planning workshop scheduled • Public survey update • Public outreach update • Strengths, weaknesses, obstacles, opportunities session
5/2 Planning Team call #7 Planning process 5/10 Planning Team call #8 Planning process 5/16 Planning Team call #9 Planning process 5/18 Public Outreach at QuakeSmart
Preparedness Workshop for Businesses and Organizations
The Quakesmart workshop was for business owners to identify preparedness and mitigation actions needed for business continuity, disaster response, and the cost benefit of preparing for earthquakes and other business interruptions. Distribution of hazard specific information, public survey information, and Hazus data was provided.
5/24-25 Action Planning Workshops Action planning workshops were held at the Los Angeles Emergency Operations Center, 500 E. Temple, Los Angeles from 1:00 to 4:00 on May 24, and from 9:00 to 12:00 on May 25.
5/25 6th Steering Committee Meeting • Report on action planning workshops • Risk assessment completion • Mitigation best management practices • Public survey update • Public outreach event report • Confirm date for plan completion • Confirm date for public comment period
5/30 Planning Team call #10 Planning process 6/6 Planning Team call #11 Planning process 6/14 Public Outreach Press release announcing the beginning of the final public comment period. 6/15 Public Outreach Initiate 2 week final public comment period for review of the draft plan 6/17 Public Outreach for Plan Review and
Public Comment Period A presentation of the draft plan was provided at the City of Los Angeles Neighborhood Council Coalition at the Emergency Operations Center. The presentation was on the planning process and draft plan for public review.
6/22 7th Steering Committee Meeting The 7th and final Steering Committee meeting for the plan update process was dedicated to presenting the final draft of the plan and allowing the Steering Committee to comment on it to the planning team.
6/29 Public Outreach Closure of 2-week Final Public Comment period 6/30 Plan Review Plan sent to Cal OES for review and approval pending adoption 10/31 Approval Pending Adoption Approval pending adoption received from FEMA Region IX 2018 1/24 Plan adopted by the Los Angeles City
Council Plan is finalized with the Council’s adoption
1/26 Final Approval FEMA granted final approval of the adopted plan.


4-1
4. CITY OF LOS ANGELES PROFILE
4.1 GEOGRAPHIC OVERVIEW The City of Los Angeles, on the southwest coast of California, is the most populous city in the state, with a 2016 estimated population of 4,030,904 (10 percent of the total population of California). As of the 2010 U.S. Census, the City had an average population density of 8,092 people per square mile. It is the county seat of Los Angeles County. Los Angeles is an irregularly shaped city encompassing over 498 square miles of land (214 square miles of which are hills and mountains) and approximately 29 square miles of water (see Figure 3-1), the state’s largest city by area.
4.2 HISTORICAL OVERVIEW Archeological studies have indicated that people have been living in the area that now surrounds Los Angeles since 3000 B.C. By the time of the arrival of the Spanish in the 1700s, an estimated 5,000 native people lived in the Los Angeles area (McCawley, 1996).
The city that is now Los Angeles was founded in September 1781, with the name “El Pueblo de la Reina de Los Angeles” or “The Town of the Queen of the Angels.” By 1800, there were 29 buildings in the community. By 1821, when Mexico became independent of Spain, Los Angeles had grown into the largest self-sustaining farming community in the province of Alta California (Layne, 1935). In 1835, the Mexican Congress declared Los Angeles a city and the capital of Alta California. The City came under the control of the United States in 1848 with the ending of the Mexican American War. Los Angeles was incorporated in the U.S. on April 4, 1850.
The City of Los Angeles mostly remained within its original 28-square-mile area until the 1890s. The first large additions were the districts of Highland Park, Garvanza, and South Los Angeles. In 1906, the approval of the Port of Los Angeles and a change in state law allowed the City to annex “the Shoestring,” or Harbor Gateway, a narrow strip from Los Angeles to the port. San Pedro and Wilmington were added in 1909 and Hollywood was added in 1910. Also added in 1910 were Colegrove, Cahuenga, and a part of Los Feliz. By referendum, 170 square miles of the San Fernando Valley, along with the Palms district, were added to the City in 1915, almost tripling its area. Additional annexations brought the City’s area to 450 square miles by 1932 and to 469 square miles by 2004 (City of Los Angeles, 2015).
The City’s economy began steady growth with completion of the Santa Fe railroad line from Chicago to Los Angeles in 1885 and subsequent immigration from the east (Thompson, 1993). A strong economic base was developed early, in farming, oil, tourism and real estate. Hollywood made the City world famous, and World War II brought new industry, especially high-tech aircraft construction. Since the 1960s old industries have declined, including farming, oil and aircraft, but tourism, entertainment and high tech remain strong.

City of Los Angeles 2018 Local Hazard Mitigation Plan City of Los Angeles Profile
4-2
4.3 MAJOR PAST HAZARD EVENTS Presidential disaster declarations are typically issued for hazard events that cause more damage than state and local governments can handle without assistance from the federal government. A presidential disaster declaration puts federal recovery programs into motion to help disaster victims, businesses and public entities. Some of the programs are matched by state programs. Declarations are made at the county level, and 27 events since 1969 have drawn presidential disaster declarations that applied to Los Angeles County (see Table 4-1). Los Angeles County has also experienced another 26 federal fire management events since 1978. Review of these events helps identify targets for risk reduction and ways to increase a community’s capability to avoid large-scale events in the future.
Table 4-1. Presidential Disaster Declarations Applying to Los Angeles County Type of Event FEMA Disaster # Declaration Date Severe Winter Storms, Flooding, and Mudslides 4305 3/16/2017 Severe Winter Storms, Flooding, and Debris And Mud Flows 1884 3/8/2010 Wildfires 1810 11/18/2008 Wildfires, Flooding, Mud Flows, and Debris Flows 1731 10/24/2007 Severe Freeze 1689 3/13/2007 Severe Storms, Flooding, Landslides, and Mud and Debris Flows 1585 4/14/2005 Severe Storms, Flooding, Debris Flows, and Mudslides 1577 2/4/2005 Wildfires, Flooding, Mud Flow and Debris Flow 1498 10/27/2003 Severe Winter Storms and Flooding 1203 2/9/1998 Severe Winter Storms, Flooding Landslides, Mud Flow 1046 3/12/1995 Severe Winter Storms, Flooding, Landslides, Mud Flows 1044 1/10/1995 Northridge Earthquake 1008 1/17/1994 Fires, Mud/Landslides, Flooding, Soil Erosion 1005 10/28/1993 Severe Winter Storm, Mud and Landslides, and Flooding 979 2/3/1993 Fire During A Period Of Civil Unrest 942 5/2/1992 Rain/Snow/Wind Storms, Flooding, Mudslides 935 2/25/1992 Severe Freeze 894 2/11/1991 Fires 872 6/30/1990 Severe Storms, High Tides and Flooding 812 2/5/1988 Earthquake and Aftershocks 799 10/7/1987 Coastal Storms, Floods, Slides and Tornadoes 677 2/9/1983 Brush and Timber Fires 635 11/27/1980 Severe Storms, Mudslides and Flooding 615 2/21/1980 Coastal Storms, Mudslides and Flooding 547 2/15/1978 San Fernando Earthquake 299 2/9/1971 Forest and Brush Fires 295 9/29/1970 Severe Storms and Flooding 253 1/26/1969
Many natural hazard events do not trigger federal disaster declarations but have significant impacts on their communities. These events are also important to consider in establishing recurrence intervals for hazards of concern.

City of Los Angeles 2018 Local Hazard Mitigation Plan City of Los Angeles Profile
4-3
4.4 PHYSICAL SETTING Much of the City of Los Angeles is built within old floodplains and mountains or adjacent to the Pacific Ocean. The population is concentrated in urban centers, which are interspersed by low-density residential neighborhoods. Most of the flat lands of the City have been developed. The remaining open space tends to be concentrated in floodplains or along steep hillside and drainage water courses, which typically have been designated as public park land, recreational, flood control or low intensity uses, consistent with state law. Vulnerability to fires and flooding has increased as development has encroached into the remaining open space areas. Concentrated development and infrastructure have increased the vulnerability of greater numbers of people, businesses and facilities to seismic, fire and flood events, while at the same time providing greater resources for responding to such events.
4.4.1 Topography The Los Angeles area consists of flat basins defined by the San Gabriel, Santa Susana and Santa Monica Mountains, three major rivers, and the Pacific Ocean (City of Los Angeles Department of City Planning, 2013). The terrain is about 75 percent alluvial plain and 25 percent rugged canyons and hills. Elevations range from 5,074 feet at Sister Elsie Peak in the San Gabriel Mountains to nearly mean sea level in the southwestern part of the City. The San Gabriel and Santa Susana Mountains bound the City on the north and the Santa Monica Mountains extend across the middle of the City. The Palos Verdes Hills and Pacific Ocean bound the City on the south and west (City of Los Angeles, 2010).
4.4.2 Soils and Geology The 1903 soil survey of Los Angeles (Mesmer, 1903) identifies 17 soil types in the area, as summarized in Table 4-2.
Table 4-2. Identified Soil Types in the Los Angeles Area
Soil % of Total
Survey Area Soil % of Total
Survey Area Soil % of Total
Survey Area Placentia sandy loam 18.1 Oxnard loam 5.4 Maricopa gravelly loam 1.6 Fresno sand 15.9 Fresno fine sand 4.4 Galveston clay 1.3 Santiago silt loam 10.8 Maricopa sandy loam 3.8 Dune sand 0.9 Fresno fine sandy loam 10.6 Los Angeles sandy loam 2.5 River wash 0.5 San Joaquin black adobe 10.3 Fullerton sandy adobe 1.9 Peat 0.3 Oxnard sand 9.8 Sierra adobe 1.9 Source: Mesmer, 1903
California is divided into several large “geomorphic provinces” defined by similar topography and geologic structure. The northern portion of the City of Los Angeles is in the Transverse Ranges geomorphic province and the southern portion is in the Peninsular Ranges geomorphic province (California Geological Survey, 2002). The boundary between the two provinces is generally the Santa Monica-Hollywood-Raymond fault system along the south edge of the Santa Monica Mountains (Bilodeau, et al., 2007).
The Transverse Ranges geomorphic province is characterized by east-west trending mountains, valleys, and faults that extend eastward from the Channel Islands to the eastern end of the San Bernardino Mountains. Most active faults in the Transverse Ranges are east-west trending faults. Rock types in this province near the City include gneiss, granitic rocks, and sedimentary rocks (Bilodeau et al., 2007). Volcanic rocks are found in the Santa

City of Los Angeles 2018 Local Hazard Mitigation Plan City of Los Angeles Profile
4-4
Monica Mountains. Alluvial sediments are typically in canyon bottoms and valleys, with broad alluvial fans at the mouths of steep canyons.
The Peninsular Ranges geomorphic province extends southward from the south edge of the Transverse Ranges geomorphic province to the tip of Baja California in Mexico (Norris and Webb, 1990). The Peninsular Ranges are characterized by northwest-southeast trending hills and valleys separated by similarly trending faults. Most active faults in the Peninsular Ranges province are northwest trending. Rock types in this province in the Los Angeles region generally include schist and sedimentary rocks. Surface materials in canyon bottoms and basins generally consist of alluvium.
The City of Los Angeles is within a seismically active region that is well known for its many active faults. Due to the area’s historical seismicity, it is reasonable to expect future seismic shaking along local or regional faults. The San Andreas Fault is a major tectonic boundary about 34 miles northeast of downtown Los Angeles, outside the city limits. Significant faults within the City include the Newport-Inglewood, Santa Monica, Hollywood, Puente Hills Blind Thrust, Palos Verdes Hills, Verdugo, San Fernando, Northridge, and Santa Susana faults.
Subsurface geology of the area is generally shown in Figure 4-1, which illustrates mapped rock types and seismic faults and folds. The City of Los Angeles is delineated by the blue line in the figure.
4.4.3 Climate In the basins and valleys along the California coast, climate is subject to wide variations within short distances as a result of the influence of topography on the circulation of marine air. In general, the Los Angeles area has a mild climate characterized by warm, dry summers and cool, wet winters. Temperature and precipitation vary considerably with elevation, topography, and distance from the Pacific Ocean. A storm producing moderate rainfall on the coast (1 inch during a 24-hour period) may produce very heavy rainfall in the mountains (10 to 20 inches during the same 24-hour period). Table 4-3 summarizes key climate data at Los Angeles International Airport on the coast and in downtown Los Angeles.
Table 4-3. Average Los Angeles Climate Data L.A. International Airport Downtown Los Angeles Period of record 1944 – 2012 1906 – 2012 Average Annual Minimum Temperature 55.3ºF 55.8ºF Average Annual Maximum Temperature 70.1ºF 74.0ºF Average Annual Mean Temperature 62.7ºF 64.9ºF Maximum Temperature 110ºF, September 26, 1963 113ºF, September 27, 2010 Minimum Temperature 27ºF, January 4, 1949 25ºF, February 19, 1911 Average Annual Precipitation 12.02 inches 14.77 inches One Date Maximum Precipitation 5.60 inches, November 21, 1967 5.88 inches, March 2, 1938 Source: Western Regional Climate Center, 2017
Most precipitation occurs from December through March. Precipitation during the summer is infrequent, and rainless periods of several months are common. Precipitation usually occurs as localized cloudbursts, mostly in the mountains and deserts after summer, and light to moderate rains in winter. Six to eight heavy rain events each year result in most of the total precipitation. In general, the quantity of precipitation increases with elevation.

City of Los Angeles 2018 Local Hazard Mitigation Plan City of Los Angeles Profile
4-5
Figure 4-1. Los Angeles Geologic Features
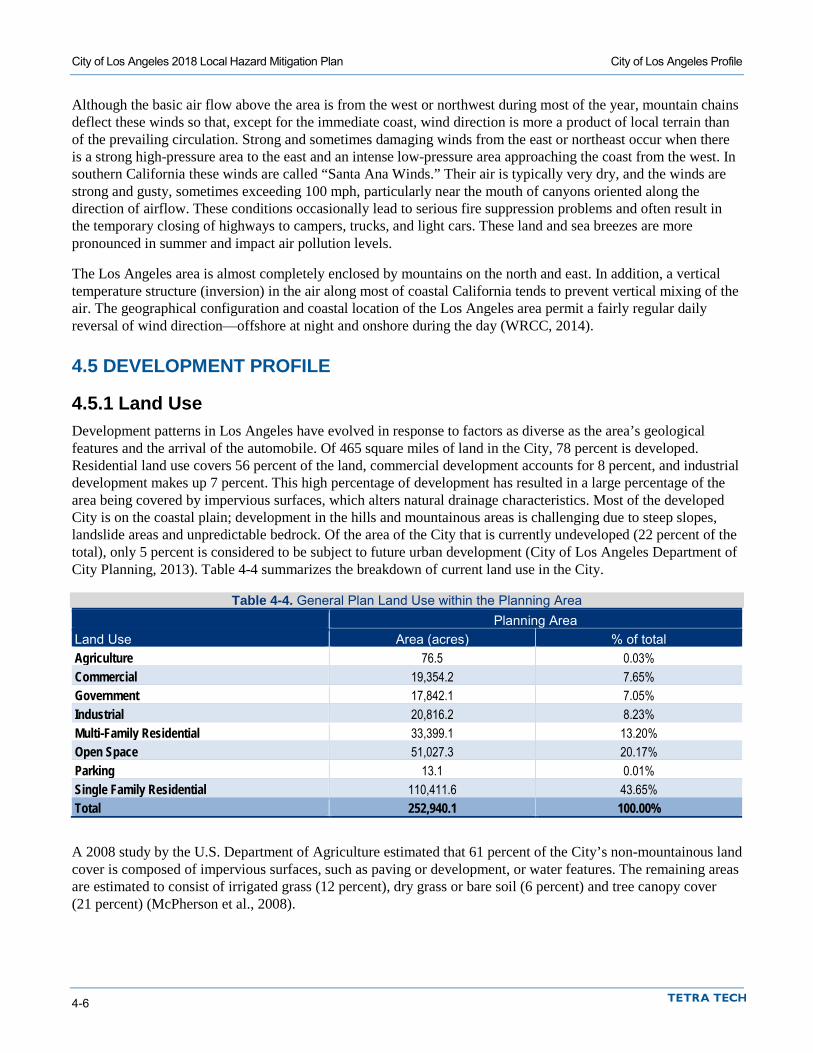
City of Los Angeles 2018 Local Hazard Mitigation Plan City of Los Angeles Profile
4-6
Although the basic air flow above the area is from the west or northwest during most of the year, mountain chains deflect these winds so that, except for the immediate coast, wind direction is more a product of local terrain than of the prevailing circulation. Strong and sometimes damaging winds from the east or northeast occur when there is a strong high-pressure area to the east and an intense low-pressure area approaching the coast from the west. In southern California these winds are called “Santa Ana Winds.” Their air is typically very dry, and the winds are strong and gusty, sometimes exceeding 100 mph, particularly near the mouth of canyons oriented along the direction of airflow. These conditions occasionally lead to serious fire suppression problems and often result in the temporary closing of highways to campers, trucks, and light cars. These land and sea breezes are more pronounced in summer and impact air pollution levels.
The Los Angeles area is almost completely enclosed by mountains on the north and east. In addition, a vertical temperature structure (inversion) in the air along most of coastal California tends to prevent vertical mixing of the air. The geographical configuration and coastal location of the Los Angeles area permit a fairly regular daily reversal of wind direction—offshore at night and onshore during the day (WRCC, 2014).
4.5 DEVELOPMENT PROFILE
4.5.1 Land Use Development patterns in Los Angeles have evolved in response to factors as diverse as the area’s geological features and the arrival of the automobile. Of 465 square miles of land in the City, 78 percent is developed. Residential land use covers 56 percent of the land, commercial development accounts for 8 percent, and industrial development makes up 7 percent. This high percentage of development has resulted in a large percentage of the area being covered by impervious surfaces, which alters natural drainage characteristics. Most of the developed City is on the coastal plain; development in the hills and mountainous areas is challenging due to steep slopes, landslide areas and unpredictable bedrock. Of the area of the City that is currently undeveloped (22 percent of the total), only 5 percent is considered to be subject to future urban development (City of Los Angeles Department of City Planning, 2013). Table 4-4 summarizes the breakdown of current land use in the City.
Table 4-4. General Plan Land Use within the Planning Area Planning Area Land Use Area (acres) % of total Agriculture 76.5 0.03% Commercial 19,354.2 7.65% Government 17,842.1 7.05% Industrial 20,816.2 8.23% Multi-Family Residential 33,399.1 13.20% Open Space 51,027.3 20.17% Parking 13.1 0.01% Single Family Residential 110,411.6 43.65% Total 252,940.1 100.00%
A 2008 study by the U.S. Department of Agriculture estimated that 61 percent of the City’s non-mountainous land cover is composed of impervious surfaces, such as paving or development, or water features. The remaining areas are estimated to consist of irrigated grass (12 percent), dry grass or bare soil (6 percent) and tree canopy cover (21 percent) (McPherson et al., 2008).

City of Los Angeles 2018 Local Hazard Mitigation Plan City of Los Angeles Profile
4-7
The City’s General Plan and zoning code guide local development. The Land Use Element of the General Plan defines 35 Community Plan areas for guidance of the physical development of the City’s neighborhoods. These community plan areas are distributed between seven Area Planning Commissions (APCs):
• Central APC • East Los Angeles APC • Harbor APC • North Valley APC • South Los Angeles APC • South Valley APC • West Los Angeles APC
4.5.2 Critical Facilities and Infrastructure For consistency, the Steering Committee decided to retain the critical facility categories established for the City’s previous (2011) hazard mitigation plan:
• Critical Operating Facilities—These facilities—referred to as the City’s “Big 20” infrastructure buildings—house most City personnel and are required for the day-to-day conduct of City business:
City Hall City Hall East City Hall South LAPD Administration
Building Personnel Department
Building Piper Technical Center
San Pedro Municipal Building Braude Building West Los Angeles City Hall Metro Communication/Dispatch Van Nuys City Hall Figueroa Tower#1 Figueroa Tower#2 Wilshire Towers
Garland Building West Los Angeles Inspection
Division Convention Center Valley 911 Building Public Works Broadway
Building Emergency Operations Center.
• Critical Response Facilities—These City facilities are necessary for hazard event response. They include fire stations, police stations, hospitals, and evacuation centers, such as Los Angeles Unified School District schools, and recreation and park facilities.
• Critical Infrastructure—Critical public and private infrastructure has two categories:
Critical transportation infrastructure includes freeways, streets, bridges, railroads, airports and the harbor.
Critical utilities infrastructure includes potable water systems (treatment and reservoirs), wastewater systems (treatment plants, major interceptors and sewer lines), electric power systems (power plants, substations and major transmissions lines), oil refineries, natural gas systems, and communication systems.
Figure 4-2 through Figure 4-15 show the location of critical facilities and infrastructure in the planning area. Due to the sensitivity of this information, a detailed list of facilities is not provided. The list is on file with the City of Los Angeles. Table 4-5 summarizes the general types of critical facilities and infrastructure, respectively. All critical facilities and infrastructure were analyzed in the risk assessment to help rank risk and identify mitigation actions. The risk assessment for each hazard qualitatively discusses critical facilities with regard to that hazard.
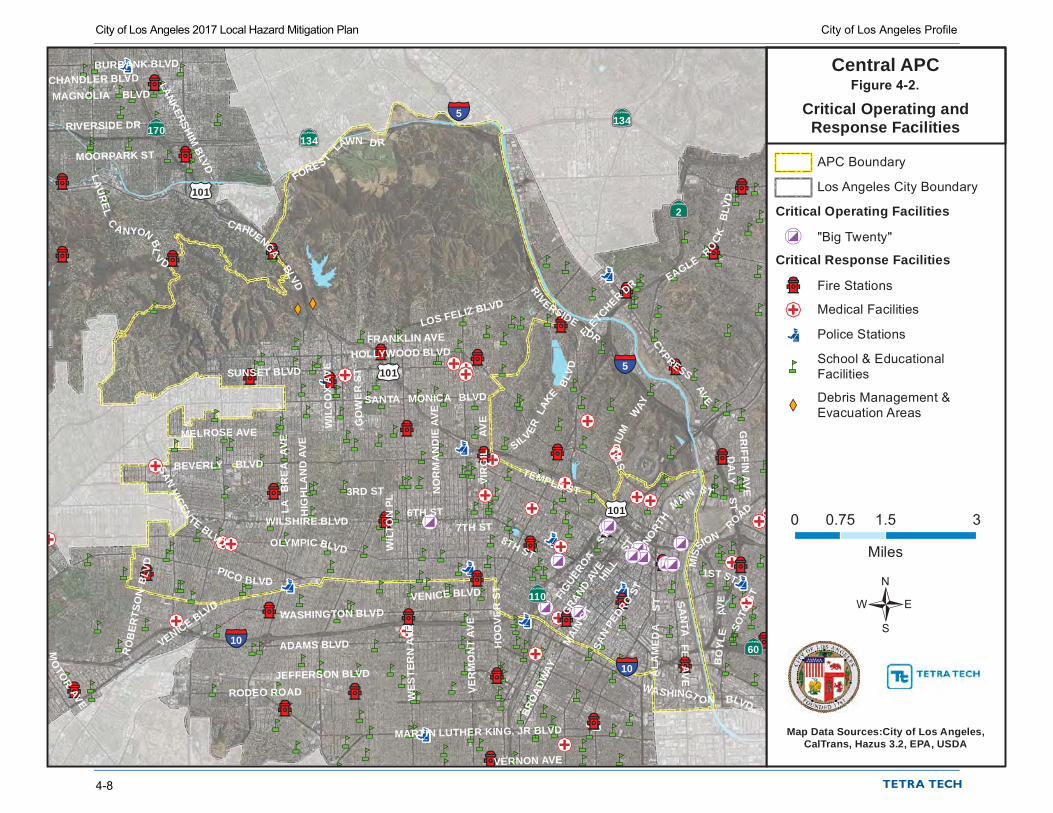
XW
XWXW
nm
nmnm
nm
nmnmnm
nm
nmnm
nmnm
nm nmnm nmnm
nm nmnm
nmnm nmnm nm nm
nmnmnmnmnm nm
nmnmnm
nm nmnm nm nmnmnmnm
nmnm
nm nm nmnmnm nmnmnm nm
nmnm
nm
nm nmnm
nm nmnmnmnm
nm nm
nm nmnmnmnm nm nmnm nm nmnmnmnm
nmnmnm
nmnm nmnm nm nm
nm
nmnmnm nm
nm
nm nm
nm
nmnm nmnm
nmnm nm nm
nmnmnmnmnm
nmnm
nmnm nmnm nmnm nm nm nmnm nmnmnm nmnmnmnmnmnm nmnmnm nm nmnm nmnm
nmnmnm
nm nmnmnm nm nmnm nmnmnmnmnmnm nm nm
nmnm nmnmnmnmnm nmnm nm nm nmnmnm nmnm nm
nmnm nmnm nm nmnmnm nm nmnmnmnm nmnmnm nm nmnmnm nm nmnmnm nmnmnmnm nmnmnmnm nmnmnm nmnmnm nmnmnm nm nmnm nmnm nmnm nm
nmnm nmnmnm nm nmnm
nm
nmnmnm
nm
nm
nmnm nm nmnm nmnm nmnm nmnm nm nmnm nm nmnmnmnm nmnmnm nmnm nmnmnm nm nmnm nmnmnm nmnmnmnm nmnm nm nmnmnm
nm
í
í
í
í
í
í
í
í
í
í
í
í
"'
"'
"'
"'
"'
"'
"'"'"'"'
"'"'"'
"' "'"' "'"'"' "' "'
"'
"'"'"'
"'
¬«¬«
¬«¬«
¬«
¬«
¬«
¬« ¬«
¬«
¬«¬«
¬«
¬«
¬«
¬«
¬«
¬«
¬«
¬«
¬«
¬«
¬«
¬« ¬«
¬«
¬«
¬«
¬«
¬«
¬«
¬«
¬«
¬«
¬«
¬«
¬«
¬«
¬«
"N"N"N"N
"N"N"N"N
"N"N
"N
"N "N
"N
§¦10
§¦10
§¦5
§¦5
ÄÆÅ60
ÄÆÅ170
ÄÆÅ110
ÄÆÅ2
ÄÆÅ134
ÄÆÅ134
£¤101
£¤101
£¤101
3RD ST
GRAND
AVE
MELROSE AVE
FRANKLIN AVE
BEVERLY BLVD
1STST
6TH ST
JEFFERSON BLVD
VERNON AVE
TEMPLE ST
MARTIN LUTHER KING, JR BLVD
VER
MO
NT
AVE
7TH ST8TH ST
EAGLERO
CK
BLV
DB
OYL
EAV
E
PICO BLVD
VENICE BLVDHIL
L ST
SAN
TAFE
AVE
SUNSET BLVD
WASHINGT ON BLVD
HOLLYWOOD BLVD
VIR
GIL
AV
E
RIVERSIDEDR
MAGNOLIA BLVD
MOORPARK ST
WASHINGTON BLVD
LOS FELIZ BLVD
SOTO
ST
ADAMS BLVD
WILSHIRE BLVD
RODEO ROAD
VENICE BLVD
NORT
H
MAINST
LAU
REL
C
A NYON BL
VD
SANTA MONICA BLVD
OLYMPIC BLVD
FLETCHER DR
SANVICEN
TE BLVD
BURBANK BLVD
SILVERLA
KE
BLV
D
FORESTLAWN DR
RIVERSIDE DR
CHANDLER BLVD
CYPRESS
AV
E
CAHUENGABLVD
FIGUEROA
STSA
NPE
DROST
LANKERSHIM BLVD
LA
BR
EA
AV
E
MO
TORAVE W
ESTE
RN
AVE
MAI
N ST
BROA
DWAY
GO
WE
R S
T
GR
IFFIN AV
E
HO
OVE
R S
T
WIL
CO
X A
VE
ALA
MED
A
ST
MIS
SION
ROAD
WIL
TON
PL N
OR
MA
ND
IE A
VE
HIG
HLA
ND
AVE
RO
BER
TSO
NB
LVD
DA
LYS
T
STA
DIU
MW
AY
APC Boundary
Los Angeles City Boundary
Critical Operating Facilities
"N "Big Twenty"
Critical Response Facilities
¬« Fire Stations
"' Medical Facilities
í Police Stations
nmSchool & EducationalFacilities
XWDebris Management &Evacuation Areas
Map Data Sources:City of Los Angeles,CalTrans, Hazus 3.2, EPA, USDA
Central APC
0 1.5 30.75
Miles
/
Critical Operating andResponse Facilities
Figure 4-2.
City of Los Angeles 2017 Local Hazard Mitigation Plan City of Los Angeles Profile
4-8
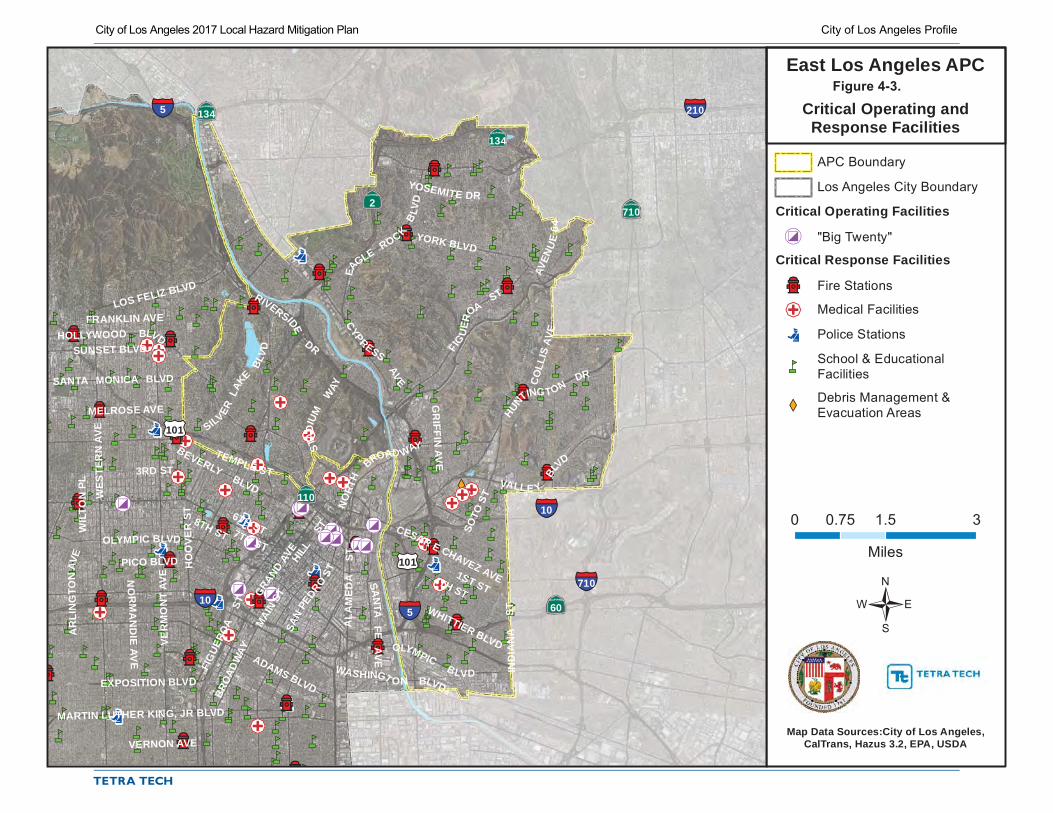
XW
nmnm
nmnm
nmnm
nmnm nm
nm nmnm
nm
nmnm nm nm nm nm
nmnm
nmnm nm
nm nmnmnmnm
nmnm
nm nmnmnmnmnm
nmnm
nm
nm nmnmnm nmnmnmnm nm
nm nm nmnmnmnm nm
nmnmnmnm
nmnm nm
nm nm nm
nmnmnm
nm
nmnmnm
nmnmnmnmnm
nm nm nm nmnmnm nmnmnm nmnmnm
nm nmnm
nmnm nm nmnm nmnm nm nmnmnm nmnmnmnm nmnm nmnm nm nm nm
nmnmnm
nm nmnmnm nm nm nmnmnm nmnmnm nmnm nm
nm nmnm nmnmnmnm nmnm nmnm nm nm nmnm nmnmnm nmnm nmnm nmnm nmnm nmnm nmnm nmnm nmnmnm nm nmnmnmnm nm nmnm nmnmnmnm nmnm nm nmnmnm nmnm nmnmnmnm nm nmnmnm nmnm
nm nmnm nm nm
nm
nm
nmnmnm
nm
nm
nm nmnm nmnm nmnm nmnm nm nmnm nm nmnmnmnm nmnm nmnm nmnm nm nmnmnm nmnmnm nmnm nm nmnm
nm
nm
í
íí
í
í
í
í
í
í
"'
"'
"'
"'
"'
"'"'"'
"'
"'"' "'"' "'"'"'
"'"'
"'"'
"'
¬«¬«
¬«¬«
¬«
¬«
¬«
¬«
¬«
¬«
¬«
¬«
¬«
¬«¬«
¬«
¬«
¬«
¬«
¬«
¬«
¬«¬« ¬«
¬«
¬«
¬«¬«
¬«
¬«
"N"N"N"N
"N"N"N"N
"N"N
"N
"N "N
"N
§¦210
§¦710
§¦10
§¦10
§¦5
§¦5
ÄÆÅ710
ÄÆÅ110
ÄÆÅ2
ÄÆÅ60
ÄÆÅ134
ÄÆÅ134
£¤101
£¤101
3RD ST
GRAND
AVE
MELROSE AVE
BEVERLYBLVD
1ST ST
6TH ST
VERNON AVE
TEMPLE ST
MARTIN LUTHER KING, JR BLVD
VER
MO
NT
AVE
7TH ST
8TH ST
EA
GLEROCK
BLV
D
PICO BLVD HILL
ST
SAN
TAF E
AVE
YORK BLVD
WASHINGT ON BLVD
YOSEMITE DR
HOLLYWOOD BLVD
CESAR E CHAVEZ AVE
FIG
UER
OAST
FRANKLIN AVE
GR
IFFIN AV
E
RIVERSIDE
DRSUNSET BLVD
LOS FELIZ BLVD
HUNTING TON
DR
SOTO
ST
IND
IAN
A
ST
4TH STWHITTIER BLVD
ADAMS BLVDEXPOSITION BLVD
VALLE Y
BLVD
SANTA MONICA BLVD
NO
RTH
BROAD WAYSILVER
LAKE
BLV
D
OLYMPIC BLVD
OLYMPICBLVD
CYPRESS
AV
E
FIG
UERO
A ST
SAN
PEDRO
ST
WES
TER
N A
VE
MAI
N ST
BROA
DWAY
CO
LLIS
AVE
HO
OVE
R S
T
NO
RM
AN
DIE
AVE
ALA
ME
DA
ST
AVEN
UE
64
WIL
TON
PL
AR
LIN
GTO
NAV
E
STA
DIUM
WAY
APC Boundary
Los Angeles City Boundary
Critical Operating Facilities
"N "Big Twenty"
Critical Response Facilities
¬« Fire Stations
"' Medical Facilities
í Police Stations
nmSchool & EducationalFacilities
XWDebris Management &Evacuation Areas
Map Data Sources:City of Los Angeles,CalTrans, Hazus 3.2, EPA, USDA
East Los Angeles APC
0 1.5 30.75
Miles
/
Critical Operating andResponse Facilities
Figure 4-3.
City of Los Angeles 2017 Local Hazard Mitigation Plan City of Los Angeles Profile
laura.leone
Typewritten Text
4-9
laura.leone
Typewritten Text
laura.leone
Typewritten Text
laura.leone
Typewritten Text
laura.leone
Typewritten Text
laura.leone
Typewritten Text
laura.leone
Typewritten Text
laura.leone
Typewritten Text
laura.leone
Typewritten Text

XW
nmnm
nmnm
nm
nm
nm
nm
nm
nmnm nmnmnm nmnm nm nm nmnm nmnm nmnmnmnm
nm
nm
nmnm
nm
nmnm nmnmnm nmnmnm nmnmnm
nm nmnm
nmnm
nmnm
nmnmnmnm nmnm
nmnmnmnmnm
nm nm
í
í
"'
¬«
¬«
¬«
¬«
¬«
¬«
¬«
¬«
¬«
¬« ¬«
¬«
¬«
¬«
¬«"N
§¦710
§¦710
§¦110
§¦105
§¦105
§¦405
§¦405
ÄÆÅ1
ÄÆÅ1ÄÆÅ1
ÄÆÅ1
ÄÆÅ91
FIG
UE
RO
AST
PACIFIC COAST HWY
IMPERIAL HWY
ANAHEIM ST
PAC
IFIC
AV
E
IMPERIAL HWY
LOMITA BLVD
VER
MO
NT
AVE
GA
FFEYST
PASEODEL MAR
WES
TER
N A
VE
NO
RM
AN
DIE
AV
E
APC Boundary
Los Angeles City Boundary
Critical Operating Facilities
"N "Big Twenty"
Critical Response Facilities
¬« Fire Stations
"' Medical Facilities
í Police Stations
nmSchool & EducationalFacilities
XWDebris Management &Evacuation Areas
Map Data Sources:City of Los Angeles,CalTrans, Hazus 3.2, EPA, USDA
Harbor APC
0 2.5 51.25
Miles
/
Critical Operating andResponse Facilities
Figure 4-4.
City of Los Angeles 2017 Local Hazard Mitigation Plan City of Los Angeles Profile
4-10
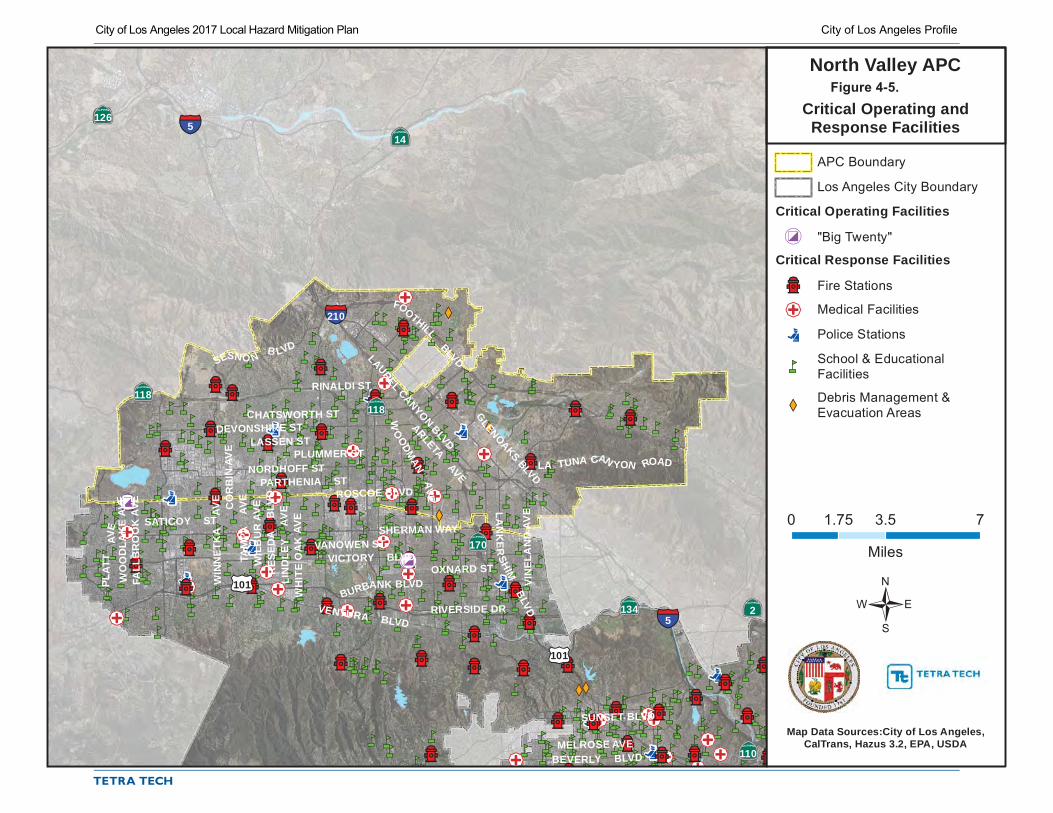
XW
XW
XWXW
XWnmnmnm
nmnm
nmnmnmnm nm nmnm nmnm nmnmnmnmnm nmnm nmnm nmnm nmnm
nm nmnm nmnmnm nmnm nmnm nmnm nmnm nm
nmnm nmnm nmnm nmnmnmnmnmnm nm nmnm nmnm nmnm nmnm nmnm nmnm nm nmnm nmnm nm nmnmnmnmnm nm nmnmnmnm nm nmnmnm
nm
nmnmnm nmnmnm nmnmnmnmnm nmnm nmnmnm nmnm nmnmnm nm nm nmnmnm nmnm nmnmnmnm nmnmnm nmnmnm nm nmnm
nm nmnmnmnm nmnm nmnm nmnmnm nmnmnmnm nm nmnmnm nmnm nmnm nm nm nmnmnm nmnm nmnm nmnm nm nmnm nmnm nmnmnm nm nmnmnmnmnm
nmnm nm nmnmnmnm nmnmnm nmnmnmnmnm nm nmnm nmnmnmnmnm nmnm nm nmnmnmnm nm nmnmnmnmnm nm nmnmnmnmnmnm nm nm nm nmnm nmnmnm nm nmnm nmnm nmnm nm nmnm nm nmnmnmnm nmnmnmnm
nmnmnm nmnmnmnm nmnm nmnm nm
nmnm nm nmnm nmnm nmnm nmnm nmnmnm nm nmnm nmnm nmnmnm nm nmnmnmnm nm nm nmnm nmnmnm nm nmnm nmnm nmnmnm nmnm nmnmnm nmnmnmnmnm nm
nmnmnm nmnm nmnm nm nmnmnmnm nm nmnmnm nm nmnm nmnm nmnmnm nm nmnm nm nmnm
nmnm nm nmnm nmnmnmnm nmnm nm
nmnm nm nmnm nmnm nm
nm
nm
nm
nm
nmnm nmnm nmnmnm nmnmnm nmnm nmnmnmnmnmnm nm nmnmnm nmnmnmnmnm nmnm nm nm nmnmnmnmnm nmnm nmnm nmnm nmnmnm nm nmnmnmnm nmnmnm nm nm nmnmnm nmnmnmnmnmnm nmnmnm
í
í
í
í
í
í
í
í
íí
í "'"'
"'
"'
"'
"'
"'
"' "'
"'"' "'
"'"'
"'"' "'
"'"'"'
"'"'"'"'
"'"' "'"'
¬« ¬«
¬«
¬«
¬«
¬«¬«
¬«
¬«
¬«
¬«
¬«¬«
¬«
¬«
¬«
¬« ¬«
¬«
¬«¬«
¬«¬«
¬«
¬«
¬«
¬«
¬«
¬«¬«
¬«
¬«
¬«
¬«
¬«
¬«
¬«
¬«
¬«
¬«¬«
¬«
¬«
¬«
¬«
¬«
¬«
¬«
¬«¬«
¬«
¬«
¬«
"N
"N
"N
§¦210
§¦5
§¦5
ÄÆÅ110
ÄÆÅ126
ÄÆÅ170
ÄÆÅ2ÄÆÅ134
ÄÆÅ14
ÄÆÅ118ÄÆÅ118
£¤101
£¤101
MELROSE AVE
FALL
BR
OO
K A
VE
ROSCOE BLVD
BEVERLY BLVD
VANOWEN ST
OXNARD STVICTORY BLVD
GLENOAKSBLVD
SUNSET BLVD
VENTURA BLVD
CHATSWORTH ST
SATICOY ST
LAUREL CANYONBLVD
NORDHOFF ST
FOOTHILLBLVD
DEVONSHIRE STLASSEN ST
PLUMMER ST
WIL
BU
R A
VECO
RB
IN A
VE
PARTHENIA ST
TAM
PA
AVE
WIN
NET
KA
AV
E
LIN
DLE
Y AV
EW
HIT
EO
AK
AVE
RIVERSIDE DR
RINALDI ST
BURBANK BLVDWO
OD
LAK
EAV
E
SHERMAN WAY
SESNO NB LVD
LA TUNA CAN YON ROAD
LAN
KE
RSHIM
BLVD
RES
EDA
B
LVD
WOODM
ANA
VE
VIN
ELA
ND
AV
E
PLAT
TAV
E
ARLETA AVE
APC Boundary
Los Angeles City Boundary
Critical Operating Facilities
"N "Big Twenty"
Critical Response Facilities
¬« Fire Stations
"' Medical Facilities
í Police Stations
nmSchool & EducationalFacilities
XWDebris Management &Evacuation Areas
Map Data Sources:City of Los Angeles,CalTrans, Hazus 3.2, EPA, USDA
North Valley APC
0 3.5 71.75
Miles
/
Critical Operating andResponse Facilities
Figure 4-5.
City of Los Angeles 2017 Local Hazard Mitigation Plan City of Los Angeles Profile
laura.leone
Typewritten Text
laura.leone
Typewritten Text
4-11

XW
XW
XW
nmnm nmnm nm nmnm
nmnmnm
nm
nm nm nmnmnm nmnmnm nm
nmnm
nm
nm nmnmnm nmnmnmnm nm nmnm nm nmnmnmnm
nm nm
nmnmnm
nmnm nmnm nm nm
nm
nmnmnm nm
nm nm
nmnm
nm nmnm nmnm
nm nmnmnm
nm nm
nmnm nm
nm nmnmnm
nmnm
nmnm nmnm nmnm nm nm nmnm nmnmnm nmnmnmnmnmnm nmnmnm nm nmnm nmnm
nm nmnmnm nm nmnmnm nmnmnmnm nmnmnmnm nmnmnm nmnmnm nmnmnm nm nmnm nmnm nmnm nm
nmnm nmnmnm nm nmnm
nmnmnm
nm
nm
nm
nm
nmnm nm nmnm nmnm nmnm nmnm nm nmnm nm nmnmnmnm nmnm nmnm nmnm nmnmnm nm nmnm nmnmnm nmnmnmnm nmnm nm nmnmnm
nmnmnm nmnmnm nmnmnm nm nmnmnm
nmnmnm nmnm nmnm nmnm
nmnm nm nmnm nmnmnm nmnmnmnm nm
nmnm nmnmnmnmnm nm
nmnmnm nmnm nmnmnm nmnmnm
nmnm nm nm nmnm nmnm nm nmnmnm
nm
nm
í í
í
í
í
í
í
í
í
í
"'
"'
"'
"'
"'"' "'"' "'
"'"' "' "'
"'
"'"'"'
"'
¬«
¬«
¬«¬«
¬«
¬«
¬«
¬« ¬«
¬«
¬«¬«
¬«
¬«
¬«¬«
¬«
¬«
¬«
¬«
¬«
¬«¬«
¬«¬«
¬«
¬«
¬«
¬«
"N"N"N"N
"N"N"N"N
"N"N
"N
"N "N
"N §¦5
§¦405
§¦110
§¦105 §¦105
§¦10
§¦10
ÄÆÅ1
ÄÆÅ60
ÄÆÅ110
£¤101
NORTH MA IN ST3RD ST
GRAN
D AV
E
FLO
WER
ST
HO
OVE
R S
T
1STST
JEFFERSON BLVD
VERNON AVE
MARTIN LUTHER KING, JR BLVD
VER
MO
NT
AVE
48TH ST
SLAUSON AVE
FLORENCE AVE
7TH ST
8TH ST
BO
YLE
AVE
PICO BLVD
NO
RM
AN
DIE
AV
E
IMPERIAL HWY
WES
TER
N A
VE
HILL
ST
SAN
TAFE
AVE
WASHINGT ON BLVD
OLIV
EST
LOS
ANGELESST
CESAR E CHAVEZ AVE
CENTURY BLVD
108TH ST
WASHINGTON BLVD
IMPERIAL HWY
ADAMS BLVD
WILSHIRE BLVD
RODEO ROAD
CR
ENS
HA
W B
LVD
VENICE BLVD
OLYMPIC BLVD
SAN
VICENTE BLVD
EXPOSITION BLVD
MANCHESTER AVE
GAGE AVE
VAN
NES
SAV
E
ALVA
RADO
ST
STOCKER ST
FIGUEROA
ST
FIG
UE
RO
A
ST
AVA
LON
BLV
D
SAN
PEDRO
ST
MA
IN S
T
LA
BRE
AAV
E
MO
TORAVE
CEN
TRA
L AV
E
BR
OA
DW
AY
HO
OVE
R S
T
AVIA
TIO
N B
LVD
VER
MO
NT
AVE
SAN
PED
RO
ST
ALA
ME
DA
STLO
NG
BE
AC
HAV
E
LAC
IEN
EG
AB
LVD
AR
LIN
GTO
N A
VE
RO
BER
TSO
NB
LVD
APC Boundary
Los Angeles City Boundary
Critical Operating Facilities
"N "Big Twenty"
Critical Response Facilities
¬« Fire Stations
"' Medical Facilities
í Police Stations
nmSchool & EducationalFacilities
XWDebris Management &Evacuation Areas
Map Data Sources:City of Los Angeles,CalTrans, Hazus 3.2, EPA, USDA
South Los Angeles APC
0 1.5 30.75
Miles
/
Critical Operating andResponse Facilities
Figure 4-6.
City of Los Angeles 2017 Local Hazard Mitigation Plan City of Los Angeles Profile
4-12
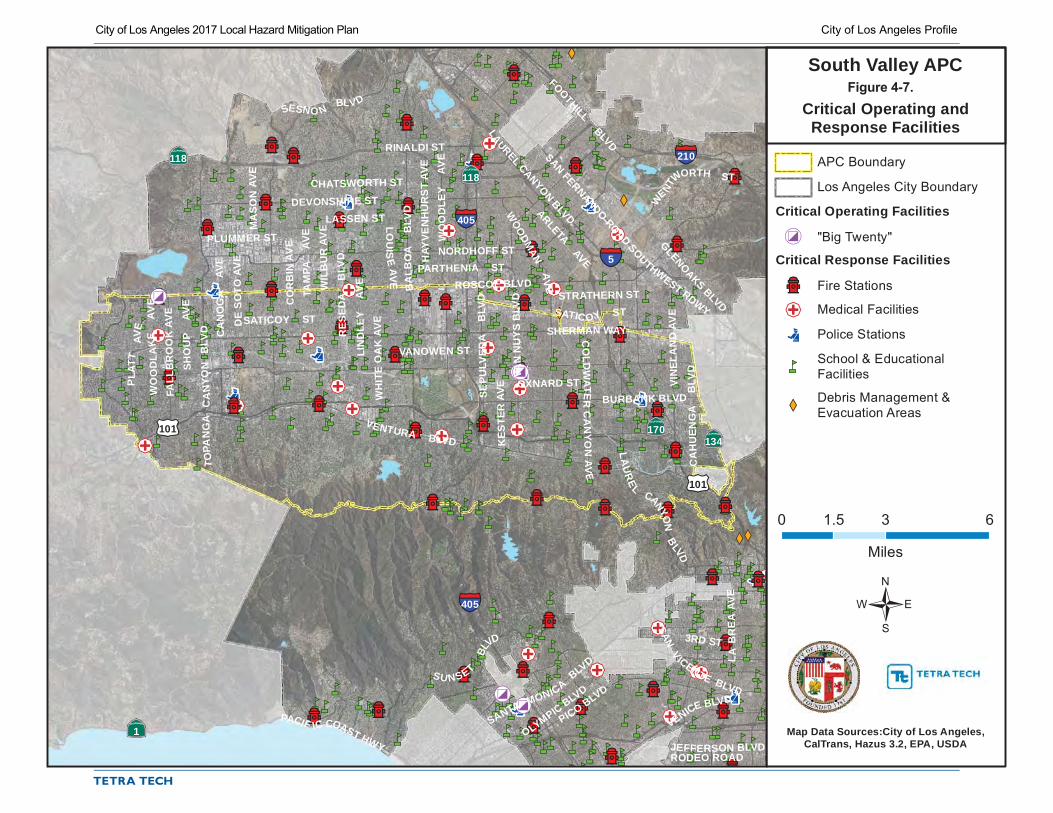
XW
XW
XWXW
XWnm
nmnm
nmnm
nmnmnmnm nmnmnm nmnmnmnmnm nmnm nm nmnm
nm nmnm nmnmnm nmnm nmnm nmnm nmnm nm
nmnm nmnm nmnm nmnmnmnmnm nm
nm nmnm nmnm nmnm nmnm nmnm nmnm nm nmnm nmnm nm nmnmnmnmnm nm nmnmnmnm nm nmnmnm
nm
nmnmnm nmnmnm
nmnm nm
nm nmnmnm nmnm nmnmnm nmnm
nmnm nm nmnm
nmnmnm nmnm nmnm nmnm nmnm nm
nmnm nm nmnmnmnm nmnmnm nmnm nmnmnm nm nmnm nmnmnmnmnm nmnm nm nmnmnmnm nm nmnmnmnmnm nm nmnmnmnmnmnm nm nm nm nmnm nmnmnm nm nmnm nmnm nmnm nm nmnm nm nmnmnm nm nmnmnmnm
nmnmnm nmnmnm
nm
nmnmnm nmnmnm
nm nmnm nmnm nmnmnm nm nm
nm nmnm nmnm nmnm nmnmnm nm nmnm nmnmnmnm nmnmnmnm nm nm nmnmnm nmnmnm nmnmnm nmnm nmnmnm nmnmnmnm nmnm nmnmnmnm nmnm nmnm nmnmnm nmnmnmnm nm nmnmnm nmnm nmnm nm nm nmnmnm nmnm nmnm nmnm nm nmnm nmnm nmnmnm nm nmnmnmnmnm nmnmnm nmnm nmnm nm nmnmnmnm nm nmnmnm nm nmnm nmnm nmnmnm nm nmnm nm nmnm
nmnm nm nmnm nmnmnmnm
nmnm nm
nmnmnm
nm
nmnm nm nmnmnm nmnmnm nmnm nm nmnm nmnmnm nm
nmnmnmnm
nm nmnmnmnmnm nmnmnmnm nmnmnmnmnmnm nm nmnm
nmnm nmnm
nmnmnm nmnmnm
nm
nm
nmnmnm nm nmnm nmnmnmnm nmnmnm nmnm nmnm nmnm nmnmnmnm
nm
nm
nm
í
í
í
í
í
í
í
í
í
íí
"'
"'
"'
"'
"' "'
"'"' "'
"'"'
"'"' "'
"'"'"'
"'
"'
"'"' "'
"'¬«
¬«
¬«
¬«
¬«
¬«
¬«
¬«
¬«
¬«
¬«
¬«
¬«
¬«
¬«
¬«
¬«
¬«
¬«
¬«
¬«
¬«
¬«
¬«
¬«
¬«
¬«
¬«
¬«¬«
¬«
¬«
¬«
¬«
¬«
¬«
¬«
¬«
¬«
¬«
¬«¬«
¬«
¬«
¬«
¬«
¬«
¬«
¬« ¬«
¬«
¬«
¬«"N
"N
"N
"N
"N
§¦210
§¦5
§¦405
§¦405
ÄÆÅ1
ÄÆÅ134ÄÆÅ170
ÄÆÅ118ÄÆÅ118
£¤101
£¤101
FALL
BR
OO
K A
VE
ROSCOE BLVD
KES
TER
AVE
PACIF IC COAST HWY
VANOWEN ST
LOU
ISE
AV E
OXNARD ST
VENICE BLVD
GLENOAKSBLVD
VENTURA BLVD
3RD ST
CHATSWORTH ST
SATICOY ST
PICO BLVD
PLUMMER ST
LAUREL CANYONBLVD
NORDHOFF ST
DEVONSHIRE ST
LASSEN ST
FOOTHILLBLVD
OLYMPICBLVD
WIL
BU
R A
VE
CO
RB
IN A
VE
PARTHENIA ST
JEFFERSON BLVD
STRATHERN ST
WO
OD
LEY
AVE
DE
SO
TOAV
E
TAM
PA
AVE
LIN
DLE
Y AV
E
MA
SON
AVE
WH
ITE
OA
KAV
E
RODEO ROAD
SU NSET
BL
VD
SHO
UP
AVE
LAU
RE
LCANYO
NB
LVD
RINALDI ST
BURBANK BLVD
SANTA MONICABLVD
CO
LDW
AT ER
CA
NYO
NAV
E
SANV
ICENTE BLVDC
AH
UEN
GA
B
LVD
SANFERNANDO
ROADSOUTHWEST RDWY
W
ENT
WORTH ST
SHERMAN WAY
WO
OD
LAKE
AVE
CA
NO
GA
AV
E HAY
VEN
HU
RS
T AV
E
VAN
NU
YS
BLV
D
SESNO NBLVD
RES
EDA
B
LVD
L AB
RE
AAV
E
SEPU
LVED
A
BLV
D
WOO
DMAN
AV
EBALB
OA
BLV
D
VIN
ELA
ND
AV
E
PLA
TTAV
E
ARLETA AVE
SATIC OY ST
TO
PAN
GA
CA
NYO
NB
LVD
APC Boundary
Los Angeles City Boundary
Critical Operating Facilities
"N "Big Twenty"
Critical Response Facilities
¬« Fire Stations
"' Medical Facilities
í Police Stations
nmSchool & EducationalFacilities
XWDebris Management &Evacuation Areas
Map Data Sources:City of Los Angeles,CalTrans, Hazus 3.2, EPA, USDA
South Valley APC
0 3 61.5
Miles
/
Critical Operating andResponse Facilities
Figure 4-7.
City of Los Angeles 2017 Local Hazard Mitigation Plan City of Los Angeles Profile
laura.leone
Typewritten Text
laura.leone
Typewritten Text
4-13
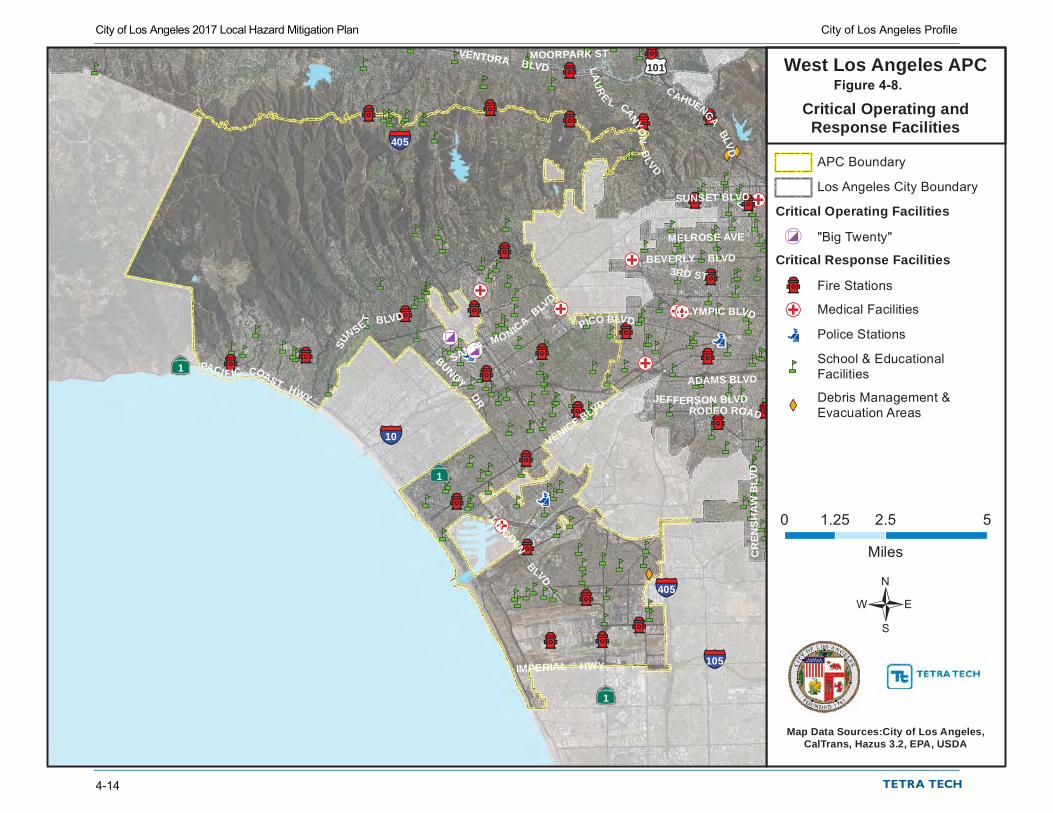
XW
XWXW
nmnm nm nmnmnm
nm
nm nmnm nmnmnm
nmnm nm
nm nmnmnm nmnm nmnmnm nmnmnm
nmnm nm nmnm
nmnmnm nmnm nmnm nmnm nmnm nm
nmnm nmnm nmnm
nmnmnm nmnmnm
nm
nmnm
nmnmnm nm nm
nm
nmnm
nm
nm nm nmnm
nm nm nmnm nmnmnmnm
nmnm nm
nmnmnm
nm
nmnm nm nmnmnm nmnmnm nmnm nm nmnm nmnmnm nm
nmnmnmnmnm
nm nmnmnmnmnm nm
nmnmnmnmnmnmnmnmnm nm nmnm
nmnm nmnm
nmnmnm nmnmnm
nm
nm
nm
nm
nmnmnm nm nmnm nmnmnmnm nmnm nmnm nmnm nmnm nmnm nmnmnmnm nmnm nm
nmnmnm nmnm nm nmnmnm nmnm nmnm nm
nmnm
nmnm nmnm
nmnmnmnmnm
nm
í
í
í
í
"'
"'
"'
"'"' "'
"'
"'
¬«
¬«
¬«
¬«
¬«
¬«
¬«
¬«
¬«
¬«
¬«
¬«
¬«
¬«
¬«
¬«
¬«
¬«
¬«
¬«
¬«
¬«
¬«¬«¬«
¬«
¬«
¬«
¬«"N"N
§¦105
§¦10
§¦405
§¦405
ÄÆÅ1
ÄÆÅ1
ÄÆÅ1
£¤101
PICO BLVD
BEVERLY BLVD
PACI F IC COAST HWY
SUNSET BLVD
VENTURA BLVD
LINCOLNBLVD
3RD ST
MOORPARK ST
LAU
RE L CANYO
NB
LVDJEFFERSON BLVD
IMPERIAL HWY
ADAMS BLVD
RODEO ROAD
SUNSE
T BLVD
VENICE BLVD
SANTA MONICABLV
DOLYMPIC BLVD
BUNDY
DR
MELROSE AVE
CR
ENS
HA
W B
LVD
C
AHUENGABLVD
APC Boundary
Los Angeles City Boundary
Critical Operating Facilities
"N "Big Twenty"
Critical Response Facilities
¬« Fire Stations
"' Medical Facilities
í Police Stations
nmSchool & EducationalFacilities
XWDebris Management &Evacuation Areas
Map Data Sources:City of Los Angeles,CalTrans, Hazus 3.2, EPA, USDA
West Los Angeles APC
0 2.5 51.25
Miles
/
Critical Operating andResponse Facilities
Figure 4-8.
City of Los Angeles 2017 Local Hazard Mitigation Plan City of Los Angeles Profile
4-14

§¦10
§¦10
§¦5
§¦5
ÄÆÅ60
ÄÆÅ170
ÄÆÅ110
ÄÆÅ2
ÄÆÅ134
ÄÆÅ134
£¤101
£¤101
£¤101
3RD ST
GRAND
AVE
MELROSE AVE
FRANKLIN AVE
BEVERLY BLVD
1STST
6TH ST
JEFFERSON BLVD
VERNON AVE
TEMPLE ST
MARTIN LUTHER KING, JR BLVD
VER
MO
NT
AVE
7TH ST8TH ST
EAGLERO
CK
BLV
DB
OYL
EAV
E
PICO BLVD
VENICE BLVDHIL
L ST
SAN
TAFE
AVE
SUNSET BLVD
WASHINGT ON BLVD
HOLLYWOOD BLVD
VIR
GIL
AV
E
RIVERSIDEDR
MAGNOLIA BLVD
MOORPARK ST
WASHINGTON BLVD
LOS FELIZ BLVD
SOTO
ST
ADAMS BLVD
WILSHIRE BLVD
RODEO ROAD
VENICE BLVD
NORT
H
MAINST
LAU
REL
C
A NYON BL
VD
SANTA MONICA BLVD
OLYMPIC BLVD
FLETCHER DR
SANVICEN
TE BLVD
BURBANK BLVD
SILVERLA
KE
BLV
D
FORESTLAWN DR
RIVERSIDE DR
CHANDLER BLVD
CYPRESS
AV
E
CAHUENGABLVD
FIGUEROA
STSA
NPE
DROST
LANKERSHIM BLVD
LA
BR
EA
AV
E
MO
TORAVE W
ESTE
RN
AVE
MAI
N ST
BROA
DWAY
GO
WE
R S
T
GR
IFFIN AV
E
HO
OVE
R S
T
WIL
CO
X A
VE
ALA
MED
A
ST
MIS
SION
ROAD
WIL
TON
PL N
OR
MA
ND
IE A
VE
HIG
HLA
ND
AVE
RO
BER
TSO
NB
LVD
DA
LYS
T
STA
DIU
MW
AY
APC Boundary
Los Angeles City Boundary
Utility Infrastructure
Communications
d Electric Power
%defgc Hazardous Materials
!/ Petroleum & Natural Gas
po Potable Water
! ( Waste WaterTransportation Infrastructure
J Airport Facilities
Ja Bus Systemsú Bridges
I2 Light Rail Facilities
í Port / Harbor
I3 Rail Facilities
Map Data Sources:City of Los Angeles,CalTrans, Hazus 3.2, EPA, USDA
Central APC
0 1.5 30.75
Miles
/
Critical InfrastructureFigure 4-9.
City of Los Angeles 2017 Local Hazard Mitigation Plan City of Los Angeles Profile
laura.leone
Typewritten Text
4-15
laura.leone
Typewritten Text

§¦210
§¦710
§¦10
§¦10
§¦5
§¦5
ÄÆÅ710
ÄÆÅ110
ÄÆÅ2
ÄÆÅ60
ÄÆÅ134
ÄÆÅ134
£¤101
£¤101
3RD ST
GRAND
AVE
MELROSE AVE
BEVERLYBLVD
1ST ST
6TH ST
VERNON AVE
TEMPLE ST
MARTIN LUTHER KING, JR BLVD
VER
MO
NT
AVE
7TH ST
8TH ST
EA
GLEROCK
BLV
D
PICO BLVD HILL
ST
SAN
TAF E
AVE
YORK BLVD
WASHINGT ON BLVD
YOSEMITE DR
HOLLYWOOD BLVD
CESAR E CHAVEZ AVE
FIG
UER
OAST
FRANKLIN AVE
GR
IFFIN AV
E
RIVERSIDE
DRSUNSET BLVD
LOS FELIZ BLVD
HUNTING TON
DR
SOTO
ST
IND
IAN
A
ST
4TH STWHITTIER BLVD
ADAMS BLVDEXPOSITION BLVD
VALLE Y
BLVD
SANTA MONICA BLVD
NO
RTH
BROAD WAYSILVER
LAKE
BLV
D
OLYMPIC BLVD
OLYMPICBLVD
CYPRESS
AV
E
FIG
UERO
A ST
SAN
PEDRO
ST
WES
TER
N A
VE
MAI
N ST
BROA
DWAY
CO
LLIS
AVE
HO
OVE
R S
T
NO
RM
AN
DIE
AVE
ALA
ME
DA
ST
AVEN
UE
64
WIL
TON
PL
AR
LIN
GTO
NAV
E
STA
DIUM
WAY
APC Boundary
Los Angeles City Boundary
Utility Infrastructure
Communications
d Electric Power
%defgc Hazardous Materials
!/ Petroleum & Natural Gas
po Potable Water
! ( Waste WaterTransportation Infrastructure
J Airport Facilities
Ja Bus Systemsú Bridges
I2 Light Rail Facilities
í Port / Harbor
I3 Rail Facilities
Map Data Sources:City of Los Angeles,CalTrans, Hazus 3.2, EPA, USDA
East Los Angeles APC
0 1.5 30.75
Miles
/
Critical InfrastructureFigure 4-10.
City of Los Angeles 2017 Local Hazard Mitigation Plan City of Los Angeles Profile
4-16
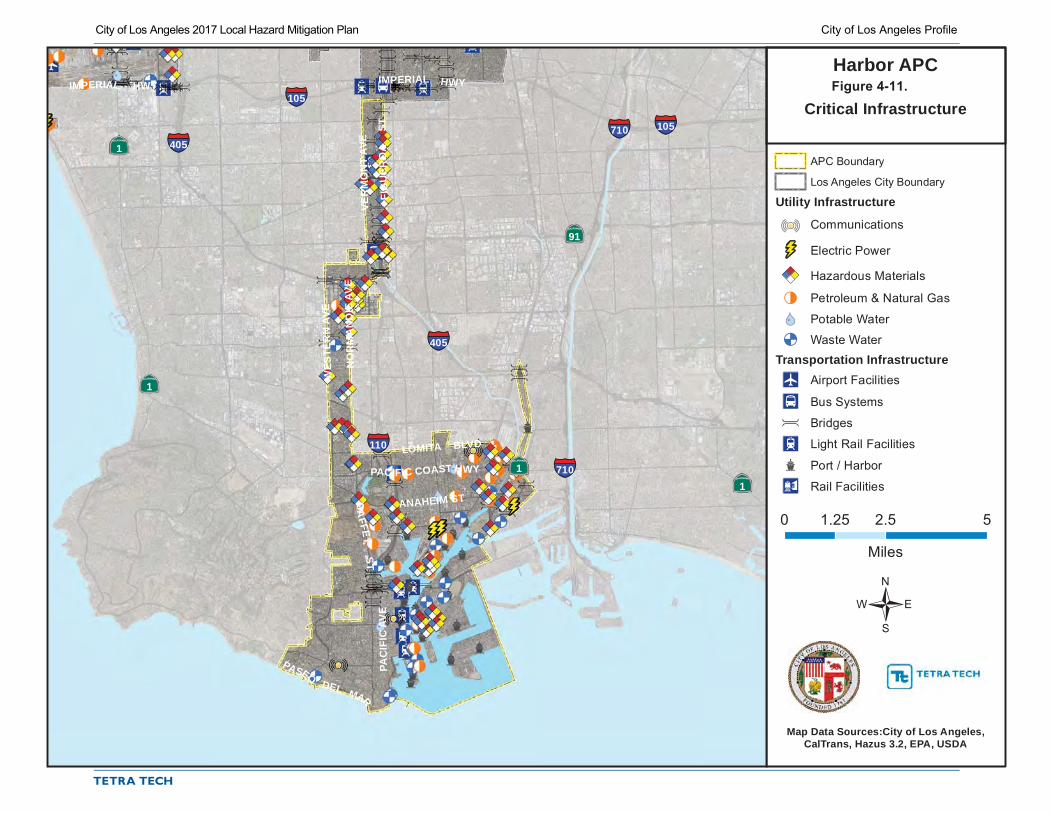
§¦710
§¦710
§¦110
§¦105
§¦105
§¦405
§¦405
ÄÆÅ1
ÄÆÅ1ÄÆÅ1
ÄÆÅ1
ÄÆÅ91
FIG
UE
RO
AST
PACIFIC COAST HWY
IMPERIAL HWY
ANAHEIM ST
PAC
IFIC
AV
E
IMPERIAL HWY
LOMITA BLVD
VER
MO
NT
AVE
GA
FFEYST
PASEODEL MAR
WES
TER
N A
VE
NO
RM
AN
DIE
AV
E
APC Boundary
Los Angeles City Boundary
Utility Infrastructure
Communications
d Electric Power
%defgc Hazardous Materials
!/ Petroleum & Natural Gas
po Potable Water
! ( Waste WaterTransportation Infrastructure
J Airport Facilities
Ja Bus Systemsú Bridges
I2 Light Rail Facilities
í Port / Harbor
I3 Rail Facilities
Map Data Sources:City of Los Angeles,CalTrans, Hazus 3.2, EPA, USDA
Harbor APC
0 2.5 51.25
Miles
/
Critical InfrastructureFigure 4-11.
City of Los Angeles 2017 Local Hazard Mitigation Plan City of Los Angeles Profile
laura.leone
Typewritten Text
4-17

§¦210
§¦5
§¦5
ÄÆÅ110
ÄÆÅ126
ÄÆÅ170
ÄÆÅ2ÄÆÅ134
ÄÆÅ14
ÄÆÅ118ÄÆÅ118
£¤101
£¤101
MELROSE AVE
FALL
BR
OO
K A
VE
ROSCOE BLVD
BEVERLY BLVD
VANOWEN ST
OXNARD STVICTORY BLVD
GLENOAKSBLVD
SUNSET BLVD
VENTURA BLVD
CHATSWORTH ST
SATICOY ST
LAUREL CANYONBLVD
NORDHOFF ST
FOOTHILLBLVD
DEVONSHIRE STLASSEN ST
PLUMMER ST
WIL
BU
R A
VECO
RB
IN A
VE
PARTHENIA ST
TAM
PA
AVE
WIN
NET
KA
AV
E
LIN
DLE
Y AV
EW
HIT
EO
AK
AVE
RIVERSIDE DR
RINALDI ST
BURBANK BLVDWO
OD
LAK
EAV
E
SHERMAN WAY
SESNO NB LVD
LA TUNA CAN YON ROAD
LAN
KE
RSHIM
BLVD
RES
EDA
B
LVD
WOODM
ANA
VE
VIN
ELA
ND
AV
E
PLAT
TAV
E
ARLETA AVE
APC Boundary
Los Angeles City Boundary
Utility Infrastructure
Communications
d Electric Power
%defgc Hazardous Materials
!/ Petroleum & Natural Gas
po Potable Water
! ( Waste WaterTransportation Infrastructure
J Airport Facilities
Ja Bus Systemsú Bridges
I2 Light Rail Facilities
í Port / Harbor
I3 Rail Facilities
Map Data Sources:City of Los Angeles,CalTrans, Hazus 3.2, EPA, USDA
North Valley APC
0 3.5 71.75
Miles
/
Critical InfrastructureFigure 4-12.
City of Los Angeles 2017 Local Hazard Mitigation Plan City of Los Angeles Profile
4-18
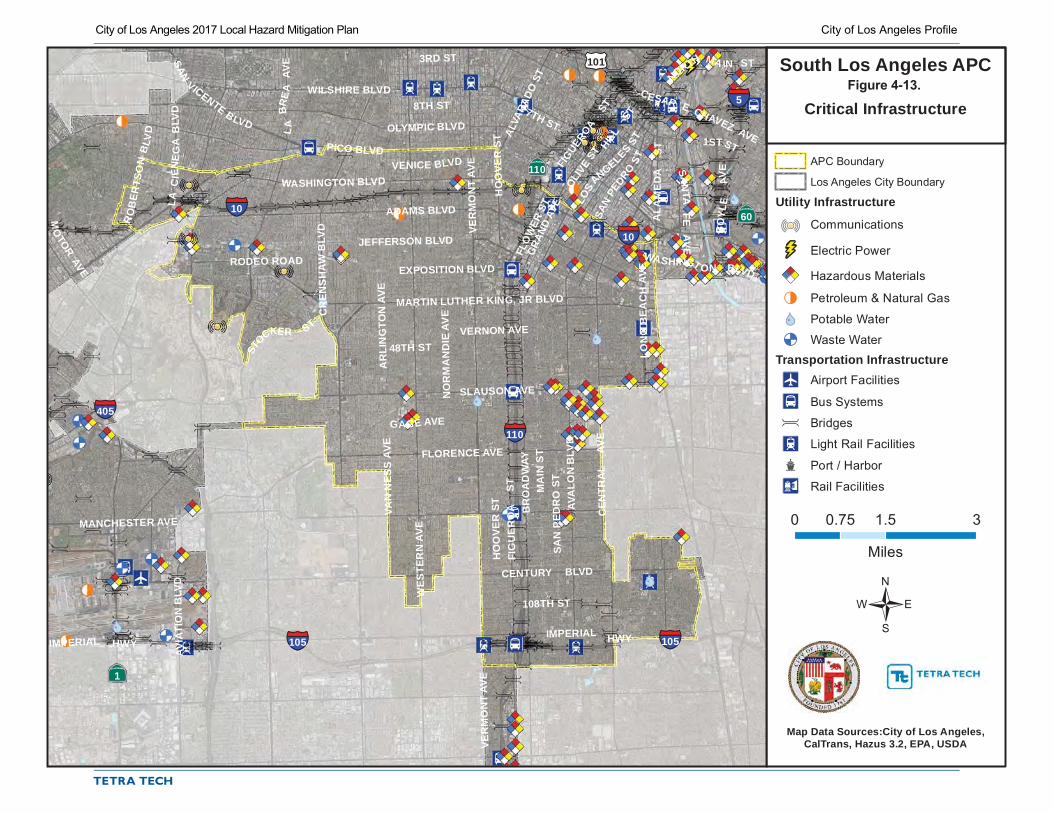
§¦5
§¦405
§¦110
§¦105 §¦105
§¦10
§¦10
ÄÆÅ1
ÄÆÅ60
ÄÆÅ110
£¤101
NORTH MA IN ST3RD ST
GRAN
D AV
E
FLO
WER
ST
HO
OVE
R S
T
1STST
JEFFERSON BLVD
VERNON AVE
MARTIN LUTHER KING, JR BLVD
VER
MO
NT
AVE
48TH ST
SLAUSON AVE
FLORENCE AVE
7TH ST
8TH ST
BO
YLE
AVE
PICO BLVD
NO
RM
AN
DIE
AV
E
IMPERIAL HWY
WES
TER
N A
VE
HILL
ST
SAN
TAFE
AVE
WASHINGT ON BLVD
OLIV
EST
LOS
ANGELESST
CESAR E CHAVEZ AVE
CENTURY BLVD
108TH ST
WASHINGTON BLVD
IMPERIAL HWY
ADAMS BLVD
WILSHIRE BLVD
RODEO ROAD
CR
ENS
HA
W B
LVD
VENICE BLVD
OLYMPIC BLVD
SAN
VICENTE BLVD
EXPOSITION BLVD
MANCHESTER AVE
GAGE AVE
VAN
NES
SAV
E
ALVA
RADO
ST
STOCKER ST
FIGUEROA
ST
FIG
UE
RO
A
ST
AVA
LON
BLV
D
SAN
PEDRO
ST
MA
IN S
T
LA
BRE
AAV
E
MO
TORAVE
CEN
TRA
L AV
E
BR
OA
DW
AY
HO
OVE
R S
T
AVIA
TIO
N B
LVD
VER
MO
NT
AVE
SAN
PED
RO
ST
ALA
ME
DA
STLO
NG
BE
AC
HAV
E
LAC
IEN
EG
AB
LVD
AR
LIN
GTO
N A
VE
RO
BER
TSO
NB
LVD
APC Boundary
Los Angeles City Boundary
Utility Infrastructure
Communications
d Electric Power
%defgc Hazardous Materials
!/ Petroleum & Natural Gas
po Potable Water
! ( Waste WaterTransportation Infrastructure
J Airport Facilities
Ja Bus Systemsú Bridges
I2 Light Rail Facilities
í Port / Harbor
I3 Rail Facilities
Map Data Sources:City of Los Angeles,CalTrans, Hazus 3.2, EPA, USDA
South Los Angeles APC
0 1.5 30.75
Miles
/
Critical InfrastructureFigure 4-13.
City of Los Angeles 2017 Local Hazard Mitigation Plan City of Los Angeles Profile
laura.leone
Typewritten Text
4-19

§¦210
§¦5
§¦405
§¦405
ÄÆÅ1
ÄÆÅ134ÄÆÅ170
ÄÆÅ118ÄÆÅ118
£¤101
£¤101
FALL
BR
OO
K A
VE
ROSCOE BLVD
KES
TER
AVE
PACIF IC COAST HWY
VANOWEN ST
LOU
ISE
AV E
OXNARD ST
VENICE BLVD
GLENOAKSBLVD
VENTURA BLVD
3RD ST
CHATSWORTH ST
SATICOY ST
PICO BLVD
PLUMMER ST
LAUREL CANYONBLVD
NORDHOFF ST
DEVONSHIRE ST
LASSEN ST
FOOTHILLBLVD
OLYMPICBLVD
WIL
BU
R A
VE
CO
RB
IN A
VE
PARTHENIA ST
JEFFERSON BLVD
STRATHERN ST
WO
OD
LEY
AVE
DE
SO
TOAV
E
TAM
PA
AVE
LIN
DLE
Y AV
E
MA
SON
AVE
WH
ITE
OA
KAV
E
RODEO ROAD
SU NSET
BL
VD
SHO
UP
AVE
LAU
RE
LCANYO
NB
LVD
RINALDI ST
BURBANK BLVD
SANTA MONICABLVD
CO
LDW
AT ER
CA
NYO
NAV
E
SANV
ICENTE BLVDC
AH
UEN
GA
B
LVD
SANFERNANDO
ROADSOUTHWEST RDWY
W
ENT
WORTH ST
SHERMAN WAY
WO
OD
LAKE
AVE
CA
NO
GA
AV
E HAY
VEN
HU
RS
T AV
E
VAN
NU
YS
BLV
D
SESNO NBLVD
RES
EDA
B
LVD
L AB
RE
AAV
E
SEPU
LVED
A
BLV
D
WOO
DMAN
AV
EBALB
OA
BLV
D
VIN
ELA
ND
AV
E
PLA
TTAV
E
ARLETA AVE
SATIC OY ST
TO
PAN
GA
CA
NYO
NB
LVD
APC Boundary
Los Angeles City Boundary
Utility Infrastructure
Communications
d Electric Power
%defgc Hazardous Materials
!/ Petroleum & Natural Gas
po Potable Water
! ( Waste WaterTransportation Infrastructure
J Airport Facilities
Ja Bus Systemsú Bridges
I2 Light Rail Facilities
í Port / Harbor
I3 Rail Facilities
Map Data Sources:City of Los Angeles,CalTrans, Hazus 3.2, EPA, USDA
South Valley APC
0 3 61.5
Miles
/
Critical InfrastructureFigure 4-14.
City of Los Angeles 2017 Local Hazard Mitigation Plan City of Los Angeles Profile
4-20
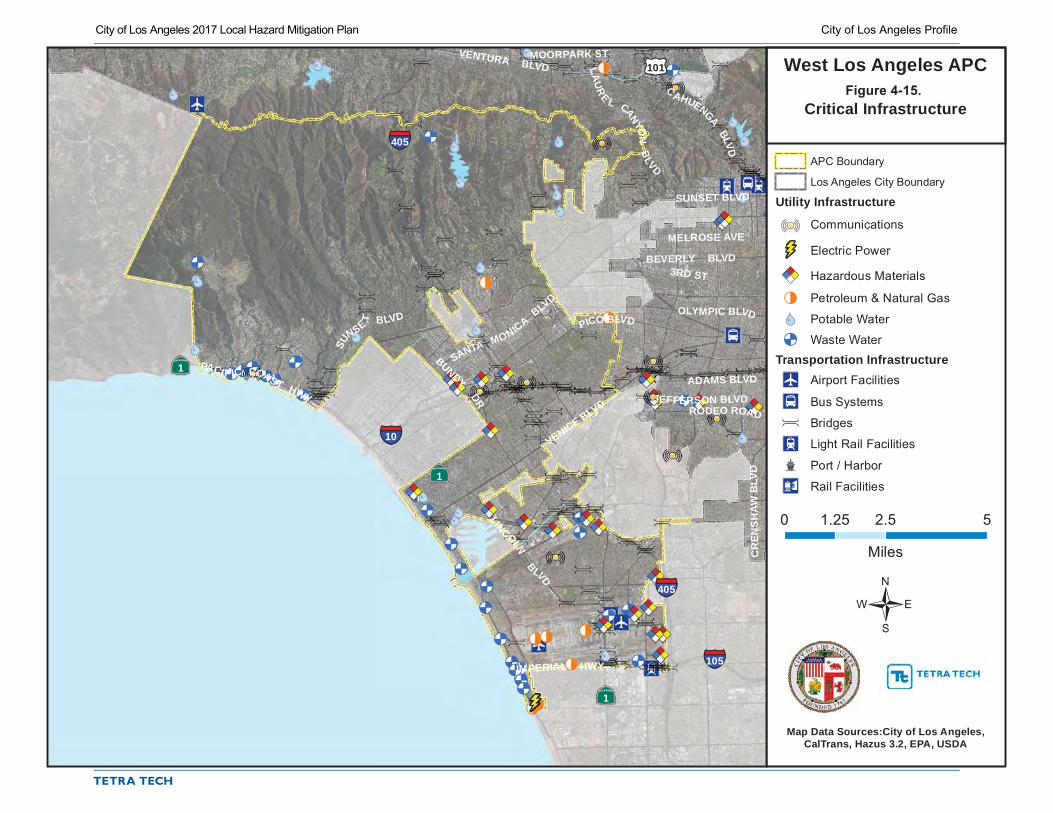
§¦105
§¦10
§¦405
§¦405
ÄÆÅ1
ÄÆÅ1
ÄÆÅ1
£¤101
PICO BLVD
BEVERLY BLVD
PACI F IC COAST HWY
SUNSET BLVD
VENTURA BLVD
LINCOLNBLVD
3RD ST
MOORPARK ST
LAU
RE L CANYO
NB
LVDJEFFERSON BLVD
IMPERIAL HWY
ADAMS BLVD
RODEO ROAD
SUNSE
T BLVD
VENICE BLVD
SANTA MONICABLV
DOLYMPIC BLVD
BUNDY
DR
MELROSE AVE
CR
ENS
HA
W B
LVD
C
AHUENGABLVD
APC Boundary
Los Angeles City Boundary
Utility Infrastructure
Communications
d Electric Power
%defgc Hazardous Materials
!/ Petroleum & Natural Gas
po Potable Water
! ( Waste WaterTransportation Infrastructure
J Airport Facilities
Ja Bus Systemsú Bridges
I2 Light Rail Facilities
í Port / Harbor
I3 Rail Facilities
Map Data Sources:City of Los Angeles,CalTrans, Hazus 3.2, EPA, USDA
West Los Angeles APC
0 2.5 51.25
Miles
/
Critical InfrastructureFigure 4-15.
City of Los Angeles 2017 Local Hazard Mitigation Plan City of Los Angeles Profile
laura.leone
Typewritten Text
4-21

City of Los Angeles 2018 Local Hazard Mitigation Plan City of Los Angeles Profile
4-22
Table 4-5. Planning Area Critical Facilities
Category Central
APC East LA
APC Harbor APC
North Valley APC
South LA APC
South Valley APC
West LA APC Total
Critical Operating Facilities 14 0 1 0 0 3 2 20 Critical Response Facilities Evacuation Centers / Debris Removal 2 1 1 3 1 0 1 9 Fire 17 11 11 17 13 20 17 106 Medical 14 8 1 6 4 11 3 47 Police 6 2 1 4 5 4 2 24 Schools 114 113 43 156 154 163 104 847 Critical Infrastructure—Transportation Airports 0 0 0 2 0 3 2 7 Bridges 151 230 70 286 127 190 134 1,188 Bus Systems 4 3 3 0 4 15 1 30 Light Rail 18 4 2 3 8 1 1 37 Port / Harbor 0 0 35 0 0 0 0 35 Railroads 1 1 0 5 0 2 0 9 Critical Infrastructure—Utilities Communications 6 5 3 6 5 7 5 37 Electric Power 1 0 3 3 0 1 1 9 Hazardous Materials 28 72 64 132 46 48 18 408 Petroleum & Natural Gas 4 0 32 3 3 6 10 58 Potable Water 4 7 3 27 4 8 14 67 Waste Water 1 4 21 0 2 12 45 85 Overall 385 461 294 653 376 494 360 3,023
4.5.3 Future Trends in Development The City’s General Plan governs land use decision and policy-making. This hazard mitigation plan will work together with the General Plan to support wise land use in the future by providing vital information on the risk associated with hazards within the city. The City of Los Angeles will incorporate by reference the Hazard Mitigation Plan Update in its General Plan. This will ensure that all future trends in development can be established with the benefits of the information on risk and vulnerability to hazards identified in this plan.
According to Southern California Public Radio (KPCC 89.30), the number of residential building permits reported in the Los Angeles metro area sharply decreased between 2004 and 2009, followed by a sharp increase after 2009. Permits for housing construction in the Los Angeles metropolitan area declined in 2016 compared to the previous year, a reversal in what had been a steady post-recession recovery, according to figures from the U.S. Census Bureau. (KPCC, 2017). Figure 4-16 shows the trends in residential development projects in the planning area since 2005.
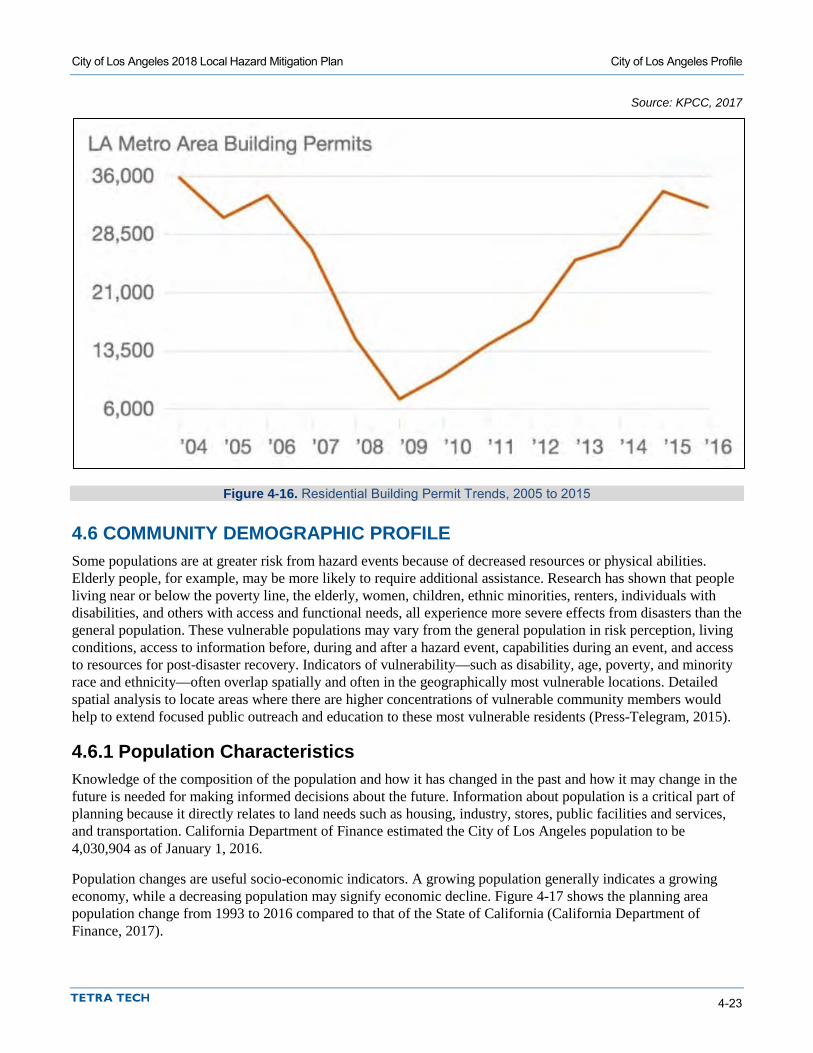
City of Los Angeles 2018 Local Hazard Mitigation Plan City of Los Angeles Profile
4-23
Source: KPCC, 2017
Figure 4-16. Residential Building Permit Trends, 2005 to 2015
4.6 COMMUNITY DEMOGRAPHIC PROFILE Some populations are at greater risk from hazard events because of decreased resources or physical abilities. Elderly people, for example, may be more likely to require additional assistance. Research has shown that people living near or below the poverty line, the elderly, women, children, ethnic minorities, renters, individuals with disabilities, and others with access and functional needs, all experience more severe effects from disasters than the general population. These vulnerable populations may vary from the general population in risk perception, living conditions, access to information before, during and after a hazard event, capabilities during an event, and access to resources for post-disaster recovery. Indicators of vulnerability—such as disability, age, poverty, and minority race and ethnicity—often overlap spatially and often in the geographically most vulnerable locations. Detailed spatial analysis to locate areas where there are higher concentrations of vulnerable community members would help to extend focused public outreach and education to these most vulnerable residents (Press-Telegram, 2015).
4.6.1 Population Characteristics Knowledge of the composition of the population and how it has changed in the past and how it may change in the future is needed for making informed decisions about the future. Information about population is a critical part of planning because it directly relates to land needs such as housing, industry, stores, public facilities and services, and transportation. California Department of Finance estimated the City of Los Angeles population to be 4,030,904 as of January 1, 2016.
Population changes are useful socio-economic indicators. A growing population generally indicates a growing economy, while a decreasing population may signify economic decline. Figure 4-17 shows the planning area population change from 1993 to 2016 compared to that of the State of California (California Department of Finance, 2017).
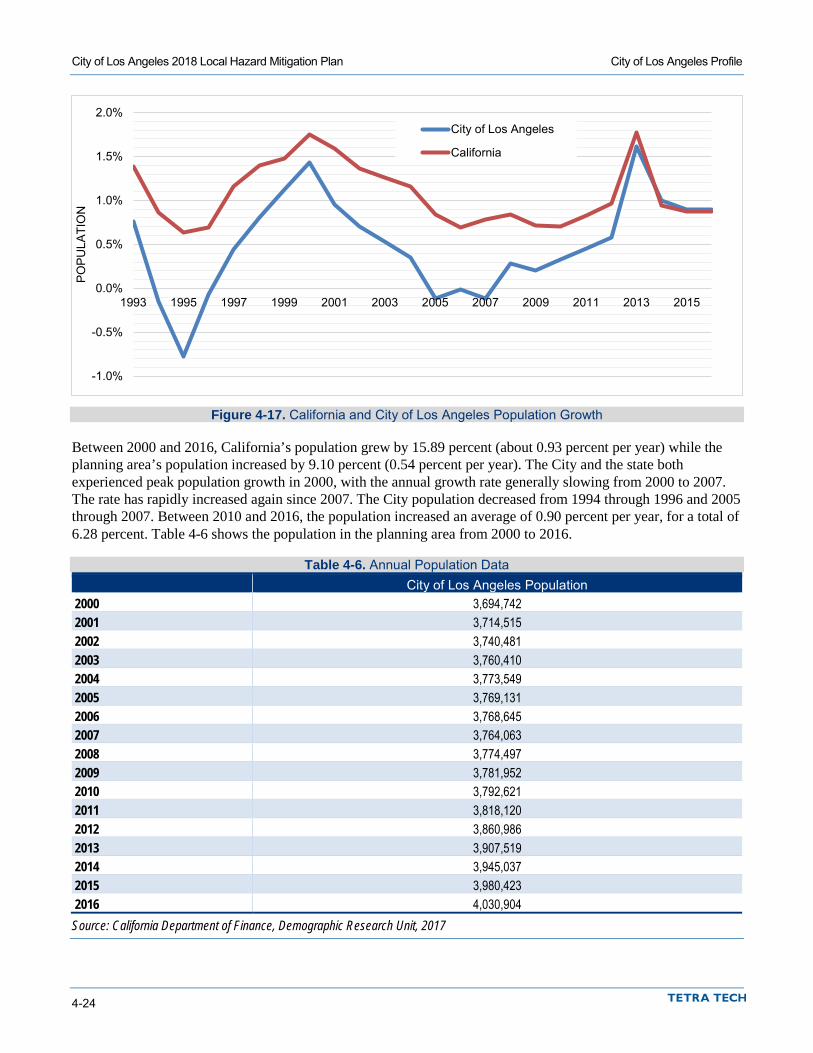
City of Los Angeles 2018 Local Hazard Mitigation Plan City of Los Angeles Profile
4-24
Figure 4-17. California and City of Los Angeles Population Growth
Between 2000 and 2016, California’s population grew by 15.89 percent (about 0.93 percent per year) while the planning area’s population increased by 9.10 percent (0.54 percent per year). The City and the state both experienced peak population growth in 2000, with the annual growth rate generally slowing from 2000 to 2007. The rate has rapidly increased again since 2007. The City population decreased from 1994 through 1996 and 2005 through 2007. Between 2010 and 2016, the population increased an average of 0.90 percent per year, for a total of 6.28 percent. Table 4-6 shows the population in the planning area from 2000 to 2016.
Table 4-6. Annual Population Data City of Los Angeles Population 2000 3,694,742 2001 3,714,515 2002 3,740,481 2003 3,760,410 2004 3,773,549 2005 3,769,131 2006 3,768,645 2007 3,764,063 2008 3,774,497 2009 3,781,952 2010 3,792,621 2011 3,818,120 2012 3,860,986 2013 3,907,519 2014 3,945,037 2015 3,980,423 2016 4,030,904 Source: California Department of Finance, Demographic Research Unit, 2017
-1.0%
-0.5%
0.0%
0.5%
1.0%
1.5%
2.0%
1993 1995 1997 1999 2001 2003 2005 2007 2009 2011 2013 2015
PO
PU
LATI
ON
City of Los Angeles
California

City of Los Angeles 2018 Local Hazard Mitigation Plan City of Los Angeles Profile
4-25
4.6.2 Age Distribution As a group, the elderly are more apt to lack the physical and economic resources necessary for response to hazard events and are more likely to suffer health-related consequences making recovery slower. They are more likely to be vision, hearing, and/or mobility impaired, and more likely to experience mental impairment or dementia. Additionally, the elderly are more likely to live in assisted-living facilities where emergency preparedness occurs at the discretion of facility operators. These facilities are typically identified as “critical facilities” by emergency managers because they require extra notice to implement evacuation. Elderly residents living in their own homes may have more difficulty evacuating their homes and could be stranded in dangerous situations. This population group is more likely to need special medical attention, which may not be readily available during natural disasters due to isolation caused by the event. Specific planning attention for the elderly is an important consideration given the current aging of the American population.
Children under 14 are particularly vulnerable to disaster events because of their young age and dependence on others for basic necessities. Very young children may additionally be vulnerable to injury or sickness; this vulnerability can be worsened during a natural disaster because they may not understand the measures that need to be taken to protect themselves from hazards.
The overall age distribution for the planning area is shown in Figure 4-18. Based on the most recent 5-year estimates from the U.S. Census Bureau’s American Community Survey (2011-2015), 11.2 percent of the planning area’s population is 65 or older. According to U.S. Census data, 38.6 percent of the over-65 population have disabilities of some kind and 16.2 percent have incomes below the poverty line. The City’s population includes 18.1 percent who are 14 or younger. Among children under 18, 32 percent are below the poverty line.
Figure 4-18. Planning Area Age Distribution
0 100,000 200,000 300,000 400,000 500,000 600,000 700,000 800,000
Under 5 years
5 to 9 years
10 to 14 years
15 to 19 years
20 to 24 years
25 to 34 years
35 to 44 years
45 to 54 years
55 to 59 years
60 to 64 years
65 to 74 years
75 to 84 years
85 years and over
Number of People
Age
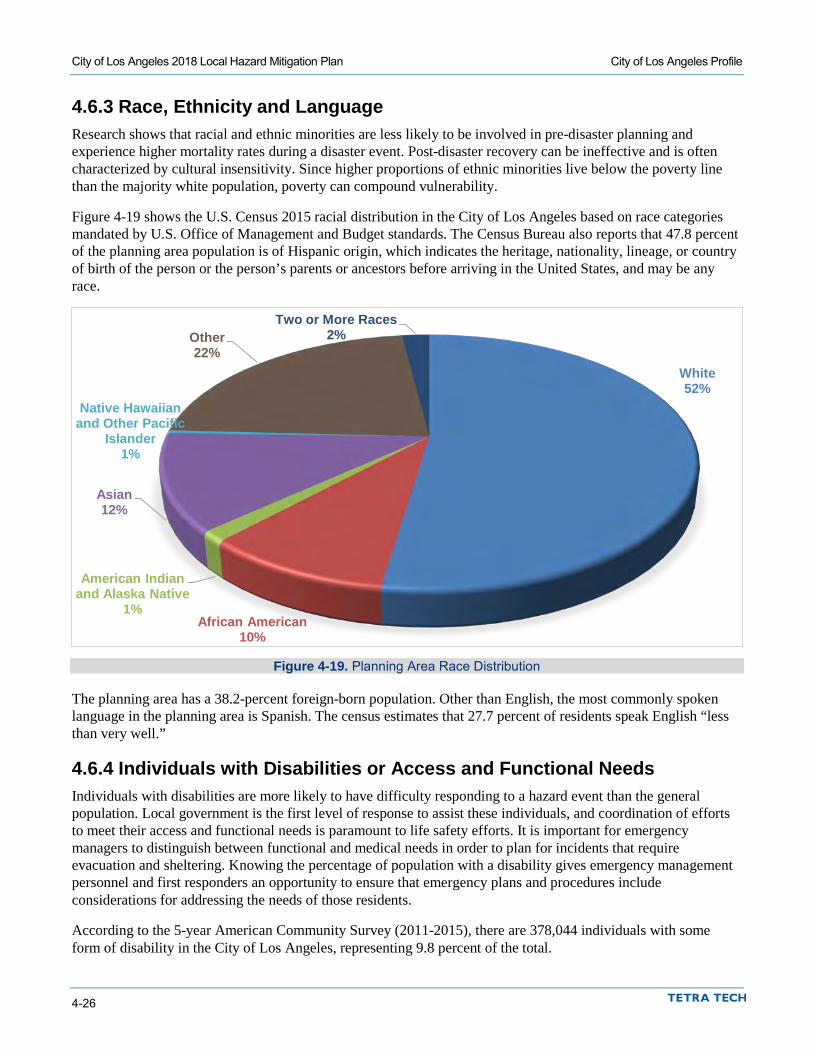
City of Los Angeles 2018 Local Hazard Mitigation Plan City of Los Angeles Profile
4-26
4.6.3 Race, Ethnicity and Language Research shows that racial and ethnic minorities are less likely to be involved in pre-disaster planning and experience higher mortality rates during a disaster event. Post-disaster recovery can be ineffective and is often characterized by cultural insensitivity. Since higher proportions of ethnic minorities live below the poverty line than the majority white population, poverty can compound vulnerability.
Figure 4-19 shows the U.S. Census 2015 racial distribution in the City of Los Angeles based on race categories mandated by U.S. Office of Management and Budget standards. The Census Bureau also reports that 47.8 percent of the planning area population is of Hispanic origin, which indicates the heritage, nationality, lineage, or country of birth of the person or the person’s parents or ancestors before arriving in the United States, and may be any race.
Figure 4-19. Planning Area Race Distribution
The planning area has a 38.2-percent foreign-born population. Other than English, the most commonly spoken language in the planning area is Spanish. The census estimates that 27.7 percent of residents speak English “less than very well.”
4.6.4 Individuals with Disabilities or Access and Functional Needs Individuals with disabilities are more likely to have difficulty responding to a hazard event than the general population. Local government is the first level of response to assist these individuals, and coordination of efforts to meet their access and functional needs is paramount to life safety efforts. It is important for emergency managers to distinguish between functional and medical needs in order to plan for incidents that require evacuation and sheltering. Knowing the percentage of population with a disability gives emergency management personnel and first responders an opportunity to ensure that emergency plans and procedures include considerations for addressing the needs of those residents.
According to the 5-year American Community Survey (2011-2015), there are 378,044 individuals with some form of disability in the City of Los Angeles, representing 9.8 percent of the total.
White52%
African American10%
American Indian and Alaska Native
1%
Asian12%
Native Hawaiian and Other Pacific
Islander1%
Other22%
Two or More Races2%
City of Los Angeles 2018 Local Hazard Mitigation Plan City of Los Angeles Profile
4-27
4.7 ECONOMY
4.7.1 Income In the United States, individual households are expected to use private resources to prepare for, respond to and recover from disasters to some extent. This means that households living in poverty are automatically disadvantaged when confronting hazards. Additionally, the poor typically occupy more poorly built and inadequately maintained housing. Mobile or modular homes, for example, are more susceptible to damage in earthquakes and floods than other types of housing. In urban areas, the poor often live in older houses and apartment complexes, which are more likely to be made of un-reinforced masonry, a building type that is particularly susceptible to damage during earthquakes. Furthermore, residents below the poverty level are less likely to have insurance to compensate for losses incurred from natural disasters. This means that residents below the poverty level have a great deal to lose during an event and are the least prepared to deal with potential losses. The events following Hurricane Katrina in 2005 illustrated that personal household economics significantly impact people’s decisions on evacuation. Individuals who cannot afford gas for their cars will likely decide not to evacuate.
Based on U.S. Census Bureau estimates, per capita income in the planning area in 2015 was $28,761, and the median household income was $50,205. It is estimated that about 12.8 percent of households receive an income between $100,000 and $149,999 per year, and over 14.9 percent of household incomes are above $150,000 annually. About 22 percent of the households in the planning area make less than $25,000 per year and are therefore below the poverty level. The weighted average poverty threshold for a family of four in 2015 was $24,250; for a family of three, $20,090; for a family of two, $15,930.
4.7.2 Industry, Businesses and Institutions The City of Los Angeles has the 16th largest economy in the world (LATCB, 2015). The Port of Los Angeles handles tens of billions of dollars in industry sales. According to the Los Angeles Tourism & Convention Board, the total value of two-way trade handled at the Los Angeles Customs District in 2014 was a record $426 billion. The City is also home to the Los Angeles International (LAX), L.A./Ontario International and Van Nuys airports, generating billions of dollars in revenue and transporting millions of passengers.
Los Angeles is well known for its higher education institutions, events, sports centers, urban and outdoor recreational tourist attractions, shopping enclaves, dining destinations, and arts and cultural institutions. Los Angeles is regarded as the entertainment capital of the world and is leading in several growth industries, including the fashion, health services/biomedical, and aerospace/technology industries (LATCB, 2015).
The planning area’s economy is strongly based in the education/health care/social service industry (22.2 percent), followed by the professional/scientific/management/administrative industry (15.1 percent), and arts/ entertainment/recreation industry (12.8 percent). Natural resource industries (<1 percent), and public administration (2.8 percent) make up the smallest sources of the local economy. Figure 4-20 shows the breakdown of industry types in the planning area. According to the Los Angeles Tourism & Convention Board, leisure and hospitality is a leading industry in Los Angeles, employing 464,600 individuals in 2014. The apparel, health care, aerospace product and manufacturing, entertainment industries also employ thousands of employees and generate billions of dollars in revenue.

City of Los Angeles 2018 Local Hazard Mitigation Plan City of Los Angeles Profile
4-28
Figure 4-20. Industry in the Planning Area
Online data sources identify the following large employers in Los Angeles County (CA EDD, LA Business Journal, LA Almanac, 2017):
• Government organizations—Los Angeles County, Los Angeles Unified Schools, the City of Los Angeles, the federal government and the State of California
• Universities—The University of California Los Angeles, the University of Southern California and the California Institute of Technology
• Large health-care providers—Kaiser Permanente, Cedars-Sinai Medical Center, Providence Health and Services, Long Beach Memorial Medical Center, Children’s Hospital of Los Angeles and Adventist Health
• Large defense contractors—Northrop Grumman Corporation, the Boeing Company, Raytheon Company and Lockheed Martin Corporation
• Major employers in retail—Kroger, Target, The Home Depot, Von’s and Costco • Banks—Bank of America, Wells Fargo, and J.P. Morgan Chase • Entertainment industry—FX Networks, Walt Disney Company, Warner Bros. Entertainment Inc. and
Sony Pictures Entertainment • Other major employers—VXI Global Solutions call centers, American Apparel, Farmers Insurance
Group, UPS, and AT&T Inc.
Agriculture, forestry, fishing and hunting, and
mining0.3%
Construction3.2%
Manufacturing5.6%
Wholesale trade2.3%
Retail trade10.9%
Transportation and warehousing, and
utilities4.1%
Information8.8%
Finance and insurance, and real
estate and rental and leasing
7.2%
Professional, scientific, and
management, and administrative and waste management
services15.1%
Educational services, and
health care and social assistance
22.2%Arts, entertainment, and recreation, and
accommodation and food services
12.8%
Other services4.7%
Public administration
2.8%

City of Los Angeles 2018 Local Hazard Mitigation Plan City of Los Angeles Profile
4-29
4.7.3 Employment Trends and Occupations According to the 5-year American Community Survey (2011-2015), about 66.2 percent of the City of Los Angeles’s population 16 years old or older is in the labor force. Of the working-age population, 40.6 percent of men and 59.4 percent of women are in the labor force.
Figure 4-21 compares state and city unemployment trends from 1995 through 2016. The City of Los Angeles unemployment rate was lowest in 2006 at 5.3 percent. The rate peaked at 13.8 percent in 2010, and has declined since then. The City unemployment rate has generally been slightly higher than the statewide rate.
Figure 4-21. California and City of Los Angeles Unemployment Rate
Figure 4-22 shows Census Bureau estimates of employment distribution by occupation category. Management, business, science and arts occupations make up 36 percent of the jobs in the City of Los Angeles. Sales and office occupations make up 23 percent of the local working population.
The U.S. Census estimates that over 67.9 percent of workers in the planning area commute alone (by car, truck or van) to work, and mean travel time to work is 30.1 minutes.
0.00
2.00
4.00
6.00
8.00
10.00
12.00
14.00
16.00
1995 1997 1999 2001 2003 2005 2007 2009 2011 2013 2015
UN
EM
PLO
YME
NT
RA
TE (%
)
California
City of Los Angeles

City of Los Angeles 2018 Local Hazard Mitigation Plan City of Los Angeles Profile
4-30
Figure 4-22. Occupations in the City of Los Angeles
4.8 VULNERABLE COMMUNITIES Nine of the 10 most vulnerable communities in Los Angeles County are located within the City of Los Angeles, according to the Red Cross’ PrepareLA Vulnerable Communities Project (American Red Cross, 2014). These communities do not align within the Area Planning Commissions for the City of Los Angeles.
These are Westlake, Historic South-Central, South Park, Central-Alameda, Pico Union, Florence, Watts, Boyle Heights, and Koreatown. They were selected based on eight indicators of vulnerability: race/ethnicity and poverty, single parent head of household, educational attainment, limited English language proficiency, car-less households, age dependency ratio, population density, and the presence of access and functional needs population.
The Office of Environmental Health Hazard Assessment, on behalf of the California Environmental Protection Agency, identified California communities that are disproportionately burdened by many sources of pollution and are socioeconomically disadvantaged. Each of these communities was afforded a CalEnviroScreen score. A significantly above average score was given to each of the City of Los Angeles’ most vulnerable communities. The PrepareLA project confirmed the high CalEnviroScreen scores, showing that each of the most vulnerable communities has a high presence of facilities or railway lines that contribute to air pollution. Statistics indicating these communities’ vulnerability are summarized in Table 4-7 through Table 4-9. The following sections offer discussions of each individual community.
Management, Business, Science
and Arts36%
Service21%
Sales & Office23%
Natural Resources, Construction and
Maintenance8%
Production, Transportation, and
Material Moving12%

City of Los Angeles 2018 Local Hazard Mitigation Plan City of Los Angeles Profile
4-31
Table 4-7. Vulnerable Neighborhood Community Assets
Neighborhood
Emergency Response
Facilities Assets
Healthcare Facilities Assets
Open Space & Recreation Centers Assets
Community Serving Organization Assets
Westlake 9 20 Recreation facilities near MacArthur Park 30 Historic South-Central 8 11 2 20 South Park 3 3 2 4 Central-Alameda 8 3 4 19 Pico Union 7 5 7 19 Florence 4 4 0 5 Watts 11 3 No information 29 Boyle Heights 17 30 25 42 Koreatown 7 9 4 50 Source: American Red Cross Los Angeles Region (2014). “PrepareLA– Vulnerable Communities Project.” Los Angeles, CA.
Table 4-8. Vulnerable Neighborhood Hazards
Neighborhood CalEnviro-
Screen Score Earthquake
Liquefaction Zone Risk Air Pollutants Risk Flooding
Risk Extreme Heat Risk Westlake 71-100% NE portion of the
neighborhood west of Glendale Blvd.
1 hazardous waste facility at NW corner
Around lake at MacArthur
Park
Moderate, 13 exceptionally high temperatures/year
Historic South-Central
86-100% SW corner of the district near Vernon Avenue
2 point source facilities Low Moderate, 13 exceptionally high temperatures/year
South Park 86-100% 2/3 of the area 1 railway line, 1 hazardous waste facility in SE portion
of the district
Low Moderate, 13 exceptionally high temperatures/year
Central-Alameda
76-100% Southern portion 2 hazardous waste facilities, 2 point source facilities, 2 railway lines
Low Moderate, 13 exceptionally high temperatures/year
Pico Union 76-95% Low risk 1 point source facility Low Moderate, 13 exceptionally high temperatures/year
Florence 86-100% Entire area Several railway lines 3 point source facilities
Low Moderate
Watts 61-100% Entire area 1 hazardous waste facility, 2 railway lines
Low Moderate
Boyle Heights 56-90% Northern portions Several railway lines, 7 hazardous waste facilities,
6 point source facilities
Low Moderate
Koreatown 47-79% Low risk Low High Moderate Source: American Red Cross Los Angeles Region (2014). “PrepareLA– Vulnerable Communities Project.” Los Angeles, CA.

City of Los Angeles 2018 Local Hazard Mitigation Plan City of Los Angeles Profile
4-32
Table 4-9. Vulnerable Neighborhood Race/Ethnicity, Educational Attainment, and Language Ability
Neighborhood Population Race/Ethnicity
Other Than White Educational Attainment (HS Diploma or Higher)
Speak English Less Than Very Well/ Non-English Languages
Westlake 104,246 95.2% 54.4% 58.4% (Spanish, Korean, Tagalog) Historic South-Central 46,892 98.8% 34.9% 58.4% (Spanish, Korean, Thai) South Park 32,938 98.8% 39.8% 48.5% (Spanish, Korean, Thai) Central-Alameda 42,124 99.5% 33.6% 48.5% (Spanish, Korean, Thai) Pico Union 41,545 96.4% 46.5% 59.8% (Spanish, Korean, Tagalog) Florence 47,839 99.1% 42.5% 44.7% (Spanish, Cambodian, Mon-Kmer) Watts 39,362 99.3% 46.4% 31.8% (Spanish, Korean, Japanese) Boyle Heights 89,498 97.8% 45.4% 51.6% (Spanish, Chinese, Tagalog) Koreatown 108,363 92.5% 69.5% 56.6% (Spanish, Korean, Tagalog) Source: American Red Cross Los Angeles Region (2014). “PrepareLA– Vulnerable Communities Project.” Los Angeles, CA.
4.8.1 Westlake Community Westlake is a commercial neighborhood in central Los Angeles near MacArthur Park, bordered by Silver Lake, Echo Park, Downtown, Pico-Union, and Koreatown. With over 100,000 residents in 2.72 square miles (46,201 people per square mile), it is the second densest neighborhood in Los Angeles County. The median household income is low, with 67.4 percent below 200 percent of the federal poverty line. The percent of households without access to a vehicle is 35.4 percent. An age dependency ratio of 47 percent means that for every 100 working age adults there are 47 dependents, a rate slightly lower than the city’s other vulnerable communities.
4.8.2 Historic South-Central Community Historic South-Central is 3 miles southwest of Downtown Los Angeles, east of the I-110 freeway and south of the I-10 freeway. Almost 47,000 residents live within in a 2.5-square-mile area, placing it among the city’s 20 densest neighborhoods. Historic South-Central’s population is more than 77 percent low-income and almost 45 percent single-parent households. Just over one-quarter of all households do not have a car. The number of dependents in the area is slightly higher than average, with 62 dependents for every 100 working age adults.
4.8.3 South Park Community South Park is just south of Historic South-Central, east of the I-110 freeway and bounded by Vernon Avenue to the north and Slauson Avenue to the south. The neighborhood is home to just under 33,000 people and covers 1.4 square miles. With over 24,000 people per square mile, it is one of Los Angeles County’s densest communities. One in five households does not have a vehicle and an age dependency ratio of 68.9 percent means that for every 100 working age adults there are nearly 70 dependents.
4.8.4 Central-Alameda Community The Central-Alameda district is just east of Historic South-Central and South Park. It is bounded by Central Avenue to the west, Slauson Street to the south, Alameda Street to the East, and Washington Boulevard to the north. The neighborhood has over 42,000 residents and covers 2.2 square miles, placing it among the city’s 20 densest neighborhoods. More than two-thirds of households are low-income. Just 33 percent of residents over the age of 25 hold at least a high school diploma. One in five households does not have a vehicle. For every 100 working age adults there are about 66 dependents.
City of Los Angeles 2018 Local Hazard Mitigation Plan City of Los Angeles Profile
4-33
4.8.5 Pico Union Community The Pico-Union district is immediately south of the Westlake and Koreatown neighborhoods. It is bounded by Olympic Boulevard on the north, the I-110 freeway to the east, and the I-10 freeway to the south. Over 41,000 people reside in its 1.67 square miles, making it one of the County’s densest communities. More than 71 percent are low-income. More than half the population over the age of 25 does not hold a high school diploma or its equivalent. Three in 10 households lack a vehicle. There are 52 dependents for every 100 working age adults.
4.8.6 Florence Community The Florence neighborhood is just south of Historic South-Central and South Park. Just fewer than 48,000 people reside within its 2.8 square miles. Florence has 71.4 percent low-income households, and more than 44 percent are headed by a single parent.
4.8.7 Watts Community Watts lies north of the I-105 freeway and contains the public housing developments of Imperial Courts, Jordan Downs, and Nickerson Gardens. The area of Watts is 2.1 square miles, with just under 40,000 people, ranking it among the city’s 10 densest neighborhoods. Over 71 percent are low-income. Nearly 20 percent of households lack an automobile. The age dependency ratio in Watts is the highest among the most vulnerable communities, with 84 dependents for every 100 working age adults.
4.8.8 Boyle Heights Community Boyle Heights is a mainly residential neighborhood just east of the Los Angeles River and west of Indiana Street. Over 89,000 people live in its area of 6.5 square miles. Nearly 70 percent of households are low-income and almost 21 percent of households do not have access to a vehicle. The age dependency ratio is high, with almost 70 dependents for every 100 working age adults.
4.8.9 Koreatown Community Koreatown is just west of Westlake. The district is home to over 108,000 people and covers 2.7 square miles. With a population density of nearly 52,000 people per square mile, it is one of the densest areas of both the City and County of Los Angeles. Nearly 60 percent of households are low-income. Almost 28 percent do not have access to a vehicle. Just fewer than 25 percent of households are headed by a single parent.
4.9 LAWS AND ORDINANCES Existing laws, ordinances, plans and programs at the federal, state and local level can support or impact hazard mitigation actions identified in this plan. Hazard mitigation plans are required to include a review and incorporation, if appropriate, of existing plans, studies, reports, and technical information as part of the planning process (44 CFR, Section 201.6(b)(3)). The following federal and state programs have been identified as programs that may interface with the actions identified in this plan. Each of these programs enhances capabilities to implement the mitigation actions in this plan or has a nexus with the mitigation actions in this plan. The purpose of this section is to inform a thorough review of local capability to implement the actions, as presented in in Section 4.9.4.

City of Los Angeles 2018 Local Hazard Mitigation Plan City of Los Angeles Profile
4-34
4.9.1 Federal
Disaster Mitigation Act The DMA is the current federal legislation addressing hazard mitigation planning. It emphasizes planning for disasters before they occur. It specifically addresses planning at the local level, requiring plans to be in place before Hazard Mitigation Assistance grant funds are available to communities. This plan is designed to meet the requirements of DMA, improving eligibility for future hazard mitigation funds.
Emergency Watershed Program The USDA Natural Resources Conservation Service (NRCS) administers the Emergency Watershed Protection (EWP) Program, which responds to emergencies created by natural disasters. Eligibility for assistance is not dependent on a national emergency declaration. The program is designed to help people and conserve natural resources by relieving imminent hazards to life and property caused by floods, fires, windstorms, and other natural occurrences. EWP is an emergency recovery program. Financial and technical assistance are available for the following activities (Natural Resources Conservation Service, 2016):
• Remove debris from stream channels, road culverts, and bridges • Reshape and protect eroded banks • Correct damaged drainage facilities • Establish cover on critically eroding lands • Repair levees and structures • Repair conservation practices.
This federal program has objectives similar to those of the Disaster Mitigation Act and could be a funding source for actions identified in this plan.
Emergency Relief for Federally Owned Roads Program The U.S. Forest Service’s Emergency Relief for Federally Owned Roads Program was established to assist federal agencies with repair or reconstruction of tribal transportation facilities, federal lands transportation facilities, and other federally owned roads that are open to public travel and have suffered serious damage by a natural disaster over a wide area or by a catastrophic failure. The program funds both emergency and permanent repairs (Office of Federal Lands Highway, 2016). Eligibility under this program corresponds with some of the goals and objectives for this plan, so this could be a funding source for actions identified in this plan.
National Flood Insurance Program The National Flood Insurance Program (NFIP) makes federally backed flood insurance available to homeowners, renters, and business owners in participating communities. For most participating communities, FEMA has prepared a detailed Flood Insurance Study. The study presents water surface elevations for floods of various magnitudes, including the 1-percent annual-chance flood (called the 100-year flood or base flood) and the 0.2-percent annual chance flood (the 500-year flood). Base flood elevations and the boundaries of the 1-percent-annual-chance and 0.2-percent-annual-chance floodplains are shown on Flood Insurance Rate Maps (FIRMs), which are the principle tool for identifying the extent and location of the flood hazard. FIRMs are the most detailed and consistent data source available, and for many communities they represent the minimum area of oversight under the local floodplain management program. In recent years, FIRMs have been digitized as Digital Flood Insurance Rate Maps (DFIRMs), which are more accessible to residents, local government and stakeholders.
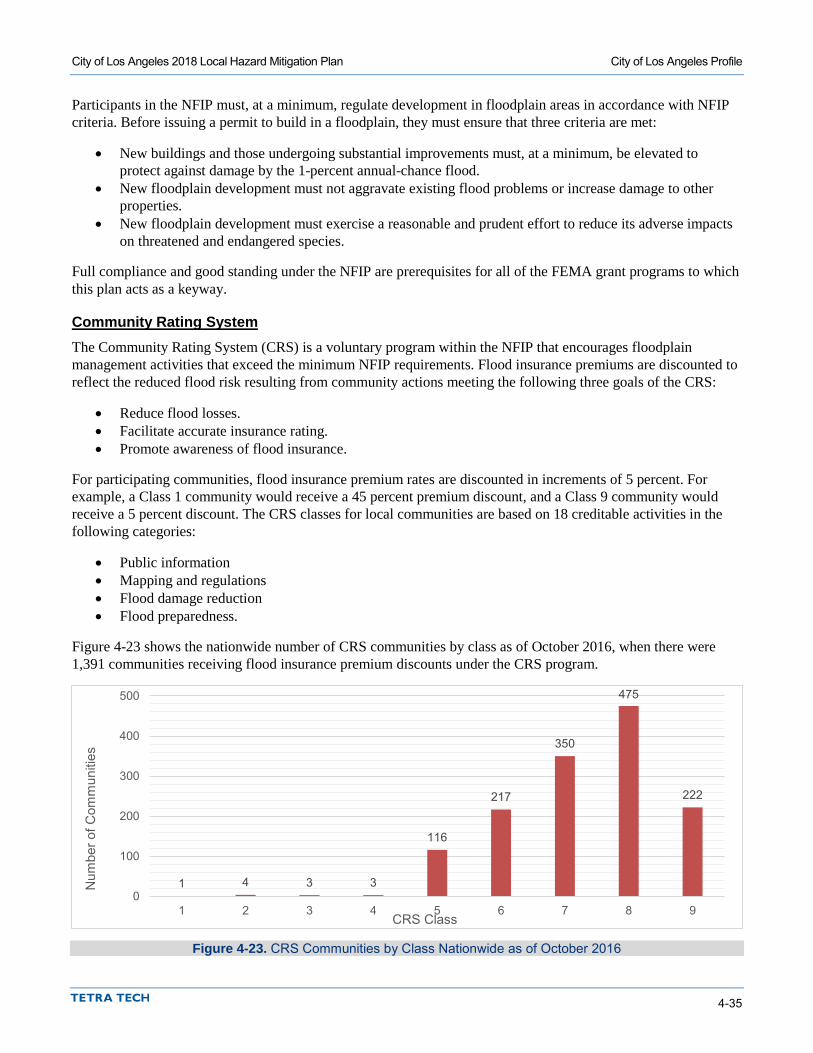
City of Los Angeles 2018 Local Hazard Mitigation Plan City of Los Angeles Profile
4-35
Participants in the NFIP must, at a minimum, regulate development in floodplain areas in accordance with NFIP criteria. Before issuing a permit to build in a floodplain, they must ensure that three criteria are met:
• New buildings and those undergoing substantial improvements must, at a minimum, be elevated to protect against damage by the 1-percent annual-chance flood.
• New floodplain development must not aggravate existing flood problems or increase damage to other properties.
• New floodplain development must exercise a reasonable and prudent effort to reduce its adverse impacts on threatened and endangered species.
Full compliance and good standing under the NFIP are prerequisites for all of the FEMA grant programs to which this plan acts as a keyway.
Community Rating System The Community Rating System (CRS) is a voluntary program within the NFIP that encourages floodplain management activities that exceed the minimum NFIP requirements. Flood insurance premiums are discounted to reflect the reduced flood risk resulting from community actions meeting the following three goals of the CRS:
• Reduce flood losses. • Facilitate accurate insurance rating. • Promote awareness of flood insurance.
For participating communities, flood insurance premium rates are discounted in increments of 5 percent. For example, a Class 1 community would receive a 45 percent premium discount, and a Class 9 community would receive a 5 percent discount. The CRS classes for local communities are based on 18 creditable activities in the following categories:
• Public information • Mapping and regulations • Flood damage reduction • Flood preparedness.
Figure 4-23 shows the nationwide number of CRS communities by class as of October 2016, when there were 1,391 communities receiving flood insurance premium discounts under the CRS program.
Figure 4-23. CRS Communities by Class Nationwide as of October 2016
1 4 3 3
116
217
350
475
222
0
100
200
300
400
500
1 2 3 4 5 6 7 8 9
Num
ber o
f Com
mun
ities
CRS Class

City of Los Angeles 2018 Local Hazard Mitigation Plan City of Los Angeles Profile
4-36
CRS activities can help to save lives and reduce property damage. Communities participating in the CRS represent a significant portion of the nation’s flood risk; over 66 percent of the NFIP’s policy base is located in these communities. Communities receiving premium discounts through the CRS range from small to large and represent a broad mixture of flood risks, including both coastal and riverine flood risks. The City of Los Angeles has participated in the CRS program since 1991. Many of the programs the City is receiving credit for under the CRS program strive to reduce the impacts from flood-related hazards within the City.
Presidential Executive Orders 11988 and 13690 Executive Order 11988 requires federal agencies to avoid to the extent possible the long and short-term adverse impacts associated with the occupancy and modification of floodplains and to avoid direct and indirect support of floodplain development wherever there is a practicable alternative. It requires federal agencies to provide leadership and take action to reduce the risk of flood loss, minimize the impact of floods on human safety, health, and welfare, and restore and preserve the natural and beneficial values of floodplains. The requirements apply to the following activities (FEMA, 2015a):
• Acquiring, managing, and disposing of federal lands and facilities • Providing federally undertaken, financed, or assisted construction and improvements • Conducting federal activities and programs affecting land use, including but not limited to water and
related land resources planning, regulation, and licensing.
Executive Order 13690 expands Executive Order 11988 and acknowledges that the impacts of flooding are anticipated to increase over time due to the effects of climate change and other threats. It mandates a federal flood risk management standard to increase resilience against flooding and help preserve the natural values of floodplains. This standard expands management of flood issues from the current base flood level to a higher vertical elevation and corresponding horizontal floodplain. The goal is to address current and future flood risk and ensure that projects funded with taxpayer dollars last as long as intended (Office of the Press Secretary, 2015). All actions identified in this plan will seek full compliance with all presidential executive orders that may interface with the given action.
The Clean Water Act The federal Clean Water Act (CWA) employs regulatory and non-regulatory tools to reduce direct pollutant discharges into waterways, finance municipal wastewater treatment facilities, and manage polluted runoff. These tools are employed to achieve the broader goal of restoring and maintaining the chemical, physical, and biological integrity of the nation’s surface waters so that they can support “the protection and propagation of fish, shellfish, and wildlife and recreation in and on the water.”
Evolution of CWA programs over the last decade has included a shift from a program-by-program, source-by-source, pollutant-by-pollutant approach to more holistic watershed-based strategies. Under the watershed approach, equal emphasis is placed on protecting healthy waters and restoring impaired ones. A full array of issues are addressed, not just those subject to CWA regulatory authority. Involvement of stakeholder groups in the development and implementation of strategies for achieving and maintaining water quality and other environmental goals is a hallmark of this approach.
The CWA is important to hazard mitigation in several ways. There are often permitting requirements for any construction within 200 feet of water of the United States, which may have implications for mitigation projects identified by a local jurisdiction. Additionally, CWA requirements apply to wetlands, which serve important functions related to preserving and protecting the natural and beneficial functions of floodplains and are linked with a community’s floodplain management program. Finally, the National Pollutant Discharge Elimination
City of Los Angeles 2018 Local Hazard Mitigation Plan City of Los Angeles Profile
4-37
System is part of the CWA and addresses local stormwater management programs. Stormwater management plays a critical role in hazard mitigation by addressing urban drainage or localized flooding issues within jurisdictions.
Any action identified in this plan that has overlap with the scope of the CWA will need to comply with the act. All FEMA hazard mitigation project grant applications require full compliance with all federal acts that may interface with the action.
Presidential Executive Order 11990 Executive Order 11990 requires federal agencies to provide leadership and take action to minimize the destruction, loss or degradation of wetlands, and to preserve and enhance the natural and beneficial values of wetlands. The requirements apply to the following activities (National Archives, 2016):
• Acquiring, managing, and disposing of federal lands and facilities • Providing federally undertaken, financed, or assisted construction and improvements • Conducting federal activities and programs affecting land use, including but not limited to water and
related land resources planning, regulation, and licensing.
All actions identified in this plan will seek full compliance with all presidential executive orders that may interface with the given action.
Endangered Species Act The federal Endangered Species Act (ESA) was enacted in 1973 to conserve species facing depletion or extinction and the ecosystems that support them. The act sets forth a process for determining which species are threatened and endangered and requires the conservation of the critical habitat in which those species live. The ESA provides broad protection for species of fish, wildlife and plants that are listed as threatened or endangered. Provisions are made for listing species, as well as for recovery plans and the designation of critical habitat for listed species. The ESA outlines procedures for federal agencies to follow when taking actions that may jeopardize listed species and contains exceptions and exemptions. It is the enabling legislation for the Convention on International Trade in Endangered Species of Wild Fauna and Flora. Criminal and civil penalties are provided for violations of the ESA and the Convention.
Federal agencies must seek to conserve endangered and threatened species and use their authorities in furtherance of the ESA’s purposes. The ESA defines three fundamental terms:
• Endangered means that a species of fish, animal or plant is “in danger of extinction throughout all or a significant portion of its range.” (For salmon and other vertebrate species, this may include subspecies and distinct population segments.)
• Threatened means that a species “is likely to become endangered within the foreseeable future.” Regulations may be less restrictive for threatened species than for endangered species.
• Critical habitat means “specific geographical areas that are…essential for the conservation and management of a listed species, whether occupied by the species or not.”
Five sections of the ESA are of critical importance to understanding it:
• Section 4: Listing of a Species—The National Oceanic and Atmospheric Administration Fisheries Service (NOAA Fisheries) is responsible for listing marine species; the U.S. Fish and Wildlife Service is responsible for listing terrestrial and freshwater aquatic species. The agencies may initiate reviews for listings, or residents may petition for them. A listing must be made “solely on the basis of the best scientific and commercial data available.” After a listing has been proposed, agencies receive comment and conduct further scientific reviews for 12 to 18 months, after which they must decide if the listing is
City of Los Angeles 2018 Local Hazard Mitigation Plan City of Los Angeles Profile
4-38
warranted. Economic impacts cannot be considered in this decision, but it may include an evaluation of the adequacy of local and state protections. Critical habitat for the species may be designated at the time of listing.
• Section 7: Consultation—Federal agencies must ensure that any action they authorize, fund, or carry out is not likely to jeopardize the continued existence of a listed or proposed species or adversely modify its critical habitat. This includes private and public actions that require a federal permit. Once a final listing is made, non-federal actions are subject to the same review, termed a “consultation.” If the listing agency finds that an action will “take” a species, it must propose mitigations or “reasonable and prudent” alternatives to the action; if the proponent rejects these, the action cannot proceed.
• Section 9: Prohibition of Take—It is unlawful to “take” an endangered species, including killing or injuring it or modifying its habitat in a way that interferes with essential behavioral patterns, including breeding, feeding or sheltering.
• Section 10: Permitted Take—Through voluntary agreements with the federal government that provide protections to an endangered species, a non-federal applicant may commit a take that would otherwise be prohibited as long as it is incidental to an otherwise lawful activity (such as developing land or building a road). These agreements often take the form of a “Habitat Conservation Plan.”
• Section 11: Citizen Lawsuits—Civil actions initiated by any citizen can require the listing agency to enforce the ESA’s prohibition of taking or to meet the requirements of the consultation process.
Any action identified in this plan that has overlap with the ESA will need to comply with the act. All FEMA hazard mitigation project grant applications require full compliance with all federal acts that may interface with the action.
National Environmental Policy Act The National Environmental Policy Act (NEPA) requires federal agencies to consider the environmental impacts of proposed actions and reasonable alternatives to those actions, alongside technical and economic considerations. NEPA established the Council on Environmental Quality (CEQ), whose regulations (40 CFR Parts 1500-1508) set the standard for NEPA compliance. Consideration of environmental impacts and decision-making process is documented in an environmental impact statement or environmental assessment. Environmental impact assessment requires the evaluation of reasonable alternatives to a proposed action, solicitation of input from organizations and individuals that could be affected, and the unbiased presentation of direct, indirect, and cumulative environmental impacts. Any action identified in this plan that has overlap with the scope of NEPA will need to comply with the act. All FEMA hazard mitigation project grant applications require full compliance with all federal acts that may interface with the action.
National Incident Management System The National Incident Management System (NIMS) is a systematic approach for government, nongovernmental organizations, and the private sector to work together to manage incidents involving hazards. The NIMS provides a flexible but standardized set of incident management practices. Incidents typically begin and end locally, and they are managed at the lowest possible geographical, organizational, and jurisdictional level. In some cases, success depends on the involvement of multiple jurisdictions, levels of government, functional agencies, and emergency responder disciplines. These cases necessitate coordination across a spectrum of organizations. Communities using NIMS follow a comprehensive national approach that improves the effectiveness of emergency management and response personnel across the full spectrum of potential hazards (including natural hazards, technological hazards, and human-caused hazards) regardless of size or complexity. Although participation is voluntary, federal departments and agencies are required to make adoption of NIMS by local and state jurisdictions a condition to receive federal preparedness grants and awards.
City of Los Angeles 2018 Local Hazard Mitigation Plan City of Los Angeles Profile
4-39
Hazard mitigation is one of the four phases of emergency management (preparedness, response, recovery and mitigation), and this plan is a viable support tool for any of these phases. Since NIMS is a response function, information in the hazard mitigation plan can support the implementation and update of all NIMS-compliant plans within the City.
Americans with Disabilities Act The Americans with Disabilities Act (ADA) seeks to prevent discrimination against people with disabilities in employment, transportation, public accommodation, communications, and government activities. Title II of the ADA deals with compliance with the Act in emergency management and disaster-related programs, services, and activities. It applies to state and local governments as well as third parties, including religious entities and private nonprofit organizations. Any action identified in this plan that has overlap with the scope of the ADA will need to comply with the act. All FEMA hazard mitigation project grant application require full compliance with all federal acts that may interface with the action.
The ADA has implications for sheltering requirements and public notifications. During an emergency alert, officials must use a combination of warning methods to ensure that all residents have all necessary information. Those with hearing impairments may not hear radio, television, sirens, or other audible alerts, while those with visual impairments may not see flashing lights or other visual alerts. Two technical documents for shelter operators address physical accessibility needs of people with disabilities, as well as medical needs and service animals.
The ADA intersects with disaster preparedness programs in regards to transportation, social services, temporary housing, and rebuilding. Persons with disabilities may require additional assistance in evacuation and transit (e.g., vehicles with wheelchair lifts or paratransit buses). Evacuation and other response plans should address the unique needs of residents. Local governments may be interested in implementing a special-needs registry to identify the home addresses, contact information, and needs for residents who may require more assistance.
Civil Rights Act of 1964 The Civil Rights Act of 1964 prohibits discrimination based on race, color, religion, sex or nation origin and requires equal access to public places and employment. The Act is relevant to emergency management and hazard mitigation in that it prohibits local governments from favoring the needs of one population group over another. Local government and emergency response must ensure the continued safety and well-being of all residents equally, to the extent possible. Any action identified in this plan that has overlap with the Civil Rights Act will need to comply with the act. All FEMA hazard mitigation project grant application require full compliance with all federal acts that may interface with the action.
Community Development Block Grant Disaster Resilience Program In response to disasters, Congress may appropriate additional funding for the U.S. Department of Housing and Urban Development Community Development Block Grant programs to be distributed as Disaster Recovery grants (CDBG-DR). These grants can be used to rebuild affected areas and provide seed money to start the recovery process. CDBG-DR assistance may fund a broad range of recovery activities, helping communities and neighborhoods that otherwise might not recover due to limited resources. CDBG-DR grants often supplement disaster programs of the Federal Emergency Management Agency, the Small Business Administration, and the U.S. Army Corps of Engineers. Housing and Urban Development generally awards noncompetitive, nonrecurring CDBG-DR grants by a formula that considers disaster recovery needs unmet by other federal disaster assistance programs. To be eligible for CDBG-DR funds, projects must meet the following criteria:
• Address a disaster-related impact (direct or indirect) in a presidentially declared county for the covered disaster
City of Los Angeles 2018 Local Hazard Mitigation Plan City of Los Angeles Profile
4-40
• Be a CDBG-eligible activity (according to regulations and waivers) • Meet a national objective.
Incorporating preparedness and mitigation into these actions is encouraged, as the goal is to rebuild in ways that are safer and stronger. The CDGB-DR program is a potential alternative source of funding for actions identified in this plan.
Army Corps of Engineers Programs The U.S. Army Corps of Engineers has several civil works authorities and programs related to flood risk and flood hazard management:
• The Floodplain Management Services program offers 100-percent federally funded technical services such as development and interpretation of site-specific data related to the extent, duration and frequency of flooding. Special studies may be conducted to help a community understand and respond to flood risk. These may include flood hazard evaluation, flood warning and preparedness, or flood modeling.
• For more extensive studies, the Corps of Engineers offers a cost-shared program called Planning Assistance to States and Tribes. Studies under this program generally range from $25,000 to $100,000 with the local jurisdiction providing 50 percent of the cost.
• The Corps of Engineers has several cost-shared programs (typically 65 percent federal and 35 percent non-federal) aimed at developing, evaluating and implementing structural and non-structural capital projects to address flood risks at specific locations or within a specific watershed:
The Continuing Authorities Program for smaller-scale projects includes Section 205 for Flood Control, with a $7 million federal limit and Section 14 for Emergency Streambank Protection with a $1.5 million federal limit. These can be implemented without specific authorization from Congress.
Larger scale studies, referred to as General Investigations, and projects for flood risk management, for ecosystem restoration or to address other water resource issues, can be pursued through a specific authorization from Congress and are cost-shared, typically at 65 percent federal and 35 percent non-federal.
Watershed management planning studies can be specifically authorized and are cost-shared at 50 percent federal and 50 percent non-federal.
• The Corps of Engineers provides emergency response assistance during and following natural disasters. Public Law 84-99 enables the Corps to assist state and local authorities in flood fight activities and cost share in the repair of flood protective structures. Assistance is provided in the flowing categories:
Preparedness—The Flood Control and Coastal Emergency Act establishes an emergency fund for preparedness for emergency response to natural disasters; for flood fighting and rescue operations; for rehabilitation of flood control and hurricane protection structures. Funding for Corps of Engineers emergency response under this authority is provided by Congress through the annual Energy and Water Development Appropriation Act. Disaster preparedness activities include coordination, planning, training and conduct of response exercises with local, state and federal agencies.
Response Activities—PL 84-99 allows the Corps of Engineers to supplement state and local entities in flood fighting urban and other non-agricultural areas under certain conditions (Engineering Regulation 500-1-1 provides specific details). All flood fight efforts require a project cooperation agreement signed by the public sponsor and the sponsor must remove all flood fight material after the flood has receded. PL 84-99 also authorizes emergency water support and drought assistance in certain situations and allows for “advance measures” assistance to prevent or reduce flood damage conditions of imminent threat of unusual flooding.
City of Los Angeles 2018 Local Hazard Mitigation Plan City of Los Angeles Profile
4-41
Rehabilitation—Under PL 84-99, an eligible flood protection system can be rehabilitated if damaged by a flood event. The flood system would be restored to its pre-disaster status at no cost to the federal system owner, and at 20-percent cost to the eligible non-federal system owner. All systems considered eligible for PL 84-99 rehabilitation assistance have to be in the Rehabilitation and Inspection Program prior to the flood event. Acceptable operation and maintenance by the public levee sponsor are verified by levee inspections conducted by the Corps on a regular basis. The Corps has the responsibility to coordinate levee repair issues with interested federal, state, and local agencies following natural disaster events where flood control works are damaged.
All of these authorities and programs are available to the City of Los Angeles to support any intersecting mitigation actions.
4.9.2 State
Alquist-Priolo Earthquake Fault Zoning Act The Alquist-Priolo Earthquake Fault Zoning Act was enacted in 1972 to mitigate the hazard of surface faulting to structures for human occupancy. The Alquist-Priolo Earthquake Fault Zoning Act’s main purpose is to prevent construction of buildings used for human occupancy on the surface trace of active faults. Before a new project is permitted, cities and counties require a geologic investigation to demonstrate that proposed buildings will not be constructed on active faults. The act addresses only the hazard of surface fault rupture and is not directed toward other earthquake hazards, such as liquefaction or seismically induced landslides. The law requires the State of California geologist to establish regulatory zones around the surface traces of active faults and to issue appropriate maps. The maps are distributed to all affected cities, counties, and state agencies for their use in planning and controlling new or renewed construction. Local agencies must regulate most development projects within the zones. Projects include all land divisions and most structures for human occupancy. All seismic hazard mitigation actions identified in this plan will seek full compliance with the Alquist-Priolo Earthquake Fault Zoning Act.
California General Planning Law California state law requires that every county and city prepare and adopt a comprehensive long-range plan to serve as a guide for community development. The general plan expresses the community’s goals, visions, and policies relative to future land uses, both public and private. The general plan is mandated and prescribed by state law (Cal. Gov. Code §65300 et seq.), and forms the basis for most local government land use decision-making.
The plan must consist of an integrated and internally consistent set of goals, policies, and implementation measures. In addition, the plan must focus on issues of the greatest concern to the community and be written in a clear and concise manner. City actions, such as those relating to land use allocations, annexations, zoning, subdivision and design review, redevelopment, and capital improvements, must be consistent with the plan.
The City of Los Angeles has a general plan that is currently compliant with this law and has committed to integrating this mitigation plan with its general plan through other provisions referenced below (AB-2140 and SB-379).
California Environmental Quality Act The California Environmental Quality Act (CEQA) was passed in 1970, shortly after the federal government passed the National Environmental Policy Act, to institute a statewide policy of environmental protection. CEQA requires state and local agencies in California to follow a protocol of analysis and public disclosure of the potential environmental impacts of development projects. CEQA makes environmental protection a mandatory part of every California state and local agency’s decision making process.

City of Los Angeles 2018 Local Hazard Mitigation Plan City of Los Angeles Profile
4-42
CEQA establishes a statewide environmental policy and mandates actions all state and local agencies must take to advance the policy. For any project under CEQA’s jurisdiction with potentially significant environmental impacts, agencies must identify mitigation measures and alternatives by preparing an environmental impact report and may approve only projects with no feasible mitigation measures or environmentally superior alternatives.
All discretionary actions require environmental review pursuant to CEQA. However, the CEQA guidelines list classes of projects that have been determined to not have a significant effect on the environment—referred to as categorical exemptions. These include feasibility and planning studies for possible future action. Planning processes such as hazard mitigation planning meet the criteria for this exemption, so the City of Los Angeles has determined that this plan update is categorically exempt from the formal CEQA protocol. The City will initiate the formal CEQA protocol on any project recommended in this plan that requires adherence to this protocol at the initiation of the project. Any project action identified in this plan will seek full CEQA compliance upon implementation.
Assembly Bill 162: Flood Planning This California State Assembly bill passed in 2007 requires cities and counties to address flood-related matters in the land use, conservation, and safety and housing elements of their general plans. The land use element must identify and annually review the areas covered by the general plan that are subject to flooding as identified in floodplain mapping by either FEMA or the state Department of Water Resources (DWR). Upon the next revision of the housing element on or after January 1, 2009, the conservation element of the general plan must identify rivers, creeks, streams, flood corridors, riparian habitat, and land that may accommodate floodwater for the purposes of groundwater recharge and stormwater management. The safety element must identify information regarding flood hazards including:
• Flood hazard zones • Maps published by FEMA, DWR, the U.S. Army Corps of Engineers, the Central Valley Flood
Protection Board, California Office of Emergency Services (Cal OES), etc. • Historical data on flooding • Existing and planned development in flood hazard zones.
The general plan must establish goals, policies and objectives to protect from unreasonable flooding risks including:
• Avoiding or minimizing the risks of flooding new development • Evaluating whether new development should be located in flood hazard zones • Identifying construction methods to minimize damage.
Assembly Bill (AB) 162 establishes goals, policies and objectives to protect from unreasonable flooding risks. It establishes procedures for the determination of available land suitable for urban development, which may exclude lands where FEMA or DWR has determined that the flood management infrastructure is not adequate to avoid the risk of flooding.
The City of Los Angeles has developed a Comprehensive Flood Hazard Management Plan that was most recently updated in 2016 and is fully complaint with this bill and FEMA’s CRS program. The flood management plan is considered to be fully integrated by reference in this hazard mitigation plan.
Assembly Bill 2140: General Plans—Safety Element This bill provides that the state may allow for more than 75 percent of public assistance funding under the California Disaster Assistance Act only if the local agency is in a jurisdiction that has adopted a local hazard mitigation plan as part of the safety element of its general plan. The local hazard mitigation plan needs to include

City of Los Angeles 2018 Local Hazard Mitigation Plan City of Los Angeles Profile
4-43
elements specified in this legislation. In addition this bill requires Cal OES to give federal mitigation funding preference to cities and counties that have adopted local hazard mitigation plan. The intent of the bill is to encourage cities and counties to create and adopt hazard mitigation plans.
Assembly Bill 70: Flood Liability This bill provides that a city or county may be required to contribute a fair and reasonable share to compensate for property damage caused by a flood to the extent that it has increased the state’s exposure to liability for property damage by unreasonably approving new development in a previously undeveloped area that is protected by a state flood control project, unless the city or county meets specified requirements.
Assembly Bill 32: The California Global Warming Solutions Act This bill addresses greenhouse gas emissions. It identifies the following potential adverse impacts of global warming:
“… the exacerbation of air quality problems, a reduction in the quality and supply of water to the state from the Sierra snowpack, a rise in sea levels resulting in the displacement of thousands of coastal businesses and residences, damage to marine ecosystems and the natural environment, and an increase in the incidences of infectious diseases, asthma, and other human health-related problems.”
AB 32 establishes a state goal of reducing greenhouse gas emissions to 1990 levels by 2020 (a reduction of approximately 25 percent from forecast emission levels) with further reductions to follow. The law requires the state Air Resources Board to do the following:
• Establish a program to track and report greenhouse gas emissions. • Approve a scoping plan for achieving the maximum technologically feasible and cost-effective reductions
from sources of greenhouse gas emissions. • Adopt early reduction measures to begin moving forward. • Adopt, implement and enforce regulations—including market mechanisms such as “cap and-trade”
programs—to ensure that the required reductions occur.
The Air Resources Board recently adopted a statewide greenhouse gas emissions limit and an emissions inventory, along with requirements to measure, track, and report greenhouse gas emissions by the industries it determined to be significant sources of greenhouse gas emissions.
Assembly Bill 2800: Climate Change—Infrastructure Planning This California State Assembly bill passed in 2016. Until July 1, 2020, it requires state agencies to take into account the current and future impacts of climate change when planning, designing, building, operating, maintaining, and investing in state infrastructure. The bill requires agencies to establish a Climate-Safe Infrastructure Working Group by July 1, 2017, for the purpose of examining how to integrate scientific data concerning projected climate change impacts into state infrastructure engineering, and maintaining the group until July 1, 2020.
Senate Bill 97: Guidelines for Greenhouse Gas Emissions Senate Bill 97, enacted in 2007, amended CEQA to clearly establish that greenhouse gas emissions and the effects of greenhouse gas emissions are appropriate subjects for CEQA analysis. It directed the Governor’s Office of Planning and Research to develop draft CEQA guidelines for the mitigation of greenhouse gas emissions or their effects by July 1, 2009 and directed the California Natural Resources Agency to certify and adopt the CEQA Guidelines by January 1, 2010.
City of Los Angeles 2018 Local Hazard Mitigation Plan City of Los Angeles Profile
4-44
Senate Bill 1000: General Plan Amendments—Safety and Environmental Justice Elements
Senate Bill 1000, adopted in 2016, amends California’s Planning and Zoning Law in two ways:
• The original law established requirements for initial revisions of general plan safety elements to address flooding, fire, and climate adaptation and resilience. It also required subsequent review and revision as necessary based on new information. Senate Bill 1000 specifies that the subsequent reviews and revision based on new information are required to address only flooding and fires (not climate adaptation and resilience).
• Senate Bill 1000 adds a requirement that, upon adoption or revision of any two other general plan elements on or after January 1, 2018, an environmental justice element be adopted for the general plan or environmental justice goals, policies and objectives be incorporated into other elements of the plan.
Senate Bill 1241: General Plans: Safety Element—Fire Hazard Impacts In 2012, Senate Bill 1241 passed requiring that all future general plans address fire risk in state responsibility areas and very high fire hazard severity zones in their safety element. In addition, the bill requires cities and counties to make certain findings regarding available fire protection and suppression services before approving a tentative map or parcel map.
Senate Bill 379: General Plans: Safety Element—Climate Adaptation Senate Bill (SB) 379 builds upon the flood planning inclusions into the safety and housing elements and the hazard mitigation planning safety element inclusions in general plans outlined in AB 162 and AB 2140, respectively. SB 379 focuses on a new requirement that cities and counties include climate adaptation and resiliency strategies in the safety element of their general plans beginning January 1, 2017. In addition, this bill requires general plans to include a set of goals, policies and objectives, and specified implementation measures based on the conclusions drawn from climate adaptation research and recommendations.
This update process for this hazard mitigation plan was conducted with the intention of full compliance with this bill. However, at the time of the update, there was no clear guidance from the state on what constitutes full compliance or what protocol is to be used to determine compliance. When such guidance has been established, the City will submit this plan or its subsequent updates to the state for review and approval.
California State Building Code California Code of Regulations Title 24 (CCR Title 24), also known as the California Building Standards Code, is a compilation of building standards from three sources:
• Building standards that have been adopted by state agencies without change from building standards contained in national model codes
• Building standards that have been adopted and adapted from the national model code standards to meet California conditions
• Building standards authorized by the California legislature that constitute extensive additions not covered by the model codes adopted to address particular California concerns.
The state Building Standards Commission is authorized by California Building Standards Law (Health and Safety Code Sections 18901 through 18949.6) to administer the processes related to the adoption, approval, publication, and implementation of California’s building codes. These building codes serve as the basis for the design and construction of buildings in California. The national model code standards adopted into Title 24 apply to all occupancies in California except for modifications adopted by state agencies and local governing bodies. Since 1989, the Building Standards Commission has published new editions of Title 24 every three years.

City of Los Angeles 2018 Local Hazard Mitigation Plan City of Los Angeles Profile
4-45
On January 1, 2014, California Building Code Accessibility Standards found in Chapter 11B incorporated the 2010 Americans with Disabilities Act (ADA) Standards as the model accessibility code for California. The purpose for this incorporation was to ensure consistency with federal guidelines. As a result of this incorporation, the California standards will fully implement and include 2010 ADA Standards within the California Building Code while maintaining enhanced levels of accessibility already provided by existing California accessibility regulations. The City has adopted building codes that are in full compliance with the California State Building Code.
Standardized Emergency Management System CCR Title 19 establishes the Standardized Emergency Management System (SEMS) to standardize the response to emergencies involving multiple jurisdictions. SEMS is intended to be flexible and adaptable to the needs of all emergency responders in California. It requires emergency response agencies to use basic principles and components of emergency management. Local governments must use SEMS by December 1, 1996 in order to be eligible for state funding of response-related personnel costs under CCR Title 19 (Sections 2920, 2925 and 2930). Individual agencies’ roles and responsibilities contained in existing laws or the state emergency plan are not superseded by these regulations. This hazard mitigation plan is considered to be a support document for all phases of emergency management, including those associated with SEMS.
State of California Multi-Hazard Mitigation Plan Under the DMA, California must adopt a federally approved state multi-hazard mitigation plan to be eligible for certain disaster assistance and mitigation funding. The intent of the State of California Multi-Hazard Mitigation Plan is to reduce or prevent injury and damage from hazards in the state through the following:
• Documenting statewide hazard mitigation planning in California • Describing strategies and priorities for future mitigation activities • Facilitating the integration of local and tribal hazard mitigation planning activities into statewide efforts • Meeting state and federal statutory and regulatory requirements.
The plan is an annex to the State Emergency Plan, and it identifies past and present mitigation activities, current policies and programs, and mitigation strategies for the future. It also establishes hazard mitigation goals and objectives. The plan will be reviewed and updated annually to reflect changing conditions and new information, especially information on local planning activities.
Under 44 CFR Section 201.6, local hazard mitigation plans must be consistent with their state’s hazard mitigation plan. In updating this plan, the Steering Committee reviewed the California State Hazard Mitigation Plan to identify key relevant state plan elements (see Section 3.6).
California Coastal Management Program The California Coastal Management Program under the California Coastal Act requires each city or county lying wholly or partly within the coastal zone to prepare a Local Coastal Plan. The specific contents of such plans are not specified by state law, but they must be certified by the Coastal Commission as consistent with policies of the Coastal Act (Public Resources Code, Division 20). The Coastal Act has provisions relating to geologic hazards, but does not mention tsunamis specifically. Section 30253(1) of the Coastal Act, states that new development shall minimize risks to life and property in areas of high geologic, flood, and fire hazard. Development should be prevented or limited in high hazard areas whenever possible. However, where development cannot be prevented or limited, land use density, building value, and occupancy should be kept at a minimum. There are identified coastal zones in Los Angeles, and the City has developed a local coastal plan to address them. Any mitigation project identified in this plan that intersects the mapped coastal zone will be consistent with the recommendations of the City’s coastal plan.

City of Los Angeles 2018 Local Hazard Mitigation Plan City of Los Angeles Profile
4-46
Governor’s Executive Order S-13-08 Governor’s Executive Order S-13-08 enhances the state’s management of climate impacts from sea level rise, increased temperatures, shifting precipitation and adverse weather events. It required the following key actions:
• Initiate California’s first statewide climate change adaptation strategy to assess expected climate change impacts, identify where California is most vulnerable, and recommend adaptation policies by early 2009. This effort will improve coordination within state government so that better planning can more effectively address climate impacts on human health, the environment, the state’s water supply and the economy.
• Request that the National Academy of Science establish an expert panel to report on sea level rise impacts in California, to inform state planning and development efforts.
• Issue interim guidance to state agencies for how to plan for sea level rise in designated coastal and floodplain areas for new projects.
• Initiate a report on critical infrastructure projects vulnerable to sea level rise.
Los Angeles Regional Water Quality Control Board The Los Angeles Regional Water Quality Control Board protects ground and surface water quality in the Los Angeles region. It is one of nine regional boards statewide under the California Environmental Protection Agency. The board conducts the following activities to protect ground and surface waters under its jurisdiction (California State Water Resources Control Board, 2015):
• Address region-wide and specific water quality concerns through updates of the Water Quality Control Plan (Basin Plan) for the Los Angeles Region.
• Prepare, monitor compliance with, and enforce waste discharge requirements. • Implement and enforce local stormwater control efforts. • Regulate cleanup of contaminated sites that have polluted groundwater or surface water or could do so. • Enforce water quality laws, regulations, and waste discharge requirements. • Coordinate with other public agencies and groups that are concerned with water quality. • Inform and involve the public on water quality issues.
4.9.3 City of Los Angeles This section identifies locally sponsored programs, plans, and studies that can support or enhance the core capabilities of the City and the mitigation actions identified in this plan. Many were put in place by the City in response to the federal and state programs described in Sections 4.9.1 and 4.9.2. Each can be leveraged by the City to support or enhance the implementation of actions identified in Chapter 23 of this plan. These programs, plans and studies are to be considered in addition to the core capabilities identified in Section 4.9.4, and they are hereby integrated into this hazard mitigation plan by reference. Mitigation actions identified in the programs, plans and studies are considered to be fully integrated into this hazard mitigation plan by reference.
General Plan The Los Angeles General Plan is a comprehensive set of purposes, policies and programs to guide the future form and development of the City. The plan is approved by the City Council and the Mayor and adopted by the Planning Commission. The General Plan is both a strategic and long-term document, broad in scope and specific in nature. It is implemented by decisions that direct the allocation of public resources and that shape private development, which affects the lives of the residents and business community. The General Plan is prepared and maintained by the Department of City Planning and must comply with the California General Planning Law. The law requires specific planning elements, including land use, circulation, housing, conservation, open space, noise, safety, and air quality. The City of Los Angeles’ General Plan consists of the following elements:
City of Los Angeles 2018 Local Hazard Mitigation Plan City of Los Angeles Profile
4-47
• Plan for a Healthy LA: A Health and Wellness Element of the General Plan, March 2015 • The Citywide General Plan Framework: An Element of the General Plan, August 2001 • Air Quality Element: An Element of the City of Los Angeles General Plan, November 1992 • Conservation Element of the City of Los Angeles General Plan, September 2001 • The Housing Element 2013 – 2021 of the City of Los Angeles General Plan, December 2013 • Noise Element of the City of Los Angeles General Plan, February 1999 • The Open Space Element of the City of Los Angeles General Plan, June 1973 • Service Systems Element of the City of Los Angeles General Plan, Unknown Date • Safety Element of the City of Los Angeles General Plan, November 1996 • Mobility Plan 2035, An Element of the General Plan, September 2016 (used to be Transportation Plan) • The Land Use Element of the General Plan, July 2003 (consisting of 35 community plans)
The Safety Element addresses protection from unreasonable risks associated with natural disasters, including fire and rescue, stormwater and inundation, slope failure and subsidence, seismic events, and hazardous materials. The Safety Element includes the Emergency Operations Organization and other interagency coordination, the California State safety element requirements, and emergency response, disaster recovery and hazard mitigation.
The Department of City Planning is reviewing all of the General Plan elements and establishing a suggested schedule for updating those plans that are still pending as well as developing a sequence for updating other existing elements. New laws, requirements, resources, and research that affect general planning include SB 375 (sustainable communities strategies), SB 5 (flood management), SB 743 (vehicle miles traveled), SB 244 (island or fringe communities), AB 52 (tribal consultation), and AB 2140 (local hazard mitigation plans).
Comprehensive Zoning Code The Zoning Code regulates all land, building, structures, and uses within the City of Los Angeles. Since 2013, the City has been in the process of creating a new zoning code for the 21st century. The original zoning regulations were developed in 1946 and had not been revised since then. A new initiative called, “Plan re:code LA” is the City’s latest effort to update the zoning code with an engaged community vision, policies and implementation strategies, alignment with various adopted plans, land use and zoning maps, and address the issues of unique neighborhoods with needs that differ by neighborhood.
Los Angeles Municipal Code Chapter 1, Article 2, also known as the Comprehensive Zoning Plan of the City of Los Angeles, coordinates all City zoning regulations and provisions in order to regulate the location and use of buildings, structures and land. The goals of the Comprehensive Zoning Plan are to encourage the most appropriate use of land; to stabilize the value of property; to provide adequate open spaces; to prevent and fight fires; to prevent undue concentration of population; to lessen street congestion; to facilitate adequate provisions for transportation, water, sewerage, schools, parks and other public requirements; and to promote health, safety and the general welfare in accordance with the General Plan. It includes designation of zones that allow for floodplains and flood control facilities and presents design standards including those that deal with flood prevention and control.
Multi-Hazard Related Activities of City Departments Several city departments perform activities and collect data related to hazard mitigation issues. The following is a summary of key city activities related to hazard and risk management:
• Department of Public Works, Bureau of Engineering
Maintain FEMA Flood Insurance Rate Map data. Maintain a map of hillside areas.
City of Los Angeles 2018 Local Hazard Mitigation Plan City of Los Angeles Profile
4-48
Maintain records of drainage complaints. Complaints are investigated by staff engineers or maintenance crews. Complaints have been entered into a database and geo-coded for display on the GIS.
Maintain a list of known deficiencies. A project is identified to address each deficiency, so the deficiency list serves as a list of proposed projects. The projects can also be displayed on the GIS.
Assess infrastructure damage through field investigations after major storms. Prepare geotechnical reports related to geologically unstable areas. Maintain a database of FEMA Repetitive Loss Properties.
• Department of Public Works
Assess infrastructure damage through field investigations after major hazard incidents. Identify areas in need of frequent maintenance of the flood control system. Provide post-disaster debris clearance.
• Department of Building and Safety
Identify mud-prone and landslide areas throughout the City. Track the number of building permits issued in flood risk areas. Lead the Safety Assessment Program using volunteers and mutual aid building inspectors in safety
evaluation of the built environment in the aftermath of a disaster.
• Planning Department
Maintain demographic, building, land use and zoning data. Provide hazard descriptions of fire and rescue, stormwater, inundation and other water action, slope
failure and subsidence, seismic events, and hazardous materials and phases of disasters such as hazard mitigation, and multi-hazard emergency response and disaster recovery provided by the Safety Element of the General Plan.
Maintain tsunami maps, dam failure inundation maps and landslide hazard identification maps from the safety element of the General Plan (input from the State Division of Mines and Geology and the State Office of Emergency Services).
Assess City policy in maintaining open space and the effectiveness of regulatory and preventive standards in preventing flood damage.
Maintain list of natural and beneficial areas within the City (wetlands, riparian areas, sensitive areas, and habitat for rare or endangered species).
• Emergency Management Department
Establish and maintain a comprehensive citywide planning, training/exercise and coordination effort for mitigation, preparedness, response and recovery for multi-hazard incidents.
Activate and operate the City Emergency Operations Center for coordination of all-hazards incidents. Maintain emergency operations plans and associated hazard-specific and functional support annexes
for the City to respond to events. Chair a City Tsunami Task Force, with recommendations for community outreach, educational
programs, and tsunami signage in hazard areas. Provide disaster awareness and emergency preparedness information to the public. Provide emergency public information regarding emergency alert and warning, notifications,
evacuations, and sheltering for the public and City personnel.
• Port of Los Angeles

City of Los Angeles 2018 Local Hazard Mitigation Plan City of Los Angeles Profile
4-49
Maintain tsunami signage program. Evacuate vessels for the safety of crew members. Evacuate Port facilities and the Port area. Procure and maintain emergency supplies and equipment. Establish damage assessment and prioritization procedures. Identify shelter facilities. Provide employee emergency preparedness training.
• Department of Water and Power
Implement necessary planning in the design, construction, reconstruction and maintenance of water and power systems to carry out hazard and risk mitigation measures.
Security and Emergency Management Division to oversee security and emergency preparedness strategies, programs, and measures for the department.
Develop an Urban Water Management Plan every five years to comply with California’s Urban Water Management Planning Act.
• Los Angeles Housing and Community Investment Department (HCID)
Systematic Code Enforcement Program—Under this award-winning proactive program, inspectors have legal authority from the City for code enforcement over all multi-family rental properties in the city. Building and Safety does not do this; HCID does. On a four-year cycle, on a schedule coordinated with every landlord, HCID systematically inspects all multi-family properties in the city on a variety of codes (building, plumbing, electrical and mechanical, health and safety, etc.) to ensure that life and fire safety systems are working and the property meets habitability standards.
Lead Hazard Remediation Program—This program provides grants to property owners to make their properties lead-safe and to eliminate health and safety hazards. The grants are primarily targeted to low-income families with children under the age of six. The program also provides education regarding the dangers of lead-based paint and health and safety hazards.
City of Los Angeles Resilience Program The City of Los Angeles is committed to addressing resilience by strengthening the city’s physical, social, and economic foundations. The Mayor’s Office has adopted far-reaching strategies to develop the tools the City needs to rebound from major crises—including storms, earthquakes, and economic recessions—if and when they come. Led by the Mayor’s office, the City’s resilience program is based on plans and programs summarized below.
100 Resilient Cities In 2013, the City of Los Angeles was selected as an inaugural member of 100 Resilient Cities network pioneered by the Rockefeller Foundation, an organization that helps cities confront 21st century challenges. The network gives cities tools to develop a road map to resilience:
• Financial and logistical guidance for establishing an innovative new position in city government—a Chief Resilience Officer—to lead the city’s resilience efforts
• Expert support for development of a robust resilience strategy • Connection with service providers and others who can help implement resilience strategies • Membership in a global network of member cities that share best practices and support pioneering
resilience.
Through these actions, the 100 Resilient Cities network aims to build urban resilience and establish guidelines for resilience among governments, non-governmental organizations, the private sector, and individual residents.

City of Los Angeles 2018 Local Hazard Mitigation Plan City of Los Angeles Profile
4-50
Resilience by Design Released in December 2014, Resilience by Design addresses Los Angeles’ greatest earthquake vulnerabilities, including building retrofitting and steps to secure the water supply and communications infrastructure. The report presents recommendations of the Mayoral Seismic Safety Task Force. These recommendations suggest strategic solutions to protect the lives of residents; improve the capacity of the City to respond to earthquakes; prepare the City to recover quickly from earthquakes; and protect the economy of the City and all of Southern California. The Mayoral Seismic Task Force evaluated four areas of seismic vulnerability: pre-1980 “non-ductile reinforced concrete” buildings: pre-1980 “soft-first story” buildings; water system infrastructure (including impact on firefighting capability); and telecommunications infrastructure.
The Sustainable City pLAn The Sustainable City pLAn is a road map for a Los Angeles that is environmentally healthy, economically prosperous, and equitable in opportunity for all—now and over the next 20 years. The pLAn focuses on both short-term results and long-term goals to transform the City. The pLAn provides the following:
• A vision for Los Angeles’ future—Presents a clear vision and details specific long-term outcomes to be achieved over the next two decades in 14 key aspects of the environment, the economy and measures of social equity.
• A pathway to short-term results that lay the foundation for long-term outcomes—Creates a set of near-term, back-to-basics outcomes by 2017 that create a foundation to achieve transformational change by 2025 and 2035.
• A framework to build out policies—Lays out strategies and priority initiatives that will be developed and detailed to deliver the tangible outcomes in the pLAn.
• A platform for collaboration—Creates a platform for collaboration to identify, create, and strengthen programs, policies, and partnerships that cut across bureaucratic boundaries to improve the city and neighborhoods.
• A set of tools to help manage Los Angeles—Provides the Mayor with a set of tools to ensure implementation and empower the men and women who work for the City.
• A dashboard of sustainability metrics to transparently measure progress—Identifies and tracks clear metrics to measure progress and share how everyone—in city operations, and as Angelenos—is doing along with way.
• A pathway for engaging our residents—Builds on leadership throughout Los Angeles, while providing Angelenos ways and opportunities to participate in creating tangible improvements to their lives, their neighborhoods, and the entire city.
Enhanced Watershed Management Plans In order to improve water quality, comply with water quality mandates and address water supply issues, cities and community stakeholders throughout Los Angeles County are working to develop Enhanced Watershed Management Plans for each of the county’s four watersheds—Ballona Creek, Dominguez Channel, Santa Monica Bay and Los Angeles River. The efforts are being led by a Watershed Management Group for each watershed.
Each plan will identify projects to improve water quality, promote water conservation, enhance recreational opportunities, manage flood risk, improve local aesthetics, and support public education. Each will outline water quality priorities, watershed control measures, reasonable assurance analysis, project scheduling and the monitoring, assessment and adaptive management of projects. The plans are to be submitted to the Los Angeles Regional Water Quality Control Board by June 28, 2015 (City of Los Angeles Stormwater Program, 2015).
City of Los Angeles 2018 Local Hazard Mitigation Plan City of Los Angeles Profile
4-51
Greater Los Angeles County Region Integrated Regional Water Management Plan Municipalities and groups across the Greater Los Angeles County Region collaborated to develop an Integrated Regional Water Management Plan in 2006 that focuses on water resource management. The plan identifies solutions over the next 20 years to reduce dependence on imported water, clean up local groundwater and stormwater, enhance in-stream water quality, improve habitat, and expand parks and open space. The plan can support development of local funding sources and help local jurisdictions comply with regulatory mandates. It provides a tool for achieving planning targets for the region and improving the sustainability of water resources and ecological health of local watersheds. More sustainable water resources will improve the quality of life for all communities. (Los Angeles County Department of Public Works, 2015)
Los Angeles County Flood Control District The Los Angeles County Flood Control Act (ACT) was adopted by the State Legislature in 1915, after a disastrous regional flood took a heavy toll on lives and property. The Act established the Los Angeles County Flood Control District and empowered it to provide flood protection, water conservation, recreation and aesthetic enhancement within its boundaries. The Flood Control District is governed, as a separate entity, by the County of Los Angeles Board of Supervisors.
In 1984, the Flood Control District entered into an operational agreement with the Los Angeles County Department of Public Works transferring planning and operational activities to the Department of Public Works. Watershed Management Division is the planning and policy arm of the Flood Control District. Public Works Flood Maintenance and Water Resources Divisions, respectively, oversee its maintenance and operational efforts.
The Flood Control District encompasses more than 3,000 square miles, 85 cities and approximately 2.1 million land parcels. It includes the vast majority of drainage infrastructure within incorporated and unincorporated areas in every watershed, including 500 miles of open channel, 2,800 miles of underground storm drains, and an estimated 120,000 catch basins. The District includes portions of the City of Los Angeles.
U.S. Army Corps of Engineers Los Angeles River Ecosystem Restoration Feasibility Study The City of Los Angeles, in conjunction with the U.S. Army Corps of Engineers, prepared the Final Integrated Feasibility Report, which includes the Final Feasibility Report and Environmental Impact Statement/Environmental Impact Report for the proposed Los Angeles River Ecosystem Restoration Project. The City Council adopted the Study in June 2016.
Prior to the recent report, the Los Angeles River Ecosystem Restoration Integrated Feasibility Report documented an ongoing study that was initiated in 2003 to determine whether there is a federal interest in ecosystem restoration along the Los Angeles River within the City of Los Angeles. The study included a hydraulic analysis along the proposed project’s 11-mile extent that produced a set of floodplain maps. The purpose of the hydraulic analysis was to produce baseline and with-project snapshots of potential impacts that an ecosystem restoration plan might have on the flood conveyance capacity of the river.
Los Angeles River Revitalization Master Plan The following content is excerpted from the Los Angeles River Revitalization Master Plan (City of Los Angeles, 2015).
The Los Angeles River flows 51 miles through some of the most diverse communities in Southern California. It stretches 32 miles within the City of Los Angeles, from Owensmouth in the upper reaches of the northwest San Fernando Valley, all the way to the border with Vernon at the southern end of downtown. The river is typically dry during summer, but can fill with fast-flowing waters during the rainy season.
City of Los Angeles 2018 Local Hazard Mitigation Plan City of Los Angeles Profile
4-52
Community leaders, elected officials, residents, environmental groups, recreational groups, and others have explored ways to restore the river’s natural benefits while maintaining flood protection and safety. In 2002, the Los Angeles City Council Ad Hoc Committee on the Los Angeles River was created to encourage community involvement in river improvements and to help coordinate river-related projects in the City. As a result of the Ad Hoc River Committee’s efforts, the City began the preparation of a Revitalization Master Plan that would identify proposals to make the Los Angeles River a “front door” to the City, supporting diverse civic activities. The Ad Hoc River Committee established the following goals for the Los Angeles River Revitalization Plan:
• Establish environmentally sensitive guidelines for improving communities along the river by providing open space, housing, retail spaces, and places for public institutions.
• Improve the environment, enhance water quality, improve water resources, and improve the ecological functioning of the river.
• Provide public access to the river. • Provide significant recreation space and open space, and improve natural habitats. • Preserve and enhance the flood control features of the river. • Foster community awareness of and pride in the Los Angeles River.
The 18-month revitalization planning process looked at improvements along the river that would enhance neighborhoods, protect wildlife, promote the health of the river, and leverage economic development. The finished master plan outlines a 20-year blueprint for development and management of the Los Angeles River to be implemented by the City of Los Angeles. It calls for an extensive community engagement effort that will include public workshops at key project milestones, participation in neighborhood and community events, and an interactive web site (www.lariver.org).
The City of Los Angeles Floodplain Management Plan (2015) Recent history has demonstrated how the City of Los Angeles can be significantly impacted by flooding. On November 12, 2003, 5.6 inches of precipitation fell during a 4-hour period over the Watts area of Los Angeles and portions of the City of Carson, causing significant flooding in areas not previously considered at risk for flooding. National Weather Service records show a total of 37.25 inches of rain at the downtown Los Angeles Civic Center during the rainy season of 2004-2005—the second highest recorded seasonal rainfall (the highest was 38.18 inches in 1883-1884). In 2014, Hurricane Marie brought one of the largest hurricane-related surf events in decades to Southern California, leading to overall losses of $20 million. Hurricane Marie tied for the sixth most-intense Pacific hurricane on record.
Even though the City of Los Angeles has adopted multiple mitigation and flood control projects and plans, it is constantly seeking additional ways to mitigate flood impacts in the community. Additionally, as a participant in the Community Rating System, the City can use an updated floodplain management plan as a key step toward significant reductions in flood insurance premiums.
Administered by the City of Los Angeles Department of Public Works Bureau of Engineering, the 2015 City of Los Angeles Floodplain Management Plan provides a blueprint for flood risk reduction and management for the City. The plan is centered upon a comprehensive flood hazard risk assessment that looks at coastal, riverine, urban drainage, dam failure and tsunami hazards as well as a forward look at the possible increase in risk to these hazards caused by global climate change. The plan identifies and prioritizes 80 flood risk reduction actions to be implemented over a 5-year performance period. Progress reports on the status of the implementation of the actions in the plan are prepared by the Bureau of Engineering annually.
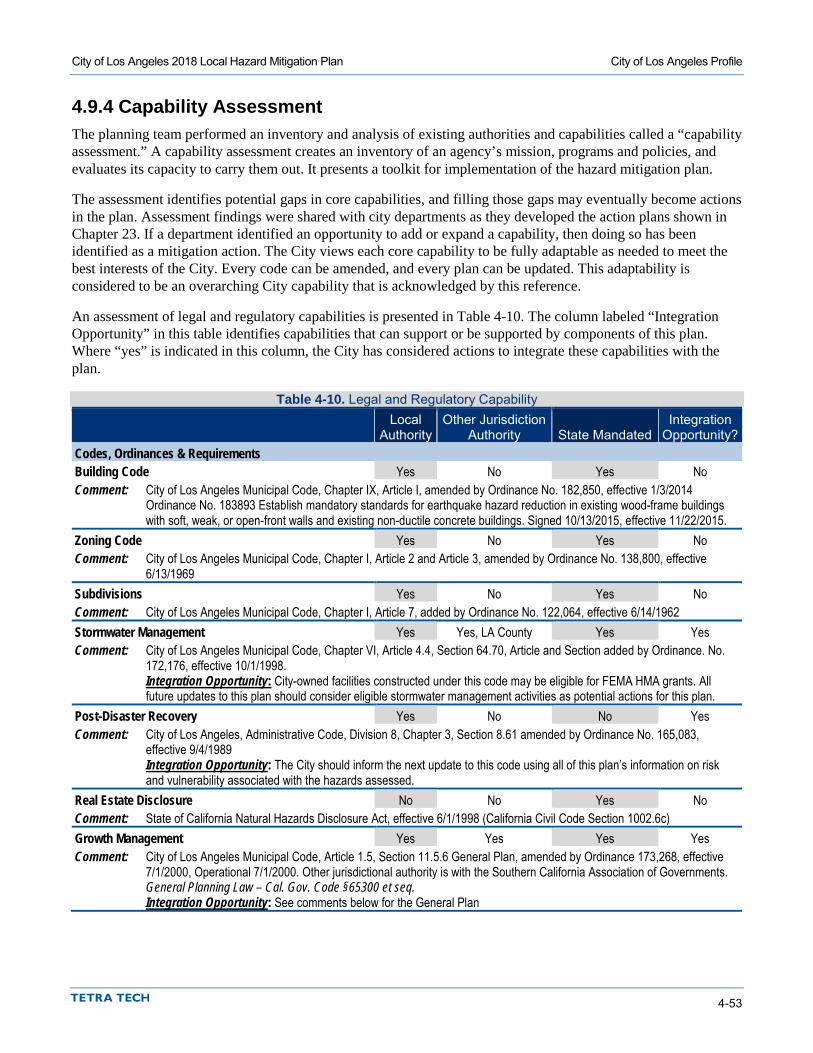
City of Los Angeles 2018 Local Hazard Mitigation Plan City of Los Angeles Profile
4-53
4.9.4 Capability Assessment The planning team performed an inventory and analysis of existing authorities and capabilities called a “capability assessment.” A capability assessment creates an inventory of an agency’s mission, programs and policies, and evaluates its capacity to carry them out. It presents a toolkit for implementation of the hazard mitigation plan.
The assessment identifies potential gaps in core capabilities, and filling those gaps may eventually become actions in the plan. Assessment findings were shared with city departments as they developed the action plans shown in Chapter 23. If a department identified an opportunity to add or expand a capability, then doing so has been identified as a mitigation action. The City views each core capability to be fully adaptable as needed to meet the best interests of the City. Every code can be amended, and every plan can be updated. This adaptability is considered to be an overarching City capability that is acknowledged by this reference.
An assessment of legal and regulatory capabilities is presented in Table 4-10. The column labeled “Integration Opportunity” in this table identifies capabilities that can support or be supported by components of this plan. Where “yes” is indicated in this column, the City has considered actions to integrate these capabilities with the plan.
Table 4-10. Legal and Regulatory Capability
Local
Authority Other Jurisdiction
Authority State Mandated Integration
Opportunity? Codes, Ordinances & Requirements Building Code Yes No Yes No Comment: City of Los Angeles Municipal Code, Chapter IX, Article I, amended by Ordinance No. 182,850, effective 1/3/2014
Ordinance No. 183893 Establish mandatory standards for earthquake hazard reduction in existing wood-frame buildings with soft, weak, or open-front walls and existing non-ductile concrete buildings. Signed 10/13/2015, effective 11/22/2015.
Zoning Code Yes No Yes No Comment: City of Los Angeles Municipal Code, Chapter I, Article 2 and Article 3, amended by Ordinance No. 138,800, effective
6/13/1969 Subdivisions Yes No Yes No Comment: City of Los Angeles Municipal Code, Chapter I, Article 7, added by Ordinance No. 122,064, effective 6/14/1962 Stormwater Management Yes Yes, LA County Yes Yes Comment: City of Los Angeles Municipal Code, Chapter VI, Article 4.4, Section 64.70, Article and Section added by Ordinance. No.
172,176, effective 10/1/1998. Integration Opportunity: City-owned facilities constructed under this code may be eligible for FEMA HMA grants. All future updates to this plan should consider eligible stormwater management activities as potential actions for this plan.
Post-Disaster Recovery Yes No No Yes Comment: City of Los Angeles, Administrative Code, Division 8, Chapter 3, Section 8.61 amended by Ordinance No. 165,083,
effective 9/4/1989 Integration Opportunity: The City should inform the next update to this code using all of this plan’s information on risk and vulnerability associated with the hazards assessed.
Real Estate Disclosure No No Yes No Comment: State of California Natural Hazards Disclosure Act, effective 6/1/1998 (California Civil Code Section 1002.6c) Growth Management Yes Yes Yes Yes Comment: City of Los Angeles Municipal Code, Article 1.5, Section 11.5.6 General Plan, amended by Ordinance 173,268, effective
7/1/2000, Operational 7/1/2000. Other jurisdictional authority is with the Southern California Association of Governments. General Planning Law – Cal. Gov. Code §65300 et seq. Integration Opportunity: See comments below for the General Plan
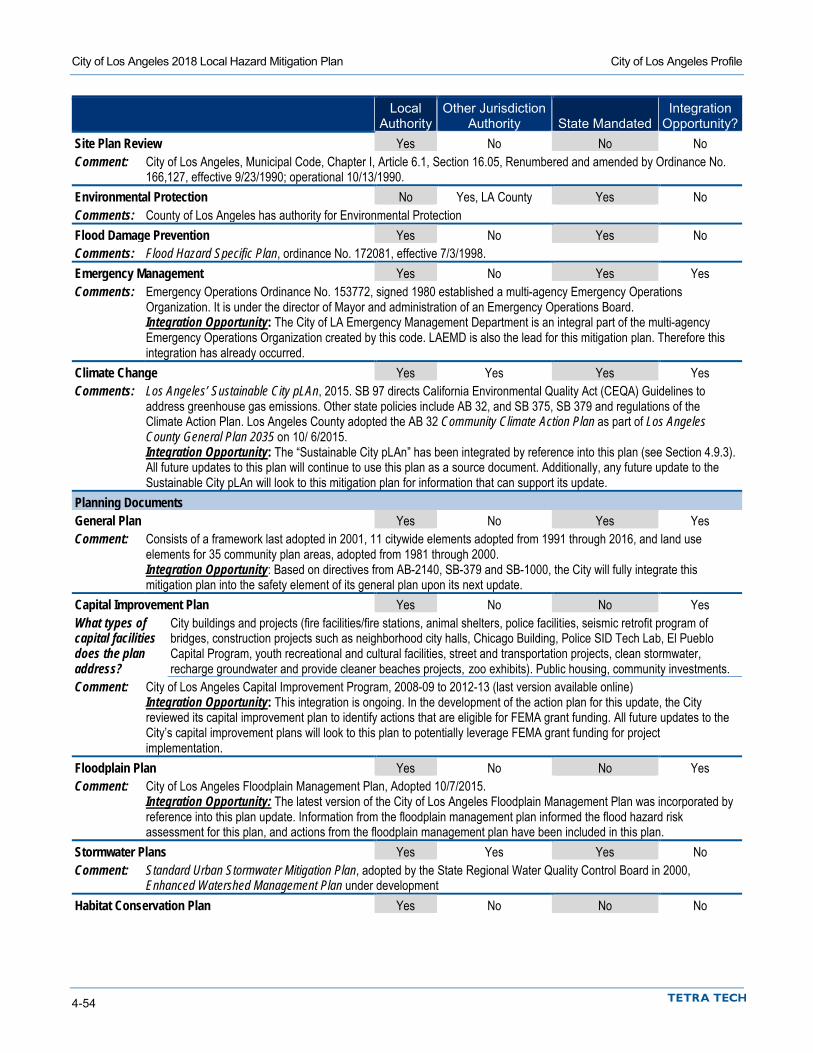
City of Los Angeles 2018 Local Hazard Mitigation Plan City of Los Angeles Profile
4-54
Local
Authority Other Jurisdiction
Authority State Mandated Integration
Opportunity? Site Plan Review Yes No No No Comment: City of Los Angeles, Municipal Code, Chapter I, Article 6.1, Section 16.05, Renumbered and amended by Ordinance No.
166,127, effective 9/23/1990; operational 10/13/1990. Environmental Protection No Yes, LA County Yes No Comments: County of Los Angeles has authority for Environmental Protection Flood Damage Prevention Yes No Yes No Comments: Flood Hazard Specific Plan, ordinance No. 172081, effective 7/3/1998. Emergency Management Yes No Yes Yes Comments: Emergency Operations Ordinance No. 153772, signed 1980 established a multi-agency Emergency Operations
Organization. It is under the director of Mayor and administration of an Emergency Operations Board. Integration Opportunity: The City of LA Emergency Management Department is an integral part of the multi-agency Emergency Operations Organization created by this code. LAEMD is also the lead for this mitigation plan. Therefore this integration has already occurred.
Climate Change Yes Yes Yes Yes Comments: Los Angeles’ Sustainable City pLAn, 2015. SB 97 directs California Environmental Quality Act (CEQA) Guidelines to
address greenhouse gas emissions. Other state policies include AB 32, and SB 375, SB 379 and regulations of the Climate Action Plan. Los Angeles County adopted the AB 32 Community Climate Action Plan as part of Los Angeles County General Plan 2035 on 10/ 6/2015. Integration Opportunity: The “Sustainable City pLAn” has been integrated by reference into this plan (see Section 4.9.3). All future updates to this plan will continue to use this plan as a source document. Additionally, any future update to the Sustainable City pLAn will look to this mitigation plan for information that can support its update.
Planning Documents General Plan Yes No Yes Yes Comment: Consists of a framework last adopted in 2001, 11 citywide elements adopted from 1991 through 2016, and land use
elements for 35 community plan areas, adopted from 1981 through 2000. Integration Opportunity: Based on directives from AB-2140, SB-379 and SB-1000, the City will fully integrate this mitigation plan into the safety element of its general plan upon its next update.
Capital Improvement Plan Yes No No Yes What types of capital facilities does the plan address?
City buildings and projects (fire facilities/fire stations, animal shelters, police facilities, seismic retrofit program of bridges, construction projects such as neighborhood city halls, Chicago Building, Police SID Tech Lab, El Pueblo Capital Program, youth recreational and cultural facilities, street and transportation projects, clean stormwater, recharge groundwater and provide cleaner beaches projects, zoo exhibits). Public housing, community investments.
Comment: City of Los Angeles Capital Improvement Program, 2008-09 to 2012-13 (last version available online) Integration Opportunity: This integration is ongoing. In the development of the action plan for this update, the City reviewed its capital improvement plan to identify actions that are eligible for FEMA grant funding. All future updates to the City’s capital improvement plans will look to this plan to potentially leverage FEMA grant funding for project implementation.
Floodplain Plan Yes No No Yes Comment: City of Los Angeles Floodplain Management Plan, Adopted 10/7/2015.
Integration Opportunity: The latest version of the City of Los Angeles Floodplain Management Plan was incorporated by reference into this plan update. Information from the floodplain management plan informed the flood hazard risk assessment for this plan, and actions from the floodplain management plan have been included in this plan.
Stormwater Plans Yes Yes Yes No Comment: Standard Urban Stormwater Mitigation Plan, adopted by the State Regional Water Quality Control Board in 2000,
Enhanced Watershed Management Plan under development Habitat Conservation Plan Yes No No No
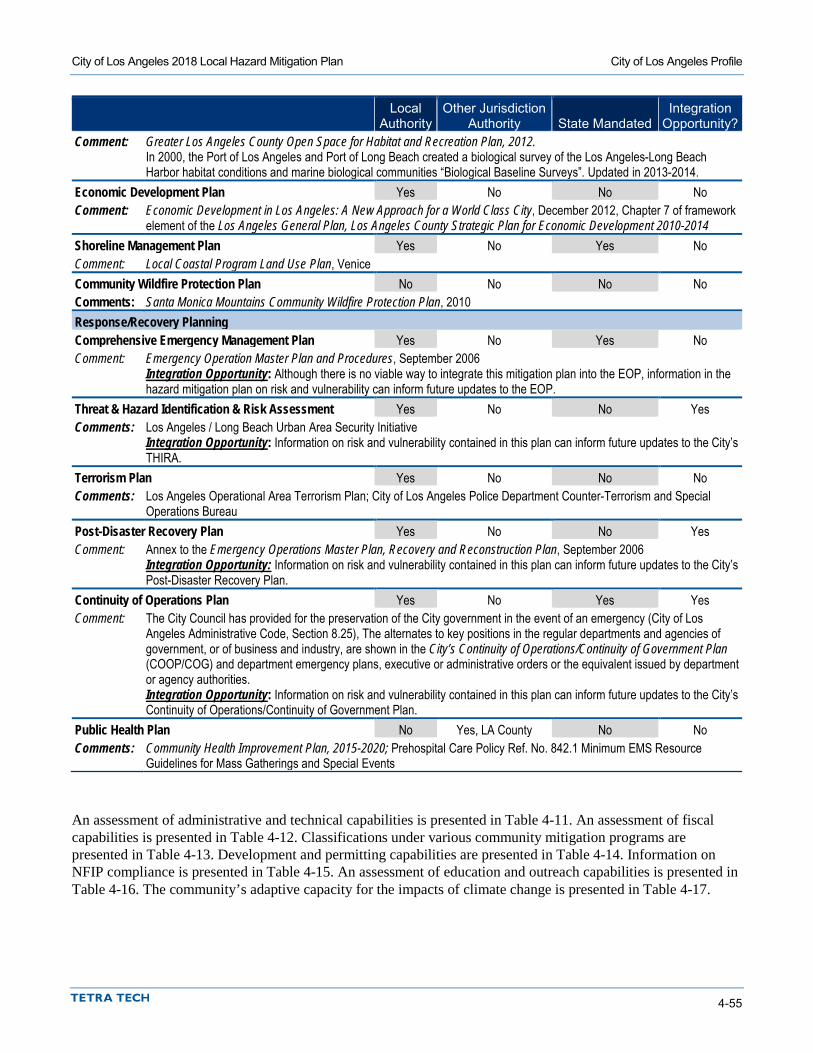
City of Los Angeles 2018 Local Hazard Mitigation Plan City of Los Angeles Profile
4-55
Local
Authority Other Jurisdiction
Authority State Mandated Integration
Opportunity? Comment: Greater Los Angeles County Open Space for Habitat and Recreation Plan, 2012.
In 2000, the Port of Los Angeles and Port of Long Beach created a biological survey of the Los Angeles-Long Beach Harbor habitat conditions and marine biological communities “Biological Baseline Surveys”. Updated in 2013-2014.
Economic Development Plan Yes No No No Comment: Economic Development in Los Angeles: A New Approach for a World Class City, December 2012, Chapter 7 of framework
element of the Los Angeles General Plan, Los Angeles County Strategic Plan for Economic Development 2010-2014 Shoreline Management Plan Yes No Yes No Comment: Local Coastal Program Land Use Plan, Venice Community Wildfire Protection Plan No No No No Comments: Santa Monica Mountains Community Wildfire Protection Plan, 2010 Response/Recovery Planning Comprehensive Emergency Management Plan Yes No Yes No Comment: Emergency Operation Master Plan and Procedures, September 2006
Integration Opportunity: Although there is no viable way to integrate this mitigation plan into the EOP, information in the hazard mitigation plan on risk and vulnerability can inform future updates to the EOP.
Threat & Hazard Identification & Risk Assessment Yes No No Yes Comments: Los Angeles / Long Beach Urban Area Security Initiative
Integration Opportunity: Information on risk and vulnerability contained in this plan can inform future updates to the City’s THIRA.
Terrorism Plan Yes No No No Comments: Los Angeles Operational Area Terrorism Plan; City of Los Angeles Police Department Counter-Terrorism and Special
Operations Bureau Post-Disaster Recovery Plan Yes No No Yes Comment: Annex to the Emergency Operations Master Plan, Recovery and Reconstruction Plan, September 2006
Integration Opportunity: Information on risk and vulnerability contained in this plan can inform future updates to the City’s Post-Disaster Recovery Plan.
Continuity of Operations Plan Yes No Yes Yes Comment: The City Council has provided for the preservation of the City government in the event of an emergency (City of Los
Angeles Administrative Code, Section 8.25), The alternates to key positions in the regular departments and agencies of government, or of business and industry, are shown in the City’s Continuity of Operations/Continuity of Government Plan (COOP/COG) and department emergency plans, executive or administrative orders or the equivalent issued by department or agency authorities. Integration Opportunity: Information on risk and vulnerability contained in this plan can inform future updates to the City’s Continuity of Operations/Continuity of Government Plan.
Public Health Plan No Yes, LA County No No Comments: Community Health Improvement Plan, 2015-2020; Prehospital Care Policy Ref. No. 842.1 Minimum EMS Resource
Guidelines for Mass Gatherings and Special Events
An assessment of administrative and technical capabilities is presented in Table 4-11. An assessment of fiscal capabilities is presented in Table 4-12. Classifications under various community mitigation programs are presented in Table 4-13. Development and permitting capabilities are presented in Table 4-14. Information on NFIP compliance is presented in Table 4-15. An assessment of education and outreach capabilities is presented in Table 4-16. The community’s adaptive capacity for the impacts of climate change is presented in Table 4-17.
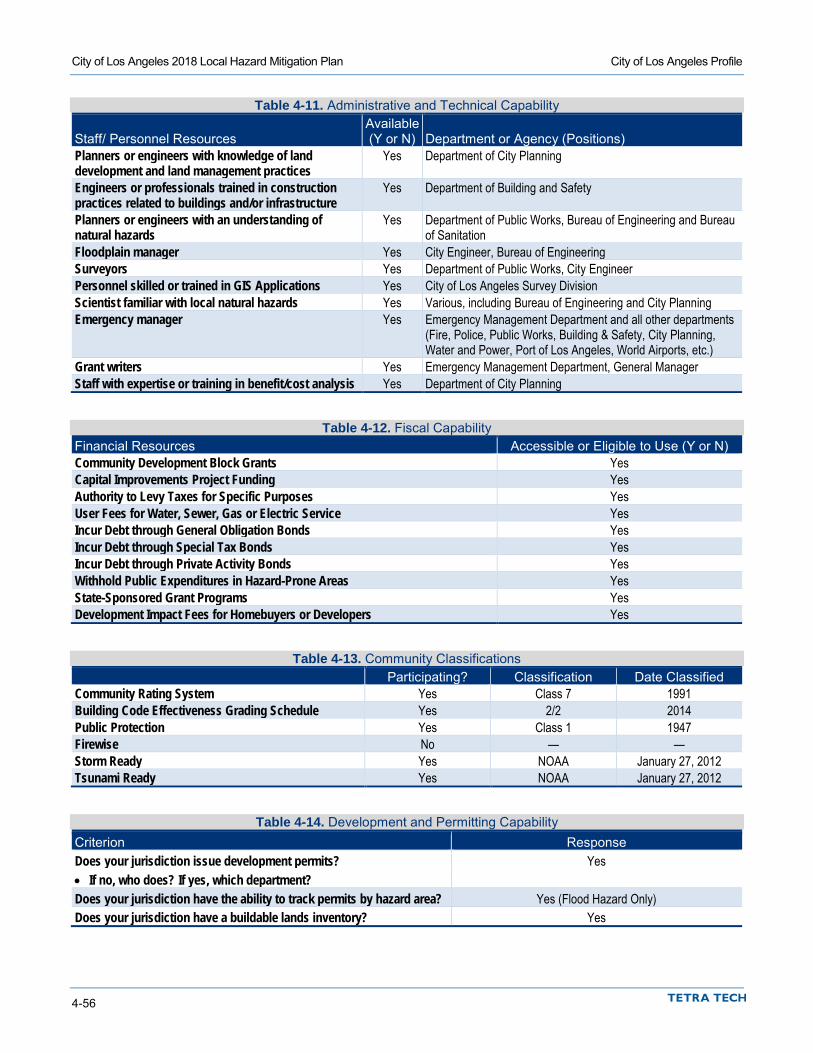
City of Los Angeles 2018 Local Hazard Mitigation Plan City of Los Angeles Profile
4-56
Table 4-11. Administrative and Technical Capability
Staff/ Personnel Resources Available (Y or N) Department or Agency (Positions)
Planners or engineers with knowledge of land development and land management practices
Yes Department of City Planning
Engineers or professionals trained in construction practices related to buildings and/or infrastructure
Yes Department of Building and Safety
Planners or engineers with an understanding of natural hazards
Yes Department of Public Works, Bureau of Engineering and Bureau of Sanitation
Floodplain manager Yes City Engineer, Bureau of Engineering Surveyors Yes Department of Public Works, City Engineer Personnel skilled or trained in GIS Applications Yes City of Los Angeles Survey Division Scientist familiar with local natural hazards Yes Various, including Bureau of Engineering and City Planning Emergency manager Yes Emergency Management Department and all other departments
(Fire, Police, Public Works, Building & Safety, City Planning, Water and Power, Port of Los Angeles, World Airports, etc.)
Grant writers Yes Emergency Management Department, General Manager Staff with expertise or training in benefit/cost analysis Yes Department of City Planning
Table 4-12. Fiscal Capability Financial Resources Accessible or Eligible to Use (Y or N) Community Development Block Grants Yes Capital Improvements Project Funding Yes Authority to Levy Taxes for Specific Purposes Yes User Fees for Water, Sewer, Gas or Electric Service Yes Incur Debt through General Obligation Bonds Yes Incur Debt through Special Tax Bonds Yes Incur Debt through Private Activity Bonds Yes Withhold Public Expenditures in Hazard-Prone Areas Yes State-Sponsored Grant Programs Yes Development Impact Fees for Homebuyers or Developers Yes
Table 4-13. Community Classifications Participating? Classification Date Classified Community Rating System Yes Class 7 1991 Building Code Effectiveness Grading Schedule Yes 2/2 2014 Public Protection Yes Class 1 1947 Firewise No — — Storm Ready Yes NOAA January 27, 2012 Tsunami Ready Yes NOAA January 27, 2012
Table 4-14. Development and Permitting Capability Criterion Response Does your jurisdiction issue development permits? Yes • If no, who does? If yes, which department? Does your jurisdiction have the ability to track permits by hazard area? Yes (Flood Hazard Only) Does your jurisdiction have a buildable lands inventory? Yes
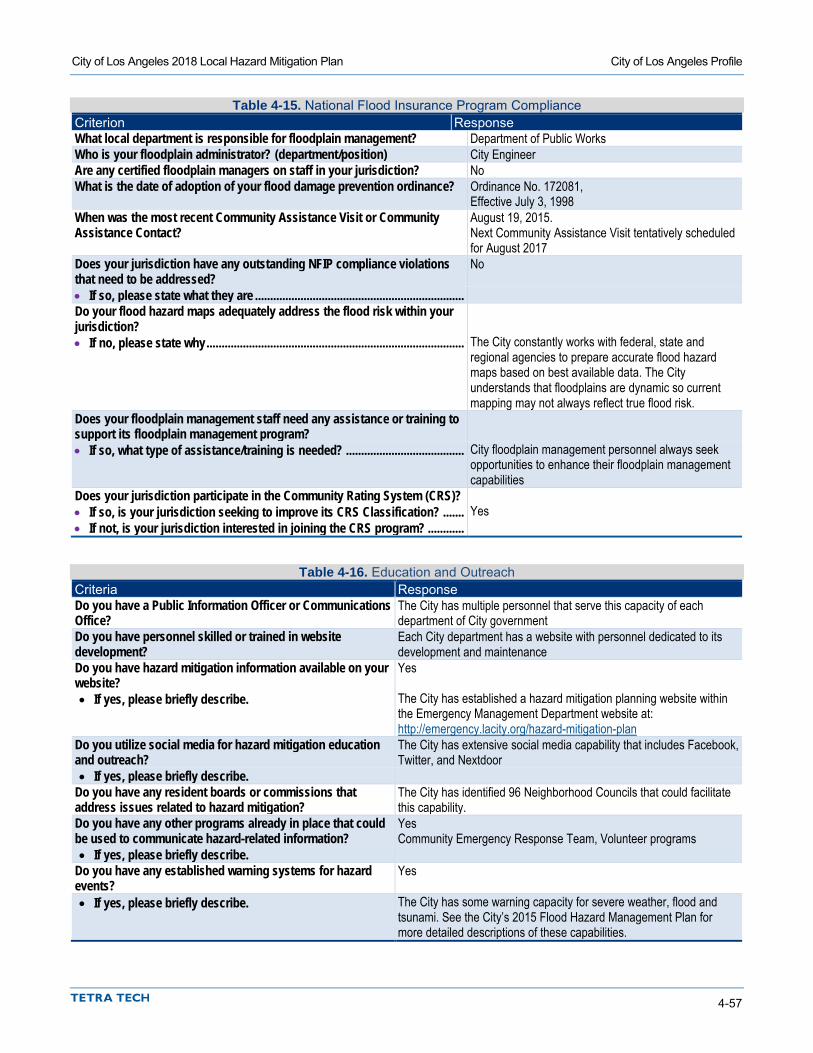
City of Los Angeles 2018 Local Hazard Mitigation Plan City of Los Angeles Profile
4-57
Table 4-15. National Flood Insurance Program Compliance Criterion Response What local department is responsible for floodplain management? Department of Public Works Who is your floodplain administrator? (department/position) City Engineer Are any certified floodplain managers on staff in your jurisdiction? No What is the date of adoption of your flood damage prevention ordinance? Ordinance No. 172081,
Effective July 3, 1998 When was the most recent Community Assistance Visit or Community Assistance Contact?
August 19, 2015. Next Community Assistance Visit tentatively scheduled for August 2017
Does your jurisdiction have any outstanding NFIP compliance violations that need to be addressed?
No
• If so, please state what they are ..................................................................... Do your flood hazard maps adequately address the flood risk within your jurisdiction?
• If no, please state why ..................................................................................... The City constantly works with federal, state and regional agencies to prepare accurate flood hazard maps based on best available data. The City understands that floodplains are dynamic so current mapping may not always reflect true flood risk.
Does your floodplain management staff need any assistance or training to support its floodplain management program?
• If so, what type of assistance/training is needed? ....................................... City floodplain management personnel always seek opportunities to enhance their floodplain management capabilities
Does your jurisdiction participate in the Community Rating System (CRS)? • If so, is your jurisdiction seeking to improve its CRS Classification? ....... Yes • If not, is your jurisdiction interested in joining the CRS program? ............
Table 4-16. Education and Outreach Criteria Response Do you have a Public Information Officer or Communications Office?
The City has multiple personnel that serve this capacity of each department of City government
Do you have personnel skilled or trained in website development?
Each City department has a website with personnel dedicated to its development and maintenance
Do you have hazard mitigation information available on your website?
Yes
• If yes, please briefly describe. The City has established a hazard mitigation planning website within the Emergency Management Department website at: http://emergency.lacity.org/hazard-mitigation-plan
Do you utilize social media for hazard mitigation education and outreach?
The City has extensive social media capability that includes Facebook, Twitter, and Nextdoor
• If yes, please briefly describe. Do you have any resident boards or commissions that address issues related to hazard mitigation?
The City has identified 96 Neighborhood Councils that could facilitate this capability.
Do you have any other programs already in place that could be used to communicate hazard-related information?
Yes Community Emergency Response Team, Volunteer programs
• If yes, please briefly describe. Do you have any established warning systems for hazard events?
Yes
• If yes, please briefly describe. The City has some warning capacity for severe weather, flood and tsunami. See the City’s 2015 Flood Hazard Management Plan for more detailed descriptions of these capabilities.
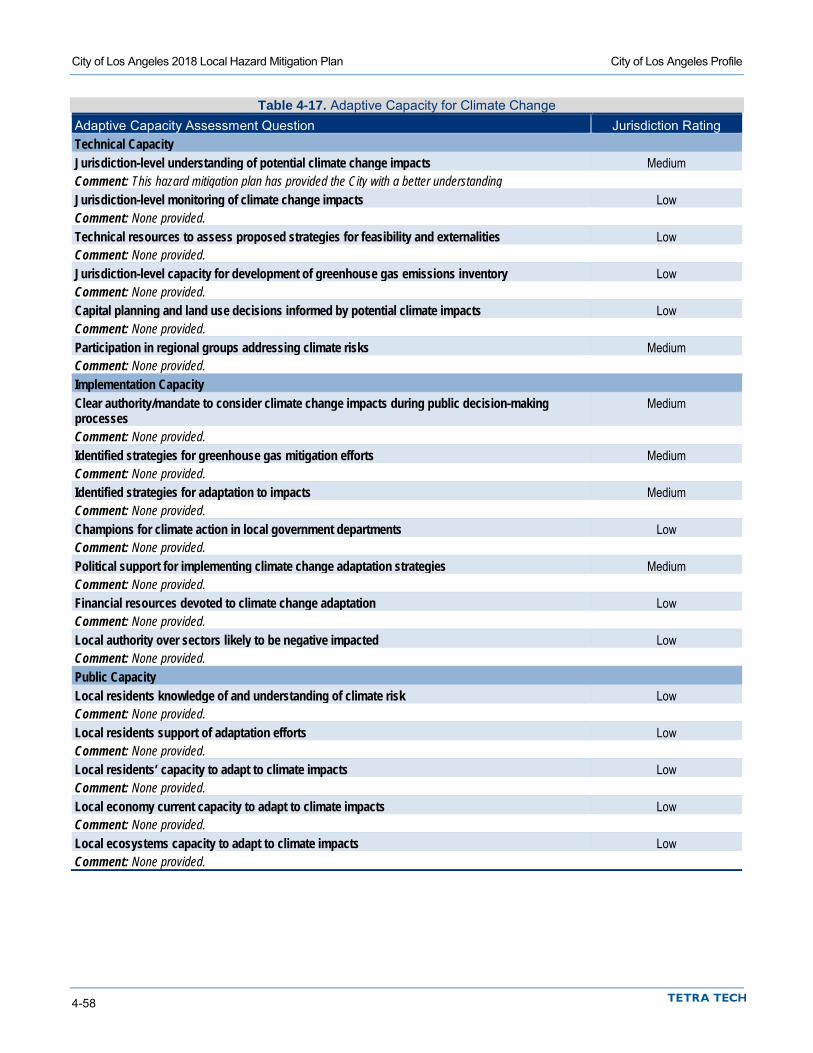
City of Los Angeles 2018 Local Hazard Mitigation Plan City of Los Angeles Profile
4-58
Table 4-17. Adaptive Capacity for Climate Change Adaptive Capacity Assessment Question Jurisdiction Rating Technical Capacity Jurisdiction-level understanding of potential climate change impacts Medium Comment: This hazard mitigation plan has provided the City with a better understanding Jurisdiction-level monitoring of climate change impacts Low Comment: None provided. Technical resources to assess proposed strategies for feasibility and externalities Low Comment: None provided. Jurisdiction-level capacity for development of greenhouse gas emissions inventory Low Comment: None provided. Capital planning and land use decisions informed by potential climate impacts Low Comment: None provided. Participation in regional groups addressing climate risks Medium Comment: None provided. Implementation Capacity Clear authority/mandate to consider climate change impacts during public decision-making processes
Medium
Comment: None provided. Identified strategies for greenhouse gas mitigation efforts Medium Comment: None provided. Identified strategies for adaptation to impacts Medium Comment: None provided. Champions for climate action in local government departments Low Comment: None provided. Political support for implementing climate change adaptation strategies Medium Comment: None provided. Financial resources devoted to climate change adaptation Low Comment: None provided. Local authority over sectors likely to be negative impacted Low Comment: None provided. Public Capacity Local residents knowledge of and understanding of climate risk Low Comment: None provided. Local residents support of adaptation efforts Low Comment: None provided. Local residents’ capacity to adapt to climate impacts Low Comment: None provided. Local economy current capacity to adapt to climate impacts Low Comment: None provided. Local ecosystems capacity to adapt to climate impacts Low Comment: None provided.

City of Los Angeles 2018 Local Hazard Mitigation Plan
PART 2—RISK ASSESSMENT


5-1
5. HAZARDS OF CONCERN, RISK ASSESSMENT METHODOLOGY
Risk assessment is the process of measuring the potential loss of life, personal injury, economic injury, and property damage resulting from identified hazards. It allows emergency management personnel to establish early response priorities by identifying potential hazards and vulnerable assets. The process focuses on the following elements:
• Hazard identification—Use all available information to determine what types of hazards may affect a jurisdiction, how often they can occur, and their potential severity.
• Exposure identification—Estimate the total number of people and properties in the jurisdiction that are likely to experience a hazard event if it occurs.
• Vulnerability identification and loss estimation—Assess the impact of hazard events on the people, property, environment, economy and lands of the region, including estimates of the cost of potential damage or cost that can be avoided by mitigation.
The risk assessment for this hazard mitigation plan update evaluates the risk of natural hazards prevalent in the planning area and meets requirements of the Disaster Mitigation Act (44 CFR, Section 201.6(c)(2)). To protect individual privacy and the security of critical facilities, information on properties assessed is presented in aggregate, without details about specific individual properties.
5.1 IDENTIFIED HAZARDS OF CONCERN The Steering Committee considered the full range of natural hazards that could affect the planning area and then listed hazards that present the greatest concern. The process incorporated a review of state and local hazard planning documents as well as information on the frequency of, magnitude of, and costs associated with hazards that have struck the planning area or could do so. Anecdotal information regarding natural hazards and the perceived vulnerability of the planning area’s assets to them was also used. Based on the review, this plan addresses the following hazards of concern (presented in alphabetical order; the order of listing does not indicate the hazards’ relative severity):
• Adverse weather • Climate change and sea-level rise • Dam failure • Drought • Earthquake • Flood • Landslide • Tsunami • Wildland/Urban Interface Fire • Human-caused hazards.
City of Los Angeles 2018 Local Hazard Mitigation Plan Hazards of Concern, Risk Assessment Methodology
5-2
5.2 RISK ASSESSMENT TOOLS
5.2.1 Mapping National, state, county, and city databases were reviewed to locate available spatially based data relevant to this planning effort. Maps were produced using geographic information system (GIS) software to show the spatial extent and location of hazards when such datasets were available. Data used for this plan update represents the best science currently available. All data used was approved by the City of Los Angeles for use in this plan update. These maps are included in the hazard profile chapters of this document. Sources and methods used to generate the maps are described in Appendix B.
5.2.2 Hazus
Overview FEMA developed the standardized GIS-based software program Hazards U.S. (Hazus) to estimate losses caused by earthquakes, hurricanes and floods and identify areas that face the highest risk and potential for loss. Hazus is used to support risk assessments, mitigation planning, and emergency planning and response. It provides a wide range of inventory data, such as demographics, building stock, critical facilities, and transportation and utility infrastructure, and multiple models to estimate potential losses from natural disasters. The program maps and calculates hazard data and damage and economic loss estimates for buildings and infrastructure. Its advantages include the following:
• Provides a consistent methodology for assessing risk across geographic and political entities. • Provides a way to save data so that they can readily be updated as population, inventory, and other factors
change and as mitigation planning efforts evolve. • Facilitates review of mitigation plans because it helps to ensure that FEMA methodologies are
incorporated. • Supports grant applications by calculating benefits using FEMA definitions and terminology. • Produces hazard data and loss estimates that can be used in communication with local stakeholders. • Is administered by the local government and can be used to manage and update a hazard mitigation plan
throughout its implementation.
Levels of Detail for Evaluation Hazus provides default data for inventory, vulnerability, and hazards; these default data can be supplemented with local data to provide a more refined analysis. The model can carry out three levels of analysis:
• Level 1—All of the information needed to produce an estimate of losses is included in the software’s default data. These data are derived from national databases and describe in general terms the characteristic parameters of the planning area.
• Level 2—More accurate estimates of losses require more detailed information about the planning area. To produce Level 2 estimates of losses, detailed information is required about local geology, hydrology, hydraulics, and building inventory, as well as data about utilities and critical facilities. This information is needed in a GIS format.
• Level 3—This level of analysis generates the most accurate estimate of losses. It requires detailed engineering and geotechnical information to customize it for the planning area.
City of Los Angeles 2018 Local Hazard Mitigation Plan Hazards of Concern, Risk Assessment Methodology
5-3
5.3 RISK ASSESSMENT APPROACH The risk assessments in this plan describe the risks associated with each hazard of concern identified. The following steps were used to define the risk of each hazard:
• Identify and profile each hazard—The following information is given for each hazard:
The local history of previous events associated with the hazard Geographic areas most affected by the hazard Estimated event frequency A qualitative assessment of the potential severity of events associated with the hazard Warning time likely to be available for response.
• Determine exposure to each hazard—Exposure was assessed by overlaying hazard maps with an inventory of structures, facilities, and systems to decide which of them would be exposed to each hazard.
• Assess the vulnerability of exposed facilities—Vulnerability of exposed structures and infrastructure was evaluated by interpreting the probability of occurrence of each event and assessing structures, facilities, and systems that are exposed to each hazard.
5.3.1 Dam Failure, Earthquake, Tsunami, Sea Level Rise and Flood The following hazards were evaluated using Hazus:
• Flood—A Level 2 user-defined analysis was performed for general building stock in flood zones and for critical facilities and infrastructure. Current flood mapping for the planning area was used to delineate flood hazard areas and estimate potential losses from the 1-percent-annual-chance and 0.2-percent-annual-chance flood events. To estimate damage that would result from a flood, Hazus uses pre-defined relationships between flood depth at a structure and resulting damage, with damage given as a percent of total replacement value. Curves defining these relationships have been developed for damage to structures and for damage to typical contents within a structure. By inputting flood depth data and known property replacement cost values, dollar-value estimates of damage were generated.
• Dam Failure—A Level 2 analysis was run using the flood methodology described above. • Sea Level Rise—A Level 2 analysis was run using the flood methodology described above. • Tsunami—A modified Level 2 analysis was run using the flood methodology described above. • Earthquake—A Level 2 analysis was performed to assess earthquake exposure and vulnerability for five
scenario events:
A Magnitude 7.2 event on the Newport-Inglewood Fault with an epicenter 32 miles southeast of downtown Los Angeles.
A Magnitude 7.3 event on the Palos Verde Fault with an epicenter 55 miles south southeast of downtown Los Angeles.
A Magnitude 7.0 event on the Puente Hills Fault with an epicenter 11.5 miles northeast of downtown Los Angeles.
A Magnitude 7.8 event on the San Andreas Fault with an epicenter 150 miles east southeast of downtown Los Angeles.
A Magnitude 6.8 event on the Santa Monica Fault with an epicenter 9.5 miles northwest of downtown Los Angeles.
City of Los Angeles 2018 Local Hazard Mitigation Plan Hazards of Concern, Risk Assessment Methodology
5-4
5.3.2 Drought The risk assessment methodologies used for this plan focus on damage to structures. The risk assessment for drought was more limited and qualitative than the assessment for the other hazards of concern because drought does not affect structures.
5.3.3 All Other Assessed Hazards Historical datasets were not adequate to model future losses for most of the hazards of concern. However, areas and inventory susceptible to some of the hazards of concern were mapped by other means, and exposure was evaluated. A qualitative analysis was conducted for other hazards using the best available data and professional judgment.
5.4 SOURCES OF DATA USED IN HAZUS MODELING
5.4.1 Building and Cost Data Replacement cost values and detailed structure information derived from parcel and tax assessor data provided by the City of Los Angeles were loaded into Hazus. When available, an updated inventory was used in place of the Hazus defaults for critical facilities and infrastructure.
Replacement cost is the cost to replace the entire structure with one of equal quality and utility. Replacement cost is based on industry-standard cost-estimation models published in RS Means Square Foot Costs (RS Means, 2017). It is calculated using the RS Means square foot cost for a structure, which is based on the Hazus occupancy class (i.e., multi-family residential or commercial retail trade), multiplied by the square footage of the structure from the tax assessor data. The construction class and number of stories for single-family residential structures also factor into determining the square-foot costs.
5.4.2 Hazus Data Inputs The following hazard datasets were used for the Hazus Level 2 analysis conducted for the risk assessment:
• Flood—The effective Digital Flood Insurance Rate Map (DFIRM) for the planning area was used to delineate flood hazard areas and estimate potential losses from the 1-percent-annual-chance and 0.2-percent-annual-chance flood events. For the City’s 2015 Floodplain Management Plan, the DFIRM floodplain boundaries and base flood elevation information, and Los Angeles County’s 5-foot digital elevation model data, were used to generate flood depth grids. These depth grids were updated with Letter of Map Revision data issued since 2015, and integrated into the Hazus model for this plan.
• Dam Failure—For the City’s 2015 Floodplain Management Plan, dam inundation area data provided by the County, and the County’s 5-foot digital elevation model were used to develop depth grids. These depth grids were integrated into the Hazus model for this plan. Inundation areas for the following dams were included: Lower Franklin No.2, Los Angeles Reservoir, Mulholland, Pacoima, Sepulveda, Silver Lake, Devils Gate, Eagle Rock, Elysian, Encino, Big Tijunga No. 1, Green Verdugo, Greystone Reservoir, Hansen, Lopez, Palos Verdes Reservoir, Riviera Reservoir, Santa Ynez Canyon, Stone Canyon, and Upper Franklin.
• Tsunami—For the City’s 2015 Floodplain Management Plan, tsunami inundation zone data, provided by the California Department of Conservation, and the County’s 5-foot digital elevation model were used to develop depth grids. These depth grids were integrated into the Hazus model for this plan.
• Sea Level Rise—Depth grids for sea level rises of 25-cm and 150-cm with 100-year storm surge provided by the U.S. Geological Survey (USGS) were integrated into the Hazus model. This Coastal Storm Modeling System data is identified by California’s Cal-Adapt program as a sea level rise data resource.

City of Los Angeles 2018 Local Hazard Mitigation Plan Hazards of Concern, Risk Assessment Methodology
5-5
• Earthquake—Earthquake shake maps prepared by the USGS were used for the analysis of this hazard. Landslide susceptibility data from the California Geological Survey and the City’s liquefaction zones data were also integrated into the Hazus model.
5.4.3 Other Local Hazard Data Locally relevant information on hazards was gathered from a variety of sources. Frequency and severity indicators include past events and the expert opinions of geologists, emergency management specialists, and others. Data sources for specific hazards were as follows:
• Landslide—Susceptibility to deep-seated landslides data were provided by the California Geological Survey, dated 2011. Areas categorized as very high (source data Category X) and high (Categories VII, VIII, and IX) were used in the exposure analysis. This data was approved by the Building and Safety Division as the appropriate data to use for this assessment.
• Adverse Weather—No GIS format adverse weather area datasets were identified for the City of Los Angeles.
• Wildfire—Fire severity data was acquired from California Department of Forestry and Fire Protection (CAL FIRE).
• Climate Change—Climate change related projections, data and visualization tools were provided by Cal-Adapt, an online resource that provides information on how climate change might affect local communities in California, unless otherwise indicated. The data available on Cal-Adapt is from a variety of organizations in the scientific community and represents peer-reviewed science.
5.4.4 Data Source Summary Table 5-1 summarizes the data sources used for the risk assessment for this plan.
5.5 LIMITATIONS Loss estimates, exposure assessments, and hazard-specific vulnerability evaluations rely on the best available data and methodologies. Uncertainties are inherent in any loss estimation methodology and arise in part from incomplete scientific knowledge concerning natural hazards and their effects on the built environment. Uncertainties also result from the following:
• Approximations and simplifications necessary to conduct a study • Incomplete or outdated inventory, demographic or economic parameter data • The unique nature, geographic extent, and severity of each hazard • Mitigation measures already employed • The amount of advance notice residents have to prepare for a specific hazard event. • The liquefaction zones data used in the earthquake analysis did not include the level of liquefaction
susceptibility information required by the Hazus model. For the purpose of the analysis, it was assumed that areas within the zones had a moderate susceptibility.
These factors can affect loss estimates by a factor of two or more. Therefore, potential exposure and loss estimates are approximate and should be used only to understand relative risk. Over the long term, the City of Los Angeles will collect additional data to assist in estimating potential losses associated with other hazards.

City of Los Angeles 2018 Local Hazard Mitigation Plan Hazards of Concern, Risk Assessment Methodology
5-6
Table 5-1. Hazus Model Data Documentation Data Source Date Format Building footprints City of Los Angeles 2014 Digital (GIS) format Address points City of Los Angeles 2016 Digital (GIS) format Property parcels (includes tax roll data such as use code, year built, number of stories, and square footage)
Los Angeles County 2015 Digital (GIS) format
Soft-story apartments City of Los Angeles 2016 Digital (spreadsheet) format Building replacement cost RS Means 2017 Paper format Demographic data FEMA Hazus version 3.2 2010 Digital (GIS and tabular) format Population data U.S. Census Bureau American
Community Survey 5-Year Population Estimates
2015 Digital (tabular) format
Flood depth grids (created from FEMA effective DFIRM data)
2015 City of Los Angeles Floodplain Management Plan
2015 Digital (GIS) format
Letters of Map Revision FEMA 2016 Digital (GIS) format Tsunami inundation depth grids (created from CA Dept. of Conservation data)
2015 City of Los Angeles Floodplain Management Plan
2015 Digital (GIS) format
Earthquake shake maps USGS Earthquake Hazards Program website
2012-2015 Digital (GIS) format
Susceptibility to Deep-Seated Landslides CA Geological Survey 2011 Digital (GIS) format Liquefaction zones Los Angeles County (via City of Los
Angeles GIS data portal) 2016 Digital (GIS) format
National Earthquake Hazard Reduction Program Soils
California Department of Conservation 2008 Digital (GIS) format
Dam inundation depth grids (created from Los Angeles County data)
2015 City of Los Angeles Floodplain Management Plan
2015 Digital (GIS) format
Coastal Storm Modeling System sea level rise data (version 3.0 Phase 2)
U.S. Geological Survey 2017 Digital (GIS) format
Fire Hazard Severity Zones in Local Responsibility Area
CA Dept. of Forestry and Fire Protection 2008 Digital (GIS) format
Digital Elevation Model (5ft resolution) Los Angeles County 2006 Digital (GIS) format General Plan Land Use City of Los Angeles 2015 Digital (GIS) format Critical Facilities and Assets Critical facilities inventory 2015 City of Los Angeles Floodplain
Management Plan 2015 Digital (GIS) format
Big 20 buildings City of Los Angeles 2017 Digital (text) format Locations/Points of Interest Los Angeles County 2016 Digital (GIS) format Hospitals Los Angeles County 2011 Digital (GIS) format County-owned facilities Los Angeles County 2016 Digital (GIS) format Port of Los Angeles berths, docks, slips Los Angeles County 2014 Digital (GIS) format
6-1
6. ADVERSE WEATHER
6.1 GENERAL BACKGROUND Adverse weather refers to any dangerous meteorological phenomenon with the potential to cause damage, serious social disruption, or loss of human life. It includes thunderstorms, high winds, tornadoes, waterspouts, extreme temperatures, fog, ice storms, and dust storms.
Adverse weather can be categorized into two groups: systems that form over wide geographic areas are classified as general adverse weather; those with a more limited geographic area are classified as localized adverse weather. Adverse weather, technically, is not the same as extreme weather, which refers to unusual weather events at the extremes of the historical distribution for a given area.
The most common adverse weather events in Los Angeles are extreme heat, high winds, and tornadoes. These are described in the following sections. Flooding and beach erosion issues associated with adverse weather are discussed in Chapter 10.
6.1.1 Extreme Heat Extreme heat is defined as temperatures that hover 10 ºF or more above the average high temperatures for a region for several weeks. In Los Angeles, the summers are hot, but the combination of high temperature and high humidity, which are requirements for the National Weather Service (NWS) to declare a heat emergency, are relatively rare.
According to the California Climate Adaptation Strategy, heat waves have claimed more lives in California than all other declared disaster events combined. Despite this history, not a single heat emergency was proclaimed at the state or federal level between 1960 and 2016. Heat emergencies are often slow to develop and usually hurt vulnerable populations. It could take a number of days of oppressive heat for a heat wave to have a significant or quantifiable impact in Los Angeles. Heat waves do not strike victims immediately, but rather their cumulative effects slowly take the lives of vulnerable populations.
Los Angeles is experiencing more heat waves and more extreme heat days. Heat waves have increased by more than three per century and extreme heat days have increased by 23 per century. Both have more than tripled over the past 100 years as a consequence of the steady warming of Los Angeles. The average annual maximum temperature in Los Angeles has warmed by 5.0°F, and the average annual minimum temperature has warmed by 4.2°F. The greatest rate of change was during the summer for both maximum and minimum temperature, with late
DEFINITIONS Extreme Heat—Temperatures that hover 10 degrees or more above the average high temperature for a region and last for several weeks. Humid or muggy conditions occur when a “dome” of high atmospheric pressure traps hazy, damp air near the ground. Extremely dry and hot conditions can lead to dust storms and low visibility. Severe Local Storm—Small atmospheric systems, including tornadoes, thunderstorms, windstorms, ice storms and snowstorms. Typically, major impacts from a severe local storm are on transportation infrastructure and utilities. These storms may cause a great deal of destruction and even death, but their impact is generally confined to a small area. Thunderstorm—Any rain event that includes thunder and lightning. A typical thunderstorm is about 15 miles in diameter and lasts about 30 minutes. Tornado—Tornadoes are funnel clouds of varying sizes that touch ground. They can affect an area up to three-quarters of a mile wide, with a path of varying length. Tornadoes are measured using the Fujita Scale ranging from F0 to F5, or the Enhanced Fujiti Scale. Windstorm—A storm featuring violent winds. Windstorms are generally short-duration events involving straight-line winds or gusts of over 50 mph, strong enough to cause property damage.
City of Los Angeles 2018 Local Hazard Mitigation Plan Adverse Weather
6-2
fall and early winter having the least rates of change. There was also an increase in heat wave duration. Heat waves lasting longer than six days occurred regularly after the 1970s but were nonexistent from 1906 until 1956, when the first six-day heat wave was recorded (Tamrazian et al. 2008).
Because of its expansive urban size, Los Angeles is identified as an urban heat island (UHI). UHIs develop in urban areas where natural surfaces are paved with asphalt or covered by buildings. Radiation from the sun is absorbed by these surfaces during the day and re-radiated at night, raising ambient temperatures. UHIs have high nighttime minimum temperatures compared to neighboring areas. Waste heat from air conditioners, vehicles, and other equipment contributes to the UHI effect.
6.1.2 High Winds High winds are generally short-duration events involving straight-line winds or gusts of over 50 mph, strong enough to cause property damage. High winds or a windstorm are especially dangerous in areas with significant tree stands and areas with exposed property, poorly constructed buildings, manufactured housing units, major infrastructure, and above-ground utility lines. A windstorm can topple trees and power lines, cause damage to residential, commercial and critical facilities, and leave tons of debris in its wake.
Types of Damaging Winds Damaging winds are classified as those exceeding 60 mph. Damage from such winds accounts for half of all adverse weather reports in the lower 48 states and is more common than damage from tornadoes. Wind speeds can reach up to 100 mph and can produce a damage path extending for hundreds of miles. There are seven types of damaging winds:
• Straight-line winds—Any thunderstorm wind that is not associated with rotation; this term is used mainly to differentiate from tornado winds. Most thunderstorms produce some straight-line winds as a result of outflow generated by the thunderstorm downdraft.
• Downdrafts—A small-scale column of air that rapidly sinks toward the ground. • Downbursts—A strong downdraft with horizontal dimensions larger than 2.5 miles resulting in an
outward burst or damaging winds on or near the ground. Downburst winds may begin as a microburst and spread out over a wider area, sometimes producing damage similar to a strong tornado. Although usually associated with thunderstorms, downbursts can occur with showers too weak to produce thunder.
• Microbursts—A small concentrated downburst that produces an outward burst of damaging winds at the surface. Microbursts are generally less than 2.5 miles across and short-lived, lasting only 5 to 10 minutes, with maximum wind speeds up to 168 mph. There are two kinds of microbursts: wet and dry. A wet microburst is accompanied by heavy precipitation at the surface. Dry microbursts, common in places like the high plains and the intermountain west, occur with little or no precipitation reaching the ground.
• Gust front—A gust front is the leading edge of rain-cooled air that clashes with warmer thunderstorm inflow. Gust fronts are characterized by a wind shift, temperature drop, and gusty winds out ahead of a thunderstorm. Sometimes the winds push up air above them, forming a shelf cloud or detached roll cloud.
• Derecho—A derecho is a widespread thunderstorm wind caused when new thunderstorms form along the leading edge of an outflow boundary (the boundary formed by horizontal spreading of thunderstorm-cooled air). The word “derecho” is of Spanish origin and means “straight ahead.” Thunderstorms feed on the boundary and continue to reproduce. Derechos typically occur in summer when complexes of thunderstorms form over plains, producing heavy rain and severe wind. The damaging winds can last a long time and cover a large area.
• Bow Echo—A bow echo is a linear wind front bent outward in a bow shape. Damaging straight-line winds often occur near the center of a bow echo. Bow echoes can be 200 miles long, last for several hours, and produce extensive wind damage at the ground.

City of Los Angeles 2018 Local Hazard Mitigation Plan Adverse Weather
6-3
Santa Ana Winds Santa Ana winds are a principal feature of Los Angeles weather. These are offshore winds, usually warm, blowing from the mountains to the coast, and occurring principally in fall and winter, with a frequency peaking in December. Santa Ana winds are marked by light coastal winds, clean air and low humidity. They may last from a day to over a week. The Santa Ana condition is usually one of warm temperatures when the rest of the United States is in the grip of winter. High pressure builds over the Great Basin in fall and winter as cold air travels into that region from Canada. When the surface pressure gradient reaches or exceeds 10 millibars, as measured from Tonopah, Nevada, to Los Angles, wind gusts can reach 70 mph in the mountains and below passes and canyons near Los Angeles.
Santa Ana winds broadly affect the Los Angeles area. Winds tend to channel below specific passes and canyons, coming in gust clusters. High winds may blow in one neighborhood, while a few blocks away there are only gentle warm breezes. Offshore winds from the northeast or east must reach 30 mph or more below passes and canyons to reach minimum criteria for Santa Ana wind advisories. Typically wind speeds are in the 40 to 55 mph range, and in extreme cases, winds can gust locally to over 100 mph.
6.1.3 Tornadoes A tornado is a violently rotating column of air extending between, and in contact with, a cloud and the surface of the earth. Tornadoes are often (but not always) visible as a funnel cloud. On a local-scale, tornadoes are the most intense of all atmospheric circulations and wind can reach destructive speeds of more than 300 mph. A tornado’s vortex is typically a few hundred meters in diameter, and damage paths can be up to 1 mile wide and 50 miles long. Figure 6-1, adapted from FEMA, illustrates the potential impacts and damage from tornadoes of different magnitude. Tornadoes can occur throughout the year at any time of day but are most frequent in the spring during the late afternoon.
In 2007, NWS began rating tornadoes using the Enhanced Fujita Scale (EF-scale). The EF-scale is a set of wind estimates (not measurements) based on damage. It uses 3-second gusts estimated at the point of damage based on a judgment of 8 levels of damage to 28 indicators. These estimates vary with height and exposure. Standard measurements are taken by weather stations in openly exposed area. Table 6-1 describes the EF-scale ratings (NOAA 2007).
Table 6-1. The Fujita Scale and Enhanced Fujita Scale Fujita (F) Scale Derived Operational Enhanced Fujita (EF) Scale
F Number
Fastest ¼ mile (mph)
3-second gust (mph) EF Number
3-second gust (mph) EF Number
3-second gusts (mph)
0 40-72 45-78 0 65-85 0 65-85 1 73-112 79-117 1 86-109 1 86-110 2 113-157 118-161 2 110-137 2 111-135 3 158-207 162-209 3 138-167 3 136-165 4 208-260 210-261 4 168-199 4 166-200 5 261-318 262-317 5 200-234 5 Over 200
The south coastal region of California, including the Los Angeles area, has the greatest incidence of tornadoes in the state. The cause of most Los Angeles area tornadoes is the terrain of the basin—specifically the natural curvature of the shoreline and the location of the coastal mountains. Tornadoes in the Los Angeles area are typically less severe than those in other parts of the country. They are typically not high in intensity and are short-lived. There is no record of a Los Angeles tornado causing a fatality, and the state has never proclaimed a state of emergency or had a federal disaster declared as the result of a tornado. Nevertheless, the frequency of tornadoes and the density of the Los Angeles urban area make tornadoes a relevant hazard for the City.

City of Los Angeles 2018 Local Hazard Mitigation Plan Adverse Weather
6-4
Figure 6-1. Potential Impact and Damage from a Tornado

City of Los Angeles 2018 Local Hazard Mitigation Plan Adverse Weather
6-5
6.2 HAZARD PROFILE
6.2.1 Past Events Los Angeles has not been included in any federal declarations for extreme heat, high winds or tornado. According to the Western Regional Climate Center, the planning area averages 20 days a year with temperatures exceeding 90°F, and those days may be included in a heat wave event. A storm event database maintained by NOAA’s National Centers for Environmental Information (NCEI) lists three excessive heat events in the planning area:
• July 2006—In July 2006, California and Nevada were impacted by a heat wave that was unprecedented with respect to the magnitude and duration of high temperatures, especially high nighttime minimums; great areal extent, as it simultaneously impacted both northern and Southern California; and very high humidity levels (Los Angeles Times, 25 July 2006). The events are credited with 163 deaths in California. A temperature of 119ºF was recorded in Woodland Hills, with high humidity.
• August 30 – September 3, 2007—The combination of above normal temperatures and relative humidity produced excessive heat across the planning area. Eight fatalities occurred related to the heat. Heat index values were between 105 and 112 degrees.
• June 20 – 21, 2008—The combination of strong high pressure centered over Arizona and weak offshore flow generated extreme heat conditions across Central and Southern California. Across many sections of the area, afternoon temperatures climbed to between 100ºF and 114ºF, setting numerous high temperature records. The extreme heat resulted in several power outages due to excessive electrical use.
Los Angeles County has experienced both high wind and thunderstorm wind events. The strongest winds, from the north, are Santa Ana winds in winter. As an example of the impacts from high wind storms, a windstorm on Nov. 30, 2011 left 300,000 customers without power, some over one week. The NCEI storm events database lists the following wind events from 1996 to 2016:
• 173 high wind events, with 96 categorized as damaging winds events • 25 thunderstorm events, with 7 categorized as damaging wind events.
According to NCEI storm events database, Los Angeles County experienced 35 tornadoes from 1970 through 2016, with 34 injuries and over $60 million in property damage. The recorded tornado events are rated as F0 (25 events), EF0 (two events), F1 (six events), and the strongest recorded F2 (three events). The following are notable tornado events in the City of Los Angeles:
• March 1, 1983—An F2 tornado touched down in South-Central Los Angeles. It caused approximately $25 million in damage, including 100 homes, and injured 30 people. It stopped about 1 mile before reaching the Los Angeles civic center area.
• December 12, 2014—An EF0 tornado developed in south Los Angeles. The tornado damaged the roof of an apartment complex, two residential roofs and a steel billboard.
6.2.2 Location Adverse weather events have the potential to happen anywhere in the planning area. Extreme heat events may be exacerbated in the City where reduced air flow, reduced vegetation, and increased generation of waste heat can contribute to temperatures that are several degrees higher than in surrounding less urbanized areas. High wind events affect an entire region.

City of Los Angeles 2018 Local Hazard Mitigation Plan Adverse Weather
6-6
6.2.3 Frequency The adverse weather events for the planning area are often related to high winds associated with winter storms and thunderstorms. Based on a record of 103 damaging wind events (over 60 mph) in 21 years, the planning area will continue to experience these on an annual basis.
Even though the NCEI storm events database lists only two documented past events for extreme heat, Steering Committee members for this update report that extreme heat days occur a few days each year during summer.
Tornadoes may occur in any month and at any hour of the day, but they occur with the greatest frequency from November through March. There are only three recorded F2 tornado events from 1970 to 2016, therefore on average, a considerable tornado may occur every six years. There is a 68 percent chance of a light to moderate tornado occurring in any year.
6.2.4 Severity The most common problems associated with severe storms are immobility and loss of utilities. Fatalities are uncommon, but can occur. Roads may become impassable due to flooding, downed trees, or a landslide. Power lines may be downed due to high winds, and services such as water or phone may not be able to operate without power. Physical damage to homes and facilities can be caused by wind or flooding.
Extreme heat can cause heat exhaustion, in which the body becomes dehydrated, resulting in an imbalance of electrolytes. Without intervention, heat exhaustion can lead to collapse and heatstroke. Heatstroke occurs when perspiration cannot occur and the body overheats. Without intervention, heatstroke can lead to confusion, coma, and death. Extreme heat is the primary weather-related cause of death in the U.S. In a 10-year record of weather fatalities across the nation from (2006-2015), excessive heat claimed more lives each year than floods, lightning, tornadoes, and hurricanes. In 2015, heat claimed 25 lives, though none of them were in California (NWS 2016b). Extreme heat events do not typically impact buildings; however, losses may be associated with the UHI effect and overheating of HVAC systems. These extreme heat events can lead to drought, impact water supplies, and lead to an increase in heat-related illnesses and deaths.
High winds are a frequent problem in the planning area and have been known to damage utilities. The wind speed given in wind warnings issued by the NWS is for a one-minute average; gusts may be 25 to 30 percent higher.
Tornadoes generally have low intensity in the planning area, but if a major tornado were to strike the dense planning area, damage could be widespread. Businesses could be forced to close for an extended period or permanently, fatalities could be high, many people could be homeless for an extended period, and routine services such as telephone or power could be disrupted. Buildings may be damaged or destroyed. California ranks 32nd among states for frequency of tornadoes, 44th for the frequency of tornados per square mile, 36th for injuries, and 31st for cost of damage. The state has no reported deaths from tornadoes.
6.2.5 Warning Time Meteorologists can often predict the likelihood of severe storms. This can give several days of warning time. However, meteorologists cannot predict the exact time of onset or severity of the storm. Some storms may come on more quickly and have only a few hours of warning time. NOAA issues watch, warning, and advisory information for extreme heat, high winds, and tornadoes.
The NWS is producing experimental forecasts called HeatRisk to assess the heat risk to local thresholds in California, Nevada, Utah, and Arizona (see Figure 6-2). The numeric (0-4) and color (green, yellow, orange, red and magenta) scales are similar to the NWS air quality index.
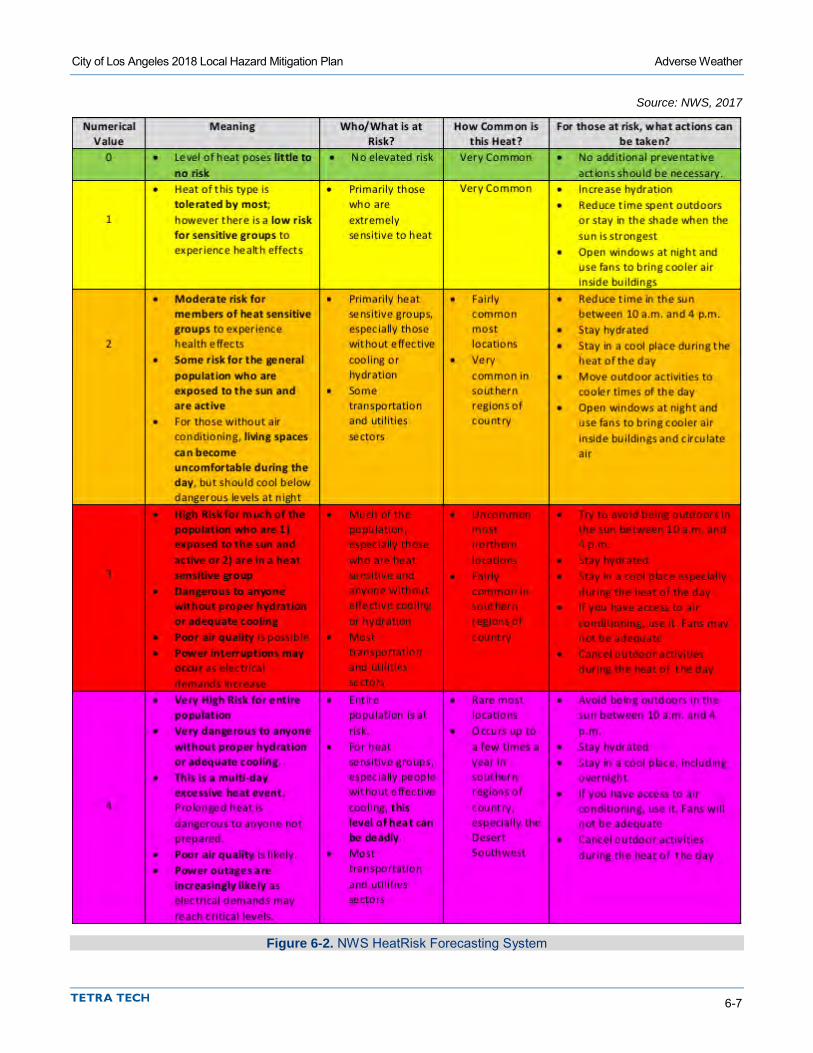
City of Los Angeles 2018 Local Hazard Mitigation Plan Adverse Weather
6-7
Source: NWS, 2017
Figure 6-2. NWS HeatRisk Forecasting System

City of Los Angeles 2018 Local Hazard Mitigation Plan Adverse Weather
6-8
The NWS continues to issue excessive heat watches, excessive heat warnings and heat advisories to warn of an extreme heat event (a “heat wave”) within the next 36 hours. If NWS forecasters predict an excessive heat event beyond 36 hours, then the NWS will issue messaging in the form of a special weather statement, partner emails and social media out between the three- to seven-day timeframe. The NWS will use the HeatRisk output (Figure 6-2) to determine if an excessive heat watch/warning or heat advisory is warranted. The NWS issues the following types of heat-related advisories:
• Heat Advisory—Tied to events where HeatRisk output is on the orange/red (Level 2-3) thresholds (orange will not be an automatic heat advisory).
• Excessive Heat Watch/Warning— Tied to events where HeatRisk output is on the red/magenta (Level 3-4) thresholds.
These advisories are intended to raise the public’s awareness to prevent heat illnesses from occurring. If significantly hot weather is forecasted, the NWS will issue an excessive heat watch generally two to three days in advance. An excessive heat watch is a way to give the public and emergency officials a warning that extreme temperatures are expected. If significantly hot temperatures remain in the forecast for 24 to 28 hours, the excessive heat watch will be upgraded to an excessive heat warning, indicating that extreme heat has either arrived or is expected soon.
6.3 SECONDARY IMPACTS A secondary impact of extreme heat is poor air quality, which can occur during summer months, when stagnant atmospheric conditions trap humid air and pollutants near the ground and closer to residents. Ozone, a major component of smog, is created in the presence of sunlight via reactions between chemicals in gasoline vapors and industrial smoke stacks. Hot weather can increase ozone levels. High ozone levels often cause or worsen respiratory problems. The longer a given heat wave lasts and the hotter the temperature is, the greater the risk of adverse impacts on human health or infrastructure. Additionally, climate change is likely to bring hotter temperatures, more hot days, and more frequent heat waves. As the population ages and climate change brings more extreme heat events, rates of heat-related impairments and deaths may rise.
High winds and tornadoes may cause loss of power if utility service is disrupted. Debris carried by high winds can also result in injury or property damage. Tornadoes may cause fires resulting from damage to natural gas infrastructure. Hazardous materials may be released if a structure is damaged that stores such materials or if such a material is in transport.
6.4 EXPOSURE
6.4.1 Population It can be assumed that all residents of Los Angeles are exposed to some extent to extreme heat, high winds, and tornadoes.
6.4.2 Property According to the Los Angeles County Assessor, there are 746,352 buildings within the census tracts that define the planning area. Most of these buildings are residential. All of these buildings are considered to be exposed to the adverse weather hazard. The frequency and degree of damage will depend on specific locations. Typically the only impact extreme heat has on general building stock is increased demand on air conditioning equipment, which may cause strain on electrical systems.
City of Los Angeles 2018 Local Hazard Mitigation Plan Adverse Weather
6-9
6.4.3 Critical Facilities and Infrastructure Extreme heat poses a risk to ground transportation infrastructure. For instance, high temperatures can cause railroad tracks and wires, and pavement and joints on roads and bridges to crack, buckle, or sag, resulting in service disruptions, potentially hazardous travel conditions, and the need for costly repairs.
Power outages or roaming blackouts may occur as a result of extreme heat events that strain and overheat circuits. During a blackout, all critical facilities and infrastructure that are reliant upon electricity for power will be severely impacted unless they are connected to a backup power source. Additional facilities on higher ground may also be exposed to wind damage or damage from falling trees.
6.4.4 Environment The environment is highly exposed to adverse weather events. Natural habitats and park areas are exposed to the elements and risk damage and destruction. Prolonged extreme heat can degrade landscape quality, lakes and vegetation. High winds and tornadoes can cause entire trees to topple.
6.5 VULNERABILITY
6.5.1 Population According to the EPA, those at greater risk to the adverse effects of excessive heat events are individuals with physical or mobility constraints, cognitive impairments, economic constraints, and social isolation. Such populations include the elderly, young children, low income people, people with life-threatening illnesses and those who are overweight. Power outages can be life threatening to those dependent on electricity for life support. Outdoor recreational users may also be more vulnerable to adverse weather events.
The homeless are particularly vulnerable to extreme heat during the summer when increased humidity keeps nighttime temperatures above 80°F. The cumulative effects over several days of continuous exposure to heat, without relief, put the homeless at serious risk of heat stroke or worse. Others at significant risk are low income populations who do not have access to air conditioning. This population, like the homeless, would lack nighttime relief from the heat, elevating their risk of heat stroke or other complications.
6.5.2 Property All property is vulnerable to adverse weather, but structures in poor condition or in vulnerable locations may risk the most damage. Northern portions of the City are more vulnerable to high Santa Ana winds, and buildings in higher elevations and on ridges may be more prone to wind damage in general. Homes near mature trees or overhead power lines may be more susceptible to wind damage and blackouts.
It is estimated that 92 percent of residential structures in Los Angeles were built without the influence of a building code with provisions for wind loads. Those that are located under or near overhead lines or near large trees may be vulnerable to falling ice or may be damaged in the event of a collapse.
Loss estimations for the adverse weather hazard are not based on damage functions, because no such damage functions have been generated. Instead, loss estimates were developed representing 10 percent, 30 percent and 50 percent of the replacement value of exposed structures. This allows emergency managers to select a range of potential economic impact based on an estimate of the percent of damage to the general building stock. Damage in excess of 50 percent is considered to be substantial by most building codes and typically requires total reconstruction of the structure. Table 6-2 lists the loss estimates by Area Planning Commission (APC) within the City of Los Angeles.
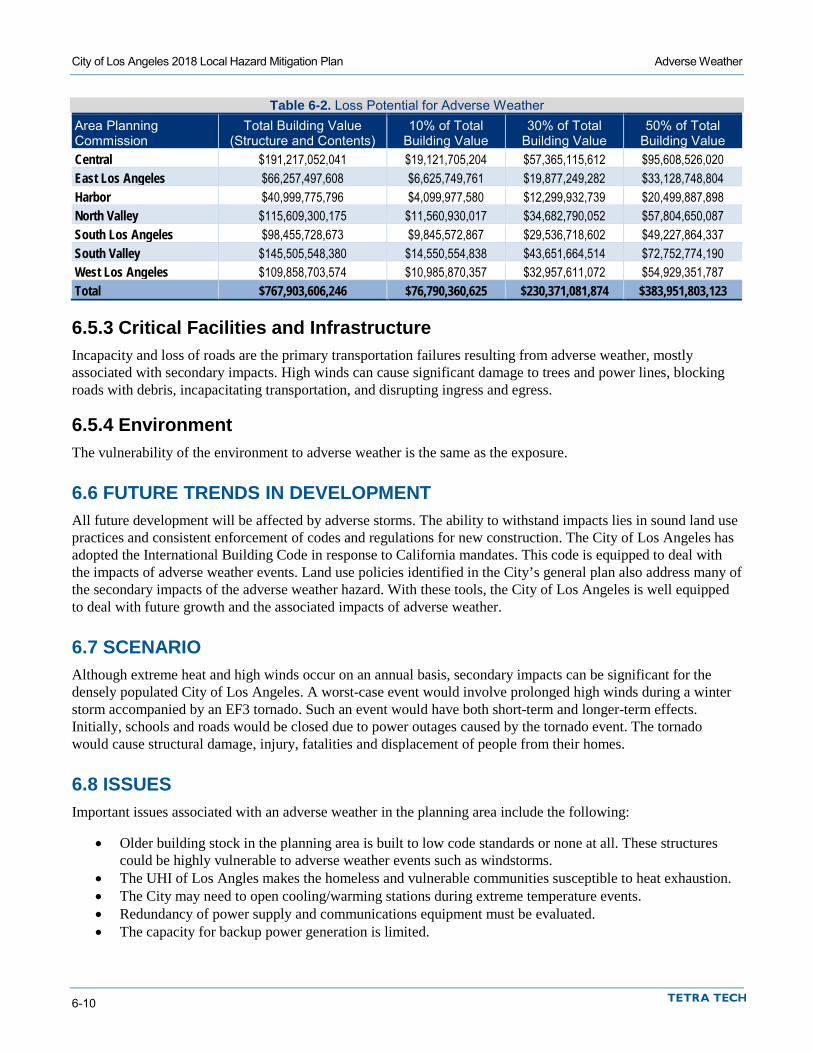
City of Los Angeles 2018 Local Hazard Mitigation Plan Adverse Weather
6-10
Table 6-2. Loss Potential for Adverse Weather Area Planning Commission
Total Building Value (Structure and Contents)
10% of Total Building Value
30% of Total Building Value
50% of Total Building Value
Central $191,217,052,041 $19,121,705,204 $57,365,115,612 $95,608,526,020 East Los Angeles $66,257,497,608 $6,625,749,761 $19,877,249,282 $33,128,748,804 Harbor $40,999,775,796 $4,099,977,580 $12,299,932,739 $20,499,887,898 North Valley $115,609,300,175 $11,560,930,017 $34,682,790,052 $57,804,650,087 South Los Angeles $98,455,728,673 $9,845,572,867 $29,536,718,602 $49,227,864,337 South Valley $145,505,548,380 $14,550,554,838 $43,651,664,514 $72,752,774,190 West Los Angeles $109,858,703,574 $10,985,870,357 $32,957,611,072 $54,929,351,787 Total $767,903,606,246 $76,790,360,625 $230,371,081,874 $383,951,803,123
6.5.3 Critical Facilities and Infrastructure Incapacity and loss of roads are the primary transportation failures resulting from adverse weather, mostly associated with secondary impacts. High winds can cause significant damage to trees and power lines, blocking roads with debris, incapacitating transportation, and disrupting ingress and egress.
6.5.4 Environment The vulnerability of the environment to adverse weather is the same as the exposure.
6.6 FUTURE TRENDS IN DEVELOPMENT All future development will be affected by adverse storms. The ability to withstand impacts lies in sound land use practices and consistent enforcement of codes and regulations for new construction. The City of Los Angeles has adopted the International Building Code in response to California mandates. This code is equipped to deal with the impacts of adverse weather events. Land use policies identified in the City’s general plan also address many of the secondary impacts of the adverse weather hazard. With these tools, the City of Los Angeles is well equipped to deal with future growth and the associated impacts of adverse weather.
6.7 SCENARIO Although extreme heat and high winds occur on an annual basis, secondary impacts can be significant for the densely populated City of Los Angeles. A worst-case event would involve prolonged high winds during a winter storm accompanied by an EF3 tornado. Such an event would have both short-term and longer-term effects. Initially, schools and roads would be closed due to power outages caused by the tornado event. The tornado would cause structural damage, injury, fatalities and displacement of people from their homes.
6.8 ISSUES Important issues associated with an adverse weather in the planning area include the following:
• Older building stock in the planning area is built to low code standards or none at all. These structures could be highly vulnerable to adverse weather events such as windstorms.
• The UHI of Los Angles makes the homeless and vulnerable communities susceptible to heat exhaustion. • The City may need to open cooling/warming stations during extreme temperature events. • Redundancy of power supply and communications equipment must be evaluated. • The capacity for backup power generation is limited.

City of Los Angeles 2018 Local Hazard Mitigation Plan Adverse Weather
6-11
• Dead or dying trees as a result of drought conditions are more susceptible to falling during severe storm events.
• Adverse weather events are likely to increase as a result of climate change impacts, including the potential for extreme heat.


7-1
7. DAM FAILURE
7.1 GENERAL BACKGROUND
7.1.1 Causes of Dam Failure Dam failures in the United States typically occur in one of four ways:
• Overtopping of the primary dam structure, which accounts for 34 percent of all dam failures, can occur due to inadequate spillway design, settlement of the dam crest, blockage of spillways, and other factors.
• Foundation defects due to differential settlement, slides, slope instability, uplift pressures, and foundation seepage can also cause dam failure. These account for 30 percent of all dam failures.
• Failure due to piping and seepage accounts for 20 percent of all failures. These are caused by internal erosion due to piping and seepage, erosion along hydraulic structures such as spillways, erosion due to animal burrows, and cracks in the dam structure.
• Failure due to problems with conduits and valves, typically caused by the piping of embankment material into conduits through joints or cracks, constitutes 10 percent of all failures.
The remaining 6 percent of U.S. dam failures are due to miscellaneous causes. Many dam failures in the United States have been secondary results of other disasters. The prominent causes are earthquakes, landslides, extreme storms, massive snowmelt, equipment malfunction, structural damage, foundation failures, and sabotage. The most likely disaster-related causes of dam failure in the Los Angeles vicinity are earthquakes, excessive rainfall, and landslides.
Poor construction, lack of maintenance and repair, and deficient operational procedures are preventable or correctable by a program of regular inspections. Terrorism and vandalism are serious concerns that all operators of public facilities must plan for; these threats are under continuous review by public safety agencies.
DEFINITIONS Dam—Any artificial barrier, together with appurtenant works, that does or may impound or divert water, and that either (a) is 25 feet or more in height from the natural bed of the stream or watercourse at the downstream toe of the barrier (or from the lowest elevation of the outside limit of the barrier if it is not across a stream channel or watercourse) to the maximum possible water storage elevation; or (b) has an impounding capacity of 50 acre-feet or more. (CA Water Code, Division 3.) Dam Failure—An uncontrolled release of impounded water due to structural deficiencies in dam. Emergency Action Plan—A formal document that identifies potential emergency conditions at a dam and specifies actions to be followed to minimize property damage and loss of life. The plan specifies actions the dam owner should take to alleviate problems at a dam. It contains procedures and information to assist the dam owner in issuing early warning and notification messages to responsible downstream emergency management authorities of the emergency situation. It also contains inundation maps to show emergency management authorities the critical areas for action in case of an emergency. High Hazard Dam—Dams where failure or improper operation will probably cause loss of human life. Significant Hazard Dam—Dams where failure or improper operation will result in no probable loss of human life but can cause economic loss, environmental damage or disruption of lifeline facilities, or can impact other concerns. Significant hazard dams are often located in rural or agricultural areas but could be located in areas with population and significant infrastructure.
City of Los Angeles 2018 Local Hazard Mitigation Plan Dam Failure
7-2
7.1.2 Regulatory Oversight
National Dam Safety Act Potential for catastrophic flooding due to dam failures led to passage of the National Dam Safety Act (Public Law 92-367). The National Dam Safety Program requires a periodic engineering analysis of the majority of dams in the country; exceptions include the following:
• Dams under jurisdiction of the Bureau of Reclamation, Tennessee Valley Authority, or International Boundary and Water Commission
• Dams constructed pursuant to licenses issued under the Federal Power Act • Dams that the Secretary of the Army determines do not pose any threat to human life or property.
The goal of this FEMA-monitored effort is to identify and mitigate the risk of dam failure so as to protect lives and property of the public. The National Dam Safety Program is a partnership among the states, federal agencies, and other stakeholders that encourages individual and community responsibility for dam safety. Under FEMA’s leadership, state assistance funds have allowed all participating states to improve their programs through increased inspections, emergency action planning, and purchases of needed equipment. FEMA has also expanded existing and initiated new training programs. Grant assistance from FEMA provides support for improvement of dam safety programs that regulate most of the dams in the United States.
California Division of Safety of Dams California’s Division of Safety of Dams (DSOD) monitors the dam safety program at the state level and maintains a working list of dams in the state. When a new dam is proposed, DSOD engineers and geologists inspect the site and the subsurface. Upon submittal of an application, the DSOD reviews the plans and specifications prepared by the owner to ensure that the dam is designed to meet minimum requirements and that the design is appropriate for the known geologic conditions. After approval of the application, the DSOD inspects all aspects of the construction to ensure that the work is done in accordance with the approved plans and specifications. After construction, the DSOD inspects each dam to ensure that it is performing as intended and is not developing problems. The DSOD periodically reviews the stability of dams and their major appurtenances in light of improved design approaches and requirements, as well as new findings regarding earthquake hazards and hydrologic estimates in California. Over 1,200 dams are inspected by DSOD engineers on a yearly schedule to ensure performance and maintenance of dams (California DSOD, 2017).
U.S. Army Corps of Engineers Dam Safety Program The U.S. Army Corps of Engineers operates and maintains approximately 700 dams nationwide. It is also responsible for safety inspections of federal and non-federal dams in the United States that meet size and storage limitations specified in the National Dam Safety Act. The Corps of Engineers has inventoried dams; surveyed each state and federal agency’s capabilities, practices and regulations regarding design, construction, operation and maintenance of the dams; and developed guidelines for inspection and evaluation of dam safety. The Corps maintains the National Inventory of Dams that contains information about a dam’s location, size, purpose, type, last inspection and regulatory facts (U.S. Army Corps of Engineers, 2017). Table 7-1 provides the most recent inspection dates for the dams in Los Angeles County and in City of Los Angeles that can impact the city.
Federal Energy Regulatory Commission Dam Safety Program The Federal Energy Regulatory Commission (FERC) cooperates with a large number of federal and state agencies to ensure and promote dam safety. More than 3,000 dams are part of regulated hydroelectric projects in the FERC program. Two-thirds of these are more than 50 years old. As dams age, concern about their safety and integrity grows, so oversight and regular inspection are important.

City of Los Angeles 2018 Local Hazard Mitigation Plan Dam Failure
7-3
Table 7-1. Los Angeles County Dam Inspection Dates Dam Name Inspection Date Dam Name Inspection Date 10th and Western 09/04/2014 Lopeza 03/04/2014 Big Tujunga 02/04/2015 Los Angeles Reservoira 08/22/2014 Devils Gate 10/14/2014 Lower Franklin #2a 09/30/2014 Diederich Reservoir 09/04/2014 Lower Van Norman Bypass 08/22/2014 Eagle Rocka 09/16/2014 Mulhollanda 09/16/2014 Elysiana 09/16/2014 Pacoima 11/05/2014 Encinoa 09/10/2014 Palos Verdes Reservoir 01/21/2015 Glen Oaks 968 09/04/2014 Riviera Reservoira 09/03/2014 Green Verdugo 09/17/2014 Santa Ynez Canyona 09/17/2014 Greystone 09/03/2014 Sepulveda 02/12/2015 Hansen Rec Lakea 03/21/2014 Silver Lakea 09/30/2014 Ivanhoe Not Available Solano 06/21/2011 Laguna Reg. Basin 10/14/2014 Stone Canyona 09/10/2014 Upper Franklin Dam 07/27/2006 a. Dams located within Los Angeles city limits Source: National Inventory of Dams, https://catalog.data.gov/dataset/national-inventory-of-dams, 2017
FERC inspects hydroelectric projects on an unscheduled basis to investigate the following:
• Potential dam safety problems • Complaints about constructing and operating a project • Safety concerns related to natural disasters • Issues concerning compliance with the terms and conditions of a license.
Every five years, an independent engineer approved by the FERC must inspect and evaluate projects with dams higher than 32.8 feet (10 meters) or with a total storage capacity of more than 2,000 acre-feet.
FERC monitors and evaluates seismic research and applies it in investigating and performing structural analyses of hydroelectric projects. FERC also evaluates the effects of potential and actual large floods on the safety of dams. During and following floods, FERC visits dams and licensed projects, determines the extent of damage, if any, and directs any necessary studies or remedial measures the licensee must undertake. The FERC publication Engineering Guidelines for the Evaluation of Hydropower Projects guides the FERC engineering staff and licensees in evaluating dam safety. The publication is frequently revised to reflect current information and methodologies.
FERC requires licensees to prepare emergency action plans and conducts training sessions on how to develop and test these plans. The plans outline an early warning system if there is an actual or potential sudden release of water from a dam due to failure. The plans include operational procedures that may be used, such as reducing reservoir levels and reducing downstream flows, as well as procedures for notifying affected residents and agencies responsible for emergency management. These plans are frequently updated and tested to ensure that everyone knows what to do in emergency situations.

City of Los Angeles 2018 Local Hazard Mitigation Plan Dam Failure
7-4
7.2 HAZARD PROFILE
7.2.1 Past Events According to the 2013 California State Hazard Mitigation Plan, there have been nine dam failures in the state since 1950, some of which occurred in Los Angeles County. Overtopping caused two of the failures, and the others were caused by seepage or leaks. The historical record indicates that California has had about 45 failures of non-federal dams. The failures occurred for a variety of reasons, the most common being overtopping. Other reasons include shortcomings in the dams or an inadequate assessment of surrounding geomorphologic characteristics. The sections below describe significant dam failure events directly relevant to the City of Los Angeles.
St. Francis Dam, 1928 The most catastrophic dam failure in California’s history was that of the St. Francis Dam in Los Angeles County in March 1928. This failure resulted in the deaths of more than 450 people and destruction of nearly 1,000 homes and buildings. Numerous roads and bridges were destroyed or damaged beyond repair. The DSOD came into existence as a direct result of this catastrophe.
Baldwin Hills Reservoir Collapse, 1963 On December 14, 1963, the dam at the head of Cloverdale Road broke in the Baldwin Hills section of Los Angeles. Lost homes, ruined property, and even death resulted from a river of rushing water from the broken dam. Automobiles, fragments of houses, and chunks of concrete were carried along the flood’s path and deposited on the ruins of Village Green. Eighteen persons were rescued by helicopter and flown out to a safety.
1971 Earthquake In 1971, a magnitude 6.7 earthquake had the following impacts on dams in the Los Angeles area:
• Perched above the densely populated San Fernando Valley, the 142-foot-high, 2,100-foot-long Lower San Fernando Dam held a reservoir 1.6 miles long and as much as 130 feet deep and supplied 80 percent of the City’s water supply. The quake shook loose a massive slide in the upstream slope of the Lower San Fernando Dam that lowered the crest about 30 feet and carried away much of upstream concrete facing of the dam. Resulting severe damage of the dam forced 80,000 residents to evacuate homes in an 11-square-mile area down the valley while the water behind the earthen dam was lowered over a three-day period. The damage was so heavy that the dam could not be repaired to safely hold its water supply in the event of another large earthquake. The $33 million Los Angeles Dam and Reservoir was built in 1975-76 about 3,000 feet up the valley from the old Lower San Fernando Dam, and the old dam was reconstructed to provide a holding basin for stormwater and to back up the new dam.
• Several thousand people were evacuated from homes south of Van Norman Dam in Mission Hills when Van Norman Lake reportedly sank 1 foot. A 60-foot section of the concrete dam at the lake’s southern edge collapsed, and portions were reported as still crumbling during the evacuation. The dam holds back more than 6 billion gallons of water and is the largest in the City’s water system.
• Cracks were reported in the Hansen Dam on Sepulveda Boulevard in Lakeview Terrace.
1994 Northridge Earthquake Thirteen dams in the greater Los Angeles area moved or cracked during the 1994 Northridge Earthquake. The most seriously damaged was the Pacoima Dam, about 8 miles from the epicenter. However, none were severely damaged, in part due to completion of retrofitting pursuant to the 1972 State Dam Safety Act. The Los Angeles Dam showed only minor deformation and superficial cracking.
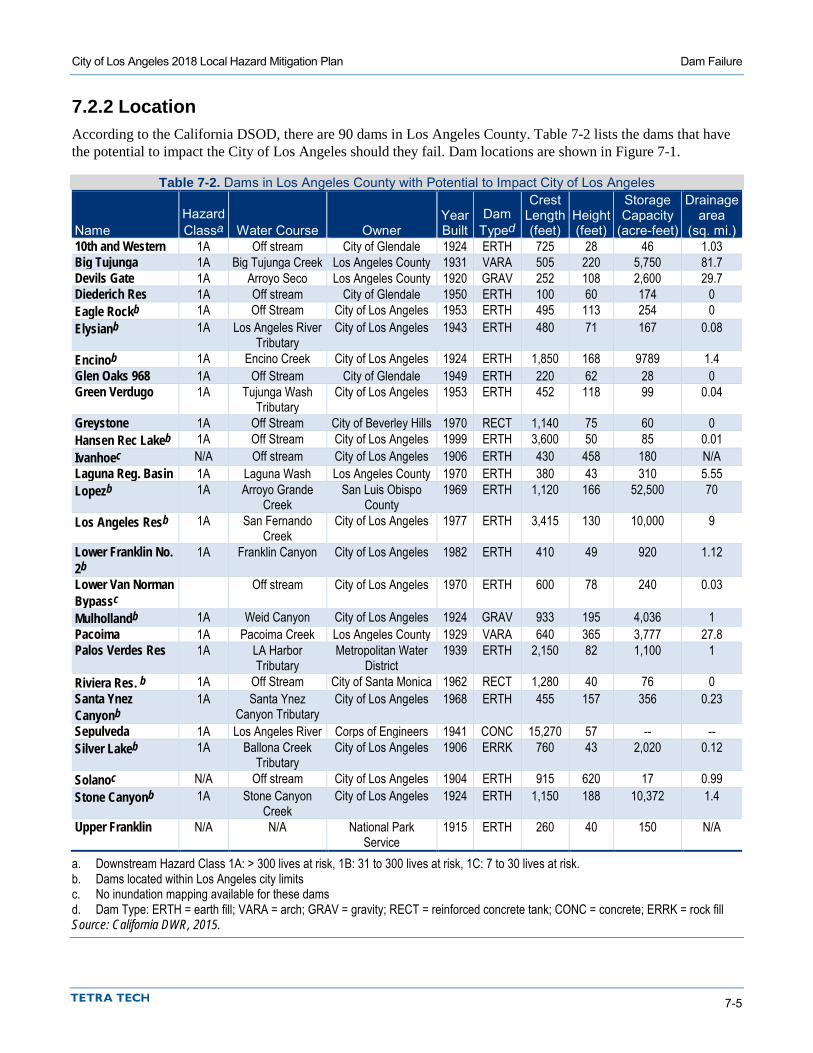
City of Los Angeles 2018 Local Hazard Mitigation Plan Dam Failure
7-5
7.2.2 Location According to the California DSOD, there are 90 dams in Los Angeles County. Table 7-2 lists the dams that have the potential to impact the City of Los Angeles should they fail. Dam locations are shown in Figure 7-1.
Table 7-2. Dams in Los Angeles County with Potential to Impact City of Los Angeles
Name Hazard Classa Water Course Owner
Year Built
Dam Typed
Crest Length (feet)
Height (feet)
Storage Capacity
(acre-feet)
Drainage area
(sq. mi.) 10th and Western 1A Off stream City of Glendale 1924 ERTH 725 28 46 1.03 Big Tujunga 1A Big Tujunga Creek Los Angeles County 1931 VARA 505 220 5,750 81.7 Devils Gate 1A Arroyo Seco Los Angeles County 1920 GRAV 252 108 2,600 29.7 Diederich Res 1A Off stream City of Glendale 1950 ERTH 100 60 174 0 Eagle Rockb 1A Off Stream City of Los Angeles 1953 ERTH 495 113 254 0 Elysianb 1A Los Angeles River
Tributary City of Los Angeles 1943 ERTH 480 71 167 0.08
Encinob 1A Encino Creek City of Los Angeles 1924 ERTH 1,850 168 9789 1.4 Glen Oaks 968 1A Off Stream City of Glendale 1949 ERTH 220 62 28 0 Green Verdugo 1A Tujunga Wash
Tributary City of Los Angeles 1953 ERTH 452 118 99 0.04
Greystone 1A Off Stream City of Beverley Hills 1970 RECT 1,140 75 60 0 Hansen Rec Lakeb 1A Off Stream City of Los Angeles 1999 ERTH 3,600 50 85 0.01 Ivanhoec N/A Off stream City of Los Angeles 1906 ERTH 430 458 180 N/A Laguna Reg. Basin 1A Laguna Wash Los Angeles County 1970 ERTH 380 43 310 5.55 Lopezb 1A Arroyo Grande
Creek San Luis Obispo
County 1969 ERTH 1,120 166 52,500 70
Los Angeles Resb 1A San Fernando Creek
City of Los Angeles 1977 ERTH 3,415 130 10,000 9
Lower Franklin No. 2b
1A Franklin Canyon City of Los Angeles 1982 ERTH 410 49 920 1.12
Lower Van Norman Bypassc
Off stream City of Los Angeles 1970 ERTH 600 78 240 0.03
Mulhollandb 1A Weid Canyon City of Los Angeles 1924 GRAV 933 195 4,036 1 Pacoima 1A Pacoima Creek Los Angeles County 1929 VARA 640 365 3,777 27.8 Palos Verdes Res 1A LA Harbor
Tributary Metropolitan Water
District 1939 ERTH 2,150 82 1,100 1
Riviera Res. b 1A Off Stream City of Santa Monica 1962 RECT 1,280 40 76 0 Santa Ynez Canyonb
1A Santa Ynez Canyon Tributary
City of Los Angeles 1968 ERTH 455 157 356 0.23
Sepulveda 1A Los Angeles River Corps of Engineers 1941 CONC 15,270 57 -- -- Silver Lakeb 1A Ballona Creek
Tributary City of Los Angeles 1906 ERRK 760 43 2,020 0.12
Solanoc N/A Off stream City of Los Angeles 1904 ERTH 915 620 17 0.99 Stone Canyonb 1A Stone Canyon
Creek City of Los Angeles 1924 ERTH 1,150 188 10,372 1.4
Upper Franklin N/A N/A National Park Service
1915 ERTH 260 40 150 N/A
a. Downstream Hazard Class 1A: > 300 lives at risk, 1B: 31 to 300 lives at risk, 1C: 7 to 30 lives at risk. b. Dams located within Los Angeles city limits c. No inundation mapping available for these dams d. Dam Type: ERTH = earth fill; VARA = arch; GRAV = gravity; RECT = reinforced concrete tank; CONC = concrete; ERRK = rock fill Source: California DWR, 2015.
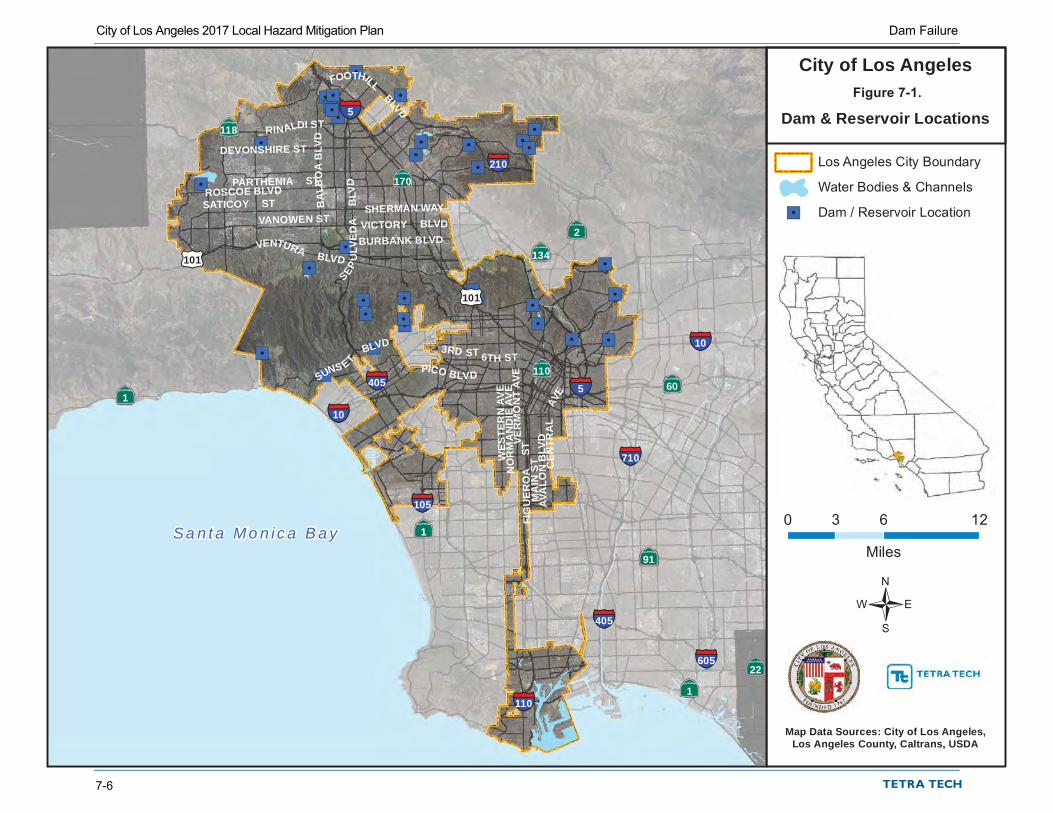
"/
"/
"/ "/
"/ "/"/
"/"/
"/
"/
"/"/
"/
"/
"/
"/
"/
"/"/
"/
"/
"/
"/
"/
"/"/
"/
"/
"/
"/
"/
"/
"/
"/
"/
§¦605
§¦405
§¦405
§¦10
§¦10
§¦105
§¦710
§¦110
§¦5
§¦5
§¦210
ÄÆÅ1
ÄÆÅ22
ÄÆÅ1
ÄÆÅ1
ÄÆÅ91
ÄÆÅ110
ÄÆÅ170
ÄÆÅ2
ÄÆÅ60
ÄÆÅ134
ÄÆÅ118
£¤101
£¤101
3RD ST
ROSCOE BLVD
AVA
LON
BLV
D
VANOWEN ST
6TH ST
VER
MO
NT
AVEPICO BLVD
NO
RM
AN
DIE
AV
E
VICTORY BLVD
VENTURA BLVD
SATICOY ST
FOOTHILL
BLVD
DEVONSHIRE ST
PARTHENIA ST
SUNS ETBLVD
RINALDI ST
BURBANK BLVD
SHERMAN WAY
FIG
UE
RO
A
STM
AIN
STW
ESTE
RN
AVE
CEN
TRA
LAV
E
SEPU
LVE
DA
BLV
D
BA
LBO
AB
LVD
Los Angeles City Boundary
Water Bodies & Channels
"/ Dam / Reservoir Location
Map Data Sources: City of Los Angeles,Los Angeles County, Caltrans, USDA
City of Los Angeles
0 6 123
Miles
/
Dam & Reservoir Locations
Sa n t a M o n i c a B a y
Figure 7-1.
City of Los Angeles 2017 Local Hazard Mitigation Plan Dam Failure
7-6
laura.leone
Typewritten Text
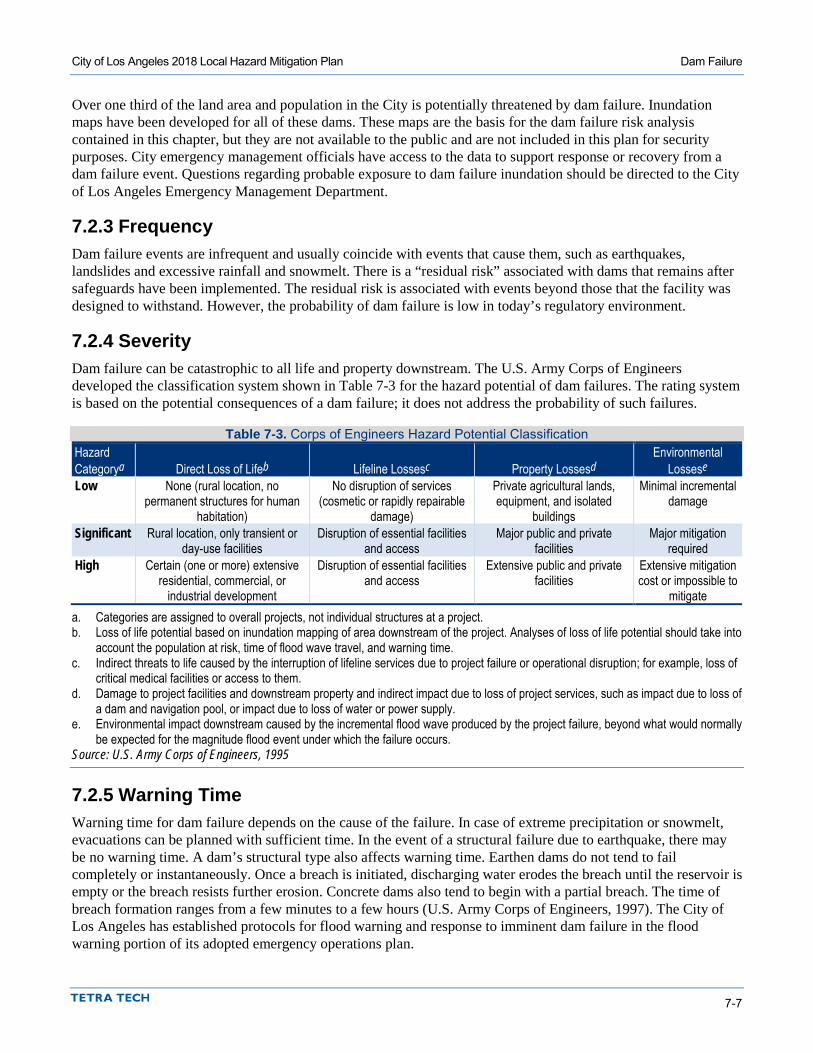
City of Los Angeles 2018 Local Hazard Mitigation Plan Dam Failure
7-7
Over one third of the land area and population in the City is potentially threatened by dam failure. Inundation maps have been developed for all of these dams. These maps are the basis for the dam failure risk analysis contained in this chapter, but they are not available to the public and are not included in this plan for security purposes. City emergency management officials have access to the data to support response or recovery from a dam failure event. Questions regarding probable exposure to dam failure inundation should be directed to the City of Los Angeles Emergency Management Department.
7.2.3 Frequency Dam failure events are infrequent and usually coincide with events that cause them, such as earthquakes, landslides and excessive rainfall and snowmelt. There is a “residual risk” associated with dams that remains after safeguards have been implemented. The residual risk is associated with events beyond those that the facility was designed to withstand. However, the probability of dam failure is low in today’s regulatory environment.
7.2.4 Severity Dam failure can be catastrophic to all life and property downstream. The U.S. Army Corps of Engineers developed the classification system shown in Table 7-3 for the hazard potential of dam failures. The rating system is based on the potential consequences of a dam failure; it does not address the probability of such failures.
Table 7-3. Corps of Engineers Hazard Potential Classification Hazard Categorya Direct Loss of Lifeb Lifeline Lossesc Property Lossesd
Environmental Lossese
Low None (rural location, no permanent structures for human
habitation)
No disruption of services (cosmetic or rapidly repairable
damage)
Private agricultural lands, equipment, and isolated
buildings
Minimal incremental damage
Significant Rural location, only transient or day-use facilities
Disruption of essential facilities and access
Major public and private facilities
Major mitigation required
High Certain (one or more) extensive residential, commercial, or
industrial development
Disruption of essential facilities and access
Extensive public and private facilities
Extensive mitigation cost or impossible to
mitigate a. Categories are assigned to overall projects, not individual structures at a project. b. Loss of life potential based on inundation mapping of area downstream of the project. Analyses of loss of life potential should take into
account the population at risk, time of flood wave travel, and warning time. c. Indirect threats to life caused by the interruption of lifeline services due to project failure or operational disruption; for example, loss of
critical medical facilities or access to them. d. Damage to project facilities and downstream property and indirect impact due to loss of project services, such as impact due to loss of
a dam and navigation pool, or impact due to loss of water or power supply. e. Environmental impact downstream caused by the incremental flood wave produced by the project failure, beyond what would normally
be expected for the magnitude flood event under which the failure occurs. Source: U.S. Army Corps of Engineers, 1995
7.2.5 Warning Time Warning time for dam failure depends on the cause of the failure. In case of extreme precipitation or snowmelt, evacuations can be planned with sufficient time. In the event of a structural failure due to earthquake, there may be no warning time. A dam’s structural type also affects warning time. Earthen dams do not tend to fail completely or instantaneously. Once a breach is initiated, discharging water erodes the breach until the reservoir is empty or the breach resists further erosion. Concrete dams also tend to begin with a partial breach. The time of breach formation ranges from a few minutes to a few hours (U.S. Army Corps of Engineers, 1997). The City of Los Angeles has established protocols for flood warning and response to imminent dam failure in the flood warning portion of its adopted emergency operations plan.
City of Los Angeles 2018 Local Hazard Mitigation Plan Dam Failure
7-8
7.3 SECONDARY IMPACTS Dam failure can cause severe downstream flooding, depending on the magnitude of the failure. Other potential secondary impacts of dam failure are landslides around the reservoir perimeter, bank erosion on the rivers, and destruction of downstream habitat.
7.4 EXPOSURE Exposure to the dam failure hazard was assessed by use of spatial analysis. Dam inundation areas for which inundation mapping was available were combined into a single inundation area. The combined dam failure inundation area includes the following dams:
• Big Tijunga No. 1 • Devils Gate • Eagle Rock • Elysian • Encino • Green Verdugo • Greystone Res
• Hansen Rec Lake • Lopez • Los Angeles Reservoir • Lower Franklin No. 2 • Mulholland • Pacoima • Palos Verdes Res
• Riviera Res • Santa Ynez Canyon • Sepulveda • Silver Lake • Stone Canyon • Upper Franklin.
This area was overlaid with planning area general building stock. The flood module of the Hazus risk assessment platform was used to assess dam failure. Hazus uses census data at the block level and FEMA floodplain data, which has a level of accuracy acceptable for planning purposes. Where possible, the Hazus data for this risk assessment was enhanced using GIS data from local, state and federal sources.
7.4.1 Population All populations in a dam failure inundation zone would be exposed to the risk of a dam failure. The potential for loss of life is affected by the capacity and number of evacuation routes available to populations living in areas of potential inundation. The estimated population living in the mapped inundation areas within the planning area is 1,553,114 or 39.8 percent of the total planning-area population.
7.4.2 Property
Structures Based on assessor parcel data, the Hazus model estimated that there are 292,601 structures within the combined dam failure inundation area. The Hazus-derived value of exposed buildings by Area Planning Commission (APC) is summarized in Table 7-4. This methodology estimated $340 billion worth of building-and-contents exposure to dam failure inundation, representing 44.4 percent of the total replacement value of the planning area.
Land Use Some land uses are more vulnerable to dam failure inundation, such as single-family homes, while others are less vulnerable, such as agricultural land or parks. Table 7-5 shows the existing land use of all parcels in the combined dam inundation area, including those in public/open space uses, for the planning area. Open space uses make up about 12 percent of the combined dam inundation area. These are favorable, lower-risk uses for dam inundation areas. The amount of the dam inundation area contains vacant, developable land is not known. This would be valuable information for gauging the future development potential of the dam inundation area.
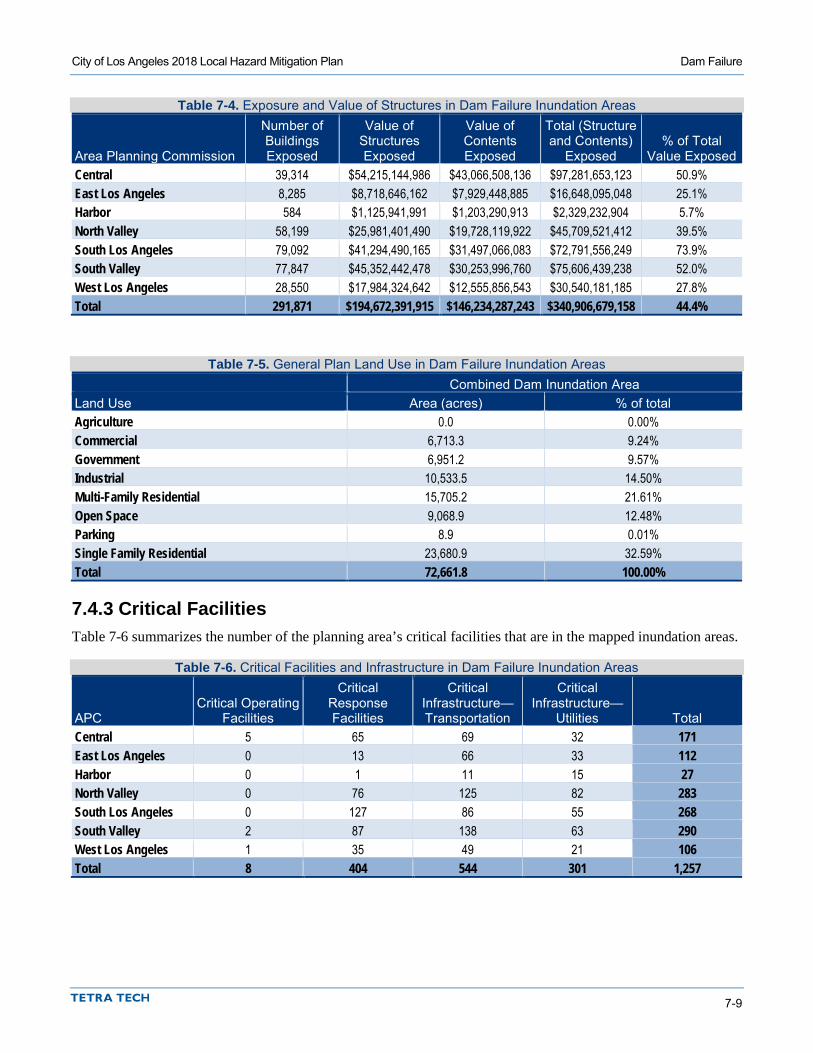
City of Los Angeles 2018 Local Hazard Mitigation Plan Dam Failure
7-9
Table 7-4. Exposure and Value of Structures in Dam Failure Inundation Areas
Area Planning Commission
Number of Buildings Exposed
Value of Structures Exposed
Value of Contents Exposed
Total (Structure and Contents)
Exposed % of Total
Value Exposed Central 39,314 $54,215,144,986 $43,066,508,136 $97,281,653,123 50.9% East Los Angeles 8,285 $8,718,646,162 $7,929,448,885 $16,648,095,048 25.1% Harbor 584 $1,125,941,991 $1,203,290,913 $2,329,232,904 5.7% North Valley 58,199 $25,981,401,490 $19,728,119,922 $45,709,521,412 39.5% South Los Angeles 79,092 $41,294,490,165 $31,497,066,083 $72,791,556,249 73.9% South Valley 77,847 $45,352,442,478 $30,253,996,760 $75,606,439,238 52.0% West Los Angeles 28,550 $17,984,324,642 $12,555,856,543 $30,540,181,185 27.8% Total 291,871 $194,672,391,915 $146,234,287,243 $340,906,679,158 44.4%
Table 7-5. General Plan Land Use in Dam Failure Inundation Areas Combined Dam Inundation Area Land Use Area (acres) % of total Agriculture 0.0 0.00% Commercial 6,713.3 9.24% Government 6,951.2 9.57% Industrial 10,533.5 14.50% Multi-Family Residential 15,705.2 21.61% Open Space 9,068.9 12.48% Parking 8.9 0.01% Single Family Residential 23,680.9 32.59% Total 72,661.8 100.00%
7.4.3 Critical Facilities Table 7-6 summarizes the number of the planning area’s critical facilities that are in the mapped inundation areas.
Table 7-6. Critical Facilities and Infrastructure in Dam Failure Inundation Areas
APC Critical Operating
Facilities
Critical Response Facilities
Critical Infrastructure—Transportation
Critical Infrastructure—
Utilities Total Central 5 65 69 32 171 East Los Angeles 0 13 66 33 112 Harbor 0 1 11 15 27 North Valley 0 76 125 82 283 South Los Angeles 0 127 86 55 268 South Valley 2 87 138 63 290 West Los Angeles 1 35 49 21 106 Total 8 404 544 301 1,257
City of Los Angeles 2018 Local Hazard Mitigation Plan Dam Failure
7-10
7.4.4 Environment Reservoirs held behind dams affect many ecological aspects of a river. River topography and dynamics depend on a wide range of flows, but rivers below dams often experience long periods of very stable flow conditions or saw-tooth flow patterns caused by releases followed by no releases. Water releases from dams usually contain very little suspended sediment; this can lead to scouring of river beds and banks.
The environment would be exposed to a number of risks in the event of dam failure. The inundation could introduce many foreign elements into local waterways. This could result in destruction of downstream habitat and could have detrimental effects on many species of animals, especially endangered species such as salmon.
7.5 VULNERABILITY
7.5.1 Population Vulnerable populations are all populations downstream from dam failures that are incapable of escaping the area within the allowable time frame. This population includes the elderly and young who may be unable to get themselves out of the inundation area. The vulnerable population also includes those who would not have adequate warning from a television or radio emergency warning system. A geographic analysis of demographics using the Hazus model identified populations vulnerable to the dam failure hazard as follows:
• Economically Disadvantaged Populations—It is estimated that 55 percent of the households within the combined dam inundation areas are economically disadvantaged, defined as having household incomes of $50,000 or less.
• Population over 65 Years Old—It is estimated that 9 percent of the population in the census blocks that intersect the combined dam inundation areas are over 65 years old.
• Population under 16 Years Old—It is estimated that 24 percent of the population within census blocks located in or near the combined dam inundation areas are under 16 years of age.
7.5.2 Property Vulnerable properties are those closest to the dam inundation area. These properties would experience the largest, most destructive surge of water. Low-lying areas are also vulnerable since they are where the dam waters would collect. Transportation routes are vulnerable to dam inundation and have the potential to be wiped out, creating isolation issues. This includes all roads, railroads and bridges in the path of the dam inundation. Those that are most vulnerable are those that are already in poor condition and would not be able to withstand a large water surge. Utilities such as overhead power lines, cable and phone lines could also be vulnerable. Loss of these utilities could create additional isolation issues for the inundation areas.
It is estimated that there could be up to $108 billion of losses from dam failures affecting the planning area. This represents 14.1 percent of the total replacement value of the planning area. Table 7-7 summarizes the loss estimates for dam failure. The Hazus analysis also estimated the amount of debris that would be caused by a dam failure in the planning area, as summarized in Table 7-8.
7.5.3 Critical Facilities Table 7-9 summarizes the Hazus results for potential damage from dam failure to critical facilities in the dam failure inundation area.

City of Los Angeles 2018 Local Hazard Mitigation Plan Dam Failure
7-11
Table 7-7. Loss Estimates for Dam Failure
Area Planning Commission Buildings Impacted
Value of Structures Damaged
Value of Contents Damaged
Total Value (Structure and
Contents) Damaged
% of Total Value
Damaged Central 23,496 $11,764,854,423 $16,104,622,969 $27,869,477,392 14.6% East Los Angeles 6,022 $2,033,175,464 $2,448,366,240 $4,481,541,704 6.8% Harbor 454 $84,369,803 $132,082,642 $216,452,445 0.5% North Valley 36,582 $5,787,154,365 $6,162,016,744 $11,949,171,110 10.3% South Los Angeles 75,892 $15,432,886,043 $18,745,359,132 $34,178,245,175 34.7% South Valley 60,165 $11,133,349,064 $9,737,597,319 $20,870,946,383 14.3% West Los Angeles 17,907 $4,636,020,393 $4,300,107,899 $8,936,128,292 8.1% Total 220,518 $50,871,809,556 $57,630,152,946 $108,501,962,501 14.1%
Table 7-8. Estimated Debris Area Planning Commission Debris to Be Removed (tons) from Combined Dam Inundation Central 1,712,077 East Los Angeles 336,748 Harbor 4,376 North Valley 949,319 South Los Angeles 3,448,095 South Valley 1,717,866 West Los Angeles 893,068 Total 9,061,549
Table 7-9. Potential Damage to Critical Facilities in Dam Failure Inundation Area Number of Average % of Total Value Damaged Facilities Affected Structure Content Critical Operating Facilities 3 9.52 41.88 Critical Response Facilities 227 N/A N/A Critical Infrastructure—Transportation 275 3.35 43.38 Critical Infrastructure—Utilities 134 30.38 47.90 Total/Average 639 14.42 44.39
7.5.4 Environment The environment would be vulnerable to a number of risks in the event of dam failure. The inundation could introduce foreign elements into local waterways, resulting in destruction of downstream habitat and detrimental effects on many species of animals, especially endangered species such as the Santa Ana sucker and arroyo chub. The extent of the vulnerability of the environment is the same as the exposure of the environment.
7.6 FUTURE TRENDS IN DEVELOPMENT Dam failures are low-probability, high-consequence events. Because of this, it is not typically practical for local governments to regulate new development in dam failure inundation areas. Land use will be directed by the City of Los Angeles General Plan and zoning ordinance adopted under state law. The safety element of the General Plan establishes standards and plans for the protection of the community from hazards. Dam failure is currently
City of Los Angeles 2018 Local Hazard Mitigation Plan Dam Failure
7-12
not addressed as a stand-alone hazard in the safety element, but flooding is. The City of Los Angeles has established comprehensive policies regarding sound land use in identified flood hazard areas. Most of the areas vulnerable to the more severe impacts from dam failure intersect the mapped flood hazard areas. Flood-related policies in the general plan will help to reduce the risk associated with the dam failure hazard for all future development in the City. Any new development outside of a flood hazard area will most likely not include provisions that would mitigate the impacts from a dam failure.
While probability of dam failure is low, probability of flooding associated with changes in dam operational parameters in response to extreme rainfall events is higher. Dam designs and operations are developed based on hydrographs from historical records. If these hydrographs change significantly over time due to effects of climate change, current dam designs and operations may become overwhelmed. Specified release rates and impound thresholds may have to be changed, which could result in increased discharges downstream of these facilities, thus increasing probability and severity of flooding.
7.7 SCENARIO An earthquake in the region could lead to liquefaction of soils around a dam. This could occur without warning during any time of the day. Human activity such as a terrorist attack also could trigger a catastrophic failure of a dam that impacts the planning area.
7.8 ISSUES The most significant issue associated with dam failure involves the properties and populations in the inundation zones. Flooding as a result of a dam failure would significantly impact these areas. There is often limited warning time for dam failure. These events are frequently associated with other natural hazard events such as earthquakes, landslides or adverse weather, which limits their predictability and compounds the hazard. Important issues associated with dam failure hazards include the following:
• California’s AB 2800 enacts legislation that will require engineers and climate scientists to collaborate to help the state design and build infrastructure that will withstand the unavoidable impacts of a changing climate.
• Federally regulated dams have an adequate level of oversight and sophistication in the development of emergency action plans for public notification in the unlikely event of failure. However, the protocol for notification of downstream residents of imminent failure needs to be tied to local emergency response planning.
• Mapping for federally regulated dams is already required and available; however, mapping for non-federal-regulated dams that estimates inundation depths is needed to better assess the risk associated with dam failure from these facilities.
• Most dam failure mapping required at federal levels requires determination of the probable maximum flood. While the probable maximum flood represents a worst-case scenario, it is generally the event with the lowest probability of occurrence. For non-federal-regulated dams, mapping of dam failure scenarios that are less extreme than the probable maximum flood but have a higher probability of occurrence can be valuable to emergency managers and community officials downstream of these facilities. This type of mapping can illustrate areas potentially impacted by more frequent events to support emergency response and preparedness.
• The concept of residual risk associated with structural flood control projects should be considered in the design of capital projects and the application of land use regulations.
• Addressing security concerns and the need to inform the public of the risk associated with dam failure is a challenge for public officials.
8-1
8. DROUGHT
8.1 GENERAL BACKGROUND Drought is a significant decrease in water supply relative to what is “normal” in a given location. A part of the climate cycle of most regions, drought originates from a deficiency of precipitation over an extended period of time, usually a season or more. This leads to a water shortage for some activity, group or environmental sector.
Determination of when drought begins is based on impacts on water users and assessments of the available water supply, including water stored in surface reservoirs or groundwater basins. Different water agencies have different criteria for defining drought. Some issue drought watch or drought warning announcements. The California water code does not include a statutory definition of drought; however, the code frequently focuses on drought conditions during times of water shortages (California Code of Regulations (CCR) 2016).
8.1.1 Monitoring Drought The National Oceanic and Atmospheric Administration has developed several indices to measure drought impacts and severity and to map their extent and locations:
• The Palmer Crop Moisture Index measures weekly short-term drought to quantify drought impacts on agriculture during the growing season. Figure 8-1 shows this index for the week ending March 11, 2017.
• The Palmer Z Index measures monthly short-term drought. Figure 8-2 shows this index for February 2017.
• The Palmer Drought Index measures the duration and intensity of long-term drought-inducing circulation patterns. Long-term drought is cumulative, so the intensity of drought during a given month is dependent on the current weather patterns plus the cumulative patterns of previous months. Weather patterns can change quickly from a long-term drought pattern to a long-term wet pattern, and the Palmer Drought Index can respond fairly rapidly. Figure 8-3 shows this index for March 11, 2017.
• The hydrological impacts of drought (e.g., reservoir levels, groundwater levels, etc.) take longer to develop and it takes longer to recover from them. The Palmer Hydrological Drought Index quantifies long-term hydrological effects. It responds more slowly to changing conditions than the Palmer Drought Index. Figure 8-4 shows this index for February 2017.
• While the Palmer indices consider precipitation, evapotranspiration and runoff, the Standardized Precipitation Index considers only precipitation. In the Standardized Precipitation Index, an index of zero indicates the median precipitation amount; the index is negative for drought and positive for wet conditions. The Standardized Precipitation Index is computed for time scales ranging from one month to 24 months. Figure 8-5 shows the 24-month Standardized Precipitation Index map for March 2015 through February 2017.
DEFINITIONS Drought—The cumulative impacts of long periods of dry weather. These can include deficiencies in surface and subsurface water supplies and general impacts on health, well being, and quality of life. Meteorological drought—Precipitation at levels below normal over a period of time. Meteorological measurements are the first indicators of drought and are usually region-specific. Agricultural Drought—Inadequate soil moisture to meet the needs of a particular crop at a particular time. Hydrological Drought—Deficiencies in surface and subsurface water supplies. Socioeconomic Drought—Drought impacts on health, wellbeing, and quality of life.

City of Los Angeles 2018 Local Hazard Mitigation Plan Drought
8-2
Source: NOAA, NWS. 2017
Figure 8-1. Palmer Crop Moisture Index for Week Ending March 11, 2017
Source: NOAA, NWS. 2017a
Figure 8-2. Palmer Z Index Short-Term Drought Conditions (February 2017)

City of Los Angeles 2018 Local Hazard Mitigation Plan Drought
8-3
Source: NOAA, NWS. 2017b
Figure 8-3. Palmer Drought Severity Index (March 11, 2017)
Source: NOAA, NWS. 2017c
Figure 8-4. Palmer Hydrological Drought Index (February 2017)
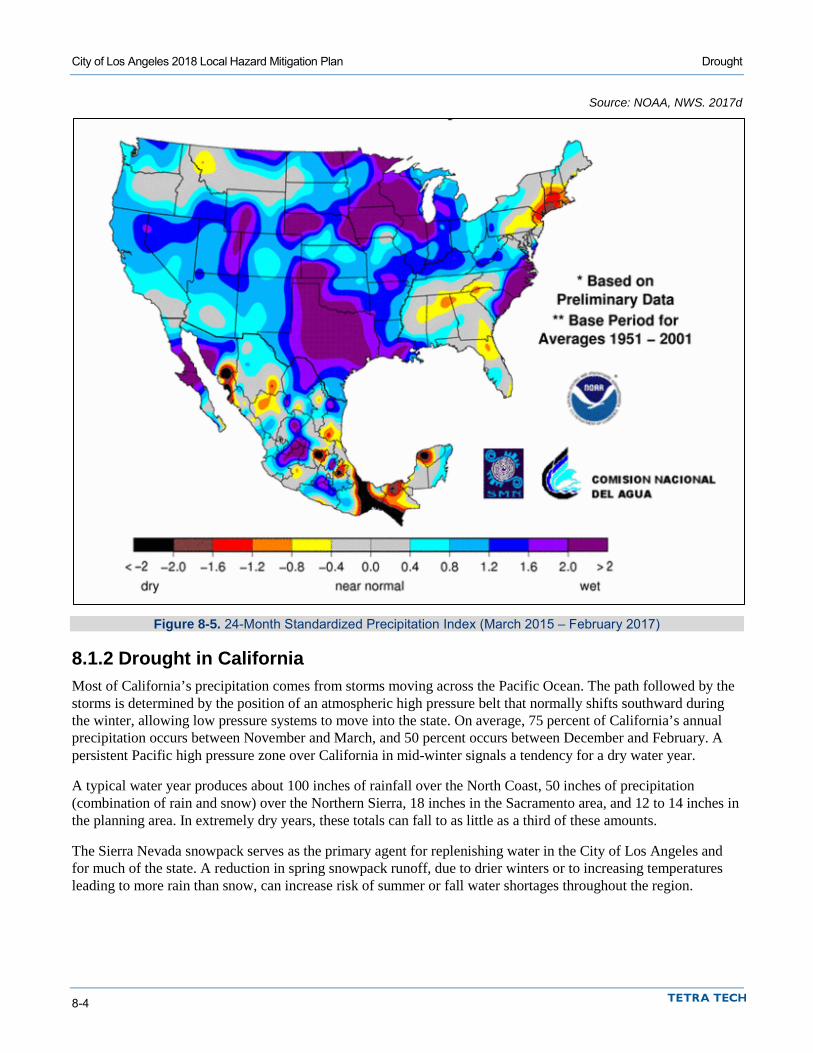
City of Los Angeles 2018 Local Hazard Mitigation Plan Drought
8-4
Source: NOAA, NWS. 2017d
Figure 8-5. 24-Month Standardized Precipitation Index (March 2015 – February 2017)
8.1.2 Drought in California Most of California’s precipitation comes from storms moving across the Pacific Ocean. The path followed by the storms is determined by the position of an atmospheric high pressure belt that normally shifts southward during the winter, allowing low pressure systems to move into the state. On average, 75 percent of California’s annual precipitation occurs between November and March, and 50 percent occurs between December and February. A persistent Pacific high pressure zone over California in mid-winter signals a tendency for a dry water year.
A typical water year produces about 100 inches of rainfall over the North Coast, 50 inches of precipitation (combination of rain and snow) over the Northern Sierra, 18 inches in the Sacramento area, and 12 to 14 inches in the planning area. In extremely dry years, these totals can fall to as little as a third of these amounts.
The Sierra Nevada snowpack serves as the primary agent for replenishing water in the City of Los Angeles and for much of the state. A reduction in spring snowpack runoff, due to drier winters or to increasing temperatures leading to more rain than snow, can increase risk of summer or fall water shortages throughout the region.
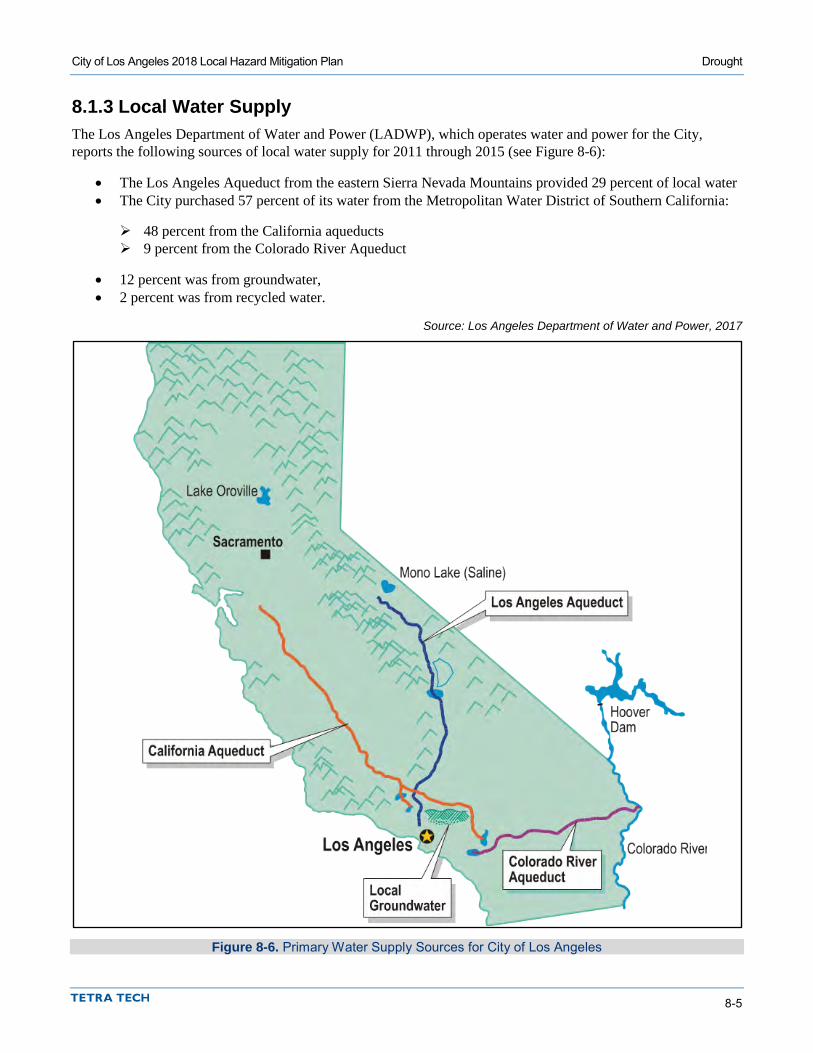
City of Los Angeles 2018 Local Hazard Mitigation Plan Drought
8-5
8.1.3 Local Water Supply The Los Angeles Department of Water and Power (LADWP), which operates water and power for the City, reports the following sources of local water supply for 2011 through 2015 (see Figure 8-6):
• The Los Angeles Aqueduct from the eastern Sierra Nevada Mountains provided 29 percent of local water • The City purchased 57 percent of its water from the Metropolitan Water District of Southern California:
48 percent from the California aqueducts 9 percent from the Colorado River Aqueduct
• 12 percent was from groundwater, • 2 percent was from recycled water.
Source: Los Angeles Department of Water and Power, 2017
Figure 8-6. Primary Water Supply Sources for City of Los Angeles
City of Los Angeles 2018 Local Hazard Mitigation Plan Drought
8-6
In general, the District is trying to conserve as much of its water as possible from the California aqueducts, and more water is being imported from the Colorado River.
Customers in the City used an average of 113 gallons per day per capita in 2014-2015. Residential users accounted for about 68 percent, and commercial/industrial users accounted for 32 percent. (LADWP, 2017)
8.1.4 Defined Drought Stages During critically dry years, the California State Water Resources Control Board can mandate water entitlements on water right holders to address statewide water shortages. Table 8-1 shows the state drought management program stages mandated to water right holders.
Table 8-1. State Drought Management Program Drought Stage State Mandated Customer Demand Reduction Rate Impacts Stage 0 or 1 <10% Normal rates Stage 2 10 to 15% Normal rates; Drought surcharge Stage 3 15 to 20% Normal rates; Drought surcharge Stage 4 >20% Normal rates, Drought surcharge
LADWP defined Emergency Water Conservation Plan Ordinance restrictions by phases in 2015 Urban Water Management Plan (Chapter 3, Water Conservation). It enacts the state’s mandates by activating Phases I through VI, with water conservation, prohibited uses, and penalties for violation that steadily increase by phase.
8.2 HAZARD PROFILE Droughts originate from a deficiency of precipitation resulting from an unusual weather pattern. If the weather pattern lasts a short time (a few weeks or a couple months), the drought is considered short-term. If the weather pattern becomes entrenched and the precipitation deficits last for several months or years, the drought is considered to be long-term. It is possible for a region to experience a long-term circulation pattern that produces drought, and to have short-term changes in this long-term pattern that result in short-term wet spells. Likewise, it is possible for a long-term wet circulation pattern to be interrupted by short-term weather spells that result in short-term drought.
8.2.1 Past Events
Statewide Droughts The California Department of Water Resources has state hydrologic data back to the early 1900s (CA DWR, 2017). The hydrologic data show multi-year droughts from 1912 to 1913, 1918 to 1920, 1922 to 1924 and 1928 to 1934. The following sections describe additional prolonged periods of drought in California since then, all of which impacted the City of Los Angeles to some degree.
1976 to 1977 Drought California had one of its most severe droughts due to lack of rainfall during the winters of 1976 and 1977. 1977 was the driest period on record in California to that time, with the previous winter recorded as the fourth driest. The cumulative impact led to widespread water shortages and severe water conservation measures throughout the state. Only 37 percent of the average Sacramento Valley runoff was received, with just 6.6 million acre-feet recorded. A federal disaster declaration was declared, but it did not apply to Los Angeles County.
City of Los Angeles 2018 Local Hazard Mitigation Plan Drought
8-7
1987 to 1992 Drought California received precipitation well below average levels for four consecutive years. While the Central Coast was most affected by the lack of rainfall and low runoff, the Sierra Nevada range in Northern California and City of Los Angeles was also affected. During this drought, only 56 percent of average runoff for the Sacramento Valley was received, totaling just 10 million acre-feet. By February 1991, all 58 counties in California were suffering from drought conditions. Urban areas as well as rural and agricultural areas were impacted. In 1988, the City adopted a plumbing retrofit ordinance to mandate the installation of conservation devices in all properties and require water-efficient landscaping in new construction. An amendment to the ordinance in 1999 required the installation of ultra-low-flush toilets in single-family and multifamily residences prior to resale.
2007 to 2009 Drought The governor issued an Executive Order that proclaimed a statewide drought emergency on June 4, 2008 after spring 2008 was the driest spring on record and snowmelt runoff was low. On February 27, 2009, the governor proclaimed a state of emergency for the entire state as the severe drought conditions continued widespread impacts and the largest court-ordered water restriction in state history (at the time).
2012 to 2016 Drought California’s latest drought set several records:
• The period from 2012 to 2014 ranked as the driest three consecutive years for statewide precipitation. • 2014 set new climate records for statewide average temperatures and for record-low water allocations in
the State Water Project and federal Central Valley Project. • 2013 set minimum annual precipitation records for many communities.
On January 17, 2014 the governor declared a state of emergency for drought throughout California. This declaration followed release of a report that stated that California had had the least amount of rainfall in its 163-year history. Californians were asked to voluntarily reduce their water consumption by 20 percent. Drought conditions worsened into 2015. On April 1, 2015, following the lowest snowpack ever recorded, the governor announced actions to save water, increase enforcement to prevent wasteful water use, streamline the state’s drought response, and invest in new technologies to make California more drought-resilient. The governor directed the State Water Resources Control Board to implement mandatory water reductions in cities and towns across California to reduce water usage by 25 percent on average. The LADWP was assigned a 16-percent water conservation target by the State Water Resources Control Board.
Drought Impact Reporter The National Drought Mitigation Center developed the Drought Impact Reporter in response to the need for a national drought impact database for the United States. Information comes from a variety of sources: on-line, drought-related news stories and scientific publications, members of the public who visit the website and submit a drought-related impact for their region, members of the media, and members of relevant government agencies. The Drought Impact Reporter contains information on 98 impacts from droughts that specifically affected the City of Los Angeles from 2006 through January 2017. The following are the categories and reported number of impacts (note that some impacts have been assigned to more than one category):
• Agriculture—6 • Business and Industry—13 • Energy—0 • Fire—3 • Plants and Wildlife—12
City of Los Angeles 2018 Local Hazard Mitigation Plan Drought
8-8
• Relief, Response, and Restrictions—58 • Society and Public Health—45 • Tourism and Recreation—4 • Water Supply and Quality—71.
8.2.2 Location Drought is a regional phenomenon. A drought that affects the planning area would affect the entirety of the area simultaneously and has the potential to directly or indirectly impact every person in the county as well as adversely affect the local economy.
8.2.3 Frequency Historical drought data for the planning area indicate there have been four significant multi-year droughts in the last 40 years (1976 to 2016). For approximately 12 of the last 40 years, the City has been included in various levels of drought. This equates to a drought every three years on average, or a 30 percent chance of a drought in any given year. As temperatures increase, the probability of future droughts will likely increase as well.
8.2.4 Severity Drought can have a widespread impact on the environment and the economy, although it typically does not result in loss of life or damage to property, as do other natural disasters. Nationwide, the impacts of drought occur in the following categories: agriculture; business and industry; energy; fire; plants and wildfire; relief, response and restrictions; tourism and recreation; and water supply and quality sectors. The National Drought Mitigation Center uses three categories to describe likely drought impacts:
• Economic Impacts—These impacts of drought cost people or businesses money (i.e., farmers’ crops are destroyed, water supply is too low and money must be spent on irrigation or to drill new wells; businesses that sell boats and fishing equipment are not able to sell their goods; water companies must spend money on new or additional water supplies)
• Environmental Impacts—Plants and animals depend on water, just like people. When a drought occurs, their food supply can shrink and their habitat can be damaged
• Social Impacts—These impacts affect people’s health and safety. Social impacts include public safety, health, conflicts between people when there is not enough water to go around, and changes in lifestyle.
The severity of a drought depends on the degree of moisture deficiency, the duration, and the size and location of the affected area. The longer the duration of the drought and the larger the area impacted, the more severe the potential impacts.
Drought generally does not affect groundwater sources as quickly as surface water supplies, but groundwater supplies generally take longer to recover. Reduced precipitation during a drought means that groundwater supplies are not replenished at a normal rate. This can lead to a reduction in groundwater levels and problems such as reduced pumping capacity or wells going dry. Shallow wells are more susceptible than deep wells. Reduced replenishment of groundwater affects streams. Much of the flow in streams comes from groundwater, especially during the summer when there is less precipitation and after snowmelt ends. Reduced groundwater levels mean that even less water will enter streams when stream flows are lowest.

City of Los Angeles 2018 Local Hazard Mitigation Plan Drought
8-9
8.2.5 Warning Time Droughts are climatic patterns that occur over long periods of time. Only generalized warning can take place due to the numerous variables that scientists have not pieced together well enough to make accurate and precise predictions.
Empirical studies conducted over the past century have shown that meteorological drought is never the result of a single cause. It is the result of many causes, often synergistic in nature; these include global weather patterns that produce persistent, upper-level high-pressure systems along the West Coast with warm, dry air resulting in less precipitation.
Scientists at this time do not know how to predict drought more than a month in advance for most locations. Predicting drought depends on the ability to forecast precipitation and temperature. Anomalies of precipitation and temperature may last from several months to several decades. California is currently finishing a several-year-long drought, while other areas in the United States may undergo droughts as short as 1 or 2 months. How long they last depends on interactions between the atmosphere and the oceans, soil moisture and land surface processes, topography, internal dynamics, and the accumulated influence of weather systems on the global scale.
8.3 SECONDARY IMPACTS The secondary impact most commonly associated with drought is wildfire. A prolonged lack of precipitation dries out vegetation, which becomes increasingly susceptible to ignition as the duration of the drought extends. Millions of board feet of timber have been lost, and in many cases erosion occurred, which caused serious damage to aquatic life, irrigation, and power production by heavy silting of streams, reservoirs, and rivers.
Drought also is often accompanied by extreme heat, exposing people to the risk of sunstroke, heat cramps and heat exhaustion. Pets and livestock are also vulnerable to heat-related injuries. Crops can be vulnerable as well.
8.4 EXPOSURE Drought can affect a wide range of economic, environmental, and social activities. Its impacts can span many sectors of the economy because water is integral to the ability to produce goods and provide services. The impacts can reach well beyond the area undergoing physical drought. Vulnerability of an activity to drought depends on its water demand and the water supplies available to meet the demand.
California’s 2005 Water Plan and subsequent updates indicate that water demand in the state will increase through 2030. The Department of Water Resources predicts a modest decrease in agricultural water use, but an urban water use increase of 1.5 to 5.8 million acre-feet per year (DWR 2005). The 2013 update to the Water Plan explores measures, benchmarks, and successes in increasing agricultural and urban water use efficiency.
8.5 VULNERABILITY
8.5.1 Population The City of Los Angeles is vulnerable to drought events. Drought can affect people’s health and safety, including health problems related to low water flows, poor water quality, or dust. Drought can also lead to loss of human life (National Drought Mitigation Center, 2017). Other possible impacts include recreational risks; effects on air quality; diminished living conditions related to energy, air quality, and hygiene; compromised food and nutrition; and increased incidence of illness and disease (Centers for Disease Control and Prevention, 2012). Droughts can also lead to reduced local firefighting capabilities.

City of Los Angeles 2018 Local Hazard Mitigation Plan Drought
8-10
LADWP and other regional stakeholders have devoted considerable time and effort to protect life, safety, and health during times of consecutive dry years. Provisions and measures have been taken to analyze and account for anticipated water shortages. With coordination with residents in the planning area, the LADWP has the ability to minimize and reduce impacts on residents and water consumers in the City.
8.5.2 Property No structures will be directly affected by drought conditions, though some structures may become vulnerable to wildfires, which are more likely following years of drought. Droughts can also have significant impacts on landscapes, which could cause a financial burden to property owners. However, these impacts are not considered critical in planning for impacts from the drought hazard.
8.5.3 Critical Facilities Critical facilities as defined for this plan will continue to be operational during a drought. A benefit of water conservation in the City is delaying the need for sewer facility expansions by reducing wastewater discharge into the sewer collection and treatment system. Critical facility elements such as landscaping may not be maintained due to limited resources, but the risk to the planning area’s critical facilities inventory will be largely aesthetic. For example, when water conservation measures are in place, landscaped areas will not be watered and may die. These aesthetic impacts are not considered significant.
8.5.4 Environment Environmental losses are the result of damage to plants, animals, wildlife habitat, and air and water quality; forest and range fires; degradation of landscape quality; loss of biodiversity; and soil erosion. Some of the effects are short-term and conditions quickly return to normal following the end of the drought. Other environmental effects linger for some time or may even become permanent. Wildlife habitat, for example, may be degraded through the loss of wetlands, lakes, and vegetation. However, many species will eventually recover from this temporary condition. The degradation of landscape quality, including increased soil erosion, may lead to a more permanent loss of biological productivity. Although environmental losses are difficult to quantify, growing public awareness and concern for environmental quality has forced public officials to focus greater attention on these effects.
8.5.5 Economic Impact Economic impact will be largely associated with industries that use water or depend on water for their business. For example, landscaping businesses were affected in the droughts of the past as the demand for service significantly declined because landscaping was not watered. Agricultural industries will be impacted if water usage is restricted for irrigation.
A prolonged drought can affect a community’s economy significantly. Increased demand for water and electricity may result in shortages and higher costs of these resources. Industries that rely on water for business may be impacted the most (e.g., landscaping businesses). Although most businesses will still be operational, they may be affected aesthetically—especially the recreation and tourism industry. Moreover, droughts within another area could affect food supply and price for City residents.
8.6 FUTURE TRENDS IN DEVELOPMENT The City of Los Angeles has a General Plan that includes policies directing land use and dealing with issues of water supply and the protection of water resources. This plan provides the capability at the local level to protect future development from the impacts of drought. The City of Los Angeles reviewed its General Plan under the

City of Los Angeles 2018 Local Hazard Mitigation Plan Drought
8-11
capability assessment performed for this effort. Deficiencies identified by this review can be addressed by mitigation actions to increase the capability to deal with future trends in development.
8.7 SCENARIO An extreme, multiyear drought associated with record-breaking rates of low precipitation and high temperatures—such as the most recent drought across the State of California——is the worst-case scenario. Combinations of low precipitation and high temperatures could occur over several consecutive years. Intensified by such conditions, extreme wildfires could break out throughout the planning area, increasing the need for water. Surrounding communities, also in drought conditions, could increase their demand for water supplies relied upon by the City of Los Angeles, causing social and political conflicts. If such conditions persisted for several years, the economy of the City of Los Angeles could experience setbacks, especially in water dependent industries.
8.8 ISSUES The planning team has identified the following drought-related issues:
• Identification and development of alternative water supplies • Large residential populations stressing the water supply • Utilization of groundwater recharge techniques to stabilize the groundwater supply • The probability of increased multi-year drought and durations due to climate change, and the associated
need to consider long-term conservation measures • Loss of much of the water transported from aqueducts to leaks and evaporation • Recycled water opportunities • The capture and storage of urban runoff.

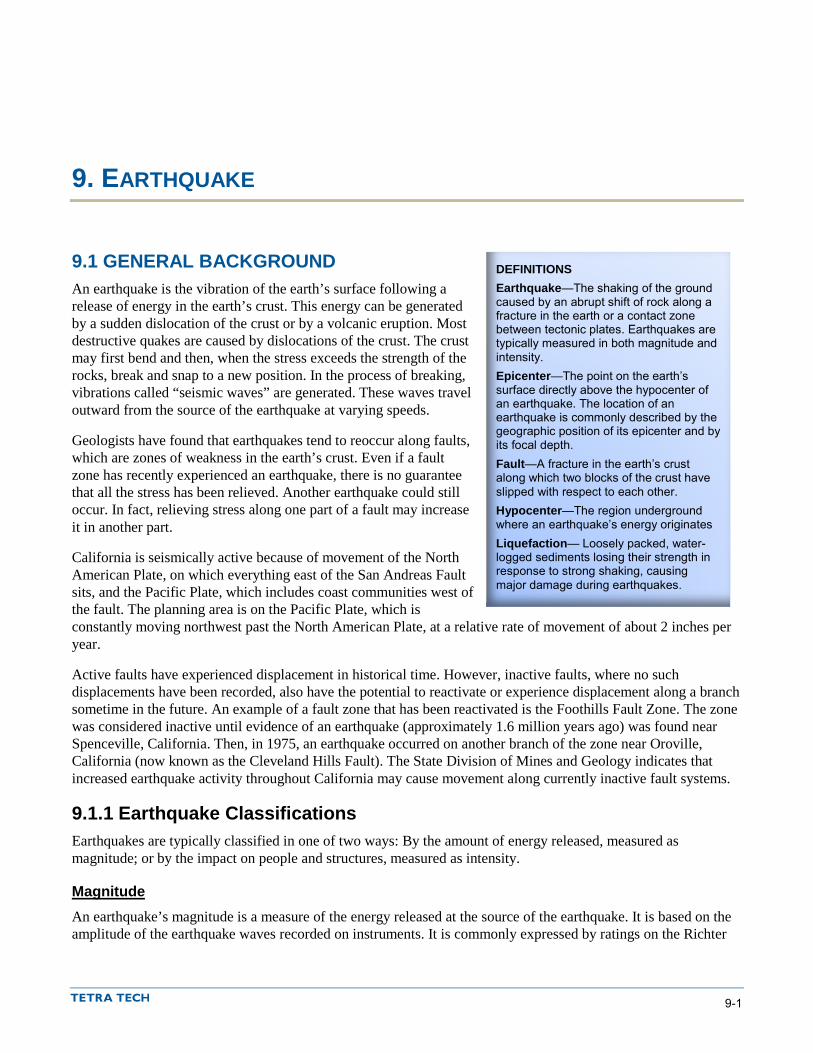
9-1
9. EARTHQUAKE
9.1 GENERAL BACKGROUND An earthquake is the vibration of the earth’s surface following a release of energy in the earth’s crust. This energy can be generated by a sudden dislocation of the crust or by a volcanic eruption. Most destructive quakes are caused by dislocations of the crust. The crust may first bend and then, when the stress exceeds the strength of the rocks, break and snap to a new position. In the process of breaking, vibrations called “seismic waves” are generated. These waves travel outward from the source of the earthquake at varying speeds.
Geologists have found that earthquakes tend to reoccur along faults, which are zones of weakness in the earth’s crust. Even if a fault zone has recently experienced an earthquake, there is no guarantee that all the stress has been relieved. Another earthquake could still occur. In fact, relieving stress along one part of a fault may increase it in another part.
California is seismically active because of movement of the North American Plate, on which everything east of the San Andreas Fault sits, and the Pacific Plate, which includes coast communities west of the fault. The planning area is on the Pacific Plate, which is constantly moving northwest past the North American Plate, at a relative rate of movement of about 2 inches per year.
Active faults have experienced displacement in historical time. However, inactive faults, where no such displacements have been recorded, also have the potential to reactivate or experience displacement along a branch sometime in the future. An example of a fault zone that has been reactivated is the Foothills Fault Zone. The zone was considered inactive until evidence of an earthquake (approximately 1.6 million years ago) was found near Spenceville, California. Then, in 1975, an earthquake occurred on another branch of the zone near Oroville, California (now known as the Cleveland Hills Fault). The State Division of Mines and Geology indicates that increased earthquake activity throughout California may cause movement along currently inactive fault systems.
9.1.1 Earthquake Classifications Earthquakes are typically classified in one of two ways: By the amount of energy released, measured as magnitude; or by the impact on people and structures, measured as intensity.
Magnitude An earthquake’s magnitude is a measure of the energy released at the source of the earthquake. It is based on the amplitude of the earthquake waves recorded on instruments. It is commonly expressed by ratings on the Richter
DEFINITIONS Earthquake—The shaking of the ground caused by an abrupt shift of rock along a fracture in the earth or a contact zone between tectonic plates. Earthquakes are typically measured in both magnitude and intensity. Epicenter—The point on the earth’s surface directly above the hypocenter of an earthquake. The location of an earthquake is commonly described by the geographic position of its epicenter and by its focal depth. Fault—A fracture in the earth’s crust along which two blocks of the crust have slipped with respect to each other. Hypocenter—The region underground where an earthquake’s energy originates Liquefaction— Loosely packed, water-logged sediments losing their strength in response to strong shaking, causing major damage during earthquakes.

City of Los Angeles 2018 Local Hazard Mitigation Plan Earthquake
9-2
scale and the moment magnitude (Mw) scale. The Richter scale magnitude is based on the amplitude of the largest energy wave released by the earthquake. Richter scale readings are suitable for smaller earthquakes; however, because it is a logarithmic scale, the scale does not distinguish clearly the magnitude of large earthquakes above a certain level. Table 9-1 summarizes Richter scale magnitudes and corresponding earthquake effects.
Table 9-1. Richter Magnitude Scale Richter Magnitude Earthquake Effects 2.5 or less Usually not felt, but can be recorded by seismograph 2.5 to 5.4 Often felt, but causes only minor damage 5.5 to 6.0 Slight damage to buildings and other structures 6.1 to 6.9 May cause a lot of damage in very populated areas 7.0 to 7.9 Major earthquake; serious damage 8.0 or greater Great earthquake; can totally destroy communities near the epicenter
The moment magnitude (Mw) scale was introduced in 1979 to address shortcomings of the Richter scale while maintaining consistency. It is based on the seismic moment of the earthquake. For medium-sized earthquakes, moment magnitude values are similar to Richter values—a magnitude 5.0 earthquake is about 5.0 on both scales. Unlike other scales, the moment magnitude scale does not saturate at the upper end; there is no upper limit to the magnitude it can measure. However, this has the side-effect that the scales diverge for smaller earthquakes (Hanks and Hiroo, 1979). The Mw scale, described in Table 9-2, is currently the most commonly used magnitude scale.
Table 9-2. Moment Magnitude Class Magnitude Class Magnitude Range (Mw=magnitude)
Great Mw ≥ 8 Major Mw = 7.0 – 7.9 Strong Mw = 6.0 – 6.9 Moderate Mw = 5.0 – 5.9 Light Mw = 4.0 – 4.9 Minor Mw = 3.0 – 3.9 Micro Mw < 3
Intensity The intensity of an earthquake is based on the observed effects of ground shaking on people, buildings, and natural features, and varies with location. The intensity of earthquake shaking lessens with distance from the earthquake epicenter. The Modified Mercalli Intensity (MMI) scale expresses intensity of an earthquake and describes how strong a shock was felt at a particular location in values. The MMI is currently the most commonly used intensity scale (see Table 9-3).
9.1.2 Ground Motion During an earthquake when the ground is shaking, it also experience acceleration. The peak acceleration is the largest increase in velocity recorded by a particular station during an earthquake. Earthquake hazard assessment based on expected ground motion involves determining the annual probability that certain ground motion accelerations will be exceeded, then summing the annual probabilities over a time period of interest.
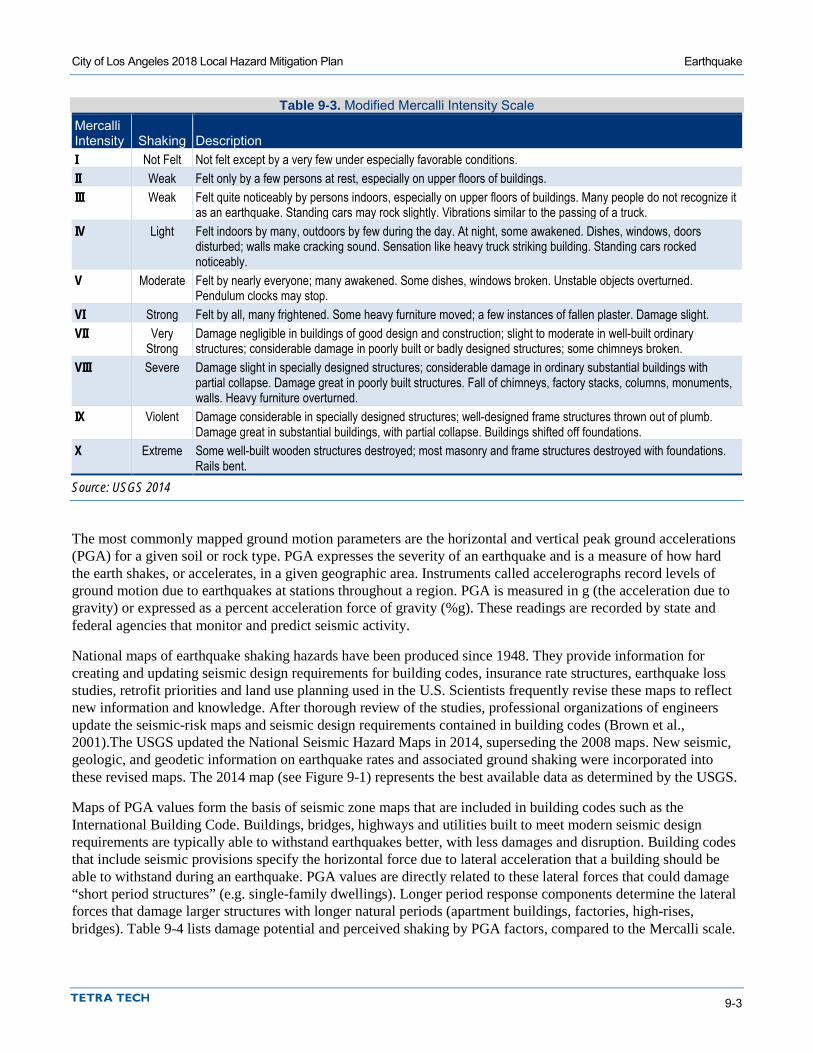
City of Los Angeles 2018 Local Hazard Mitigation Plan Earthquake
9-3
Table 9-3. Modified Mercalli Intensity Scale Mercalli Intensity Shaking Description I Not Felt Not felt except by a very few under especially favorable conditions. II Weak Felt only by a few persons at rest, especially on upper floors of buildings. III Weak Felt quite noticeably by persons indoors, especially on upper floors of buildings. Many people do not recognize it
as an earthquake. Standing cars may rock slightly. Vibrations similar to the passing of a truck. IV Light Felt indoors by many, outdoors by few during the day. At night, some awakened. Dishes, windows, doors
disturbed; walls make cracking sound. Sensation like heavy truck striking building. Standing cars rocked noticeably.
V Moderate Felt by nearly everyone; many awakened. Some dishes, windows broken. Unstable objects overturned. Pendulum clocks may stop.
VI Strong Felt by all, many frightened. Some heavy furniture moved; a few instances of fallen plaster. Damage slight. VII Very
Strong Damage negligible in buildings of good design and construction; slight to moderate in well-built ordinary structures; considerable damage in poorly built or badly designed structures; some chimneys broken.
VIII Severe Damage slight in specially designed structures; considerable damage in ordinary substantial buildings with partial collapse. Damage great in poorly built structures. Fall of chimneys, factory stacks, columns, monuments, walls. Heavy furniture overturned.
IX Violent Damage considerable in specially designed structures; well-designed frame structures thrown out of plumb. Damage great in substantial buildings, with partial collapse. Buildings shifted off foundations.
X Extreme Some well-built wooden structures destroyed; most masonry and frame structures destroyed with foundations. Rails bent.
Source: USGS 2014
The most commonly mapped ground motion parameters are the horizontal and vertical peak ground accelerations (PGA) for a given soil or rock type. PGA expresses the severity of an earthquake and is a measure of how hard the earth shakes, or accelerates, in a given geographic area. Instruments called accelerographs record levels of ground motion due to earthquakes at stations throughout a region. PGA is measured in g (the acceleration due to gravity) or expressed as a percent acceleration force of gravity (%g). These readings are recorded by state and federal agencies that monitor and predict seismic activity.
National maps of earthquake shaking hazards have been produced since 1948. They provide information for creating and updating seismic design requirements for building codes, insurance rate structures, earthquake loss studies, retrofit priorities and land use planning used in the U.S. Scientists frequently revise these maps to reflect new information and knowledge. After thorough review of the studies, professional organizations of engineers update the seismic-risk maps and seismic design requirements contained in building codes (Brown et al., 2001).The USGS updated the National Seismic Hazard Maps in 2014, superseding the 2008 maps. New seismic, geologic, and geodetic information on earthquake rates and associated ground shaking were incorporated into these revised maps. The 2014 map (see Figure 9-1) represents the best available data as determined by the USGS.
Maps of PGA values form the basis of seismic zone maps that are included in building codes such as the International Building Code. Buildings, bridges, highways and utilities built to meet modern seismic design requirements are typically able to withstand earthquakes better, with less damages and disruption. Building codes that include seismic provisions specify the horizontal force due to lateral acceleration that a building should be able to withstand during an earthquake. PGA values are directly related to these lateral forces that could damage “short period structures” (e.g. single-family dwellings). Longer period response components determine the lateral forces that damage larger structures with longer natural periods (apartment buildings, factories, high-rises, bridges). Table 9-4 lists damage potential and perceived shaking by PGA factors, compared to the Mercalli scale.

City of Los Angeles 2018 Local Hazard Mitigation Plan Earthquake
9-4
Source: USGS 2014
Black circle indicates the approximate location of the City of Los Angeles
Figure 9-1. Peak Acceleration (%g) with 10% Probability of Exceedance in 50 Years
Table 9-4. Mercalli Scale and Peak Ground Acceleration Comparison Modified Potential Structure Damage Estimated PGAa
Mercalli Scale Perceived Shaking Resistant Buildings Vulnerable Buildings (%g) I Not Felt None None <0.17%
II-III Weak None None 0.17% – 1.4% IV Light None None 1.4% – 3.9% V Moderate Very Light Light 3.9% – 9.2% VI Strong Light Moderate 9.2% – 18% VII Very Strong Moderate Moderate/Heavy 18% – 34% VIII Severe Moderate/Heavy Heavy 34% – 65% IX Violent Heavy Very Heavy 65% – 124%
X – XII Extreme Very Heavy Very Heavy >124% a. PGA measured in percent of g, where g is the acceleration of gravity Sources: USGS, 2008; USGS, 2010
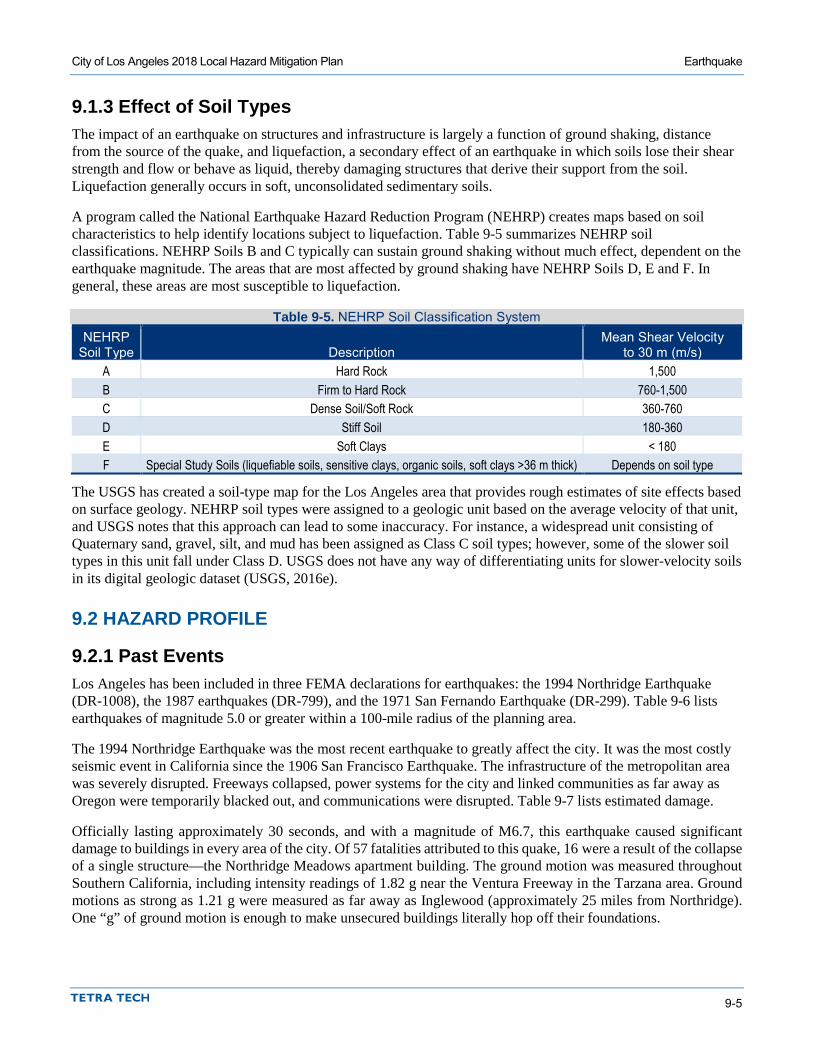
City of Los Angeles 2018 Local Hazard Mitigation Plan Earthquake
9-5
9.1.3 Effect of Soil Types The impact of an earthquake on structures and infrastructure is largely a function of ground shaking, distance from the source of the quake, and liquefaction, a secondary effect of an earthquake in which soils lose their shear strength and flow or behave as liquid, thereby damaging structures that derive their support from the soil. Liquefaction generally occurs in soft, unconsolidated sedimentary soils.
A program called the National Earthquake Hazard Reduction Program (NEHRP) creates maps based on soil characteristics to help identify locations subject to liquefaction. Table 9-5 summarizes NEHRP soil classifications. NEHRP Soils B and C typically can sustain ground shaking without much effect, dependent on the earthquake magnitude. The areas that are most affected by ground shaking have NEHRP Soils D, E and F. In general, these areas are most susceptible to liquefaction.
Table 9-5. NEHRP Soil Classification System NEHRP
Soil Type Description Mean Shear Velocity
to 30 m (m/s) A Hard Rock 1,500 B Firm to Hard Rock 760-1,500 C Dense Soil/Soft Rock 360-760 D Stiff Soil 180-360 E Soft Clays < 180 F Special Study Soils (liquefiable soils, sensitive clays, organic soils, soft clays >36 m thick) Depends on soil type
The USGS has created a soil-type map for the Los Angeles area that provides rough estimates of site effects based on surface geology. NEHRP soil types were assigned to a geologic unit based on the average velocity of that unit, and USGS notes that this approach can lead to some inaccuracy. For instance, a widespread unit consisting of Quaternary sand, gravel, silt, and mud has been assigned as Class C soil types; however, some of the slower soil types in this unit fall under Class D. USGS does not have any way of differentiating units for slower-velocity soils in its digital geologic dataset (USGS, 2016e).
9.2 HAZARD PROFILE
9.2.1 Past Events Los Angeles has been included in three FEMA declarations for earthquakes: the 1994 Northridge Earthquake (DR-1008), the 1987 earthquakes (DR-799), and the 1971 San Fernando Earthquake (DR-299). Table 9-6 lists earthquakes of magnitude 5.0 or greater within a 100-mile radius of the planning area.
The 1994 Northridge Earthquake was the most recent earthquake to greatly affect the city. It was the most costly seismic event in California since the 1906 San Francisco Earthquake. The infrastructure of the metropolitan area was severely disrupted. Freeways collapsed, power systems for the city and linked communities as far away as Oregon were temporarily blacked out, and communications were disrupted. Table 9-7 lists estimated damage.
Officially lasting approximately 30 seconds, and with a magnitude of M6.7, this earthquake caused significant damage to buildings in every area of the city. Of 57 fatalities attributed to this quake, 16 were a result of the collapse of a single structure—the Northridge Meadows apartment building. The ground motion was measured throughout Southern California, including intensity readings of 1.82 g near the Ventura Freeway in the Tarzana area. Ground motions as strong as 1.21 g were measured as far away as Inglewood (approximately 25 miles from Northridge). One “g” of ground motion is enough to make unsecured buildings literally hop off their foundations.

City of Los Angeles 2018 Local Hazard Mitigation Plan Earthquake
9-6
Table 9-6. Earthquakes Magnitude 5.0 or Larger Within 100-mile Radius of the Planning Area Date Magnitude Epicenter Location Fault Line 03/29/2014 Brea Earthquake 5.1 Near Brea, CA Puente Hills fault 07/29/2008 5.44 Near Chino Hills, CA Whittier fault 01/17/1994 Northridge Earthquake 6.7 20 miles west-northwest of LA Northridge Thrust 06/28/1991 Sierra Madre Earthquake 5.8 12 miles northeast of Pasadena, CA Clamshell-Sawpit Canyon fault 02/28/1990 Upland Earthquake 7.9 30 miles east of LA San Jose fault 01/18/1989 Malibu Earthquake 5.0 20 miles south of Malibu, CA N/A 12/03/1988 Pasadena Earthquake 5.0 Below City of Pasadena, CA Raymond fault 06/26/1988 Upland Earthquake 7.9 30 miles east of LA San Jose fault 06/10/1988 Tejon Ranch Earthquake 6.8 Northeast of Frazier Park, CA N/A 10/01/1987 Whittier Narrows Earthquake 5.9 Southeast of Pasadena Puente Hills fault 01/01/1979 Malibu Earthquake 5.2 South of Malibu, CA N/A 08/13/1978 Santa Barbara Earthquake 5.1 Southeast of Santa Barbara, CA unknown 02/21/1973 Point Mugu Earthquake 5.3 Near Oxnard, 45 miles west of LA San Fernando fault 02/09/1971 San Fernando Earthquake 6.5 Near Sylmar, CA San Fernando fault 12/4/1948 Desert Hot Springs Earthquake 6.0 Near Desert Hot Springs, 100 miles east of LA S. Branch San Andreas fault 6/30/1941 Santa Barbara Earthquake 5.5 6 miles ESE of Santa Barbara, CA N/A 3/10/1933 Long Beach Earthquake 6.4 3 miles south of Huntington Beach, CA Newport-Inglewood fault Source: Southern California Earthquake Data Center, 2017
Table 9-7. Northridge Earthquake Estimated Damages Number Estimated Losses
Residential 86,457 $1,150,939,340 Commercial 6,236 $459,955,246 Mix Use 224 $7,568,900 Total 92,917 $1,618,463,486 Source: City of Los Angeles, 2011
According to the scientists of the U.S. Geological Survey (USGS) and the Southern California Earthquake Center, the Northridge Earthquake raised nearby mountains by as much as 70 centimeters. The fault, which was previously unknown, appears to be truncated by the fault that broke in the similarly sized 1971 San Fernando Earthquake, the two faults abutting at a depth of 5 miles. The Northridge Earthquake caused many times more damage than the 1971 event, primarily because its fault is directly under the densely populated valley, whereas the 1971 fault lies under the mountains.
9.2.2 Location
Major Faults The City of Los Angeles is located in a region of high seismicity with numerous local faults, as shown on Figure 9-2. The primary seismic hazard for the City is potential ground shaking from these major known faults, especially the Newport-Inglewood, Palos Verde, Puente Hills, San Andreas, and Santa Monica faults, which are further described in the sections below.
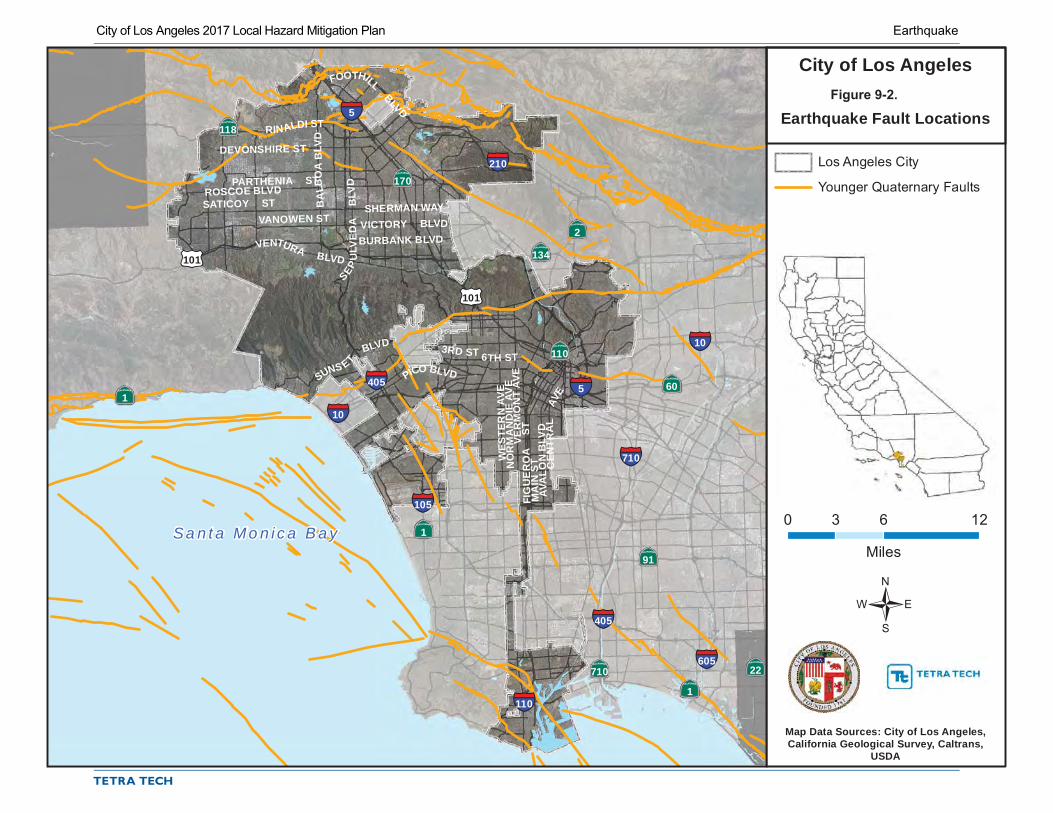
§¦605
§¦405
§¦405
§¦10
§¦10
§¦105
§¦710
§¦110
§¦5
§¦5
§¦210
ÄÆÅ1
ÄÆÅ22
ÄÆÅ1
ÄÆÅ1ÄÆÅ710
ÄÆÅ91
ÄÆÅ110
ÄÆÅ170
ÄÆÅ2
ÄÆÅ60
ÄÆÅ134
ÄÆÅ118
£¤101
£¤101
3RD ST
ROSCOE BLVD
AVA
LON
BLV
D
VANOWEN ST
6TH ST
VER
MO
NT
AVEPICO BLVD
NO
RM
AN
DIE
AV
E
VICTORY BLVD
WES
TER
N A
VE
VENTURA BLVD
SATICOY ST
FOOTHILL
BLVD
DEVONSHIRE ST
PARTHENIA ST
SUNS ETBLVD
RINALDI ST
BURBANK BLVD
SHERMAN WAY
FIG
UE
RO
A
STM
AIN
ST CEN
TRA
LAV
E
SEPU
LVE
DA
BLV
D
BA
LBO
AB
LVD
Los Angeles City
Younger Quaternary Faults
Map Data Sources: City of Los Angeles,California Geological Survey, Caltrans,
USDA
City of Los Angeles
0 6 123
Miles
/
Earthquake Fault Locations
Sa n t a M o n i c a B a y
Figure 9-2.
City of Los Angeles 2017 Local Hazard Mitigation Plan Earthquake
laura.leone
Typewritten Text
9-7

City of Los Angeles 2018 Local Hazard Mitigation Plan Earthquake
9-8
Newport-Inglewood The Newport-Inglewood fault is a right-lateral strike-slip fault that extends for 47 miles from Culver City southeast through Inglewood and other coastal communities to Newport Beach, at which point the fault extends east-southeast into the Pacific Ocean where it is known as the Rose Canyon Fault. The fault can be inferred on the Earth’s surface as passing along and through a line of hills extending from Signal Hill to Culver City. This is the second most active fault in California and is capable of producing an earthquake with a magnitude of 6.3 to 7.5.
Palos Verde The Palos Verde fault extends from the Pacific Ocean and comes ashore near the southwest point of the Redondo Beach-Torrance border. The fault then curves around the base of the Palos Verdes Peninsula roughly midway between the Pacific Coast Highway and the peninsula. It continues this southerly course until it runs into the Los Angeles Harbor.
Puente Hills The Puente Hills fault, also known as the Puente Hills thrust system, is an active geological fault that runs about 25 miles in three discrete sections from the Puente Hills region in the southeast to just south of Griffith Park in the northwest. The fault is known as a blind thrust fault due to the lack of surface features normally associated with thrust faults. This fault is capable of producing an earthquake with a magnitude between 7.0 and 7.5.
San Andreas The San Andreas fault is a continental transform fault that extends roughly 800 miles through California. It forms the tectonic boundary between the Pacific Plate and the North American Plate, and its motion is right-lateral strike-slip (horizontal). The fault divides into three segments, each with different characteristics and a different degree of earthquake risk, the most significant being the southern segment, which passes within about 35 miles of Los Angeles.
Santa Monica The Santa Monica fault is one of several northeast-southwest-trending, north-dipping, reverse faults that extend through the Los Angeles metropolitan area for approximately 50 miles. This fault is capable of producing an earthquake with a magnitude of 6.0 to 7.0.
Mapping of Earthquake Impact The impact of an earthquake is largely a function of the following components:
• Ground shaking (ground motion accelerations) • Liquefaction (soil instability) • Distance from the source (both horizontally and vertically).
Mapping that shows the impacts of these components was used to assess the risk of earthquakes within the planning area. While the impacts of these components can build upon each other during an earthquake, the mapping looks at each component individually.
Shake Maps A shake map is a representation of ground shaking produced by an earthquake. The information it presents is different from the earthquake magnitude and epicenter that are released after an earthquake because shake maps focus on the ground shaking resulting from the earthquake, rather than the parameters describing the earthquake source. An earthquake has only one magnitude and one epicenter, but it produces a range of ground shaking at

City of Los Angeles 2018 Local Hazard Mitigation Plan Earthquake
9-9
sites throughout the region, depending on the distance from the earthquake, the rock and soil conditions at sites, and variations in the propagation of seismic waves from the earthquake due to complexities in the structure of the earth’s crust. A shake map shows the extent and variation of ground shaking in a region immediately following significant earthquakes.
Ground motion and intensity maps are derived from peak ground motion amplitudes recorded on seismic sensors (accelerometers), with interpolation based on estimated amplitudes where data are lacking, and site amplification corrections. Color-coded instrumental intensity maps are derived from empirical relations between peak ground motions and Modified Mercalli intensity. Earthquake scenario maps describe the expected ground motions and effects of hypothetical large earthquakes for a region. The following scenarios were assessed for this plan:
• Newport-Inglewood Fault Scenario—A Magnitude 7.2 event with a depth of 7.5 miles and epicenter 32 miles southeast of downtown Los Angeles. See Figure 9-3.
• Palos Verde Fault Scenario—A Magnitude 7.3 event with a depth of 7.0 miles and epicenter 55 miles south-southeast of downtown Los Angeles. See Figure 9-4.
• Puente Hills Fault Scenario—A Magnitude 7.0 event with a depth of 7.6 miles and epicenter 11.5 miles northeast of downtown Los Angeles. See Figure 9-5.
• San Andreas Fault Scenario—A Magnitude 7.8 event with a depth of 4.7 miles and epicenter 150 miles east-southeast of downtown Los Angeles. See Figure 9-6.
• Santa Monica Fault Scenario—A Magnitude 6.8 event with a depth of 5.7 miles and epicenter 9.5 miles northwest of downtown Los Angeles. See Figure 9-7.
NEHRP Soil Maps NEHRP soil types define the locations that will be significantly impacted by an earthquake. NEHRP Soils B and C typically can sustain low-magnitude ground shaking without much effect. The areas that are most commonly affected by ground shaking have NEHRP Soils D, E and F. NEHRP soil classifications in each APC are shown in Figure 9-8 through Figure 9-14.
Liquefaction Maps When the ground liquefies, sandy or silty materials saturated with water behave like a liquid, causing pipes to leak, roads and airport runways to buckle, and building foundations to be damaged. In general, areas with NEHRP Soils D, E and F are susceptible to liquefaction. If there is a dry soil crust, excess water will sometimes come to the surface through cracks in the confining layer, bringing liquefied sand with it, creating sand boils. Liquefaction susceptibility in each APC is shown in Figure 9-15 through Figure 9-21.
9.2.3 Frequency California experiences hundreds of earthquakes each year, most with minimal damage and magnitudes below 3.0 on the Richter Scale. Earthquakes that cause moderate damage to structures occur several times a year. According to the USGS, a strong earthquake measuring greater than 5.0 on the Richter Scale occurs every two to three years and major earthquakes of more than 7.0 on the Richter Scale occur once a decade. The San Andreas Fault has the potential for experiencing major to great events. The State Hazard Mitigation Plan indicates that in the next 30 years in California there is over a 99-percent probability of a magnitude 6.7 earthquake and a 94-percent probability of a magnitude 7.0 earthquake.

§¦605
§¦405
§¦405
§¦10
§¦10
§¦105
§¦710
§¦110
§¦5
§¦5
§¦210
ÄÆÅ1
ÄÆÅ22
ÄÆÅ1
ÄÆÅ1
ÄÆÅ91
ÄÆÅ110
ÄÆÅ170
ÄÆÅ2
ÄÆÅ60
ÄÆÅ134
ÄÆÅ118
£¤101
£¤101
3RD ST
ROSCOE BLVD
AVA
LON
BLV
D
VANOWEN ST
6TH ST
VER
MO
NT
AVEPICO BLVD
NO
RM
AN
DIE
AV
E
VICTORY BLVD
VENTURA BLVD
SATICOY ST
FOOTHILL
BLVD
DEVONSHIRE ST
PARTHENIA ST
SUNS ETBLVD
RINALDI ST
BURBANK BLVD
SHERMAN WAY
FIG
UE
RO
A
STM
AIN
STW
ESTE
RN
AVE
CEN
TRA
LAV
E
SEPU
LVE
DA
BLV
D
BA
LBO
AB
LVD
Los Angeles City
Modified Mercalli Scale,Potential Shaking
I (Not Felt)
II-III (Weak)
IV (Light)
V (Moderate)
VI (Strong)
VII (Very Strong)
VIII (Severe)
IX (Violent)
X+ (Extreme)
Map Data Sources: City of Los Angeles,Caltrans, USGS, USDA
City of Los Angeles
0 6 123
Miles
/
Newport Inglewood M7.2Earthquake Scenario
Peak Ground Acceleration
Range of Model Results Inside Planning Area
Sa n t a M o n i c a B a y
Figure 9-3.
City of Los Angeles 2017 Local Hazard Mitigation Plan Earthquake
9-10
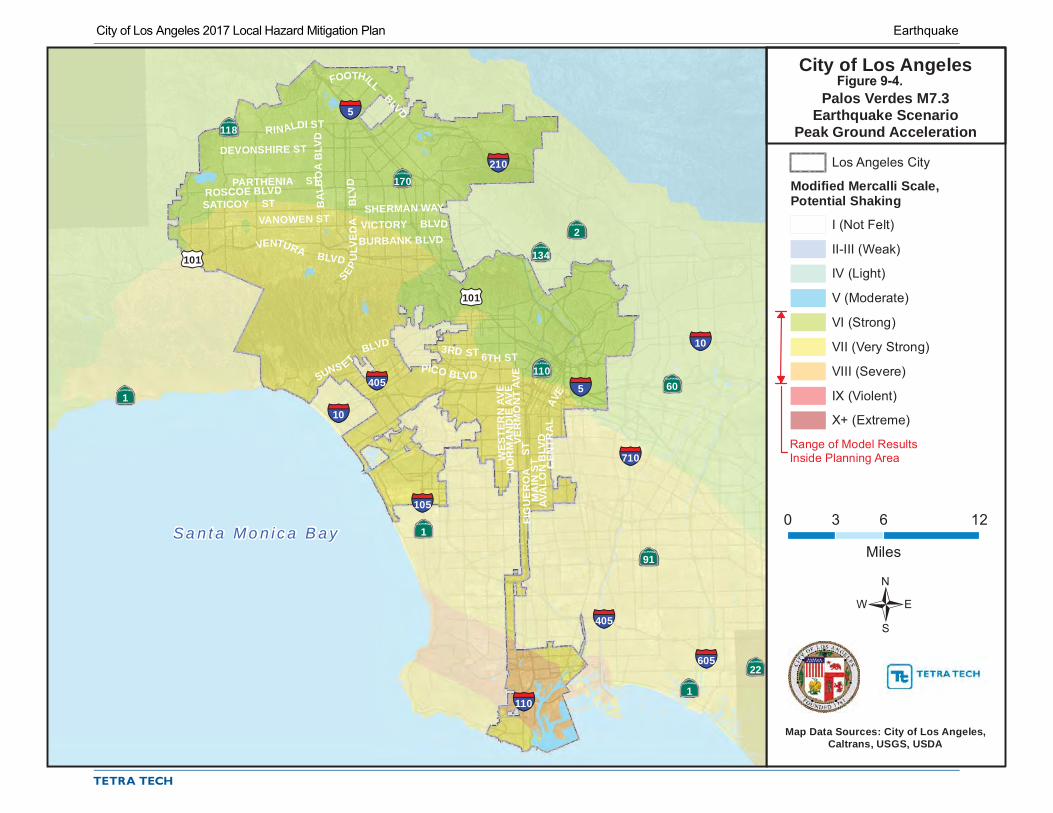
§¦605
§¦405
§¦405
§¦10
§¦10
§¦105
§¦710
§¦110
§¦5
§¦5
§¦210
ÄÆÅ1
ÄÆÅ22
ÄÆÅ1
ÄÆÅ1
ÄÆÅ91
ÄÆÅ110
ÄÆÅ170
ÄÆÅ2
ÄÆÅ60
ÄÆÅ134
ÄÆÅ118
£¤101
£¤101
3RD ST
ROSCOE BLVD
AVA
LON
BLV
D
VANOWEN ST
6TH ST
VER
MO
NT
AVEPICO BLVD
NO
RM
AN
DIE
AV
E
VICTORY BLVD
VENTURA BLVD
SATICOY ST
FOOTHILL
BLVD
DEVONSHIRE ST
PARTHENIA ST
SUNS ETBLVD
RINALDI ST
BURBANK BLVD
SHERMAN WAY
FIG
UE
RO
A
STM
AIN
STW
ESTE
RN
AVE
CEN
TRA
LAV
E
SEPU
LVE
DA
BLV
D
BA
LBO
AB
LVD
Los Angeles City
Modified Mercalli Scale,Potential Shaking
I (Not Felt)
II-III (Weak)
IV (Light)
V (Moderate)
VI (Strong)
VII (Very Strong)
VIII (Severe)
IX (Violent)
X+ (Extreme)
Map Data Sources: City of Los Angeles,Caltrans, USGS, USDA
City of Los Angeles
0 6 123
Miles
/
Palos Verdes M7.3Earthquake Scenario
Peak Ground Acceleration
Range of Model Results Inside Planning Area
Sa n t a M o n i c a B a y
Figure 9-4.
City of Los Angeles 2017 Local Hazard Mitigation Plan Earthquake
laura.leone
Typewritten Text
9-11

§¦605
§¦405
§¦405
§¦10
§¦10
§¦105
§¦710
§¦110
§¦5
§¦5
§¦210
ÄÆÅ1
ÄÆÅ22
ÄÆÅ1
ÄÆÅ1
ÄÆÅ91
ÄÆÅ110
ÄÆÅ170
ÄÆÅ2
ÄÆÅ60
ÄÆÅ134
ÄÆÅ118
£¤101
£¤101
3RD ST
ROSCOE BLVD
AVA
LON
BLV
D
VANOWEN ST
6TH ST
VER
MO
NT
AVEPICO BLVD
NO
RM
AN
DIE
AV
E
VICTORY BLVD
VENTURA BLVD
SATICOY ST
FOOTHILL
BLVD
DEVONSHIRE ST
PARTHENIA ST
SUNS ETBLVD
RINALDI ST
BURBANK BLVD
SHERMAN WAY
FIG
UE
RO
A
STM
AIN
STW
ESTE
RN
AVE
CEN
TRA
LAV
E
SEPU
LVE
DA
BLV
D
BA
LBO
AB
LVD
Los Angeles City
Modified Mercalli Scale,Potential Shaking
I (Not Felt)
II-III (Weak)
IV (Light)
V (Moderate)
VI (Strong)
VII (Very Strong)
VIII (Severe)
IX (Violent)
X+ (Extreme)
Map Data Sources: City of Los Angeles,Caltrans, USGS, USDA
City of Los Angeles
0 6 123
Miles
/
Puente Hills M7.0Earthquake Scenario
Peak Ground Acceleration
Range of Model Results Inside Planning Area
Sa n t a M o n i c a B a y
Figure 9-5.
City of Los Angeles 2017 Local Hazard Mitigation Plan Earthquake
9-12
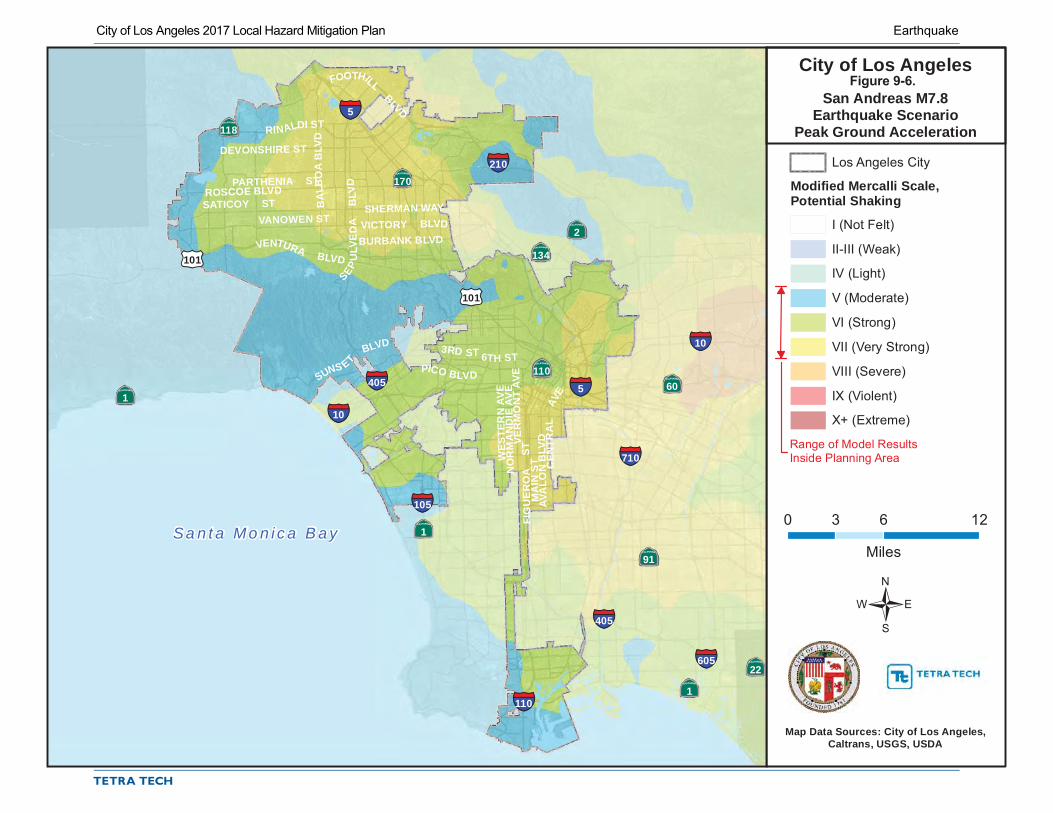
§¦605
§¦405
§¦405
§¦10
§¦10
§¦105
§¦710
§¦110
§¦5
§¦5
§¦210
ÄÆÅ1
ÄÆÅ22
ÄÆÅ1
ÄÆÅ1
ÄÆÅ91
ÄÆÅ110
ÄÆÅ170
ÄÆÅ2
ÄÆÅ60
ÄÆÅ134
ÄÆÅ118
£¤101
£¤101
3RD ST
ROSCOE BLVD
AVA
LON
BLV
D
VANOWEN ST
6TH ST
VER
MO
NT
AVEPICO BLVD
NO
RM
AN
DIE
AV
E
VICTORY BLVD
VENTURA BLVD
SATICOY ST
FOOTHILL
BLVD
DEVONSHIRE ST
PARTHENIA ST
SUNS ETBLVD
RINALDI ST
BURBANK BLVD
SHERMAN WAY
FIG
UE
RO
A
STM
AIN
STW
ESTE
RN
AVE
CEN
TRA
LAV
E
SEPU
LVE
DA
BLV
D
BA
LBO
AB
LVD
Los Angeles City
Modified Mercalli Scale,Potential Shaking
I (Not Felt)
II-III (Weak)
IV (Light)
V (Moderate)
VI (Strong)
VII (Very Strong)
VIII (Severe)
IX (Violent)
X+ (Extreme)
Map Data Sources: City of Los Angeles,Caltrans, USGS, USDA
City of Los Angeles
0 6 123
Miles
/
San Andreas M7.8Earthquake Scenario
Peak Ground Acceleration
Range of Model Results Inside Planning Area
Sa n t a M o n i c a B a y
Figure 9-6.
City of Los Angeles 2017 Local Hazard Mitigation Plan Earthquake
laura.leone
Typewritten Text
9-13
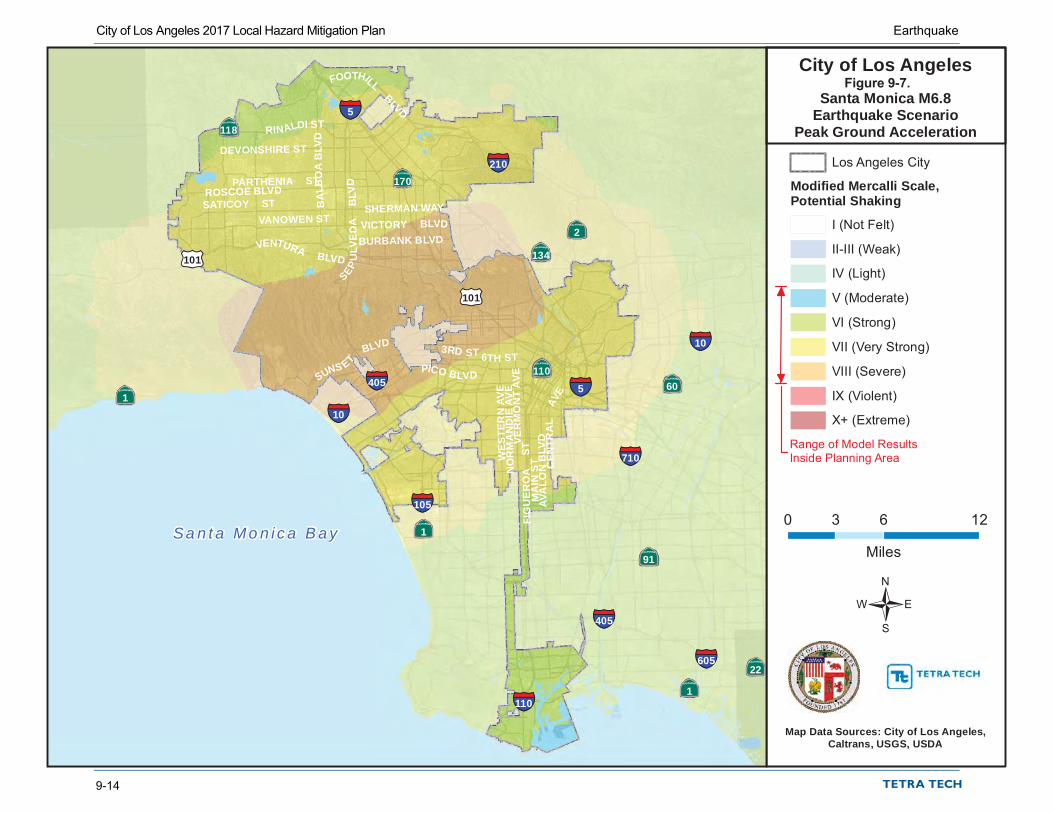
§¦605
§¦405
§¦405
§¦10
§¦10
§¦105
§¦710
§¦110
§¦5
§¦5
§¦210
ÄÆÅ1
ÄÆÅ22
ÄÆÅ1
ÄÆÅ1
ÄÆÅ91
ÄÆÅ110
ÄÆÅ170
ÄÆÅ2
ÄÆÅ60
ÄÆÅ134
ÄÆÅ118
£¤101
£¤101
3RD ST
ROSCOE BLVD
AVA
LON
BLV
D
VANOWEN ST
6TH ST
VER
MO
NT
AVEPICO BLVD
NO
RM
AN
DIE
AV
E
VICTORY BLVD
VENTURA BLVD
SATICOY ST
FOOTHILL
BLVD
DEVONSHIRE ST
PARTHENIA ST
SUNS ETBLVD
RINALDI ST
BURBANK BLVD
SHERMAN WAY
FIG
UE
RO
A
STM
AIN
STW
ESTE
RN
AVE
CEN
TRA
LAV
E
SEPU
LVE
DA
BLV
D
BA
LBO
AB
LVD
Los Angeles City
Modified Mercalli Scale,Potential Shaking
I (Not Felt)
II-III (Weak)
IV (Light)
V (Moderate)
VI (Strong)
VII (Very Strong)
VIII (Severe)
IX (Violent)
X+ (Extreme)
Map Data Sources: City of Los Angeles,Caltrans, USGS, USDA
City of Los Angeles
0 6 123
Miles
/
Santa Monica M6.8Earthquake Scenario
Peak Ground Acceleration
Range of Model Results Inside Planning Area
Sa n t a M o n i c a B a y
Figure 9-7.
City of Los Angeles 2017 Local Hazard Mitigation Plan Earthquake
9-14
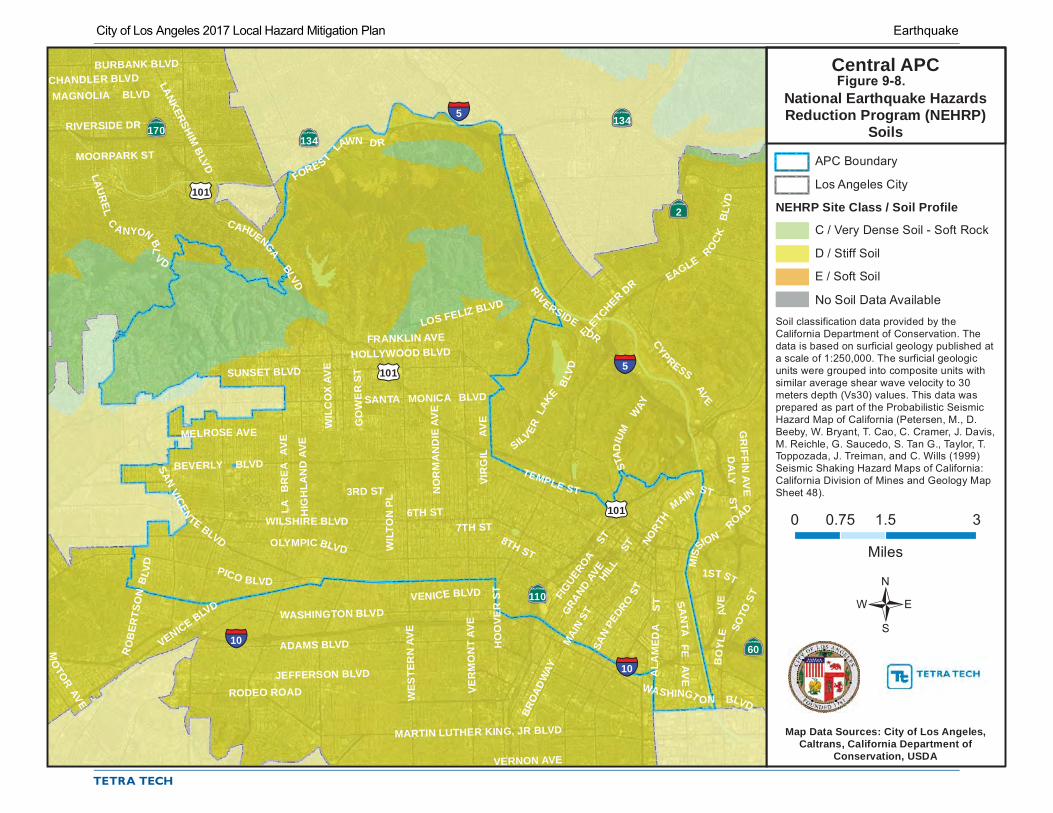
§¦10
§¦10
§¦5
§¦5
ÄÆÅ60
ÄÆÅ170
ÄÆÅ110
ÄÆÅ2
ÄÆÅ134
ÄÆÅ134
£¤101
£¤101
£¤101
3RD ST
GRAND
AVE
MELROSE AVE
FRANKLIN AVE
BEVERLY BLVD
1STST
6TH ST
JEFFERSON BLVD
VERNON AVE
TEMPLE ST
MARTIN LUTHER KING, JR BLVD
VER
MO
NT
AVE
7TH ST8TH ST
EAGLERO
CK
BLV
DB
OYL
EAV
E
PICO BLVD
VENICE BLVDHIL
L ST
SAN
TAFE
AVE
SUNSET BLVD
WASHINGT ON BLVD
HOLLYWOOD BLVD
VIR
GIL
AV
E
RIVERSIDEDR
MAGNOLIA BLVD
MOORPARK ST
WASHINGTON BLVD
LOS FELIZ BLVD
SOTO
ST
ADAMS BLVD
WILSHIRE BLVD
RODEO ROAD
VENICE BLVD
NORT
H
MAINST
LAU
REL
C
A NYON BL
VD
SANTA MONICA BLVD
OLYMPIC BLVD
FLETCHER DR
SANVICEN
TE BLVD
BURBANK BLVD
SILVERLA
KE
BLV
D
FORESTLAWN DR
RIVERSIDE DR
CHANDLER BLVD
CYPRESS
AV
E
CAHUENGABLVD
FIGUEROA
STSA
NPE
DROST
LANKERSHIM BLVD
LA
BR
EA
AV
E
MO
TORAVE W
ESTE
RN
AVE
MAI
N ST
BROA
DWAY
GO
WE
R S
T
GR
IFFIN AV
E
HO
OVE
R S
T
WIL
CO
X A
VE
ALA
MED
A
ST
MIS
SION
ROAD
WIL
TON
PL N
OR
MA
ND
IE A
VE
HIG
HLA
ND
AVE
RO
BER
TSO
NB
LVD
DA
LYS
T
STA
DIU
MW
AY
APC Boundary
Los Angeles City
NEHRP Site Class / Soil Profile
C / Very Dense Soil - Soft Rock
D / Stiff Soil
E / Soft Soil
Map Data Sources: City of Los Angeles,Caltrans, California Department of
Conservation, USDA
Central APC
0 1.5 30.75
Miles
/
Soil classification data provided by theCalifornia Department of Conservation. Thedata is based on surficial geology published ata scale of 1:250,000. The surficial geologicunits were grouped into composite units withsimilar average shear wave velocity to 30meters depth (Vs30) values. This data wasprepared as part of the Probabilistic SeismicHazard Map of California (Petersen, M., D.Beeby, W. Bryant, T. Cao, C. Cramer, J. Davis,M. Reichle, G. Saucedo, S. Tan G., Taylor, T.Toppozada, J. Treiman, and C. Wills (1999)Seismic Shaking Hazard Maps of California:California Division of Mines and Geology MapSheet 48).
National Earthquake HazardsReduction Program (NEHRP)
Soils
No Soil Data Available
Figure 9-8.
City of Los Angeles 2017 Local Hazard Mitigation Plan Earthquake
laura.leone
Typewritten Text
9-15

§¦210
§¦710
§¦10
§¦10
§¦5
§¦5
ÄÆÅ710
ÄÆÅ110
ÄÆÅ2
ÄÆÅ60
ÄÆÅ134
ÄÆÅ134
£¤101
£¤101
3RD ST
GRAND
AVE
MELROSE AVE
BEVERLYBLVD
1ST ST
6TH ST
VERNON AVE
TEMPLE ST
MARTIN LUTHER KING, JR BLVD
VER
MO
NT
AVE
7TH ST
8TH ST
EA
GLEROCK
BLV
D
PICO BLVD HILL
ST
SAN
TAF E
AVE
YORK BLVD
WASHINGT ON BLVD
YOSEMITE DR
HOLLYWOOD BLVD
CESAR E CHAVEZ AVE
FIG
UER
OAST
FRANKLIN AVE
GR
IFFIN AV
E
RIVERSIDE
DRSUNSET BLVD
LOS FELIZ BLVD
HUNTING TON
DR
SOTO
ST
IND
IAN
A
ST
4TH STWHITTIER BLVD
ADAMS BLVDEXPOSITION BLVD
VALLE Y
BLVD
SANTA MONICA BLVD
NO
RTH
BROAD WAYSILVER
LAKE
BLV
D
OLYMPIC BLVD
OLYMPICBLVD
CYPRESS
AV
E
FIG
UERO
A ST
SAN
PEDRO
ST
WES
TER
N A
VE
MAI
N ST
BROA
DWAY
CO
LLIS
AVE
HO
OVE
R S
T
NO
RM
AN
DIE
AVE
ALA
ME
DA
ST
AVEN
UE
64
WIL
TON
PL
AR
LIN
GTO
NAV
E
STA
DIUM
WAY
APC Boundary
Los Angeles City
NEHRP Site Class / Soil Profile
C / Very Dense Soil - Soft Rock
D / Stiff Soil
E / Soft Soil
Map Data Sources: City of Los Angeles,Caltrans, California Department of
Conservation, USDA
East Los Angeles APC
0 1.5 30.75
Miles
/
Soil classification data provided by theCalifornia Department of Conservation. Thedata is based on surficial geology published ata scale of 1:250,000. The surficial geologicunits were grouped into composite units withsimilar average shear wave velocity to 30meters depth (Vs30) values. This data wasprepared as part of the Probabilistic SeismicHazard Map of California (Petersen, M., D.Beeby, W. Bryant, T. Cao, C. Cramer, J. Davis,M. Reichle, G. Saucedo, S. Tan G., Taylor, T.Toppozada, J. Treiman, and C. Wills (1999)Seismic Shaking Hazard Maps of California:California Division of Mines and Geology MapSheet 48).
National Earthquake HazardsReduction Program (NEHRP)
Soils
No Soil Data Available
Figure 9-9.
City of Los Angeles 2017 Local Hazard Mitigation Plan Earthquake
9-16

§¦710
§¦710
§¦110
§¦105
§¦105
§¦405
§¦405
ÄÆÅ1
ÄÆÅ1ÄÆÅ1
ÄÆÅ1
ÄÆÅ91
FIG
UE
RO
AST
PACIFIC COAST HWY
IMPERIAL HWY
ANAHEIM ST
PAC
IFIC
AV
E
IMPERIAL HWY
LOMITA BLVD
VER
MO
NT
AVE
GA
FFEYST
PASEODEL MAR
WES
TER
N A
VE
NO
RM
AN
DIE
AV
E
APC Boundary
Los Angeles City
NEHRP Site Class / Soil Profile
C / Very Dense Soil - Soft Rock
D / Stiff Soil
E / Soft Soil
Map Data Sources: City of Los Angeles,Caltrans, California Department of
Conservation, USDA
Harbor APC
0 2.5 51.25
Miles
/
Soil classification data provided by theCalifornia Department of Conservation. Thedata is based on surficial geology published ata scale of 1:250,000. The surficial geologicunits were grouped into composite units withsimilar average shear wave velocity to 30meters depth (Vs30) values. This data wasprepared as part of the Probabilistic SeismicHazard Map of California (Petersen, M., D.Beeby, W. Bryant, T. Cao, C. Cramer, J. Davis,M. Reichle, G. Saucedo, S. Tan G., Taylor, T.Toppozada, J. Treiman, and C. Wills (1999)Seismic Shaking Hazard Maps of California:California Division of Mines and Geology MapSheet 48).
National Earthquake HazardsReduction Program (NEHRP)
Soils
No Soil Data Available
Figure 9-10.
City of Los Angeles 2017 Local Hazard Mitigation Plan Earthquake
laura.leone
Typewritten Text
9-17
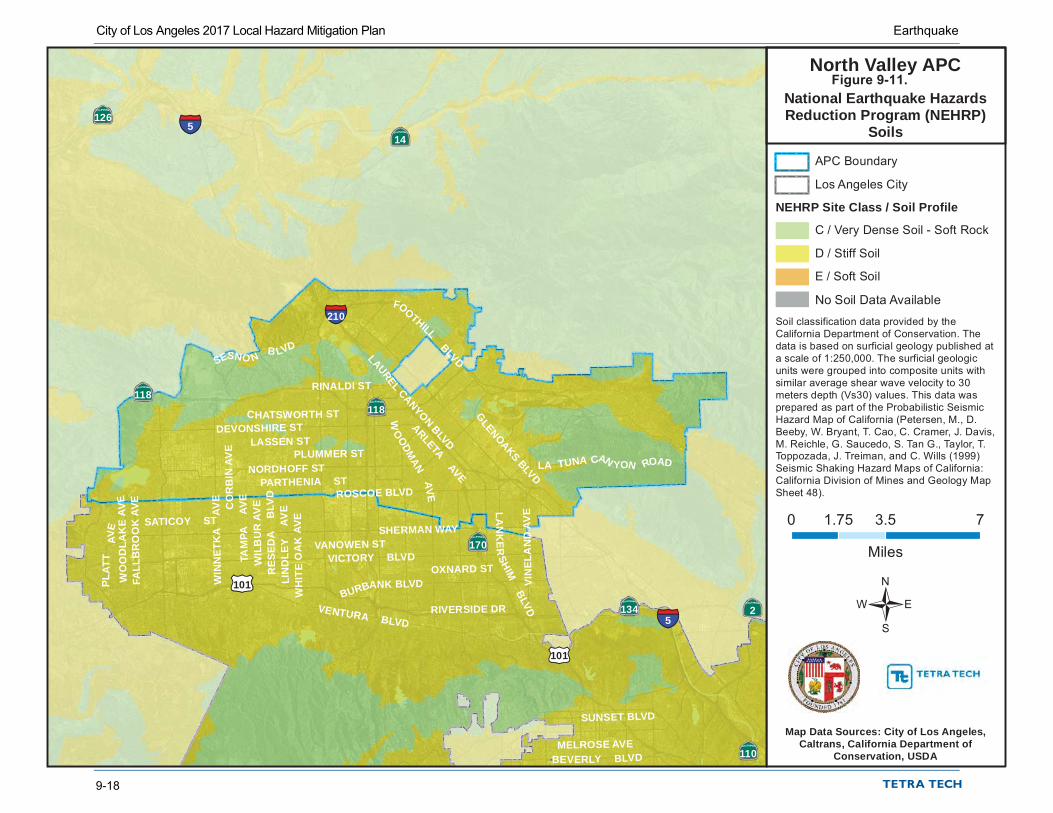
§¦210
§¦5
§¦5
ÄÆÅ110
ÄÆÅ126
ÄÆÅ170
ÄÆÅ2ÄÆÅ134
ÄÆÅ14
ÄÆÅ118ÄÆÅ118
£¤101
£¤101
MELROSE AVE
FALL
BR
OO
K A
VE
ROSCOE BLVD
BEVERLY BLVD
VANOWEN ST
OXNARD STVICTORY BLVD
GLENOAKSBLVD
SUNSET BLVD
VENTURA BLVD
CHATSWORTH ST
SATICOY ST
LAUREL CANYONBLVD
NORDHOFF ST
FOOTHILLBLVD
DEVONSHIRE STLASSEN ST
PLUMMER ST
WIL
BU
R A
VECO
RB
IN A
VE
PARTHENIA ST
TAM
PA
AVE
WIN
NET
KA
AV
E
LIN
DLE
Y AV
EW
HIT
EO
AK
AVE
RIVERSIDE DR
RINALDI ST
BURBANK BLVDWO
OD
LAK
EAV
E
SHERMAN WAY
SESNO NB LVD
LA TUNA CAN YON ROAD
LAN
KE
RSHIM
BLVD
RES
EDA
B
LVD
WOODM
ANA
VE
VIN
ELA
ND
AV
E
PLAT
TAV
E
ARLETA AVE
APC Boundary
Los Angeles City
NEHRP Site Class / Soil Profile
C / Very Dense Soil - Soft Rock
D / Stiff Soil
E / Soft Soil
Map Data Sources: City of Los Angeles,Caltrans, California Department of
Conservation, USDA
North Valley APC
0 3.5 71.75
Miles
/
Soil classification data provided by theCalifornia Department of Conservation. Thedata is based on surficial geology published ata scale of 1:250,000. The surficial geologicunits were grouped into composite units withsimilar average shear wave velocity to 30meters depth (Vs30) values. This data wasprepared as part of the Probabilistic SeismicHazard Map of California (Petersen, M., D.Beeby, W. Bryant, T. Cao, C. Cramer, J. Davis,M. Reichle, G. Saucedo, S. Tan G., Taylor, T.Toppozada, J. Treiman, and C. Wills (1999)Seismic Shaking Hazard Maps of California:California Division of Mines and Geology MapSheet 48).
National Earthquake HazardsReduction Program (NEHRP)
Soils
No Soil Data Available
Figure 9-11.
City of Los Angeles 2017 Local Hazard Mitigation Plan Earthquake
9-18

§¦5
§¦405
§¦110
§¦105 §¦105
§¦10
§¦10
ÄÆÅ1
ÄÆÅ60
ÄÆÅ110
£¤101
NORTH MA IN ST3RD ST
GRAN
D AV
E
FLO
WER
ST
HO
OVE
R S
T
1STST
JEFFERSON BLVD
VERNON AVE
MARTIN LUTHER KING, JR BLVD
VER
MO
NT
AVE
48TH ST
SLAUSON AVE
FLORENCE AVE
7TH ST
8TH ST
BO
YLE
AVE
PICO BLVD
NO
RM
AN
DIE
AV
E
IMPERIAL HWY
WES
TER
N A
VE
HILL
ST
SAN
TAFE
AVE
WASHINGT ON BLVD
OLIV
EST
LOS
ANGELESST
CESAR E CHAVEZ AVE
CENTURY BLVD
108TH ST
WASHINGTON BLVD
IMPERIAL HWY
ADAMS BLVD
WILSHIRE BLVD
RODEO ROAD
CR
ENS
HA
W B
LVD
VENICE BLVD
OLYMPIC BLVD
SAN
VICENTE BLVD
EXPOSITION BLVD
MANCHESTER AVE
GAGE AVE
VAN
NES
SAV
E
ALVA
RADO
ST
STOCKER ST
FIGUEROA
ST
FIG
UE
RO
A
ST
AVA
LON
BLV
D
SAN
PEDRO
ST
MA
IN S
T
LA
BRE
AAV
E
MO
TORAVE
CEN
TRA
L AV
E
BR
OA
DW
AY
HO
OVE
R S
T
AVIA
TIO
N B
LVD
VER
MO
NT
AVE
SAN
PED
RO
ST
ALA
ME
DA
STLO
NG
BE
AC
HAV
E
LAC
IEN
EG
AB
LVD
AR
LIN
GTO
N A
VE
RO
BER
TSO
NB
LVD
APC Boundary
Los Angeles City
NEHRP Site Class / Soil Profile
C / Very Dense Soil - Soft Rock
D / Stiff Soil
E / Soft Soil
Map Data Sources: City of Los Angeles,Caltrans, California Department of
Conservation, USDA
South Los Angeles APC
0 1.5 30.75
Miles
/
Soil classification data provided by theCalifornia Department of Conservation. Thedata is based on surficial geology published ata scale of 1:250,000. The surficial geologicunits were grouped into composite units withsimilar average shear wave velocity to 30meters depth (Vs30) values. This data wasprepared as part of the Probabilistic SeismicHazard Map of California (Petersen, M., D.Beeby, W. Bryant, T. Cao, C. Cramer, J. Davis,M. Reichle, G. Saucedo, S. Tan G., Taylor, T.Toppozada, J. Treiman, and C. Wills (1999)Seismic Shaking Hazard Maps of California:California Division of Mines and Geology MapSheet 48).
National Earthquake HazardsReduction Program (NEHRP)
Soils
No Soil Data Available
Figure 9-12.
City of Los Angeles 2017 Local Hazard Mitigation Plan Earthquake
laura.leone
Typewritten Text
9-19
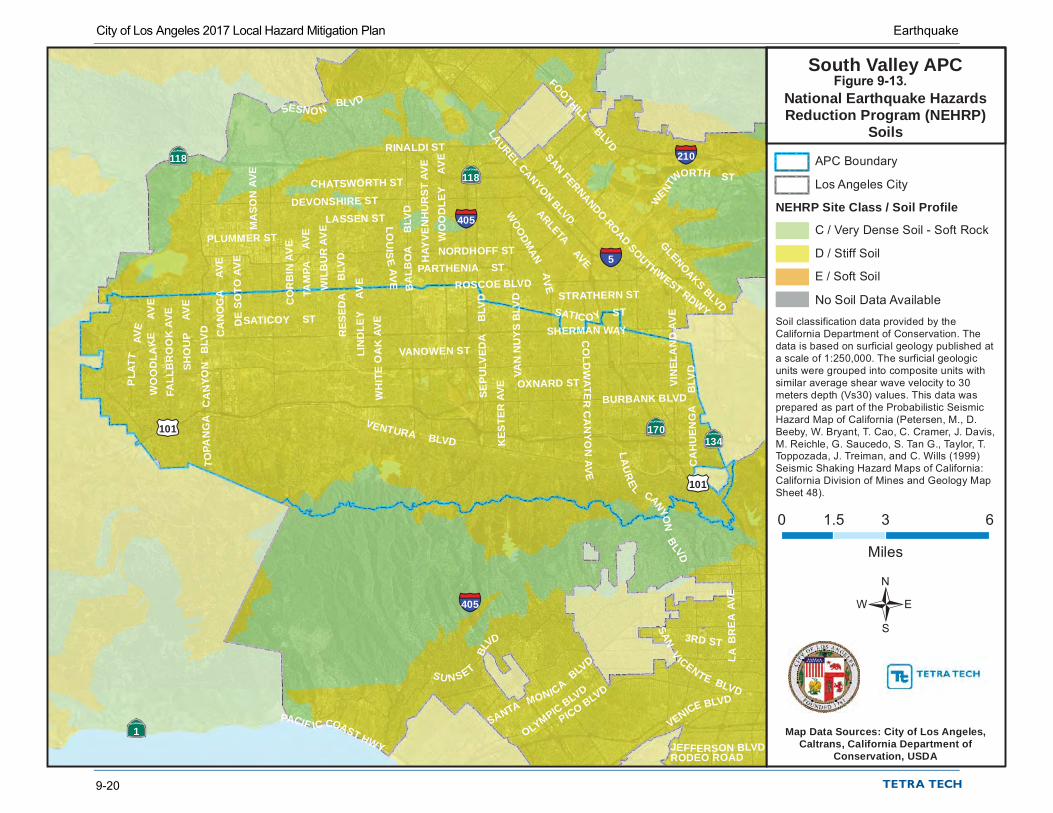
§¦210
§¦5
§¦405
§¦405
ÄÆÅ1
ÄÆÅ134ÄÆÅ170
ÄÆÅ118ÄÆÅ118
£¤101
£¤101
FALL
BR
OO
K A
VE
ROSCOE BLVD
KES
TER
AVE
PACIF IC COAST HWY
VANOWEN ST
LOU
ISE
AV E
OXNARD ST
VENICE BLVD
GLENOAKSBLVD
VENTURA BLVD
3RD ST
CHATSWORTH ST
SATICOY ST
PICO BLVD
PLUMMER ST
LAUREL CANYONBLVD
NORDHOFF ST
DEVONSHIRE ST
LASSEN ST
FOOTHILLBLVD
OLYMPICBLVD
WIL
BU
R A
VE
CO
RB
IN A
VE
PARTHENIA ST
JEFFERSON BLVD
STRATHERN ST
WO
OD
LEY
AVE
DE
SO
TOAV
E
TAM
PA
AVE
LIN
DLE
Y AV
E
MA
SON
AVE
WH
ITE
OA
KAV
E
RODEO ROAD
SU NSET
BL
VD
SHO
UP
AVE
LAU
RE
LCANYO
NB
LVD
RINALDI ST
BURBANK BLVD
SANTA MONICABLVD
CO
LDW
AT ER
CA
NYO
NAV
E
SANV
ICENTE BLVDC
AH
UEN
GA
B
LVD
SANFERNANDO
ROADSOUTHWEST RDWY
W
ENT
WORTH ST
SHERMAN WAY
WO
OD
LAKE
AVE
CA
NO
GA
AV
E HAY
VEN
HU
RS
T AV
E
VAN
NU
YS
BLV
D
SESNO NBLVD
RES
EDA
B
LVD
L AB
RE
AAV
E
SEPU
LVED
A
BLV
D
WOO
DMAN
AV
EBALB
OA
BLV
D
VIN
ELA
ND
AV
E
PLA
TTAV
E
ARLETA AVE
SATIC OY ST
TO
PAN
GA
CA
NYO
NB
LVD
APC Boundary
Los Angeles City
NEHRP Site Class / Soil Profile
C / Very Dense Soil - Soft Rock
D / Stiff Soil
E / Soft Soil
Map Data Sources: City of Los Angeles,Caltrans, California Department of
Conservation, USDA
South Valley APC
0 3 61.5
Miles
/
Soil classification data provided by theCalifornia Department of Conservation. Thedata is based on surficial geology published ata scale of 1:250,000. The surficial geologicunits were grouped into composite units withsimilar average shear wave velocity to 30meters depth (Vs30) values. This data wasprepared as part of the Probabilistic SeismicHazard Map of California (Petersen, M., D.Beeby, W. Bryant, T. Cao, C. Cramer, J. Davis,M. Reichle, G. Saucedo, S. Tan G., Taylor, T.Toppozada, J. Treiman, and C. Wills (1999)Seismic Shaking Hazard Maps of California:California Division of Mines and Geology MapSheet 48).
National Earthquake HazardsReduction Program (NEHRP)
Soils
No Soil Data Available
Figure 9-13.
City of Los Angeles 2017 Local Hazard Mitigation Plan Earthquake
9-20
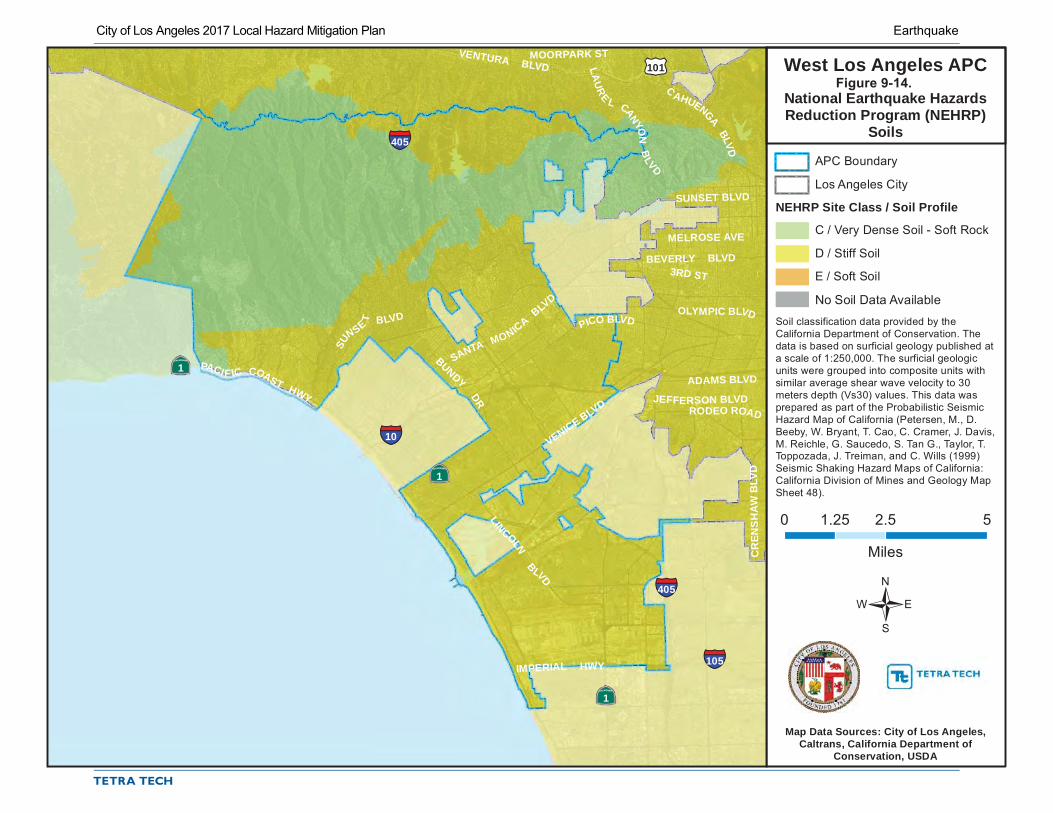
§¦105
§¦10
§¦405
§¦405
ÄÆÅ1
ÄÆÅ1
ÄÆÅ1
£¤101
PICO BLVD
BEVERLY BLVD
PACI F IC COAST HWY
SUNSET BLVD
VENTURA BLVD
LINCOLNBLVD
3RD ST
MOORPARK ST
LAU
RE L CANYO
NB
LVDJEFFERSON BLVD
IMPERIAL HWY
ADAMS BLVD
RODEO ROAD
SUNSE
T BLVD
VENICE BLVD
SANTA MONICABLV
DOLYMPIC BLVD
BUNDY
DR
MELROSE AVE
CR
ENS
HA
W B
LVD
C
AHUENGABLVD
APC Boundary
Los Angeles City
NEHRP Site Class / Soil Profile
C / Very Dense Soil - Soft Rock
D / Stiff Soil
E / Soft Soil
Map Data Sources: City of Los Angeles,Caltrans, California Department of
Conservation, USDA
West Los Angeles APC
0 2.5 51.25
Miles
/
Soil classification data provided by theCalifornia Department of Conservation. Thedata is based on surficial geology published ata scale of 1:250,000. The surficial geologicunits were grouped into composite units withsimilar average shear wave velocity to 30meters depth (Vs30) values. This data wasprepared as part of the Probabilistic SeismicHazard Map of California (Petersen, M., D.Beeby, W. Bryant, T. Cao, C. Cramer, J. Davis,M. Reichle, G. Saucedo, S. Tan G., Taylor, T.Toppozada, J. Treiman, and C. Wills (1999)Seismic Shaking Hazard Maps of California:California Division of Mines and Geology MapSheet 48).
National Earthquake HazardsReduction Program (NEHRP)
Soils
No Soil Data Available
Figure 9-14.
City of Los Angeles 2017 Local Hazard Mitigation Plan Earthquake
laura.leone
Typewritten Text
laura.leone
Typewritten Text
9-21
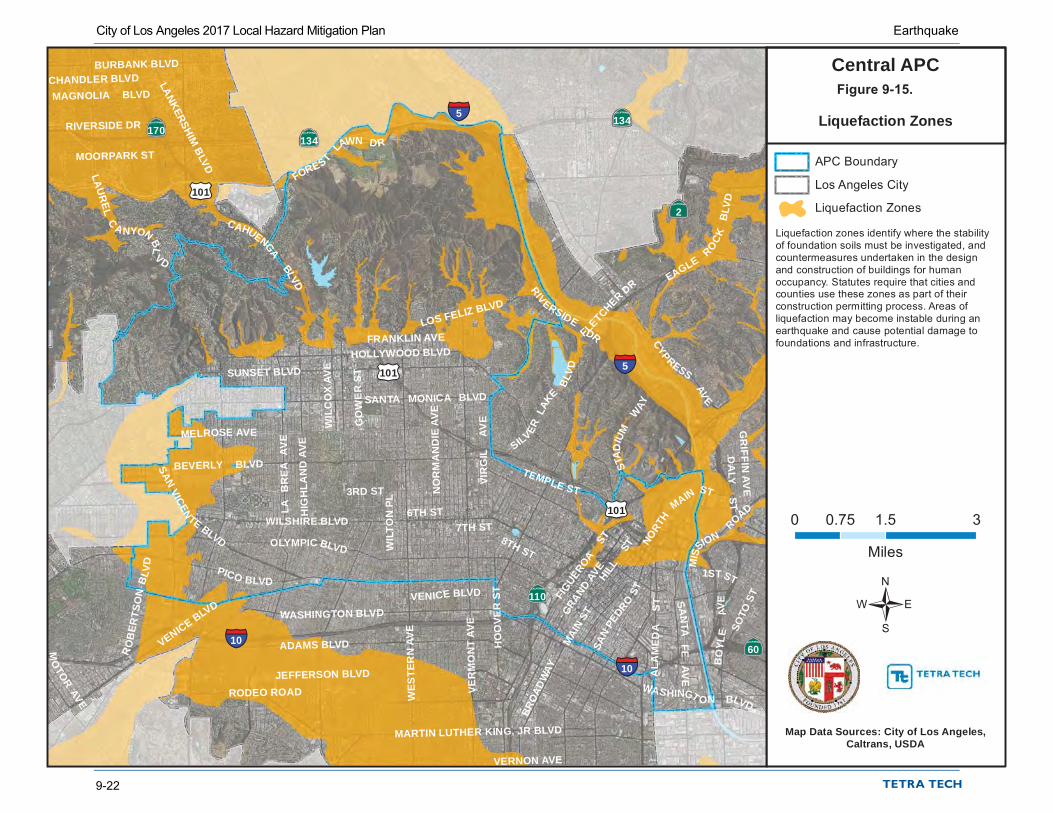
§¦10
§¦10
§¦5
§¦5
ÄÆÅ60
ÄÆÅ170
ÄÆÅ110
ÄÆÅ2
ÄÆÅ134
ÄÆÅ134
£¤101
£¤101
£¤101
3RD ST
GRAND
AVE
MELROSE AVE
FRANKLIN AVE
BEVERLY BLVD
1STST
6TH ST
JEFFERSON BLVD
VERNON AVE
TEMPLE ST
MARTIN LUTHER KING, JR BLVD
VER
MO
NT
AVE
7TH ST8TH ST
EAGLERO
CK
BLV
DB
OYL
EAV
E
PICO BLVD
VENICE BLVDHIL
L ST
SAN
TAFE
AVE
SUNSET BLVD
WASHINGT ON BLVD
HOLLYWOOD BLVD
VIR
GIL
AV
E
RIVERSIDEDR
MAGNOLIA BLVD
MOORPARK ST
WASHINGTON BLVD
LOS FELIZ BLVD
SOTO
ST
ADAMS BLVD
WILSHIRE BLVD
RODEO ROAD
VENICE BLVD
NORT
H
MAINST
LAU
REL
C
A NYON BL
VD
SANTA MONICA BLVD
OLYMPIC BLVD
FLETCHER DR
SANVICEN
TE BLVD
BURBANK BLVD
SILVERLA
KE
BLV
D
FORESTLAWN DR
RIVERSIDE DR
CHANDLER BLVD
CYPRESS
AV
E
CAHUENGABLVD
FIGUEROA
STSA
NPE
DROST
LANKERSHIM BLVD
LA
BR
EA
AV
E
MO
TORAVE W
ESTE
RN
AVE
MAI
N ST
BROA
DWAY
GO
WE
R S
T
GR
IFFIN AV
E
HO
OVE
R S
T
WIL
CO
X A
VE
ALA
MED
A
ST
MIS
SION
ROAD
WIL
TON
PL N
OR
MA
ND
IE A
VE
HIG
HLA
ND
AVE
RO
BER
TSO
NB
LVD
DA
LYS
T
STA
DIU
MW
AY
APC Boundary
Los Angeles City
Liquefaction Zones
Map Data Sources: City of Los Angeles,Caltrans, USDA
Central APC
0 1.5 30.75
Miles
/
Liquefaction zones identify where the stabilityof foundation soils must be investigated, andcountermeasures undertaken in the designand construction of buildings for humanoccupancy. Statutes require that cities andcounties use these zones as part of theirconstruction permitting process. Areas ofliquefaction may become instable during anearthquake and cause potential damage tofoundations and infrastructure.
Liquefaction Zones
Figure 9-15.
City of Los Angeles 2017 Local Hazard Mitigation Plan Earthquake
9-22
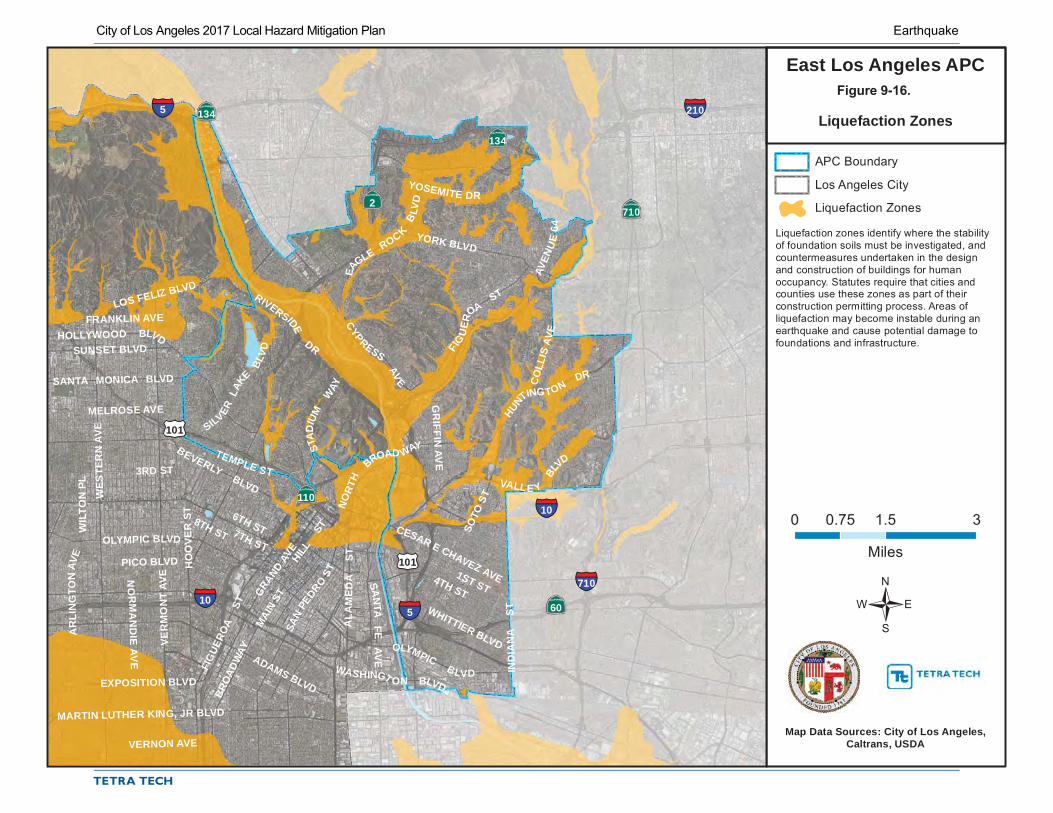
§¦210
§¦710
§¦10
§¦10
§¦5
§¦5
ÄÆÅ710
ÄÆÅ110
ÄÆÅ2
ÄÆÅ60
ÄÆÅ134
ÄÆÅ134
£¤101
£¤101
3RD ST
GRAND
AVE
MELROSE AVE
BEVERLYBLVD
1ST ST
6TH ST
VERNON AVE
TEMPLE ST
MARTIN LUTHER KING, JR BLVD
VER
MO
NT
AVE
7TH ST
8TH ST
EA
GLEROCK
BLV
D
PICO BLVD HILL
ST
SAN
TAF E
AVE
YORK BLVD
WASHINGT ON BLVD
YOSEMITE DR
HOLLYWOOD BLVD
CESAR E CHAVEZ AVE
FIG
UER
OAST
FRANKLIN AVE
GR
IFFIN AV
E
RIVERSIDE
DRSUNSET BLVD
LOS FELIZ BLVD
HUNTING TON
DR
SOTO
ST
IND
IAN
A
ST
4TH STWHITTIER BLVD
ADAMS BLVDEXPOSITION BLVD
VALLE Y
BLVD
SANTA MONICA BLVD
NO
RTH
BROAD WAYSILVER
LAKE
BLV
D
OLYMPIC BLVD
OLYMPICBLVD
CYPRESS
AV
E
FIG
UERO
A ST
SAN
PEDRO
ST
WES
TER
N A
VE
MAI
N ST
BROA
DWAY
CO
LLIS
AVE
HO
OVE
R S
T
NO
RM
AN
DIE
AVE
ALA
ME
DA
ST
AVEN
UE
64
WIL
TON
PL
AR
LIN
GTO
NAV
E
STA
DIUM
WAY
APC Boundary
Los Angeles City
Liquefaction Zones
Map Data Sources: City of Los Angeles,Caltrans, USDA
East Los Angeles APC
0 1.5 30.75
Miles
/
Liquefaction zones identify where the stabilityof foundation soils must be investigated, andcountermeasures undertaken in the designand construction of buildings for humanoccupancy. Statutes require that cities andcounties use these zones as part of theirconstruction permitting process. Areas ofliquefaction may become instable during anearthquake and cause potential damage tofoundations and infrastructure.
Liquefaction Zones
Figure 9-16.
City of Los Angeles 2017 Local Hazard Mitigation Plan Earthquake
laura.leone
Typewritten Text
laura.leone
Typewritten Text
9-23
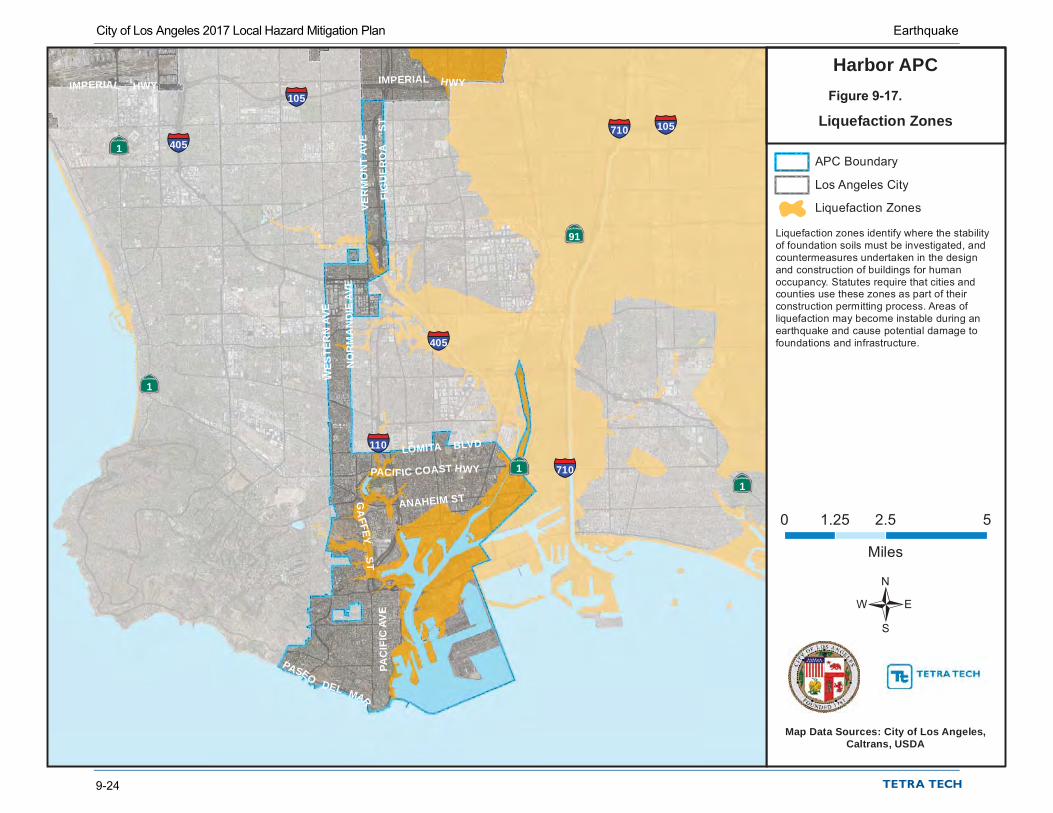
§¦710
§¦710
§¦110
§¦105
§¦105
§¦405
§¦405
ÄÆÅ1
ÄÆÅ1ÄÆÅ1
ÄÆÅ1
ÄÆÅ91
FIG
UE
RO
AST
PACIFIC COAST HWY
IMPERIAL HWY
ANAHEIM ST
PAC
IFIC
AV
E
IMPERIAL HWY
LOMITA BLVD
VER
MO
NT
AVE
GA
FFEYST
PASEODEL MAR
WES
TER
N A
VE
NO
RM
AN
DIE
AV
E
APC Boundary
Los Angeles City
Liquefaction Zones
Map Data Sources: City of Los Angeles,Caltrans, USDA
Harbor APC
0 2.5 51.25
Miles
/
Liquefaction zones identify where the stabilityof foundation soils must be investigated, andcountermeasures undertaken in the designand construction of buildings for humanoccupancy. Statutes require that cities andcounties use these zones as part of theirconstruction permitting process. Areas ofliquefaction may become instable during anearthquake and cause potential damage tofoundations and infrastructure.
Liquefaction Zones
Figure 9-17.
City of Los Angeles 2017 Local Hazard Mitigation Plan Earthquake
9-24
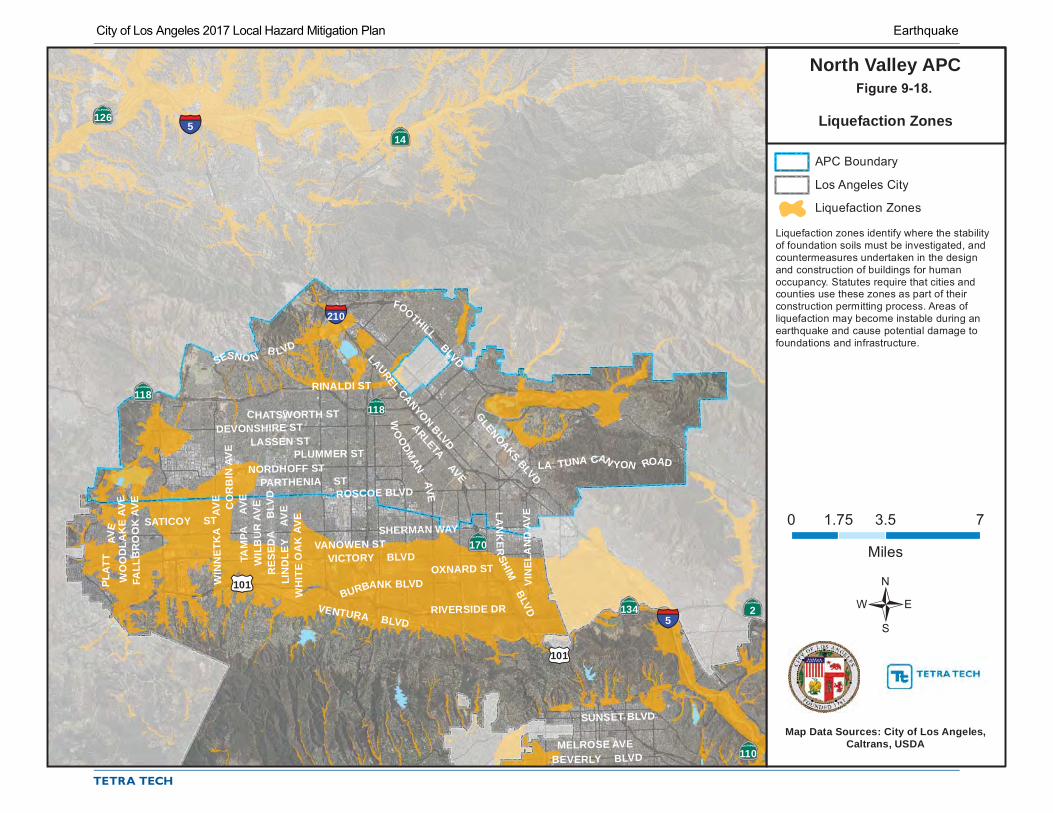
§¦210
§¦5
§¦5
ÄÆÅ110
ÄÆÅ126
ÄÆÅ170
ÄÆÅ2ÄÆÅ134
ÄÆÅ14
ÄÆÅ118ÄÆÅ118
£¤101
£¤101
MELROSE AVE
FALL
BR
OO
K A
VE
ROSCOE BLVD
BEVERLY BLVD
VANOWEN ST
OXNARD STVICTORY BLVD
GLENOAKSBLVD
SUNSET BLVD
VENTURA BLVD
CHATSWORTH ST
SATICOY ST
LAUREL CANYONBLVD
NORDHOFF ST
FOOTHILLBLVD
DEVONSHIRE STLASSEN ST
PLUMMER ST
WIL
BU
R A
VECO
RB
IN A
VE
PARTHENIA ST
TAM
PA
AVE
WIN
NET
KA
AV
E
LIN
DLE
Y AV
EW
HIT
EO
AK
AVE
RIVERSIDE DR
RINALDI ST
BURBANK BLVDWO
OD
LAK
EAV
E
SHERMAN WAY
SESNO NB LVD
LA TUNA CAN YON ROAD
LAN
KE
RSHIM
BLVD
RES
EDA
B
LVD
WOODM
ANA
VE
VIN
ELA
ND
AV
E
PLAT
TAV
E
ARLETA AVE
APC Boundary
Los Angeles City
Liquefaction Zones
Map Data Sources: City of Los Angeles,Caltrans, USDA
North Valley APC
0 3.5 71.75
Miles
/
Liquefaction zones identify where the stabilityof foundation soils must be investigated, andcountermeasures undertaken in the designand construction of buildings for humanoccupancy. Statutes require that cities andcounties use these zones as part of theirconstruction permitting process. Areas ofliquefaction may become instable during anearthquake and cause potential damage tofoundations and infrastructure.
Liquefaction Zones
Figure 9-18.
City of Los Angeles 2017 Local Hazard Mitigation Plan Earthquake
laura.leone
Typewritten Text
9-25
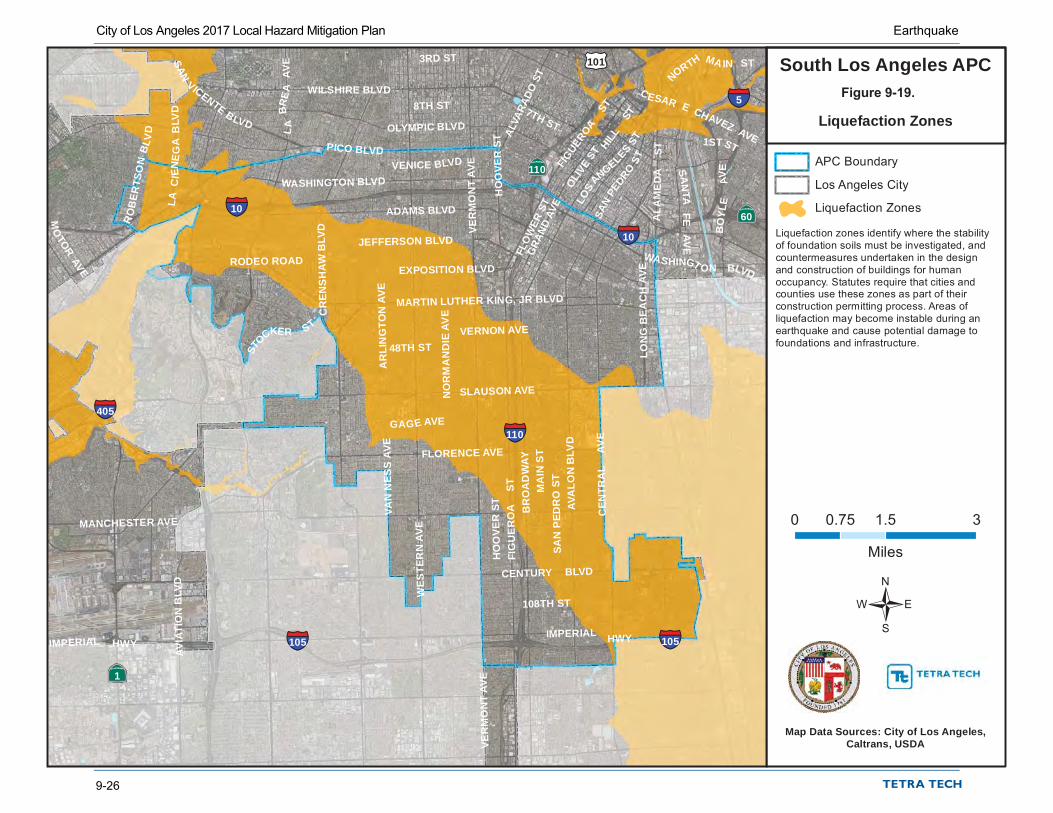
§¦5
§¦405
§¦110
§¦105 §¦105
§¦10
§¦10
ÄÆÅ1
ÄÆÅ60
ÄÆÅ110
£¤101
NORTH MA IN ST3RD ST
GRAN
D AV
E
FLO
WER
ST
HO
OVE
R S
T
1STST
JEFFERSON BLVD
VERNON AVE
MARTIN LUTHER KING, JR BLVD
VER
MO
NT
AVE
48TH ST
SLAUSON AVE
FLORENCE AVE
7TH ST
8TH ST
BO
YLE
AVE
PICO BLVD
NO
RM
AN
DIE
AV
E
IMPERIAL HWY
WES
TER
N A
VE
HILL
ST
SAN
TAFE
AVE
WASHINGT ON BLVD
OLIV
EST
LOS
ANGELESST
CESAR E CHAVEZ AVE
CENTURY BLVD
108TH ST
WASHINGTON BLVD
IMPERIAL HWY
ADAMS BLVD
WILSHIRE BLVD
RODEO ROAD
CR
ENS
HA
W B
LVD
VENICE BLVD
OLYMPIC BLVD
SAN
VICENTE BLVD
EXPOSITION BLVD
MANCHESTER AVE
GAGE AVE
VAN
NES
SAV
E
ALVA
RADO
ST
STOCKER ST
FIGUEROA
ST
FIG
UE
RO
A
ST
AVA
LON
BLV
D
SAN
PEDRO
ST
MA
IN S
T
LA
BRE
AAV
E
MO
TORAVE
CEN
TRA
L AV
E
BR
OA
DW
AY
HO
OVE
R S
T
AVIA
TIO
N B
LVD
VER
MO
NT
AVE
SAN
PED
RO
ST
ALA
ME
DA
STLO
NG
BE
AC
HAV
E
LAC
IEN
EG
AB
LVD
AR
LIN
GTO
N A
VE
RO
BER
TSO
NB
LVD
APC Boundary
Los Angeles City
Liquefaction Zones
Map Data Sources: City of Los Angeles,Caltrans, USDA
South Los Angeles APC
0 1.5 30.75
Miles
/
Liquefaction zones identify where the stabilityof foundation soils must be investigated, andcountermeasures undertaken in the designand construction of buildings for humanoccupancy. Statutes require that cities andcounties use these zones as part of theirconstruction permitting process. Areas ofliquefaction may become instable during anearthquake and cause potential damage tofoundations and infrastructure.
Liquefaction Zones
Figure 9-19.
City of Los Angeles 2017 Local Hazard Mitigation Plan Earthquake
9-26

§¦210
§¦5
§¦405
§¦405
ÄÆÅ1
ÄÆÅ134ÄÆÅ170
ÄÆÅ118ÄÆÅ118
£¤101
£¤101
FALL
BR
OO
K A
VE
ROSCOE BLVD
KES
TER
AVE
PACIF IC COAST HWY
VANOWEN ST
LOU
ISE
AV E
OXNARD ST
VENICE BLVD
GLENOAKSBLVD
VENTURA BLVD
3RD ST
CHATSWORTH ST
SATICOY ST
PICO BLVD
PLUMMER ST
LAUREL CANYONBLVD
NORDHOFF ST
DEVONSHIRE ST
LASSEN ST
FOOTHILLBLVD
OLYMPICBLVD
WIL
BU
R A
VE
CO
RB
IN A
VE
PARTHENIA ST
JEFFERSON BLVD
STRATHERN ST
WO
OD
LEY
AVE
DE
SO
TOAV
E
TAM
PA
AVE
LIN
DLE
Y AV
E
MA
SON
AVE
WH
ITE
OA
KAV
E
RODEO ROAD
SU NSET
BL
VD
SHO
UP
AVE
LAU
RE
LCANYO
NB
LVD
RINALDI ST
BURBANK BLVD
SANTA MONICABLVD
CO
LDW
AT ER
CA
NYO
NAV
E
SANV
ICENTE BLVDC
AH
UEN
GA
B
LVD
SANFERNANDO
ROADSOUTHWEST RDWY
W
ENT
WORTH ST
SHERMAN WAY
WO
OD
LAKE
AVE
CA
NO
GA
AV
E HAY
VEN
HU
RS
T AV
E
VAN
NU
YS
BLV
D
SESNO NBLVD
RES
EDA
B
LVD
L AB
RE
AAV
E
SEPU
LVED
A
BLV
D
WOO
DMAN
AV
EBALB
OA
BLV
D
VIN
ELA
ND
AV
E
PLA
TTAV
E
ARLETA AVE
SATIC OY ST
TO
PAN
GA
CA
NYO
NB
LVD
APC Boundary
Los Angeles City
Liquefaction Zones
Map Data Sources: City of Los Angeles,Caltrans, USDA
South Valley APC
0 3 61.5
Miles
/
Liquefaction zones identify where the stabilityof foundation soils must be investigated, andcountermeasures undertaken in the designand construction of buildings for humanoccupancy. Statutes require that cities andcounties use these zones as part of theirconstruction permitting process. Areas ofliquefaction may become instable during anearthquake and cause potential damage tofoundations and infrastructure.
Liquefaction Zones
Figure 9-20.
City of Los Angeles 2017 Local Hazard Mitigation Plan Earthquake
laura.leone
Typewritten Text
9-27

§¦105
§¦10
§¦405
§¦405
ÄÆÅ1
ÄÆÅ1
ÄÆÅ1
£¤101
PICO BLVD
BEVERLY BLVD
PACI F IC COAST HWY
SUNSET BLVD
VENTURA BLVD
LINCOLNBLVD
3RD ST
MOORPARK ST
LAU
RE L CANYO
NB
LVDJEFFERSON BLVD
IMPERIAL HWY
ADAMS BLVD
RODEO ROAD
SUNSE
T BLVD
VENICE BLVD
SANTA MONICABLV
DOLYMPIC BLVD
BUNDY
DR
MELROSE AVE
CR
ENS
HA
W B
LVD
C
AHUENGABLVD
APC Boundary
Los Angeles City
Liquefaction Zones
Map Data Sources: City of Los Angeles,Caltrans, USDA
West Los Angeles APC
0 2.5 51.25
Miles
/
Liquefaction zones identify where the stabilityof foundation soils must be investigated, andcountermeasures undertaken in the designand construction of buildings for humanoccupancy. Statutes require that cities andcounties use these zones as part of theirconstruction permitting process. Areas ofliquefaction may become instable during anearthquake and cause potential damage tofoundations and infrastructure.
Liquefaction Zones
Figure 9-21.
City of Los Angeles 2017 Local Hazard Mitigation Plan Earthquake
9-28

City of Los Angeles 2018 Local Hazard Mitigation Plan Earthquake
9-29
9.2.4 Severity The USGS has created ground motion maps based on current information about fault zones. These maps show the PGA that has a certain probability (2 percent or 10 percent) of being exceeded in a 50-year period. The maps were most recently updated in 2014 with new seismic, geologic, and geodetic information on earthquake rates and ground shaking, representing the best currently available data. The 2014 map for California shows that for City of Los Angeles, the PGA with a 10-percent probability of exceedance in 50 years is 0.4g and 0.2g (see Figure 9-22).
Oval is approximate location of City of Los Angeles
Figure 9-22. PGA with 2-Percent Probability of Exceedance in 50 Years

City of Los Angeles 2018 Local Hazard Mitigation Plan Earthquake
9-30
9.2.5 Warning Time There is currently no reliable way to predict the day or month that an earthquake will occur at any given location. Research is being done with warning systems that use the low energy waves that precede major earthquakes. These potential warning systems give approximately 40 seconds notice that a major earthquake is about to occur. The warning time is very short but it could allow for someone to get under a desk, step away from a hazardous material they are working with, or shut down a computer system.
9.3 SECONDARY IMPACTS Earthquakes can cause large and sometimes disastrous landslides and mudslides. River valleys are vulnerable to slope failure, often as a result of loss of cohesion in clay-rich soils. Soil liquefaction occurs when water-saturated sands, silts or gravelly soils are shaken so violently that the individual grains lose contact with one another and float freely in the water, turning the ground into a pudding-like liquid. Building and road foundations lose load-bearing strength and may sink into what was previously solid ground. Unless properly secured, hazardous materials can be released, causing significant damage to the environment and people. Earthen dams and levees are highly susceptible to seismic events and the impacts of their eventual failures can be considered secondary risks for earthquakes.
Earthquakes can also trigger tsunamis. Tsunamis significantly damage many locations beyond where the earthquake struck. Coastal communities near the earthquake epicenter that are also vulnerable to tsunamis could experience devastating impacts. Additionally, fires can result from gas lines or power lines that are broken or downed during the earthquake. It may be difficult to control a fire, particularly if the water lines feeding fire hydrants are also broken.
9.4 EXPOSURE
9.4.1 Population The entire population of the planning area is potentially exposed to direct and indirect impacts from earthquakes. Whether directly impacted or indirectly impacted, the entire population will have to deal with the consequences of earthquakes to some degree. Business interruption could keep people from working, road closures could isolate populations, and loss of functions of utilities could impact populations that suffered no direct damage from an event itself.
9.4.2 Property According to assessor records, there are 746,352 buildings in the planning area, with a total replacement value of $767.9 billion. Since all structures in the planning area are susceptible to earthquake impacts to varying degrees, this total represents the property exposure to seismic events. Table 9-8 shows the exposure value breakdown by Area Planning Commission.
9.4.3 Critical Facilities and Infrastructure All critical facilities in the planning area are exposed to the earthquake hazard. Table 4-5 lists the number of each type of facility in the planning area. Facilities holding hazardous materials are of particular concern because of possible isolation of neighborhoods surrounding them. Hazardous materials releases can occur during an earthquake from fixed facilities or transportation-related incidents. During an earthquake, structures storing these materials could rupture and leak into the surrounding area or an adjacent waterway, having a disastrous effect on the environment. Transportation corridors can be disrupted during an earthquake, leading to the release of materials to the surrounding environment.

City of Los Angeles 2018 Local Hazard Mitigation Plan Earthquake
9-31
Table 9-8. Earthquake Exposure by Area Planning Commission Area Planning Commission Total # of Buildings Total Building Value—Structure and Contents Central 84,429 $191,217,052,041 East Los Angeles 72,052 $66,257,497,608 Harbor 39,749 $40,999,775,796 North Valley 151,060 $115,609,300,175 South Los Angeles 112,787 $98,455,728,673 South Valley 173,423 $145,505,548,380 West Los Angeles 112,852 $109,858,703,574 Total 746,352 $767,903,606,246
9.4.4 Environment Secondary hazards associated with earthquakes will likely have damaging effects on the environment. Earthquake-induced landslides can significantly impact surrounding habitat. It is also possible for streams to be rerouted after an earthquake. This can change the water quality, possibly damaging habitat and feeding areas. There is a possibility of streams fed by groundwater drying up because of changes in underlying geology.
9.5 VULNERABILITY Earthquake vulnerability data was generated using a Level 2 Hazus analysis. Once the location and size of a hypothetical earthquake are identified, Hazus estimates the intensity of the ground shaking, the number of buildings damaged, the number of casualties, the damage to transportation systems and utilities, the number of people displaced from their homes, and the estimated cost of repair and clean up.
9.5.1 Population The degree of vulnerability of people exposed to the earthquake hazard is dependent on many factors, including the age and construction type of the structures they live in, the soil type their homes are constructed on, their proximity to fault location, etc. There are estimated to be 1,189,384 people in over 428,992 households living on soils with liquefaction potential in the planning area. This is about 77 percent of the total population. Three population groups are particularly vulnerable to earthquake hazards:
• Population Below Poverty Level—An estimated 209,133 households in areas with liquefaction potential soils have household incomes less than $50,000 per year. This is about 49 percent of all households located on liquefaction potential soils. These households may lack the financial resources to improve their homes to prevent or mitigate earthquake damage. Economically disadvantaged residents are also less likely to have insurance to compensate for losses in earthquakes.
• Population Over 65 Years Old—An estimated 123,376 residents in areas with liquefaction potential soils are over 65 years old. This is about 10 percent of all residents in these areas. This population group is vulnerable because they are more likely to need special medical attention, which may not be available due to isolation caused by earthquakes. Elderly residents also have more difficulty leaving their homes during earthquake events and could be stranded in dangerous situations.
• Linguistically Isolated Populations—–Problems arise when there is an urgent need to inform non-English speaking residents of an earthquake event. They are vulnerable because of difficulties in understanding hazard-related information from predominantly English-speaking media and government agencies. No estimates have been developed of the number of linguistically isolated persons living in areas with liquefaction potential soils.
Impacts on persons and households in the planning area were estimated for the five scenario events through the Level 2 Hazus analysis. Table 9-9 summarizes the results.

City of Los Angeles 2018 Local Hazard Mitigation Plan Earthquake
9-32
Table 9-9. Estimated Earthquake Impact on Persons and Households Earthquake Scenario Number of Displaced Households Number of Persons Requiring Short-Term Shelter Newport-Inglewood 50,064 34,315 Palos Verde 13,015 9,193 Puente Hills 116,329 92,303 San Andreas 71,428 57,776 Santa Monica 93,572 55,283
9.5.2 Property
Building Age Table 9-10 identifies significant milestones in building and seismic code requirements that directly affect the structural integrity of development. Using these time periods, the planning team used Hazus to identify the number of structures in the planning area by date of construction.
Table 9-10. Age of Structures in Planning Area
Time Period
Number of Current Planning Area
Structures Built in Period Significance of Time Frame
Pre-1933 120,497 Before 1933, there were no explicit earthquake requirements in building codes. State law did not require local governments to have building officials or issue building permits.
1933-1940 42,566 In 1940, the first strong motion recording was made. 1941-1960 250,943 In 1960, the Structural Engineers Association of California published guidelines on
recommended earthquake provisions. 1961-1975 145,368 In 1975, significant improvements were made to lateral force requirements. 1976-1994 127,211 In 1994, the Uniform Building Code was amended to include provisions for seismic safety. 1994 – present 59,773 Seismic code is currently enforced. Total 746,358
The number of structures does not reflect the number of total housing units, as many multi-family units and attached housing units are reported as one structure. Approximately 8 percent of the planning area’s structures were constructed after the Uniform Building Code was amended in 1994 to include seismic safety provisions. Approximately 16 percent were built before 1933 when there were no building permits, inspections, or seismic standards.
Loss Potential Property losses were estimated through the Level 2 Hazus analysis for the five earthquake fault scenarios. Table 9-11 through Table 9-15 shows the results for damage to structures and damage to building contents.

City of Los Angeles 2018 Local Hazard Mitigation Plan Earthquake
9-33
Table 9-11. Loss Estimates for Newport-Inglewood Fault Scenario Estimated Loss Associated with Earthquake % of Total
Area Planning Commission Structure Contents Total Replacement
Value Central $8,241,730,263 $1,920,045,166 $10,161,775,428 5.3% East Los Angeles $1,305,221,209 $445,761,452 $1,750,982,661 2.6% Harbor $1,749,599,309 $531,934,262 $2,281,533,571 5.6% North Valley $867,454,730 $348,651,514 $1,216,106,244 1.1% South Los Angeles $7,569,043,634 $1,863,552,074 $9,432,595,708 9.6% South Valley $1,999,692,385 $636,853,477 $2,636,545,861 1.8% West Los Angeles $6,648,152,056 $1,651,233,193 $8,299,385,249 7.6% Total $28,380,893,585 $7,398,031,139 $35,778,924,723 4.7%
Table 9-12. Loss Estimates for Palos Verde Fault Scenario Estimated Loss Associated with Earthquake % of Total
Area Planning Commission Structure Contents Total Replacement
Value Central $1,964,015,648 $697,062,972 $2,661,078,620 1.4% East Los Angeles $500,900,960 $213,829,877 $714,730,836 1.1% Harbor $3,135,433,765 $960,807,399 $4,096,241,164 10.0% North Valley $571,011,942 $249,616,280 $820,628,222 0.7% South Los Angeles $1,290,293,580 $408,926,868 $1,699,220,448 1.7% South Valley $1,177,185,021 $439,600,127 $1,616,785,148 1.1% West Los Angeles $2,849,929,987 $779,747,585 $3,629,677,572 3.3% Total $11,488,770,903 $3,749,591,107 $15,238,362,010 2.0%
Table 9-13. Loss Estimates for Puente Hills Fault Scenario Estimated Loss Associated with Earthquake % of Total
Area Planning Commission Structure Contents Total Replacement
Value Central $30,232,804,494 $7,858,974,294 $38,091,778,788 19.9% East Los Angeles $10,319,509,533 $3,332,567,416 $13,652,076,949 20.6% Harbor $399,610,119 $139,106,363 $538,716,483 1.3% North Valley $1,503,231,885 $500,450,267 $2,003,682,153 1.7% South Los Angeles $13,651,437,366 $3,934,772,239 $17,586,209,605 17.9% South Valley $2,326,598,180 $675,458,539 $3,002,056,719 2.1% West Los Angeles $3,041,456,855 $784,733,477 $3,826,190,332 3.5% Total $61,474,648,432 $17,226,062,595 $78,700,711,027 10.2%
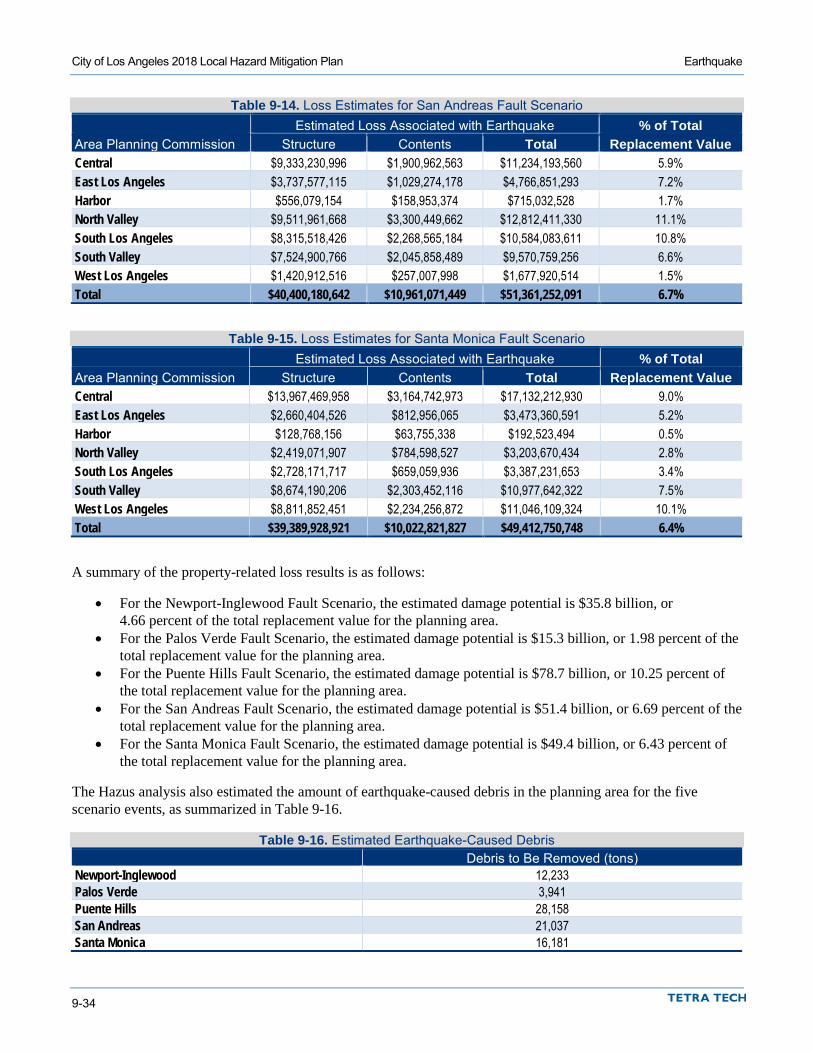
City of Los Angeles 2018 Local Hazard Mitigation Plan Earthquake
9-34
Table 9-14. Loss Estimates for San Andreas Fault Scenario Estimated Loss Associated with Earthquake % of Total Area Planning Commission Structure Contents Total Replacement Value Central $9,333,230,996 $1,900,962,563 $11,234,193,560 5.9% East Los Angeles $3,737,577,115 $1,029,274,178 $4,766,851,293 7.2% Harbor $556,079,154 $158,953,374 $715,032,528 1.7% North Valley $9,511,961,668 $3,300,449,662 $12,812,411,330 11.1% South Los Angeles $8,315,518,426 $2,268,565,184 $10,584,083,611 10.8% South Valley $7,524,900,766 $2,045,858,489 $9,570,759,256 6.6% West Los Angeles $1,420,912,516 $257,007,998 $1,677,920,514 1.5% Total $40,400,180,642 $10,961,071,449 $51,361,252,091 6.7%
Table 9-15. Loss Estimates for Santa Monica Fault Scenario Estimated Loss Associated with Earthquake % of Total Area Planning Commission Structure Contents Total Replacement Value Central $13,967,469,958 $3,164,742,973 $17,132,212,930 9.0% East Los Angeles $2,660,404,526 $812,956,065 $3,473,360,591 5.2% Harbor $128,768,156 $63,755,338 $192,523,494 0.5% North Valley $2,419,071,907 $784,598,527 $3,203,670,434 2.8% South Los Angeles $2,728,171,717 $659,059,936 $3,387,231,653 3.4% South Valley $8,674,190,206 $2,303,452,116 $10,977,642,322 7.5% West Los Angeles $8,811,852,451 $2,234,256,872 $11,046,109,324 10.1% Total $39,389,928,921 $10,022,821,827 $49,412,750,748 6.4%
A summary of the property-related loss results is as follows:
• For the Newport-Inglewood Fault Scenario, the estimated damage potential is $35.8 billion, or 4.66 percent of the total replacement value for the planning area.
• For the Palos Verde Fault Scenario, the estimated damage potential is $15.3 billion, or 1.98 percent of the total replacement value for the planning area.
• For the Puente Hills Fault Scenario, the estimated damage potential is $78.7 billion, or 10.25 percent of the total replacement value for the planning area.
• For the San Andreas Fault Scenario, the estimated damage potential is $51.4 billion, or 6.69 percent of the total replacement value for the planning area.
• For the Santa Monica Fault Scenario, the estimated damage potential is $49.4 billion, or 6.43 percent of the total replacement value for the planning area.
The Hazus analysis also estimated the amount of earthquake-caused debris in the planning area for the five scenario events, as summarized in Table 9-16.
Table 9-16. Estimated Earthquake-Caused Debris Debris to Be Removed (tons) Newport-Inglewood 12,233 Palos Verde 3,941 Puente Hills 28,158 San Andreas 21,037 Santa Monica 16,181
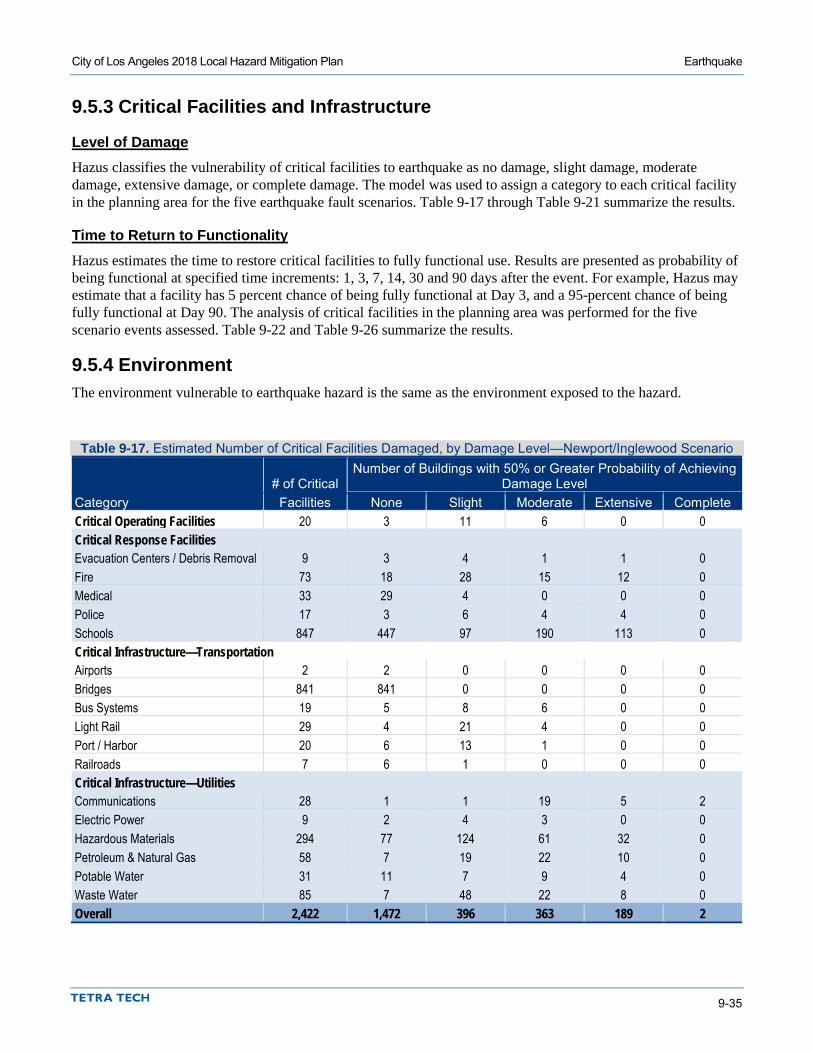
City of Los Angeles 2018 Local Hazard Mitigation Plan Earthquake
9-35
9.5.3 Critical Facilities and Infrastructure
Level of Damage Hazus classifies the vulnerability of critical facilities to earthquake as no damage, slight damage, moderate damage, extensive damage, or complete damage. The model was used to assign a category to each critical facility in the planning area for the five earthquake fault scenarios. Table 9-17 through Table 9-21 summarize the results.
Time to Return to Functionality Hazus estimates the time to restore critical facilities to fully functional use. Results are presented as probability of being functional at specified time increments: 1, 3, 7, 14, 30 and 90 days after the event. For example, Hazus may estimate that a facility has 5 percent chance of being fully functional at Day 3, and a 95-percent chance of being fully functional at Day 90. The analysis of critical facilities in the planning area was performed for the five scenario events assessed. Table 9-22 and Table 9-26 summarize the results.
9.5.4 Environment The environment vulnerable to earthquake hazard is the same as the environment exposed to the hazard.
Table 9-17. Estimated Number of Critical Facilities Damaged, by Damage Level—Newport/Inglewood Scenario
# of Critical Number of Buildings with 50% or Greater Probability of Achieving
Damage Level Category Facilities None Slight Moderate Extensive Complete Critical Operating Facilities 20 3 11 6 0 0 Critical Response Facilities Evacuation Centers / Debris Removal 9 3 4 1 1 0 Fire 73 18 28 15 12 0 Medical 33 29 4 0 0 0 Police 17 3 6 4 4 0 Schools 847 447 97 190 113 0 Critical Infrastructure—Transportation Airports 2 2 0 0 0 0 Bridges 841 841 0 0 0 0 Bus Systems 19 5 8 6 0 0 Light Rail 29 4 21 4 0 0 Port / Harbor 20 6 13 1 0 0 Railroads 7 6 1 0 0 0 Critical Infrastructure—Utilities Communications 28 1 1 19 5 2 Electric Power 9 2 4 3 0 0 Hazardous Materials 294 77 124 61 32 0 Petroleum & Natural Gas 58 7 19 22 10 0 Potable Water 31 11 7 9 4 0 Waste Water 85 7 48 22 8 0 Overall 2,422 1,472 396 363 189 2
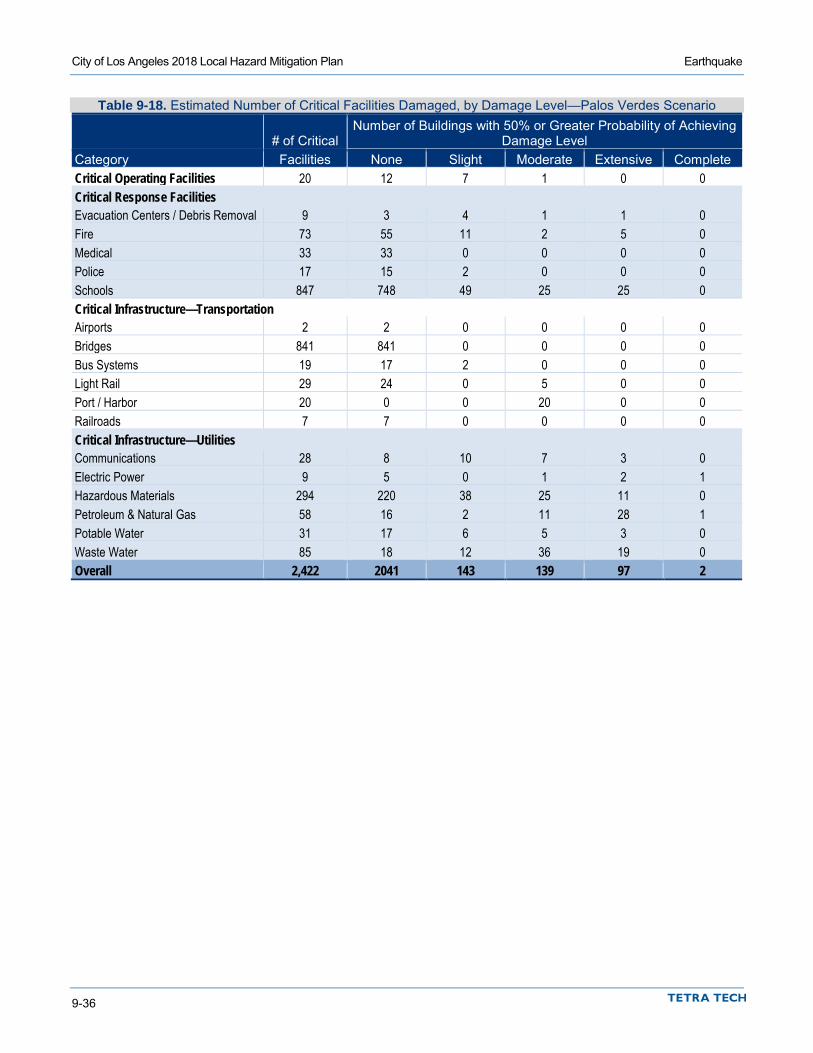
City of Los Angeles 2018 Local Hazard Mitigation Plan Earthquake
9-36
Table 9-18. Estimated Number of Critical Facilities Damaged, by Damage Level—Palos Verdes Scenario
# of Critical Number of Buildings with 50% or Greater Probability of Achieving
Damage Level Category Facilities None Slight Moderate Extensive Complete Critical Operating Facilities 20 12 7 1 0 0 Critical Response Facilities Evacuation Centers / Debris Removal 9 3 4 1 1 0 Fire 73 55 11 2 5 0 Medical 33 33 0 0 0 0 Police 17 15 2 0 0 0 Schools 847 748 49 25 25 0 Critical Infrastructure—Transportation Airports 2 2 0 0 0 0 Bridges 841 841 0 0 0 0 Bus Systems 19 17 2 0 0 0 Light Rail 29 24 0 5 0 0 Port / Harbor 20 0 0 20 0 0 Railroads 7 7 0 0 0 0 Critical Infrastructure—Utilities Communications 28 8 10 7 3 0 Electric Power 9 5 0 1 2 1 Hazardous Materials 294 220 38 25 11 0 Petroleum & Natural Gas 58 16 2 11 28 1 Potable Water 31 17 6 5 3 0 Waste Water 85 18 12 36 19 0 Overall 2,422 2041 143 139 97 2
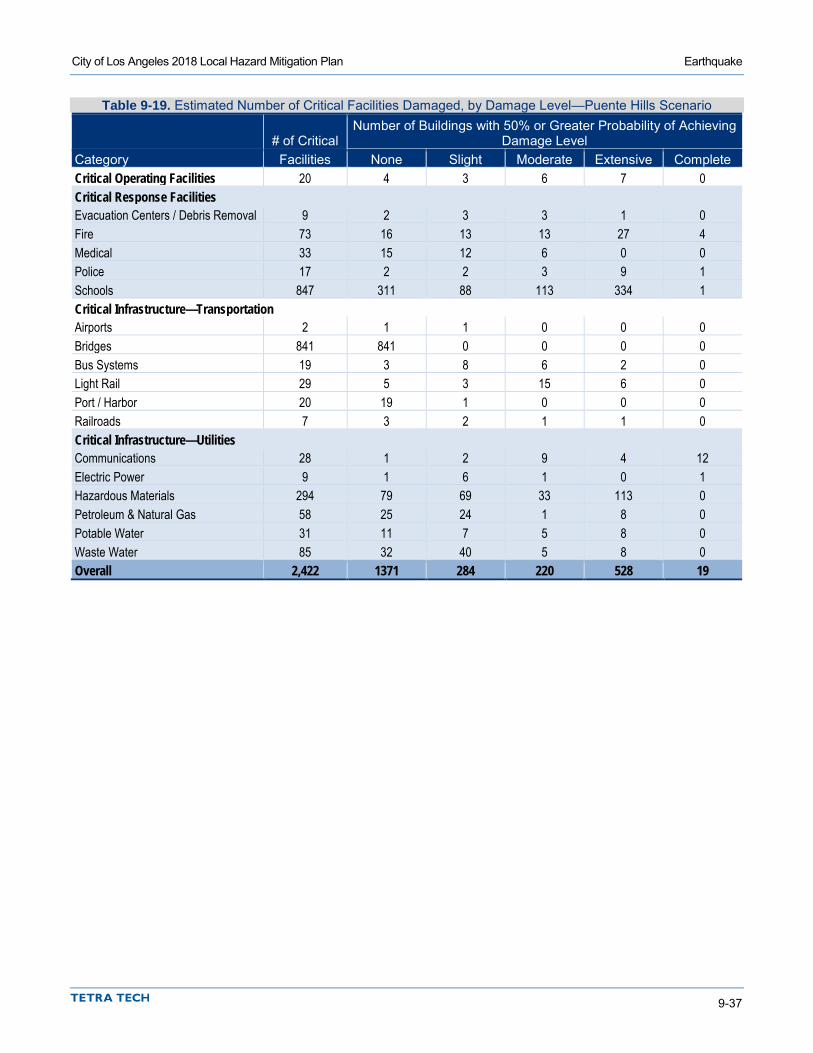
City of Los Angeles 2018 Local Hazard Mitigation Plan Earthquake
9-37
Table 9-19. Estimated Number of Critical Facilities Damaged, by Damage Level—Puente Hills Scenario
# of Critical Number of Buildings with 50% or Greater Probability of Achieving
Damage Level Category Facilities None Slight Moderate Extensive Complete Critical Operating Facilities 20 4 3 6 7 0 Critical Response Facilities Evacuation Centers / Debris Removal 9 2 3 3 1 0 Fire 73 16 13 13 27 4 Medical 33 15 12 6 0 0 Police 17 2 2 3 9 1 Schools 847 311 88 113 334 1 Critical Infrastructure—Transportation Airports 2 1 1 0 0 0 Bridges 841 841 0 0 0 0 Bus Systems 19 3 8 6 2 0 Light Rail 29 5 3 15 6 0 Port / Harbor 20 19 1 0 0 0 Railroads 7 3 2 1 1 0 Critical Infrastructure—Utilities Communications 28 1 2 9 4 12 Electric Power 9 1 6 1 0 1 Hazardous Materials 294 79 69 33 113 0 Petroleum & Natural Gas 58 25 24 1 8 0 Potable Water 31 11 7 5 8 0 Waste Water 85 32 40 5 8 0 Overall 2,422 1371 284 220 528 19

City of Los Angeles 2018 Local Hazard Mitigation Plan Earthquake
9-38
Table 9-20. Estimated Number of Critical Facilities Damaged, by Damage Level—San Andreas Scenario
# of Critical Number of Buildings with 50% or Greater Probability of Achieving
Damage Level Category Facilities None Slight Moderate Extensive Complete Critical Operating Facilities 20 6 6 7 1 0 Critical Response Facilities Evacuation Centers / Debris Removal 9 4 1 2 2 0 Fire 73 22 14 23 5 9 Medical 33 33 0 0 0 0 Police 17 2 3 8 3 1 Schools 847 363 142 166 153 23 Critical Infrastructure—Transportation Airports 2 1 1 0 0 0 Bridges 841 841 0 0 0 0 Bus Systems 19 1 8 8 2 0 Light Rail 29 8 9 12 0 0 Port / Harbor 20 19 1 0 0 0 Railroads 7 0 4 2 1 0 Critical Infrastructure—Utilities Communications 28 3 1 2 20 2 Electric Power 9 1 3 1 3 1 Hazardous Materials 294 1 2 86 174 31 Petroleum & Natural Gas 58 37 11 6 3 1 Potable Water 31 14 3 9 3 2 Waste Water 85 57 10 15 3 0 Overall 2,422 1413 219 347 373 70

City of Los Angeles 2018 Local Hazard Mitigation Plan Earthquake
9-39
Table 9-21. Estimated Number of Critical Facilities Damaged, by Damage Level—Santa Monica Scenario
# of Critical Number of Buildings with 50% or Greater Probability of Achieving
Damage Level Category Facilities None Slight Moderate Extensive Complete Critical Operating Facilities 20 4 5 11 0 0 Critical Response Facilities Evacuation Centers / Debris Removal 9 3 3 3 0 0 Fire 73 10 22 13 28 0 Medical 33 19 14 0 0 0 Police 17 1 5 6 5 0 Schools 847 257 205 209 176 0 Critical Infrastructure—Transportation Airports 2 0 1 1 0 0 Bridges 841 841 0 0 0 0 Bus Systems 19 4 9 6 0 0 Light Rail 29 8 13 8 0 0 Port / Harbor 20 20 0 0 0 0 Railroads 7 3 4 0 0 0 Critical Infrastructure—Utilities Communications 28 4 0 15 6 3 Electric Power 9 3 1 3 2 0 Hazardous Materials 294 68 113 69 44 0 Petroleum & Natural Gas 58 32 11 11 4 0 Potable Water 31 11 7 3 9 1 Waste Water 85 21 15 15 28 6 Overall 2,422 1309 428 373 302 10
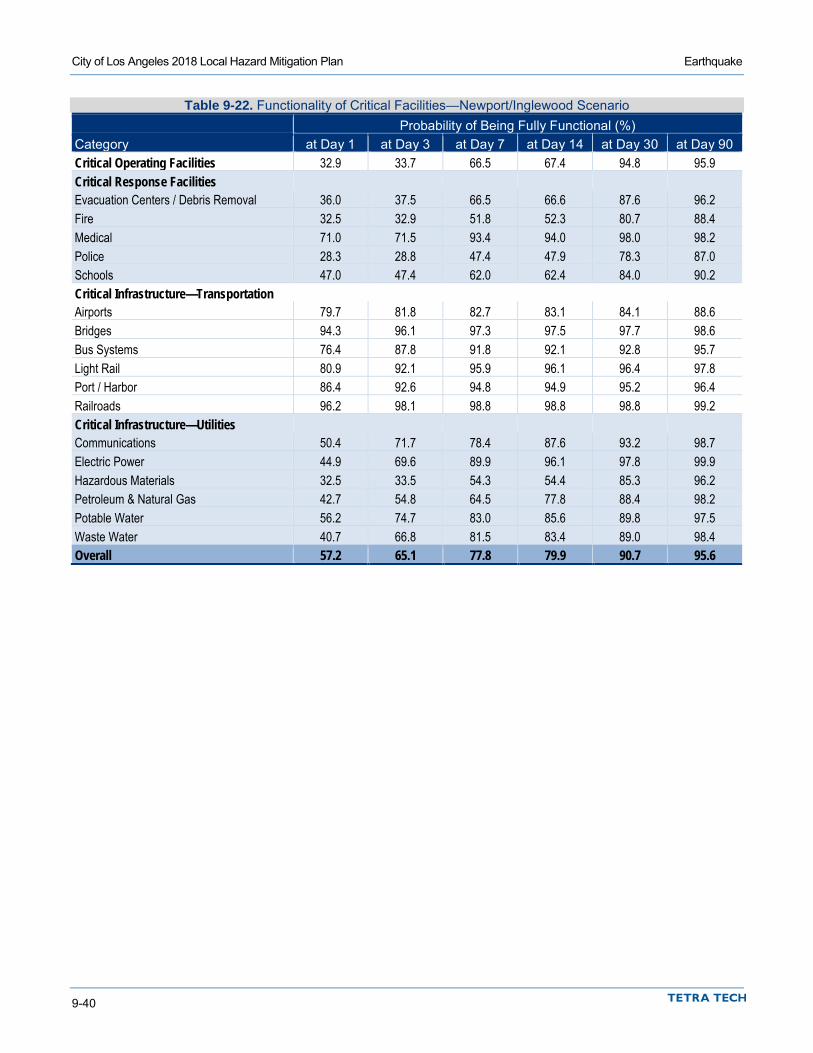
City of Los Angeles 2018 Local Hazard Mitigation Plan Earthquake
9-40
Table 9-22. Functionality of Critical Facilities—Newport/Inglewood Scenario
Probability of Being Fully Functional (%) Category at Day 1 at Day 3 at Day 7 at Day 14 at Day 30 at Day 90 Critical Operating Facilities 32.9 33.7 66.5 67.4 94.8 95.9 Critical Response Facilities Evacuation Centers / Debris Removal 36.0 37.5 66.5 66.6 87.6 96.2 Fire 32.5 32.9 51.8 52.3 80.7 88.4 Medical 71.0 71.5 93.4 94.0 98.0 98.2 Police 28.3 28.8 47.4 47.9 78.3 87.0 Schools 47.0 47.4 62.0 62.4 84.0 90.2 Critical Infrastructure—Transportation Airports 79.7 81.8 82.7 83.1 84.1 88.6 Bridges 94.3 96.1 97.3 97.5 97.7 98.6 Bus Systems 76.4 87.8 91.8 92.1 92.8 95.7 Light Rail 80.9 92.1 95.9 96.1 96.4 97.8 Port / Harbor 86.4 92.6 94.8 94.9 95.2 96.4 Railroads 96.2 98.1 98.8 98.8 98.8 99.2 Critical Infrastructure—Utilities Communications 50.4 71.7 78.4 87.6 93.2 98.7 Electric Power 44.9 69.6 89.9 96.1 97.8 99.9 Hazardous Materials 32.5 33.5 54.3 54.4 85.3 96.2 Petroleum & Natural Gas 42.7 54.8 64.5 77.8 88.4 98.2 Potable Water 56.2 74.7 83.0 85.6 89.8 97.5 Waste Water 40.7 66.8 81.5 83.4 89.0 98.4 Overall 57.2 65.1 77.8 79.9 90.7 95.6

City of Los Angeles 2018 Local Hazard Mitigation Plan Earthquake
9-41
Table 9-23. Functionality of Critical Facilities—Palos Verdes Scenario
Probability of Being Fully Functional (%) Category at Day 1 at Day 3 at Day 7 at Day 14 at Day 30 at Day 90 Critical Operating Facilities 58.5 59.1 85.6 86.3 97.0 98.1 Critical Response Facilities Evacuation Centers / Debris Removal 65.6 66.7 87.7 87.8 97.7 98.7 Fire 61.9 62.3 79.4 79.9 93.2 95.6 Medical 90.9 91.1 98.8 98.9 99.2 99.2 Police 68.4 68.8 87.2 87.7 98.5 98.9 Schools 76.5 76.8 88.0 88.3 95.9 97.3 Critical Infrastructure—Transportation Airports 88.4 89.0 89.3 89.5 89.9 92.1 Bridges 98.8 99.3 99.5 99.6 99.6 99.7 Bus Systems 96.2 97.6 98.2 98.2 98.3 98.7 Light Rail 89.2 94.7 96.5 96.7 96.9 98.1 Port / Harbor 45.4 73.1 82.6 83.2 84.7 91.0 Railroads 99.4 99.7 99.8 99.8 99.8 99.8 Critical Infrastructure—Utilities Communications 71.5 87.4 90.7 94.9 97.4 99.5 Electric Power 50.8 64.5 79.5 89.4 94.0 99.9 Hazardous Materials 57.5 58.5 78.4 78.4 95.0 98.7 Petroleum & Natural Gas 39.0 46.7 54.4 65.5 77.5 95.7 Potable Water 68.7 82.0 88.1 90.3 93.6 98.3 Waste Water 31.5 55.4 71.9 75.0 84.4 97.8 Overall 69.9 76.2 86.4 88.3 94.0 97.6

City of Los Angeles 2018 Local Hazard Mitigation Plan Earthquake
9-42
Table 9-24. Functionality of Critical Facilities—Puente Hills Scenario
Probability of Being Fully Functional (%) Category at Day 1 at Day 3 at Day 7 at Day 14 at Day 30 at Day 90 Critical Operating Facilities 21.5 21.8 34.5 34.9 67.6 79.4 Critical Response Facilities Evacuation Centers / Debris Removal 22.4 23.7 50.5 50.6 83.7 94.2 Fire 22.4 22.7 35.2 35.5 56.6 69.3 Medical 42.2 42.9 74.3 75.1 95.6 96.2 Police 13.4 13.6 22.2 22.4 40.6 57.4 Schools 33.5 33.8 44.9 45.2 64.3 76.5 Critical Infrastructure—Transportation Airports 75.8 81.1 83.0 83.3 84.2 88.3 Bridges 86.6 89.3 90.8 91.1 91.5 94.0 Bus Systems 62.8 78.5 84.0 84.6 86.3 93.2 Light Rail 47.1 67.6 74.9 76.0 78.8 90.5 Port / Harbor 98.8 99.4 99.6 99.6 99.6 99.7 Railroads 76.5 84.6 87.5 87.9 89.1 93.9 Critical Infrastructure—Utilities Communications 37.9 51.6 59.1 70.4 79.7 96.4 Electric Power 48.8 72.6 89.1 93.8 96.5 99.9 Hazardous Materials 26.7 27.5 42.4 42.5 63.3 84.6 Petroleum & Natural Gas 64.1 75.2 80.3 86.7 91.8 97.8 Potable Water 48.9 64.6 73.6 76.8 81.7 92.6 Waste Water 54.2 75.1 84.8 86.1 90.3 98.6 Overall 49.1 57.0 67.3 69.0 80.1 89.0
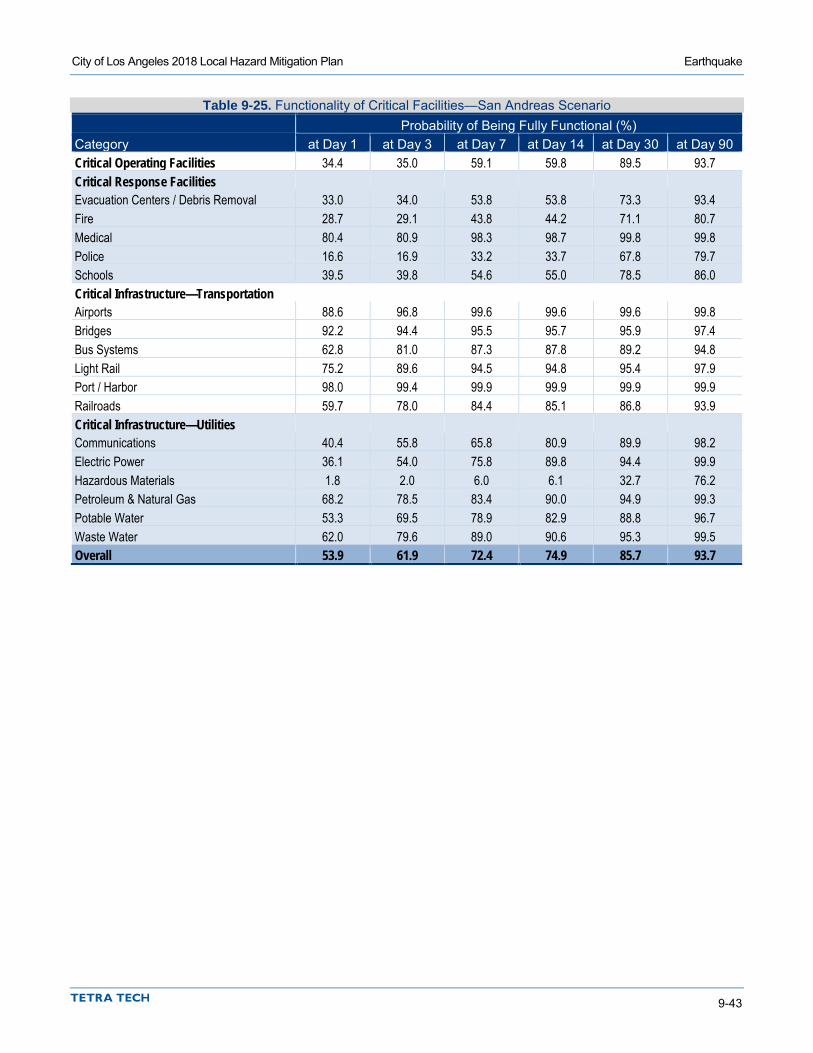
City of Los Angeles 2018 Local Hazard Mitigation Plan Earthquake
9-43
Table 9-25. Functionality of Critical Facilities—San Andreas Scenario
Probability of Being Fully Functional (%) Category at Day 1 at Day 3 at Day 7 at Day 14 at Day 30 at Day 90 Critical Operating Facilities 34.4 35.0 59.1 59.8 89.5 93.7 Critical Response Facilities Evacuation Centers / Debris Removal 33.0 34.0 53.8 53.8 73.3 93.4 Fire 28.7 29.1 43.8 44.2 71.1 80.7 Medical 80.4 80.9 98.3 98.7 99.8 99.8 Police 16.6 16.9 33.2 33.7 67.8 79.7 Schools 39.5 39.8 54.6 55.0 78.5 86.0 Critical Infrastructure—Transportation Airports 88.6 96.8 99.6 99.6 99.6 99.8 Bridges 92.2 94.4 95.5 95.7 95.9 97.4 Bus Systems 62.8 81.0 87.3 87.8 89.2 94.8 Light Rail 75.2 89.6 94.5 94.8 95.4 97.9 Port / Harbor 98.0 99.4 99.9 99.9 99.9 99.9 Railroads 59.7 78.0 84.4 85.1 86.8 93.9 Critical Infrastructure—Utilities Communications 40.4 55.8 65.8 80.9 89.9 98.2 Electric Power 36.1 54.0 75.8 89.8 94.4 99.9 Hazardous Materials 1.8 2.0 6.0 6.1 32.7 76.2 Petroleum & Natural Gas 68.2 78.5 83.4 90.0 94.9 99.3 Potable Water 53.3 69.5 78.9 82.9 88.8 96.7 Waste Water 62.0 79.6 89.0 90.6 95.3 99.5 Overall 53.9 61.9 72.4 74.9 85.7 93.7

City of Los Angeles 2018 Local Hazard Mitigation Plan Earthquake
9-44
Table 9-26. Functionality of Critical Facilities—Santa Monica Scenario
Probability of Being Fully Functional (%) Category at Day 1 at Day 3 at Day 7 at Day 14 at Day 30 at Day 90 Critical Operating Facilities 23.7 24.3 50.8 51.5 89.7 93.0 Critical Response Facilities Evacuation Centers / Debris Removal 34.2 35.2 55.8 55.9 87.4 96.5 Fire 21.8 22.1 36.2 36.6 63.6 76.4 Medical 52.7 53.6 88.2 89.1 96.6 96.8 Police 16.3 16.7 33.0 33.4 67.6 79.7 Schools 33.6 34.0 49.6 50.0 76.4 85.2 Critical Infrastructure—Transportation Airports 54.6 69.8 75.1 75.6 76.7 82.1 Bridges 92.2 93.9 94.7 94.8 95.0 96.3 Bus Systems 70.6 84.9 89.9 90.2 91.1 94.8 Light Rail 75.7 89.8 94.6 94.8 95.4 97.7 Port / Harbor 99.9 99.9 99.9 99.9 99.9 99.9 Railroads 84.0 94.2 97.6 97.6 97.8 98.4 Critical Infrastructure—Utilities Communications 43.8 61.8 70.2 82.6 90.2 98.2 Electric Power 48.2 67.5 87.3 96.2 98.0 99.9 Hazardous Materials 31.8 32.8 51.7 51.8 82.9 96.0 Petroleum & Natural Gas 70.8 79.2 84.0 90.2 95.2 99.3 Potable Water 51.7 68.3 76.7 80.9 87.9 96.6 Waste Water 37.1 53.8 66.4 70.1 81.9 97.7 Overall 52.4 60.1 72.3 74.5 87.4 93.6
9.6 FUTURE TRENDS IN DEVELOPMENT The City of Los Angeles will strictly enforce all seismic building codes and design standards to prevent loss of life and property from earthquakes. Public education, cooperation with the development community, and individual preparedness are essential.
The City has a General Plan with policies directing land use and dealing with issues of geologic and seismic safety. This plan provides the capability to protect future development from the impacts of earthquakes. Deficiencies identified by development reviews can be identified as mitigation actions to increase the capability to deal with future trends in development.
Since all of the planning area is located within earthquake hazard zones, all future development will, to some extent, be exposed to the earthquake hazard.
9.7 SCENARIO With the abundance of fault exposure in southern California, the potential scenarios for earthquake activity are many. An earthquake does not have to occur within the planning area to have a significant impact on the people, property and economy of the planning area.
Any seismic activity of 6.0 or greater on faults within the planning area would have significant impacts throughout the planning area. Potential warning systems could give approximately 40 seconds notice that a major

City of Los Angeles 2018 Local Hazard Mitigation Plan Earthquake
9-45
earthquake is about to occur. This would not provide adequate time for preparation. Earthquakes of this magnitude or higher would lead to massive structural failure of property on NEHRP C, D, E, and F soils. Levees and revetments built on these poor soils would likely fail, representing a loss of critical infrastructure. These events could cause secondary impacts, including landslides and mudslides that would further damage structures. River valley hydraulic-fill sediment areas are also vulnerable to slope failure, often as a result of loss of cohesion in clay-rich soils. Soil liquefaction would occur in water-saturated sands, silts or gravelly soils.
9.8 ISSUES Important issues associated with an earthquake include the following:
• More than 74 percent of the planning area’s building stock was built prior to 1975, when seismic provisions became uniformly applied through building code applications.
• Based on the modeling of critical facility performance performed for this plan, a high number of facilities in the planning area are expected to have complete or extensive damage from scenario events. These facilities are prime targets for structural retrofits.
• Critical facility owner should be encouraged to create or enhance continuity of operations plans using the information on risk and vulnerability contained in this plan.
• Geotechnical standards should be established that take into account the probable impacts from earthquakes in the design and construction of new or enhanced facilities.
• There are a large number of earthen dams within the planning area. Dam failure warning and evacuation plans and procedures should be reviewed and updated to reflect the dams’ risk potential associated with earthquake activity in the region.
• Earthquakes could trigger other natural hazard events such as dam failures and landslides, which could severely impact the planning area.
• A worst-case scenario would be the occurrence of a large seismic event during a flood or high-water event. Levee failures would happen at multiple locations, increasing the impacts of the individual events.