CITY OF PITTSFIELD · Deanna Ruffer, Director Department of Community Development, City of...
68
Prepared for: City of Pittsfield Department of Community Development CITY OF PITTSFIELD August 2009 Housing Needs Analysis & Development Recommendations Westside and Morningside Neighborhoods Morningside Westside
Transcript of CITY OF PITTSFIELD · Deanna Ruffer, Director Department of Community Development, City of...

Prepared for:
City of PittsfieldDepartment of Community Development
CITY OF PITTSFIELD
August 2009
Housing Needs Analysis & Development RecommendationsWestside and Morningside Neighborhoods
Morningside
Westside
City of Pittsfield
1
HOUSING NEEDS ANALYSIS & DEVELOPMENT RECOMMENDATIONS
Contributors James M. Ruberto, Mayor, City of Pittsfield Deanna Ruffer, Director Department of Community Development, City of Pittsfield Bonnie Galant, Community Development/ Housing Program Manager, City of Pittsfield Justine Dodds, Housing Specialist, City of Pittsfield Brad Gordon, Berkshire County Housing Authority Elton Ogden, Berkshire Community Development Corporation Donald Atwater, Berkshire Community Action Council Mark Maloy, Berkshire County Regional Planning Commission City of Pittsfield Code Enforcement Team Wendy B. Goodwin, Rental Housing Association of Berkshire County Meeting Westside Steering Committee Morningside Steering Committee Consultant Team Drew M. Leff, Principal, GLC Development Resources Kerry L. Dietz, AIA, LEED AP President, Dietz & Company Architects, Inc. Lynne Wallace, Vice President, Dietz & Company Architects, Inc. Robert Salisbury, Director, Bonz & Company Date August 2009
City of Pittsfield
2
HOUSING NEEDS ANALYSIS & DEVELOPMENT RECOMMENDATIONS
Table of Contents EXECUTIVE SUMMARY……………………………………………………….……….3 1. BACKGROUND AND METHODOLOGY.…..…….…………………...……………...8 2. POPULATION, EMPLOYMENT AND HOUSING TRENDS....…………….……………13 3. HOUSING MARKET ANALYSIS…………............................………………..………..31 4. HOUSING NEEDS AND OPPORTUNITIES.............................…………………………36 5. DEVELOPMENT RECOMMENDATIONS..….............................………………………..43 APPENDICES……………………………...…………………….…..…...………….49

City of Pittsfield
3
HOUSING NEEDS ANALYSIS & DEVELOPMENT RECOMMENDATIONS
Executive Summary The Westside and Morningside neighborhoods flank Pittsfield’s city center and their revitalization is critical to the future of the city and its downtown in particular. These two neighborhoods are compact and walkable with connections to a strengthening downtown core. With the right investments, they could grow into safe, mixed-income urban neighborhoods. For now however, there are significant challenges to overcome. The purpose of this study is to identify the housing needs of the Westside and Morningside neighborhoods. We define needs in relation to established criteria: in this case, we have used the defined goals of the City and the condition of the balance of the City as the standard and reviewed how these two neighborhoods compare. To do this, we have reviewed prior studies, stakeholder meeting notes as well as created a demographic and housing market analysis to establish a profile of the neighborhood’s current and projected condition. A second component of this study will be an Action Plan, which provides a scope of work and an order of magnitude budget for the selected initiatives and recommended development projects. The prior studies and stakeholder meetings suggest that these two neighborhoods are challenged by declining population and lower incomes compared with the balance of the City. These facts are balanced against improvement in the educational attainment of the residents and median household income. The studies indicate that these two neighborhoods contain the majority of the City’s affordable rental housing and have the lowest prices for existing homes in the market. The neighborhoods have also struggled with a large number of unoccupied and distressed housing units, with problems ranging from abandonment to foreclosure. The City and community stakeholders have ambitions for these neighborhoods, however. They perceive there to be a need for additional homeownership, reduction of blight, efforts to build on the recent successes of code enforcement; and provide a greater physical

City of Pittsfield
4
HOUSING NEEDS ANALYSIS & DEVELOPMENT RECOMMENDATIONS
connection to downtown. They also perceive the need for better affordable housing through rehabilitation and, where appropriate, new construction. Most of all they see a need for thoughtful but significant physical action in the neighborhood to change attitudes and enhance the pride residents feel for their community. Demographic and housing market data supports the trends the community identified and projects that while not likely to change, the worst appears to be over. From Pittsfield’s peak population of approximately 58,000 in the 1960s and 1970s, the population has dropped to 44,000 today, a loss of almost 25%. Pittsfield is still losing population, although this trend is slowing. Much of this population loss has taken place in the Westside neighborhood, which lost over 10% of its population from 1990-2008. Employment trends indicate that while no significant growth is projected and the City will suffer the loss of jobs in the current recession in the same fashion as the State, the City and these neighborhoods’ employment has stabilized to match the general conditions in the State. Westside’s and Morningside’s residential market together make up the most affordable level of Pittsfield’s private housing market, and these neighborhoods’ housing stock is significantly older and in poorer condition than that of other City neighborhoods. These two sections of the City also have unusually high rates of unoccupied housing, 16% and 12%, respectively. The market rents in the area are at or below both professionally managed developments in the City and Section 8 Fair Market rents. Housing prices for a single-family or two-family in the neighborhood are $110,000 35% lower than the $170,000 city-wide median price. Houses stay on the market for 145 days before a sale which is generally in line with the City as a whole. The combination of demographic and market factors suggest that a balance among population, employment and housing has been reached City-wide, but that balance leaves a number of units in these neighborhoods in distress or unoccupied. This suggests that there is too much housing in the market. The excess housing is either uneconomic to rehabilitate - as declining population has caused an over-supply of housing and thus declining rents - or it may not match the needs of either the local market households or residents needing affordable housing. The reasons for this include the full spectrum of causes from the narrow margin between market rents and Section 8 Fair Market Rents, the size and configuration of units, and the age and relatively poor condition of the housing stock in the neighborhoods. As long as there is a significant number of unoccupied existing housing units that could be occupied or rehabilitated, developers are unlikely to undertake new, unsubsidized market-driven housing redevelopment. Further, existing owners are less likely to improve their units for new tenants (affordable or otherwise) or renovate their homes for sale. Housing Needs To respond to the stakeholder vision and demographic and market analysis, GLC Development/Dietz & Company Architects (GLC / Dietz & Co) believe that in general, the City must act to “tighten” the market for housing in these neighborhoods and remove

City of Pittsfield
5
HOUSING NEEDS ANALYSIS & DEVELOPMENT RECOMMENDATIONS
abandoned and blighted properties that threaten the well-being of the surrounding properties. This approach suggests the following housing needs, which represent both necessary policies to support housing in these neighborhoods and specific physical housing and related needs. Policy Needs
• Reduce the number of distressed residential units (properties in foreclosure, abandoned or vacant housing) in the following ways:
o Continue to require improvement of code non-compliant properties and
acquire and demolish those which do not improve; o Rehabilitate marginal housing with the capacity to serve the market and
affordable (family and elderly) demand; o Assemble blighted vacant property for future development, further
tightening the market and encouraging development interests to rehabilitate and develop new units.
• Create new amenities to renew interest in the Westside and Morningside
neighborhoods by targeting young people interested in a less expensive lifestyle who would be attracted to an urban location in a Berkshire setting, as well as older people interested in a second home or retirement home in an improving community.
• Increase the rate of homeownership in the Westside and Morningside
neighborhoods. Physical Housing Needs
• Rehabilitated and/or new construction homes which appeal to younger households, retiree, and empty nester households who are currently buying property or renting in other parts of the City, specifically:
o “Starter homes” or smaller scale homeownership opportunities for first time
homebuyers or those with the need for smaller homes; o Market or mixed-market and affordable rental development involving
existing buildings.
• Larger bedroom (2-3 BR) rental units which are code compliant o First, through rehabilitation of existing and distressed properties; o Second, and where possible, through subsidized new construction
• Infrastructure and open space development including street improvements and
beautification and open space development to improve perception of the neighborhood as a nicer place to live.

City of Pittsfield
6
HOUSING NEEDS ANALYSIS & DEVELOPMENT RECOMMENDATIONS
Housing Opportunities The same demographic and market analysis which indicates Westside and Morningside’s housing needs also offers opportunities for the City and developers to respond to these trends. This analysis recommends opportunities for redevelopment of two varieties: Policy Initiatives which will affect the market in the neighborhoods in general and specific Development Recommendations which could result in specific development or infrastructure projects. First however, it is important to identify what is working well with the current approach in these two neighborhoods.
• The City’s code enforcement activities have made a difference in the quality of housing available in the two neighborhoods with more than 1,800 housing units brought into compliance with housing regulations. The coordinated approach to this program has enhanced the effectiveness and long term value of the program.
• The development of new affordable rental housing units in the Westside, the first new rental housing to be constructed by a private developer in the city in more than 30 years, has expanded housing choices available in the city’s urban center and provides positive pressure on other rental property owners to improve the quality of other rental property.
• The City’s enactment of housing programs like 40R and the Urban Housing TIF program provide some of the needed incentives to existing property owners and potential developers to invest in rehabilitating or building new housing units in the city’s urban center.
Policy Initiatives:
• Code Enforcement Team: continue to evolve the organizational structure and deployment of the team to build on successes; and continue aggressive action against vacant and dilapidated property.
• Weatherization and Heating Improvement Program: Work with small landlords to bring substandard housing into better condition with available funds, existing and new;
• Vacant property / land banking: create interim strategy for vacant property in the neighborhoods, including privately owner parcels where structures have been demolished by city action. Further, identify priority development locations where new mixed-income housing could be provided and seek funding for acquisition, land banking and demolition including exploring the potential of establishing a Land Bank.
• Targeted Homebuyer Assistance: Expand programs to include and emphasize employee housing programs, 1st time homebuyer lending, Individual Development

City of Pittsfield
7
HOUSING NEEDS ANALYSIS & DEVELOPMENT RECOMMENDATIONS
Accounts; acquisition-rehabilitation lending; including exploring potential to revive the Good Samaritan Program.
Development Recommendations
• Focus Areas: We recommend identifying two “Focus Areas” that represent areas which have a disproportionately negative impact on the neighborhoods. We recommend turning distressed housing and vacant land into consolidated open space and rehabilitated housing that better meets the market.
o On the Westside: Linden Street to the north, Columbus to the South; Dewey
(both sides) to the east and John Street to the west. o On Morningside: Orchard to the North; Railroad to the South; First Street to
the East; Second Street to the West.
• Christopher Arms Public Housing Improvement: This property represents a specific opportunity to make an improvement of scale in the Westside neighborhood. We recommend exploring use of 4% Tax Credit Program for State public housing redevelopment at Christopher Arms (John Street, Westside).
City of Pittsfield
8
HOUSING NEEDS ANALYSIS & DEVELOPMENT RECOMMENDATIONS
1 Background and Methodology We prepared this report by reviewing the existing plans, meeting with stakeholders and the City, and then looking at the data available on the neighborhood’s demographics and housing market. This section provides an overview of the prior plans and studies and identifies how we have used demographic and market data to analyze the Westside and Morningside neighborhoods’ Housing Needs. Review of Prior Studies As background to this analysis, the City has a number of strong planning efforts that preceded this study, including 2005 and 2006-2010 Consolidated Plans, the 2005 Sustainable Design Assessment Team (SDAT) planning completed through the American Institute of Architects, as well as smaller Action Plans for both neighborhoods from the early 2000s, and a number of analyses specially focused on foreclosures, the needs of homeless populations and other households with special needs. We used these plans to create a baseline understanding of certain key data and to identify current direction of the City’s planning efforts in the Westside and Morningside

City of Pittsfield
9
HOUSING NEEDS ANALYSIS & DEVELOPMENT RECOMMENDATIONS
neighborhoods. While this is not a complete listing, the following are several key conclusions of some of the reports which we believe serve as good background for the study. In the SDAT report of 2007, Pittsfield residents saw improvement of Westside and Morningside neighborhoods as essential for Downtown success. In the report, it was suggested that Pittsfield “…consider Westside, Morningside and Downtown as one great place.” In fact, they suggested the redefinition of Downtown as including the West Branch of the Housatonic River and Silver Lake and all the residents in between. Additionally, they suggested that growth be directed to Downtown and the existing neighborhoods, and that the policy should be to redevelop first by capitalizing and focusing on existing infrastructure. Additionally, the Master Plan of 2009 suggests a number of goals and strategies that are consistent with the integration of Westside and Morningside into “one great place.” The Master Plan goals relative to housing quality and affordability include:
• Creating and preserving neighborhoods that attract new people to live in Pittsfield, as well as retaining current residents;
• Providing a diversity of affordable workforce housing for current and future residents;
• Providing a diversity of housing choices to attract people in all stages of life, and • Raising the quality of the existing housing stock.
The Master Plan also suggested the following strategies for housing quality and affordability:
• Increasing homeownership rates and rehabilitation of existing stock with the Home Improvement Program run through DCD
• Re-establishing the local lending incentive program • Creating inclusionary zoning ordinances • Preparing neighborhood level plans • Developing neighborhood pattern book/design guidelines • Promoting walkability • Improving and broadening code enforcement – fines and penalties
What emerges from other planning studies, including the 2005 Westside and Morningside Action Plans and the 2005 Consolidated Plan, is a community that is continuing to shrink. This trend is even greater in the Westside neighborhood, which lost population at a 2% rate per year between 1990-2000, although the Morningside neighborhood grew 3% overall during this period. The composition of the population that lives in Pittsfield has also changed somewhat from 1990-2000; the population has grown younger and includes a larger portion of single-parent headed households. Pittsfield also continues to see the trend toward increasing median incomes: the increase per year between 1990 and 2000 was nearly 2%. While the households in these neighborhoods are gaining in median income, that median income still only represents approximately 50% of the median household income of the remainder of the City.
City of Pittsfield
10
HOUSING NEEDS ANALYSIS & DEVELOPMENT RECOMMENDATIONS
The planning studies also indicate that the Pittsfield housing market has a relatively old housing stock of primarily single-family and small (2-3 units) multi-family properties. This statement is particularly true of the Morningside and Westside neighborhoods where 45% of the housing was built before World War II. According to Pittsfield Housing Authority’s analysis, 65-75% of the units in these two neighborhoods are in need of major repair. Pittsfield and the Morningside and Westside neighborhoods in particular have a large percentage of unoccupied units which are close to 20% in the Westside. Units in Pittsfield have the lowest median prices among Berkshire cities and towns, and within the City, Westside and Morningside have the lowest sales prices and rents. Finally, the 2000 Local Initiatives Support Corporation (LISC) report indicates that before the current crisis, these neighborhoods had struggled with code compliance and tax title property for some time. These distressed housing units have hurt the new production of both market and affordable housing in the City. Discussions with Stakeholders GLC / D&Co staff has met with the following key city stakeholders over the past three months to understand their goals for the Westside and Morningside neighborhoods. The meetings included the following community members and groups:
• James M. Ruberto, Mayor, City of Pittsfield • Deanna Ruffer, Director Department of Community Development, City of Pittsfield • City of Pittsfield Code Enforcement Team • Brad Gordon, Berkshire County Housing Authority • Elton Ogden, Berkshire Community Development Corporation • Wendy Goodwin, Rental Housing Association of Berkshire County Meeting • Westside Steering Committee • Morningside Steering Committee
From these discussions, we have gleaned the following key goals for these neighborhoods. (We recommend using these goals as criteria in the analysis of potential needs and options in the Action Plan component of this engagement.)
• Support market rate or mixed-income redevelopment of existing property • Increase homeownership • Support Pittsfield’s arts, culture and recreation industry focus • Use “green” or sustainable development approaches • Emphasize rehabilitation and redevelopment over new construction • Reduce blight and vacancy • Connect with downtown redevelopment efforts • Be open to bold action on the future of these neighborhoods

City of Pittsfield
11
HOUSING NEEDS ANALYSIS & DEVELOPMENT RECOMMENDATIONS
Methodology Building on this information, we observed that many of the studies reviewed focus on housing for specific groups, such as elders or the homeless, or for the specific needs of the households eligible for affordable housing. To provide a different perspective, the consultant team focused on the Westside and Morningside neighborhoods in a market context: What demographic and housing trends may be causing the market to function in a way that creates the current conditions? To do this, GLC / D&Co took three steps which match the sections of this analysis:
• Reviewed the Population, Employment and Housing Trends • Prepared a Housing Market Analysis • Indentified Housing Needs and Opportunities which the team will use to identify
potential initiatives. We believe that the specific action steps needed to respond to these market conditions can be identified in the Action Plan section of this engagement which follows the completion of this Housing Needs Analysis. Defining the Neighborhoods For the purposes of the study, the two neighborhoods were defined as follows:
• Westside includes an area from Park, Beech and Turner Avenue on the North; College Drive and West Street to the South; North Street on the East; and Onota Street on the West. See Map 1.
• Morningside: Springside Avenue to the North; East Street to the South; Silver
Lake/Fourth Street/Kellogg Street/Woodlawn/Benedict Street to the East and North Street to the West. See Map 2.
For the purposes of the study, the Downtown area is captured in these two neighborhood market areas. Sources of Data GLC / D&Co used a private database which included American Community Survey data and other data to produce current-year and 5-year projections (STDB Online). This data source responds to the specific boundaries above to prepare its projections, which may be at slight variance from the City’s census data (for tracts 9006, 9001, 9002) as the boundaries do not always overlap. However, it does provide effective trending analysis for the various categories.

City of Pittsfield
12
HOUSING NEEDS ANALYSIS & DEVELOPMENT RECOMMENDATIONS
For the profile of key developments in the market, GLC/D&Co worked with Bonz & Company, who provides comprehensive real estate advisory, consulting, and valuation services, to visit properties in the City and to ascertain market rents and sales prices in the City.

City of Pittsfield
13
HOUSING NEEDS ANALYSIS & DEVELOPMENT RECOMMENDATIONS
2 Population, Employment and Housing Trends To identify the City’s housing needs and the specific needs of the Westside and Morningside neighborhoods, we reviewed the status of the forces that affect housing need: population, employment, the condition of housing and the housing market in these neighborhoods. Population As shown in the table below, Pittsfield’s population has contracted since 1990, with the heaviest losses taking place in Westside and Morningside, which includes Pittsfield’s downtown. This trend has slowed in the past eight years and is projected to be stabilizing from 2008-2013.

City of Pittsfield
14
HOUSING NEEDS ANALYSIS & DEVELOPMENT RECOMMENDATIONS
TABLE 1 – Population 1990 2000 2008 2013 90-00 00-08 08-13 Pittsfield 48,622 45,793 44,703 44,055 -6% -2% -1%Morningside 6,749 6,132 6,162 6,118 -9% 0% -1%Westside 4,154 3,753 3,658 3,601 -10% -3% -2%Balance of Pittsfield 37,719 35,908 34,883 34,336 -5% -3% -2% Westside/Morningside 10,903 9,885 9,820 9,719 -9% -1% -1% While the growth of the population of young people has grown at the same rate as the broader community, Westside and Morningside have larger numbers of young people than the balance of the City as percent of neighborhood population, especially in the categories of 25-34 and 34-44 years of age.
TABLE 2 – Youth 1990 2000 2008 90-08
Percent of Neighborhood
Pop. 25-34 years Morningside 883 1,141 1,014 15% 16%Westside 422 511 497 18% 14%Total WS/MS 1,305 1,652 1,511 16% 15%Balance of City 2,865 4,102 3,420 19% 8%35-44 years Morningside 604 992 936 55% 15%Westside 360 607 472 31% 13%Total WS/MS 964 1,599 1,408 46% 14%Balance of City 3,033 5,608 4,425 46% 10%
The elderly population of the neighborhoods is growing, although at a lower rate than the balance of the City, as shown in the table below. Elders are also a smaller percentage of the population within their neighborhoods than they are in the rest of the City.
TABLE 3 – Elderly 1990 2000 2008 90-08
Percent of Neighborhood
Pop. 65-74 years Morningside 261 346 299 15% 5%Westside 175 258 222 27% 6%Total WS/MS 436 604 521 19% 5%Balance of City 2,147 3,441 3,031 41% 9%75-84 years Morningside 229 297 252 10% 4%Westside 145 243 200 38% 5%Total WS/MS 374 540 452 21% 5%Balance of City 1,775 2,722 2,810 58% 8%
City of Pittsfield
15
HOUSING NEEDS ANALYSIS & DEVELOPMENT RECOMMENDATIONS
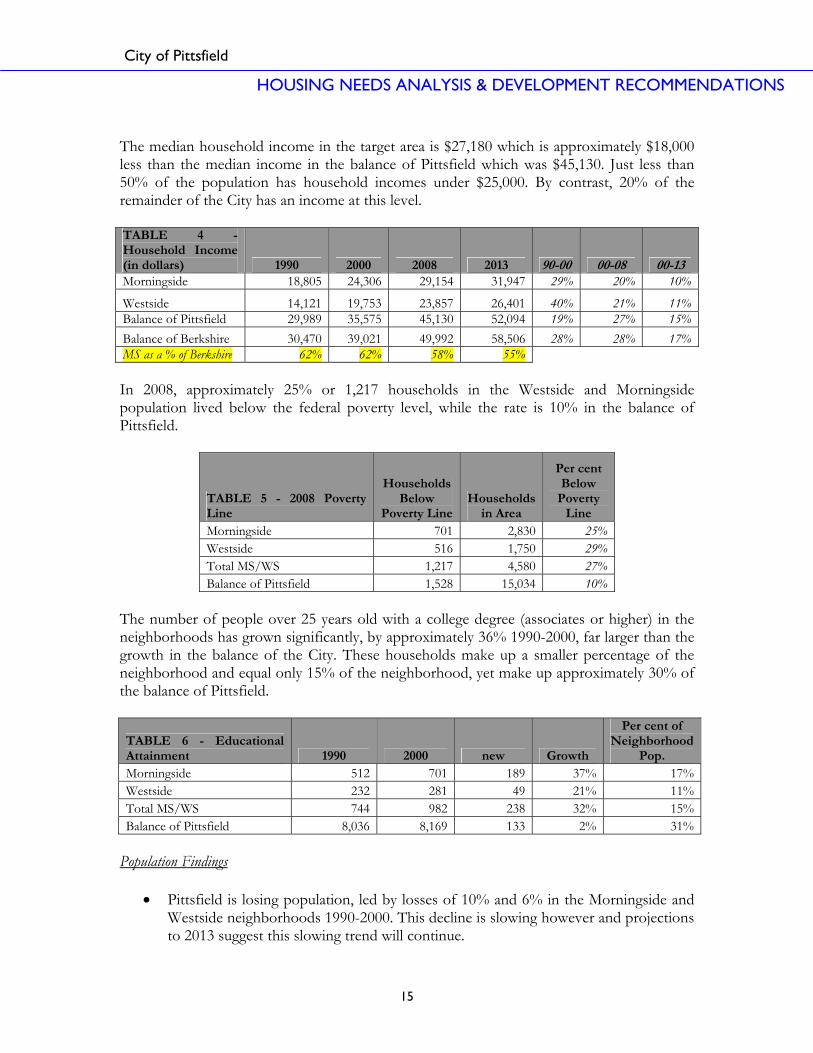
The median household income in the target area is $27,180 which is approximately $18,000 less than the median income in the balance of Pittsfield which was $45,130. Just less than 50% of the population has household incomes under $25,000. By contrast, 20% of the remainder of the City has an income at this level. TABLE 4 -Household Income (in dollars) 1990 2000 2008 2013 90-00 00-08 00-13 Morningside 18,805 24,306 29,154 31,947 29% 20% 10%
Westside 14,121 19,753 23,857 26,401 40% 21% 11%Balance of Pittsfield 29,989 35,575 45,130 52,094 19% 27% 15%Balance of Berkshire 30,470 39,021 49,992 58,506 28% 28% 17%MS as a % of Berkshire 62% 62% 58% 55% In 2008, approximately 25% or 1,217 households in the Westside and Morningside population lived below the federal poverty level, while the rate is 10% in the balance of Pittsfield.
TABLE 5 - 2008 Poverty Line
Households Below
Poverty LineHouseholds
in Area
Per cent Below
Poverty Line
Morningside 701 2,830 25% Westside 516 1,750 29% Total MS/WS 1,217 4,580 27% Balance of Pittsfield 1,528 15,034 10%
The number of people over 25 years old with a college degree (associates or higher) in the neighborhoods has grown significantly, by approximately 36% 1990-2000, far larger than the growth in the balance of the City. These households make up a smaller percentage of the neighborhood and equal only 15% of the neighborhood, yet make up approximately 30% of the balance of Pittsfield.
TABLE 6 - Educational Attainment 1990 2000 new Growth
Per cent of Neighborhood
Pop. Morningside 512 701 189 37% 17%Westside 232 281 49 21% 11%Total MS/WS 744 982 238 32% 15%Balance of Pittsfield 8,036 8,169 133 2% 31%
Population Findings
• Pittsfield is losing population, led by losses of 10% and 6% in the Morningside and Westside neighborhoods 1990-2000. This decline is slowing however and projections to 2013 suggest this slowing trend will continue.

City of Pittsfield
16
HOUSING NEEDS ANALYSIS & DEVELOPMENT RECOMMENDATIONS
• The Morningside and Westside population has a significantly higher percentage of young people than the rest of the City.
• The neighborhoods have a share of the aging population but represent a smaller percentage of these two downtown neighborhoods than the balance of the City.
• Morningside and Westside have seen growth in household income on pace with the rest of the City. However, the median incomes in these neighborhoods represent approximately 50% of the balance of the City and the Berkshires.
• Further, 27% of the households in these neighborhoods are living below the federal poverty line of approximately $15,000 per year.
• The neighborhoods have shown significant growth in households with college degrees over the 1990-2000 period, growing much faster than the balance of the City.
Employment Over 24 months, from April 2007 to April 2009, the Massachusetts labor force increased by 0.6% while the number of people employed decreased by 3.1%. In this same time period, the unemployment rate rose to 7.8% in April 2009, an 85.8% increase (the current economic climate greatly impacts 2009 numbers). Over a 12-month period, growth in the Massachusetts labor force increased at half the rate as over the previous two-year period. The unemployment rate over 12 months was 81.4%, a figure less than the 85.7% change over the 24-month period. The City of Pittsfield has seen its labor force decrease by 0.1% and the number of people working decrease by 3.7%. Pittsfield’s unemployment rate of 8.2% in April 2009 is 0.4% greater than the Massachusetts unemployment rate and represents a 74.5% change over both 12- and 24- month periods.

City of Pittsfield
17
HOUSING NEEDS ANALYSIS & DEVELOPMENT RECOMMENDATIONS
TABLE 7 - Employment Trends Massachusetts Apr-07 Apr-08 Apr-09 24 mo. % change 12 mo. % change Labor Force 3,384,450 3,396,403 3,405,812 0.6% 0.3%Employed 3,241,043 3,251,798 3,139,410 -3.1% -3.5%Unemployed 143,407 144,605 266,402 85.8% 84.2%Unemployment Rate 4.2 4.3 7.8 85.7% 81.4%
Pittsfield Metropolitan NECTA Division Apr-07 Apr-08 Apr-09 24 mo. % change 12 mo. % changeLabor Force 38,214 37,589 38,190 -0.1% 1.6%Employed 36,486 35,918 35,151 -3.7% -2.1%Unemployed 1,728 1,671 3,039 75.9% 81.9%Unemployment Rate 4.5 4.4 8 77.8% 81.8% Berkshire County Apr-07 Apr-08 Apr-09 24 mo. % change 12 mo. % changeLabor Force 71,048 70,379 71,408 0.5% 1.5%Employed 67,771 67,245 65,814 -2.9% -2.1%Unemployed 3,277 3,134 5,594 70.7% 78.5%Unemployment Rate 4.6 4.5 7.8 69.6% 73.3% Pittsfield Apr-07 Apr-08 Apr-09 24 mo. % change 12 mo. % changeLabor Force 22,560 22,203 22,548 -0.1% 1.6%Employed 21,490 21,156 20,704 -3.7% -2.1%Unemployed 1,070 1,047 1,844 72.3% 76.1%Unemployment Rate 4.7 4.7 8.2 74.5% 74.5%
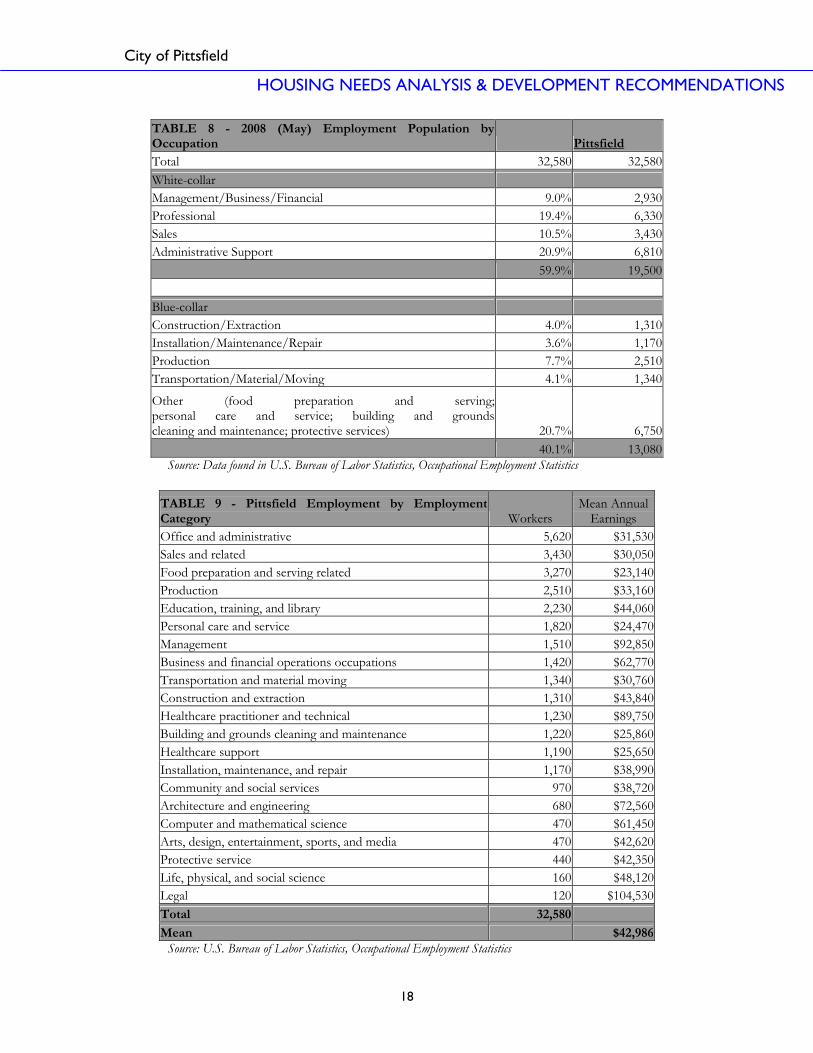
Source: U.S. Bureau of Labor Statistics Within the Pittsfield Metropolitan NECTA Division, the labor force decreased by 0.1%, an identical figure to Pittsfield’s change in labor force over the 24-month span. However, between April 2008 and April 2009, the labor force increased 1.5%. In this same time frame, employment figures dropped 2.1% which indicates a smaller drop than over 24 months. In Berkshire County, unemployment figures did not increase or decrease as much as in the state, New England City and Town Area (NECTA) division, or the city itself. Seasonally adjusted unemployment rates in April 2009 for the four divisions were similar: 7.8% in Massachusetts, 8.0% in the NECTA division, 7.8% in Berkshire County, and 8.2% in Pittsfield. Employed Pittsfield residents primarily work in white-collar professions, the majority of whom fit into the professional services and administrative support services sectors. There is a 59.9% concentration of white-collar workers compared to 40.1% in blue-collar professions. In white-collar professions, professional and professional support categories comprise 19.4% and 20.9% of the employed population, respectively. Distribution of employment population is shown in the chart below. Median wages are listed based on these employment categories.
City of Pittsfield
18
HOUSING NEEDS ANALYSIS & DEVELOPMENT RECOMMENDATIONS
TABLE 8 - 2008 (May) Employment Population by Occupation Pittsfield Total 32,580 32,580White-collar Management/Business/Financial 9.0% 2,930Professional 19.4% 6,330Sales 10.5% 3,430Administrative Support 20.9% 6,810 59.9% 19,500 Blue-collar Construction/Extraction 4.0% 1,310Installation/Maintenance/Repair 3.6% 1,170Production 7.7% 2,510Transportation/Material/Moving 4.1% 1,340
Other (food preparation and serving; personal care and service; building and grounds cleaning and maintenance; protective services) 20.7% 6,750 40.1% 13,080
Source: Data found in U.S. Bureau of Labor Statistics, Occupational Employment Statistics
TABLE 9 - Pittsfield Employment by Employment Category Workers
Mean Annual Earnings
Office and administrative 5,620 $31,530 Sales and related 3,430 $30,050 Food preparation and serving related 3,270 $23,140 Production 2,510 $33,160 Education, training, and library 2,230 $44,060 Personal care and service 1,820 $24,470 Management 1,510 $92,850 Business and financial operations occupations 1,420 $62,770 Transportation and material moving 1,340 $30,760 Construction and extraction 1,310 $43,840 Healthcare practitioner and technical 1,230 $89,750 Building and grounds cleaning and maintenance 1,220 $25,860 Healthcare support 1,190 $25,650 Installation, maintenance, and repair 1,170 $38,990 Community and social services 970 $38,720 Architecture and engineering 680 $72,560 Computer and mathematical science 470 $61,450 Arts, design, entertainment, sports, and media 470 $42,620 Protective service 440 $42,350 Life, physical, and social science 160 $48,120 Legal 120 $104,530 Total 32,580 Mean $42,986
Source: U.S. Bureau of Labor Statistics, Occupational Employment Statistics

City of Pittsfield
19
HOUSING NEEDS ANALYSIS & DEVELOPMENT RECOMMENDATIONS
In Berkshire County and Pittsfield, the largest employers are in manufacturing and healthcare. Lenox, Pittsfield, and Dalton are home to major regional and national companies. In addition to the companies in the below table, higher education institutions also create a major market in the Berkshire region.
TABLE 10 - Major Berkshire County Employer City Number of Employees Berkshire Medical Center Pittsfield 1,000-4,999 Crane and Co. Inc. Dalton 1,000-4,999 Berkshire Life Insurance Co. Pittsfield 500-999 Canyon Ranch Lenox 500-999 Hillcrest Hospital McGee Unit Pittsfield 500-999 Jiminy Peak Ski Resort Hancock 500-999 Sabic Innovative Plastics Pittsfield 500-999 Berkshire Community College Pittsfield 250-499 Berkshire Eagle Pittsfield 250-499 Boston Symphony Orchestra Inc. Lenox 250-499 Cranwell Resort Spa and Golf Club Lenox 250-499 Hillcrest Commons Pittsfield 250-499 Petricca Industries Inc. Pittsfield 250-499 Sullivan and Associates Pittsfield 250-499 US Post Office Pittsfield 250-499 AGI Polymatrix Pittsfield 100-249 Berkshire Children and Families Pittsfield 100-249 Berkshire Gas Co. Pittsfield 100-249 Berkshire House of Correction Pittsfield 100-249
TABLE 11 - Major Pittsfield Employer City Number of Employees Berkshire Medical Center Pittsfield 1,000-4,999 Berkshire Life Insurance Co. Pittsfield 500-999 Hillcrest Hospital McGee Unit Pittsfield 500-999 Sabic Innovative Plastics Pittsfield 500-999 Berkshire Community College Pittsfield 250-499 Berkshire Eagle Pittsfield 250-499 Hillcrest Commons Pittsfield 250-499 Petricca Industries Inc. Pittsfield 250-499 Sullivan and Associates Pittsfield 250-499 US Post Office Pittsfield 250-499 AGI Poly-CD Pittsfield 100-249 AGI Polymatrix Pittsfield 100-249 Berkshire Children and Families Pittsfield 100-249 Berkshire Gas Co. Pittsfield 100-249 Berkshire House of Correction Pittsfield 100-249

City of Pittsfield
20
HOUSING NEEDS ANALYSIS & DEVELOPMENT RECOMMENDATIONS
Source: Massachusetts Department of Labor and Workforce Development
TABLE 12 - Critical and emerging industries in Berkshire County, as determined by BCREB Workers
Mean Annual Earnings
Construction 1,310 $43,840Education 2,230 $44,060Finance, Insurance, and Real Estate 1,420 $62,770Health care (including healthcare support) 2,420 $57,700
Hospitality* 32,580 $42,986 Source: List of sectors provided by Berkshire County Regional Employment Board * As shown in Table 12 above, in addition to food preparation and serving and personal care, which fall into the Accommodation and Food Services sector, the Leisure and Hospitality supersector includes the Arts, Entertainment, and Recreation sector which includes many areas linked to the “creative economy.” The average income for a Pittsfield household is $42,986. Pittsfield residents employed in these sectors are above the median average income range and work in “critical and emerging industries” positioned for growth. At this level of income for a household, using the 30% standard for income allocation to housing, the average area household can pay the following in rent or mortgage payments.
TABLE 13 - Average Working HH Rent/Buying Power Pittsfield
Household Income 42,000
Allocation to Rent/Mortgage 30%
Annual Allocation 12,600
Monthly Allocation 1,050
Rent Level 1,050
Maximum Mortgage $173,437 30 periods 6.0% I/PY
12,600 Annual Payments
Employment Findings
• Pittsfield’s employment trends have closely tracked the State’s broad employment trends;
• Workers in the City have been subject to the same loss of jobs that the State and nation at large are experiencing;
• Pittsfield’s largest employers are in heath care, education and manufacturing;

City of Pittsfield
21
HOUSING NEEDS ANALYSIS & DEVELOPMENT RECOMMENDATIONS
• Pittsfield and the Berkshires in general have retained their manufacturing employment to a greater extent than the rest of the state where employment has moved strongly towards services;
• It is expected that health care, education and hospitality which include the “creative economy” will be strong growth sectors for the local economy in the coming five years;
• The median income for a Pittsfield household is $42,000 per year which allows rent of approximately $1,050 per month or acquisition of a home or condominium of approximately $175,000.
Housing Status Pittsfield has a total of 21,633 housing units which reflects an increase of 2% from 2008. Westside and Morningside represent 25% of the total units in the City.
TABLE 14 - Units 1990 2000 2008 90-08 % of TotalCity of Pittsfield 21,272 21,366 21,633 2% 100%Morningside 3,300 3,163 3,268 -1% 15%Westside 2,136 2,073 2,100 -2% 10%Total WS/MS 5,436 5,236 5,368 -1% 25%Balance of City 15,836 16,130 16,265 3% 75%
Of the City’s total owner-occupied units, the Westside and Morningside neighborhoods’ housing stock represents only 10% of the total number of units, with the remaining 90% of the owner-occupied units in the balance of the City.
TABLE 15 - Owner-Occupied Units 1990 2000 2008 90-08 % of TotalCity of Pittsfield 11,861 12,019 12,357 4% 100%Morningside 679 626 714 5% 6%Westside 496 496 496 0% 4%Total WS/MS 1,175 1,122 1,210 3% 10%Balance of City 10,686 10,897 11,147 4% 90%
However, considering that these two neighborhoods represent only 25% of the City, they have very high percentages of the rental units, comprising nearly 50% of the renter-occupied units in the City.
TABLE 16 - Rental Units 1990 2000 2008 90-08 % of TotalCity of Pittsfield 8,055 7,725 7,257 -10% 100%Morningside 2,365 2,143 2,115 -11% 29%Westside 1,420 1,315 1,254 -12% 17%Total WS/MS 3,785 3,458 3,369 -11% 46%Balance of City 4,270 4,267 3,888 -9% 54%

City of Pittsfield
22
HOUSING NEEDS ANALYSIS & DEVELOPMENT RECOMMENDATIONS
A data point that we believed was very important as well is the question of occupancy. As shown in the table below, Westside and Morningside have high rates of unoccupied housing relative to balance of the City: 16% and 12%, respectively. The team looked closely at this to discover how the data was calculated: the figure includes data from the post office, census and other sources. While it is not a scientific, house-by-house calculation, in its relationship to the balance of the City, it does represent a significant difference. (Note: this is not the same as the “vacancy rate” applying to housing being offered rental or for sale or for multi-family properties, which is lower.)
TABLE 17 - Occupied Units, 2008
Morningside Westside Balance of Pittsfield
Total housing units 3,268 2,100 16,265 Occupied units 2,829 1,750 15,035 Owner occupied units 714 496 11,147 Renter occupied units 2,115 1,254 3,888 Vacant units 439 350 1,230 Percent Un-occupied 13.4% 16.7% 7.6%
Housing Characteristics Westside Neighborhood The Westside neighborhood is bounded by Turner Avenue and Park Street to the north; North Street to the east; College Drive and West Street to the south and Onota Street to the west. North Street represents Downtown Pittsfield. See Map 1. The neighborhood includes a mix of housing and housing types, including one- and two- family units, multi-family housing, elderly and special needs housing. Three of the Pittsfield Housing Authority’s properties are located within this neighborhood; Francis Plaza, a 40-unit one-bedroom elderly housing complex, Christopher Arms, a 24-unit family complex and McGill Court, a three bedroom family development. See Map 3.

City of Pittsfield
23
HOUSING NEEDS ANALYSIS & DEVELOPMENT RECOMMENDATIONS
Christopher Arms Reflecting the growth of the City over the years, there is a reduction in both the density and age of the housing in this neighborhood as one moves from east to west, with the marked dividing line being the West Branch of the Housatonic River. The existing housing reflects the physical and economic growth patterns of the City (and the region) in its boom era from the 1890s to the 1930s. From the mansions on the hill in the Circular Avenue area to the more humble housing in the area east of the West Branch, this area has seen a shift from predominately single-family housing to more multi-family units resulting from the carving up of existing larger homes. This has obviously led to more rental housing and away from homeownership. See Map 5.
288-272 Bradford Street

City of Pittsfield
24
HOUSING NEEDS ANALYSIS & DEVELOPMENT RECOMMENDATIONS
113-119 Robbins Avenue The housing on the other side of the West Branch is a bit less dense and has slightly larger lot sizes. Habitat for Humanity has recently constructed several single-family homes in the neighborhood, most recently at the corner of John Street and West Union Street.
38-48 West Union Street – Habitat Houses An area of significant concern (and opportunity) is Dewey Street from the corner of Linden Street to the north and West Street to the south. This area has seen significant tax title, foreclosure, blight, and abandonment. Additionally, as this corridor runs parallel on the east side of the West Branch, activities in this area will be limited by the regulations around building and renovating in a 100 year flood plain district. See Map 7.

City of Pittsfield
25
HOUSING NEEDS ANALYSIS & DEVELOPMENT RECOMMENDATIONS
161-193 Dewey Street
68 Dewey and 293 Columbus Avenue Morningside Neighborhood The neighborhood is bounded by Springside Avenue to the north; Benedict Road, Tyler Street, Kellogg Street, and Fourth Street to the east; East Street to the south and North Street to the west. North Street represents Downtown Pittsfield, but there are other smaller commercial areas along Tyler Street to the north and at the junction of East Street and Fenn Street to the south. Both of these non-downtown districts are more car oriented. There is another smaller commercial node at the corner of First Street, Melville Street and Adam Street. See Map 2.
First Street and Adam Street

City of Pittsfield
26
HOUSING NEEDS ANALYSIS & DEVELOPMENT RECOMMENDATIONS
First Street and Melville Street The neighborhood includes a mix of housing and housing types, including one- and two- family units, multi-family housing, elderly and special needs housing. The only Pittsfield Housing Authority property in the neighborhood is the Providence Court apartments, a five- story elderly housing development. See Map 4. Similarly to Westside, the existing housing reflects the growth patterns of the City (and the region) in its boom era from the 1890s to the 1930s. However, the difference is that the housing closest to Downtown is some of the older and smaller housing, mixed with some commercial buildings. Much of the housing that was formerly between North Street and Pearl Street has been demolished for parking lots, leaving gaps in the Downtown to neighborhood fabric.
Rear of North Street along Pearl Street Another common housing type in this neighborhood, to a lesser extent in Westside, is a side-by-side duplex unit, which fits well into the scale of the neighborhoods, as well as provides opportunities through front porches for “eyes on the street” for neighborhood security.
City of Pittsfield
27
HOUSING NEEDS ANALYSIS & DEVELOPMENT RECOMMENDATIONS
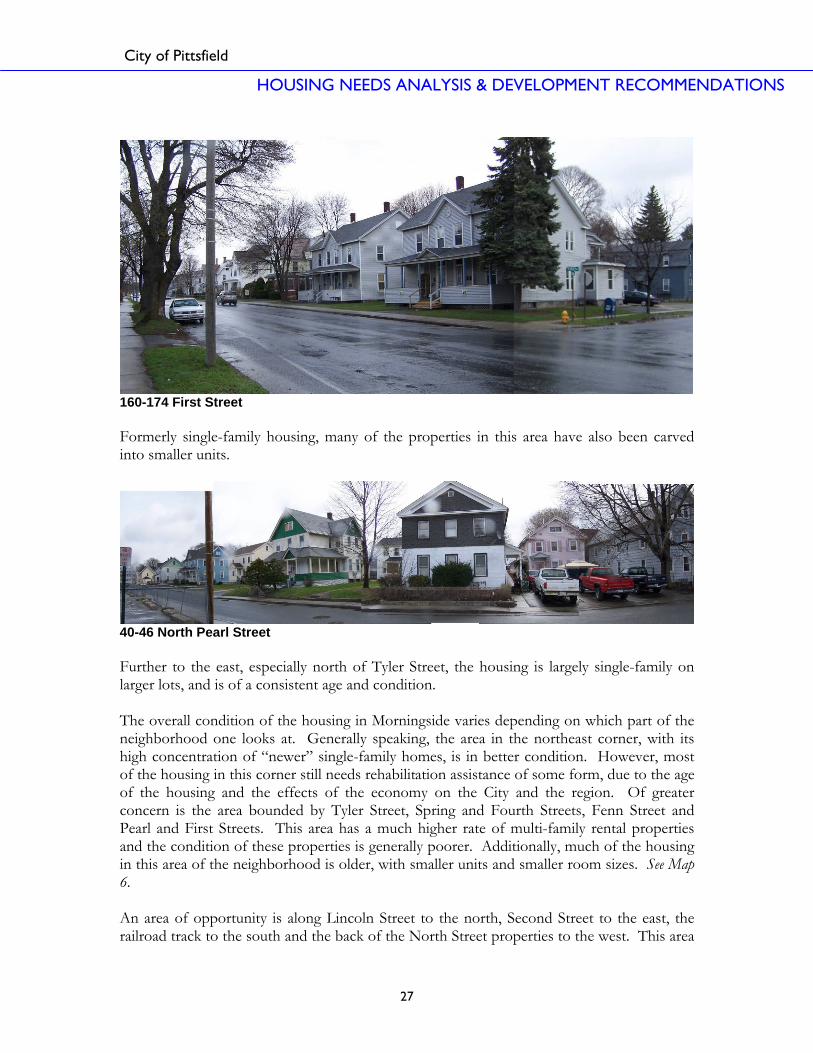
160-174 First Street Formerly single-family housing, many of the properties in this area have also been carved into smaller units.
40-46 North Pearl Street Further to the east, especially north of Tyler Street, the housing is largely single-family on larger lots, and is of a consistent age and condition. The overall condition of the housing in Morningside varies depending on which part of the neighborhood one looks at. Generally speaking, the area in the northeast corner, with its high concentration of “newer” single-family homes, is in better condition. However, most of the housing in this corner still needs rehabilitation assistance of some form, due to the age of the housing and the effects of the economy on the City and the region. Of greater concern is the area bounded by Tyler Street, Spring and Fourth Streets, Fenn Street and Pearl and First Streets. This area has a much higher rate of multi-family rental properties and the condition of these properties is generally poorer. Additionally, much of the housing in this area of the neighborhood is older, with smaller units and smaller room sizes. See Map 6. An area of opportunity is along Lincoln Street to the north, Second Street to the east, the railroad track to the south and the back of the North Street properties to the west. This area

City of Pittsfield
28
HOUSING NEEDS ANALYSIS & DEVELOPMENT RECOMMENDATIONS
has an opportunity to provide a real connection of housing to Downtown by creating linkages to the cultural and entertainment centers being created there. Within very easy walking distance, the housing in this area could be further supported by the creation of a neighborhood identity through cultural/historical landmarks, mini-parks, signage and other such identity markers. Although not as distressed as other parts of Morningside, it is a critical intersection of Downtown and neighborhood that, through its improvement, could provide a first wave of revitalization. See Map 8. Relationship of Westside and Morningside Neighborhoods to Downtown Pittsfield The current condition and future success of both Westside and Morningside neighborhoods is critical to the overall success of Downtown Pittsfield. Given the amazing variety of housing in both neighborhoods and the close proximity, within walking distance, of hundreds of units of housing, these neighborhoods provide a unique opportunity for Downtown. However, in both neighborhoods, but particularly in Morningside, there is a perception of crime, drugs, and gangs that was much discussed in our meetings with various citizen and civic groups. It was also noted that there is strong neighborhood identification by Pittsfield residents – both good and bad – with clear boundaries. Housing Conditions According to census data, most of the units in the target areas are older with a mean year built of 1940. Only a small percentage of units (as low as 10%) were built within the past 30 years.
TABLE 18 – Age of Housing Stock Before 1969 All Units 2008
Percent before 1969
Mean Year Built
Morningside (Census Tracts 9001,9002) 2,854 3,268 87% 1940Westside (Census Tract 9006) 1,703 2,100 81% 1940
These two neighborhoods have a significant number of units which are in varying levels of distress, including: vacancy, abandonment, foreclosure and lots which had housing recently, but whose housing has been demolished for code compliance.
TABLE 19 - Distressed Properties in Morningside/Westside (2Q 2009) Units* Abandoned 35 Bank Owned or Controlled 29 Foreclosed and Sold or Transferred Under Threat of Foreclosure 44 In Foreclosure Process 116 Vacant Lots - Code Compliance* 69 TOTAL 293 * Vacant lots is properties not units

City of Pittsfield
29
HOUSING NEEDS ANALYSIS & DEVELOPMENT RECOMMENDATIONS
These statistics point to what is obvious in both neighborhoods: the housing, especially the multi-family buildings and rental housing, is in fair to poor condition. Given the age of the properties, there are significant issues with lead paint, dilapidated roofs, porches, windows, and siding. It can also be assumed that, given their age, most of these units are not energy efficient, contributing to the overall costs of maintaining, operating and affording these units by both tenants and landlords. Housing Subsidies The Westside and Morningside neighborhoods also have a significant number of directly subsidized households or housing units.
TABLE 20 - Directly Subsidized Households Morningside Westside Total Public Housing Units 115 189 304 Families with Section 8 Vouchers 97 274 371 TOTAL 212 463 675
Separate from these units, the State’s 40B calculation for Pittsfield identifies 1,668 units of subsidized housing in the Westside neighborhood which represents 85% of the 1,947 total subsidized unit count as of 2000. (This was based on a street name analysis of the inventory so there may be limited exceptions where properties were outside the target areas). While these units widely differ in character (an estimated 50% of these units are beneficiaries of the City’s successful homeowner rehabilitation program) this does represent a large allocation of the units to these neighborhoods. Taken together, the Morningside and Westside neighborhoods have a large number of factors which should concern the City. While none of these factors alone indicates that a neighborhood is troubled, this combination of factors signals that this community has significant challenges and may lack the balance of rental and owner-occupied housing reflective of a healthy neighborhood. Housing Findings
• Westside and Morningside represent 25% of the housing in the City but only 10% of the owner-occupied housing in the City.
• The target neighborhoods have a disproportionate share of the rental units accounting for 46% of the City’s total rental units; while some of this is appropriate for a city center, this neighborhood is absorbing more than its share of the rental housing stock.
• The target neighborhoods also have very old housing, approximately 90% of which was built before 1969 and more than 85% of which predates 1950 – the housing in these neighborhoods has a mean construction date of 1940.
• Westside and Morningside have a large number of subsidized properties. According to the DHCD Chapter 40B calculation, we estimate that these two neighborhoods have approximately 1,600 subsidized units or 85% of the subsidized housing in the

City of Pittsfield
30
HOUSING NEEDS ANALYSIS & DEVELOPMENT RECOMMENDATIONS
City. NOTE: While the ratio is high, because so many the subsidized properties are owner-occupied through the City’s homeowner rehabilitation program may make this factor seem more extreme that it is.
• However, when combined with the number of properties in distress through abandonment, foreclosure, the imminent threat of foreclosure or demolition for code compliance, the data do suggest a neighborhood which needs additional diversity of housing stock and tenure.

City of Pittsfield
31
HOUSING NEEDS ANALYSIS & DEVELOPMENT RECOMMENDATIONS
3 Housing Market Analysis With a better understanding of the population, employment and housing trends in Pittsfield, the operative question for this report is: what is it about the market that is causing the high level of distress in the community? This section reviews the status of housing demand and supply, including both the rental and for-sale market to better understand how these two factors are collaborating to create the current market condition. Housing Demand Growth in population, employment, and income and household formation are the primary demand drivers for market housing and to a lesser extent, affordable housing. As shown in Table 1 in the prior section, population in the City and the two target neighborhoods has gone down by 6% and 9% respectively between 1990 and 2000. Also, the number of employed people in the City at large has generally been stable since it sustained a significant loss in the 1980s with the reduction of employment at General Electric. Between 1980 and 1990, Pittsfield saw a significant population decrease of 6%. Unfortunately as shown in Table 7, the most recent quarters suggest that there will be more loss of employment due to the national recession. As a result, in Pittsfield, the near term trend in both these categories suggests there would be zero or very slow growth in new local market residential demand.

City of Pittsfield
32
HOUSING NEEDS ANALYSIS & DEVELOPMENT RECOMMENDATIONS
Meetings with the Rental Housing Association suggest that the customer for local market rental housing is a younger single person or couple who is either local or relocating to the City to work at one of the larger firms in town on a temporary basis or are new hires. Discussions with local realtors suggest that much of their housing demand is coming from households seeking a lower price option for second homes or retirement homes compared with nearby Lenox. They have been specifically focused on new condominium product on the outskirts of the City and the housing in the target neighborhoods has not been seen as comparable and competitive. Looking at the affordable housing side of the market in isolation, the Pittsfield Housing Authority’s waiting list suggests that there is strong demand for affordable housing in the market. TABLE 21 - PHA Waiting List Households 1BR 2BR 3BR 4BR+ Family (State and Federal) 182 - 127 52 3 Elderly (State and Federal) 203 202 1 - - Vouchers 395 133 172 77 13 Total Waiting List 780 335 300 129 16 Overall Housing Supply As shown in the housing overview, in 2008, Pittsfield had approximately 21,000 residential units. In the period between 1990 and 2000, Pittsfield added few units, approximately 94 or just fewer than 10 per year. In contrast, over the past 8 years, the City has added 267 units or 33 per year, representing 1.25% growth in new units. Morningside and Westside actually lost units from 1990-2000, and although they have grown incrementally in recent years, they have not yet approached their 1990 unit count. (It is important to mention that the City’s successful downtown residential development efforts have been included in these unit counts based on their locations.) Units which are not either renter or owner-occupied are noted as vacant in the data reviewed. These figures suggest that up to 789 units in a target area of 5,368 units (14%) are vacant. This is not a vacancy rate for rental housing but rather a reflection of rental and ownership housing that is out of service. If this is the case, there are a number of units standing idle which could, if the unit mix or affordability was right, be adequate to house all of the households on the City’s waiting list. The trend for new single-family permits in the City suggests that there has been a pipeline of new for-sale units in the market; however, there are no new multi-family or rental units in the pipeline.
Table 22 - Permits
FY 2001
FY 2002
FY 2003
FY 2004
FY 2005
FY 2006
FY 2007
FY 2008
Single-Family 41 42 50 57 49 N/A 25 16 Multi-Family 0 0 0 0 0 0 0 0

City of Pittsfield
33
HOUSING NEEDS ANALYSIS & DEVELOPMENT RECOMMENDATIONS
Rental Supply Profile There are 7,257 renter-occupied units in Pittsfield. Rental units in the Westside and Morningside represent 45% of the rental housing in the market. To understand the rental housing market Bonz & Co. reviewed a number of comparables. The City’s market rents for established multi-family properties are shown in detail in Table 23. These rents and their companion US HUD Fair Market Rents and 60%, 50%, and 30% AMI rents for Low Income Housing Tax Credit eligibility are shown below. The majority of the City’s rental units are in 2-4 family units managed by homeowners rather than larger multi-family properties which have usually been built more recently and have greater amenities.
Market Rents Affordable Rents TABLE 23 - Market & Affordable Rents High Low FMRs 60% 50% 30% 1BR: 939 626 676 873 727 436 2BR: 1,000 755 839 1,047 872 523 3BR: 1,218 1,040 1,078 1,210 1,008 605 Consistent with the finding in the 2005 Consolidated Plan, data from Berkshire County Regional Housing Authority suggests that market rents for professionally managed buildings in this area typically mirror or are below Section 8 Fair Market Rents. These newer professionally managed properties also had a very low vacancy rate of approximately 2%. The reason for this is the age and condition of the housing stock. Much of the smaller landlord property is older and lacks the features of the new developments. As a result while there may not be incentives for market rental housing, development of newer rental housing using affordable housing resources would compete well for eligible households given the age of the stock in general. For-Sale Supply Profile Since 2000, the Pittsfield for-sale housing market has had sales volume ranging from a low of 607 achieved in 2009 to a high of 918 transactions in 2004. The market has consisted of approximately 60% single-family homes; 5% condos, and the remainder are multi-family properties. The average price citywide for single families have ranged from $110,000 in 2000 to a high of $173,000 in 2008. Condo sales have changed in character significantly since 2006. At that time, a new product – a new condominium developed on a “greenfield” site outside the city center – has entered the market and elevated median condo prices to $365,000 in 2008 from a low of just $87,000 in 2002. The 40-50 new permits per year for single-family units are closely aligned with the 30-69 condo units sold each year 2003-2008. The Westside and Morningside single- and multi-family units sold have been at price points 35% lower on average than the $173,000 average for 2008 with properties transacting at

City of Pittsfield
34
HOUSING NEEDS ANALYSIS & DEVELOPMENT RECOMMENDATIONS
approximately $110,000. The two neighborhoods had 63 sales in 2008 representing roughly 10% of the total home sales and 20% of the single and multi-family units sold. This is approximately consistent with the 20% of homes in the City that these neighborhoods represent. These properties that were absorbed have an average of 143 days on the market which is in line with the Citywide trend. At this price, the economics of development for new construction – which can cost $200,000-$250,000 in direct costs even for a modular, lower-cost unit – is uneconomic. Rehabilitation is more feasible. However, there are few resources for affordable home-ownership. Even if there were more resources, at a $200,000-$250,000 per unit cost, developers would still struggle to obtain the financing, develop and sell new, affordable for-sale property economically. Putting aside the vacancy rate, this is especially true when there are many properties for-sale in the $110,000 range on which there is no restriction on equity growth (a requirement of most for-sale subsidies). For that reason, at this time, the demand for for-sale renovation and new construction in the Westside and Morningside areas are likely low. Market Findings
• Local demand for housing is likely stagnant because of the lack of growth in population and employment.
• The market demand that exists is largely coming from outside the community into newly developed condominiums.
• Based on the Housing Authority waiting list, there is significant demand for new affordable housing.
• On the supply side there has been some added product in the market to appeal to households relocating from outside the market, largely in units located on the outskirts of the City.
• The data suggests that market rental housing is discouraged by: o Excess supply: So long as vacant properties could be rehabilitated and
competitive for tenants for less than the price of new construction, developers will not be interested.
o Low rents: The fact that rents in the market are slightly higher (or in some cases the same or lower) than Section 8 FMRs or 60% AMI (LIHTC) rents is a disincentive to market rehabilitation and new development.
• However, there are incentives for affordable housing: o High demand for affordable housing based on the PHA list; o High occupancy of larger professionally managed market and affordable
housing; and o The high median age of the housing stock.
• As a result of these factors, it is likely that there is some demand for new affordable or market housing, such as the New Amsterdam and Silk Mill properties currently in construction and planning.
City of Pittsfield
35
HOUSING NEEDS ANALYSIS & DEVELOPMENT RECOMMENDATIONS
• While the absorption rate and sales of Westside / Morningside property as a percentage of total sales are in line with the neighborhoods’ proportion of the City, The data suggest that new for-sale housing is discouraged by:
o Lower price points: The current sales price for units in Westside and Morningside is well below the cost of construction and in some cases, rehabilitation costs (which may include lead paint remediation) can also exceed the sales price available on the market.
City of Pittsfield
36
HOUSING NEEDS ANALYSIS & DEVELOPMENT RECOMMENDATIONS
4 Housing Needs and Opportunities Given the City and stakeholder goals and demographic and market analysis what are the housing needs and opportunities for these neighborhoods? Summary Findings Population and Employment
• Pittsfield’s overall population has shrunk significantly since 1990 but that rate of decline has slowed and is projected to slow down further. This trend is particularly significant on the Westside and to a lesser degree on Morningside.
• The population of these two neighborhoods is disproportionately young, and has lower incomes than the rest of the City; however, the City also has grown in the percentage of households with associate’s degrees and above.
• Generally, Pittsfield’s employment and population have trended in the same direction and have now reached a level where the employment rate for the City is approximately in the same range as the state-wide rates of employment and unemployment.

City of Pittsfield
37
HOUSING NEEDS ANALYSIS & DEVELOPMENT RECOMMENDATIONS
• Household incomes for these neighborhoods are lower than the balance of Pittsfield, in the case of the Westside the median represents only half of the median for the balance of Pittsfield.
Housing Status
• Westside and Morningside have the oldest housing in the City. • On Westside, the neighborhood has its most density between the river and North
Street, west of which it has larger homes and single-family character. • On Morningside, the neighborhood has its smallest and oldest stock closest to North
Street with newer housing clustered in the Northeast section of the neighborhood. • These neighborhoods house the majority of households with Section 8 vouchers and
support the largest volume of affordable housing. • These two neighborhoods have the majority of the City’s multi-family housing stock. • The two neighborhoods also have the most affordable housing stock. • The two neighborhoods also have the most distressed housing (foreclosed, bank
owned or controlled, or abandoned housing). • The two target neighborhoods also have the lowest rates of homeownership in the
City. Housing Market
• Achieved rents in newer professionally-managed market properties in the City are within the range of the City’s fair market rents.
• In the two target neighborhoods, rents in professionally-managed older multi-family and two-family properties are at or below the City’s fair market rents.
• Rental operators suggest that smaller 1 BR units are most difficult to lease and larger units with 3 or more bedrooms are in greater demand.
• Anecdotally, relocated and temporary professionals in the City’s corporate community look at properties in these neighborhoods but are dissuaded from renting by neighborhood perceptions.
• On the for-sale side, new production of single-family units has been clustered in the undeveloped areas on the outskirts of the City.
• Single families have been selling for a median price of $173,000 in 2007 with condominiums selling for a median of $365,000.
• The buyers for these condominiums are generally being driven by the second home and retiree market, rather than local demand.
• The 63 sales in these neighborhoods in 2008 represent roughly 10% of total home sales and 20% of the single- and multi-family units sold. This is approximately consistent with the 20% of the homes in the City that these neighborhoods represent.
• Westside and Morningside homes have some of the lowest cost properties with an average price of $110,000 and some prices as low as $65,000; at the $110,000 price point homes represent a 35% discount on the median price.

City of Pittsfield
38
HOUSING NEEDS ANALYSIS & DEVELOPMENT RECOMMENDATIONS
• These properties that were absorbed have an average of 143 days on the market which is in line with the Citywide trend.
City and Stakeholder Priorities These facts must be viewed in the context of the City’s goals and priorities. To understand how this data can indicate the needs for these neighborhoods, we need to understand the set of City priorities. These emerged from recent plans (specifically, from the City’s Master Plan), and other prior planning efforts and meetings with stakeholders. These plans envision the City and these two neighborhoods as:
• Vibrant place to live; • Center of innovation; • Heart of regional culture; • Compassionate place; and • As a sustainable place economically and environmentally;
The plans also target housing quality and affordability with the goals of:
• Creating and preserving neighborhoods that attract new people to live in Pittsfield and retain current residents
• Providing a diversity of affordable workforce housing for current and future residents
• Providing a diversity of housing choices to attract people in all stages of life • Raising the quality of housing stock • Providing points of pride for neighborhood to rally around
From discussions with the City and local stakeholders, we gathered the following criteria for evaluating this data for Westside and Morningside specifically. According to community members, the initiatives in these neighborhoods must:
• Support market-rate or mixed-income redevelopment of existing property • Increase homeownership • Support Pittsfield’s arts, culture and recreation industry focus • Use “green” or sustainable development approaches • Emphasize rehabilitation and redevelopment over new construction • Reduce blight and vacancy • Connect with downtown redevelopment efforts • Be open to bold action on the future of these neighborhoods
To these priorities, we have added some of our own goals to the discussion. Our recommended goals include the following:
City of Pittsfield
39
HOUSING NEEDS ANALYSIS & DEVELOPMENT RECOMMENDATIONS
• The plans must create “Defensible Space,” that is, space which attempts to “…restructure the physical layout of communities to allow residents to control the areas around their homes. This includes the streets and grounds outside their buildings and the lobbies and corridors within them. The programs help people preserve those areas in which they can realize their commonly held values and life styles.” (from Oscar Newman’s Creating Defensible Space.”)
• Involve natural features to the maximum extent possible and represent current best practices.
• Include open spaces which are programmable, where possible. • Include a special design element, such as a monument, special street signage or street
trees, an historic structure to serve as a landmark and/or neighborhood marker. • Reinforce a system of key streets to link vital commercial and employment centers to
walkable neighborhoods, parks, rivers. Housing Needs: Westside - Morningside Bearing in mind the demographic information, market data, and community goals, the GLC/D&Co team has identified a set of housing needs. These needs represent both needed policy which support housing in these neighborhoods and specific physical housing improvements. Westside – Morningside Housing Needs - Policy
• Reduce the number of distressed residential units (properties in foreclosure, and abandoned or vacant housing) in one of the following ways:
o Continue to build on the success of Code Enforcement by requiring
improvement of non-compliant properties and acquire and demolish those which do not improve;
o Rehabilitate marginal housing with the capacity to serve the market and affordable (family and elderly) demand;
o Assemble blighted vacant property for future development, further tightening the market and encouraging development interests to rehabilitate and develop new units.
• Create major new amenities to renew interest in the Westside and Morningside
neighborhoods to target younger households and retirees and change local attitudes about the communities.
• Increase the rate of homeownership in the Westside and Morningside
neighborhoods.

City of Pittsfield
40
HOUSING NEEDS ANALYSIS & DEVELOPMENT RECOMMENDATIONS
Housing Needs – Development and Rehabilitation
• Rehabilitated and/or new construction homes which appeal to younger households and retiree and empty nester households who are currently buying property or renting in other parts of the City, specifically:
o Rehabilitated “starter homes” or smaller-scale homeownership opportunities
for first time homebuyers or those with the need for smaller homes o Market or mixed-market and affordable rental development involving
existing buildings.
• Larger bedroom (2-3 BR) rental units which are code compliant o First, through rehabilitation of existing and distressed properties; o Second, and where possible, through subsidized new construction.
• Infrastructure and open space development including street improvements and
beautification and open space development. Housing Opportunities The local stakeholders input, demographics and the market analysis have helped define a set of housing needs in the neighborhoods. The same information also helps define a set of opportunities for the City and the development community, answering the question: what set of actions can the City and developers take to change the market dynamic in the Westside and Morningside neighborhoods? The City of Pittsfield has some key assets and amenities that could be leveraged by a strategic approach to alleviate the housing issues of Westside and Morningside, including:
• Both neighborhoods are within easy walking distance of Downtown. • Pittsfield residents see the improvement of Westside and Morningside
neighborhoods as essential for Downtown success, and as such, would likely support improvement efforts.
• There is a need for housing for young professionals, for example, members of the creative economy, health care employees, etc.
• There is a need for housing retirees, empty-nesters and others who see Pittsfield as the “Downtown of the Berkshires.”
• There is an abundant supply of historic properties that are eligible for Historic Tax Credits, making them easier to develop (this program only applies to rental properties).
• The natural surroundings of Pittsfield, the Berkshires, make Pittsfield a unique place to live, providing easy and fast access to nature.
• Pittsfield has created a Downtown Mixed-Use and Arts and Cultural Overlay district to encourage and link arts, business and housing.

City of Pittsfield
41
HOUSING NEEDS ANALYSIS & DEVELOPMENT RECOMMENDATIONS
• There is an abundant supply of cultural attractions in the area, enough to satisfy any potential resident.
Also, as we described earlier, we need to recognize what is working well with the current approach in these two neighborhoods.
• The City’s code enforcement activities have made a difference in the quality of housing available in the two neighborhoods with more than 1,800 housing units brought into compliance with housing regulations.
• New Amsterdam, the first new rental housing to be constructed by a private developer in the city in more than 30 years, has expanded housing choice for eligible households.
• The City’s enactment of housing programs like 40R and the Urban Housing TIF program offer tools for owners in rehabilitating or building new housing units in the city’s center.
We recommend the following areas of focus for the redevelopment effort. This section summarizes the Policy Initiatives which will affect the market in the neighborhoods in general. The next section, Development Recommendations proposes specific a development and infrastructure project. Policy Initiatives
• Code Enforcement Team: continue to evolve the organizational structure and deployment of the team to build on successes; and continue aggressive action against vacant and dilapidated property. Specifically:
o Coordinate use of the existing Govern software or if necessary purchase a master database system that will allow the inventorying and tracking of all properties and actions;
o Increase staffing and responsibilities of the Code Enforcement Team to allow for increased levels of investigation and follow-through;
o Using the Master Plan, develop a strategic, prioritized list of key properties, streets, or areas for enforcement; and
o Create Code Enforcement “Follow-Through” guidelines for interim-use of cleared properties.
• Weatherization and Heating Improvement Program: Work with landlords and
individual homeowners to bring substandard housing into better condition. Specifically:
o Create an expanded program of weatherization and heating repair using funding from the National Recovery Act (Federal Stimulus) for the Weatherization Assistance Program and HEATWAP;
o Expand the DCD Home Improvement Program to reach more units.

City of Pittsfield
42
HOUSING NEEDS ANALYSIS & DEVELOPMENT RECOMMENDATIONS
• “Land Banking”: Identify funding to acquire, dispose of and hold distressed or abandoned property to create bundles of property for redevelopment and potentially development of amenities such as open space. Funding may be available for these tasks through the US HUD Neighborhood Stabilization Program, Part 2.
• Design Guidelines: Develop a set of standards specific to each neighborhood for lot
sizes, building placement (setbacks), landscaping, driveways and parking, building density and proportions, design features, and other architectural design issues. These standards can guide future infill for land banking activities or for new developers entering the area. The city can use these guidelines to make sure that local developers meet a high standard of design which will appeal to the target younger and retiree markets.
• Targeted Homebuyer Assistance: The City needs to attract new homebuyers to the
area a part of a multi-tiered effort to improve homeownership in these two neighborhoods. While physical changes are needed as well, direct homebuyer incentives have an important role to play. Programs could include Employee Housing Programs, First time homebuyer lending, Individual Development Accounts (IDAs) for both Artists and other targeted groups; and acquisition rehabilitation lending for qualified buyers.
City of Pittsfield
43
HOUSING NEEDS ANALYSIS & DEVELOPMENT RECOMMENDATIONS
5 Development Recommendations As we have noted earlier in this report, there are blocks in every neighborhood which have a disproportionate role in defining neighborhood character. When neighborhoods are distressed, these blocks accentuate those problems. When they are healthy, these blocks that will define the neighborhood positively. Earlier in this report, we recommended that the City identify a “Focus Area” in each neighborhood and concentrate attention and resources on those blocks where investment will have a high impact. At that time we recommended the following blocks:
• On the Westside, the area selected included Linden Street to the north, Columbus to the south, Dewey (both sides) to the east, and John Street to the west. See Map 7.
• On Morningside, the focus area included Orchard Street to the north, the Railroad to the south; Pleasant Street to the east, and Second Street to the west. See Map 8.
Based on our further review, we have found that the conditions in Westside are most ripe for intervention by the City, while the problematic conditions in Morningside are more diffuse. With a few exceptions noted here, they lend themselves better to the policy recommendations identified earlier in the report. As a result, GLC / D & Co. have focused efforts on developing concept plans, program and economics for an open space development plan, and a residential rehabilitation and development initiative in Westside. In Morningside, we have identified some specific areas to focus attention through the policy initiatives described in the conclusions.
City of Pittsfield
44
HOUSING NEEDS ANALYSIS & DEVELOPMENT RECOMMENDATIONS
Westside Yet, as we have indicated in the Housing Needs Analysis, we feel strongly that additional public action is needed on the Westside and Morningside neighborhoods of the City. Westside has lost the largest percentage of population and has the largest number of unoccupied properties and vacant house lots. This section of the City needs to be further positioned to connect to Pittsfield’s downtown and attract the younger and retiree households that are being attracted to the City’s urban housing market. To accomplish this, GLC / D & Co. recommend a significant open space intervention and streetscape strategy, paired with a plan to acquire, hold, and then, when the open space improvements are underway, GLC / D & Co. will create an offering package including key houses and vacant house lots for developers with capacity. Open Space and Streetscape Initiative To change the dynamic on the Westside, the City must make the area attractive to current and potential residents through open space improvements. Based on the maps of properties in various stages of distress (abandoned, foreclosed, demolished for code compliance) it appears that there are a number of sites with adjacency to the West Branch of the Housatonic River which have the possibility for redevelopment into attractive open space. The team also feels strongly that segments of Bradford Street, specifically between Francis and Dewey Street, have an attractive residential street frontage and connect well into the downtown. While Columbus and Linden are the leading vehicular connecting streets to the Westside from downtown, as a pedestrian-scale walking street, Bradford seems better matched to the task of connecting residents to the downtown. While infill development has the potential to bring new residents to the area, a major public improvement will help change the perception and use of the area. The GLC / Dietz & Co team recommends that the City add a small number of private and tax-title properties that have been subject to demolition for code compliance to its current set of City-owned properties along the river (see Exhibit 1). Together with the City properties, these properties will give the City an adequate assemblage to develop a new open space along the river as shown in Exhibit 2. (These ideas build on the direction that emerged from the Executive Office of Energy and Environmental Affairs Urban Visions 2 Plan in 2006.) The proposed development program for this Housatonic River Open Space includes:
1. A canoe/kayak launch; 2. Two pavilions for riverfront picnic and recreation; 3. An attractive Bradford Street bridge across the West Branch of the Housatonic
connecting Bradford to Monroe Street); 4. Parking; and 5. Naturalized River edges
City of Pittsfield
45
HOUSING NEEDS ANALYSIS & DEVELOPMENT RECOMMENDATIONS
All elements of the open space area must be well planned and designed, however, the new Bradford Street Bridge should be a distinctive and special bridge that recognizes the residential neighborhood context in which it is located. It should also establish a high standard for design. The bridge and the open space around it should become an attraction for the neighborhood as well as serve as its own Pittsfield attraction. It is our hope that with careful planning and design, this improvement can help create a new landmark and character for the Westside that is related to this important river. With a new bridge and a new arts focus on the existing bridges, we hope that this improvement can brand the Westside as a “Bridge” district, an idea which can aid rehabilitation and new development in the neighborhood over time. Examples of distinguished comparable bridges are included in Exhibit 2. To connect these open space and bridge improvements, we recommend connecting the proposed improvements to downtown through a series of coordinated street improvements along Bradford Street, including new street trees, street lights, and sidewalk and curbing leading up to the bridge crossing. As shown in Exhibit 3, we believe this package of improvements can be accomplished for approximately $3.5M using resources from the City and State. We specifically recommend requesting a 2011 CDAG grant as well as a Commonwealth PARC grant. A key element in this funding strategy will also be NSP2 funding which the State has requested on behalf of the City from US HUD in a recent application. It is our hope that when combined and phased correctly, these open space and streetscape improvements will begin to create momentum for this neighborhood. Specifically, we feel that improving Bradford Street, linking it to downtown, and creating an attraction at the river’s edge in the heart of the Westside sets the stage for changed perceptions of the Westside. To implement this project, we recommend that the City create an internal team, using work assignments for existing staff and potentially adding staff or contractors to acquire properties. (This same team can be used to assemble houses for rehabilitation or new construction proposed in the following section.) We then recommend that the City carefully select a landscape planner and bridge designer to create the Housatonic Open Space, potentially involving a design competition or elements of such a competition. Depending on current staff depth in managing improvements of this kind, we suggest you retain enough funding in the budget to hire an owner’s project manager to make sure the project’s design and execution are of a very high quality. Residential Initiative We recommend that the City follow this improvement with the acquisition of several critical houses and vacant house lots with a specific plan to hold the properties. The plan must allocate enough resources to actively manage and maintain the properties for some period of time using interim uses such as community gardens and temporary public art installations, among other uses. Next, we recommend release of an RFP for a bundle of residential

City of Pittsfield
46
HOUSING NEEDS ANALYSIS & DEVELOPMENT RECOMMENDATIONS
properties which put a premium on high quality rehabilitation and construction of a small number of well-designed new homes designed to meet the market need for both affordable and market rate housing. This strategy will help spur private investment and realize improvements to other private properties in the neighborhood. We recommend that the City gather resources, potentially from the State’s recent NSP2 funding request, or the State’s existing NSP resources. Using this funding, the City should acquire residential properties on the Westside with the intention of advertising for one or more developers to purchase and develop them as infill for-sale housing. To reach a developable scale for the infill developer, we recommend that the City acquire sites with the intention of aggregating 20-25 properties for redevelopment. The City should use the following general priorities for acquisition until it reaches this range ("Available Properties"):
1. Properties with recorded liens; 2. Properties with unrecorded liens; 3. Abandoned homes and properties (vacant properties in tax title, land court or estate
properties); and 4. Foreclosed properties (note: the properties available through foreclosure proceedings
change on a monthly basis. We recommend that the City monitor this information; settle on acquisition criteria for location and price and acquire selected properties in the auction stages of the process.).
The development of these acquired properties into new housing will take several years. As a result, the City should budget its resources to manage these acquired properties appropriately. In some cases this means simply clearing the sites and making sure property maintenance takes place. In others, it will mean securing or even leasing properties through an agent for existing houses. For vacant sites, it could mean “yard sales” to neighboring homeowners with a commitment to maintenance and operations. It could also include actively programming vacant sites with interim improvements and landscaping and maintaining the sites as small open spaces or community gardens, especially where larger clusters of sites are identified. (The current community garden at Robbins Avenue and Bradford Street is an example of this.) During or after the open space and streetscape improvements, when the market is deemed receptive, the City should then offer the bundle of properties to developers. They should be packaged with a set of specific development requirements including design guidelines and, where appropriate, arrange for allocation of home-ownership subsidies from CDBG or the State HOME program. While the properties will be infill, they will re-create the conditions on a set of critical streets for the Westside. The City should require that the developer attend to the importance of specific streets such as Linden, Columbus, Bradford, Dewey and John Street. One of the explicit targets of this residential initiative is attracting new residents to the Westside, while making improvements for the current and longtime residents. We further recommend that the City work with Assets for Artists and seek out an Employee Assisted

City of Pittsfield
47
HOUSING NEEDS ANALYSIS & DEVELOPMENT RECOMMENDATIONS
Purchase program that can be specifically linked to the rehabilitation and new construction proposed for these sites as well as other property in the neighborhood. As a part of the community and part of the development economics of a proposed project in this area, these programs could be instrumental in changing this neighborhood. To execute this project the City needs four types of expertise: property acquisition expertise, planning expertise, property management expertise, and development expertise for the property disposition. Finally, the City needs the resources to implement this assignment. We recommend that the City use the same internal team identified for the Open Space initiative, potentially adding staff or contractors to plan for the interim uses and improvements for the properties and to sell the properties. To illustrate the specific scope we recommend, we have included in Exhibit 4 a list of distressed properties including demolished properties with liens, demolished properties without liens, and properties believed to be abandoned, as described above. We have also projected the cost of assembly. Exhibit 5 provides a sources and uses statement for the project which illustrates the actual acquisition costs, as well as the budget for the hold strategy (planning and property management) as well as the costs associated with disposition. Exhibit 6 contains a site plan and examples of comparable infill housing types. As shown in these exhibits, the projected cost of the initiative is approximately $2M, also including costs of acquisition, property management, and planning and disposition. Morningside As described earlier in this report, the conditions in Morningside are significantly different than Westside. Data indicates that the community has been hurt slightly less by the population loss and vacant, abandoned, and foreclosed property. Thanks to the efforts of code enforcement to identify areas of concern, we can identify several locations where there is a need and an opportunity for additional action. Three places in particular have been identified for future planning focus:
1. North Pearl Street between Melville and Maplewood Streets; 2. Orchard Street between First and Wellington Streets; and 3. Pleasant Street between Lincoln and the Rail Corridor.
North Pearl Street. The area along this street is bordered by Maplewood and Melville and is where the Morningside residential neighborhood meets downtown. The condition of the houses on the east side of North Pearl varies widely but with the Boys and Girls Club, senior facilities and St. Joseph’s as neighbors, the area offers the possibility of being a “transition zone.” In this area, walkers can move from lower scale residential on Morningside into downtown scale in a manner similar to that on the block between downtown and Center and Francis Street on the Westside. Today, the sites are used for parking for the area land users.

City of Pittsfield
48
HOUSING NEEDS ANALYSIS & DEVELOPMENT RECOMMENDATIONS
However, the parking appears to exceed demand. While there is not adequate market demand to support new residential or other uses, it is a great place for an interim community use which could enhance the transition. GLC / D & Co. feel this area is important and could be a good location for an interim land use such as a crafts or farmer’s market or a location for major outdoor programs that need active outdoor space. The area could also be helped significantly by landscaping or appropriately scaled, additional street trees and lighting along North Pearl Street. Orchard Street: Also within the focus area is Orchard Street. Within the block between First and Wellington Street, there are two large foreclosed houses, 56 and 60 Orchard Street, which are scheduled to be demolished. The soon-to-be-vacant house lots are on a short street and within two blocks of North Street. This situation is emblematic of a condition that occurs on a few streets in the neighborhood: the deterioration of one or two properties on a street negatively impacts the perception of other properties. GLC / D & Co. believe that along with the success code enforcement has had in identifying and tracking issues throughout the process, the City can help Orchard Street and similar streets by planning for clearance with aggressive property management and thoughtful interim uses. When this site is cleared, there will be a large vacant lot. Going forward, the city should consider how it can clear, seed, and maintain the lot so that its appearance is mitigated in the immediate term. This property is also a location where, property rights allowing, the City could consider a pocket park or related uses for children in the neighborhood. Pleasant Street. Between Lincoln Street and the Rail corridor, Pleasant Street is a short, narrow street with eight houses. This street has similar problems as Orchard Street: 7 Pleasant Street at the corner nearest the rail bed is vacant and in the foreclosure process. 17-19 Pleasant, two doors down, was demolished in 1993. The property at 16 Lincoln Street appears to be in tax title. This street is distinguished by its view of the Berkshires over the rail corridor. GLC / D & Co. can tie the identification of conditions on this street to good code enforcement. With the right follow through and intervention this street can transform from a neglected corner of the Morningside to a special place in the neighborhood. Options here include granting use of the vacant lot to one or more of the neighbors for community gardens, acquisition and demolition of the long-vacant house, and potential creation of an open space for children which takes advantage of the views from this promontory point. Together we believe that execution of the proposed improvements on the Westside combined with a focus on the specific Morningside conditions identified here will begin to change the perception of these neighborhoods and continue the process of linking them to the City’s emerging revitalized downtown.

City of Pittsfield
49
HOUSING NEEDS ANALYSIS & DEVELOPMENT RECOMMENDATIONS
APPENDICES
List of Tables and Maps Population, Employment, and Housing Trends Table 1: Population Table 2: Youth Table 3: Elderly Table 4: Household income Table 5: Poverty line Table 6: Educational attainment Table 7: Employment trends Table 8: 2008 (May) employment population by occupation Table 9: Pittsfield employment by employment category Table 10: Major Berkshire County employer Table 11: Major Pittsfield employer Table 12: Critical and emerging industries in Berkshire County, as determined by BCREB Table 13: Average working household rent and buying power Table 14: Units Table 15: Owner-occupied units Table 16: Rental units

City of Pittsfield
50
HOUSING NEEDS ANALYSIS & DEVELOPMENT RECOMMENDATIONS
Map 1: Westside neighborhood boundaries Map 3: Westside housing types Map 5: Westside distressed housing Map 7: Westside focus area Map 2: Morningside neighborhood boundaries Map 4: Morningside housing types Map 6: Morningside distressed housing Map 8: Morningside focus area Table 17: Occupied units Table 18: Distressed properties in Morningside/Westside (2Q 2009) Table 19: Directly subsidized households Table 20: Subsidized and distressed units and properties
Housing Market Analysis Table 21: PHA waiting list Table 22: Permits Table 23: Market and affordable rents
Housing Needs and Opportunities Map 7: Westside focus area Map 8: Morningside focus area
Development Recommendations Exhibit 1: Housatonic Open Space Initiative – Property acquisition Exhibit 2: Housatonic Open Space Initiative – Site plan and examples Exhibit 3: Housatonic open space and Bradford Street & bridge, sources and uses Exhibit 4: Residential Initiative – Property acquisition Exhibit 5: Residential Initiative – Sources and uses Exhibit 6: Residential initiative – Site plan and program and examples

P I T T S F I E L D
D I E T Z & C O M P A N Y A R C H I T E C T S
N
WALNUT ST
LOCUST ST
TER
RAC
E AV
E
CHESTNUT STSUM
MIT
AVE
ATLANTIC AVE TAUBERT AVEN
. PAC
IFIC
ST
S. A
TLAN
TIC
AVE
PAC
IFIC
ST
IND
IAN
ST
W. UNION ST
ON
OTA
ST
STAT
E ST
ALBR
O S
T
MER
RIA
M S
T
S O
NO
TA S
T
WEST ST
S JO
HN
ST
WEST ST
DEWEY AVE
CIRCULAR AVE
DIVISION ST
JUBILEE TER
CIRCULAR AVE
COLUMBUS AVE
SOUTHERN AVE
PROSPECT ST
RO
BBIN
S AV
E
DEW
EY A
VE
LINDEN ST
LEIDHOLD PL
DAN
IELS
AVE
BRADFORD ST
FRAN
CIS
AVE
UNION ST
CEN
TER
ST
NO
RTH
RU
P ST
SUMMER ST
CENTER ST
CENTER ST
DEPOT ST
COLLEGE D
R
GOVERNMENT DR
MC
KAY
ST
BURBANK PL
MARKET ST
LIBE
RTY
ST
SCHOOL ST
ALLE
N S
T
FERDERAL ST
FEN ST
WIL
LIS
ST
CR
OSB
Y PL
ROSTONE PL
MCLAUGHLIN PL
REN
NE
AVE
EAGLE ST
PEAR
L ST
MELVILLE ST
NO
RTH
ST
MAPLEWOOD AVE
FIR
ST S
T
HAMLIN ST
ADAM ST
N. P
EAR
L ST
LINCOLN ST
MAUD ST
ORCHARD ST
BURBANK ST
NORTH S
T
TYLER ST
KENT AVE
SEYM
OU
R ST
MAD
ISO
N P
L
HAL
L PL
HAY
ES P
L
FAU
LKN
ER P
L
MADISON AVE
DANFORTH AVE
TURNER AVE
BEEC
H S
T
PARK ST
PITT
ST
WAH
CO
NAH
ST
GILBERT ST
JOH
N S
T
MONROE ST
KIN
G S
T
HILLSIDE ST
VONNIDA AVE
PHA
PHA
DOROTHYAMESPARK
BERKSHIREMEDICALCENTER
WAHCONAH PARK
PITTPARK
TUCKERPARK
WES
T BR
ANC
H H
OU
SATO
NIC
RIV
ER
PHA
PHA PHA
PHA
PHA
Contours - 3m
Westside Neighborhood
FEMA 100yr Floodplain
Buildings
City Parks & Playgrounds
Railroad Line
WESTSIDE NEIGHBORHOOD BOUNDARIES
Feet
0 200 400 600 800 1000
LEGEND
MAP 1

P I T T S F I E L D
D I E T Z & C O M P A N Y A R C H I T E C T S
N
PARK ST
WAH
CO
NAH
ST
CAHRLES ST
CLIFF AVE
NO
RTH
ST
NORTH S
T
MYR
TLE
ST
PLEA
SUR
E AV
E
HULL AVE
STODDARD AVE
CO
UR
TLAN
D P
L
SMIT
H S
T
BURBANK ST
PIN
E ST
GLE
NW
OO
D A
VE
ORCHARD ST
MAUD ST
WHITE TER
LINCOLN ST
WEL
LIN
GTO
N A
VE
MAPLEWOOD AVEC
HER
RY
ST
MAPLE ST
WILLOW ST
SPR
ING
ST
WIN
TER
ST
FIR
ST S
T
N. P
EAR
L ST
MELVILLE ST
EAGLE ST
REN
NE
AVE
PEAR
L ST
FEDERAL STSCHOOL ST
ALLE
N S
T
WEN
DEL
L AV
E EX
T.
WIL
LIS
STPARK PL
BANK ROW
EAST ST
FENN ST
CR
OSB
Y PL
ROSTONE PL
MCLAUGHLIN PL
WALLACE PL
SEC
ON
D S
T POND ST
LAKE ST
SILVER ST
THIR
D S
T
LAKE ST
NATHAN PL
WHIPPLE ST
ESTH
ER T
ER
FORTH ST
PLEA
SAN
T ST
OAK
ST
CURTIS STKELLOGG ST
FRANCO TER
TYLERS ST
PAR
KER
ST
BRO
WN
ST
PLU
NKE
TT S
T
CU
RTI
S TE
R
FOR
EST
PL
WO
OD
LAW
N A
VE
DALTON AVE
WESTM
INSTER
ST
HAR
VARD
ST
DAR
TMO
UTH
ST
BENED
ICT R
D
SPRINGSIDE AVE
GR
OVE
ST
CHURCH ST
SOU
TH S
T
WEN
DEL
L AV
E
BAR
TLET
T AV
E
POM
ERO
Y AV
E
APPL
ETO
N A
VE
CO
PLEY
TER
GO
RD
ON
ST
ELM ST
ROOT PL
COVE ST
WEST ST
MC
KAY
ST
MARKET ST
BURBANK PL
DEPOT ST
LIBE
RTY
ST
COLUMBUS AVE
SUMMER ST
CEN
TER
ST
UNION ST
NO
RTH
RU
P ST
CEN
TER
ST
KENT AVE
SEYM
OU
R ST
MAD
ISO
N P
L
HAL
L PL
HAY
ES P
L
FAU
LKN
ER P
L
MADISON AVE
DANFORTH AVE
TURNER AVE BEEC
H S
T
PITT
ST
LINDEN ST
FRAN
CIS
AVE
ADAM ST
HAMLIN ST
SILVER LAKE
MORNINGSIDESCHOOL
SILK MILL
SPRINGSIDEPARK
BERKSHIREMEDICALCENTER
WAHCONAH PARK
EAST BRANCH HOUSATONIC RIVER
PHA
PHA
PHA
PHA
Contours - 3m
Morningside Neighborhood
FEMA 100yr Floodplain
Buildings
City Parks & Playgrounds
Railroad Line
MORNINGSIDE NEIGHBORHOOD BOUNDARIES
Feet
0 200 400 600 800 1000
LEGEND
MAP 2
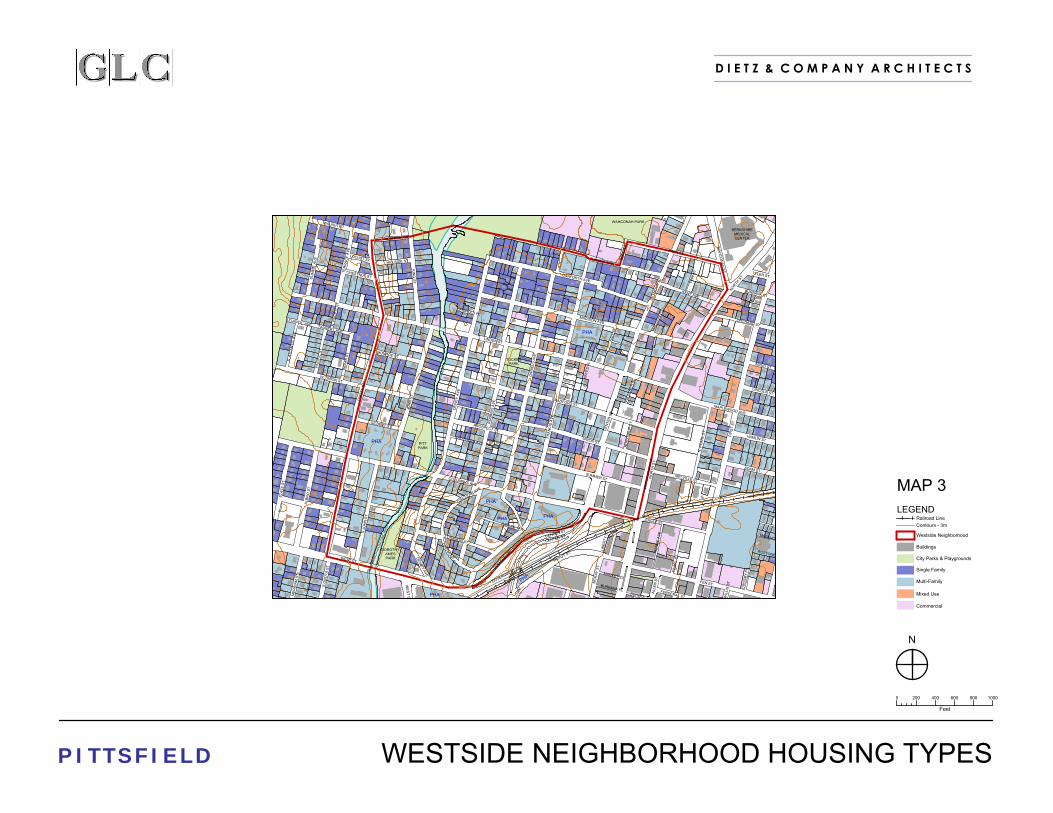
P I T T S F I E L D
D I E T Z & C O M P A N Y A R C H I T E C T S
N
WALNUT ST
LOCUST ST
TER
RAC
E AV
E
CHESTNUT STSUM
MIT
AVE
ATLANTIC AVE TAUBERT AVEN
. PAC
IFIC
ST
S. A
TLAN
TIC
AVE
PAC
IFIC
ST
IND
IAN
ST
W. UNION ST
ON
OTA
ST
STAT
E ST
ALBR
O S
T
MER
RIA
M S
T
S O
NO
TA S
T
WEST ST
S JO
HN
ST
WEST ST
DEWEY AVE
CIRCULAR AVE
DIVISION ST
JUBILEE TER
CIRCULAR AVE
COLUMBUS AVE
SOUTHERN AVE
PROSPECT ST
RO
BBIN
S AV
E
DEW
EY A
VE
LINDEN ST
LEIDHOLD PL
DAN
IELS
AVE
BRADFORD ST
FRAN
CIS
AVE
UNION ST
CEN
TER
ST
NO
RTH
RU
P ST
SUMMER ST
CENTER ST
CENTER ST
DEPOT ST
COLLEGE D
R
GOVERNMENT DR
MC
KAY
ST
BURBANK PL
MARKET ST
LIBE
RTY
ST
SCHOOL ST
ALLE
N S
T
FERDERAL ST
FEN ST
WIL
LIS
ST
CR
OSB
Y PL
ROSTONE PL
MCLAUGHLIN PL
REN
NE
AVE
EAGLE ST
PEAR
L ST
MELVILLE ST
NO
RTH
ST
MAPLEWOOD AVE
FIR
ST S
T
HAMLIN ST
ADAM ST
N. P
EAR
L ST
LINCOLN ST
MAUD ST
ORCHARD ST
BURBANK ST
NORTH S
T
TYLER ST
KENT AVE
SEYM
OU
R ST
MAD
ISO
N P
L
HAL
L PL
HAY
ES P
L
FAU
LKN
ER P
L
MADISON AVE
DANFORTH AVE
TURNER AVE
BEEC
H S
T
PARK ST
PITT
ST
WAH
CO
NAH
ST
GILBERT ST
JOH
N S
T
MONROE ST
KIN
G S
T
HILLSIDE ST
VONNIDA AVE
PHA
PHA
DOROTHYAMESPARK
BERKSHIREMEDICALCENTER
WAHCONAH PARK
PITTPARK
TUCKERPARK
WES
T BR
ANC
H H
OU
SATO
NIC
RIV
ER
PHA
PHA PHA
PHA
PHA
Contours - 3m
Westside Neighborhood
Buildings
City Parks & Playgrounds
Single Family
Multi-Family
Mixed Use
Commercial
Railroad Line
WESTSIDE NEIGHBORHOOD HOUSING TYPES
Feet
0 200 400 600 800 1000
LEGEND
MAP 3
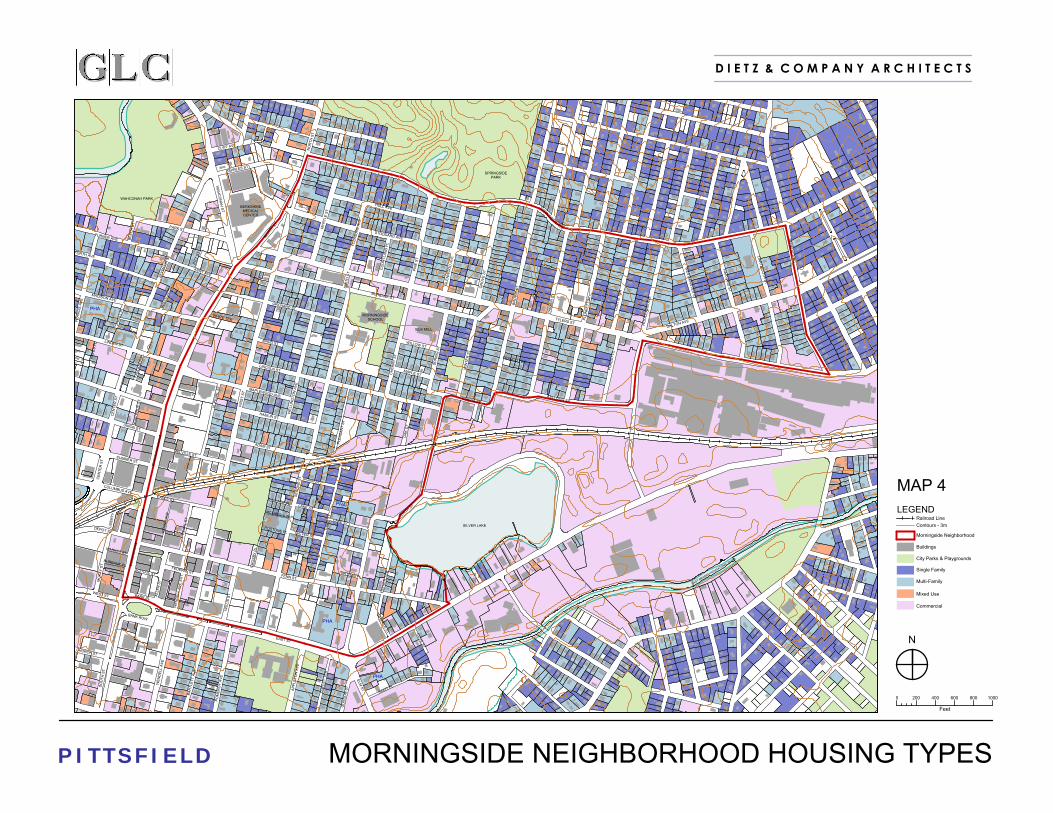
P I T T S F I E L D
D I E T Z & C O M P A N Y A R C H I T E C T S
N
PARK ST
WAH
CO
NAH
ST
CAHRLES ST
CLIFF AVE
NO
RTH
ST
NORTH S
T
MYR
TLE
ST
PLEA
SUR
E AV
E
HULL AVE
STODDARD AVE
CO
UR
TLAN
D P
L
SMIT
H S
T
BURBANK ST
PIN
E ST
GLE
NW
OO
D A
VE
ORCHARD ST
MAUD ST
WHITE TER
LINCOLN ST
WEL
LIN
GTO
N A
VE
MAPLEWOOD AVE
CH
ERR
Y ST
MAPLE ST
WILLOW ST
SPR
ING
ST
WIN
TER
ST
FIR
ST S
T
N. P
EAR
L ST
MELVILLE ST
EAGLE ST
REN
NE
AVE
PEAR
L ST
FEDERAL STSCHOOL ST
ALLE
N S
T
WEN
DEL
L AV
E EX
T.
WIL
LIS
STPARK PL
BANK ROW
EAST ST
FENN ST
CR
OSB
Y PL
ROSTONE PL
MCLAUGHLIN PL
WALLACE PL
SEC
ON
D S
T POND ST
LAKE ST
SILVER ST
THIR
D S
T
LAKE ST
NATHAN PL
WHIPPLE ST
ESTH
ER T
ER
FORTH ST
PLEA
SAN
T ST
OAK
ST
CURTIS STKELLOGG ST
FRANCO TER
TYLERS ST
PAR
KER
ST
BRO
WN
ST
PLU
NKE
TT S
T
CU
RTI
S TE
R
FOR
EST
PL
WO
OD
LAW
N A
VE
DALTON AVE
WESTM
INSTER
ST
HAR
VARD
ST
DAR
TMO
UTH
ST
BENED
ICT R
D
SPRINGSIDE AVE
GR
OVE
ST
CHURCH ST
SOU
TH S
T
WEN
DEL
L AV
E
BAR
TLET
T AV
E
POM
ERO
Y AV
E
APPL
ETO
N A
VE
CO
PLEY
TER
GO
RD
ON
ST
ELM ST
ROOT PL
COVE ST
WEST ST
MC
KAY
ST
MARKET ST
BURBANK PL
DEPOT ST
LIBE
RTY
ST
COLUMBUS AVE
SUMMER ST
CEN
TER
ST
UNION ST
NO
RTH
RU
P ST
CEN
TER
ST
KENT AVE
SEYM
OU
R ST
MAD
ISO
N P
L
HAL
L PL
HAY
ES P
L
FAU
LKN
ER P
L
MADISON AVE
DANFORTH AVE
TURNER AVE BEEC
H S
T
PITT
ST
LINDEN ST
FRAN
CIS
AVE
ADAM ST
HAMLIN ST
SILVER LAKE
MORNINGSIDESCHOOL
SILK MILL
SPRINGSIDEPARK
BERKSHIREMEDICALCENTER
WAHCONAH PARK
EAST BRANCH HOUSATONIC RIVER
PHA
PHA
PHA
PHA
Contours - 3m
Morningside Neighborhood
Buildings
City Parks & Playgrounds
Single Family
Multi-Family
Mixed Use
Commercial
Railroad Line
MORNINGSIDE NEIGHBORHOOD HOUSING TYPES
Feet
0 200 400 600 800 1000
LEGEND
MAP 4
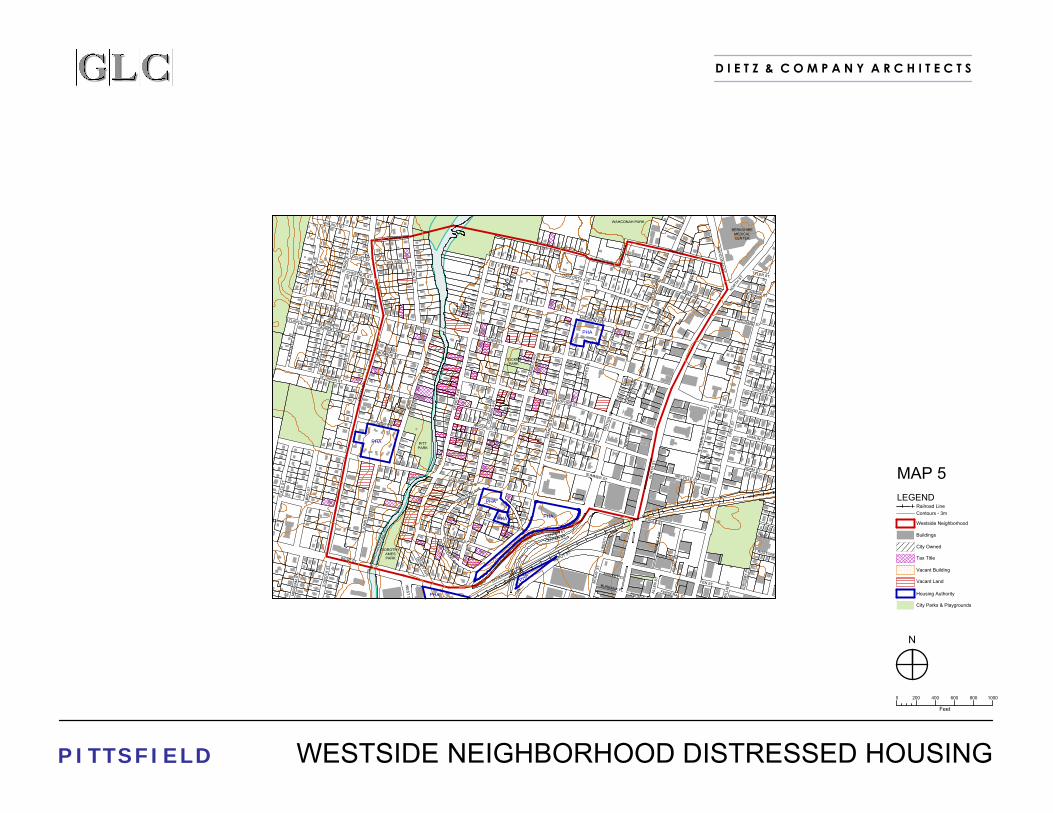
P I T T S F I E L D
D I E T Z & C O M P A N Y A R C H I T E C T S
N
WALNUT ST
LOCUST ST
TER
RAC
E AV
E
CHESTNUT STSUM
MIT
AVE
ATLANTIC AVE TAUBERT AVEN
. PAC
IFIC
ST
S. A
TLAN
TIC
AVE
PAC
IFIC
ST
IND
IAN
ST
W. UNION ST
ON
OTA
ST
STAT
E ST
ALBR
O S
T
MER
RIA
M S
T
S O
NO
TA S
T
WEST ST
S JO
HN
ST
WEST ST
DEWEY AVE
CIRCULAR AVE
DIVISION ST
JUBILEE TER
CIRCULAR AVE
COLUMBUS AVE
SOUTHERN AVE
PROSPECT ST
RO
BBIN
S AV
E
DEW
EY A
VE
LINDEN ST
LEIDHOLD PL
DAN
IELS
AVE
BRADFORD ST
FRAN
CIS
AVE
UNION ST
CEN
TER
ST
NO
RTH
RU
P ST
SUMMER ST
CENTER ST
CENTER ST
DEPOT ST
COLLEGE D
R
GOVERNMENT DR
MC
KAY
ST
BURBANK PL
MARKET ST
LIBE
RTY
ST
SCHOOL ST
ALLE
N S
T
FERDERAL ST
FEN ST
WIL
LIS
ST
CR
OSB
Y PL
ROSTONE PL
MCLAUGHLIN PL
REN
NE
AVE
EAGLE ST
PEAR
L ST
MELVILLE ST
NO
RTH
ST
MAPLEWOOD AVE
FIR
ST S
T
HAMLIN ST
ADAM ST
N. P
EAR
L ST
LINCOLN ST
MAUD ST
ORCHARD ST
BURBANK ST
NORTH S
T
TYLER ST
KENT AVE
SEYM
OU
R ST
MAD
ISO
N P
L
HAL
L PL
HAY
ES P
L
FAU
LKN
ER P
L
MADISON AVE
DANFORTH AVE
TURNER AVE
BEEC
H S
T
PARK ST
PITT
ST
WAH
CO
NAH
ST
GILBERT ST
JOH
N S
T
MONROE ST
KIN
G S
T
HILLSIDE ST
VONNIDA AVE
PHA
PHA
DOROTHYAMESPARK
BERKSHIREMEDICALCENTER
WAHCONAH PARK
PITTPARK
TUCKERPARK
WES
T BR
ANC
H H
OU
SATO
NIC
RIV
ER
PHA
PHA PHA
PHA
PHA
Contours - 3m
Westside Neighborhood
Buildings
City Owned
Tax Title
Vacant Building
Vacant Land
Housing Authority
City Parks & Playgrounds
Railroad Line
WESTSIDE NEIGHBORHOOD DISTRESSED HOUSING
Feet
0 200 400 600 800 1000
LEGEND
MAP 5

P I T T S F I E L D
D I E T Z & C O M P A N Y A R C H I T E C T S
N
PARK ST
WAH
CO
NAH
ST
CAHRLES ST
CLIFF AVE
NO
RTH
ST
NORTH S
T
MYR
TLE
ST
PLEA
SUR
E AV
E
HULL AVE
STODDARD AVE
CO
UR
TLAN
D P
L
SMIT
H S
T
BURBANK ST
PIN
E ST
GLE
NW
OO
D A
VE
ORCHARD ST
MAUD ST
WHITE TER
LINCOLN ST
WEL
LIN
GTO
N A
VE
MAPLEWOOD AVEC
HER
RY
ST
MAPLE ST
WILLOW ST
SPR
ING
ST
WIN
TER
ST
FIR
ST S
T
N. P
EAR
L ST
MELVILLE ST
EAGLE ST
REN
NE
AVE
PEAR
L ST
FEDERAL STSCHOOL ST
ALLE
N S
T
WEN
DEL
L AV
E EX
T.
WIL
LIS
STPARK PL
BANK ROW
EAST ST
FENN ST
CR
OSB
Y PL
ROSTONE PL
MCLAUGHLIN PL
WALLACE PL
SEC
ON
D S
T POND ST
LAKE ST
SILVER ST
THIR
D S
T
LAKE ST
NATHAN PL
WHIPPLE ST
ESTH
ER T
ER
FORTH ST
PLEA
SAN
T ST
OAK
ST
CURTIS STKELLOGG ST
FRANCO TER
TYLERS ST
PAR
KER
ST
BRO
WN
ST
PLU
NKE
TT S
T
CU
RTI
S TE
R
FOR
EST
PL
WO
OD
LAW
N A
VE
DALTON AVE
WESTM
INSTER
ST
HAR
VARD
ST
DAR
TMO
UTH
ST
BENED
ICT R
D
SPRINGSIDE AVE
GR
OVE
ST
CHURCH ST
SOU
TH S
T
WEN
DEL
L AV
E
BAR
TLET
T AV
E
POM
ERO
Y AV
E
APPL
ETO
N A
VE
CO
PLEY
TER
GO
RD
ON
ST
ELM ST
ROOT PL
COVE ST
WEST ST
MC
KAY
ST
MARKET ST
BURBANK PL
DEPOT ST
LIBE
RTY
ST
COLUMBUS AVE
SUMMER ST
CEN
TER
ST
UNION ST
NO
RTH
RU
P ST
CEN
TER
ST
KENT AVE
SEYM
OU
R ST
MAD
ISO
N P
L
HAL
L PL
HAY
ES P
L
FAU
LKN
ER P
L
MADISON AVE
DANFORTH AVE
TURNER AVE BEEC
H S
T
PITT
ST
LINDEN ST
FRAN
CIS
AVE
ADAM ST
HAMLIN ST
SILVER LAKE
MORNINGSIDESCHOOL
SILK MILL
SPRINGSIDEPARK
BERKSHIREMEDICALCENTER
WAHCONAH PARK
EAST BRANCH HOUSATONIC RIVER
PHA
PHA
PHA
PHA
Contours - 3m
Morningside Neighborhood
Buildings
City Owned
Tax Title
Vacant Building
Vacant Land
Housing Authority
City Parks & Playgrounds
Railroad Line
MORNINGSIDE NEIGHBORHOOD DISTRESSED HOUSING
Feet
0 200 400 600 800 1000
LEGEND
MAP 6
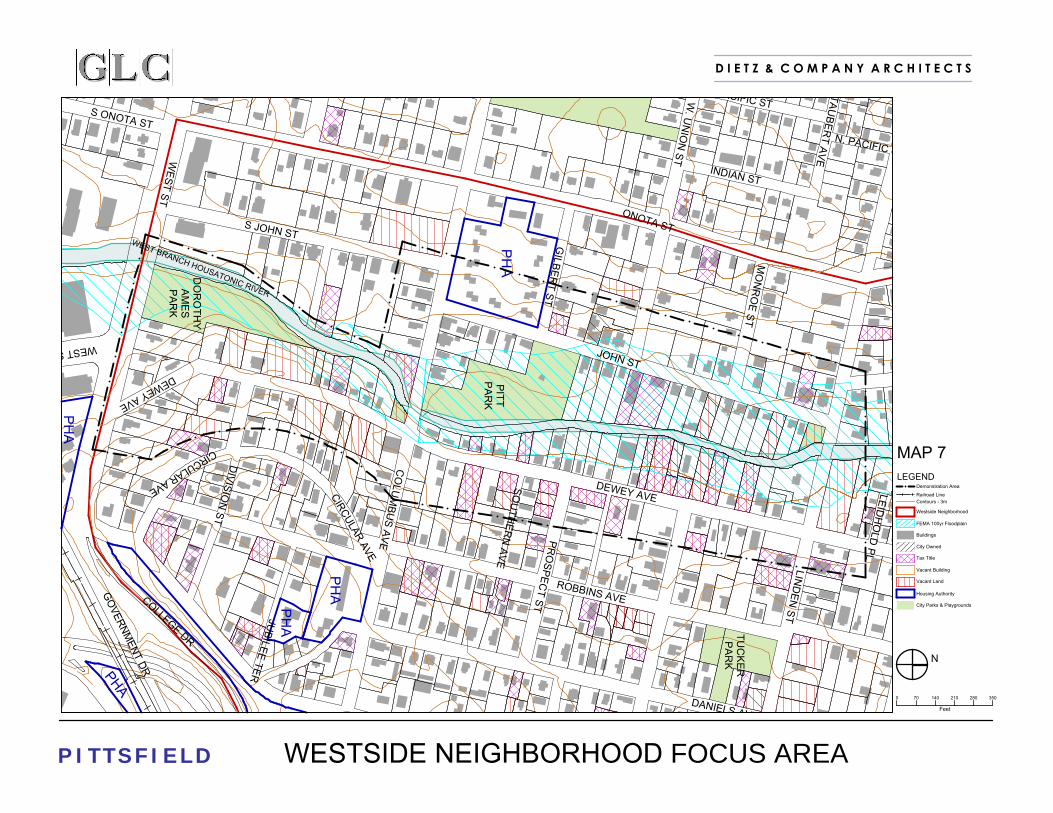
P I T T S F I E L D
D I E T Z & C O M P A N Y A R C H I T E C T S
N
TAUBER
T AVE
N. PACIFIC ST
PACIFIC ST
INDIAN ST
W. U
NIO
N ST
ONOTA ST
S ONOTA ST
WEST ST
S JOHN ST
WEST ST
DEWEY AVE
CIRCULAR AVE
DIVISIO
N ST
JUBILEE TER
CIRCULAR AVE
CO
LUM
BUS AVE
SOU
THER
N AVE
PRO
SPECT ST
ROBBINS AVE
DEWEY AVE
LIND
EN ST
LEIDH
OLD
PL
DANIELS AVE
COLLEGE DR
GO
VERNMENT DR
GILBER
T ST
JOHN ST
MO
NR
OE ST
PH
A
DO
RO
THY
AM
ES
PA
RK
PITT
PA
RK
TUC
KE
RP
AR
K
WEST BRANCH HOUSATONIC RIVER
PH
A
PH
A
PHA
PH
A
Contours - 3m
Westside Neighborhood
FEMA 100yr Floodplain
Buildings
City Owned
Tax Title
Vacant Building
Vacant Land
Housing Authority
City Parks & Playgrounds
Demonstration Area
Railroad Line
WESTSIDE NEIGHBORHOOD FOCUS AREA
Feet
0 70 140 210 280 350
LEGEND
MAP 7

P I T T S F I E L D
D I E T Z & C O M P A N Y A R C H I T E C T S
N
ORCHARD ST
MAUD ST
WHITE TER
LINCOLN ST
WEL
LIN
GTO
N A
VE
MAPLEWOOD AVE
CH
ERR
Y ST
FIR
ST S
T
N. P
EAR
L ST
MELVILLE ST
EAGLE ST
REN
NE
AVE
PEAR
L ST
MCLAUGHLIN PL
WALLACE PL
SEC
ON
D S
T POND ST
LAKE ST
THIR
D S
TLAKE ST
PLEA
SAN
T ST
LIBE
RTY
ST
COLUMBUS AVE
SUMMER ST
CEN
TER
ST
UNION ST
NO
RTH
RU
P ST
CEN
TER
ST
MAD
ISO
N P
L
HAL
L PL
FAU
LKN
ER P
L
LINDEN ST
ADAM ST
HAMLIN ST
MORNINGSIDESCHOOL
PHA
PHA
Contours - 3m
Morningside Neighborhood
FEMA 100yr Floodplain
Buildings
City Owned
Tax Title
Vacant Building
Vacant Land
Housing Authority
City Parks & Playgrounds
Demonstration Area
Railroad Line
MORNINGSIDE NEIGHBORHOOD FOCUS AREA
LEGEND
Feet
0 70 140 210 280 350
MAP 8
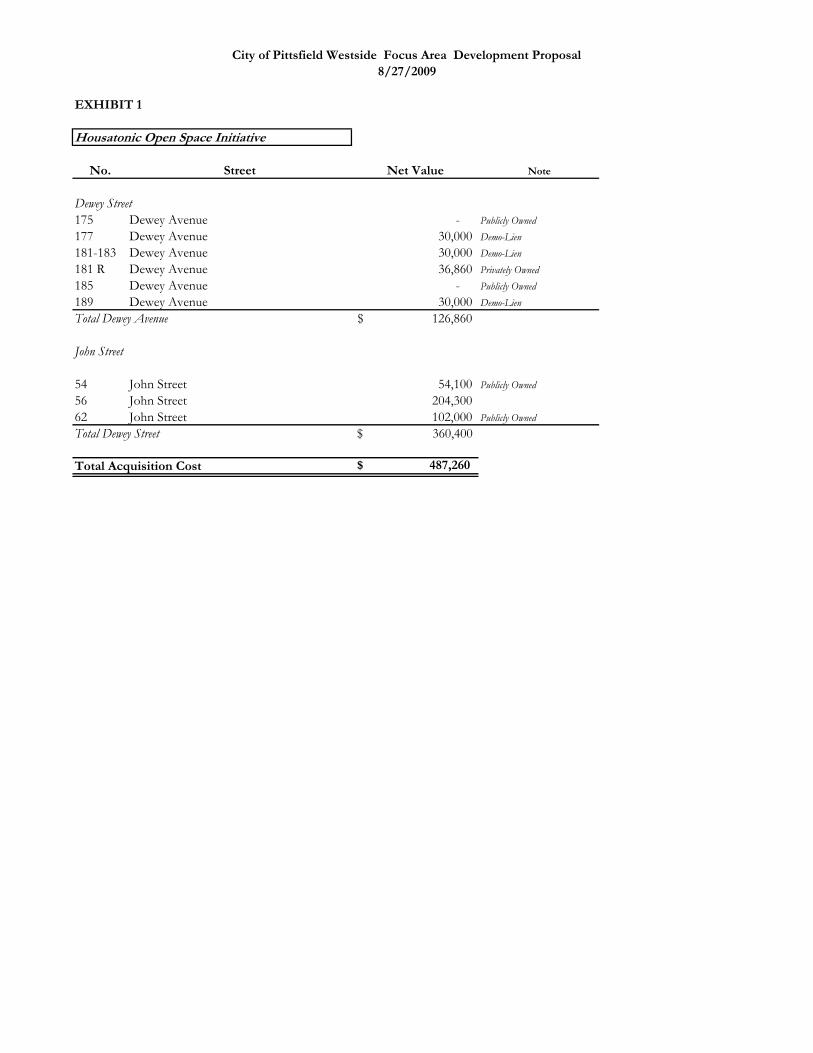
City of Pittsfield Westside Focus Area Development Proposal8/27/2009
EXHIBIT 1
Housatonic Open Space Initiative
No. Street Net Value Note
Dewey Street175 Dewey Avenue - Publicly Owned177 Dewey Avenue 30,000 Demo-Lien181-183 Dewey Avenue 30,000 Demo-Lien181 R Dewey Avenue 36,860 Privately Owned185 Dewey Avenue - Publicly Owned189 Dewey Avenue 30,000 Demo-LienTotal Dewey Avenue 126,860$
John Street
54 John Street 54,100 Publicly Owned56 John Street 204,300 62 John Street 102,000 Publicly OwnedTotal Dewey Street $ 360,400
Total Acquisition Cost $ 487,260
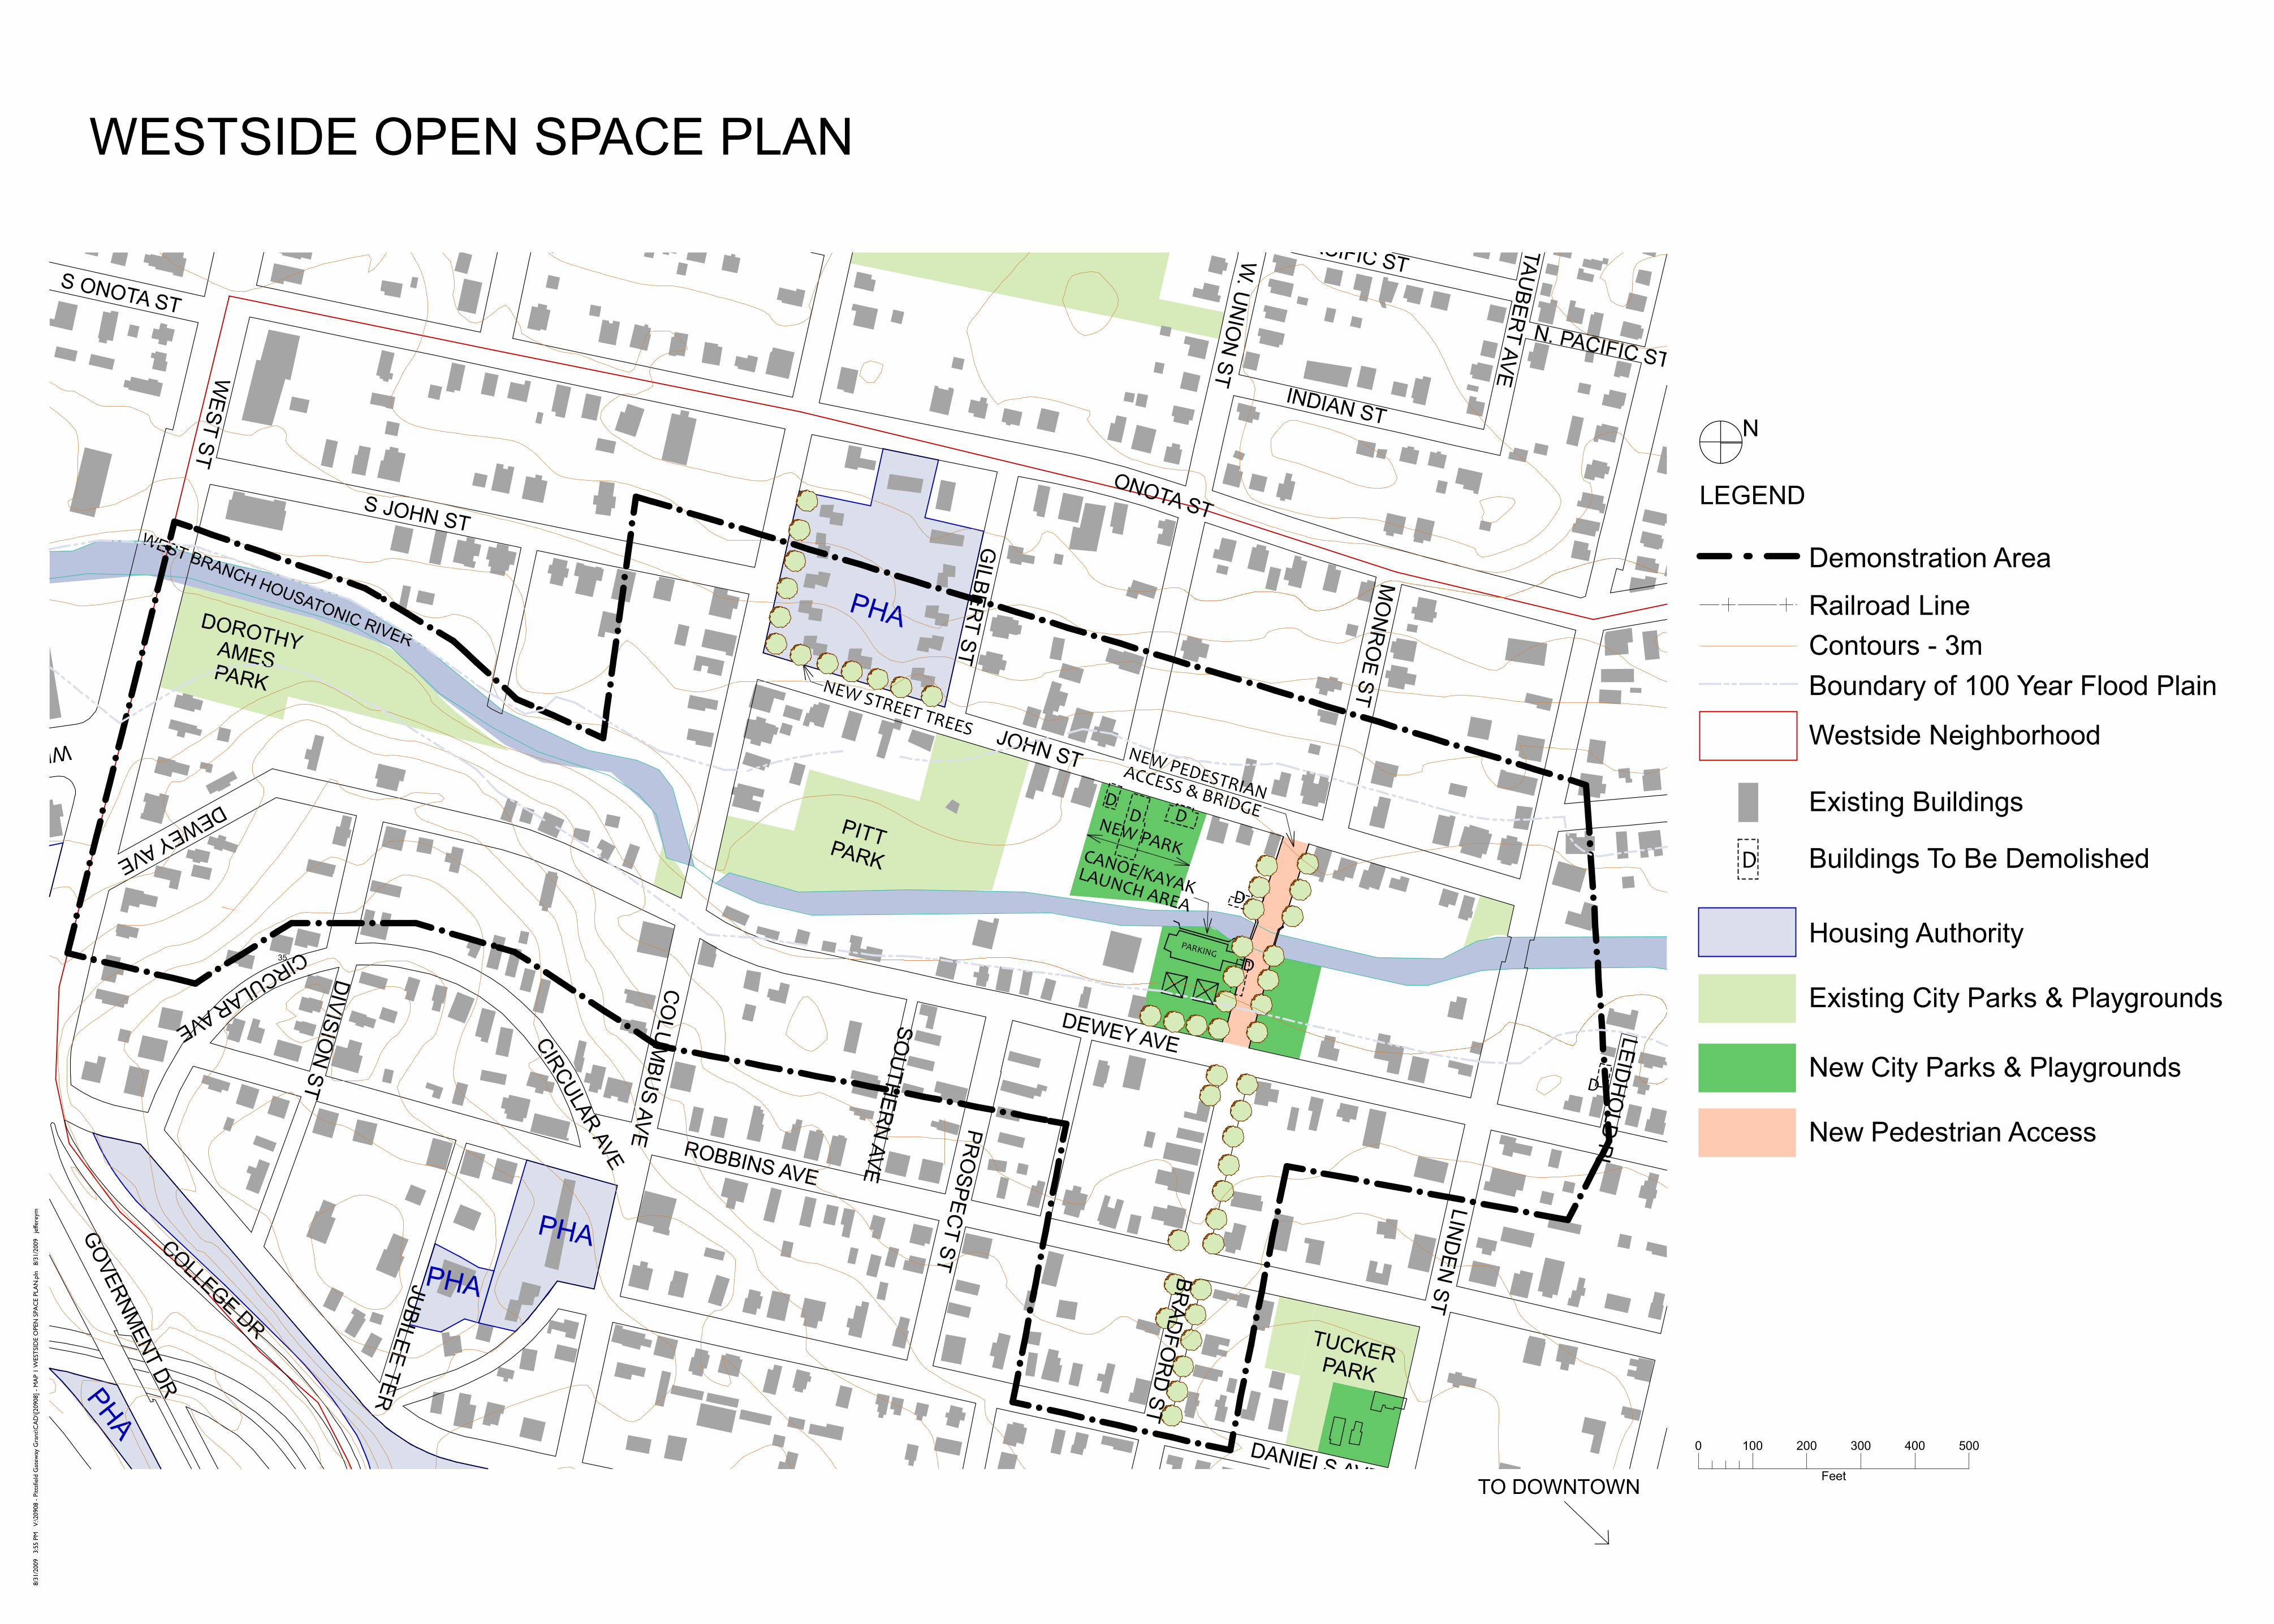
8/31
/200
9 3
:55
PM
V:\2
0908
- P
ittsfie
ld G
atew
ay G
rant
\CAD
\[20
908]
- M
AP
1 W
ESTSI
DE
OPE
N S
PAC
E PL
AN
.pln
8/
31/2
009
jef
fere
ym
N
TAU
BER
T A
VE
N. PACIFIC ST
PACIFIC ST
INDIAN ST
W. U
NIO
N S
T
ONOTA ST
S ONOTA ST
WEST S
T
S JOHN ST
WEST ST
DEWEY AVE
CIRCULAR AVE
DIV
ISIO
N S
T
JU
BIL
EE T
ER
CIR
CULAR A
VE
CO
LU
MBU
S A
VE
SO
UTH
ER
N A
VE
PR
OSPEC
T S
T
ROBBINS AVE
DEWEY AVE
LIN
DEN
ST
LEID
HO
LD
PL
DANIELS AVE
COLLEG
E DR
GO
VERNM
ENT D
R
GIL
BER
T S
T
JOHN ST
MO
NR
OE S
T
PHADOROTHYAMESPARK
PITTPARK
TUCKERPARK
WEST BRANCH HOUSATONIC RIVER
PHA
PHA
PHA
35D
CANOE/KAYAKLAUNCH AREA
NEW PEDESTRIANACCESS & BRIDGE
D
DD D
NEW PARK
NEW STREET TREES
D
PARKING
BR
AD
FO
RD
ST
Contours - 3m
Westside Neighborhood
Existing Buildings
Housing Authority
Existing City Parks & Playgrounds
Railroad Line
New City Parks & Playgrounds
Buildings To Be Demolished
Demonstration Area
D
Boundary of 100 Year Flood Plain
New Pedestrian Access
LEGEND
WESTSIDE OPEN SPACE PLAN
Feet
0 100 200 300 400 500
TO DOWNTOWN

P I T T S F I E L D Canoe/Kayak Launches
Exhibit 2: Examples

P I T T S F I E L D Pedestrian Bridges
Exhibit 2: Examples

City of Pittsfield Westside Focus Area Development Proposal8/27/2009
EXHIBIT 3
Open Space Initiative - Housatonic Open Space, Bradford Bridge & Street
USES
Acquisition & Demolition
Acquire 171-189 Dewey Street 126,860 Acquire 54, 56, 62 John Street 360,400 Demolition 98,000 Acquisition Costs 585,260$
Hard & Soft Costs
Hard CostsBradford Street Bridge (Pedestrian only) 250,000 Bradford Street Bridge Project 250,000 "Urban Wild" Landscaping 100,000 Canoe Launch 75,000 Riverside Pavilion & Program Space 250,000 Open Space Construction Cost 425,000 New Dewey Street Streetlights 84,000 New Dewey Street Trees 48,000 New Dewey Sidewalk and Curb 320,000 Dewey Street Improvements 452,000 New Bradford Street Streetlights 96,000 New Bradford Street Trees 60,000 Bradford Street Improvements 156,000 Sub-Total - Hard Costs 1,283,000 General Conditions and Fee 205,280 16% of hard costsSub-Total 1,488,280 Contingency 148,828 10% of hard costsTotal Hard Costs 1,637,108$
Soft CostsDesign & Engineering 163,711 10% of hard costsArtist Premium for Bridge 81,855 5% of hard costsProject and Construction Management 122,783 7.5% of hard costsTotal Soft Costs 368,349$
Total Uses 2,590,717$
Sources
US HUD NSP2 Funding 1,350,000 Commonwealth CDAG 750,000 Commonwealth PARC Funding 250,000 2011 City Capital/CDBG Funding 250,000 Total Sources 2,600,000$

City of Pittsfield Westside Focus Area Development Proposal8/27/2009
EXHIBIT 4
Residential Initiative
No. Street Value Notes
Existing House61 Dewey Avenue 115,000 Abandoned166 Linden Street 120,730 222 Bradford Street 73,200 Land Court88 Robbins Avenue 124,200 Land Court112 Robbins Avenue 87,100 Land CourtTotal Existing Houses 520,230$
Cost ofVacant Lots Resolution [1]231 Dewey Avenue 120,000 Privately-Owned243 Bradford Street 30,000 Demo-Lien282 Bradford Street 30,000 Demo-Lien30 Dewey Avenue 30,000 Demo-Lien72 Dewey Avenue 30,000 Land Court114 Dewey Avenue 30,000 Demo-Lien43 Prospect Street 30,000 Demo-Lien47 Prospect Street - Publicly Owned51 Prospect Street 30,000 Demo-Lien146 Robbins Avenue - Publicly Owned148 Robbins Avenue 30,000 Demo-Lien154 Robbins Avenue - Publicly OwnedTotal Vacant Lot Acquisition 240,000$
Total Residential Acquisition 760,230$
Notes
[1] This assumes that net of the demolition lien the cost to resolvethe outstanding title issues is $30,000.[2] This excludes any acquisition of foreclosed property which may be undertaken on a case by case basis.

City of Pittsfield Westside Focus Area Development Proposal8/27/2009
EXHIBIT 5
Residential Initiative - Westside Rehabilitation / New Construction
USES
Acquisition & Demolition CostsExisting Abandoned Houses (See List) 520,230 Vacant Lots (See List) 240,000 Demolition Allowance - Acquisition Costs 760,230$
Hard & Soft Costs
Hard Costs lots/housesRehabilitation Cost 250,000 5 50,000$ New Construction Subsidy [1] 1,350,000 9 150,000$ Total Hard Costs 1,600,000
Soft Costs
Property Management per lot/house lots/houses yearsInterim Property Management Allowance (10 houses) 90,000 6,000$ 5 3Interim Property Management Allowance (12 Vacant Lots) 54,000 2,000$ 9 3
Planning and GuidelinesCode Enforcement Guidelines Contract 50,000 Pattern Book for Infill and Rehabilitation 50,000 Interim Use Planning & Design Contract 100,000
Staff and Contractors years valueNSP2 Program Manager 225,000 3 75,000$ Includes benefitsConstruction and Rehab Specialist 120,000 2 60,000$ NSP2 Staff Person 180,000 3 60,000$
per propertyLegal Contract 110,000 5,000$ 22
Years ValueLandscape Contract 150,000 3 50,000$ Appraisal Contract 11,000 500$ 22Marketing Plan 45,000 Total Soft Costs 1,185,000$
Total Uses 3,545,230$
Sources
US HUD NSP2 Funding 2,300,000 Commonwealth HOME Investment Partnership Program 750,000 2011 City Capital/CDBG Funding 500,000 Total Sources 3,550,000$
Note:[1] Fewer units than lots are proposed as lots may be too small for conventional new construction.

8/31
/200
9 3
:55
PM
V:\2
0908
- P
ittsfie
ld G
atew
ay G
rant
\CAD
\[20
908]
- M
AP
2 W
ESTSI
DE
RES
IDEN
TIA
L IN
ITIA
TIV
E.pl
n 8
/31/
2009
je
ffere
ym
N
TAU
BER
T A
VE
N. PACIFIC ST
PACIFIC ST
INDIAN ST
W. U
NIO
N S
T
ONOTA ST
S ONOTA ST
WEST S
T
S JOHN ST
WEST ST
DEWEY AVE
CIRCULAR AVE
DIV
ISIO
N S
T
JU
BIL
EE T
ER
CIR
CULAR A
VE
CO
LU
MBU
S A
VE
SO
UTH
ER
N A
VE
PR
OSPEC
T S
T
ROBBINS AVE
DEWEY AVE
LIN
DEN
ST
LEID
HO
LD
PL
DANIELS AVE
COLLEG
E DR
GO
VERNM
ENT D
R
GIL
BER
T S
T
JOHN ST
MO
NR
OE S
T
PHADOROTHYAMESPARK
PITTPARK
TUCKERPARK
WEST BRANCH HOUSATONIC RIVER
PHA
PHA
R
PHA
35
R
D
D
CANOE/KAYAKLAUNCH AREA
NEW PEDESTRIANACCESS & BRIDGE
D
DD D
NEW PARK
DNEW STREET TREES
D
PARKING
BR
AD
FO
RD
ST
Contours - 3m
Westside Neighborhood
Existing Buildings
Housing Authority
Existing City Parks & Playgrounds
Railroad Line
Available Properties(See Report for Definition)
New Housing Units
New City Parks & Playgrounds
Buildings To Be Demolished
Property Aquisition Required
Demonstration Area
Erase Property Line
D
Boundary of 100 Year Flood Plain
Existing BuildingsTo Be Rehabilitated
R
New Pedestrian Access
LEGEND
WESTSIDE RESIDENTIAL INITIATIVE
Feet
0 100 200 300 400 500
TO DOWNTOWN
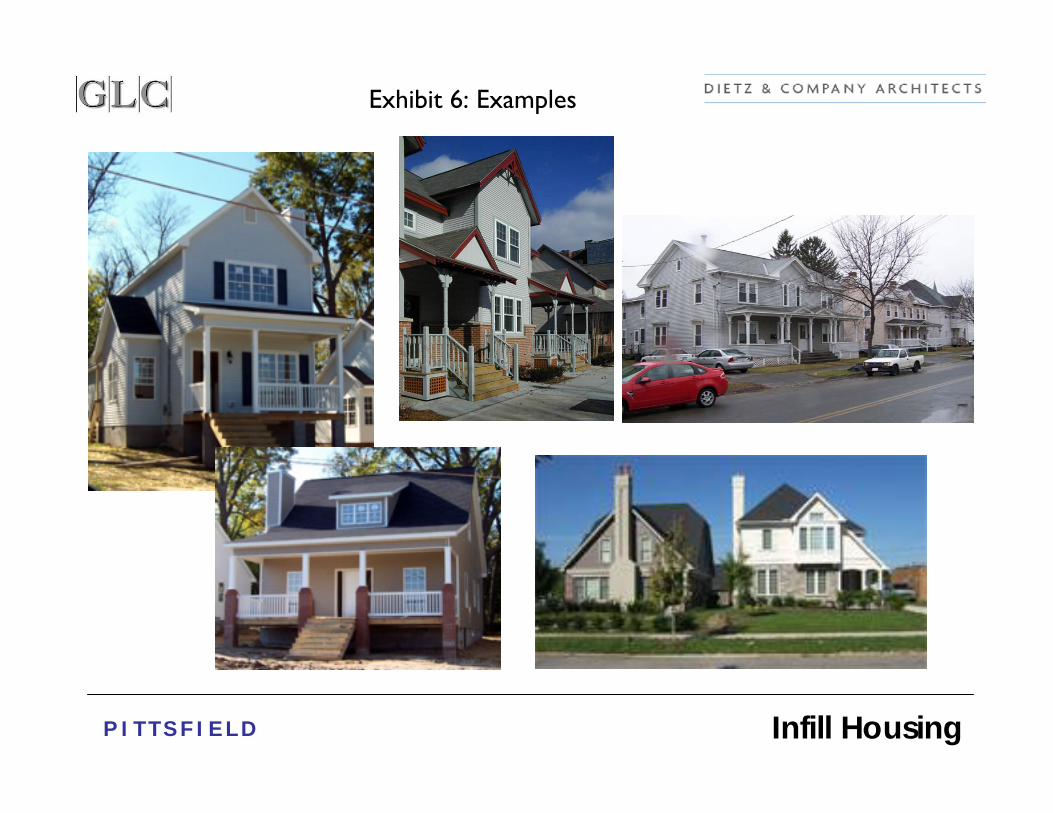
P I T T S F I E L D Infill Housing
Exhibit 6: Examples