
City of Athens Fiscal Year 2017 Proposed Budget
47
PROPOSED ANNUAL OPERATING BUDGET CITY OF ATHENS | TEXAS FISCAL YEAR 2017
-
Upload
michael-v-hannigan -
Category
News & Politics
-
view
441 -
download
0
Transcript of City of Athens Fiscal Year 2017 Proposed Budget

P R O P O S E D A N N U A L O P E R A T I N G B U D G E T
CITY OF ATHENS | TEXAS
F I S C A L Y E A R 2 0 1 7

BUDGET HIGHLIGHTS
• BUDGETED FINANCIAL RESERVE (SAVINGS) EQUAL TO 60 DAYS OPERATING EXPENSES, OR $1,790,434 FOR SECOND YEAR IN A ROW
• ADDITION OF UP TO 6 NEW POLICE OFFICERS AND ALL ACCOMPANYING EQUIPMENT AND VEHICLES NEEDED
• $200,000 TO UPGRADE THE EMERGENCY WARNING SYSTEM
• IMPROVEMENTS TO O. D. BAGGETT PARK AND CAIN PARK SOFTBALL FIELDS
• NO NEW DEBT ADDED IN THE FY 2017 BUDGET – ‘PAY AS YOU GO’
• IMPLEMENTATION OF A NEW EQUIPMENT REPLACEMENT PROGRAM

BUDGET HIGHLIGHTS CONTINUED
• KEY FLEET REPLACEMENTS ACROSS THE ORGANIZATION INCLUDING A NEW FIREBRUSH TRUCK
• AGGRESSIVE STRATEGY FOR CAPITAL IMPROVEMENTS IN WATER AND WASTEWATER TO ADDRESS 33+ STATE VIOLATIONS (TCEQ) STEMMING BACK 6+ YEARS
• ADDITION OF NEW, CRUCIAL POSITIONS IN SEVERAL DEPARTMENTS INCLUDING WASTEWATER, MUNICIPAL COURT, UTILITY BILLING, INFORMATION TECHNOLOGY AND FACILITIES MAINTENANCE
• ADDITIONAL FUNDING FOR HENDERSON COUNTY LIBRARY
• SIGNIFICANT STREET MAINTENANCE PROGRAM FOR THE SECOND YEAR
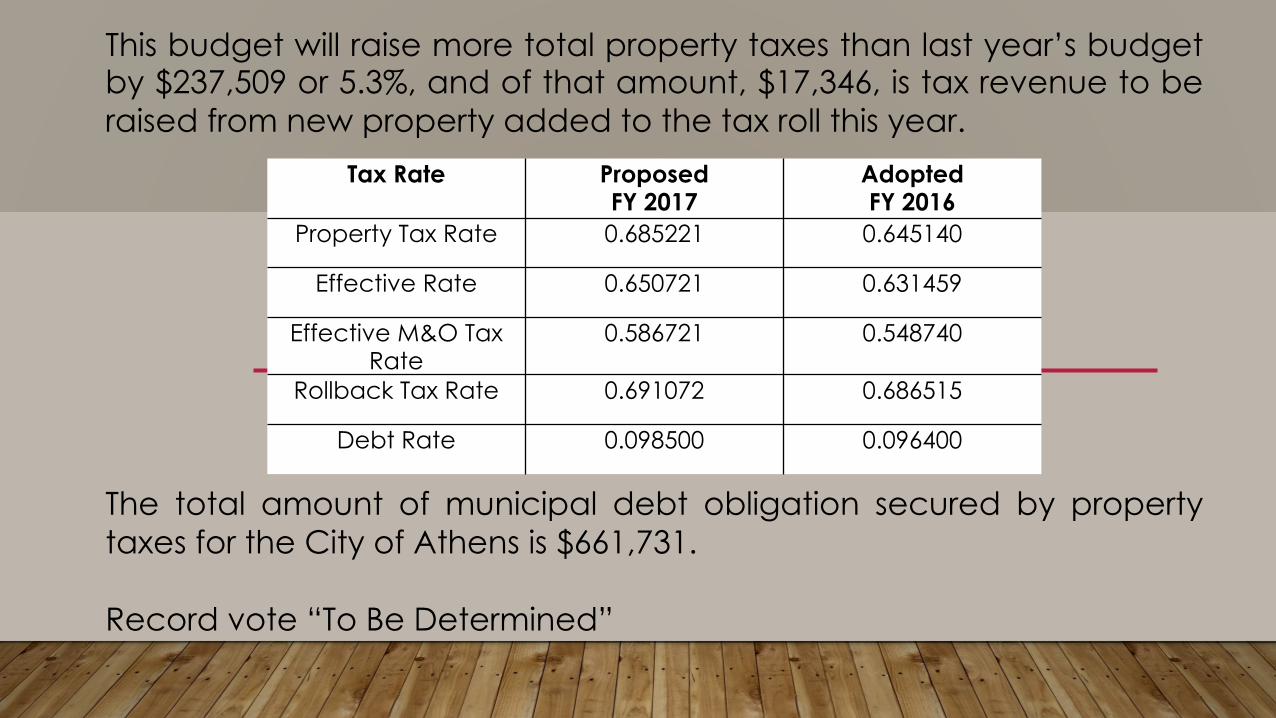
This budget will raise more total property taxes than last year’s budgetby $237,509 or 5.3%, and of that amount, $17,346, is tax revenue to beraised from new property added to the tax roll this year.
The total amount of municipal debt obligation secured by propertytaxes for the City of Athens is $661,731.
Record vote “To Be Determined”
Tax Rate Proposed FY 2017
Adopted FY 2016
Property Tax Rate 0.685221 0.645140
Effective Rate 0.650721 0.631459
Effective M&O Tax Rate
0.586721 0.548740
Rollback Tax Rate 0.691072 0.686515
Debt Rate 0.098500 0.096400

TAX RATE COMPARISON
Taxable Value
FY 2016 Tax Rate
Estimated Tax
Taxable Value
FY 2017 Tax Rate
Estimated Tax
Annual Tax Impact
Monthly Tax Impact
$60,000.00 0.64514 $387 $60,000.00 0.685221 $411.13 $24 $2.00
$80,000.00 0.64514 $516 $80,000.00 0.685221 $548.18 $32 $2.67
$100,000.00 0.64514 $645 $100,000.00 0.685221 $685.22 $40 $3.34
$125,000.00 0.64514 $806 $125,000.00 0.685221 $856.53 $50 $4.18
$150,000.00 0.64514 $968 $150,000.00 0.685221 $1,027.83 $60 $5.01
$175,000.00 0.64514 $1,129 $175,000.00 0.685221 $1,199.14 $70 $5.85

GENERAL FUND REVENUES
- History - - Current Year - - Proposed Budget -FY 2014 Actual
FY 2015 Actual
FY 2016 Adopted Budget
FY 2016 Current
FY 2016 YTD Actual
FY 2016 Projected EOY
FY 2017 Proposed Budget
Ad Valorem/Other Taxes 7,498,399 7,604,004 7,889,650 7,889,650 7,098,042 7,919,157 8,086,923
Franchise 939,027 933,540 925,419 925,419 825,188 925,000 926,819 Court/Public Safety 540,636 376,954 217,672 217,672 188,231 222,522 223,778
License/Permits 28,536 35,602 32,100 32,100 69,546 36,226 49,454 Other Operating
Revenues - - 25 25 - - 15 Intragovernmental 980,607 650,000 875,000 875,000 660,000 875,000 955,000
Reimbursing Revenue 47,550 40,550 40,550 40,550 14,667 14,667 44,667
Non-Operating 134,124 52,957 17,500 17,500 211,822 218,185 60,800 Other Financing
Sources 41,940 72,076 33,000 33,000 39,957 250,906 43,000 Operating Transfers 11,365 215,249 221,000 221,000 224,160 11,660 10,000
Total Categories 10,222,184 9,980,932 10,251,916 10,251,916 9,331,613 10,473,323 10,400,456

10 | CITY MANAGER’S OFFICE
- History - - Current Year -- Proposed
Budget -
Expenditures by Category
FY 2014 Actual
FY 2015 Actual
FY 2016 Adopted Budget
FY 2016 Current
FY 2016 YTD
Actual
FY 2016 Projected
EOY
FY 2017 Proposed
Budget Personnel
Services 211,767 461,944 186,905 191,038 157,044 191,538 194,055Supplies 224 4,199 3,150 3,150 1,192 5,726 4,425
Contractual Services 5,198 5,074 13,240 15,640 5,335 11,103 15,850
Capital Outlay 2,600 Total Categories 217,189 471,217 203,295 209,828 163,570 208,367 216,930

11 | LEGAL
- History - - Current Year -- Proposed
Budget -
Expenditures by Category
FY 2014 Actual
FY 2015 Actual
FY 2016 Adopted
Budget
FY 2016 Current
FY 2016 YTD
Actual
FY 2016 Projected
EOY
FY 2017 Proposed
Budget Supplies 26 37 25 25 24 - 50
Contractual Services 373,439 79,618 101,500 101,500 70,753 85,758 95,300
Total Categories 373,465 79,655 101,525 101,525 70,777 85,758 95,350

12 | HUMAN RESOURCES
+ Added one (1) new position in FY 2016: Human Resources Coordinator; Increased Employee Engagement Programs
- History - - Current Year -- Proposed
Budget -
Expenditures by Category
FY 2014 Actual
FY 2015 Actual
FY 2016 Adopted Budget
FY 2016 Current
FY 2016 YTD
Actual
FY 2016 Projected
EOY
FY 2017 Proposed
Budget Personnel
Services 125,760 125,339 127,253 127,253 62,288 102,380 165,552 Supplies 4,581 4,578 7,000 7,000 7,201 8,288 8,250
Contractual Services 13,576 15,016 21,850 21,850 67,123 65,768 23,450
Total Categories 143,917 144,933 156,103 156,103 136,613 176,436 197,252

14 | FINANCE
- History - - Current Year -- Proposed
Budget -
Expenditures by Category
FY 2014 Actual
FY 2015 Actual
FY 2016 Adopted Budget
FY 2016 Current
FY 2016 YTD
Actual
FY 2016 Projected
EOY
FY 2017 Proposed
Budget Personnel
Services 216,030 221,614 223,985 223,985 139,968 181,395 185,747 Supplies 6,820 11,198 8,700 10,200 7,577 7,950 8,900
Contractual Services 47,670 46,830 52,292 50,792 71,633 71,415 60,700
Capital Outlay 11,000 11,000 10,807 10,807 5,500 Total Categories 270,520 279,642 295,977 295,977 229,985 271,567 260,847

15 | MAYOR/COUNCIL
- History - - Current Year -- Proposed
Budget -
Expenditures by Category
FY 2014 Actual
FY 2015 Actual
FY 2016 Adopted Budget
FY 2016 Current
FY 2016 YTD
Actual
FY 2016 Projected
EOY
FY 2017 Proposed
Budget Supplies 396 268 150 150 153 154 150
Contractual Services 35,523 47,005 55,219 55,219 37,305 46,924 46,100
Total Categories 35,919 47,273 55,369 55,369 37,458 47,078 46,250
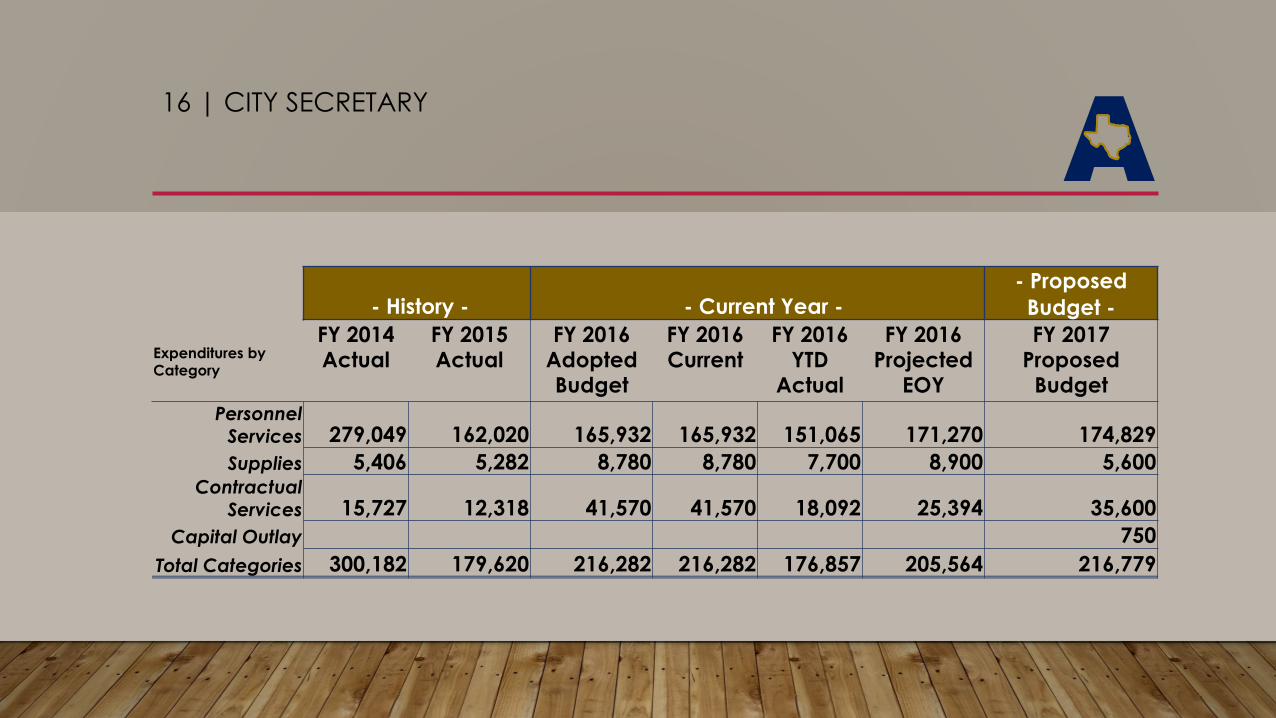
16 | CITY SECRETARY
- History - - Current Year -- Proposed
Budget -
Expenditures by Category
FY 2014 Actual
FY 2015 Actual
FY 2016 Adopted Budget
FY 2016 Current
FY 2016 YTD
Actual
FY 2016 Projected
EOY
FY 2017 Proposed
Budget Personnel
Services 279,049 162,020 165,932 165,932 151,065 171,270 174,829 Supplies 5,406 5,282 8,780 8,780 7,700 8,900 5,600
Contractual Services 15,727 12,318 41,570 41,570 18,092 25,394 35,600
Capital Outlay 750 Total Categories 300,182 179,620 216,282 216,282 176,857 205,564 216,779

17 | FACILITIES
- History - - Current Year -- Proposed
Budget -
Expenditures by Category
FY 2014 Actual
FY 2015 Actual
FY 2016 Adopted Budget
FY 2016 Current
FY 2016 YTD
Actual
FY 2016 Projected
EOY
FY 2017 Proposed
Budget Personnel
Services 10 -Supplies 11,218 11,043 8,500 8,500 5,826 8,012 9,500
Contractual Services 149,873 103,054 230,225 230,225 138,138 213,575 103,800
Capital Outlay 25,660 16,570 69,500 Total Categories 161,101 139,757 238,725 238,725 143,967 238,157 182,800

20 | COMMUNITY DEVELOPMENT
- History - - Current Year -- Proposed
Budget -
Expenditures by Category
FY 2014 Actual
FY 2015 Actual
FY 2016 Adopted Budget
FY 2016 Current
FY 2016 YTD
Actual
FY 2016 Projected
EOY
FY 2017 Proposed
Budget Personnel
Services - - 86,211 86,211 55,957 80,200 88,637 Supplies 3,000 3,000 3,072 3,397 2,000
Contractual Services 147,012 152,000 177,900 95,500 72,670 97,066 3,800
Capital Outlay 200,000 200,000 Total Categories 147,012 152,000 267,111 384,711 131,699 380,663 94,437

22 | CODE ENFORCEMENT
+ Combined with Animal Control in FY 2016; Stand-alone Department in FY 2017; Addition of Code Enforcement Officer
- History - - Current Year -- Proposed
Budget -
Expenditures by Category
FY 2014 Actual
FY 2015 Actual
FY 2016 Adopted Budget
FY 2016 Current
FY 2016 YTD
Actual
FY 2016 Projected
EOY
FY 2017 Proposed
Budget Personnel
Services 186,370 195,215 112,701 Supplies 25,271 20,314 6,400
Contractual Services 68,678 49,733 9,330
Capital Outlay 19,440 -Total Categories 280,319 284,702 - - - - 128,431

24 | PLANNING & DEVELOPMENT
+ Restructuring and expansion of role in FY 2017; Relocation of offices to EOC; Phase I of Mapping project
- History - - Current Year -- Proposed
Budget -
Expenditures by Category
FY 2014 Actual
FY 2015 Actual
FY 2016 Adopted Budget
FY 2016 Current
FY 2016 YTD
Actual
FY 2016 Projected
EOY
FY 2017 Proposed
Budget Personnel
Services 186,520 187,527 224,014 224,014 100,672 175,407 132,825 Supplies 4,735 2,393 5,573 5,573 8,326 11,193 7,225
Contractual Services 5,143 4,766 11,810 11,810 63,538 73,188 154,300
Capital Outlay 24,600 8,000 Total Categories 196,398 194,686 241,397 241,397 172,537 284,388 302,350

32 | STREETS & DRAINAGE
+ Continued Street Maintenance Program; Wood St. Project; 18” Asphalt Planer for Compact Track Loader; Equipment trailer; LeeBoy tack wagon; ½ Ton Crew Cab (100k miles +)
- History - - Current Year -- Proposed Budget -
Expenditures by Category
FY 2014 Actual
FY 2015 Actual
FY 2016 Adopted Budget
FY 2016 Current
FY 2016 YTD Actual
FY 2016 Projected
EOY
FY 2017 Proposed Budget
Personnel Services 435,041 441,109 469,617 469,617 367,589 468,998 471,510 Supplies 137,983 138,750 151,100 148,672 85,158 143,650 145,100
Contractual Services 402,281 235,920 210,300 210,300 161,293 216,700 205,900
Capital Outlay 159,484 209,668 506,500 508,928 162,069 505,928 577,000 Total Categories 1,134,789 1,025,447 1,337,517 1,337,517 776,118 1,335,276 1,399,510

34 | PARKS, RECREATION & CULTURE
+ North Athens Park improvements; Cain Center softball field improvements; SCAG mower; ½-time Facilities Maintenance Technician; Break room; ½ Ton truck (replaces 2000 model)
- History - - Current Year -- Proposed Budget -
Expenditures by Category
FY 2014 Actual
FY 2015 Actual
FY 2016 Adopted Budget
FY 2016 Current
FY 2016 YTD
Actual
FY 2016 Projected
EOY
FY 2017 Proposed Budget
Personnel Services 258,424 246,514 406,424 406,424 305,003 407,290 449,103Supplies 38,756 33,261 49,415 49,415 28,725 46,029 47,250
Contractual Services 61,052 58,974 86,510 86,510 67,028 78,711 81,550
Capital Outlay 9,975 551,393 585,393 448,531 606,470 182,000 Total Categories 358,232 348,724 1,093,742 1,127,742 849,287 1,039,500 759,903

38 | FLEET MAINTENANCE
+ Energy-efficient LED shop lighting; Engine scan tool
- History - - Current Year -- Proposed Budget -
Expenditures by Category
FY 2014 Actual
FY 2015 Actual
FY 2016 Adopted Budget
FY 2016 Current
FY 2016 YTD
Actual
FY 2016 Projected
EOY
FY 2017 Proposed Budget
Personnel Services 181,113 146,958 157,085 157,085 128,458 157,142 164,302 Supplies 9,113 12,724 14,464 14,414 11,276 13,920 15,713
Contractual Services 14,965 8,159 11,076 12,976 8,841 12,975 13,000
Capital Outlay 25,000 23,150 23,150 23,150 16,000 Total Categories 205,191 167,841 207,625 207,625 171,725 207,187 209,015

46 | FIRE & RESCUE
+ Pay Equity, Phase II; Apparatus Operator Assignment Pay; Uniforms and Bunker Gear; Physical Fitness Assessments; Brush Truck
- History - - Current Year -- Proposed Budget -
Expenditures by Category
FY 2014 Actual
FY 2015 Actual
FY 2016 Adopted Budget
FY 2016 Current
FY 2016 YTD Actual
FY 2016 Projected
EOY
FY 2017 Proposed Budget
Personnel Services 2,225,962 2,246,353 2,356,045 2,356,045 1,952,981 2,317,215 2,364,715 Supplies 75,952 47,378 79,585 79,585 58,103 75,017 79,150
Contractual Services 95,884 104,335 106,029 106,029 100,756 128,425 103,775
Capital Outlay 35,414 57,000 57,000 13,562 57,000 293,000 Total Categories 2,397,798 2,433,480 2,598,659 2,598,659 2,125,402 2,577,657 2,840,640
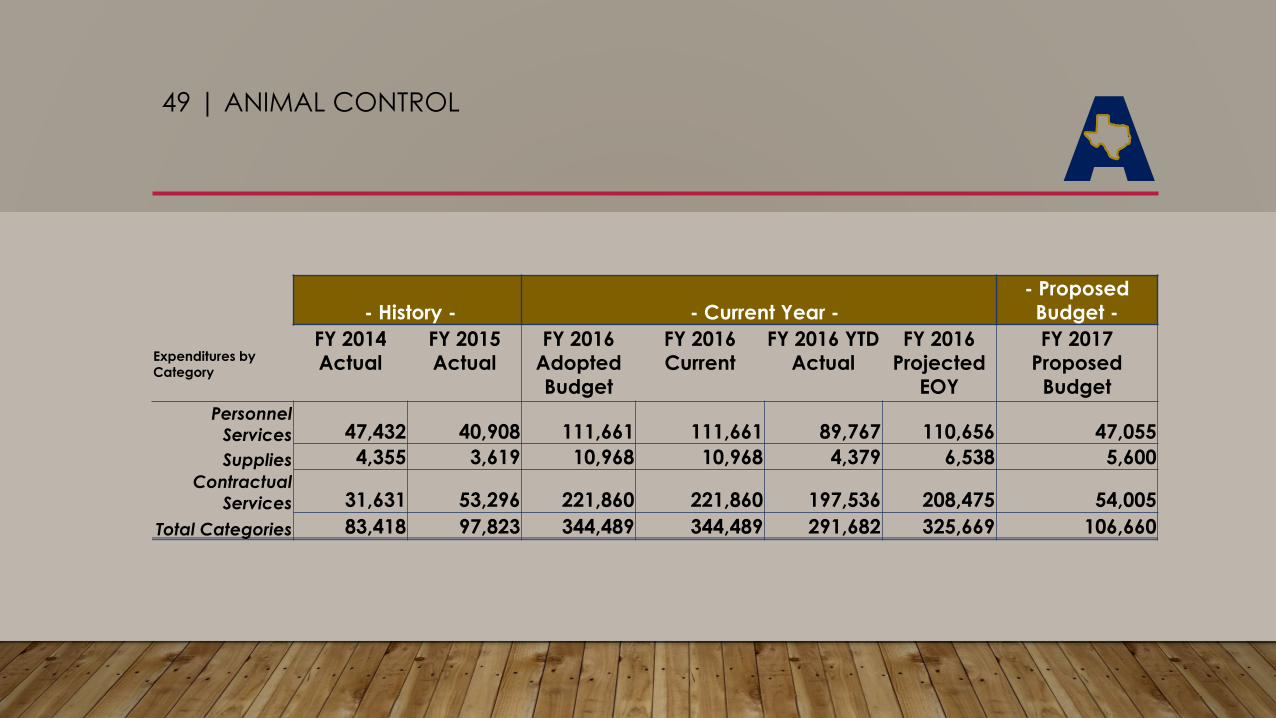
49 | ANIMAL CONTROL
- History - - Current Year -- Proposed Budget -
Expenditures by Category
FY 2014 Actual
FY 2015 Actual
FY 2016 Adopted Budget
FY 2016 Current
FY 2016 YTD Actual
FY 2016 Projected
EOY
FY 2017 Proposed Budget
Personnel Services 47,432 40,908 111,661 111,661 89,767 110,656 47,055 Supplies 4,355 3,619 10,968 10,968 4,379 6,538 5,600
Contractual Services 31,631 53,296 221,860 221,860 197,536 208,475 54,005
Total Categories 83,418 97,823 344,489 344,489 291,682 325,669 106,660

50 | MUNICIPAL COURT
+ Municipal Court Clerk; Municipal Court Audit FY 2016
- History - - Current Year -- Proposed Budget -
Expenditures by Category
FY 2014 Actual
FY 2015 Actual
FY 2016 Adopted Budget
FY 2016 Current
FY 2016 YTD Actual
FY 2016 Projected
EOY
FY 2017 Proposed Budget
Personnel Services 90,425 90,412 92,070 92,070 77,378 92,503 141,383 Supplies 4,754 4,379 4,350 4,350 3,300 3,840 4,600
Contractual Services 11,184 12,561 17,535 17,535 12,409 17,235 18,015
Total Categories 106,363 107,352 113,955 113,955 93,086 113,578 163,998

51 | POLICE ADMINISTRATION
- History - - Current Year -- Proposed Budget -
Expenditures by Category
FY 2014 Actual
FY 2015 Actual
FY 2016 Adopted Budget
FY 2016 Current
FY 2016 YTD Actual
FY 2016 Projected
EOY
FY 2017 Proposed Budget
Personnel Services 275,632 268,966 272,831 272,831 226,294 275,228 276,739 Supplies 5,716 5,214 7,321 7,321 2,344 4,861 7,000
Contractual Services 6,464 4,352 8,930 8,930 7,052 8,710 9,350
Total Categories 287,812 278,532 289,082 289,082 235,691 288,799 293,089

52 | POLICE – CRIMINAL INVESTIGATIONS DIVISION
+ Investigator vehicle (replaces 2005 model)
- History - - Current Year -- Proposed Budget -
Expenditures by Category
FY 2014 Actual
FY 2015 Actual
FY 2016 Adopted Budget
FY 2016 Current
FY 2016 YTD Actual
FY 2016 Projected
EOY
FY 2017 Proposed Budget
Personnel Services 400,175 403,634 472,994 472,994 383,258 467,820 436,912Supplies 12,661 16,009 19,284 19,284 3,670 10,200 18,450
Contractual Services 16,280 9,604 13,350 13,350 6,767 9,421 18,350
Capital Outlay 24,488 20,000 20,000 18,979 18,988 21,000 Total Categories 429,116 453,735 525,628 525,628 412,687 506,429 494,712

53 | POLICE – PATROL DIVISION
- History - - Current Year -- Proposed Budget -
Expenditures by Category
FY 2014 Actual
FY 2015 Actual
FY 2016 Adopted Budget
FY 2016 Current
FY 2016 YTD Actual
FY 2016 Projected
EOY
FY 2017 Proposed Budget
Personnel Services 1,346,336 1,410,918 1,563,690 1,563,690 1,249,387 1,557,731 1,704,663Supplies 72,623 117,110 131,890 131,890 67,804 101,750 90,329
Contractual Services 22,353 16,655 22,000 22,000 9,506 14,400 214,584
Capital Outlay 136,400 159,200 159,200 160,043 160,044 46,350Operating
Transfers 5,980 Total Categories 1,441,312 1,681,083 1,876,780 1,876,780 1,486,740 1,833,925 2,055,926
+ 6 new Police Officers and accompanying equipment; 5 new vehicles

54 | POLICE – SUPPORT SERVICES
- History - - Current Year -- Proposed Budget -
Expenditures by Category
FY 2014 Actual
FY 2015 Actual
FY 2016 Adopted Budget
FY 2016 Current
FY 2016 YTD Actual
FY 2016 Projected
EOY
FY 2017 Proposed Budget
Personnel Services 509,454 551,571 644,982 644,982 458,841 640,560 586,740Supplies 21,945 16,695 23,950 23,950 11,637 17,600 23,400
Contractual Services 70,325 73,084 88,063 88,063 42,545 64,237 89,872
Capital Outlay 40,025 10,000 Total Categories 641,749 641,350 756,995 756,995 513,024 722,397 710,012

55 | NON-DEPARTMENTAL
- History - - Current Year -- Proposed Budget -
Expenditures by Category
FY 2014 Actual
FY 2015 Actual
FY 2016 Adopted Budget
FY 2016 Current
FY 2016 YTD Actual
FY 2016 Projected
EOY
FY 2017 Proposed Budget
Personnel Services 22,167 Supplies 6,107 2,266 2,338 2,338 558 558 2,338
Contractual Services 158,194 186,452 232,630 243,630 199,858 250,075 531,161
Capital Outlay 7,200 Total Categories 164,301 188,718 234,968 253,168 200,416 250,075 555,666
+ 57,000 in Aid to Other Organizations; 2,800 for Chamber of Commerce; 12,000 for Henderson County Library; Cain Center thru Dec.; $15,000 for Keep Athens Beautiful; $4,000 for Other; $22,167 Retirement Insurance Benefits for previous years employees; $250,000 Equipment Replacement Program

GENERAL FUND REVENUES/EXPENDITURES SUMMARY
- History - - Current Year - - Proposed Budget -FY 2014 Actual
FY 2015 Actual
FY 2016 Adopted Budget
FY 2016 Current
FY 2016 YTD Actual
FY 2016 Projected EOY
FY 2017 Proposed Budget
TOTAL REVENUES 10,222,184 9,980,933 10,251,916 10,251,916 9,331,617 10,473,323 10,400,456TOTAL EXPENDITURES 9,382,081 9,397,571 11,155,224 11,331,557 8,419,318 11,099,028 11,330,557
Excess Revenues Over (Under) Expenditures 840,103 583,363 (903,308) (1,079,641) 912,312 (625,705) (930,101)
BEGINNING FUND BALANCE 2,384,625 2,384,625 2,384,625 2,384,625 1,758,920
PROJECTED ENDING FUND BALANCE 1,481,317 1,304,984 3,296,937 1,758,920 828,819

60 DAYS OPERATING (NON-CAPITAL ITEMS)
- Current Year - - Proposed Budget -FY 2016 Adopted
BudgetFY 2016 Current
FY 2016 YTD Actual
FY 2016 Projected EOY
FY 2017 Proposed Budget
FinancialReserve 1,833,735 1,833,735 1,833,735 1,833,735 1,790,434Transfer to FY 2017 43,300
GENERAL FUND BUDGETED FINANCIAL RESERVE
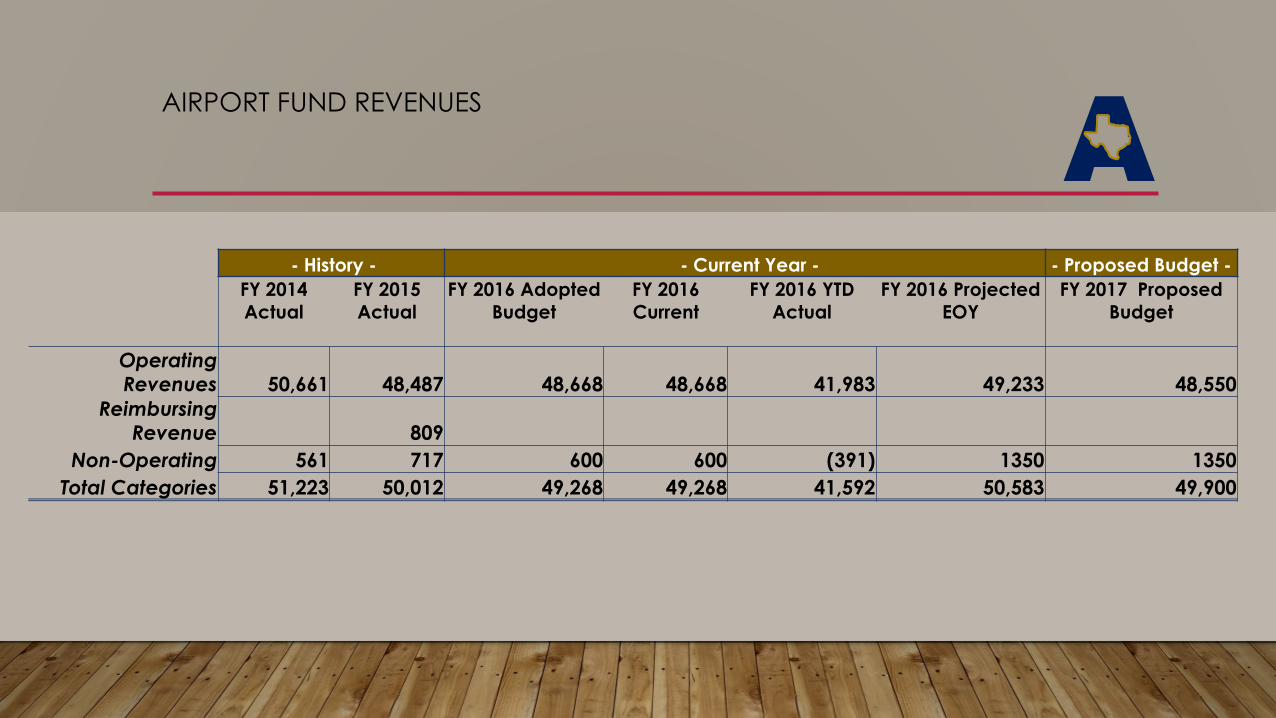
AIRPORT FUND REVENUES
- History - - Current Year - - Proposed Budget -FY 2014 Actual
FY 2015 Actual
FY 2016 Adopted Budget
FY 2016 Current
FY 2016 YTD Actual
FY 2016 Projected EOY
FY 2017 Proposed Budget
Operating Revenues 50,661 48,487 48,668 48,668 41,983 49,233 48,550
Reimbursing Revenue 809
Non-Operating 561 717 600 600 (391) 1350 1350Total Categories 51,223 50,012 49,268 49,268 41,592 50,583 49,900

36 | AIRPORT EXPENDITURES
+ Tree Abatement completed in FY 2016
- History - - Current Year -- Proposed Budget -
Expenditures by Category
FY 2014 Actual
FY 2015 Actual
FY 2016 Adopted Budget
FY 2016 Current
FY 2016 YTD Actual
FY 2016 Projected
EOY
FY 2017 Proposed Budget
Supplies 2,327 1,133 3,900 2,150 1,797 2,740 2,020 Contractual Services 6,417 6,132 9,817 11,567 10,730 13,380 11,910 Capital OutlayOperating Transfers 6,027 10,290 80,000 80,000 41,000 80,000 35,000 Total Categories 14,771 17,555 93,717 93,717 53,526 96,120 48,930

AIRPORT FUND REVENUES/EXPENDITURES SUMMARY
- History - - Current Year - - Proposed Budget -FY 2014 Actual
FY 2015 Actual
FY 2016 Adopted Budget
FY 2016 Current
FY 2016 YTD Actual
FY 2016 Projected EOY
FY 2017 Proposed Budget
TOTAL REVENUES 51,223 50,012 49,268 49,268 41,592 50,583 49,900TOTAL EXPENDITURES 14,771 17,555 93,717 93,717 53,287 96,120 48,930
Excess Revenues Over (Under) Expenditures 36,452 32,457 (44,449) (44,449) (11,694) (45,537) 970
BEGINNING FUND BALANCE 237,823 237,823 237,823 237,823 192,286
PROJECTED ENDING FUND BALANCE 193,374 193,374 226,128 192,286 193,256

HOTEL OCCUPANCY TAX FUND REVENUES
- History - - Current Year - - Proposed Budget -FY 2014 Actual
FY 2015 Actual
FY 2016 Adopted Budget
FY 2016 Current
FY 2016 YTD Actual
FY 2016 Projected
EOY
FY 2017 Proposed Budget
Hotel Occupancy Tax 235,275 311,130 255,900 255,900 255,700 257,922 261,000
Total Categories 235,275 311,130 255,900 255,900 255,700 257,922 261,000

72 | HOTEL OCCUPANCY TAX
- History - - Current Year -- Proposed Budget -
Expenditures by Category
FY 2014 Actual
FY 2015 Actual
FY 2016 Adopted Budget
FY 2016 Current
FY 2016 YTD Actual
FY 2016 Projected
EOY
FY 2017 Proposed Budget
Personnel Services 80,433 83,281 103,947 103,947 19,639 30,235 59,778 Supplies 6,656 5,139 15,800 15,800 285 548 25,800 Contractual Services 121,915 121,964 135,254 135,254 59,682 65,073 148,325 Capital OutlayOperating Transfers 195,000 195,000 150,000 195,000 45,000 Total Categories 209,004 210,384 450,001 450,001 229,605 290,856 278,903

HOT FUND REVENUES/EXPENDITURES SUMMARY
- History - - Current Year - - Proposed Budget -FY 2014 Actual
FY 2015 Actual
FY 2016 Adopted Budget
FY 2016 Current
FY 2016 YTD Actual
FY 2016 Projected EOY
FY 2017 Proposed Budget
TOTAL REVENUES 235,275 311,130 255,900 255,900 255,700 292,922 261,000TOTAL EXPENDITURES 209,004 210,385 450,001 450,001 229,605 292,249 278,903
Excess Revenues Over (Under) Expenditures 26,271 100,745 (194,101) (194,101) 26,265 673 (17,903)
BEGINNING FUND BALANCE 434,963 434,963 434,963 434,963 435,636
PROJECTED ENDING FUND BALANCE 240,862 240,862 461,058 435,636 417,733
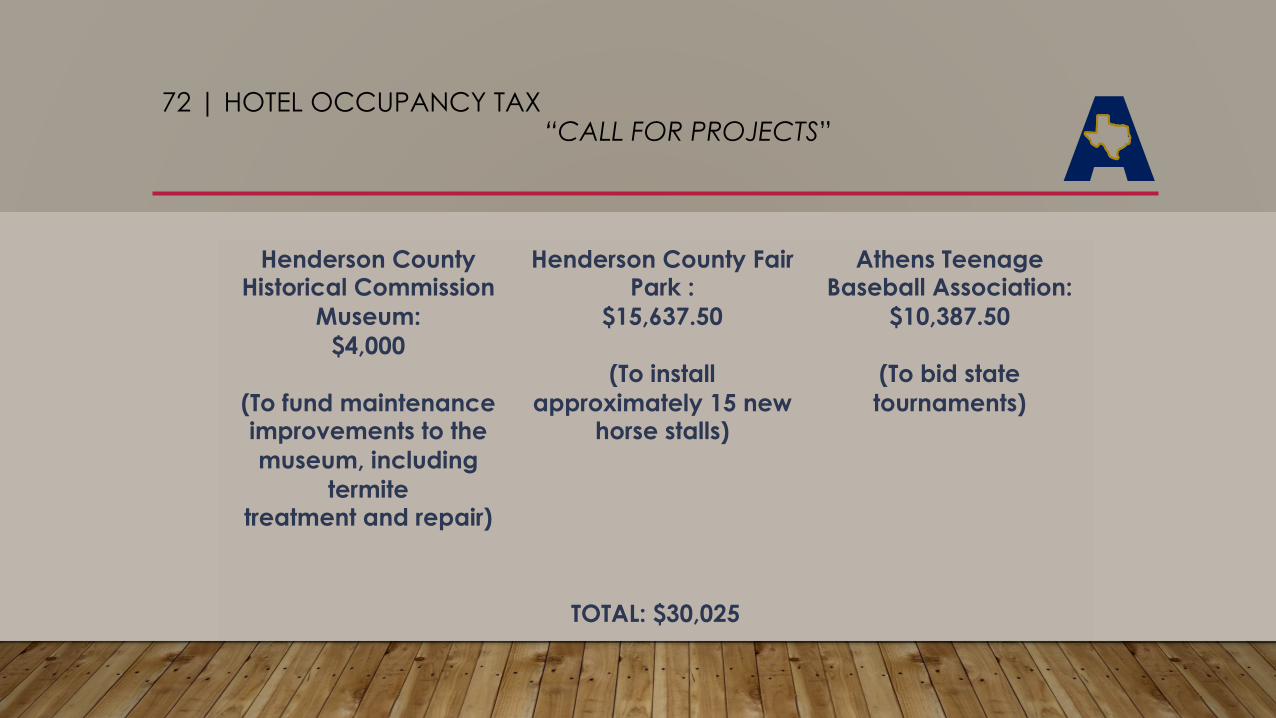
72 | HOTEL OCCUPANCY TAX “CALL FOR PROJECTS”
Henderson County Historical Commission
Museum: $4,000
(To fund maintenance improvements to the museum, including
termitetreatment and repair)
Henderson County Fair Park :
$15,637.50
(To install approximately 15 new
horse stalls)
Athens Teenage Baseball Association:
$10,387.50
(To bid statetournaments)
TOTAL: $30,025

INTEREST AND SINKING FUND
- History - - Current Year -- Proposed Budget
-FY 2014 Actual
FY 2015 Actual
FY 2016 Adopted Budget
FY 2016 Current
FY 2016 YTD Actual
FY 2016 Projected
EOY
FY 2017 Proposed Budget
68-Debt Service 631,022 625,264 672,927 672,927 655,053 655,053 663,231
Total Expenditures 631,022 625,264 672,927 672,927 655,053 655,053 663,231
Excess Revenues over Expenditures (21,715) 10,718 (53,459) (53,459) (47,738) (38,353) (1,500)
Beginning Fund Balance 79,093 79,093 79,093 79,093 40,740
Projected Fund Balance 25,634 25,634 31,355 40,740 39,240

UTILITY FUND REVENUES
- History - - Current Year -- Proposed
Budget -
Revenue SummaryFY 2014 Actual
FY 2015 Actual
FY 2016 Adopted Budget
FY 2016 Current
FY 2016 YTD Actual
FY 2016 Projected
EOY
FY 2017 Proposed Budget
Operating Revenue 4,267,644 4,303,118 5,898,928 5,898,928 4,398,927 5,914,428 5,951,101
Intragovernmental - 275,327 - - - - -Intergovernmental 73,219 325,008 200,000 200,000 207,000 207,000 207,000
Reimbursing Revenue 1,595 8,535 2,000 2,000 - - 500
Other Non Operating Rev 117,702 128,171 134,889 134,889 129,454 171,750 97,800
Other Financing Sources 558 558 - - - - -
Total Revenues 4,460,718 5,040,717 6,235,817 6,235,817 4,735,381 6,293,178 6,256,401 37
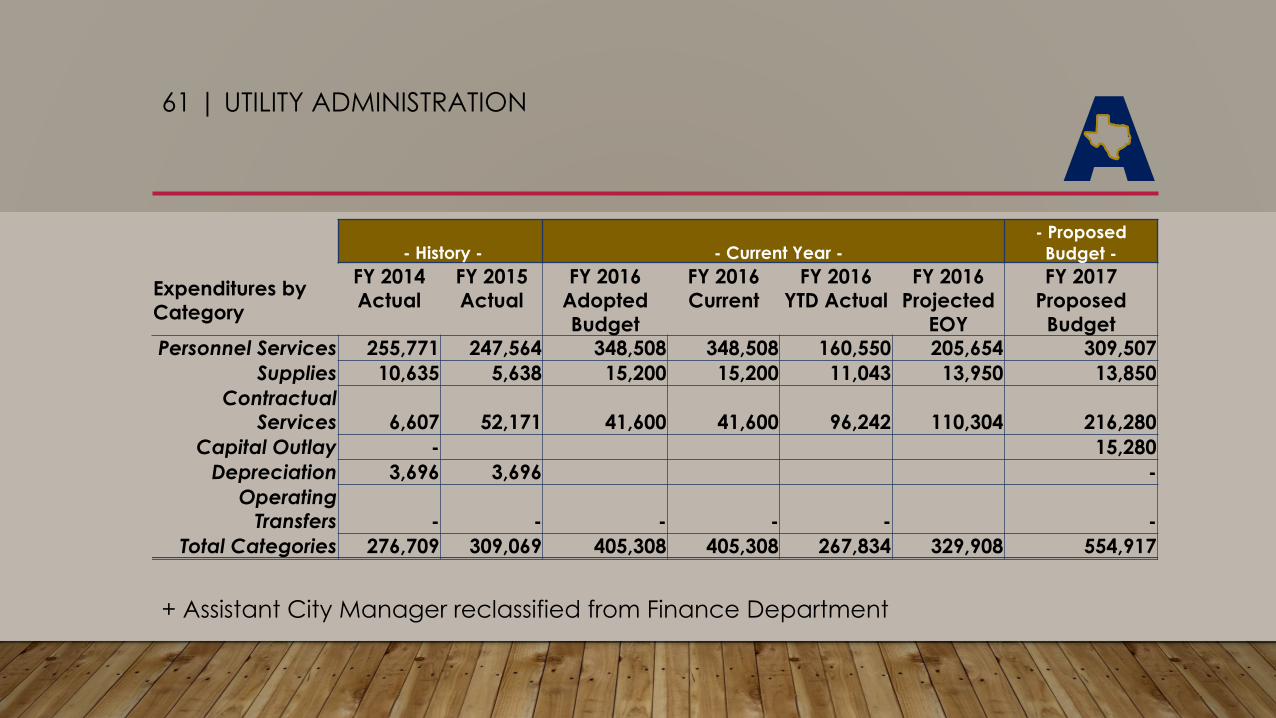
61 | UTILITY ADMINISTRATION
- History - - Current Year -- Proposed
Budget -
Expenditures by Category
FY 2014 Actual
FY 2015 Actual
FY 2016 Adopted Budget
FY 2016 Current
FY 2016 YTD Actual
FY 2016 Projected
EOY
FY 2017 Proposed Budget
Personnel Services 255,771 247,564 348,508 348,508 160,550 205,654 309,507 Supplies 10,635 5,638 15,200 15,200 11,043 13,950 13,850
Contractual Services 6,607 52,171 41,600 41,600 96,242 110,304 216,280
Capital Outlay - 15,280 Depreciation 3,696 3,696 -
Operating Transfers - - - - - -
Total Categories 276,709 309,069 405,308 405,308 267,834 329,908 554,917
+ Assistant City Manager reclassified from Finance Department

62| WATER UTILITY
- History - - Current Year -- Proposed
Budget -
Expenditures by Category
FY 2014 Actual
FY 2015 Actual
FY 2016 Adopted Budget
FY 2016 Current
FY 2016 YTD Actual
FY 2016 Projected
EOY
FY 2017 Proposed Budget
Personnel Services 372,677 395,093 419,665 419,665 310,295 356,857 408,006 Supplies 95,733 133,375 166,320 166,320 105,919 172,248 269,500
Contractual Services 382,269 412,960 448,139 448,139 328,302 433,653 453,900
Capital Outlay - - 258,750 303,800 283,357 308,357 450,000 Depreciation 53,513 35,834 - - - - -
Total Categories 904,192 977,262 1,292,874 1,337,924 1,027,873 1,271,115 1,581,406

63| DISTRIBUTION & COLLECTION
- History - - Current Year -- Proposed
Budget -
Expenditures by Category
FY 2014 Actual
FY 2015 Actual
FY 2016 Adopted Budget
FY 2016 Current
FY 2016 YTD Actual
FY 2016 Projected
EOY
FY 2017 Proposed Budget
Personnel Services 511,038 522,030 560,148 560,148 437,228 442,497 581,501 Supplies 282,340 359,393 354,077 354,077 254,295 324,415 353,165
Contractual Services 28,689 86,382 110,598 110,598 29,905 105,718 113,730
Capital Outlay - - 645,875 645,875 - - 845,500 Reserves 336,376 336,625
Total Categories 1,158,443 1,304,430 1,670,698 1,670,698 721,428 872,630 1,893,896

65| WASTEWATER UTILITY
- History - - Current Year -- Proposed
Budget -
Expenditures by Category
FY 2014 Actual
FY 2015 Actual
FY 2016 Adopted Budget
FY 2016 Current
FY 2016 YTD Actual
FY 2016 Projected
EOY
FY 2017 Proposed Budget
Personnel Services 362,058 354,945 366,452 366,452 293,126 367,649 441,891Supplies 75,592 85,727 125,810 122,310 93,661 118,682 152,860
Contractual Services 437,925 390,029 474,075 477,575 408,170 486,719 518,500
Capital Outlay - - 64,000 64,000 66,098 68,729 264,000 Reserves 291,625 302,449 - - - - -
Operating Transfers
Total Categories 1,167,200 1,133,150 1,030,337 1,030,337 861,055 1,041,779 1,377,251

66| UTILITY BILLING
- History - - Current Year -- Proposed
Budget -
Expenditures by Category
FY 2014 Actual
FY 2015 Actual
FY 2016 Adopted Budget
FY 2016 Current
FY 2016 YTD Actual
FY 2016 Projected
EOY
FY 2017 Proposed Budget
Personnel Services 156,870 160,805 166,978 166,978 140,650 168,592 194,108Supplies 22,527 25,584 29,150 29,150 22,283 26,133 28,000
Contractual Services 35,350 33,872 44,663 44,663 25,685 34,868 37,550 Reserves 5,615 4,746 -
Total Categories 220,362 225,007 240,791 240,791 188,723 229,593 259,658

69| NON-DEPARTMENTAL
- History - - Current Year -- Proposed
Budget -
Expenditures by Category
FY 2014 Actual
FY 2015 Actual
FY 2016 Adopted Budget
FY 2016 Current
FY 2016 YTD Actual
FY 2016 Projected
EOY
FY 2017 Proposed Budget
Personnel Services 8,875 (8,756) - - - - -Contractual
Services 30,368 26,993 30,070 30,070 34,172 34,171 31,000 Long Term Debt 193,539 176,980 557,488 557,488 645,185 704,942 557,488 Capital Outlay - - 380,000 380,000 48,085 300,000 150,000
Operating Transfers 980,607 650,000 650,000 650,000 487,500 650,000 875,000 Reserves 50,494 50,690 - - 570 570 -
Total Categories 1,263,883 895,907 1,617,558 1,617,558 1,215,512 1,689,683 1,613,488

UTILITY FUND REVENUES/EXPENDITURES SUMMARY
- History - - Current Year - - Proposed Budget -FY 2014 Actual
FY 2015 Actual
FY 2016 Adopted Budget
FY 2016 Current
FY 2016 YTD Actual
FY 2016 Projected EOY
FY 2017 Proposed Budget
TOTAL REVENUES 4,460,718 5,040,718 6,235,817 6,235,817 4,735,211 6,293,178 6,256,401TOTAL EXPENDITURES 4,990,788 4,844,824 6,257,566 6,302,616 4,278,425 5,434,708 7,280,616
Excess Revenues Over (Under) Expenditures (530,069) 195,894 (21,749) (66,799) 453,562 858,470 (1,024,215)
BEGINNING FUND BALANCE 11,518,595 11,518,595 11,518,595 11,518,595 12,377,065
PROJECTED ENDING FUND BALANCE 11,496,846 11,451,796 11,972,157 12,377,065 11,352,850

STEP & GRADE FY 2017
• FY 2017 ONLY
GRADE
Minimum Mid-Point Maximum
STEP
1 2 3 4 5 6 7 8 9 10 11
7 18,436 19,006 19,594 20,200 20,824 21,468 22,132 22,817 23,523 24,250 25,000
8 19,615 20,222 20,848 21,492 22,157 22,842 23,549 24,277 25,028 25,802 26,600
9 20,869 21,515 22,180 22,866 23,573 24,302 25,054 25,829 26,627 27,451 28,300
10 22,196 22,883 23,591 24,320 25,072 25,848 26,647 27,471 28,321 29,197 30,100
11 23,612 24,343 25,095 25,872 26,672 27,497 28,347 29,224 30,128 31,059 32,020
12 25,087 25,863 26,663 27,488 28,338 29,214 30,118 31,049 32,009 32,999 34,020
13 26,791 27,619 28,473 29,354 30,262 31,198 32,163 33,157 34,183 35,240 36,330
14 28,538 29,421 30,331 31,269 32,236 33,233 34,261 35,320 36,413 37,539 38,700
15 30,411 31,352 32,322 33,321 34,352 35,414 36,509 37,639 38,803 40,003 41,240
16 32,417 33,420 34,453 35,519 36,617 37,750 38,917 40,121 41,362 42,641 43,960
17 34,570 35,640 36,742 37,878 39,050 40,257 41,503 42,786 44,109 45,474 46,880
18 36,879 38,019 39,195 40,407 41,657 42,945 44,273 45,643 47,054 48,510 50,010
19 39,356 40,574 41,828 43,122 44,456 45,831 47,248 48,709 50,216 51,769 53,370
CS-19 40,064 41,303 42,581 43,898 45,255 46,655 48,098 49,586 51,119 52,700 54,330
20 41,937 43,234 44,571 45,950 47,371 48,836 50,347 51,904 53,509 55,164 56,870
P-20 43,191 44,527 45,904 47,324 48,787 50,296 51,852 53,455 55,109 56,813 58,570
F-20 44,135 45,500 46,907 48,358 49,853 51,395 52,985 54,623 56,313 58,055 59,850
21 44,953 46,344 47,777 49,255 50,778 52,348 53,967 55,637 57,357 59,131 60,960
22 47,947 49,430 50,959 52,535 54,160 55,835 57,562 59,342 61,177 63,069 65,020
CS-21 48,987 50,502 52,064 53,674 55,334 57,046 58,810 60,629 62,504 64,437 66,430
23 51,244 52,828 54,462 56,147 57,883 59,673 61,519 63,422 65,383 67,405 69,490
P-23 54,658 56,348 58,091 59,888 61,740 63,649 65,618 67,647 69,740 71,896 74,120
24 55,078 56,782 58,538 60,348 62,215 64,139 66,123 68,168 70,276 72,449 74,690
F-24 58,050 59,845 61,696 63,604 65,572 67,600 69,690 71,846 74,068 76,358 78,720
25 58,913 60,735 62,613 64,550 66,546 68,604 70,726 72,913 75,169 77,493 79,890
26 63,485 65,448 67,472 69,559 71,711 73,928 76,215 78,572 81,002 83,507 86,090
CS-26 64,104 66,087 68,131 70,238 72,410 74,650 76,959 79,339 81,792 84,322 86,930
27 68,426 70,542 72,724 74,973 77,291 79,682 82,146 84,687 87,306 90,006 92,790
28 75,269 77,597 79,997 82,471 85,021 87,651 90,362 93,157 96,038 99,008 102,070
29 81,736 84,264 86,870 89,557 92,327 95,182 98,126 101,161 104,289 107,515 110,840

Position Title (FY 2017) Grade Number of Positions Fund Position Title (FY 2017) Grade Number of Positions Fund Position Title (FY 2017) Grade Number of Positions Fund
Parks Laborer 8 2 GEN Development Coordinator 19 1 GEN Cultural Resources Coordinator 19 1 HOTStreets Laborer 11 4 GEN Police Officer CS-19 16 GEN Receptionist 13 1 UTLParks Maintenance Technician 11 4 GEN Fire Fighter CS-19 18 GEN Water Plant Operator 14 5 UTLMechanic I 11 1 GEN Police Corporal P-20 6 GEN Wastewater Plant Operator 14 5 UTLFacilities Maintenance Technician 11 0.5 GEN Fire Lieutenant F-20 3 GEN Line Maintenance Technician 14 7 UTLEquipment Operator I, Streets 13 1 GEN Streets Superintendent 21 1 GEN Water Foreman 16 1 UTLEquipment Operator I, Parks 13 1 GEN Senior Accountant 21 1 GEN Wastewater Foreman 16 1 UTLAnimal Control Officer 13 1 GEN Parks Superintendent 21 1 GEN Utility Specialist 16 2.5 UTLRecords Clerk 14 1 GEN Fleet Maintenance Superintendent 21 1 GEN Line Maintenance Foreman 16 2 UTLMunicipal Court Clerk 14 1 GEN Police Sergeant CS-21 6 GEN IT & SCADA Technician 19 1 UTLMechanic II 14 1 GEN Fire Captain CS-21 3 GEN Water Superintendent 21 1 UTLGIS Technician 14 1 GEN Police Lieutenant P-23 2 GEN Wastewater Superintendent 21 1 UTLEquipment Operator II, Streets 15 1 GEN Battalion Chief / Fire Marshal F-24 1 GEN Line Maintenance Superintendent 21 1 UTLPolice Secretary 15 1 GEN Human Resources Manager 25 1 GEN Director of Public Works 26 1 UTLPolice Dispatcher 15 5 GEN Community Development Manager 25 1 GEN Assistant City Manager 29 1 UTLEvidence Technician 15 1 GEN Director of Planning 26 1 GENCode Enforcement Officer 15 1 GEN Director of Finance 26 1 GEN Total General Fund PositionsStreets Foreman 16 1 GEN City Secretary 26 1 GEN Total Utility Fund PositionsParks Foreman 16 1 GEN Assistant Police Chief CS-26 1 GEN Total Hotel Occupancy Tax Fund PositionsMunicipal Court Administrator 16 1 GEN Assistant Fire Chief CS-26 1 GEN Total PositionsCode Enforcement Coordinator 16 1 GEN Police Chief 28 1 GENHuman Resources Coordinator 17 1 GEN Fire Chief / Emergency Management Coordinator 28 1 GENFinance & Compliance Specialist 19 1 GEN Municipal Judge N/A 0.5 GEN
City Manager N/A 1 GEN
10430.5
1135.5
FTE – POSITIONS FUNDED IN FY 2017


