City of Alhambra California
196
City of Alhambra California Comprehensive Annual Financial Report For the year ended June 30, 2018
Transcript of City of Alhambra California

City of Alhambra California
Comprehensive Annual Financial Report
For the year ended June 30, 2018

CITY OF ALHAMBRA,
CALIFORNIA
Comprehensive Annual Financial Report
Year ended June 30, 2018
(With Independent Auditors’ Report Thereon)
Prepared by:
Paul Espinoza, Director of Finance and Staff


i
CITY OF ALHAMBRA
Comprehensive Annual Financial Report
Table of Contents
Page
Introductory Section: Letter of Transmittal iv Officials of the City of Alhambra viii Organizational Chart ix GFOA Certificate of Achievement for Excellence in Financial Reporting x
Financial Section:
Independent Auditors’ Report 1
Management’s Discussion and Analysis 4 Basic Financial Statements:
Government-Wide Financial Statements: Statement of Net Position 16 Statement of Activities 17
Fund Financial Statements: Balance Sheet – Governmental Funds 18 Statement of Revenues, Expenditures, and Changes in Fund Balances – Governmental
Funds 20 Statement of Revenues, Expenditures, and Changes in Fund Balances – Budget and Actual: General Fund 22
Community Development Block Grant Fund 25 Transportation Capital Improvements Fund 26
Statement of Net Position – Proprietary Funds 27 Statement of Revenues, Expenses, and Changes in Fund Net Position – Proprietary
Funds 28 Statement of Cash Flows – Proprietary Funds 29
Statement of Fiduciary Net Position 31 Statement of Changes in Fiduciary Net Position 32
Notes to the Basic Financial Statements 33
Required Supplementary Information (Unaudited): Schedule of Changes in Net Pension Liability and Related Ratios – Miscellaneous Plan
Last Ten Fiscal Years 88 Schedule of Contributions – Miscellaneous Plan Last Ten Fiscal Years 89 Schedule of Changes in Net Pension Liability and Related Ratios – Safety Plan Last Ten
Fiscal Years 90 Schedule of Contributions – Safety Plan Last Ten Fiscal Years 91 Schedule of Changes in Total Pension Liability and Related Ratios – Other Pension Plan
Last Ten Fiscal Years 92 Schedule of Contributions – Other Pension Plan Last Ten Fiscal Years 93

ii
CITY OF ALHAMBRA
Comprehensive Annual Financial Report
Table of Contents (Continued)
Page
Schedule of Changes in Total Other Post-Employment Benefits Liability and Related Ratios – PERS Health Plan Last Ten Fiscal Years 94
Schedule of Changes in Total Other Post-Employment Benefits Liability and Related Ratios – City Council Plan Last Ten Fiscal Years 95
Combining and Individual Fund Statements and Schedules:
Other Governmental Funds: Combining Balance Sheet – Other Governmental Funds 96 Combining Statement of Revenues, Expenditures, and Changes in Fund Balances –
Other Governmental Funds 97 Combining Balance Sheet – Other Special Revenue Funds 98
Combining Statement of Revenues, Expenditures, and Changes in Fund Balances (Deficits) – Other Special Revenue Funds 101
Schedule of Revenues, Expenditures, and Changes in Fund Balance – Budget and Actual – Other Special Revenue Funds:
Law Enforcement Fund 104 TDA Bikeway Fund 105 State Gas Tax Fund 106 Proposition A – Transportation Fund 107 Proposition C – Transportation Fund 108 Measure R – Transportation Fund 109 Measure M – Transportation Fund 110 Road Maintenance & Rehabilitation Fund 111 Air Quality Fund 112 Lighting and Landscape Maintenance Fund 113 Police Facility Assessment Fund 114 Asset Forfeiture Fund 115 Disability Access Compliance Fund 116 Home and Rental Rehabilitation Fund 117 Housing Asset Fund 118
Combining Balance Sheet – Other Debt Service Funds 119 Combining Statement of Revenues, Expenditures, and Changes in Fund Balances –
Other Debt Service Funds 120 Schedule of Revenues, Expenditures, and Changes in Fund Balance – Budget and
Actual – Other Debt Service Funds: Lighting and Sidewalk Construction Fund 121 Police Facility Fund 122 Parking Authority Debt Service Fund 123

iii
CITY OF ALHAMBRA
Comprehensive Annual Financial Report
Table of Contents (Continued)
Page
Combining Balance Sheet – Other Capital Projects Funds 124 Combining Statement of Revenues, Expenditures, and Changes in Fund Balances –
Other Capital Projects Funds 125 Schedule of Revenues, Expenditures, and Changes in Fund Balance – Budget and
Actual – Other Capital Projects Funds: Capital Outlay Fund 126 Parking Authority Projects Fund 127
Internal Service Funds:
Combining Statement of Net Position (Deficits) – Internal Service Funds 128 Combining Statement of Revenues, Expenses, and Changes in Net Position
(Deficits) – Internal Service Funds 129 Combining Statement of Cash Flows – Internal Service Funds 130
Statistical Section (Not Covered by Independent Auditors’ Report)
Net Position by Component - Last Ten Fiscal Years 132 Changes in Net Position - Last Ten Fiscal Years 133 Fund Balances of Governmental Funds - Last Ten Fiscal Years 134 Changes in Fund Balances of Governmental Funds - Last Ten Fiscal Years 136 Assessed Value and Estimated Actual Value of Taxable Property - Last Ten Fiscal Years 137 Direct and Overlapping Property Tax Rates - Current Year and Nine Years Ago 138 Principal Property Tax Payers - Current Year and Nine Years Ago 139 Property Tax Levies and Collections - Last Ten Fiscal Years 140 Ratios of Outstanding Debt by Type - Last Ten Fiscal Years 141 Ratios of General Bonded Debt Outstanding - Last Ten Fiscal Years 142 Direct and Overlapping Debt 143 Legal Debt Margin Information - Last Ten Fiscal Years 145 Pledged Revenue Coverage - Last Ten Fiscal Years 146 Demographic and Economic Statistics 147 Principal Employers - Current Year and Nine Years Ago 148 Full-time Equivalent City Government Employees by Function/Program – Last Ten Fiscal Years 149 Operating Indicators by Function - Last Ten Fiscal Years 150 Capital Asset Statistics by Function - Last Ten Fiscal Years 151


Introductory Section


iv
111
South First Street
Alhambra
California
91801
Gateway
to the
San Gabriel Valley
City of Alhambra
January 29, 2019
Honorable Mayor and City Council City of Alhambra Alhambra, California
It is our pleasure to submit for your information the Comprehensive Annual Financial Report of the City of Alhambra for the fiscal year ended June 30, 2018. Responsibility for the accuracy of the presented data and the completeness and fairness of the presentation, including all disclosures, rests with the City. It is our opinion that the data, as presented, is accurate in all material aspects, that it is presented in a manner designed to fairly set forth the financial position and results of operations of the City, and all disclosures necessary to enable the reader to gain an understanding of the City’s financial affairs have been included.
The financial statements are prepared in accordance with Generally Accepted Accounting Principles in the United States of America (GAAP) as promulgated by the Government Accounting Standards Board. This report consists of management’s representations concerning the finances of the City of Alhambra, California. Consequently, management assumes full responsibility for the completeness and reliability of all of the information presented in this report. To provide a reasonable basis for making these representations, management of the City has established a comprehensive internal control framework that is designed both to protect the City’s assets from loss, theft, or misuse and to compile sufficient reliable information for the preparation of the City’s financial statements in conformity with GAAP. Because the cost of internal controls should not outweigh their benefits, the City’s comprehensive framework of internal controls have been designed to provide reasonable rather than absolute assurance that the financial statements will be free from material misstatement. As management, we assert that, to the best of our knowledge and belief, this financial report is complete and reliable in all material respects.
The City’s financial statements have been audited by White Nelson Diehl Evans LLP, a public accounting firm fully licensed and qualified to perform audits of state and local governments within the state of California. The goal of the independent audit was to provide reasonable assurance that the financial statements of the City of Alhambra, California for the fiscal year ended June 30, 2018 are free of material misstatements. The independent audit involved examining, on a test basis, evidence supporting the amounts and disclosures in the financial statements; assessing the accounting principles used and significant estimates made by management; and evaluating the overall financial statement presentation. Based upon the audit, the independent auditors concluded, that there was a reasonable basis for rendering an unmodified opinion that the City of Alhambra, California’s financial statements for the fiscal year ended June 30, 2018 are fairly presented in conformity with GAAP. The independent auditors’ report is presented as the first component of the financial section of this report.

v
The independent audit of the financial statements of the City was part of a broader, federally mandated “Single Audit” designed to meet the special needs of federal grantor agencies. The standards governing Single Audit engagements require the independent auditor to report not only on the fair presentation of the financial statements, but also on the audited government’s internal controls and compliance with legal requirements, with special emphasis on internal controls and legal requirements involving the administration of federal awards. These reports are available in the City’s separately issued Single Audit Report.
Management’s discussion and analysis (MD&A) immediately follows the independent auditor’s report and provides a narrative introduction, overview, and analysis of the basic financial statements. MD&A complement this letter of transmittal and should be read in conjunction with it.
Profile of the City of Alhambra
The City of Alhambra was incorporated on July 11, 1903 and became the third city in the state to adopt by charter the Council-Manager form of government. Council members are nominated by district and elected at- large for four-year terms at elections held in even numbered years. The City is located eight miles east of downtown Los Angeles and shares common boundaries with the cities of South Pasadena and San Marino to the north, San Gabriel to the east, Monterey Park to the south, and Los Angeles to the west.
Alhambra occupies 7.69 square miles and has been fully developed since the 1960s. Private development and higher densities have increased the population from 54,800 in 1960 to 86,665 in 2017. The City is diversified with single family and multiple family housing development, commercial development, and significant industrial development.
The City provides a full range of municipal services. Services provided include police, fire, street maintenance and improvements, water and storm drains, recreation, library, public improvements, planning zoning, and general administrative and support services.
Economic Condition and Outlook
Local Economy. The City of Alhambra’s economic base is a combination of commercial and light industrial business with 7,600 active businesses located in the City generating over $1 billion in taxable sales in 2017-2018. Approximately 38 percent of that amount is from “Auto Row” (including both auto sales and leases) which currently has 10 dealers and 13 different brands of automobiles.
The newly rebuilt “Alhambra Place” located at the southeast corner of Garfield Avenue and Main Street encompassing 10.6 acres and including 140,000 square feet of retail and restaurant space continues to be a popular destination. Alhambra Place includes Sprouts Farmers Market and Burlington as key anchor tenants. Other tenants include Blaze Pizza, The Habit Grill, Maido (stationery store), Vidorra (clothing boutique), Verizon, Bank of the West, JJ Bakery, The Big Catch, Clear Sight Optometry, Five Below and Miniso. The commercial portion of the project and parking lot are valued at $24.2 million. The four-story residential component with 260 luxury apartment homes and a parking structure is now completed. Its anticipated value is $37.8 million. The retail and restaurant space continue to infuse additional economic vitality into the City while the residential component of Alhambra Place brings a new set of residents to Alhambra who will shop and dine in our community. The Alhambra Renaissance Entertainment Center located at the northeast corner of Main Street and Garfield Avenue includes 14 screens, stadium seating, a 20,000 square foot public plaza, and 15,000 square feet of retail/restaurant space which includes Applebee’s Grill, Panda Express, Grill’Em All, and Menchie’s Frozen Yogurt. The Center also includes a five-level 252,000 square foot public parking structure and surface parking lot which provides a total of 800 free parking spaces for patrons who visit the Alhambra Renaissance Entertainment Center and surrounding businesses in the downtown.
Other major businesses within the City include Costco, Kohl’s, Home Depot, Office Depot, Ross Dress For Less, Target, Smart and Final, PetsMart, Party City, Panera Bread and Aldi.

vi
Financial Information
Long-term Financial Planning. Economic growth, while marginal in the City, has increased the demand for vital City services. These issues were reflected in the setting of City Council priorities for 2018:
The City has developed a Strategic Plan with established goals from which budgetary decisions are made. The Plan is periodically updated and the City is consistently working to achieve these goals.
City goals for fiscal years 2017 – 2018 are as follows:
• Enhance commercial development, housing and jobs creation • Enhance the quality of our neighborhoods and community • Improve financial stability • Improve and enhance the City’s infrastructure and facilities • Enhance community awareness of the City’s programs and services Substantial progress has been made towards the accomplishment of these goals.
The City has also developed a Five-Year Capital Improvement Plan detailing specific capital projects planned for each City department. Each project is consistent with the overall goals and objectives of the City as outlined in the Strategic and General Plans. The current Five-Year Capital Improvement Plan proposed $14.3 million of capital projects which includes $6 million for major street projects, $5.1 million for water and sewer system improvements, $1.7 in public safety capital expenditures, $1.1 million for parks and recreation improvements, $265,000 for development services improvements and $237,000 for library and financial software enhancements.
Internal Controls. Management of the City is responsible for establishing and maintaining internal control designed to ensure that the assets of the government are protected from loss, theft, or misuse, and to ensure that adequate accounting data are compiled to allow for the preparation of financial statements in conformity with U.S. GAAP. Internal control is designed to provide reasonable, but not absolute, assurance that these objectives are met. The concept of reasonable assurance recognizes that: (1) the cost of a control should not exceed the benefits likely to be derived; and (2) the valuation of costs and benefits requires estimates and judgments by management. Management asserts that, to the best of their knowledge and belief, this financial report is complete and reliable in all material respects. Budgetary Control. The City of Alhambra adopts a comprehensive budget detailed by department prior to the start of the fiscal year on July 1. The budget is further broken down by character of expenditure, defined as personnel services, service and supplies, and capital outlay. The ledgers of the City and its component units are maintained by the line item detail or object of expenditure. However, all budgetary controls are exercised at the department and fund level. The City maintains budgetary controls to ensure compliance with legal provisions in the annual appropriated budget approved by the City Council. Revenues are estimated annually and measured against actual revenues earned. The City also maintains an encumbrance accounting system for budgetary control. Encumbrances generally are re-appropriated as part of the following year's budget. Major Initiatives. Private investment and development continue to occur throughout the City with several major projects that include the following: St. Clair Partners, on behalf of TAG-2 Medical Investment Group, LLC and Lennar Homes will be developing a new project known as “Camellia Court” located at 1428 S. Marengo Avenue. The proposed project elements consist of a new 126-unit 3-story townhome condominium complex, a 2-story 14,600 square foot commons building addition to an existing 36,000 square foot skilled nursing facility, a new 1-


viii
Officials of the City of Alhambra
Mayor
Jeffrey Maloney Third District
City Council Members
Katherine Lee Ross Maza First District Second District
David Mejia Adele Andrade-Stadler Fourth District Fifth District
City Administration and Department Heads
City Manager ..................................................................................................................Jessica Binnquist
Assistant City Manager .................................................................................................... Brad McKinney
City Attorney .....................................................................................................................Joseph Montes
Fire Chief ......................................................................................................................... Thomas Phelps
Police Chief ...........................................................................................................................Timothy Vu
Director of Community Development .............................................................................. Marc Castagnola
Director of Finance ............................................................................................................. Paul Espinoza
Director of Library Services......................................................................................... Carmen Hernandez
Director of Parks and Recreation ........................................................................................... Mike Macias
Director of Public Works ......................................................................................................Mary Chavez
Director of Utilities .................................................................................................................Martin Ray
City Clerk .......................................................................................................................... Lauren Myles

ix
ORGANIZATIONAL CHART
Katherine LeeFirst District
Ross J. MazaSecond District
Jeff MaloneyThird District
David MejiaFourth District
Adele Andrade-StadlerFifth District
Civil Service/Board of Appeals
Parks &Recreation
Commission
PlanningCommission
HCDA CitizensAdvisory
Committee
ManagementServices
Parks andRecreation
CityClerk
Finance
CommunityDevelopment
HumanResources
Fire Police
Library Utilities
PublicWorks
City Manager City Attorney
Arts & CulturalEvents
Committee
EnvironmentalCommittee
Design ReviewCommission
Board ofLibrary
Trustees
TransportationCommission
YouthCommission
City Council
PEOPLE OF ALHAMBRA

X


Financial Section


2875 Michelle Drive, Suite 300, Irvine, CA 92606 • Tel: 714.978.1300 • Fax: 714.978.7893
Offices located in Orange and San Diego Counties
- 1 -
INDEPENDENT AUDITORS’ REPORT
The Honorable Mayor andMembers of the City Council
City of Alhambra Alhambra, California
Report on the Financial Statements
We have audited the accompanying financial statements of the governmental activities, the business-type activities, each major fund, and the aggregate remaining fund information of the City of Alhambra (the City), as of and for the year ended June 30, 2018, and the related notes to the financial statements, which collectively comprise the City’s basic financial statements as listed in the table of contents.
Management’s Responsibility for the Financial Statements
Management is responsible for the preparation and fair presentation of these financial statements in accordance with accounting principles generally accepted in the United States of America; this includes the design, implementation, and maintenance of internal control relevant to the preparation and fair presentation of financial statements that are free from material misstatement, whether due to fraud or error.
Auditors’ Responsibility
Our responsibility is to express opinions on these financial statements based on our audit. We conducted our audit in accordance with auditing standards generally accepted in the United States of America and the standards applicable to financial audits contained in Government Auditing Standards, issued by the Comptroller General of the United States. Those standards require that we plan and perform the audit to obtain reasonable assurance about whether the basic financial statements are free from material misstatement.
An audit involves performing procedures to obtain audit evidence about the amounts and disclosures in the basic financial statements. The procedures selected depend on the auditors’ judgment, including the assessment of the risks of material misstatement of the financial statements, whether due to fraud or error. In making those risk assessments, the auditors consider internal control relevant to the City’s preparation and fair presentation of the financial statements in order to design audit procedures that are appropriate in the circumstances, but not for the purpose of expressing an opinion on the effectiveness of the City’s internal control. Accordingly, we express no such opinion. An audit also includes evaluating the appropriateness of accounting policies used and the reasonableness of significant accounting estimates made by management, as well as evaluating the overall presentation of the financial statements.
We believe that the audit evidence we have obtained is sufficient and appropriate to provide a basis for our audit opinions.

- 2 -
Opinions In our opinion, the basic financial statements referred to above present fairly, in all material respects, the respective financial position of the governmental activities, the business-type activities, each major fund, and the aggregate remaining fund information of the City, as of June 30, 2018, and the respective changes in financial position and cash flows, where applicable, thereof and the respective budgetary comparisons for the General Fund, the Community Development Block Grant Special Revenue Fund, and the Transportation Capital Improvement Special Revenue fund for the year then ended in accordance with accounting principles generally accepted in the United States of America. Emphasis of Matter
As discussed in Notes J(P) and V(K) to the financial statements, the City adopted Governmental Accounting Standards Board’s Statement No. 75, Accounting and Financial Reporting for Postemployment Benefits Other than Pensions, which required retrospective application resulting in a reduction of previously reported net positions. Our opinions are not modified with respect to this matter.
Other Matters Required Supplementary Information Accounting principles generally accepted in the United States of America require that the management’s discussion and analysis, the schedules of changes in the net pension liability and related ratios for the miscellaneous, safety, and other defined benefit pension plans, the schedules of contributions of the miscellaneous, safety, and other defined benefit pension plans, and the schedules of changes in total other post-employment benefits liability and related ratios for the PERS health and City Council plans, identified as Required Supplementary Information (RSI) in the accompanying table of contents, be presented to supplement the basic financial statements. Such information, although not a part of the basic financial statements, is required by the Governmental Accounting Standards Board, who considers it to be an essential part of financial reporting for placing the basic financial statements in an appropriate operational, economic, or historical context. We have applied certain limited procedures to the RSI in accordance with auditing standards generally accepted in the United States of America, which consisted of inquiries of management about the methods of preparing the information and comparing the information for consistency with management’s responses to our inquiries, the basic financial statements, and other knowledge we obtained during the audit of the basic financial statements. We do not express an opinion or provide any assurance on the RSI because the limited procedures do not provide us with sufficient evidence to express an opinion or provide any assurance. Other Information Our audit was conducted for the purpose of forming opinions on the financial statements that collectively comprise the City’s basic financial statements. The introductory section, combining and individual fund statements and schedules, and statistical section are presented for purposes of additional analysis and are not a required part of the basic financial statements. The combining and individual fund statements and schedules are the responsibility of management and were derived from and relate directly to the underlying accounting and other records used to prepare the basic financial statements. Such information has been subjected to the auditing procedures applied in the audit of the basic financial statements and certain additional procedures, including comparing and reconciling such information directly to the underlying accounting and other records used to prepare the basic financial statements or to the basic financial statements themselves, and other additional procedures in accordance with auditing standards generally accepted in the United States of America. In our opinion, the combining and individual fund statements and schedules are fairly stated in all material respects in relation to the basic financial statements as a whole.

- 3 -
Other Matters (Continued) Other Information (Continued) The introductory section and statistical section have not been subjected to the auditing procedures applied in the audit of the basic financial statements and, accordingly, we do not express an opinion or provide any assurance on them. Other Reporting Required by Government Auditing Standards In accordance with Government Auditing Standards, we have also issued our report dated January 29, 2019, on our consideration of the City’s internal control over financial reporting and on our tests of its compliance with certain provisions of laws, regulations, contracts, and grant agreements and other matters. The purpose of that report is to describe the scope of our testing of internal control over financial reporting and compliance and the results of that testing, and not to provide an opinion on internal control over financial reporting or on compliance. That report is an integral part of an audit performed in accordance with Government Auditing Standards in considering the City’s internal control over financial reporting and compliance. Irvine, California January 29, 2019

THIS PAGE INTENTIONALLY LEFT BLANK

This section of the City’s Comprehensive Annual Financial Report provides a narrative overview and analysis of the financial activities of the City for the fiscal year ended June 30, 2018. We encourage readers to consider the information presented here in conjunction with additional information we have furnished in our letter of transmittal, which can be found beginning on page iv and the City’s financial statements beginning on page 16.
Financial Highlights
The following are some key financial highlights for the fiscal year June 30, 2018:
• The City’s assets and deferred outflow of resources exceeded its liabilities and deferred inflow of resources at the close of the most recent fiscal year by $101,359,711 (net position), which was comprised of capital assets, net investment in capital assets of $173,981,875, restricted for debt service of $790,105, restricted for projects and programs of $30,354,674, and unrestricted net deficit of $103,766,943.
• The City’s total net position increased by $4,905,660 during the current fiscal year, comprised of an increase in governmental activities of $3,317,879, and an increase in business-type activities of $1,587,781.
• As of June 30, 2018, the City’s governmental funds reported combined fund balances of $50,270,448, an increase of $3,153,460 in comparison with the prior year. Of this amount, $20,615,547 or approximately 41% of total fund balances, are available for spending at the City’s discretion (committed, assigned, and unassigned fund balance).
• At the end of the current fiscal year, committed, assigned, and unassigned fund balance for the General Fund was $24,968,370, or 40% of total general fund expenditures. However, the City has committed or assigned $24,968,370 for various projects and programs leaving $0 as unassigned.
Overview of the Financial Statements
This discussion and analysis are intended to serve as an introduction to the City’s basic financial statements. The City’s basic financial statements comprise of three components: 1) government-wide financial statements, 2) fund financial statements, and 3) notes to basic financial statements. This report also contains supplementary information in addition to the basic financial statements.
Government-wide Financial Statements. The government-wide financial statements are designed to provide readers with a broad overview of the City’s finances in a manner similar to a private-sector business.
The statement of net position presents information on all of the City’s assets and deferred outflow of resources and liabilities and deferred inflow of resources, with the difference between the two reported as net position. Over time, increases or decreases in net position may serve as a useful indicator of whether the financial position of the City is improving or deteriorating.
The statement of activities presents information showing how the City’s net position changed during the most recent fiscal year. All changes in net position are reported as soon as the underlying event giving rise to the change occurs, regardless of the timing of related cash flows. Thus, revenues and expenses are reported in this statement for some items that will only result in cash flows in future fiscal periods (e.g., uncollected taxes and earned but unused vacation leave).
Both of the government-wide financial statements distinguish functions of the City that are principally supported by taxes and intergovernmental revenues (governmental activities). The governmental activities of the City include general government, public safety, public works, housing, health and community development, culture
CITY OF ALHAMBRA Management’s Discussion and Analysis
June 30, 2018
4 (Continued)

and recreation, and interest on long-term debt. The business-type activities of the City include its water, sewer and storm drain, sanitation, and golf course/clubhouse operations.
The government-wide financial statements include not only the City itself (known as the primary government), but also four legally separate entities, the Alhambra Capital Improvements Corporation, Alhambra Golfcourse/Clubhouse Corporation, Alhambra Public Financing Authority, Alhambra Parking Authority, and the Alhambra Facilities Financing Authority. The City is financially accountable for these entities and financial information for these blended component units is reported within the financial information presented for the primary government itself.
The government-wide financial statements can be found on page 16 and page 17 of this report.
Fund Financial Statements. A fund is a grouping of related accounts used to maintain control over resources that have been segregated for specific activities or objectives. The City, like other state and local governments, uses fund accounting to ensure and demonstrate compliance with finance-related legal requirements. All of the funds of the City can be divided into two categories: governmental funds and proprietary funds.
Governmental Funds. Governmental funds are used to account for essentially the same functions reported as governmental activities in the government-wide financial statements. However, unlike the governmental-wide financial statements, governmental fund financial statements focus on near-term inflows and outflows of spendable resources, as well as on balances of spendable resources available at the end of this fiscal year. Such information may be useful in evaluating the City’s near-term financial requirements.
Because the focus of governmental funds is narrower than that of the government-wide financial statements, it is useful to compare the information presented for governmental funds with similar information presented for governmental activities in the government-wide financial statements. By doing so, readers may better understand the long-term impact of the City’s near-term financial decision. Both the governmental fund balance sheet and the governmental fund statement of revenue, expenditures, and changes in fund balances provide a reconciliation to facilitate this comparison between governmental funds and governmental activities.
The City maintains 23 individual governmental funds. Information is presented separately in the governmental fund balance sheet and in the governmental fund statement of revenues, expenditures and changes in fund balances for the General Fund, Community Development Block Grant Fund, and Transportation Capital Improvement Fund which are considered to be major funds. Data from the other 20 governmental funds are combined into a single, aggregated presentation. Individual fund data for each of these other governmental funds is provided in the form of combining statements in the other governmental funds section of this report.
The City adopts an annual appropriated budget for all of its funds. A budgetary comparison statement is provided for all funds with an annually adopted budget. The budgetary comparison statement for the General Fund is located in the basic financial statements.
The basic governmental fund financial statements can be found on page 18 and page 20 of this report.
Proprietary Funds. The City maintains two different types of proprietary funds. Enterprise funds are used to report the same functions presented as business-type activities in the government-wide financial statements. The City uses enterprise funds to account for its water, sewer and storm drain, sanitation, and golf course/clubhouse operations. Internal service funds are an accounting device used to accumulate and allocate costs internally among the City’s various functions. The City uses internal service funds to account for self-insurance activities, including: general claims liability, workers’ compensation insurance, vehicle operation and maintenance, and compensated absences.
CITY OF ALHAMBRA Management’s Discussion and Analysis
June 30, 2018
5 (Continued)

Because these services benefit both governmental and business-type functions, the services have been allocated to governmental and business type activities in the government-wide financial statements.
Proprietary funds provide the same type of information as the government-wide financial statements, only in more detail. The proprietary fund financial statements provide separate information for the water, sewer and storm drain, sanitation, and golf course/clubhouse operations, all of which are considered major funds of the City. Conversely, the internal service funds are combined into a single, aggregated presentation in the proprietary fund financial statements. Individual fund data for the internal service funds is provided in the form of combining statements in the Supplementary Information section of this report.
The basic proprietary fund financial statements can be found on page 27 through page 30 of this report.
Fiduciary Funds. The City maintains one fiduciary fund, a Private Purpose Trust for the Alhambra Redevelopment Agency Successor Agency. Fiduciary Funds are used to account for financial resources held for the benefit of parties outside the City government. Fiduciary Funds are not reflected in the government-wide statements because the resources are not available to support governmental activities of the City.
The basic fiduciary fund financial statements can be found on page 31 through page 32 of this report.
Notes to the Basic Financial Statements. The notes to the basic financial statements provide additional information that is essential to a full understanding of the data provided in the government-wide and fund financial statements. The notes to the basic financial statements can be found on pages 33 through 87 of this report.
Other Information. In addition to the basic financial statements and accompanying notes, this report also presents certain required supplementary information concerning the City’s progress in funding its obligation to provide pension benefits and other post-employment benefits to its employees. Required supplementary information can be found on pages 88 through 95 of this report.
The combining statements referred to earlier in connection with other governmental funds and internal service funds, together with information on capital assets used in the operation of governmental funds (those not included in internal service funds), are presented immediately following the required supplementary information on pensions. Combining and individual fund statements and schedules can be found on pages 96 through 131 of this report.
CITY OF ALHAMBRA Management’s Discussion and Analysis
June 30, 2018
6 (Continued)

Government-wide Financial Analysis
Governmental Business-typeactivities activities Total
2017 2017 20172018 as restated 2018 as restated 2018 as restated
Assets:Current and other assets $ 70,952,345 68,369,017 30,831,657 36,137,298 101,784,002 104,506,315 Capital assets 140,077,641 136,866,414 59,876,274 53,225,382 199,953,915 190,091,796
Total assets 211,029,986 205,235,431 90,707,931 89,362,680 301,737,917 294,598,111
Deferred outflow of resources 30,456,061 25,157,970 3,391,268 2,812,303 33,847,329 27,970,273
Liabilities:Current and other liabilities 7,910,369 7,127,310 3,777,373 3,456,781 11,687,742 10,584,091 Long-term liabilities 185,357,118 180,114,036 24,282,273 24,610,416 209,639,391 204,724,452
Total liabilities 193,267,487 187,241,346 28,059,646 28,067,197 221,327,133 215,308,543
Deferred inflow of resources 11,635,374 9,886,748 1,263,028 919,042 12,898,402 10,805,790
Net position:Net investment in capital assets 120,842,429 115,421,743 53,139,446 45,479,549 173,981,875 160,901,292 Restricted 31,144,779 25,084,068 — — 31,144,779 25,084,068 Unrestricted (115,404,022) (107,240,504) 11,637,079 17,709,195 (103,766,943) (89,531,309)
Total net position $ 36,583,186 33,265,307 64,776,525 63,188,744 101,359,711 96,454,051
Summary of Net PositionJune 30, 2018 and 2017
As noted earlier, net position may serve over time as a useful indicator of the City’s financial position. In the case of the City, assets and deferred outflow of resources exceeded liabilities and deferred inflow of resources by $101,359,711 at June 30, 2018
The largest portion of the City’s net position of $173,981,875 reflects its investment in capital assets (e.g., land, buildings, infrastructure, machinery and equipment, etc.), less any related debt used to acquire those assets that are still outstanding. The City uses these capital assets to provide services to citizens; consequently, these assets are not available for future spending. Although the City’s investment in its capital assets is reported net investment in capital assets, it should be noted that the resources needed to repay this debt must be provided from other sources, since the capital assets themselves cannot be used to liquidate these liabilities.
The second largest portion of the City’s net position of $31,144,779 represent resources that are subject to external restrictions on how they may be used. The remaining portion of the City’s net position is unrestricted and may be used to meet the City’s ongoing obligations to citizens and creditors. At June 30, 2018, unrestricted net deficit was $103,766,943.
CITY OF ALHAMBRA Management’s Discussion and Analysis
June 30, 2018
7 (Continued)

Summary of Activities Year ended June 30, 2018 and 2017
Governmental Business-typeactivities activities Total
2018 2017 2018 2017 2018 2017Revenues:
Program revenues:Charges for services $ 12,689,024 12,444,393 33,548,565 32,175,939 46,237,589 44,620,332 Operating grants and contributions 9,846,179 7,772,546 — — 9,846,179 7,772,546 Capital grants and contributions 3,745,923 1,011,554 — — 3,745,923 1,011,554
General revenues 62,118,937 56,361,654 587,286 638,493 62,706,223 57,000,147
Total revenues 88,400,063 77,590,147 34,135,851 32,814,432 122,535,914 110,404,579 Expenses:
General government 2,254,771 1,204,966 — — 2,254,771 1,204,966 Public safety 52,793,851 48,449,596 — — 52,793,851 48,449,596 Public works 8,721,130 8,643,223 — — 8,721,130 8,643,223 Housing, health, and community
development 8,259,246 7,640,825 — — 8,259,246 7,640,825 Culture and recreation 12,602,723 10,371,792 — — 12,602,723 10,371,792 Interest on long-term debt 886,838 1,036,198 — — 886,838 1,036,198 Water — — 17,748,467 17,159,580 17,748,467 17,159,580 Sewer and storm drain — — 3,480,155 2,339,224 3,480,155 2,339,224 Sanitation — — 9,244,338 8,942,478 9,244,338 8,942,478 Golf course/clubhouse — — 1,638,735 1,677,903 1,638,735 1,677,903
Total expenses 85,518,559 77,346,600 32,111,695 30,119,185 117,630,254 107,465,785 Increase (decrease) in net position before
other gains, losses, and transfers 2,881,504 243,547 2,024,156 2,695,247 4,905,660 2,938,794 Special items — (5,861,281) — — — (5,861,281) Transfers in (out) 436,375 808,050 (436,375) (808,050) — —
Increase (decrease) in net position 3,317,879 (4,809,684) 1,587,781 1,887,197 4,905,660 (2,922,487)
Net position, July 1, as restated 33,265,307 38,074,991 63,188,744 61,301,547 96,454,051 99,376,538 Net position, June 30 $ 36,583,186 33,265,307 64,776,525 63,188,744 101,359,711 96,454,051
Governmental Activities. Governmental activities increased the City’s net position by $3,317,879.
Governmental Revenues. Governmental revenues increased by $10,809,916 or 13.9%. There are numerous items which account for the net increase form prior year, however significant increases were the recognition of an additional $2 million of Community Development Block Grant revenues due to additional project costs, additional $2.4 million of Housing Asset Fund revenues from payment received from Successor Agency of the Former Redevelopment Agency, additional $1.2 million of revenues from federal grant revenues for street project, additional property tax revenues of $823,767, and revenues of $1.4 million from two new state and county transportation related funding sources.
Governmental Expenses. Governmental expenses increased by $8,171,959 or 10.6%. There are several reasons which account for this decrease, however the primary reasons for this increase is an increase in public safety of $4,344,255. This increase is due primarily to an increase in recognition of pension and other post-employment expense of $3,773,737 compared to prior year.
CITY OF ALHAMBRA Management’s Discussion and Analysis
June 30, 2018
8 (Continued)

$0
$10,000,000
$20,000,000
$30,000,000
$40,000,000
$50,000,000
$60,000,000
Generalgovernment
Public safety Public works Housing, health,and community
development
Culture andrecreation
Interest on long-term debt
Expense and Program RevenuesGovernmental Activities
For the year ending June 30, 2018
Expenses Program Revenue
Charges for services11%
Operating grants and contributions
9%
Capital grants and cont3%
Property taxes17%
Sales taxes15%Business license
1%
Utility users tax3%
Other taxes1%
Investment earnings0%
Other40%
Revenue by Source - Governmental Activities
CITY OF ALHAMBRA Management’s Discussion and Analysis
June 30, 2018
9 (Continued)
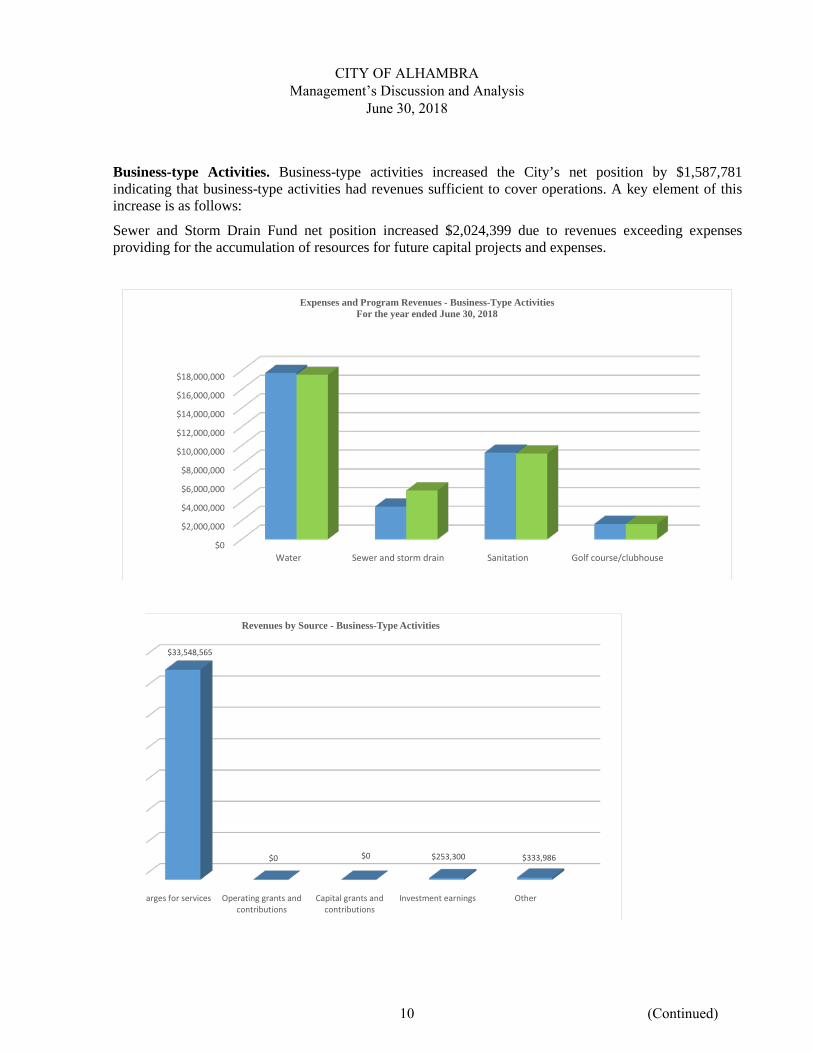
Business-type Activities. Business-type activities increased the City’s net position by $1,587,781 indicating that business-type activities had revenues sufficient to cover operations. A key element of this increase is as follows:
Sewer and Storm Drain Fund net position increased $2,024,399 due to revenues exceeding expenses providing for the accumulation of resources for future capital projects and expenses.
$0
$2,000,000
$4,000,000
$6,000,000
$8,000,000
$10,000,000
$12,000,000
$14,000,000
$16,000,000
$18,000,000
Water Sewer and storm drain Sanitation Golf course/clubhouse
Expenses and Program Revenues - Business-Type ActivitiesFor the year ended June 30, 2018
arges for services Operating grants andcontributions
Capital grants andcontributions
Investment earnings Other
$33,548,565
$0 $0 $253,300 $333,986
Revenues by Source - Business-Type Activities
CITY OF ALHAMBRA Management’s Discussion and Analysis
June 30, 2018
10 (Continued)

Financial Analysis of the City’s Major Funds
Governmental Funds. The focus of the City’s governmental funds is to provide information on near-term inflows, outflows, and balances of spendable resources. Such information may be useful in assessing the City’s financing requirements. Below is an analysis of the City’s major governmental fund for the year ended June 30, 2018.
June 30, June 30, Amount Percentage2018 2017 Increase Increase
Fund Balance:General Fund $ 25,413,325 23,528,622 1,884,703 8%Community Development Block Grant Fund (3,906,213) (1,638,833) (2,267,380) 138%Tranportation Capital Improvement Fund (1,225,518) (8,538) (1,216,980) 14254%
Total Fund Balance (Deficit) $ 20,281,594 21,881,251 (1,599,657) 14400%
The General Fund is the chief operating fund of the City. At the end of the current fiscal year, the fund balance was $25,413,325 which increased by $1,884,703 during the current fiscal year. Key factors for changes in the current fiscal year fund balance are as follows: Total revenues increased $1,794,043 primarily due to an increase in property taxes of $823,767, building permit revenues of $587,378 and an increase of $455,960 in state vehicle license fees. Total expenditures increased $1,370,222 due to numerous reasons including an increase in personnel costs for public safety of $1,269,379. Transfers out decreased $1,321,542 primarily from transfer in prior year of $2,000,000 to the reduce deficit fund balance in the Self-Insurance Internal Service Fund.
The Community Development Block Grant Fund utilizes federal grant monies received from the U.S. Department of Housing and Urban Development along with miscellaneous program income to develop certain project areas in accordance with HUD regulations. At the end of the current fiscal year, the fund deficit was $3,906,213 which decreased by $2,267,380 during the current fiscal year. The net decrease in fund balance is primarily due to timing differences in the recording of grant revenues and expenditures.
The Transportation Capital Improvement Fund utilizes federal, state, and county monies for street related projects. At the end of the current fiscal year, the fund deficit was $1,225,518 which decreased by $1,216,980 during the current fiscal year. The net decrease in fund balance is primarily due to timing differences in the recording of revenues and expenditures.
CITY OF ALHAMBRA Management’s Discussion and Analysis
June 30, 2018
11 (Continued)
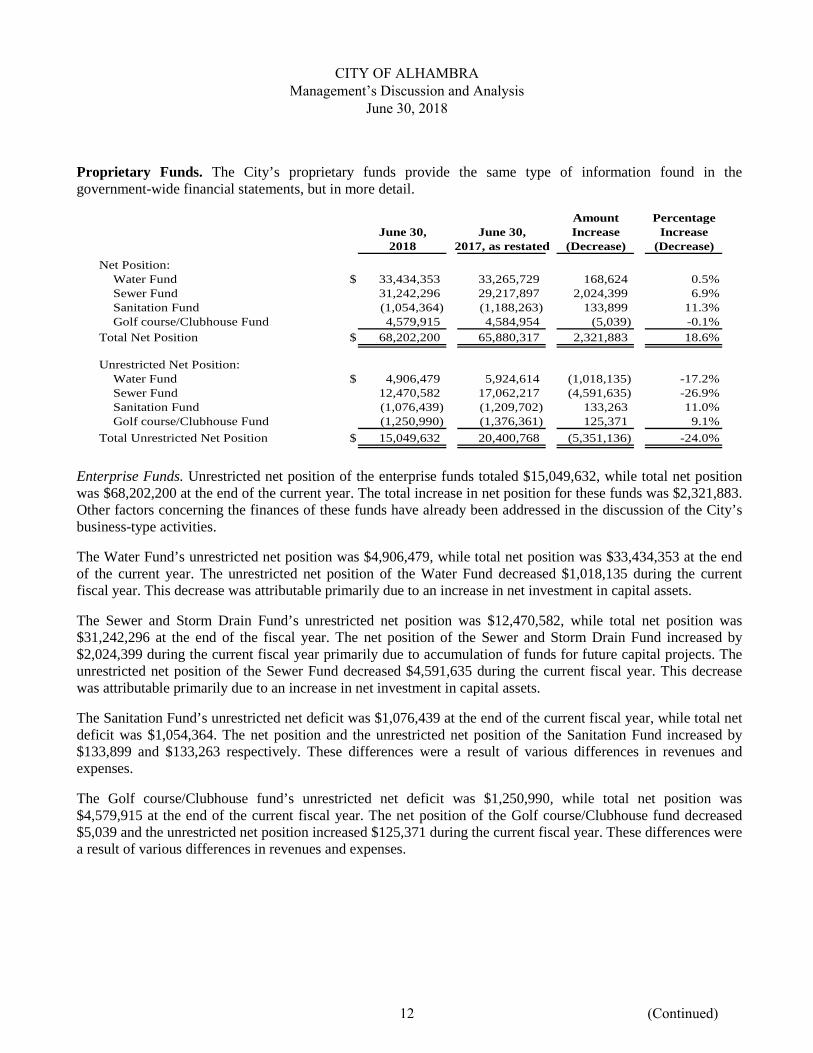
Proprietary Funds. The City’s proprietary funds provide the same type of information found in the government-wide financial statements, but in more detail.
Amount PercentageJune 30, June 30, Increase Increase
2018 2017, as restated (Decrease) (Decrease)Net Position:
Water Fund $ 33,434,353 33,265,729 168,624 0.5%Sewer Fund 31,242,296 29,217,897 2,024,399 6.9%Sanitation Fund (1,054,364) (1,188,263) 133,899 11.3%Golf course/Clubhouse Fund 4,579,915 4,584,954 (5,039) -0.1%
Total Net Position $ 68,202,200 65,880,317 2,321,883 18.6%
Unrestricted Net Position:Water Fund $ 4,906,479 5,924,614 (1,018,135) -17.2%Sewer Fund 12,470,582 17,062,217 (4,591,635) -26.9%Sanitation Fund (1,076,439) (1,209,702) 133,263 11.0%Golf course/Clubhouse Fund (1,250,990) (1,376,361) 125,371 9.1%
Total Unrestricted Net Position $ 15,049,632 20,400,768 (5,351,136) -24.0%
Enterprise Funds. Unrestricted net position of the enterprise funds totaled $15,049,632, while total net position was $68,202,200 at the end of the current year. The total increase in net position for these funds was $2,321,883. Other factors concerning the finances of these funds have already been addressed in the discussion of the City’s business-type activities.
The Water Fund’s unrestricted net position was $4,906,479, while total net position was $33,434,353 at the end of the current year. The unrestricted net position of the Water Fund decreased $1,018,135 during the current fiscal year. This decrease was attributable primarily due to an increase in net investment in capital assets.
The Sewer and Storm Drain Fund’s unrestricted net position was $12,470,582, while total net position was $31,242,296 at the end of the fiscal year. The net position of the Sewer and Storm Drain Fund increased by $2,024,399 during the current fiscal year primarily due to accumulation of funds for future capital projects. The unrestricted net position of the Sewer Fund decreased $4,591,635 during the current fiscal year. This decrease was attributable primarily due to an increase in net investment in capital assets.
The Sanitation Fund’s unrestricted net deficit was $1,076,439 at the end of the current fiscal year, while total net deficit was $1,054,364. The net position and the unrestricted net position of the Sanitation Fund increased by $133,899 and $133,263 respectively. These differences were a result of various differences in revenues and expenses.
The Golf course/Clubhouse fund’s unrestricted net deficit was $1,250,990, while total net position was $4,579,915 at the end of the current fiscal year. The net position of the Golf course/Clubhouse fund decreased $5,039 and the unrestricted net position increased $125,371 during the current fiscal year. These differences were a result of various differences in revenues and expenses.
CITY OF ALHAMBRA Management’s Discussion and Analysis
June 30, 2018
12 (Continued)

General Fund Budgetary Highlights
In the General Fund, differences between the original budget and the final amended budget resulted in a net increase in appropriation of $887,415 (net of prior year carryover of available and encumbered balances) and can be briefly summarized as follows:
• $20,000 in increases allocated to various general government departments
• $42,700 in increases allocated to the library department
• $75,900 in increases allocated to the parks and recreation department
• $78,050 in increases allocated to public safety
• $670,765 in increases allocated to community development department
The increase in various general government departments included various appropriation adjustments resulting in a net increase of $20,000 funded by available fund balance. The increase in library department of $42,700 included $35,200 for library books and materials funded from donations made to the library and $7,500 funded from grant revenues.. The increase in parks and recreation of $75,900 was funded from a $5,900 donation for a playground and transfers from general government of $70,000 to fund various expenditures. The increase of $78,050 in public safety included $68,050 for alcohol and beverage control funded from a state grant and $10,000 for equipment and training funded by a federal urban area security grant. The increase in community development department included $15,000 for general plan amendment and $655,765 for various planning and building related services funded from service charges and available fund balance.
Also in the General Fund, differences between the final amended budget and the actual amounts for revenues, expenditures, and other financing sources and uses resulted in a net positive variance of $5,215,031. General fund revenues accounted for a positive variance of $1,568,117 resulting primarily from increased building permit revenue which has a positive variance of $1,357,779. The General Fund expenditures were under budget by $3,646,914. Expenditures for building and planning under budget by $1,358,938 due to building related contract services under budget and stormwater environmental compliance under budget by $549,554 due to project designs not completed and regulatory compliance contingency funds not expended. Capital outlay expenditures under budget by $401,513 primarily due to various general government projects budgeted but not expended and storm drain devices not installed as planned. There are various departments under budget and over budget which have a occurred for a multitude of reasons but have resulted in a positive variance for the General Fund.
Capital Asset and Debt Administration
Capital Assets. The City’s investment in capital assets for its governmental and business-type activities amounts to $199,953,915 (net of accumulated depreciation of $117,069,219) as of June 30, 2018. This investment in capital assets includes land, buildings, improvements other than building, infrastructure (roads, sidewalks, land held under easement, streetlights, etc.), and machinery and equipment.
CITY OF ALHAMBRA Management’s Discussion and Analysis
June 30, 2018
13 (Continued)

Capital Assets(Net of Accumulated Depreciation)
June 30, 2018 and 2017
Governmental Business-typeactivities activities Total
2018 2017 2018 2017 2018 2017
Land $ 22,035,738 22,035,738 5,769,073 5,769,073 27,804,811 27,804,811 Buildings, structures, and improvements 58,087,717 58,579,075 10,797,727 11,134,691 68,885,444 69,713,766 Machinery and equipment 5,201,070 5,426,046 1,067,484 757,684 6,268,554 6,183,730 Utility systems — — 36,257,608 32,366,990 36,257,608 32,366,990 Infrastructure 50,053,955 49,276,881 — — 50,053,955 49,276,881 Construction in progress 4,699,161 1,548,674 5,984,382 3,196,944 10,683,543 4,745,618
Total $ 140,077,641 136,866,414 59,876,274 53,225,382 199,953,915 190,091,796
Additional information on the City’s capital assets can be found in notes to the basic financial statements on pages 52 through 56 of this report.
Major capital asset events during the current fiscal year included the following:
Governmental activities
• Machinery and equipment additions included various equipment, motor vehicles, street sweeper, and buses. Deletions included vehicles and computer equipment.
• Construction in progress increased due to various street and park projects in process to be completed next fiscal year.
• Infrastructure additions and deletions included improvement and replacement of streets, sidewalks, alleys, and traffic signals.
Business-type activities
• Machinery and equipment additions included various equipment, motor vehicles, street sweeper, and buses. Deletions included various vehicles.
• Utility systems additions primarily included sewer main line improvements along with other water and sewer infrastructure improvements and deletions included infrastructure removed or replaced due to improvements.
• Construction in progress increased due to sewer main rehabilitation projects in process to be completed next fiscal year.
Debt Administration. At the end of the current fiscal year, the City had total bonded debt outstanding of $22,840,000. Of this amount, $10,365,000 represents certificates of participation issued for various capital improvements including police facility, $6,085,000 represents lease revenue bonds for the construction of a parking structure, $5,785,000 represents revenue bonds for water treatment plant, and $605,000 represents special assessment bonds to finance public works maintenance and improvement projects. Additions to the City’s long-term debt included net increase in pension liability of $7,903,697 and net increase in outstanding claims of $1,405,878. Deductions include and net decrease in benefits payable of $60,414, net decrease in other post-employment liability of $1,175,000, and the repayment of outstanding principal totaling $3,444,403.
CITY OF ALHAMBRA Management’s Discussion and Analysis
June 30, 2018
14 (Continued)

Outstanding DebtJune 30, 2018 and 2017
Governmental Business-typeactivities activities Total
2017 2017 20172018 as restated 2018 as restated 2018 as restated
Bonded indebtedness:Certificates of participation $ 10,365,000 11,705,000 — — 10,365,000 11,705,000 Lease revenue bonds 6,085,000 6,215,000 — — 6,085,000 6,215,000 Revenue bonds — — 5,785,000 6,480,000 5,785,000 6,480,000 Assessment district bonds 605,000 1,175,000 — — 605,000 1,175,000
Other long-term debt:Capital lease obligations 933,892 1,201,325 5,962 11,672 939,854 1,212,997 Benefits payable 2,759,506 2,882,466 326,210 263,664 3,085,716 3,146,130 Pension liability 126,403,021 119,237,477 14,278,116 13,539,963 140,681,137 132,777,440 OPEB liability 20,699,611 21,720,742 2,941,389 3,095,258 23,641,000 24,816,000 Self insurance claims payable 16,637,138 15,231,260 — — 16,637,138 15,231,260 Notes and loans payable 918,708 1,159,186 195,781 391,563 1,114,489 1,550,749
$ 185,406,876 180,527,456 23,532,458 23,782,120 208,939,334 204,309,576
Additional information on the City’s debt can be found in notes to the basic financial statements on pages 59 through 64 of this report.
As of June 30, 2018 Standard & Poors credit market services has assigned a rating of “AA-“ to the City. This rating has been raised to “AA“ as of August 17, 2018.
State statutes limit the amount of general obligations debt a governmental entity may issue to 15% of its total assessed valuation. The current debt limitation for the City is $331,335,476. The City currently has no general obligation debt.
Next Year’s Budget
The fiscal year 2018-2019 budget is basically a “hold the line” budget due to a nationwide slow economic recovery. However, as in past budgets, the City’s emphasis is on future economic development efforts to continue to strengthen the City’s revenue base. The major thrust of the 2018-19 City of Alhambra Annual Budget is infrastructure improvements including water and sewer system improvements and enhancements, various street and traffic projects, public safety and golf course improvements. While the local economy is sluggish in its recovery, the City is “cautiously optimistic” and the budget projections for the fiscal year 2018-19 remain conservatively optimistic. Lastly the budget includes an increase to General Fund Reserves, no tax increases, no layoffs, no mandatory furloughs and no restrictions to on-going vital services.
Request for Information
This financial report is designed to provide a general overview of the City’s finances for readers of the financial statements. Questions concerning any of the information in this report or request for additional financial information should be addressed to the Director of Finance, 111 South First Street, Alhambra, CA 91801.
CITY OF ALHAMBRA Management’s Discussion and Analysis
June 30, 2018
15

Basic Financial Statements


CITY OF ALHAMBRA
Statement of Net Position
June 30, 2018
Governmental Business-typeAssets Activities Activities Total
Cash and investments $ 54,362,230 29,218,429 83,580,659 Restricted cash and investments 1,107,801 451,950 1,559,751 Accounts receivable 8,183,483 5,101,846 13,285,329 Loans receivable 204,405 — 204,405 Due from Successor Agency 237,722 — 237,722 Internal balances 4,617,253 (4,617,253) — Inventories 62,158 655,964 718,122
1,647,613 20,721 1,668,334 Land held for resale 529,680 — 529,680 Capital assets not being depreciated 26,734,899 11,753,455 38,488,354 Capital assets, net of accumulated depreciation 113,342,742 48,122,819 161,465,561
Total assets 211,029,986 90,707,931 301,737,917
Deferred outflow of resources:Deferred amounts from pensions 30,021,140 3,333,189 33,354,329 Deferred amounts from other post employment benefits 434,921 58,079 493,000
Total deferred outflow of resources 30,456,061 3,391,268 33,847,329
Liabilities
Liabilities:Accounts payable 3,661,811 3,114,138 6,775,949 Accrued liabilities 2,476,047 — 2,476,047 Bond interest payable 360,179 96,417 456,596 Due to Successor Agency 12,428 — 12,428 Deposits 1,245,209 451,890 1,697,099 Retentions payable 154,695 114,658 269,353 Long-term liabilities:
Due within one year 5,724,989 967,520 6,692,509 Due in more than one year 179,632,129 23,315,023 202,947,152
Total liabilities 193,267,487 28,059,646 221,327,133
Deferred inflow of resources:Deferred amounts from pensions 8,190,155 940,310 9,130,465 Deferred amounts from other post employment benefits 2,253,282 322,718 2,576,000 Deferred amount from bond refunding 1,191,937 — 1,191,937
Total deferred inflow of resources 11,635,374 1,263,028 12,898,402
Net Position
Net investment in capital assets 120,842,429 53,139,446 173,981,875
Debt service 790,105 — 790,105 Law enforcement 843,573 — 843,573 Streets and transportation 20,791,627 — 20,791,627 Air quality 125,450 — 125,450 Community development 463,129 — 463,129 Parking structure project 259,325 — 259,325 Low and moderate housing 7,871,570 — 7,871,570
Unrestricted (115,404,022) 11,637,079 (103,766,943) Total net position $ 36,583,186 64,776,525 101,359,711
Prepaid items
Restricted for:
Net position:
See accompanying notes to financial statements 16

CITY OF ALHAMBRA
Statement of Activities
Year ended June 30, 2018
Net (expenses) revenues andProgram revenues changes in net assets
Operating Capital Charges for grants and grants and Governmental Business-type
Expenses services contributions contributions activities activities Total
Functions/programs primary government:Governmental activities:
General government $ 2,254,771 1,611,247 — — (643,524) — (643,524) Public safety 52,793,851 4,767,875 494,435 — (47,531,541) — (47,531,541) Public works 8,721,130 861,322 1,940,977 3,745,923 (2,172,908) — (2,172,908) Housing, health, and community development 8,259,246 4,500,184 6,939,829 — 3,180,767 — 3,180,767 Culture and recreation 12,602,723 948,396 470,938 — (11,183,389) — (11,183,389) Interest on long-term debt 886,838 — — — (886,838) — (886,838)
Total governmental activities 85,518,559 12,689,024 9,846,179 3,745,923 (59,237,433) — (59,237,433)
Business-type activities:Water 17,748,467 17,552,925 — — — (195,542) (195,542) Sewer and storm drain 3,480,155 5,208,405 — — — 1,728,250 1,728,250 Sanitation 9,244,338 9,158,889 — — — (85,449) (85,449) Golf course/clubhouse 1,638,735 1,628,346 — — — (10,389) (10,389)
32,111,695 33,548,565 — — — 1,436,870 1,436,870 Total $ 117,630,254 46,237,589 9,846,179 3,745,923 (59,237,433) 1,436,870 (57,800,563)
General revenues:Property taxes 19,008,940 — 19,008,940 Sales tax 17,247,093 — 17,247,093 Utility users tax 3,884,135 — 3,884,135 Franchise tax 1,679,409 — 1,679,409 Business license tax 1,667,331 — 1,667,331 Other taxes 1,325,738 — 1,325,738 Unrestricted intergovernmental 9,335,408 — 9,335,408 Unrestricted investment earnings 410,811 253,300 664,111 Miscellaneous 7,560,072 333,986 7,894,058
Transfers 436,375 (436,375) —
Total general revenues and transfers 62,555,312 150,911 62,706,223
Change in net position 3,317,879 1,587,781 4,905,660
33,265,307 63,188,744 96,454,051 Net position – end of year $ 36,583,186 64,776,525 101,359,711
Total business-type activities
Net position – beginning of year, as restated
See accompanying notes to financial statements 17

CITY OF ALHAMBRABalance Sheet – Governmental Funds
June 30, 2018
SpecialRevenue Fund
Community Transportation Nonmajor TotalsDevelopment Capital Governmental Governmental
General Block Grant Improvement Funds Funds Assets
Cash and investments $ 16,871,235 — — 28,624,630 45,495,865 Restricted cash and investments — — 73,018 1,034,783 1,107,801 Receivables:
Accounts 5,439,239 4,303,016 1,225,518 887,635 11,855,408 Loans — 204,405 — — 204,405
8,574,540 — — 12,783 8,587,323 Due from Successor Agency 237,722 — — — 237,722 Inventories 62,158 — — — 62,158 Prepaid items 35,248 — — — 35,248 Property held for resale — — — 529,680 529,680
Total assets $ 31,220,142 4,507,421 1,298,536 31,089,511 68,115,610
Liabilities and Fund BalancesLiabilities:
Accounts payable $ 1,417,595 483,557 390,949 803,487 3,095,588 Accrued liabilities 2,476,047 — — — 2,476,047 Due to other funds — 3,724,226 762,396 151,492 4,638,114 Due to Successor Agency 12,428 — — — 12,428 Deposits 1,242,405 — — — 1,242,405 Retentions payable — 48,371 90,854 15,470 154,695 Unearned revenues — 3,742,537 — — 3,742,537
Total liabilities 5,148,475 7,998,691 1,244,199 970,449 15,361,814 Deferred inflow of resources:
Unavailable revenues 658,342 414,943 1,279,855 130,208 2,483,348 Fund balances:
Nonspendable:Prepaid items 35,248 — — — 35,248 Due from Successor Agency 237,722 — — — 237,722 Inventories 62,158 — — — 62,158
Restricted for:Law enforcement 109,827 — — 520,006 629,833 Streets and transportation — — — 19,456,489 19,456,489 Air quality — — — 125,450 125,450 Parking structure — — — 259,325 259,325 Community development — — — 38,090 38,090 Police facility — — — 148,911 148,911 Debt service — — — 790,105 790,105 Low and moderate housing — — — 7,871,570 7,871,570
Committed for:Emergency reserve 10,675,008 — — — 10,675,008 Legal liability reserve 3,000,000 — — — 3,000,000 Building and facility reserve 3,000,000 — — — 3,000,000 Equipment reserve 3,000,000 — — — 3,000,000 Art in public places 363,297 — — — 363,297
Assigned to:Continuing appropriations 711,056 — — — 711,056 Catch basin improvements 73,976 — — — 73,976 Public safety capital outlay 691,396 — — — 691,396 Various capital improvements 800,000 — — 794,402 1,594,402 Public safety communications improvements 382,763 — — — 382,763 Park improvements 550,000 — — — 550,000 City hall improvements 26,811 — — — 26,811 Technology upgrades 538,973 — — — 538,973 Library building repairs 362,500 — — — 362,500 Capital projects 792,590 792,590
Unassigned — (3,906,213) (1,225,518) (15,494) (5,147,225) Total fund balances 25,413,325 (3,906,213) (1,225,518) 29,988,854 50,270,448 Total liabilities and fund balances $ 31,220,142 4,507,421 1,298,536 31,089,511 68,115,610
Due from other funds
See accompanying notes to financial statements 18
CITY OF ALHAMBRA
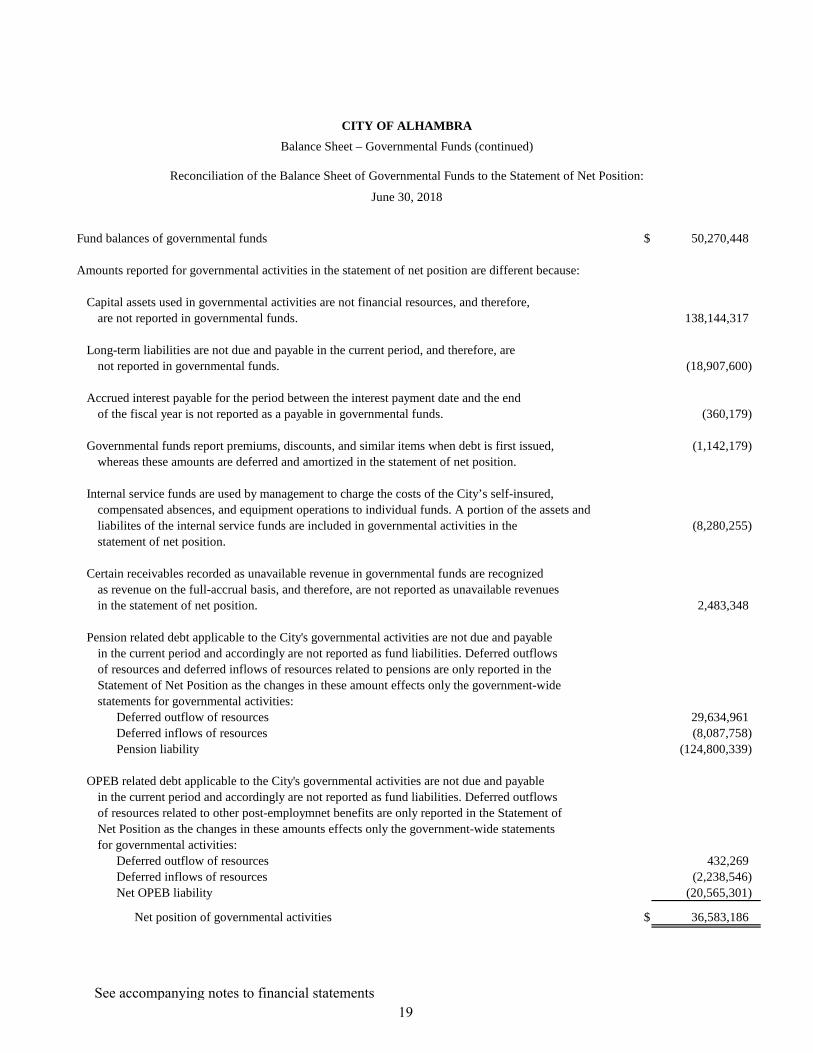
Fund balances of governmental funds $ 50,270,448
Amounts reported for governmental activities in the statement of net position are different because:
Capital assets used in governmental activities are not financial resources, and therefore,are not reported in governmental funds. 138,144,317
Long-term liabilities are not due and payable in the current period, and therefore, arenot reported in governmental funds. (18,907,600)
Accrued interest payable for the period between the interest payment date and the endof the fiscal year is not reported as a payable in governmental funds. (360,179)
Governmental funds report premiums, discounts, and similar items when debt is first issued, (1,142,179) whereas these amounts are deferred and amortized in the statement of net position.
Internal service funds are used by management to charge the costs of the City’s self-insured,compensated absences, and equipment operations to individual funds. A portion of the assets andliabilites of the internal service funds are included in governmental activities in the (8,280,255) statement of net position.
Certain receivables recorded as unavailable revenue in governmental funds are recognizedas revenue on the full-accrual basis, and therefore, are not reported as unavailable revenuesin the statement of net position. 2,483,348
Pension related debt applicable to the City's governmental activities are not due and payablein the current period and accordingly are not reported as fund liabilities. Deferred outflowsof resources and deferred inflows of resources related to pensions are only reported in theStatement of Net Position as the changes in these amount effects only the government-widestatements for governmental activities:
Deferred outflow of resources 29,634,961 Deferred inflows of resources (8,087,758) Pension liability (124,800,339)
OPEB related debt applicable to the City's governmental activities are not due and payablein the current period and accordingly are not reported as fund liabilities. Deferred outflowsof resources related to other post-employmnet benefits are only reported in the Statement ofNet Position as the changes in these amounts effects only the government-wide statementsfor governmental activities:
Deferred outflow of resources 432,269 Deferred inflows of resources (2,238,546) Net OPEB liability (20,565,301)
Net position of governmental activities $ 36,583,186
Balance Sheet – Governmental Funds (continued)
June 30, 2018
Reconciliation of the Balance Sheet of Governmental Funds to the Statement of Net Position:
See accompanying notes to financial statements 19

CITY OF ALHAMBRAStatement of Revenues, Expenditures, and Changes in Fund Balances – Governmental Funds
Year ended June 30, 2018
Community Transportation Nonmajor TotalsDevelopment Capital Governmental Governmental
General Block Grant Improvement Funds FundsRevenues:
Taxes and assessments $ 38,533,607 — — 6,160,577 44,694,184 Licenses and permits 4,025,336 — — — 4,025,336 Intergovernmental 9,996,403 5,000,748 8,538 8,208,462 23,214,151 Investment earnings 544,314 — — 169,806 714,120 Charges for services 5,675,206 — — 102,282 5,777,488 Fines and forfeitures 2,500,167 — — — 2,500,167 Other 3,748,205 — — 3,015,811 6,764,016
Total revenues 65,023,238 5,000,748 8,538 17,656,938 87,689,462 Expenditures:
Current:General government 892,053 — — — 892,053 Public safety 46,043,408 — — 1,579,295 47,622,703 Public works 839,099 — — 3,369,526 4,208,625 Housing, health, and community development 4,681,558 899,023 — 2,511,327 8,091,908 Culture and recreation 8,779,884 — — 69,037 8,848,921
Capital outlay 420,879 6,254,193 2,103,346 3,023,833 11,802,251 Debt service:
Principal retirement 261,799 — — 2,286,112 2,547,911 Interest and fiscal charges 42,289 — — 1,118,019 1,160,308
Total expenditures 61,960,969 7,153,216 2,103,346 13,957,149 85,174,680 Excess (deficiency) of revenues over
expenditures 3,062,269 (2,152,468) (2,094,808) 3,699,789 2,514,782 Other financing sources (uses):
Transfers in 1,619,170 — 877,828 5,059,992 7,556,990 Transfers out (2,799,366) (114,912) — (4,035,974) (6,950,252) Sale of capital assets 2,630 — — 29,310 31,940
Total other financing sources (uses) (1,177,566) (114,912) 877,828 1,053,328 638,678
Net change in fund balances 1,884,703 (2,267,380) (1,216,980) 4,753,117 3,153,460 Fund balances (deficits) at July 1 23,528,622 (1,638,833) (8,538) 25,235,737 47,116,988 Fund balances (deficits) at June 30 $ 25,413,325 (3,906,213) (1,225,518) 29,988,854 50,270,448
SpecialRevenue Fund
See accompanying notes to financial statements 20

CITY OF ALHAMBRA
Statement of Revenues, Expenditures, and Changes in Fund Balances – Governmental Funds (continued)
Year ended June 30, 2018
Amounts reported for governmental activities in the statement of activities are different because:
Net change in fund balances – governmental funds $ 3,153,460
Governmental funds report capital outlays as expenditures. However, in the statement of activities, the costs of those assets is allocated over their estimated useful lives, and reported as depreciation expense. This is the amount by which capital outlays of $8,383,747 exceeded the disposition of capital assets net, of $(604,189) 3,046,306 and depreciation of ($4,733,252) in the current period.
Repayment of long-term liability principal is an expenditure in the governmental funds, but the repayment reduces long-term liabilities in the statement of net position. 2,547,911
Proceeds of long-term debt is an other financing source in the governmental funds, but the receipt increases long-term liabilities in the statement of net position. Also, governmental funds report premiums, discounts,and similar items when debt is first issued, whereas these amounts are deferred and amortized in the statementof activities. This amount is the net effect of these differences in the treatment of long-term debt andrelated items. 228,589
Accrued interest payable for the period between the interest payment date and the end of the fiscal year is not reported as an expense in governmental fund statements. This difference between the prior year’s accrued interest expense and the current year’s accrued interest expense is reported in the statement of activities. 44,881
Other post-employment benefit expense reported in governmental funds include annual insurance premiumpayments. In the Statement of Activities, other post-employment benefit expense includes the change in the total other post-employment benefit liability, and related change in other post-employment benefit amountsfor deferred outflows of resources and deferred inflow of resources. (1,136,784)
Internal service funds are used by management to charge the costs of the City’s self-insurance, compensated absences, and equipment operations to individual funds. The net revenues (expenses) of the internal service funds are reported with governmental activities included in governmental activities. (2,256,578)
Certain receivables recorded as unavailable revenue in governmental funds are recognized as revenue on the full-accrual basis, and therefore, are reported as revenues in the statement of activities. (306,430)
Pension expense reported in governmental funds includes the annual required contributions. In the Statementof Activities, pension expense includes the change in the net pension liability, and related change in pensionamounts for deferred outflows of resources and deferred inflow of resources. (2,003,476)
Change in net position of governmental activities $ 3,317,879
See accompanying notes to financial statements 21

CITY OF ALHAMBRA
Statement of Revenues, Expenditures, and Changes in Fund Balance – Budget and Actual
General Fund
Year ended June 30, 2018
Variance withfinal budget
Original Final Positivebudget budget Actual (Negative)
Revenues:Taxes:
Property taxes $ 12,624,179 12,624,179 12,848,363 224,184 Sales tax 17,104,000 17,104,000 16,462,229 (641,771) Public safety sales tax 731,255 731,255 784,864 53,609 Franchise tax 1,500,000 1,500,000 1,595,395 95,395 Business license tax 1,650,000 1,650,000 1,667,331 17,331 Documentary transfer tax 200,000 200,000 278,706 78,706 Utility users tax 3,900,000 3,900,000 3,884,135 (15,865) Other 997,000 997,000 1,012,584 15,584
Total taxes 38,706,434 38,706,434 38,533,607 (172,827)
Licenses and permits:Building permits 1,025,000 1,025,000 2,382,779 1,357,779 Parking permits 1,405,000 1,405,000 1,576,380 171,380 Other 64,200 64,200 66,177 1,977
Total licenses and permits 2,494,200 2,494,200 4,025,336 1,531,136
Intergovernmental:State vehicle license 9,213,281 9,213,281 9,335,408 122,127 State police training grants 34,946 34,946 30,687 (4,259) Homeland security grants 37,351 47,351 81,263 33,912 Federal summer food grant 190,000 190,000 145,512 (44,488) Other 431,767 589,817 403,533 (186,284)
Total intergovernmental 9,907,345 10,075,395 9,996,403 (78,992)
Investment earnings:Investment income 495,798 495,798 410,018 (85,780) Jail lease revenue 81,000 81,000 134,296 53,296
Total investment earnings 576,798 576,798 544,314 (32,484)
Charges for services:Zoning and subdivision 225,000 225,000 275,580 50,580 Plan checking fees 1,125,000 1,315,000 1,230,838 (84,162) Paramedics 1,756,500 1,756,500 1,682,766 (73,734) Park and recreation fees 529,900 535,800 849,942 314,142 Engineering fees and permits 555,000 555,000 816,916 261,916 Other 678,294 678,294 819,164 140,870
Total charges for services 4,869,694 5,065,594 5,675,206 609,612
Fines and forfeitures 2,630,500 2,630,500 2,500,167 (130,333) Interfund 3,200,000 3,200,000 3,150,000 (50,000) Other 663,500 706,200 598,205 (107,995)
Total revenues 63,048,471 63,455,121 65,023,238 1,568,117
See accompanying notes to financial statements 22

CITY OF ALHAMBRA
Statement of Revenues, Expenditures, and Changes in Fund Balance – Budget and Actual
General Fund
(Continued)
Year ended June 30, 2018
Variance withfinal budget
Original Final Positivebudget budget Actual (Negative)
Expenditures:Current:
General government:City council $ 352,929 352,929 227,557 125,372 City manager 1,253,397 1,283,397 1,021,772 261,625 City clerk 486,338 481,722 484,703 (2,981) Communications 199,639 186,103 157,809 28,294 Finance 1,918,362 1,918,362 1,869,109 49,253 City attorney 620,000 620,000 341,006 278,994 Human resources 979,115 979,115 816,081 163,034 General government buildings 381,469 381,469 370,762 10,707 General services 418,422 418,422 361,561 56,861 Community promotion 247,425 237,425 236,833 592 Marketing 103,800 107,760 75,266 32,494
237,556 237,556 293,747 (56,191) Cost allocation (6,182,725) (6,182,725) (5,364,153) (818,572)
Total general government 1,015,727 1,021,535 892,053 129,482
Public safety:Police 26,319,964 26,388,014 25,374,872 1,013,142 Police – public safety augmentation 533,862 533,862 474,657 59,205 Parking enforcement 1,702,069 1,702,069 1,364,889 337,180 Fire 17,650,232 17,663,230 18,427,216 (763,986) Fire – public safety augmentation 165,161 164,163 174,657 (10,494) Hazardous materials 53,048 53,048 53,546 (498) Disaster preparedness 31,529 31,529 24,308 7,221 Hearing office 49,643 49,643 60,798 (11,155) Animal control 138,616 138,616 88,465 50,151
Total public safety 46,644,124 46,724,174 46,043,408 680,766
Public works:Administration and engineering 1,064,840 1,064,840 839,099 225,741
Housing, health, and community development:Building and planning 4,662,904 5,333,669 3,974,731 1,358,938 Code enforcement 530,560 530,560 539,573 (9,013) Stormwater environmental compliance 716,808 716,808 167,254 549,554
Total housing, health, and community development 5,910,272 6,581,037 4,681,558 1,899,479
Non-departmental
See accompanying notes to financial statements 23

CITY OF ALHAMBRA
Statement of Revenues, Expenditures, and Changes in Fund Balance – Budget and Actual
General Fund
(Continued)
Year ended June 30, 2018
Variance withfinal budget
Original Final Positivebudget budget Actual (Negative)
Culture and recreation:Public library $ 3,216,758 3,218,408 2,875,499 342,909 Administration 766,575 806,575 771,328 35,247 Community services 736,317 742,217 755,036 (12,819) Recreation services 919,894 919,894 922,395 (2,501) Senior services 203,262 203,262 246,803 (43,541) Park operations 2,382,540 2,382,540 2,295,964 86,576 Lunch program 203,121 203,121 123,018 80,103 Aquatics 265,543 265,543 443,689 (178,146) Senior support 348,257 348,257 346,152 2,105
Total culture and recreation 9,042,267 9,089,817 8,779,884 309,933
Capital outlay:General government 165,000 165,656 45,332 120,324 Public safety 82,103 93,639 65,448 28,191 Public works 165,000 165,000 — 165,000 Housing, health, and community development 5,000 5,000 2,278 2,722 Culture and recreation 322,047 393,097 307,821 85,276
Total capital outlay 739,150 822,392 420,879 401,513
Debt service:Principal retirement 249,307 249,307 261,799 (12,492) Interest and fiscal changes 54,781 54,781 42,289 12,492
Total debt service 304,088 304,088 304,088 —
Total expenditures 64,720,468 65,607,883 61,960,969 3,646,914
Excess (deficiency) of revenues over expenditures (1,671,997) (2,152,762) 3,062,269 5,215,031
Other financing sources (uses):Transfers in 1,619,173 1,619,173 1,619,170 (3) Transfers out (4,197,058) (4,197,058) (2,799,366) 1,397,692 Sale of property — — 2,630 2,630
Total other financing sources (uses) (2,577,885) (2,577,885) (1,177,566) 1,400,319
Net change in fund balances (4,249,882) (4,730,647) 1,884,703 6,615,350
Fund balance at July 1 23,528,622 23,528,622 23,528,622 — Fund balance at June 30 $ 19,278,740 18,797,975 25,413,325 6,615,350
See accompanying notes to financial statements 24

CITY OF ALHAMBRA
Changes in Fund Balance – Budget and Actual
Community Development Block Grant Special Revenue Fund
Year ended June 30, 2018
Variance withfinal budget
Original Final Positivebudget budget Actual (Negative)
Revenues:Intergovernmental $ 570,646 570,646 5,000,748 4,430,102 Investment earnings 10,000 10,000 — (10,000)
Total revenues 580,646 580,646 5,000,748 4,420,102
Expenditures:Current: Housing, health, and community development 307,297 1,115,215 899,023 216,192 Capital outlay 6,310,551 6,310,551 6,254,193 56,358
Total expenditures 6,617,848 7,425,766 7,153,216 272,550
Deficiency of revenues overexpenditures (6,037,202) (6,845,120) (2,152,468) 4,692,652
Other financing uses:Transfers out (102,129) (102,129) (114,912) (12,783)
Net change in fund balances (6,139,331) (6,947,249) (2,267,380) 4,679,869
Fund deficit at July 1 (1,638,833) (1,638,833) (1,638,833) — Fund deficit at June 30 $ (7,778,164) (8,586,082) (3,906,213) 4,679,869
Statement of Revenues, Expenditures, and
See accompanying notes to financial statements 25

CITY OF ALHAMBRA
Changes in Fund Deficit – Budget and Actual
Year ended June 30, 2018
Variance withfinal budget
Original Final Positivebudget budget Actual (Negative)
Revenues:Intergovernmental $ 2,739,337 2,739,337 8,538 (2,730,799)
Expenditures:Capital outlay 4,231,635 4,231,635 2,103,346 2,128,289
Deficiency of revenues over(1,492,298) (1,492,298) (2,094,808) (602,510)
Other financing sources:Transfers in 908,000 908,000 877,828 (30,172)
Net change in fund balances (584,298) (584,298) (1,216,980) (632,682)
Fund deficit at July 1 (8,538) (8,538) (8,538) — Fund deficit at June 30 $ (592,836) (592,836) (1,225,518) (632,682)
Statement of Revenues, Expenditures and
expenditures
Transportation Capital Improvement Special Revenue Fund
See accompanying notes to financial statements 26

CITY OF ALHAMBRA
Statement of Net Position
Proprietary Funds
June 30, 2018Governmental
Activities –Enterprise funds Internal
Sewer and Golf course/ ServiceAssets Water storm drain Sanitation clubhouse Total Funds
Current assets:Cash and investments $ 13,707,327 14,721,616 789,361 125 29,218,429 8,866,365 Restricted cash and investments 451,950 — — — 451,950 — Accounts receivable 3,568,808 568,140 887,899 76,999 5,101,846 70,612 Inventories 655,964 — — — 655,964 — Prepaid items 20,721 — — — 20,721 1,612,365
Total current assets 18,404,770 15,289,756 1,677,260 77,124 35,448,910 10,549,342
Noncurrent assets:Capital assets:
Land 1,923,817 169,595 — 3,675,661 5,769,073 237,950 Building, structures, and improvements 41,690,076 15,409,296 — 7,078,444 64,177,816 — Machinery and equipment 2,754,340 1,233,791 641,727 66,453 4,696,311 6,375,610 Construction in progress — 5,984,382 — — 5,984,382 —
46,368,233 22,797,064 641,727 10,820,558 80,627,582 6,613,560 Less accumulated depreciation (11,119,634) (4,022,369) (619,652) (4,989,653) (20,751,308) (4,680,236)
Total capital assets, net of accumulateddepreciation 35,248,599 18,774,695 22,075 5,830,905 59,876,274 1,933,324 Total noncurrent assets 35,248,599 18,774,695 22,075 5,830,905 59,876,274 1,933,324
Total assets 53,653,369 34,064,451 1,699,335 5,908,029 95,325,184 12,482,666
Deferred outflow of resources:Deferred amounts from pensions 2,486,810 388,436 457,943 — 3,333,189 386,179 Deferred amounts from other post employment
benefits 44,023 6,144 7,912 — 58,079 2,652 Total deferred outflows 2,530,833 394,580 465,855 — 3,391,268 388,831
Liabilities
Current liabilities:Accounts payable 1,475,733 955,533 645,253 134,036 3,210,555 566,223 Due to other funds — — — 1,191,578 1,191,578 2,757,631 Compensated absences 50,091 2,061 3,625 — 55,777 471,836 Deposits 451,890 — — — 451,890 2,804 Retentions payable — 112,158 — 2,500 114,658 — Capital leases payable 2,981 2,981 — — 5,962 — Current portion – revenue bonds 710,000 — — — 710,000 — Current portion – loan payable 195,781 — — — 195,781 — Current portion – self insurance claims payable — — — — — 2,559,495
Total current liabilities 2,886,476 1,072,733 648,878 1,328,114 5,936,201 6,357,989 Long-term liabilities (net of current portion)
Revenue bonds 5,825,085 — — — 5,825,085 — 242,866 9,994 17,573 — 270,433 2,287,670
Pension liability 10,623,415 1,677,424 1,977,277 — 14,278,116 1,602,682 OPEB liability 2,229,547 311,151 400,691 — 2,941,389 134,310 Self insurance claims payable — — — — — 14,077,643
Total long-term liabilities 18,920,913 1,998,569 2,395,541 — 23,315,023 18,102,305
Total liabilities 21,807,389 3,071,302 3,044,419 1,328,114 29,251,224 24,460,294
Deferred inflow of resources:Deferred amounts from pensions 697,842 111,295 131,173 — 940,310 102,397 Deferred amounts from other post employment
benefits 244,618 34,138 43,962 — 322,718 14,736 Total deferred inflows 942,460 145,433 175,135 — 1,263,028 117,133
Net Position (Deficits)
Net Position (deficits)Net investment in capital assets 28,514,752 18,771,714 22,075 5,830,905 53,139,446 1,933,324 Unrestricted (deficit) 4,919,601 12,470,582 (1,076,439) (1,250,990) 15,062,754 (13,639,254)
Total net position (deficits) $ 33,434,353 31,242,296 (1,054,364) 4,579,915 68,202,200 (11,705,930)
Adjustment to reflect the consolidation of internal service fund activities related to enterprise funds (3,425,675) Net position of business-type activities $ 64,776,525
Compensated absences
See accompanying notes to financial statements 27

CITY OF ALHAMBRA
Proprietary Funds
Year ended June 30, 2018
GovernmentalActivities –
Enterprise funds InternalSewer and Golf course/ Service
Water storm drain Sanitation clubhouse Total Funds
Operating revenues:Charges for services $ 17,552,925 5,208,405 9,158,889 1,628,346 33,548,565 1,918,328 Self-insurance/compensated absences contributions — — — — — 10,751,094 Other 312,092 — 21,863 — 333,955 —
Total operating revenues 17,865,017 5,208,405 9,180,752 1,628,346 33,882,520 12,669,422
Operating expenses:Purchase of water 2,212,158 — — — 2,212,158 — Other water production 554,526 — — — 554,526 — Water pumping, transmission, and distribution 2,366,296 — — — 2,366,296 — General and administrative 10,960,437 — — — 10,960,437 — Water quality and environmental 130,857 — — — 130,857 — Water conservation 12,404 — — — 12,404 — Sewer and storm maintenance — 2,525,461 — — 2,525,461 — Sanitation — — 8,860,753 — 8,860,753 — Recycling — — 207,229 — 207,229 — Golf course — — — 1,263,151 1,263,151 — Golf course clubhouse — — — 129,619 129,619 — Claims and compensated absences expense — — — — — 14,072,082 Vehicle expense — — — — — 1,282,456 Depreciation 705,541 236,017 14,285 130,410 1,086,253 250,448
Total operating expenses 16,942,219 2,761,478 9,082,267 1,523,180 30,309,144 15,604,986
Operating income (loss) 922,798 2,446,927 98,485 105,166 3,573,376 (2,935,564)
Nonoperating revenues (expenses):Interest income 123,945 123,582 5,773 — 253,300 60,796 Interest expense (186,260) (256) — — (186,516) — Gain (loss) on disposal of equipment (843) — 792 — (51) (8,778) Other income — — 31 — 31 63,228 Other expense (328,922) (552,960) — — (881,882) —
Total nonoperating revenues (expenses) (392,080) (429,634) 6,596 — (815,118) 115,246 530,718 2,017,293 105,081 105,166 2,758,258 (2,820,318)
Transfers in 151,747 314,456 44,666 — 510,869 47,860 Transfers out (513,841) (307,350) (15,848) (110,205) (947,244) (218,223)
Change in net position 168,624 2,024,399 133,899 (5,039) 2,321,883 (2,990,681)
Net position (deficit) at July 1, as restated 33,265,729 29,217,897 (1,188,263) 4,584,954 (8,715,249) Net position (deficit) at June 30 $ 33,434,353 31,242,296 (1,054,364) 4,579,915 (11,705,930)
Adjustment to reflect the consolidation of internal service fund activities related to enterprise funds (734,102)
Change in net position of business-type activities $ 1,587,781
Statement of Revenues, Expenses, and Changes in Net Position
Income (loss) before transfers
See accompanying notes to financial statements 28

CITY OF ALHAMBRA
GovernmentalActivities –
Enterprise funds InternalSewer and Golf course/ Service
Water storm drain Sanitation clubhouse Total Funds
Cash flows from operating activities:Cash received from customers $ 17,041,232 5,163,677 9,118,614 1,637,272 32,960,795 12,657,742 Cash paid insurance premiums and self-insurance claims — — — — — (13,345,227)
(10,876,590) (1,018,015) (8,309,039) (1,296,614) (21,500,258) (779,726) Cash paid to employees for services (4,990,502) (586,367) (621,833) — (6,198,702) (420,432) Cash paid for compensated absences claims (255,842) (27,663) (31,767) — (315,272) (861,630) Other operating cash received 312,092 — 21,894 — 333,986 59,775
Net cash provided by (used in) operating activities 1,230,390 3,531,632 177,869 340,658 5,280,549 (2,689,498)
Cash flows from noncapital financing activities:Cash paid on loans from other funds — — — (1,422,031) (1,422,031) (515,782) Cash received on loans from other funds — — — 1,191,578 1,191,578 — Cash received on loans to other funds — — — — — 2,757,631 Transfers from other funds 151,747 314,456 44,666 — 510,869 47,860 Transfers to other funds (513,841) (307,350) (15,848) (110,205) (947,244) (218,223)
Net cash provided by (used in) noncapital financing activities (362,094) 7,106 28,818 (340,658) (666,828) 2,071,486
Cash flows from capital and related financing activities:Acquisitions and construction of capital assets (1,205,111) (7,402,156) (14,129) — (8,621,396) (433,529) Proceeds from sale of capital assets — — — — — 12,835 Principal paid on certificates of participation and capital lease obligations (893,636) (2,855) — — (896,491) — Interest paid on certificates of participation and capital lease obligations (296,456) (256) — — (296,712) —
Net cash used in capital and related financing activities (2,395,203) (7,405,267) (14,129) — (9,814,599) (420,694)
Cash flows from investing activities:Interest received 123,945 123,582 5,773 — 253,300 60,796
Net cash provided by investing activities 123,945 123,582 5,773 — 253,300 60,796
Net increase (decrease) in cash and cash equivalents (1,402,962) (3,742,947) 198,331 — (4,947,578) (977,910)
Cash and cash equivalents at July 1 15,562,239 18,464,563 591,030 125 34,617,957 9,844,275 Cash and cash equivalents at June 30 $ 14,159,277 14,721,616 789,361 125 29,670,379 8,866,365
Cash and investments $ 13,707,327 14,721,616 789,361 125 29,218,429 8,866,365 Restricted cash and investments 451,950 — — — 451,950 —
Total cash and cash equivalents $ 14,159,277 14,721,616 789,361 125 29,670,379 8,866,365
Noncash investing, capital, and financing activities:(104,316) (119,142) (6,673) — (230,131) (56,962)
Statement of Cash Flows
Decrease in fair value of investments
Cash paid to suppliers for goods and services
Proprietary Funds
Year ended June 30, 2018
See accompanying notes to financial statements 29

CITY OF ALHAMBRA
GovernmentalActivities –
InternalSewer and Golf course/ Service
Water storm drain Sanitation clubhouse Total Funds
Reconciliation of operating income (loss) to net cash provided by (used in)operating activities:
$ 922,798 2,446,927 98,485 105,166 3,573,376 (2,935,564)
Adjustments to reconcile operating income (loss) to net cash provided by (used in) operating activities:
Depreciation and amortization 705,541 236,017 14,285 130,411 1,086,254 250,448 (Increase) decrease in accounts receivable (511,693) (44,728) (40,275) 8,926 (587,770) (11,680) (Increase) decrease in inventories 115,318 — — — 115,318 — (Increase) decrease in prepaid items (68) — — — (68) (1,602,365) Increase (decrease) in accounts payable (592,170) 823,398 45,769 93,655 370,652 240,228 Increase (decrease) in self-insurance claims liability — — — — — 1,405,878 Increase (decrease) in compensated absences 53,896 4,493 4,157 — 62,546 (122,960) Increase (decrease) in pension liability 557,563 82,846 97,744 — 738,153 97,638 Increase (decrease) in OPEB liability (116,631) (16,277) (20,961) — (153,869) (7,026) Increase (decrease) in deposits 8,226 — — — 8,226 — Increase (decrease) in retentions payable (81,124) 20,067 — 2,500 (58,557) (5,356) (Increase) decrease in deferred outflows (397,669) (60,591) (71,561) — (529,821) (64,786) Increase (decrease) in deferred inflows 254,311 39,480 50,195 — 343,986 6,272 Other operating cash received 312,092 — 31 — 312,123 59,775
Total adjustments 307,592 1,084,705 79,384 235,492 1,707,173 246,066 Net cash provided by (used in) operating activities $ 1,230,390 3,531,632 177,869 340,658 5,280,549 (2,689,498)
Statement of Cash Flows
Proprietary Funds
Year ended June 30, 2018
Operating income (loss)
See accompanying notes to financial statements 30

RDASucessor AgencyPrivate Purpose
Assets Trust Fund
Cash and investments $ 10,403,704 Restricted investments 3,603,926 Note receivable 2,390,000 Due from the City of Alhambra 12,428 Capital assets not being depreciated 248,791 Capital assets, net of accumulated depreciation 171,417
Total assets 16,830,266
Liabilities
Liabilities:Accounts payable 228,400 Due to the City of Alhambra 237,722 Due to governmental agencies 6,460,099 Long-term liabilities:
Due within one year 3,230,000 Due in more than one year 11,740,306
Total liabilities 21,896,527
Deferred inflow of resources:Deferred amount on refunding 247,612
Net deficit:Held in trust for the retirement of obligations of the former
Alhambra Redevelopment Agency $ (5,313,873)
June 30, 2018
CITY OF ALHAMBRA
Statement of Fiduciary Net Position
Fiduciary Funds
See accompanying notes to financial statements 31

RDASucessor AgencyPrivate Purpose
Trust FundAdditions:
Property taxes $ 8,993,990 Use of money and property 17,443 Other 20,000
Total additions 9,031,433
Deductions:Enforceable obligations 2,568,788 Administration 250,000 Interest payments 331,370 Depreciation and amortization 26,372
Total deductions 3,176,530
Change in net position 5,854,903
Net deficit at July 1 (11,168,776)
Net deficit at June 30 $ (5,313,873)
CITY OF ALHAMBRAStatement of Changes in Fiduciary Net Position
Fiduciary FundsFor the year ended June 30, 2018
See accompanying notes to financial statements 32


Notes to Financial Statements


І Summary of Significant Accounting Policies
The City of Alhambra (City), incorporated in 1903, is a Charter City that operates under a Council-City Manager form of government.
The accounting policies of the City conform to accounting principles generally accepted in the United States of America. The following is a summary of the more significant policies.
A. Reporting Entity
The City is a municipal corporation governed by an elected five-member council. As required by accounting principles generally accepted in the United States of America, the accompanying basic financial statements present the City (the primary government) and its component units. The component units discussed below are included in the City’s reporting entity because of the significance of their operational and financial relationships with the City. They are reported as part of and accountable to the City and blended into the government-wide and fund financial statements.
• The Alhambra Parking Authority (Parking Authority) is governed by a five-member board composed of City Council members. The Alhambra Parking Authority issued $6,565,000 lease revenue bonds on October 17, 2013. Although it is a legally separate entity from the City, it is considered a component unit of the City because of its purpose to provide parking for the business community. The activities of the Authority exclusively benefit the City. The City has operational responsibility for the Authority. The financial transactions of the Authority are reported in the accompanying basic financial statements within the other governmental funds column. Separate financial statements are not issued.
• The Alhambra Golf Course Clubhouse Corporation (Clubhouse Corporation) is governed by a five-member board composed of City Council members. Although it is a legally separate entity from the City, the Clubhouse Corporation is reported as if it were part of the City because of its purpose to provide a Clubhouse complex for the City’s Municipal golf course. As of June 30, 2018 there were no financial transactions to be reported in the accompanying basic financial statements. Separate financial statements are not issued.
• The Alhambra Capital Improvements Corporation and the Alhambra Public Financing Corporation are governed by a five-member board composed of City Council members. Although separate legal entities from the City, they are reported as if they were part of the City because of their purpose of providing a financing mechanism for capital projects for the City. The financial transactions of the Corporations are reported in the accompanying basic financial statements within the other governmental funds column. Separate financial statements are not issued.
• The Alhambra Facilities Financing Authority (Financing Authority) is governed by a five-member board composed of City Council members. The Financing Authority issued $8,005,000 wastewater revenue bonds on September 5, 2018. Although separate legal entities from the City, they are reported as if they were part of the City because of their purpose of providing a financing mechanism for capital projects for the City. As of June 30, 2018 there were no financial transactions to be reported in the accompanying basic financial statements. Separate financial statements are not issued.
No entities have been excluded from the basic financial statements of the City for which there was a positive response to the reporting entity inclusion criteria.
CITY OF ALHAMBRA Notes to Basic Financial Statements
June 30, 2018
33
B. Government-Wide and Fund Financial Statements
The government-wide financial statements consist of the statement of net position and statement of activities and report information on all of the primary government and its component units and excludes fiduciary funds. As a general rule, the effect of inter-fund activity has been eliminated from the government-wide financial statements. All internal balances in the statement of net position have been eliminated, with the exception of those representing balances between the governmental activities and the business-type activities, which are presented as internal balances and eliminated in the total government column. In the statement of activities, internal service fund transactions have been eliminated; however, those transactions between governmental and business-type activities have not been eliminated. Exceptions to this general rule are charges between the City’s Water Fund and various other functions of the government. Elimination of these charges would distort the direct costs and program revenues reported for the various functions concerned. Governmental activities, which normally are supported by taxes and intergovernmental revenues, are reported separately from business-type activities, which rely to a significant extent on fees and charges for support.
Both of the government-wide financial statements distinguish functions of the City that are principally supported by taxes and intergovernmental revenues (governmental activities) from other functions that are intended to recover all or a significant portion of their costs through user fees and charges (business-type activities). The governmental activities of the City include public safety, public works, housing, health and community development, culture and recreation, and general administrative support services. The business-type activities of the City include water, sewer and storm drain, sanitation, and golf course/clubhouse.
The statement of activities demonstrates the degree to which the direct and indirect expenses of a given function are offset by program revenues. Direct expenses are those that are clearly identifiable with a specific function or segment. Indirect expenses are allocated based on the annual cost allocation plan. Program revenues include: 1) charges to customers or applicants who purchase, use, or directly benefit from goods, services, or privileges provided by a given function or segment and 2) grants and contributions, including special assessments that are restricted to meeting the operational or capital requirements of a particular function. Taxes and other items not properly included among program revenues are reported instead as general revenues.
Separate fund financial statements are provided for governmental funds and proprietary funds. Major individual governmental funds and major individual enterprise funds are reported as separate columns in the fund financial statements.
C. Measurement Focus, Basis of Accounting, and Financial Statement Presentation
The accounting and financial reporting treatment is determined by applicable measurement focus and basis of accounting. Measurement focus indicates the type of resources being measured such as current financial resources or economic resources. The basis of accounting indicates the timing of transactions or events for recognition in the financial statements.
The government-wide financial statements are reported using the economic resources measurement focus and the accrual basis of accounting. Under the economic resources measurement focus, all assets and liabilities (whether current or noncurrrent) associated with their activity are included on their balance sheets. Operating statements present increases (revenues) and decreases (expenses) in total net position. Under the accrual basis of accounting, revenues are recorded when earned and expenses are recorded when a liability is incurred, regardless of the timing of related cash flows.
CITY OF ALHAMBRA Notes to Basic Financial Statements
June 30, 2018
34

Government funds financial statements are reported using the current financial resources measurement focus and the modified-accrual basis of accounting. Under the current financial resources measurement focus, revenues are recognized when they become measurable and available to finance operations during the current year. The term “available” is interpreted to mean collectible within the current period or soon enough thereafter to be used to pay liabilities of the current period (i.e., 60 days). The City regards property taxes, sales taxes, and other taxes collected by other governmental entities, but not yet remitted to the City, various billings for services rendered, and revenues from the use of money and property, as susceptible to accrual.
Under the modified-accrual basis of accounting, expenditures are generally recognized when the related fund liability is incurred as under accrual accounting. However, debt service expenditures as well as expenditures related to compensated absences and claims (including workers’ compensation) and judgments are recorded only when payment is due. General capital asset acquisitions are reported as expenditures in governmental funds. Proceeds of long-term debt and capital leases are reported as other financing sources.
Proprietary funds are accounted for on a flow of economic resources measurement focus and are maintained on the accrual basis of accounting. Revenues are recognized when they are earned, irrespective of when received, and expenses are recognized when they are incurred.
Proprietary funds distinguish operating revenues and expenses from non-operating items. Operating revenues and expenses generally result from providing services and producing and delivering goods in connection with a proprietary fund’s principal ongoing operations. The principal operating revenues of the Enterprise Funds and of the City’s Internal Service Funds are charges to customers for sales and services. Operating expense for Enterprise Funds and Internal Service Funds include the cost of sales and services, administrative expenses, and depreciation on capital assets. All revenues and expenses not meeting this definition are reported as non-operating revenues and expenses. Unbilled service receivables of $3,228,076 have been accrued at June 30, 2018. The City considers the following funds as major government funds:
• General Fund – The General Fund is the City’s primary operating fund. It is used to account for resources traditionally associated with government which are not legally or by sound financial management to be accounted for in another fund. • Community Development Block Grant Special Revenue Fund – It is used to account for the operations of the Community Development Block Grant Program. All revenues and expenditures of this fund are restricted to target areas projects as indicated by the HUD Committee and in accordance with federal regulations. • Transportation Capital Improvement Fund – To account for allocations from federal, state, and county governments for transportation projects not accounted for in other funds. The purpose for which these monies may be expended shall be limited to those authorized by the agreements with the allocating agency.
The City reports the following major proprietary funds:
• Water Fund – It is used to account for the operations of the City’s water utility. All activities necessary to provide this service are accounted for in this fund, including administration, operations, maintenance, capital improvement, billing, collection, and depreciation.
CITY OF ALHAMBRA Notes to Basic Financial Statements
June 30, 2018
35

• Sewer and Storm Drain Fund – It is used to account for the provision of sewer and storm drain maintenance services to the residents of the City. All activities necessary to provide this service are accounted for in this fund including, but not limited to, operations, maintenance, capital improvements, and depreciation. • Sanitation Fund – It is used to account for the provision of sanitation, rubbish collection, and recycling services to the residents of the City. All activities necessary to provide this service are accounted for in this fund including, but not limited to, operations, contract costs, and depreciation. • Golf Course/Clubhouse Fund – It is used to account for the operation of the City’s golf course and clubhouse complex. All activities necessary to provide this service are accounted for in this fund including, but not limited to, operations, maintenance, administration, capital improvements, debt service, and depreciation.
The City’s fund structure also includes the following fund types:
• Special Revenue Funds – are used to account for proceeds of specific revenue sources that are legally restricted or otherwise designated for specific purposes. • Debt Service Funds – are used to account for the collections, and payment of, resources used to repay long-term debt and related interest. • Capital Projects Funds – are used to account for financial resources used for the acquisition or construction of major capital facilities.
The City reports Internal Service Funds, which account for equipment, self-insurance, and compensated absences that provide services to other departments of the City on a cost-reimbursement basis. The internal service funds are presented in a single combined column in the proprietary funds financial statements. Because the principal users of the internal service funds are the City’s governmental entities, the assets and liabilities of the internal service funds are consolidated into the governmental activities column of the government-wide statement of net position.
Additionally, the City reports Fiduciary Fund Financial Statements (Private Purpose Trust Fund) which account for the non-housing related activities of the Successor Agency to the Alhambra Redevelopment Agency. Private-Purpose Trust Funds account for resources legally held in trust. These funds are accounted for on a capital maintenance measurement focus and are maintained on the accrual basis of accounting.
D. Pooled Cash and Investments
In order to maximize investment return, the City pools its available cash for investment purposes. The cash management pool is used essentially as a demand deposit account by the participating funds. Accordingly, the City has defined, for purposes of the preparation of its statements of cash flows, cash and cash equivalents as demand deposits, plus all investments maintained in the cash management pool, regardless of maturity period.
Interest and dividend income, realized gains and losses, and changes in fair value of investments arising from pooled cash and investments are normally apportioned to the participating funds based on the relationship of their respective monthly cash balances to the total pooled cash and investments, however the cash balances, of the Sanitation, Golf Course/Clubhouse, Capital Outlay; Health Insurance, Lighting and Landscape Maintenance, and the Transportation Capital Improvements funds are assigned directly to the General Fund.
CITY OF ALHAMBRA Notes to Basic Financial Statements
June 30, 2018
36

The City’s investments are stated at fair value. Fair value is determined based upon market closing prices or bid/asked prices for regularly traded securities. The fair value of investment contracts are stated at cost and other investments are estimated based on similarly traded investments. The fair value of mutual funds, government-sponsored investment pools, and other similar investments is stated at share value, or appropriate allocation of fair value of the pool, if separately reported. Certain money market investments with initial maturities at the time of purchase of less than one year are recorded at cost. The calculation of realized gains and losses is independent of the calculation of the net increase or decrease in fair value of investments. Realized gains and losses on investments that had been held in more than one fiscal year and sold in the current fiscal year may have been recognized as an increase or a decrease in fair value of investments reported in a prior year.
E. Receivables and Payables
Activity between funds that are representative of lending/borrowing arrangements outstanding at the end of the fiscal year is referred to as interfund receivables/interfund payables, i.e., the current portion of interfund loans, or advances to/from other funds, the noncurrent portion of interfund loans. All other outstanding balances between funds are reported as interfund receivables/interfund payables. Any residual balances outstanding between the governmental activities and the business-type activities are reported in the government-wide financial statements as internal balances.
Advances between funds, as reported in the fund financial statements, are classified as either nonspendable fund balance in the applicable governmental funds to indicate that they are not available for appropriation and are not expendable available financial resources or they are restricted.
All accounts, notes, and loans receivable are shown net of an allowance for uncollectible accounts and estimated refunds due. As of June 30, 2018, the allowance for uncollectible accounts for governmental and business-type activities is $10,373,654 and $5,339, respectively.
F. Inventories
Inventories of the Enterprise Funds, consisting primarily of replacement parts, are recorded using the average-cost method. Inventories of the General Fund consist of expendable supplies held for consumption and are recorded using the average-cost method. Inventory is recorded as an expenditure at the time individual items are consumed.
G. Property Held for Resale
Property held for resale in the Special Revenue Funds represents property purchased by the City to be rehabilitated and sold to qualified buyers. Property held for resale is recorded at the lower of cost or estimated net realizable value. Estimated net realizable value is determined by an agreed-upon sales price with potential developers.
H. Capital Assets
Capital assets, which include land, buildings and improvements, equipment, and infrastructure assets (e.g., roads, sidewalks, traffic lights and signals, street lights, and similar items), are reported in the applicable governmental or business-type activities columns in the governmental-wide financial statements. Capital assets are defined by the City as assets with an initial individual cost of $5,000 or more and an estimated useful life in excess of one year. Such assets are recorded at historical cost. Donated capital assets are recorded at acquisition value at the date of acquisition. The cost of normal maintenance and repairs that do not add to the value of the asset or materially extend assets lives is not capitalized.
CITY OF ALHAMBRA Notes to Basic Financial Statements
June 30, 2018
37

Major outlays for capital assets and improvements are capitalized as projects are constructed. Interest incurred during the construction phase of capital assets of business-type activities is included as part of the capitalized value of the assets constructed. No interest was capitalized during the year ended June 30, 2018.
Capital assets of the City are depreciated using a straight-line method over the following estimated useful lives:
Buildings 15 to 50 yearsStructures and improvements 15 to 50 yearsUtility systems 80 yearsInfrastructure 11 to 85 yearsMachinery and equipment 3 to 10 years
As a result of the implementation of GASB 34, the City is accounting for infrastructure assets on its government-wide financial statements. These statements include not only those infrastructure assets that were either completed during the current fiscal year or considered construction in progress at current fiscal year-end, but also those infrastructure assets completed prior to July 1, 2002.
I. Compensated Absences
It is the policy of the City to pay accumulated vacation, holiday, compensatory time and vested sick leave benefits to employees upon retirement or termination of employment. Benefits accumulated will vary depending upon the employee’s bargaining unit. All vacation, holiday, compensatory time, and sick leave are accrued when incurred in the government-wide and proprietary fund financial statements. A liability is reported in the governmental funds only if they have matured, for example, as a result of employee resignations or retirements.
The maximum accumulation of vacation is limited based on the employee’s years of service with the City. Employees are paid 100% of their accumulated vacation pay when they terminate employment for any reason.
Employees may accumulate sick leave without limitation as to the number of hours. Accumulated sick leave is paid upon retirement for up to a maximum of 25 days of sick leave provided the employee has accumulated 100 days of sick leave, 15 years of service and hired prior to July 2, 1994.
J. Net Position and Fund Balances
In the government-wide financial statements and proprietary funds financial statements, net position are reported in three categories: net investment in capital assets; restricted net position; and unrestricted net position. Net investment in capital assets represent capital assets less accumulated depreciation and reduced by outstanding balances of any bonds, mortgages, notes, or other borrowings that are attributable to the acquisition, construction, or improvement of those assets. Net investment in capital assets does not include the unspent proceeds of capital debt. Restricted net position represent net position restricted by parties outside of the City (such as creditors, grantors, contributors, laws, and regulations of other governments). All other net position is considered unrestricted.
When both restricted and unrestricted resources are available for use, it is the government’s policy to use restricted resources first, then unrestricted resources as they are needed.
CITY OF ALHAMBRA Notes to Basic Financial Statements
June 30, 2018
38
Fund balances are reported in accordance with Governmental Accounting Standards Board Statement No. 54, “Fund Balance Reporting and Governmental Fund Type Definitions”. The fund balances reported on the fund statements consist of the following categories:
• Nonspendable Fund Balance – This classification includes amounts that cannot be spent because they are either (a) not in spendable form or (b) legally or contractually required to be maintained intact.
• Restricted Fund Balance – This classification includes amounts that can be spent only for specific purposes stipulated by constitution, external resource providers or through enabling legislation.
• Committed Fund Balance – This classification includes amounts that can be used only for the specific purposes determined by a formal action (ordinance) of the government’s highest level of decision-making authority. The City Council is considered the highest authority for the City. The limitation imposed remains in place until a similar action is taken (the adoption of another ordinance) to remove or revise the limitation.
• Assigned Fund Balance – This classification includes amounts to be used by the government for specific purposes but do not meet the criteria to be classified as restricted or committed. In governmental funds, other than the general fund, assigned fund balance represents the remaining amount that is not restricted or committed. The City Council has by resolution authorized the City Manager to assign fund balance. Unlike commitments, assignments generally only exist temporarily. In other words, an additional action does not normally have to be taken for the removal of an assignment.
• Unassigned Fund Balance – This classification includes the residual balance for the government’s general fund and includes all spendable amounts not contained in other classifications. In other funds, the unassigned classification is used only to report a deficit balance resulting from overspending for specific purposes for which amounts had been restricted, committed or assigned.
When an expenditure is incurred for purposes for which both restricted and unrestricted fund balances are available, the City’s policy is to apply restricted fund balance first.
When an expenditure is incurred for purposes for which committed, assigned or unassigned fund balances are available, the City’s policy is to apply committed fund balance first, then assigned fund balance, and finally unassigned fund balance.
At June 30, 2018, the City has, by ordinances adopted by the City Council, committed fund balance for use in emergencies or potential future revenue shortfalls of $10,675,008, legal liability reserve of $3,000,000, building and facility reserve of $3,000,000, equipment reserve of $3,000,000, and arts in public places program of $363,297.
K. Self-Insurance Programs
The City is self-insured for workers’ compensation, general, automobile, and public liability claims. The City’s estimated liability for claims as of June 30, 2018 is based on the independent claim manager’s estimate of probable losses plus an amount estimated for incurred but not reported claims. An Internal Service Fund is used to account for the collection of premiums from various City departments related to workers’ compensation claims and general claims liabilities. Premiums are established based on historical claims experience.
CITY OF ALHAMBRA Notes to Basic Financial Statements
June 30, 2018
39

Additionally, the City is a member of the Independent Cities Risk Management Authority (ICRMA), which provides member cities with liability, property and workers compensation coverage. The coverage is provided through self-insurance or traditional purchase of insurance. Specific coverage for general liability includes comprehensive and general automotive liability, personal injury, contractual liability, errors and omissions and certain other coverage. Annual premium payments are paid by member cities and are adjusted retrospectively to cover costs. The City has a self-insured retention of $750,000 for each general liability claim and is insured up to $30 million per loss occurrence with ICRMA. The City has a self-insured retention of $500,000 for each workers compensation claim and is insured up to statutory limits per claim with ICRMA. (see notes IV.E and V.C.). There have been no settlements that exceeded insurance coverage in the last three years.
L. Property Taxes
The County of Los Angeles (County) has the responsibility for property tax and assessment levies and collections. The County’s property tax calendar is July 1 to June 30. Property taxes attach as an enforceable lien on the property as of the preceding January 1. Property taxes are levied on or before the first business day of September of each year. Property tax bills, which include assessments, are due in equal installments on November 1 and February 1 and are delinquent with penalties after December 10 and April 10, respectively, of each property tax year. Delinquent property tax receivables are offset by unavailable revenue.
M. Use of Estimates
The preparation of financial statements in conformity with accounting principles generally accepted in the United States of America requires management to make estimates and assumptions that affect the reported amounts of assets and liabilities and disclosure of contingent assets and liabilities at the date of the financial statements and the reported amounts of revenue and expenses/expenditures during the reporting period. Actual results could differ from those estimates.
N. Deferred Outflows/Inflows of Resources:
In addition to assets, the Statement of Net Position and the Governmental Funds Balance Sheet will sometimes report a separate section for deferred outflows of resources. This separate financial statement element, deferred outflows of resources, represents a consumption of net position that applies to future periods and will not be recognized as an outflow of resources (expense/expenditure) until that time. The City has the following items that qualify for reporting in this category:
• Deferred outflows related to pensions - include amounts equal to employer contributions made after the measurement date of the net pension liability and other items including changes in actuarial assumptions and difference between projected and actual earnings on investments of the pension plan fiduciary net position. These amounts are amortized and reported as pension expense in future fiscal years.
• Deferred outflows related to other post-employment benefits - include amounts equal to employer
contributions made after the measurement date of the total other post-employment benefit liability. These amounts are amortized and reported as other post-employment benefit expense in future fiscal years.
In addition to liabilities, the Statement of Net Position and the Governmental Funds Balance Sheet will sometimes report a separate section for deferred inflows of resources. This separate financial statement element, deferred inflows of resources, represents an acquisition of net position that applies to future
CITY OF ALHAMBRA Notes to Basic Financial Statements
June 30, 2018
40
periods and will not be recognized as an inflow of resources (revenue) until that time. The City has the following items that qualify for reporting in this category:
• Deferred inflows from unavailable revenues, which arises only under a modified accrual basis of accounting, is reported only in the governmental funds balance sheet. The governmental funds report unavailable revenues from two sources, which are taxes and grants. These amounts are deferred and recognized as an inflow of resources in the period that the amounts become available.
• Deferred gain on refunding, net of accumulated amortization reported in the government-wide statement of net position and the proprietary funds financial statements. A deferred gain on refunding results from the difference in the carrying value of refunded debt and its reacquisition price. This amount is deferred and amortized over the shorter of the life of the refunded or refunding debt.
• Deferred inflows related to pensions - include amounts for changes in actuarial assumptions and
difference between expected and actual experience. These amounts are amortized and reported as pension expense in future fiscal years.
• Deferred inflows related to other post-employment benefits - include amounts resulting from change
in assumptions. These amounts are amortized and reported as other post-employment benefit expense in future fiscal years.
O. Pensions:
For purposes of measuring the net pension liability and deferred outflows/inflows of resources related to pensions, and pension expense, information about the fiduciary net position of the City of Alhambra’s California Public Employees’ Retirement System (CalPERS) plans (Plans) and additions to/deductions from the Plans’ fiduciary net position have been determined on the same basis as they are reported by CalPERS. For this purpose, benefit payments (including refunds of employee contributions) are recognized when due and payable in accordance with the benefit terms. Investments are reported at fair value. For purposes of measuring the net pension liability and deferred outflows/inflows of resources related to pensions, and pension expense of the City’s other pension plan the benefit payments are recognized when due and payable in accordance with the benefit terms.
P. New Accounting Pronouncements:
Current Year Standards
GASB 75 - In fiscal year 2017-2018, the City implemented Governmental Accounting Standards Board (GASB) Statement No. 75, “Accounting and Financial Reporting for Postemployment Benefits Other Than Pensions”, effective for periods beginning after June 15, 2017. This Statement establish standards for measuring and recognizing liabilities, deferred outflows of resources, deferred inflows of resources, and expenses for other postemployment benefits and related assets. Accounting changes adopted to conform to the provisions of this Statement should be applied retroactively. The result of the implementation of this Statement decreased the net position at July 1, 2017 of the governmental activities by $12,026,789, business-type activities by $1,691,097, Water, Sewer and Storm Drain, Sanitation Enterprise Funds and Equipment Internal Service Fund by $1,267,113, $177,113, $232,029 and $78,116, respectively.
CITY OF ALHAMBRA Notes to Basic Financial Statements
June 30, 2018
41

GASB 81 – Irrevocable Split-Interest Agreements, effective for periods beginning after December 15, 2016, and did not impact the City.
GASB 82 – Pension Issues, effective for periods beginning after June 15, 2016, except for certain provisions on selection of assumptions, which are effective in the first reporting period in which the measurement date of the pension liability is on or after June 15, 2017, and did not impact the City.
GASB 85 – Omnibus 2017, effective for periods beginning after June15, 2017, and did not impact the City.
GASB 86 – Certain Debt Extinguishment Issues, effective for periods beginning after June 15, 2017, and did not impact the City.
Pending Accounting Standards
GASB has issued the following statements, which may impact the City’s financial reporting requirements in the future:
• GASB 83 - Certain Asset Retirement Obligations, effective for periods beginning after June 15, 2018.
• GASB 84 - Fiduciary Activities, effective for periods beginning after December 15, 2018.
• GASB 87 - Leases, effective for periods beginning after December 15, 2019.
• GASB 88 - Certain Disclosures Related to Debt, Including Direct Borrowings and Direct Placements, effective for periods beginning after June, 2018.
• GASB 89 - Accounting for Interest Cost Incurred before the end of a Construction Period, effective for periods beginning after December 15, 2019.
• GASB 90 – Majority Equity Interests – an amendment of GASB Statement No. 14 and No. 61, effective for periods beginning after December 15, 2018.
CITY OF ALHAMBRA Notes to Basic Financial Statements
June 30, 2018
42

II Reconciliation of Fund Financial Statements to Government-Wide Financial Statements
Amounts reported for governmental activities in the statement of net position are different from those reported for governmental funds in the balance sheet. The following provides a reconciliation of those differences:
Totalgovernmental
activities OtherTotal Long-term Internal adjustments Statement of
governmental assets (1) and Service and net positionAssets funds liabilities (2) Fund (3) eliminations (4) totals
Cash and investments $ 45,495,865 — 8,866,365 — 54,362,230 Restricted cash and investments 1,107,801 — — — 1,107,801 Receivables:
Accounts 11,855,408 — 70,612 (3,742,537) 8,183,483 Loans 204,405 — — — 204,405
Due from other funds 8,587,323 — 3,425,675 (7,395,745) 4,617,253 Due from Successor Agency 237,722 — — — 237,722 Inventories 62,158 — — — 62,158
35,248 — 1,612,365 — 1,647,613 Property held for resale 529,680 — — — 529,680 Capital assets not being depreciated — 26,496,949 237,950 — 26,734,899 Capital assets, net of accumulated
depreciation — 111,647,368 1,695,374 — 113,342,742 Total assets 68,115,610 138,144,317 15,908,341 (11,138,282) 211,029,986
Deferred outflow of resourcesDeferred amounts from pensions — — 386,179 29,634,961 30,021,140 Deferred amounts from other post
employment benefits — — 2,652 432,269 434,921 Total deferred outflow — — 388,831 30,067,230 30,456,061 Total assets and deferredoutflow of resources $ 68,115,610 138,144,317 16,297,172 18,928,948 241,486,047
Liabilities and Fund BalancesLiabilities:
Accounts payable $ 3,095,588 — 566,223 — 3,661,811 Accrued liabilities 2,476,047 — — — 2,476,047 Bond interest payable — — — 360,179 360,179 Deposits 1,242,405 — 2,804 — 1,245,209 Retentions payable 154,695 — — — 154,695 Unearned revenue 3,742,537 — — (3,742,537) — Due to other funds 4,638,114 — 2,757,631 (7,395,745) — Due to Successor Agency 12,428 — — — 12,428 Long-term liabilities — 164,223,482 21,133,636 — 185,357,118
Total liabilities 15,361,814 164,223,482 24,460,294 (10,778,103) 193,267,487 Deferred inflow of resources:
Unavailable resources 2,483,348 — — (2,483,348) — Deferred amounts from pensions — — 102,397 8,087,758 8,190,155 Deferred amounts from other post
employment benefits — — 14,736 2,238,546 2,253,282 Deferred amount from bond refunding — — — 1,191,937 1,191,937
Total deferred inflow 2,483,348 — 117,133 9,034,893 11,635,374 Total fund balances/
net position 50,270,448 (26,079,165) (8,280,255) 20,672,158 36,583,186 Total liabilities and fund
balances/net position $ 68,115,610 138,144,317 16,297,172 18,928,948 241,486,047
Prepaid items
CITY OF ALHAMBRA Notes to Basic Financial Statements
June 30, 2018
43

(1) Capital assets used in governmental activities are not current financialresources and, therefore, are not reported in the balance sheet $ 138,144,317
(2) Long-term liabilities are not due and payable in thecurrent period and, therefore, are not reported inthe balance sheet
Certificates of participation $ (10,365,000) Lease revenue bonds (6,085,000)
49,758 Assessment bonds (605,000) Notes and loans payable (918,708) Compensated absences (2,759,506) Capital lease obligations (933,892) Pension liability (126,403,021) OPEB liability (20,699,611) Self-insurance liabilities (16,637,138) Internal Service Funds included in governmental activities 21,133,636 $ (164,223,482)
(3) Internal Service Funds are used by management to charge the costs of theCity’s self-insurance, compensated absences, and equipment operations toindividuals funds. The allocated assets and liabilities of the Internal Service Funds are included in governmental activities in the statement of net position $ (8,280,255)
(4) Other adjustments and eliminations
Accrued interest payable for the period between the interest payment date andthe end of the fiscal year is not reported as a payable in governmental funds $ (360,179)
Other long-term assets are not available to pay for current periodexpenditures and, therefore, are deferred in the funds and recognized asrevenues in the statement of activities 2,483,348
Pension and other post employment benefit related debt applicable to the City'sgovernmental activities are not due and payable in the current period andaccordingly are not reported as fund liabilities.Deferred outflows of resources and deferred inflows of resources related to pensions,other post employment benefits, and bond refunding are only reported in the Statementof Net Position as the changes in these amounts effects only the government-widestatements for governmental activities:
Deferred outflow of resources - pension liability 29,634,961 Deferred outflow of resources - other post employment benefits 432,269 Deferred inflow of resources - pension liability (8,087,758) Deferred inflow of resources - other post employment benefits (2,238,546) Deferred inflow of resources - bond refunding (1,191,937)
$ 20,672,158
Deferred amount on bond issuance
CITY OF ALHAMBRA Notes to Basic Financial Statements
June 30, 2018
44

Amounts reported for business-type activities in the statement of net position are different from those reported for proprietary funds in the balance sheet. The following provides a reconciliation of those differences:
Enterprise net positionAssets Funds Eliminations (1) totals
Cash and investments $ 29,218,429 — 29,218,429 Restricted cash and investments 451,950 — 451,950 Accounts receivable 5,101,846 — 5,101,846 Due from other funds — (4,617,253) (4,617,253) Inventories 655,964 — 655,964 Prepaid items 20,721 — 20,721 Capital assets:
Land 5,769,073 — 5,769,073 Building, structures, and
improvements 64,177,816 — 64,177,816 Machinery and equipment 4,696,311 — 4,696,311 Construction in progress 5,984,382 — 5,984,382
Total capital assets 80,627,582 — 80,627,582
Less accumulated depreciation (20,751,308) — (20,751,308)
Total capital assets, net ofaccumulated depreciation 59,876,274 — 59,876,274
Deferred outflow of resources 3,391,268 — 3,391,268
Total assets and defered outflowof resources 98,716,452 (4,617,253) 94,099,199
Liabilities and Net PositionAccounts payable 3,210,555 — 3,210,555 Due to other funds 1,191,578 (1,191,578) — Deposits 451,890 — 451,890 Retentions payable 114,658 — 114,658 Long-term liabilities:
Due within one year 967,520 — 967,520 Due in more than one year 23,315,023 — 23,315,023
Deferred inflow of resources 1,263,028 — 1,263,028
Total liabilities and deferredinflow of resources 30,514,252 (1,191,578) 29,322,674
Total net position $ 68,202,200 (3,425,675) 64,776,525
(1) The interfund payable resulting from a cash overdraft of $1,191,578 between enterprise funds and governmental funds is being eliminated. Also, the costs in excess of charges to business-typeactivities from internal service funds is $3,425,675.
CITY OF ALHAMBRA Notes to Basic Financial Statements
June 30, 2018
45

III Stewardship, Compliance, and Accountability
A. Budgetary Information
The City adheres to the following general procedures in establishing its annual budget, which is reflected in the accompanying basic financial statements:
• Annual budgets are adopted by the City Council, which provide for the general operations of the City. Such budgets include estimated revenues and authorized appropriations for all Governmental Fund Types.
• The City Manager is authorized to transfer appropriations within any fund. Expenditures may not exceed appropriations at the fund total level without approval by the City Council. The budgeted amounts used in the basic financial statements represent the final adjusted amounts, which were increased $3,503,765 due to supplemental appropriations made by the City Council during the year.
• The budget for all funds is formally integrated into the accounting system and employed as a management control device during the year.
• Budgets for Governmental Fund Types are adopted on a modified-accrual basis.
• Unexpended or unencumbered budget appropriations lapse at the end of the fiscal year. Encumbered appropriations are re-appropriated in the ensuing year’s budget by action of the City Council.
B. Deficit Fund Balances, Accumulated Deficits, and Budget Overages
The following funds had deficit fund balances or net deficits at June 30, 2018:
Community Development Block Grant Fund - Special Revenue Fund 3,906,213Transportation Capital Improvement Fund - Special Revenue Fund 1,225,518Other Governmental Funds:
Home and Rental Rehabilitation Grant Fund - Special Revenue Fund 15,494
Enterprise Fund:Sanitation Fund 1,054,364
Internal Service Fund:Self-Insurance 14,417,857Compensated Absences 505,570
• The fund deficits in the Community Development Block Grant Fund, Transportation Capital Improvement Fund, and Home and Rental Rehabilitation Grant Fund are expected to be eliminated through future grant revenues.
• The net deficit in the Sanitation Enterprise Fund is expected to be eliminated through future revenues and transfers from the General Fund.
• The net deficit in the Self-Insurance Internal Service Fund is not expected to be eliminated in the near future. It is anticipated when the City’s financial situation improves future charges will be increased within City’s operating departments and transfers from the General Fund.
• The net deficit in the Compensated Absences Fund is expected to be eliminated in next two fiscal years with increased department contributions.
CITY OF ALHAMBRA Notes to Basic Financial Statements
June 30, 2018
46

IV Detailed Notes on all Funds A. Cash and Investments
Cash and investments as of June 30, 2018 are classified in the accompanying financial statements as follows:
Statement of Net Position:Cash and investments $ 83,580,659 Restricted cash and investments 1,559,751
Total cash and investments $ 85,140,410
Cash and investments as of June 30, 2018 consist of the following:
Cash on hand $ 24,775 Deposits with financial institutions 1,920,144 Investments 83,195,491
Total cash and investments $ 85,140,410
1. Deposits
Custodial credit risk-deposits In the case of deposits, this is the risk that in the event a bank failure, the government’s deposits may not be returned to it. The California Government Code requires California banks and savings and loan associations to secure a city’s deposits by pledging government securities as collateral. The fair value of pledged securities must equal at least 110% of a city’s deposits. California law also allows financial institutions to secure city deposits by pledging first trust deed mortgage notes having a value of 150% of a city’s total deposits. At June 30, 2018, the carrying amount of the City’s restricted and unrestricted deposits (including cash and certificates of deposit) was $1,920,144 while the corresponding bank balances were $2,800,850, and was covered by federal depository insurance or collateralized in accordance with state law. The difference between the carrying amount of deposits and the corresponding bank balance is due to outstanding checks at year-end.
CITY OF ALHAMBRA Notes to Basic Financial Statements
June 30, 2018
47

2. Investments
The City’s investment policy, as approved by the City Council, authorizes the City to invest in certain types of investments as authorized by the California Government Code.
The table below identifies these investment types and the related maximum percentages by the California Government Code (or the City’s investment policy, where more restrictive). The table also identifies certain provisions of the California Government Code (or the City’s investment policy, where more restrictive) that address interest rate risk, credit risk, and concentration of credit risk. This table does not address investments of debt proceeds held by bond trustee that are governed by the provision of debt agreements of the City, rather than the general provisions of the California Government Code or the City’s investment policy.
Authorized Investment Type
Maximum Maturity
Maximum Percentage Portfolio
Maximum Investment
In One Issuer
U.S. Treasury Securities 5 years None None U.S. Government Agency Securities 5 years 70% 30% Banker’s Acceptances 180 days 40% 30% Commercial paper 270 days 25% None Negotiable Certificates of Deposit 5 years 30% None Repurchase Agreements 1 year None None Medium-Term Notes 5 years 30% None Receivable-Backed Securities 5 years 20% None Money Market Mutual Funds N/A 20% 10% Local Agency Investment Funds (LAIF) N/A None $65 million
Investments authorized under debt agreements
Investments authorized for funds held by bond trustee include, U.S. Treasury Obligations, U.S. Government Sponsored Enterprise Securities, Certificates of Deposits, Commercial Paper, Local Agency Bonds, Bankers’ Acceptances, Money Market Mutual Funds, Repurchase Agreements, Investment Contracts and any other investments permitted by bond insurer and are legal investments under State laws. There were no limitations on the maximum amount that can be invested in one issuer or maximum percentage allowed, however the maximum maturity of an investment is five years, except for the maturity of Banker’s Acceptance and Certificates of Deposits which are limited to 30 days and Investment Contracts which are limited by agreement.
CITY OF ALHAMBRA Notes to Basic Financial Statements
June 30, 2018
48

Interest Rate Risk Interest rate risk is the risk that changes in market interest rates will adversely affect the fair value of an investment. Generally, the longer the maturity of an investment the greater the sensitivity of its fair value to changes in market interest rates. In accordance with its policy, the City manages its exposure to declines in fair values by limiting the weighted average maturity of its investment portfolio as a whole to 24 months. Investments held by trustee are not subject to the 24 month maturity limitation.
Investment Type Total12 Months or
less13 to 24 Months
25 to 60 Months
U.S Government Sponsored Entity Securities $ 39,162,220 3,964,900 15,684,280 19,513,040 Local Agency Investment Fund 42,451,891 42,451,891 - - Money Market Funds 546,538 546,538 - -
Held by Bond Trustee:Money Market Funds 387,842 387,842 - - Investment Agreements 647,000 - 647,000 -
Total $ 83,195,491 47,351,171 16,331,280 19,513,040
Remaining Maturity (in Months)
Credit Risk Credit risk is the risk that an issuer of an investment will not fulfill its obligation to the holder of the investment. The City mitigates this risk by restricting investment to those meeting the minimum rating required by (where applicable) the California Government Code, the City’s investment policy, or debt agreement. The table below presents the minimum and the actual rating by Standards and Poor as of year end for each investment type:
Investment Type Total AAA AA+ AA- Unrated
U.S Government Sponsored Entity Securities $ 39,162,220 N/A - 39,162,220 - - Local Agency Investment Fund 42,451,891 None - - - 42,451,891 Money Market Funds 546,538 A 546,538 - - - Held by Bond Trustee:
Money Market Funds 387,842 A 387,842 - - - Investment Agreements 647,000 N/A - - 647,000 -
Total $ 83,195,491 934,380 39,162,220 647,000 42,451,891
Minimal Legal Rating
Ratings as of Year End
CITY OF ALHAMBRA Notes to Basic Financial Statements
June 30, 2018
49

Concentration of Credit Risk The investment policy of the City contains no limitations on the amount that can be invested in any one issuer beyond that stipulated by the California Government Code. Investments in any one issuer (other than U.S. Treasury securities, mutual funds, and external investment pools) that represent 5% or more of the total City investments are as follows:
Issuer Investment Type AmountFederal Home Loan Mortgage Corporation U.S Government Sponsored Entity Securities $ 11,781,140 Federal Home Loan Bank U.S Government Sponsored Entity Securities 9,763,320 Federal National Mortgatge Corporation U.S Government Sponsored Entity Securities 5,886,920 Federal Farm Credit Bank U.S Government Sponsored Entity Securities 11,730,840
Total $ 39,162,220
Custodial Credit Risk – Investments For an investment, this is the risk that, in the event or the failure of the counterparty, the government will not be able to recover the value of its investments or collateral securities that are in the possession of an outside party. To protect against fraud, embezzlement, or losses caused by collapse of individual securities dealers, all securities owned by the City (except for investments held by bond trustee) are held in safekeeping by the City’s custodial bank or a third party bank trust department, acting as agent for the City under the terms of a custody agreement. Investments of $1,034,842 were purchased and held by the bond trustee.
3. State Treasurer’s Local Agency Investment Funds
The City is a voluntary participant in the Local Agency Investment Fund (LAIF) that is regulated by California Government Code Section 16429 under the oversight of the Treasurer of the State of California. The fair value of the City’s investment in this pool is reported in the accompanying financial statements at amounts based upon the City’s pro-rata share of the fair value provided by LAIF for the entire LAIF portfolio (in relation to the amortized cost of that portfolio). The balance available for withdrawal is based on the accounting records maintained by LAIF, which are recorded on an amortized cost basis.
4. Restricted Cash and Investments
Fiscal agents on behalf of the City hold and invest funds in the City’s name from long-term debt issuances, including construction, debt service, and reserve fund balances. Fiscal agents are mandated by bond indenture as to the types of investments in which debt proceeds can be invested.
5. Fair Value Measurements
The City categorized its fair value measurements within the fair value hierarchy established by generally accepted accounting principles. The hierarchy is based on the relative inputs used to measure the fair value of the investments. The hierarchy gives the highest priority to unadjusted quoted prices in active markets for identical assets (Level 1 measurements) and the lowest priority to unobservable inputs (Level 3 measurements).
CITY OF ALHAMBRA Notes to Basic Financial Statements
June 30, 2018
50

The City has the following recurring fair value measurements as of June 30, 2018:
Investment Type Total
U.S Government Sponsored Entity Securities $ - 39,162,220 - $ 39,162,220 Investment Agreements - - 647,000 647,000
Total Leveled Investments $ - 39,162,220 647,000 39,809,220
Local Agency Investment Fund 42,451,891 Money Market Mutual Funds 546,538 Held by Fiscal Agent:
Money Market Mutual Funds 387,842 Total Investment Portfolio $ 83,195,491
Quoted Inputs Level 2
Quoted Prices
Level 1
Unobservable Inputs
Level 3
• U.S. Government Sponsored Entity Securities are classified Level 2 of the fair value hierarchy, as the valuation uses a market-based model which considers yield, price of comparable securities, coupon rate, maturity, credit quality and dealer-provided prices. These prices are obtained from various pricing sources by our custodian bank.
• Investment Agreements are classified as Level 3 of the fair value hierarchy and are measured at cost.
• Local Agency Investment Funds is measured at fair value, however, the investment is not required to be leveled.
• Money Market Mutual Funds are not subject to fair value hierarchy as the investments are reported at amortized cost.
B. Receivables
Loans Receivables
The City granted loans to individuals for property rehabilitation. The terms of the loans do not require repayment until the sale of the related property and the stated interest rate is 5%. These loans are not forgivable. The loans receivable balance at June 30, 2018 is $204,405.
The City also provides certain forgivable loans for the development and rehabilitation of low- and moderate-income housing and loans for first-time home buyers. The terms of these loans do not require payment unless the related property is sold and are to be forgiven if certain conditions met. The City records the loan receivable balances and an offsetting allowance for uncollectible accounts in the same amount as these loans are considered to be uncollectible.
CITY OF ALHAMBRA Notes to Basic Financial Statements
June 30, 2018
51

C. Capital Assets
Capital assets activity for the primary government for the year ended June 30, 2018 is as follows:
Balances at Balances atJune 30, 2017 Additions Deletions June 30, 2018
Governmental activities:Capital assets, not being depreciated:
Land $ 22,035,738 — — 22,035,738 Construction in progress 1,548,674 4,699,161 (1,548,674) 4,699,161
Total capital assets, notbeing depreciated 23,584,412 4,699,161 (1,548,674) 26,734,899
Capital assets, being depreciated:Buildings, structures, and
improvements 88,461,365 1,283,020 (378,652) 89,365,733 Machinery and equipment 19,957,779 929,561 (665,807) 20,221,533 Infrastructure 98,265,376 3,457,660 (1,649,648) 100,073,388
Total capital assets,being depreciated 206,684,520 5,670,241 (2,694,107) 209,660,654
Less accumulated depreciation for:Buildings, structures, and
improvements (29,882,290) (1,757,324) 361,598 (31,278,016) Machinery and equipment (14,531,733) (1,105,419) 616,689 (15,020,463) Infrastructure (48,988,495) (2,120,957) 1,090,019 (50,019,433)
Total accumulateddepreciation (93,402,518) (4,983,700) 2,068,306 (96,317,912)
Total capital assets, beingdepreciated, net 113,282,002 686,541 (625,801) 113,342,742
Governmental activities $ 136,866,414 5,385,702 (2,174,475) 140,077,641
CITY OF ALHAMBRA Notes to Basic Financial Statements
June 30, 2018
52

Balances at Balances atJune 30, 2017 Additions Deletions June 30, 2018
Business-type activities:Capital assets, not being depreciated:
Land $ 5,769,073 — — 5,769,073 Construction in progress 3,196,944 4,632,756 (1,845,318) 5,984,382
Total capital assets, notbeing depreciated 8,966,017 4,632,756 (1,845,318) 11,753,455
Capital assets, being depreciated:Buildings, structures, and
improvements 17,845,070 — — 17,845,070 Utility systems 41,955,525 4,400,015 (22,795) 46,332,745 Machinery and equipment 4,245,804 552,769 (102,262) 4,696,311
Total capital assets,being depreciated 64,046,399 4,952,784 (125,057) 68,874,126
Less accumulated depreciation for:Buildings, structures, and
improvements (6,710,379) (336,964) — (7,047,343) Utility systems (9,588,535) (506,319) 19,717 (10,075,137) Machinery and equipment (3,488,120) (242,970) 102,263 (3,628,827)
Total accumulateddepreciation (19,787,034) (1,086,253) 121,980 (20,751,307)
Total capital assets, beingdepreciated, net 44,259,365 3,866,531 (3,077) 48,122,819
Business-type activities $ 53,225,382 8,499,287 (1,848,395) 59,876,274
Capital assets for Internal Service Funds included within governmental activities in the above table for the year ended June 30, 2018 is as follows:
Balances at Balances atJuly 1, 2017 Additions Deletions June 30, 2018
Internal Service Funds included ingovernmental activities:
Land $ 237,950 — — 237,950 Machinery and equipment 6,439,401 436,981 (500,772) 6,375,610 Less accumulated depreciation
for machinery and equipment (4,908,948) (250,448) 479,160 (4,680,236)
Total $ 1,768,403 186,533 (21,612) 1,933,324
CITY OF ALHAMBRA Notes to Basic Financial Statements
June 30, 2018
53

The following table summarizes the changes in capital assets for the year ended June 30, 2018 for the water system network:
Water System Network:
Balance as of Balance as of Capital Asset Type June 30, 2017 Additions Deletions June 30, 2018
Land $ 1,923,817 — — 1,923,817 Building 1,729,797 — — 1,729,797 Structure and improvement 9,036,829 — — 9,036,829 Water lines 18,540,787 2,064,146 (22,794) 20,582,139 Water reservoir and pump stations 7,420,836 — — 7,420,836 Water wells 2,920,475 — — 2,920,475 Machinery and equipment 1,098,538 117,109 — 1,215,647 Motor vehicle 1,203,215 413,438 (77,960) 1,538,693 Construction in progress 1,718,588 — (1,718,588) — Less accumulated depreciation for
water system network (10,511,770) (705,541) 97,677 (11,119,634)
Totals – net of accumulateddepreciation $ 35,081,112 1,889,152 (1,721,665) 35,248,599
The following table summarizes the changes in capital assets for the year ended June 30, 2018 for the storm drain and sewer system networks:
Storm Drain and Sewer System Network:
Balance as of Balance as of Capital Asset Type July 1, 2017 Additions Deletions June 30, 2018
Land $ 169,595 — — 169,595 Storm drain line 1,410,513 — — 1,410,513 Storm drain pump station 47,440 — — 47,440 Sewer lines 10,475,192 2,335,869 — 12,811,061 Sewer lift and pump stations 1,140,283 — — 1,140,283 Machinery and equipment 269,820 7,301 — 277,121 Motor vehicle 956,669 — — 956,669 Construction in progress 1,478,356 4,632,756 (126,730) 5,984,382 Less accumulated depreciation for
storm drain and sewer systemnetwork (3,786,352) (236,017) — (4,022,369)
Totals – net of accumulateddepreciation $ 12,161,516 6,739,909 (126,730) 18,774,695
CITY OF ALHAMBRA Notes to Basic Financial Statements
June 30, 2018
54
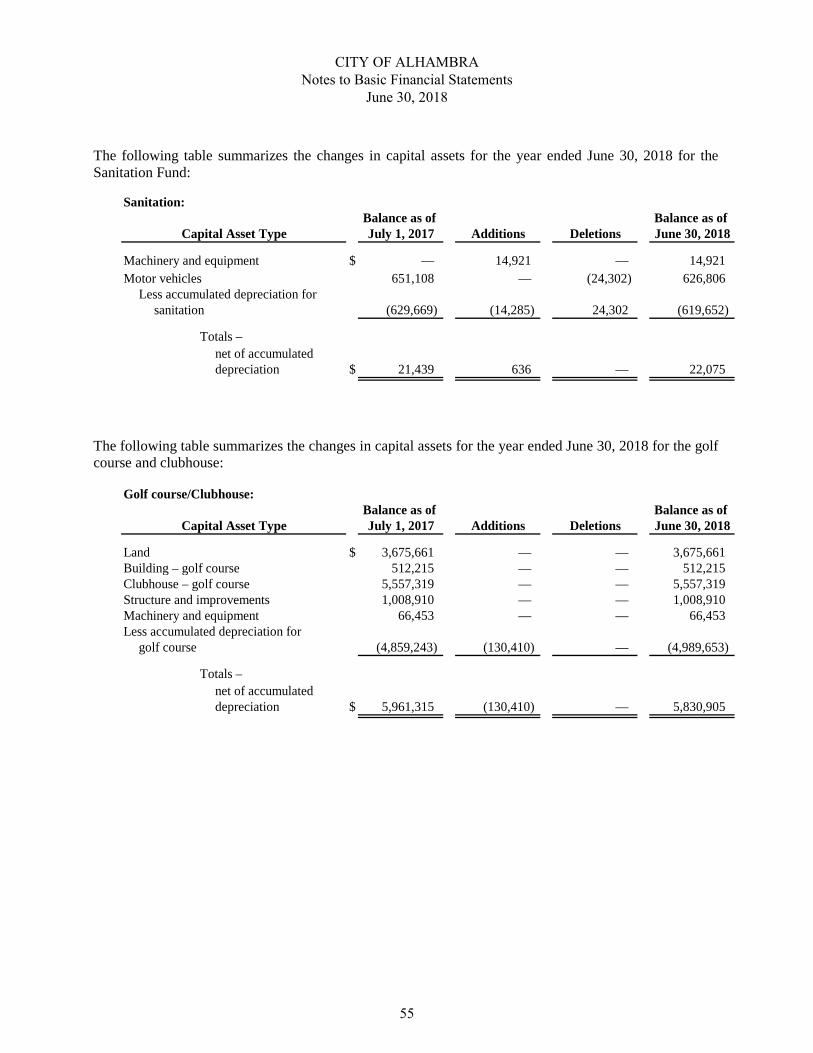
The following table summarizes the changes in capital assets for the year ended June 30, 2018 for the Sanitation Fund:
Sanitation:Balance as of Balance as of
Capital Asset Type July 1, 2017 Additions Deletions June 30, 2018
Machinery and equipment $ — 14,921 — 14,921 Motor vehicles 651,108 — (24,302) 626,806
Less accumulated depreciation for sanitation (629,669) (14,285) 24,302 (619,652)
Totals – net of accumulated depreciation $ 21,439 636 — 22,075
The following table summarizes the changes in capital assets for the year ended June 30, 2018 for the golf course and clubhouse:
Golf course/Clubhouse:Balance as of Balance as of
Capital Asset Type July 1, 2017 Additions Deletions June 30, 2018
Land $ 3,675,661 — — 3,675,661 Building – golf course 512,215 — — 512,215 Clubhouse – golf course 5,557,319 — — 5,557,319 Structure and improvements 1,008,910 — — 1,008,910 Machinery and equipment 66,453 — — 66,453 Less accumulated depreciation for
golf course (4,859,243) (130,410) — (4,989,653)
Totals – net of accumulated depreciation $ 5,961,315 (130,410) — 5,830,905
CITY OF ALHAMBRA Notes to Basic Financial Statements
June 30, 2018
55

Depreciation expense was charged to functions/programs of the primary government as follows:
Governmental activities:General government $ 203,458 Public safety 1,080,284 Public works 2,620,158 Culture and recreation 829,352 Internal service fund assets allocated to various functions based on usage 250,448
Total depreciation expense – governmental activities $ 4,983,700
Business-type activities:Water $ 705,541 Sewer and storm drain 236,017 Sanitation 14,285 Golf course/clubhouse 130,410
Total depreciation expense – business-type activities $ 1,086,253
The City has entered into contracts for the construction or renovation of the following projects:
Project Expended Remainingauthorization to date commitment
Property rehabilitation $ 57,000 32,650 24,350 Street improvements 3,662,281 1,460,397 2,201,884 Park improvements 75,000 33,500 41,500 Water reservoir rehabilitation 769,000 — 769,000 Sewer main rehabilitation 2,514,700 — 2,514,700
$ 7,077,981 1,526,547 5,551,434
CITY OF ALHAMBRA Notes to Basic Financial Statements
June 30, 2018
56

D. Interfund Accounts
Individual fund interfund receivables, payables, and transfers at June 30, 2018 are:
Due from Due toother funds other funds Transfers in Transfers out
General Fund $ 8,574,540 — 1,619,170 2,799,366Community Development Block Grant Fund — 3,724,226 — 114,912Transportation Capital Improvement — 762,396 877,828 — Other Governmental Funds:
Special Revenue Funds:Law Enforcement — 1,883 — — TDA Bikeway — 71,267 — — State Gas Tax — — 169,269 — Proposition C — — — 314,456 Measure R — — — 877,828
— — 737 — Lighting and Landscape Maintenance — — — 668,987Police Facility Assessment — — — 2,174,703
12,783 78,342 12,783 — Debt Service Funds:
Lighting and Sidewalk Construction — — 624,321 — Police Facility — — 2,084,863 — Parking Authority — — 414,369 —
Capital Projects Funds:Capital Outlay — — 1,753,650 —
Total other Governmental Funds 12,783 151,492 5,059,992 4,035,974 Enterprise Funds:
Water — — 151,747 513,841Sewer and Storm Drain — — 314,456 307,350Sanitation — — 44,666 15,848Golf Course/Clubhouse — 1,191,578 — 110,205
Total Enterprise Funds — 1,191,578 510,869 947,244 Internal Service Funds:
Equipment — — 13,530 80,666Self-Insurance — 2,757,631 34,330 137,557
Total Internal Service Funds — 2,757,631 47,860 218,223
Total $ 8,587,323 8,587,323 8,115,719 8,115,719
The outstanding interfund receivables and payable balances result primarily from temporary operating cash loans and fromthe time lag between the dates that (1) interfund goods and services are provided or reimbursable expenditures occur, (2)transactions are recorded in the accounting system, and (3) payments between funds are made.
Transfers were used to 1) move revenues from the fund with collection authorization to the debt service fund as a debtservice principal and interest payments become due, 2) move unrestricted revenues to finance various programs accountedfor in other funds including amounts provided as subsidies or matching funds for various grant programs, and 3) moveunrestricted general fund balance to various funds with deficit balances
Air Quality
Home Fund
CITY OF ALHAMBRA Notes to Basic Financial Statements
June 30, 2018
57

E. Long-Term Liabilities
Changes in long-term liabilities for the year ended June 30, 2018 were as follows: Balances,
June 30, 2017, Balances, Due withinas restated Additions Retirements June 30, 2018 one year
Governmental activities:Alhambra Capital Improvements
Corporation – certificatesof participation $ 11,705,000 — (1,340,000) 10,365,000 1,450,000
Alhambra Parking Authority -lease revenue bonds 6,215,000 — (130,000) 6,085,000 135,000
Less bond discount (51,725) 1,967 — (49,758) — Public works maintenance and
improvement bonds 1,175,000 — (570,000) 605,000 605,000 Notes and loans payable 1,159,186 — (240,478) 918,708 249,945 Compensated absences 2,882,466 2,313,510 (2,436,470) 2,759,506 471,834 Capital lease obligations (IV.F.) 1,201,325 — (267,433) 933,892 253,715 Pension liability (V.E.) 14,524,650 410,872 (1,383,402) 13,552,120 — Pension liability (V.D.) 104,712,827 17,365,784 (9,227,710) 112,850,901 — OPEB liability (V.F.) 21,720,742 739,275 (1,760,406) 20,699,611 — Self-insurance liabilities 15,231,260 5,017,965 (3,612,087) 16,637,138 2,559,495
Subtotal governmental activities 180,475,731 25,849,373 (20,967,986) 185,357,118 5,724,989 Business-type activities:
Water: Revenue refunding bonds 6,480,000 — (695,000) 5,785,000 710,000 Add bond premium 862,598 — (112,513) 750,085 —
Compensated absences 239,061 312,738 (258,842) 292,957 50,091 Loan payable 391,563 — (195,782) 195,781 195,781 Capital lease obligations (IV.F.) 5,836 — (2,855) 2,981 2,981 Pension liability (V.E.) 1,552,635 49,569 (153,636) 1,448,568 — Pension liability (V.D.) 8,513,217 1,411,849 (750,219) 9,174,847 — OPEB liability (V.F.) 2,346,178 79,381 (196,012) 2,229,547 —
Sewer and storm drain:Capital lease obligations (IV.F.) 5,836 — (2,855) 2,981 2,981 Compensated absences 7,562 32,156 (27,663) 12,055 2,061 Pension liability (V.E.) 283,815 9,061 (28,084) 264,792 — Pension liability (V.D.) 1,310,763 217,379 (115,510) 1,412,632 — OPEB liability (V.F.) 327,428 11,078 (27,355) 311,151 —
Sanitation:Compensated absences 17,041 35,924 (31,767) 21,198 3,625 Pension liability (V.E.) 333,900 10,660 (33,040) 311,520 — Pension liability (V.D.) 1,545,633 256,331 (136,207) 1,665,757 — OPEB liability (V.F.) 421,652 14,266 (35,227) 400,691 —
Subtotal business-type activities 24,644,718 2,440,392 (2,802,567) 24,282,543 967,520
Total long-term liabilities $ 205,120,449 28,289,765 (23,770,553) 209,639,661 6,692,509
CITY OF ALHAMBRA Notes to Basic Financial Statements
June 30, 2018
58

Long-term liabilities at June 30, 2018 consist of:
(1) Governmental Activities
Bond and Certificate Indebtedness
• Certificates of Participation – In 1992, the Alhambra Capital Improvements Corporation issued $27,000,000 serial and term certificates of participation maturing in increasing amounts from $135,000 to $2,000,000, plus interest at 4.80% to 6.75% through September 1, 2023. Certificates maturing on or after September 1, 2001 are subject to redemption at the option of the Corporation at a price of 102% to 100% of principal value. Debt service on the certificates is provided from a lease payment made by the City using monies collected from a Citywide Public Facility Assessment District. In August 2006, the City reoffered the outstanding balance of $22,140,000 of the 1992 Certificates of Participation by the purchase of the outstanding certificates through redemption and the sale of the certificates and optional redemption rights to the underwriter resulting in a net gain of $3,149,832 (net of issuance costs of $1,000,168) to finance the acquisition and construction of certain public capital facilities. The interest rate on the reoffered Certificates remains unchanged. At June 30, 2018, $10,365,000 was outstanding.
• Lease Revenue Bonds – In October 2013 the Alhambra Parking Authority, a nonprofit entity of the City, issued $6,565,000 serial and term bonds, which mature in increasing amounts from $105,000 to $395,000, plus interest ranging from 2.0% to 5.0% through September 1, 2043. Bond proceeds are being used to fund the construction of a parking structure, fund reserve requirements, and pay costs of issuance. The bonds maturing on or after September 1, 2024 are subject to redemption at the option of the City at any time prior to the maturity date of the bonds without premium. The term bonds, maturing on September 1, 2033, September 1, 2038, and September 1, 2043 are subject to mandatory redemption. The City under a lease agreement shall make lease payments in amounts equal to the debt service on the bonds. At June 30, 2018, $6,085,000 was outstanding.
• Public Works Maintenance and Improvements Assessment District Refunding Bonds – In 1994, the City issued $8,300,000 serial and term refunding improvement bonds related to the Public Works Maintenance and Improvements Assessment District No. 1 to advance refund the 1986 $9,930,000 improvement bonds. The bonds are secured by unpaid assessments of the assessment district and mature in increasing amounts from $180,000 to $605,000, plus interest at interest rates ranging from 3.5% to 6.125% through September 2, 2018. The bonds maturing on or after September 2, 2002 are subject to redemption at the option of the City at any time prior to the maturity date of the bonds at a price of 102% to 100% of principal value. The term bonds, maturing on September 2, 2018, are subject to mandatory redemption. Debt service payments are made from special assessment revenues and City General Fund contributions as necessary. At June 30, 2018, $605,000 was outstanding.
CITY OF ALHAMBRA Notes to Basic Financial Statements
June 30, 2018
59

Notes, Loans, and Other Long-Term Debt
• Bank Notes Payable – In December 2006, the City entered into an agreement with Banc of America Public Capital Corporation to fund the purchase of a new and upgraded heating, ventilation and air conditioning system for city facilities. Quarterly payments of $70,496 at an interest rate of 3.88% are due through December 13, 2021. At June 30, 2018, $918,708 was outstanding.
(2) Business-type Activities
• Water Revenue Refunding Bonds - In November 2016, the City issued $7,225,000 Water Revenue Refunding Bonds, Series 2016, which mature in amounts from $695,000 to $955,000, plus interest at 2.0% to 5.0% through March 1, 2025. Bond proceeds were used to refund the remaining outstanding amount of $8,980,000 on the $14,735,000 2006 Water System Revenue Certificates of Participation. The refunding resulted in an economic gain (difference between present value of the debt service payments on the old and new debt) of $826,437 and a reduction in total debt service payments of $2,248,476. The Bonds are subject to optional or mandatory redemption prior to their stated maturity dates. At June 30, 2018, $5,785,000 was outstanding.
• Loan Payable – In August 2004, the City entered into an agreement with San Gabriel Valley Municipal Water District to fund the purchase of groundwater treatment equipment. The funds were received by the City in April 2006. Ten annual payments of $195,781 at an interest rate of 0% are due beginning September 2009. At June 30, 2018, $195,781 was outstanding.
In the opinion of the City’s management, the City has complied with all debt covenants.
(3) Compensated Absences
This represents all vested compensated absences of the City, which amounted to $2,759,506 at June 30, 2018 for governmental activities and $326,210 for business-type activities. Governmental compensated absences obligation is generally liquidated by the Compensated Absences Internal Service Fund.
(4) Self-Insurance Liability
Claims liability of $16,637,138 reported in the Self-Insurance Internal Service Fund at June 30, 2018 is based on requirements of GASB Statement 10, which requires that a liability for claims be reported if information prior to the issuance of the financial statements indicates that it is probable that a liability has been incurred at the date of the financial statements and the amount of the loss can be reasonably estimated. Changes in the Fund’s claims liability amount during the two fiscal years ended June 30, 2018 were:
2018 2017Balance, July 1 $ 15,231,260 11,519,250 Claims and changes in estimates 5,017,965 5,645,458 Claim payments (3,612,087) (1,933,448) Balance, June 30 $ 16,637,138 15,231,260
CITY OF ALHAMBRA Notes to Basic Financial Statements
June 30, 2018
60

(5) Future Minimum Debt Service Requirements
Annual debt service requirements to maturity are as follows:
Governmental Activities:Certificates of Participation and Lease Revenue Bonds Assessment bonds Notes and loans payablePrincipal Interest Principal Interest Principal Interest
Year ending June 30:2019 $ 1,585,000 930,419 605,000 18,528 249,945 32,038 2020 1,720,000 822,656 — — 259,785 22,119 2021 1,830,000 706,762 — — 270,012 11,971 2022 1,920,000 584,255 — — 138,966 2,025 2023 2,035,000 455,356 — — — — 2024-2028 2,860,000 1,259,995 — — — — 2029-2033 1,055,000 987,258 — — — — 2034-2038 1,340,000 699,695 — — — — 2039-2043 1,710,000 320,750 — — — — 2044-2048 395,000 9,875 — — — —
16,450,000 6,777,021 605,000 18,528 918,708 68,153 Less bond discount (49,758) — — — — —
Total $ 16,400,242 6,777,021 605,000 18,528 918,708 68,153
Others* TotalPrincipal Interest Principal Interest
Year ending June 30:2019 $ 2,813,210 26,670 5,253,155 1,007,655 2020 473,531 18,828 2,453,316 863,603 2021 478,045 14,312 2,578,057 733,045 2022 482,687 9,671 2,541,653 595,951 2023 487,457 491 2,522,457 455,847 2024-2028 1,241,540 — 4,101,540 1,259,995 2029-2033 — — 1,055,000 987,258 2034-2038 — — 1,340,000 699,695 2039-2043 — — 1,710,000 320,750 2044-2048 — — 395,000 9,875 Indeterminate 11,594,560 — 11,594,560 —
Total 17,571,030 69,972 35,544,738 6,933,674 Less bond discount — — (49,758) —
$ 17,571,030 69,972 35,494,980 6,933,674
* Others consist of capital leases and self-insurance liabilities.
CITY OF ALHAMBRA Notes to Basic Financial Statements
June 30, 2018
61

Business-type Activities:
Revenue Refunding Bonds
Principal Interest Principal Interest Principal InterestYear ending June 30:
2019 $ 710,000 271,500 201,743 260 911,743 271,760 2020 745,000 135,125 — — 745,000 135,125 2021 780,000 197,000 — — 780,000 197,000 2022 825,000 156,875 — — 825,000 156,875 2023 865,000 114,625 — — 865,000 114,625 2024-2028 1,860,000 94,250 — — 1,860,000 94,250
5,785,000 969,375 201,743 260 5,986,743 969,635 Add bond premium 750,085 — — — 750,085 —
Total $ 6,535,085 969,375 201,743 260 6,736,828 969,635
* Others consist of loan payable, and capital leases.
TotalOthers*
(6) Pledged Revenue
The Water Revenue Refunding Bonds outstanding are collateralized by the pledging of certain revenues. The amount and term of the remainder of this commitment is indicated in the debt service to maturity table presented in the accompanying notes. The purpose for which the proceeds of the debt issuance was utilized is disclosed in the debt description of the accompanying notes. For the current year, debt service payment as percentage of the pledged gross revenue (net of certain expenses where so required by the debt agreement) is indicated in the table below. This percentage approximates the relationship of the debt service of pledged revenues for the remainder of the term of the commitment. The City is required to maintain system net revenues during each fiscal year equal to at least 120% of the annual debt service in such fiscal year. During the current fiscal year this percentage was 122%
Description of Pledged Revenue
Annual Amount of Pledged Revenue (net of expenses)
Annual Debt Service Payment
Pledged Revenue as a Percentage of
Debt Service
Water Revenues $ 1,422,519 $ 998,150 143%
F. Lease Obligations
The City has entered into capital lease obligations for machinery and equipment purchased under financing leases. The leases require monthly payments of principal and interest, with interest rates ranging from 2.8% to 6.7%. The gross amount of the assets acquired under capital leases is $1,767,032 and is classified as machinery and equipment within capital assets. The amortization of the leased assets included as part of depreciation expense and accumulated depreciation at June 30, 2018, is $257,278.
CITY OF ALHAMBRA Notes to Basic Financial Statements
June 30, 2018
62

Future minimum lease payments under capital leases and the present value of the net minimum lease payments at June 30, 2018 are:
Governmental Business-typeactivities activities
Year ending June 30:2019 $ 280,386 6,222 2020 181,973 — 2021 181,973 — 2022 181,972 — 2023 181,972 —
Total minimum lease payments 1,008,276 6,222
Less amount representing interest (74,384) (260) Present value of future minimum lease payments $ 933,892 5,962
The City is obligated under certain leases accounted for as operating leases. Operating leases do not give rise to property rights or lease obligations, and therefore, the results of the lease agreements are not reflected as capital assets. The following is a schedule by years of future minimum rental payments required under operating leases that have initial or remaining non-cancellable lease terms in excess of one year as of June 30:
Year ending June 30:2019 22,353 2020 20,592 2021 20,700 2022 11,015 2023 11,125
Total minimum paymentsrequired $ 85,785
During the fiscal year, total rental expenditures for all operating leases were $42,586.
V. Other Information
A. Litigation
In December 1995, the California Supreme Court upheld the constitutionality of Proposition 62, a 1986 initiative which required voter approval of all new or increased taxes. Since the City is a charter city, City management, based upon advice from counsel, believes the Court’s ruling will not invalidate certain taxes previously collected by the City and disallow these taxes from being collected in the future. However, the likelihood and amount of such an adverse effect upon the financial position of the City, if any, is currently unknown and has not been reflected in the basic financial statements.
The City is a defendant in general damage and personal injury lawsuits and claims arising in the normal course of operations. In the opinion of City management, outside counsel, and the City Attorney, the potential liability to the City for such lawsuits and claims should not have a material adverse effect upon the financial condition of the various funds and account groups of the City beyond that already accrued for.
CITY OF ALHAMBRA Notes to Basic Financial Statements
June 30, 2018
63

B. Contingencies
No Commitment Debt
The City has issued the special obligations listed below that are payable solely out of revenues derived from the various projects financed by the bonds. Neither the faith and credit nor the taxing power of the City is pledged to the payment of the principal of or interest on any bond; nor is the City in any manner obligated to make any appropriation for payment therefore:
• $31,390,000 Alhambra Revenue Bonds Series 2016 (Atherton Baptist Homes). The bonds were issued in October 2016 to refund the remaining amount of $28,230,000 on the Series 2010 A/B Bonds. $30,435,000 is outstanding at June 30, 2018.
C. Insurance Joint Powers Authority
The City is a member of the Independent Cities Risk Management Authority (ICRMA), a joint powers authority formed to enable individual cities to join together to obtain certain casualty and health insurance coverage’s as a group, to self-insure, where necessary, and to obtain adequate liability and worker’s compensation coverages at an affordable cost. ICRMA has 16 member cities at June 30, 2018 and each city appoints one member to the ICRMA Governing Board. As of July 1, 2018 the City is no longer a member of ICRMA and has become a member of California Joint Powers Insurance Authority.
D. Public Employees’ Retirement System
Deferred DeferredPension Outflows Inflows PensionLiability of Resources of Resources Expense
CalPers - Miscellaneous $ 39,221,673 $ 11,545,508 $ 2,592,099 $ 4,260,083CalPers - Safety 85,882,464 19,739,821 5,102,366 9,009,581Other Pension Benefit 15,577,000 2,069,000 1,436,000 1,051,000
$ 140,681,137 $ 33,354,329 $ 9,130,465 $ 14,320,664
(a) General Information about the Pension Plans:
Plan Description
All qualified permanent and probationary employees are eligible to participate in the City of Alhambra’s separate Safety (police and fire) and Miscellaneous (all other) Plans, agent multiple-employer defined benefit pension plans administered by the California Public Employees’ Retirement System (CalPERS), which acts as a common investment and administrative agent for its participating member employers. Benefit provisions under the Plans are established by State statute and City of Alhambra resolution. CalPERS issues publicly available reports that include a full description of the pension plans regarding benefit provisions, assumptions and membership information that can be found on the CalPERS website. Benefits Provided
CalPERS provides service retirement and disability benefits, annual cost of living adjustments and death benefits to plan members, who must be public employees and beneficiaries. Benefits are based on years of credited service, equal to one year of full time employment. Members with five years of total service are eligible to retire at age 50 to 62 with statutorily reduced benefits. For employees hired into a plan with the 1.5% at 65 formula, eligibility for service retirement is age 55
CITY OF ALHAMBRA Notes to Basic Financial Statements
June 30, 2018
64

with at least 5 years of services. PEPRA miscellaneous members become eligible for service retirement is age 55 with at least 5 years of services. PEPRA miscellaneous members become eligible for service retirement upon attainment of age 52 with at least 5 years of service. All members are eligible for non-duty disability benefits after 5 years of service. The death benefit is one of the following: the Basic Death Benefit, the 1957 Survivor Benefit, or the Optional Settlement 2W Death Benefit. Safety members can receive a special death benefit if the member dies while actively employed and the death is job-related. Fire members may receive the alternate death benefit in lieu of the Basic Death Benefit or the 1957 Survivor Benefit if the member dies while actively employed and has at least 20 years of total CalPERS service. The cost of living adjustments for each plan are applied as specified by the Public Employees’ Retirement Law.
The Plans’ provisions and benefits in effect at June 30, 2018, are summarized as follows:
Miscellaneous
Hire date Prior to
January 1, 2013 On or after
January 1, 2013 Benefit formula 2.7% @ 55 2% at 62 Benefit vesting schedule 5 years service 5 years service Benefit payments monthly for life monthly for life Retirement age 50 - 55 52 - 67 Monthly benefits, as a % of eligible compensation 2.0% to 2.7% 1.0% to 2.5% Required employee contribution rates 8% 5.50% Required employer normal cost rates 9.458% 9.458% Required employer payment of unfunded liability $2,746,380 Safety
Hire date Prior to
January 1, 2013 On or after
January 1, 2013 Benefit formula 3% @ 50 2.7% @ 57 Benefit vesting schedule 5 years service 5 years service Benefit payments monthly for life monthly for life Retirement age 50 50 – 57 Monthly benefits, as a % of eligible compensation 3.0% 2.0% to 2.7% Required employee contribution rates 9% 11.25% Required employer normal cost rates 18.904% 18.904% Required employer payment of unfunded liability $4,457,201
Employees Covered At June 30, 2018, the following employees were covered by the benefit terms for each Plan:
Miscellaneous Safety Inactive employees or beneficiaries currently receiving benefits 313 256 Active employees 273 140 Inactive employees entitled to but not yet receiving
benefits 414 112
Total 1,000 508
CITY OF ALHAMBRA Notes to Basic Financial Statements
June 30, 2018
65

Contributions Section 20814(c) of the California Public Employees’ Retirement Law requires that the employer contribution rates for all public employers be determined on an annual basis by the actuary and shall be effective on the July 1 following notice of a change in the rate. The total plan contributions are determined through CalPERS’ annual actuarial valuation process. The actuarially determined rate is the estimated amount necessary to finance the costs of benefits earned by employees during the year, with an additional amount to finance any unfunded accrued liability. The City is required to contribute the difference between the actuarially determined rate and the contribution rate of employees. City contribution rates may change if plan contracts are amended. Payments made by the employer to satisfy contribution requirements that are identified by the pension plan terms as plan member contributions requirements are classified as plan member contributions.
(b) Net Pension Liability
The City of Alhambra’s net pension liability for each Plan is measured as the total pension liability, less the pension plan’s fiduciary net position. The net pension liability of each of the Plans is measured as of June 30, 2017, using an annual actuarial valuation as of June 30, 2016 rolled forward to June 30, 2017 using standard update procedures. A summary of principal assumptions and methods used to determine the net pension liability is shown below. Actuarial Assumptions The total pension liabilities in the June 30, 2016 actuarial valuations were determined using the following actuarial assumptions:
Miscellaneous Safety Valuation Date June 30, 2016 June 30, 2016 Measurement Date June 30, 2017 June 30, 2017 Actuarial Cost Method Entry-Age Normal Cost Method Actuarial Assumptions: Discount Rate 7.15% 7.15% Inflation 2.75% 2.75% Payroll Growth 3.0% 3.0% Projected Salary Increase (1) (1) Mortality Rate Table (2) (2)
Post-retirement benefit income (3) (3)
(1) Varies by entry age and service. (2) The probabilities of mortality are derived using CalPERS’ membership data for all funds.
The mortality table used was developed based on CalPERS’ specific data. The table includes 20 years of mortality improvements using Society of Actuaries Scale BB. For more details on this table, please refer to the 2014 experience study report.
(3) Contract COLA up to 2.75% until Purchasing Power Protection Allowance Floor on Purchasing Power applies, 2.75% thereafter
All other actuarial assumptions used in the June 30, 2016 valuation were based on the results of an actuarial experience study for the period from 1997 to 2011, including updates to salary increase, mortality and retirement rates. The Experience Study report can be obtained at the CalPERS website under Forms and Publications.
CITY OF ALHAMBRA Notes to Basic Financial Statements
June 30, 2018
66

Change of Assumptions GASB 68, paragraph 68 states that the long-term expected rate of return should be determined net of pension plan investment expense but without reduction for pension plan administrative expense. The discount rate of 7.5% used for the June 30, 2016 measurement date was net of administrative expense. The discount rate of 7.15% used for the June 30, 2017 measurement date is without reduction of pension plan administrative expense. Discount Rate The discount rate used to measure the total pension liability was 7.15% for each Plan and reflects the long-term expected rate of return for each plan net of investment expense and without reduction for administrative expenses. To determine whether the municipal bond rate should be used in the calculation of a discount rate for each plan, CalPERS stress tested plans that would most likely result in a discount rate that would be different from the actuarially assumed discount rate. Based on the testing of the Plans, the tests revealed the assets would not run out. Therefore, the current 7.15% discount rate is appropriate and the use of the municipal bond rate calculation is not deemed necessary. The long term expected discount rate of 7.15% will be applied to all plans in the Public Employees Retirement Fund (PERF). The stress test results are presented in a detailed report called “GASB Crossover Testing Report” that can be obtained from the CalPERS website under the GASB 68 section. The long-term expected rate of return on pension plan investments was determined using a building-block method in which expected future real rates of return (expected returns, net of pension plan investment expense and inflation) are developed for each major asset class. In determining the long-term expected rate of return, CalPERS took into account both short-term and long-term market return expectations as well as the expected pension fund (PERF) cash flows. Taking into account historical returns of all the Public Employees Retirement Funds’ asset classes (which includes the agent plan and two cost-sharing plans or PERF A, B, and C funds), expected compound (geometric) returns were calculated over the short-term (first 10 years) and the long-term (11-60 years) using a building-block approach. Using the expected nominal returns for both short-term and long-term, the present value of benefits was calculated for each PERF fund. The expected rate of return was set by calculating the single equivalent expected return that arrived at the same present value of benefits for cash flows as the one calculated using both short-term and long-term returns. The expected rate of return was then set equivalent to the single equivalent rate calculated above and rounded down to the nearest one quarter of one percent.
CITY OF ALHAMBRA Notes to Basic Financial Statements
June 30, 2018
67

The table below reflects the long-term expected real rate of return by asset class. The rate of return was calculated using the capital market assumptions applied to determine the discount rate and asset allocation. These rates of return are net of administrative expenses.
Asset Class
New Strategic Allocation
Real Return Years 1-10(a)
Real Return Years 11+ (B)
Global Equity
47.0%
4.90%
5.38% Global Fixed Income
19.0%
0.80%
2.27%
Inflation Sensitive
6.0%
0.60%
1.39% Private Equity
12.0%
6.60%
6.63%
Real Estate
11.0%
2.80%
5.21% Infrastructure and Forestland
3.0%
3.90%
5.36%
Liquidity
2.0%
-0.40%
-0.90% Total
100%
(a) An expected inflation of 2.5% used for this period. (b) An expected inflation of 3.0% used for this period.
Subsequent Events In December 2016, CalPERS’ Board of Directors voted to lower the discount rate used its actuarial valuations from 7.5% to 7.0% over three fiscal years, beginning in fiscal year 2018. The change in the discount rate will affect the contribution rates employers beginning in fiscal year 2019, and result in increases to employers’ normal costs and unfunded actuarial liabilities. For the GASB Statement 68 accounting valuations, the discount rate moved to 7.15% starting with the June 30, 2017 measurement date reports and resulted in an increase to employer’s total pension liabilities.
CITY OF ALHAMBRA Notes to Basic Financial Statements
June 30, 2018
68

(c) Changes in the Net Pension Liability
The changes in the Net Pension Liability for each Plan using the measurement date of June 30, 2017, are as follows: Miscellaneous Plan:
Total Pension LiabilityPlan Fiduciary Net
PositionNet Pension
Liability/(Asset)Balance at June 30, 2016 152,925,033$ 116,725,870 36,199,163 Changes in the year:
Service Cost 3,035,159 - 3,035,159 Interest on the total pension liability 11,262,583 - 11,262,583 Difference between actual and expected (3,089,581) - (3,089,581) Change in assumptions 9,509,658 - 9,509,658 Contribution - employer - 3,641,443 (3,641,443) Contribution - employee - 1,193,014 (1,193,014) Net Investment Income - 13,033,190 (13,033,190) Benefit payments (6,688,115) (6,688,115) - Administrative Expense - (172,338) 172,338
Current Year Net Changes 14,029,704 11,007,194 3,022,510 Balance at June 30, 2017 166,954,737$ 127,733,064 39,221,673
Safety Plan:
Total Pension LiabilityPlan Fiduciary Net
PositionNet Pension
Liability/(Asset)Balance at June 30, 2016 244,660,452$ 164,777,175 79,883,277 Changes in the year:
Service Cost 4,482,059 - 4,482,059 Interest on the total pension liability 17,937,667 - 17,937,667 Difference between actual and expected (5,540,772) - (5,540,772) Change in assumptions 15,154,564 - 15,154,564 Contribution - employer - 6,588,203 (6,588,203) Contribution - employee - 1,394,896 (1,394,896) Net Investment Income - 18,294,514 (18,294,514) Benefit payments (11,277,617) (11,277,617) - Administrative Expense - (243,282) 243,282
Current Year Net Changes 20,755,901 14,756,714 5,999,187 Balance at June 30, 2017 265,416,353$ 179,533,889 85,882,464
Increase (Decrease)
Increase (Decrease)
CITY OF ALHAMBRA Notes to Basic Financial Statements
June 30, 2018
69

Sensitivity of the Net Pension Liability to Changes in the Discount Rate – The following presents the net pension liability of the City of Alhambra for each Plan, calculated using the discount rate for each Plan, as well as what the City of Alhambra’s net pension liability would be if it were calculated using a discount rate that is 1-percentage point lower or 1-percentage point higher than the current rate:
Miscellaneous
Safety
1% Decrease
6.15%
6.15% Net Pension Liability
$ 62,331,188
$122,779,119
Current Discount Rate
7.15%
7.15%
Net Pension Liability
$ 39,221,673
$ 85,882,464
1% Increase
8.15%
8.15% Net Pension Liability
$ 20,196,041
$ 52,720,900
Pension Plan Fiduciary Net Position Detailed information about each pension plan’s fiduciary net position is available in the separately issued CalPERS financial reports.
(d) Pension Expenses and Deferred Outflows/Inflows of Resources Related to Pensions Miscellaneous Plan: For the year ended June 30, 2018, the City of Alhambra recognized pension expense of $4,260,083. At June 30, 2018, the City of Alhambra reported deferred outflows of resources and deferred inflows of resources related to pensions from the following sources:
Deferred Outflows of Resources
Deferred Inflows of Resources
Pension contributions subsequent to measurement date $ 4,189,169
$ — Difference between actual and expected experience
—
2,592,099
Changes in assumptions
5,705,795
— Net difference between projected and actual earnings on plan investments 1,650,544
—
Total $ 11,545,508
$ 2,592,099
$4,189,169 reported as deferred outflows of resources related to contributions subsequent to the measurement date will be recognized as a reduction of the net pension liability in the year ending June 30, 2019. Other amounts reported as deferred outflows of resources and deferred inflows of resources related to pensions will be recognized as pension expense as follows:
Year Ended
June 30
Amount 2019
$ 1,797,608
2020
3,223,942 2021
696,750
2022
(954,060)
CITY OF ALHAMBRA Notes to Basic Financial Statements
June 30, 2018
70

Safety Plan: For the year ended June 30, 2018, the City of Alhambra recognized pension expense of $9,009,581. At June 30, 2018, the City of Alhambra reported deferred outflows of resources and deferred inflows of resources related to pensions from the following sources:
Deferred Outflows of Resources
Deferred Inflows of Resources
Pension contributions subsequent to measurement date $ 7,326,640
$ — Difference between actual and expected experience
—
5,102,366
Changes in assumptions
9,928,852
— Net difference between projected and actual earnings on plan investments 2,484,329
—
Total $ 19,739,821
$ 5,102,366
$7,326,640 reported as deferred outflows of resources related to contributions subsequent to the measurement date will be recognized as a reduction of the net pension liability in the year ending June 30, 2019. Other amounts reported as deferred outflows of resources and deferred inflows of resources related to pensions will be recognized as pension expense as follows:
Year Ended
June 30
Amount 2019
$ 1,931,421
2020
5,678,080 2021
1.071,088
2022
(1,329,774) (e) Payable to the Pension Plan At June 30, 2018, the City of Alhambra reported a payable of $448,845 for the outstanding amount of contributions to the pension plan required for the year ended June 30, 2018.
E. Other Pension Benefits
(a) General Information about the Pension Plan:
Plan Description
The City provides post-retirement benefits to retirees provided they have the requisite full-time years of service with the City combined with all previous years of service in other public agencies. The plan is a defined benefit plan established by the City of Alhambra. Retirees will receive the benefit in effect at the time of retirement.
Benefits Provided
Retirees with 20 years of service currently would receive a benefit of up to $400 a month and retirees with 25 years of service currently would receive a benefit of up to $450. No separate financial statements are available for this plan. Government Net Pension is generally liquidated by the Self-Insurance Internal Service Fund.
CITY OF ALHAMBRA Notes to Basic Financial Statements
June 30, 2018
71

Employees Covered At June 30, 2018, the following employees were covered by the benefit terms for the Plan:
Inactive employees currently receiving benefits 96 Active employees 367
Total 463
Contributions Currently, contributions are not required from plan members. The City is currently funding these pension obligations on a pay-as-you-go basis.
(b) Net Pension Liability
The City of Alhambra’s net pension liability for the Plan is measured as the total pension liability. There are no fiduciary plan net assets. The net pension liability of the Plan is measured as of June 30, 2017, using an annual actuarial valuation as of June 30, 2016. Standard update procedures were used to roll forward the total pension liability to the measurement date. A summary of principal assumptions and methods used to determine the net pension liability is shown below. Actuarial Assumptions The total pension liabilities in the June 30, 2016 actuarial valuations were determined using the following actuarial assumptions:
Valuation Date June 30, 2016 Measurement Date June 30, 2017 Actuarial Cost Method Actuarial Assumptions: Discount Rate 3.58% Inflation 2.75% Payroll Growth 3.0% Fixed Dollar Benefit Increase None Investment Rate of Return N/A Mortality (1)
Mortality Improvement (2)
(1) CalPERS 1997-2011 Experience Study. The Experience Study report can be obtained at the
CalPERS website under Forms and Publications. (2) Morality Improvement Scale MP-2016
CITY OF ALHAMBRA Notes to Basic Financial Statements
June 30, 2018
72

Change of Assumptions Changes of assumptions include a decrease in the discount rate from 2.85% to 3.58%. Discount Rate The discount rate used to measure the total pension liability was 3.58% for the Plan and was based on the Bond Buyer 20 Index.
(c) Changes in the Total Pension Liability
The changes in the Total Pension Liability for each Plan using the measurement date of June 30, 2017, are as follows:
Increase (Decrease)Total Pension
LiabilityBalance at June 30, 2017 16,695,000$ Changes in the year:
Service Cost 517,000 Interest on the total pension liability 484,000 Difference between actual and expected - Change in assumptions (1,647,000) Change in benefit terms - Benefit payments (472,000)
Current Year Net Changes (1,118,000) Balance at June 30, 2018 15,577,000$
Sensitivity of the Total Pension Liability to Changes in the Discount Rate – The following presents the total pension liability of the City of Alhambra for the Plan, calculated using the discount rate, as well as what the City’s net pension liability would be if it were calculated using a discount rate that is 1-percentage point lower or 1-percentage point higher than the current rate:
1% Decrease
2.58% Net Pension Liability
$17,901,000
Current Discount Rate
3.58% Net Pension Liability
$ 15,577,000
1% Increase
4.58% Net Pension Liability
$ 13,679,000
CITY OF ALHAMBRA Notes to Basic Financial Statements
June 30, 2018
73
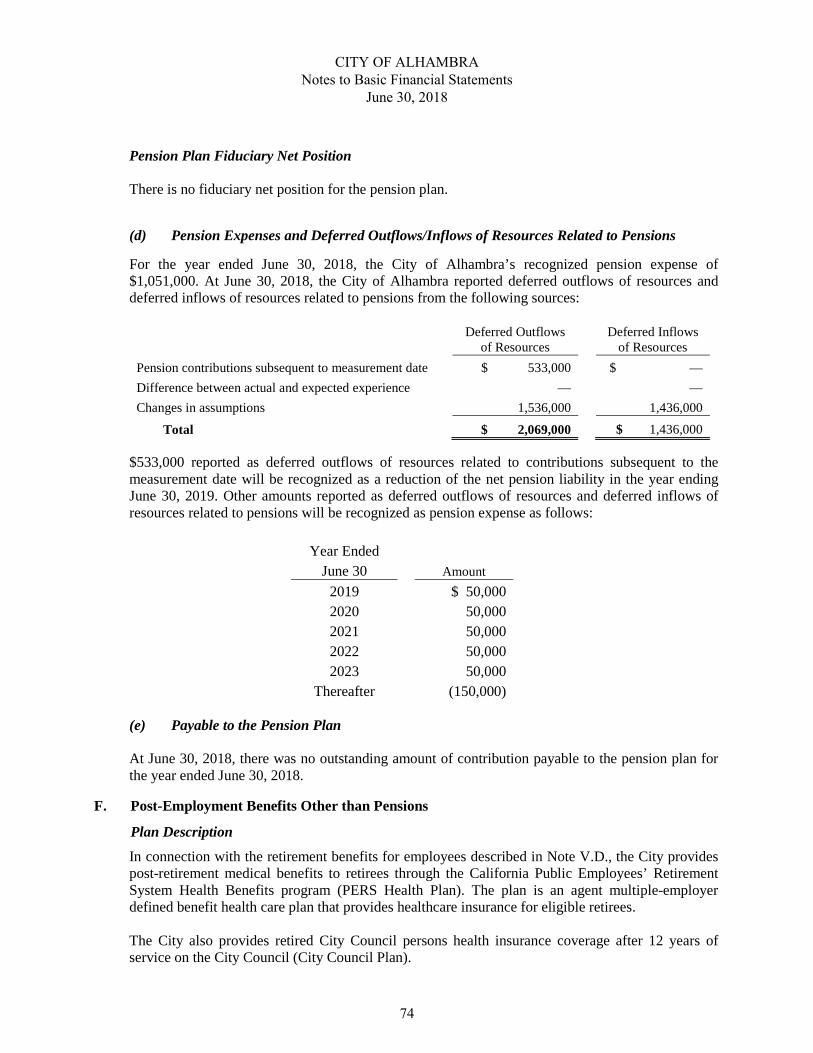
Pension Plan Fiduciary Net Position There is no fiduciary net position for the pension plan. (d) Pension Expenses and Deferred Outflows/Inflows of Resources Related to Pensions For the year ended June 30, 2018, the City of Alhambra’s recognized pension expense of $1,051,000. At June 30, 2018, the City of Alhambra reported deferred outflows of resources and deferred inflows of resources related to pensions from the following sources:
Deferred Outflows of Resources
Deferred Inflows of Resources
Pension contributions subsequent to measurement date $ 533,000
$ — Difference between actual and expected experience
—
—
Changes in assumptions
1,536,000
1,436,000
Total
$ 2,069,000
$ 1,436,000
$533,000 reported as deferred outflows of resources related to contributions subsequent to the measurement date will be recognized as a reduction of the net pension liability in the year ending June 30, 2019. Other amounts reported as deferred outflows of resources and deferred inflows of resources related to pensions will be recognized as pension expense as follows:
Year Ended
June 30
Amount 2019
$ 50,000
2020
50,000 2021
50,000
2022
50,000 2023
50,000
Thereafter
(150,000) (e) Payable to the Pension Plan At June 30, 2018, there was no outstanding amount of contribution payable to the pension plan for the year ended June 30, 2018.
F. Post-Employment Benefits Other than Pensions
Plan Description
In connection with the retirement benefits for employees described in Note V.D., the City provides post-retirement medical benefits to retirees through the California Public Employees’ Retirement System Health Benefits program (PERS Health Plan). The plan is an agent multiple-employer defined benefit health care plan that provides healthcare insurance for eligible retirees. The City also provides retired City Council persons health insurance coverage after 12 years of service on the City Council (City Council Plan).
CITY OF ALHAMBRA Notes to Basic Financial Statements
June 30, 2018
74

Benefits Provided
PERS Health Plan benefits are available to employees who retire with the City at age 50 or older with at least 5 years of service or those who satisfy certain disability requirements. The City contributes $133 toward the cost of medical coverage for the retiree until the retiree reached age 65 and become eligible for Medicare. After reaching age 65 and becoming eligible for Medicare, the retiree must join one of the Medicare Supplement coverage offers under the PERS Health program. The PERS Health Program does not issue a publicly available financial report.
City Council Plan benefits are the same health coverage received by sitting City Council, but shall not be less than substantially the same health care received during the retiree’s tenure. The City directly pays or reimburses the actual cost of health insurance premiums for the retired City Council person.
Employees Covered At June 30, 2018, the following employees were covered by the benefit terms for each Plan:
PERS Health
Plan City Council
Plan Inactive employees or beneficiaries currently receiving benefits 123 4 Active employees 379 5 Inactive employees entitled to but not yet receiving
benefits - 2
Total 502 11
Contributions Currently, contributions are not required from plan members. The City is currently funding these other post-employment benefits obligations on a pay-as-you-go basis. During the fiscal year ended June 30, 2018, the City paid $262,000 in insurance premiums and total implied subsidy was $231,000, resulting in total contributions of $493,000.
(b) Total Other Post-Employment Benefit Liability
The City of Alhambra’s net postemployment benefit liability for the Plans is measured as the total other post-employment benefits liability. There are no fiduciary plan net assets. The total other post-employment benefits liability of the Plan is measured as of June 30, 2017, using an annual actuarial valuation as of June 30, 2016. Standard update procedures were used to roll backward the total other post-employment benefits liability to the previous measurement date. A summary of principal assumptions and methods used to determine the total other post-employment benefits liability is shown below.
CITY OF ALHAMBRA Notes to Basic Financial Statements
June 30, 2018
75

Actuarial Assumptions The total other post-employment benefits liabilities in the June 30, 2016 actuarial valuations were determined using the following actuarial assumptions:
PERS Health Plan City Council Plan Valuation Date June 30, 2016 June 30, 2016 Measurement Date June 30, 2017 June 30, 2017 Actuarial Cost Method Actuarial Assumptions: Discount Rate 3.58% 3.58% Inflation 2.75% 2.75% Payroll Growth 3.0% 3.0% Projected increase 4.25% per year None Medical trend 7.5% for non-medicare and
6.5% for medicare in 2019 decreasing to 4.0% in 2076
7.5% for non-medicare and 6.5% for medicare in 2019 decreasing to 4.0% in 2076
Participation
50% if eligible for PEMHCA minimum only,
70% if eligible for fixed dollar benefit
50% if eligible for PEMHCA minimum only,
70% if eligible for fixed dollar benefit
Investment Rate of Return N/A N/A Mortality (1)
(1)
Mortality Improvement (2)
(2)
(1) CalPERS 1997-2011 Experience Study. The Experience Study report can be obtained at the
CalPERS website under Forms and Publications. (2) Morality Improvement Scale MP-2016 Change of Assumptions Changes of assumptions include an increase in the discount rate from 2.85% to 3.58%. Discount Rate The discount rate used to measure the total pension liability was 3.58% for the Plans and were based on the Bond Buyer 20 Index.
CITY OF ALHAMBRA Notes to Basic Financial Statements
June 30, 2018
76

(c) Changes in the Total Other Post-Employment Benefits Liability
The changes in the Total Other Post-Employment Benefit Liability for each Plan using the measurement date of June 30, 2017, are as follows:
PERS Health Plan City Council PlanIncrease (Decrease) Increase (Decrease)
Total Other Post-Emplyment Liability
Total Other Post-Emplyment
LiabilityBalance at June 30, 2017 23,556,000$ 1,260,000$ Changes in the year:
Service Cost 1,316,000 117,000 Interest 704,000 39,000 Change in assumptions (2,817,000) (138,000) Benefit payments (374,000) (22,000)
Current Year Net Changes (1,171,000) (4,000) Balance at June 30, 2018 22,385,000$ 1,256,000$
Sensitivity of the Total Other Post-Employment Benefits Liability to Changes in the Discount Rate – The following presents the total other post-employment benefits liability of the City of Alhambra for the Plan, calculated using the discount rate, as well as what the City’s total other post-employment benefits liability would be if it were calculated using a discount rate that is 1-percentage point lower or 1-percentage point higher than the current rate:
PERS Health Plan
City Council Plan
1% Decrease
2.58%
2.58% Net Other post-employment benefits Liability
$ 26,377,000
$ 1,449,000
Current Discount Rate
3.58%
3.58% Net Other post-employment benefits Liability
$ 22,385,000
$ 1,256,000
1% Increase
4.58%
4.58% Net Other post-employment benefits Liability
$ 19,233,000
$ 1,099,000
Sensitivity of the Total Other Post-Employment Benefits Liability to Changes in the Healthcare Trend Rate – The following presents the total other post-employment benefits liability of the City of Alhambra for the Plan, calculated using the healthcare trend rate, as well as what the City’s total other post-employment benefits liability would be if it were calculated using a healthcare trend rate that is 1-percentage point lower or 1-percentage point higher than the current rate:
PERS Health Plan
City Council Plan
1% Decrease Net Other post-employment benefits Liability
$ 18,619,000
$ 1,059,000 Current Rate
Net Other post-employment benefits Liability
$ 22,385,000
$ 1,256,000 1% Increase
Net Other post-employment benefits Liability
$ 27,306,000
$ 1,506,000
CITY OF ALHAMBRA Notes to Basic Financial Statements
June 30, 2018
77

Other Post-Employment Benefits Plan Fiduciary Net Position There is no fiduciary net position for the postemployment benefits other than pension plans. (d) Pension Expenses and Deferred Outflows/Inflows of Resources Related to Pensions PERS Health Program: For the year ended June 30, 2018, the City of Alhambra’s recognized postemployment benefits other than pension expense of $1,659,000. At June 30, 2018, the City of Alhambra reported deferred outflows of resources and deferred inflows of resources related to other post-employment benefits from the following sources:
Deferred Outflows of Resources
Deferred Inflows of Resources
Contributions subsequent to measurement date $ 442,000
$ — Changes in assumptions
—
2,456,000
Total
$ 442,000
$ 2,456,000
$442,000 reported as deferred outflows of resources related to contributions subsequent to the measurement date will be recognized as a reduction of the net other post-employment benefits liability in the year ending June 30, 2019. Other amounts reported as deferred outflows of resources and deferred inflows of resources related to other post-employment benefits will be recognized as other post-employment benefits expense as follows:
Year Ended
June 30
Amount 2019
$ (361,000)
2020
(361,000) 2021
(361,000)
2022
(361,000) 2023
(361,000)
Thereafter
(651,000) City Council Plan: For the year ended June 30, 2018, the City of Alhambra’s recognized postemployment benefits other than pension expense of $138,000. At June 30, 2018, the City of Alhambra reported deferred outflows of resources and deferred inflows of resources related to other post-employment benefits from the following sources:
Deferred Outflows of Resources
Deferred Inflows of Resources
Contributions subsequent to measurement date $ 51,000
$ — Changes in assumptions
—
120,000
Total
$ 51,000
$ 120,000
CITY OF ALHAMBRA Notes to Basic Financial Statements
June 30, 2018
78

$51,000 reported as deferred outflows of resources related to contributions subsequent to the measurement date will be recognized as a reduction of the net other post-employment benefits liability in the year ending June 30, 2019. Other amounts reported as deferred outflows of resources and deferred inflows of resources related to other post-employment benefits will be recognized as other post-employment benefits expense as follows:
Year Ended
June 30
Amount 2019
$ (18,000)
2020
(18,000) 2021
(18,000)
2022
(18,000) 2023
(18,000)
Thereafter
(30,000) (e) Payable to the Pension Plan At June 30, 2018, there was no outstanding amount of contribution payable to the postemployment benefits other than pension plans for the year ended June 30, 2018.
G. Defined Contribution Plan
The City provides pension benefits for all of its part-time employees not covered by PERS through the Public Agency Retirement Systems (PARS). This is a defined contribution plan created in accordance with Internal Revenue Code Sections 401(a) and 501 and administered by Phase II Systems. In a defined contribution plan, benefits depend solely on amounts contributed to the plan plus investment earnings. The City Council has the authority to establish and amend the plan provisions.
Employees are eligible to participate from the date of employment. The plan agreement requires that both the employee and the City contribute an amount equal to 3.75% of the employee’s earnings. The City’s contributions for each employee are fully vested. Contribution requirements are established and may be amended by the City Council.
The City’s payroll for employees covered by the plan for the year ended June 30, 2018 was $1,214,941 and the City’s total payroll for the year was $38,672,565. Both the City and the covered employees made the required 3.75% contributions amounting to $45,532 from each source, or $91,064 in total.
H. Deferred Compensation Plans
The City offers its regular full-time employees a deferred compensation plan created in accordance with Internal Revenue Code Section 457(b). The plan permits eligible employees to defer a portion of their salary until future years so as to shelter such funds from federal and state taxation until withdrawal, usually during their retirement years. The deferred compensation is not available to employees until termination, retirement, death, or unforeseeable emergency.
CITY OF ALHAMBRA Notes to Basic Financial Statements
June 30, 2018
79

All amounts of compensation deferred under the plan, all property and rights purchased with those amounts, and all income attributable to those amounts are held in a custodial account for the exclusive benefit of the employee participants and their beneficiaries.
While the City has full power and authority to administer and to adopt rules and regulations for the plan, all investment decisions under the plan are the responsibility of the plan participants. The City has no liability for losses under the plan, but does have the duty of due care that would be required of an ordinary prudent investor. Under certain circumstances, employees may modify their arrangements with the plan to provide for greater or lesser contributions or to terminate their participation. If participants retire under the plan or terminate service with the City, they may be eligible to receive payments under the plan in accordance with provisions thereof. In the event of serious financial emergency, the City may approve, upon request, withdrawals from the plan by the participants, along with their allocated contributions. As of June 30, 2018, deferred compensation assets are $25,700,521 and have been excluded from the City’s financial statements.
I. Joint Venture
The City is a participant with the County of Los Angeles, California State University at Los Angeles, City of Los Angeles, and the City of Monterey Park in a joint venture to operate the Cal State LA Metrolink Station. The Cal State LA Metrolink Station Authority (the Authority), a joint powers authority, was created to operate and maintain a Metrolink station located adjacent to the California State University at Los Angeles. On dissolution of the Authority, the net assets will be distributed based on each entity’s proportion of their respective contributions during the preceding 12 months. As of June 30, 2018, the respective contributions were as follows:
County of Los Angeles 25.0% Cal State University at LA 17.5% City of Alhambra 22.5% City of Los Angeles 22.5% City of Monterey Park 12.5%
Each entity is obligated to contribute annually the above percentages of the Authority’s budget. The
City’s equity interest in the Authority is $19,520 at June 30, 2018. Complete financial statements for the Authority can be obtained from the City of Alhambra, 111 South First Street, Alhambra, California 91801.
J. Subsequent Events
On September 5, 2018, the City issued $8,005,000 of Wastewater Revenue Bonds, Series 2018. The interest rate on the Bonds range from 3.0 – 5.0 percent and the maturity date is June 1, 2040.
Other events occurring after June 30, 2018 have been evaluated for possible adjustments to the financial statements or disclosure as of January 29, 2019, which is the date these financial statements were available to be issued for the acquisition and construction to improve the City’s wastewater system.
CITY OF ALHAMBRA Notes to Basic Financial Statements
June 30, 2018
80

K. Restatement of Net Position
Enterprise Fund net position was restated as follows:
Sewer andWater Storm Drain SanitationFund Fund Fund
Net position as previously reported $ 34,532,842 29,395,010 (956,234)To adjust net other post-employment liability
as result of GASB 75 implementation (1,267,113) (177,113) (232,029)Net position as restated $ 33,265,729 29,217,897 (1,188,263)
Internal Service Fund net position was restated as follows:
EquipmentFund
Net position as previously reported $ 2,970,740To adjust net other post-employment liability
as result of GASB 75 implementation (78,116)Net position as restated $ 2,892,624
Government-wide net position was restated as follows:
Governmental Business-typeActivities Activities
Net position as previously reported $ 45,292,096 64,879,841To adjust net other post-employment liability
as result of GASB 75 implementation (12,026,789) (1,691,097)Net position as restated $ 33,265,307 63,188,744
L. Successor Agency Disclosures
The assets and liabilities of the former Redevelopment Agency were transferred to the Successor Agency to the City of Alhambra Redevelopment Agency on February 1, 2012 as a result of the dissolution of the former Redevelopment Agency. The City is acting in a fiduciary capacity for the assets and liabilities. Disclosure related to the certain assets and long-term liabilities are as follows: 1. Cash and investments
Cash and investments as of June 30, 2018 consist of the following:
Deposits with financial institutions $ 10,403,704Investments held by Bond Trustee 3,603,926
Total cash and investments $ 14,007,630
CITY OF ALHAMBRA Notes to Basic Financial Statements
June 30, 2018
81

a. Deposits
Custodial credit risk-deposits In the case of deposits, this is the risk that in the event a bank failure, the government’s deposits may not be returned to it. The California Government Code requires California banks and savings and loan associations to secure a city’s deposits by pledging government securities as collateral. The fair value of pledged securities must equal at least 110% of a city’s deposits. California law also allows financial institutions to secure city deposits by pledging first trust deed mortgage notes having a value of 150% of a city’s total deposits. At June 30, 2018, the carrying amount and bank balances of the Successor Agency’s restricted and unrestricted deposits (including cash and certificates of deposit) was $10,403,704 and was entirely covered by federal depository insurance or collateralized in accordance with state law.
b. Investments The Successor Agency follows the investment policy of the City. The investment policy as approved by the City Council, authorizes the City to invest in certain types of investments as authorized by the California Government Code.
The table below identifies these investment types and the related maximum percentages by the California Government Code (or the City’s investment policy, where more restrictive). The table also identifies certain provisions of the California Government Code (or the City’s investment policy, where more restrictive) that address interest rate risk, credit risk, and concentration of credit risk. This table does not address investments of debt proceeds held by bond trustee that are governed by the provision of debt agreements of the City, rather than the general provisions of the California Government Code or the City’s investment policy.
Authorized Investment Type
Maximum Maturity
Maximum Percentage Portfolio
Maximum Investment
In One Issuer
U.S. Treasury Securities 5 years None None U.S. Government Agency Securities 5 years 70% 30% Banker’s Acceptances 180 days 40% 5% Commercial paper 270 days 25% 5% Negotiable Certificates of Deposit 5 years 30% 5% Repurchase Agreements 30 days None 5% Medium-Term Notes 5 years 30% 5% Receivable-Backed Securities 5 years 20% 5% Money Market Mutual Funds N/A 20% 10% Local Agency Investment Funds (LAIF) N/A None $65 million
Investments authorized under debt agreements
Investments authorized for funds held by bond trustee include, U.S. Treasury Obligations, U.S. Government Sponsored Enterprise Securities, Certificates of Deposits, Commercial Paper, Local Agency Bonds, Bankers’ Acceptances, Money Market Mutual Funds, Repurchase Agreements, Investment Contracts and any other investments permitted by bond insurer and are legal investments under State laws. There were no limitations on the maximum amount that can be invested in one issuer or maximum percentage allowed, however the maximum maturity of
CITY OF ALHAMBRA Notes to Basic Financial Statements
June 30, 2018
82

an investment is five years, except for the maturity of Banker’s Acceptance and Certificates of Deposits which are limited to 30 days and Investment Contracts which are limited by agreement.
Interest Rate Risk
Interest rate risk is the risk that changes in market interest rates will adversely affect the fair value of an investment. Generally, the longer the maturity of an investment the greater the sensitivity of its fair value to changes in market interest rates. In accordance with its policy, the Successor Agency manages its exposure to declines in fair values by limiting the weighted average maturity of its investment portfolio as a whole to 24 months. Investments held by trustee are not subject to the 24 month maturity limitation. Credit Risk
Credit risk is the risk that an issuer of an investment will not fulfill its obligation to the holder of the investment. The Successor Agency mitigates this risk by restricting investment to those meeting the minimum rating required by (where applicable) the California Government Code, the City’s investment policy, or debt agreement. The table below presents the minimum and the actual rating by Standards and Poor as of year-end for each investment type:
Concentration of Credit Risk
The investment policy of the Agency contains no limitations on the amount that can be invested in any one issuer beyond that stipulated by the California Government Code. There are no investments in any one issuer (other than U.S. Treasury securities, mutual funds, and external investment pools) that represent 5% or more of the total Successor Agency investments.
Custodial Credit Risk – Investments
For an investment, this is the risk that, in the event or the failure of the counterparty, the government will not be able to recover the value of its investments or collateral securities that are in the possession of an outside party. To protect against fraud, embezzlement, or losses caused by collapse of individual securities dealers, all securities owned by the Successor Agency (except for investments held by bond trustee) are held in safekeeping by the Successor Agency’s custodial bank or a third party bank trust department, acting as agent for the Successor Agency under the terms of a custody agreement. Investments of $3,603,926 were purchased and held by the bond trustee.
Investment Type Total
Remaining Maturity 12 months or less
Held by Bond Trustee: Money Market Funds $ 3,603,926 $ 3,603,926
Investment Type Total
Minimum Legal Rating
Rating as of Year End
AAA Held by bond trustee: Money Market Funds $ 3,603,926 A $ 3,603,926
CITY OF ALHAMBRA Notes to Basic Financial Statements
June 30, 2018
83

Fair Value Measurements The Successor Agency’s investment in money market mutual funds are not subject to fair value hierarchy. c. Restricted Cash and Investments
Fiscal agents on behalf of the Successor Agency hold and invest funds in the Successor Agency’s name from long-term debt issuances, including construction, debt service, and reserve fund balances. Fiscal agents are mandated by bond indenture as to the types of investments in which debt proceeds can be invested.
2. Notes Receivables
To enhance the redevelopment process, loans were made for the development of commercial properties. The nature of these notes is such that ultimate collectability may be in question. The terms of most of the notes do not require repayment until certain conditions are met or may be forgiven after a number of years. The timing of these conditions is generally indeterminate (e.g., upon sale of the related property) or not scheduled for 10 to 20 years in the future. Accordingly, the total notes receivable balance at June 30, 2018 is $2,390,000.
3. Capital Assets
The capital assets of the Successor at June 30, 2018 were as follows:
Balances at Balances atJuly 1, 2017 Additions Deletions June 30, 2018
Capital assets, not being depreciated:Land $ 248,791 — — 248,791
Total capital assets, notbeing depreciated 248,791 — — 248,791
Capital assets, being depreciated:Buildings, structures, and
improvements 527,438 — — 527,438 Machinery and equipment 15,000 — — 15,000
Total capital assets, being depreciated 542,438 — — 542,438 Less accumulated depreciation for:
Buildings, structures, andimprovements (329,649) (26,372) (356,021)
Machinery and equipment (15,000) — — (15,000) Total accumulated depreciation (344,649) (26,372) — (371,021) Total capital assets, being
depreciated, net 197,789 (26,372) — 171,417 Total $ 446,580 (26,372) — 420,208
CITY OF ALHAMBRA Notes to Basic Financial Statements
June 30, 2018
84

4. Long-Term Liabilities
The long-term liabilities of the Successor at June 30, 2018 were as follows:
Balances, Balances, Due withinJuly 1, 2017 Additions Retirements June 30, 2018 one year
Tax allocation refunding bonds $ 17,050,000 — 3,080,000 13,970,000 3,230,000 Add bond premium 1,316,193 — (315,887) 1,000,306 —
Total long-term liabilites $ 18,366,193 — 2,764,113 14,970,306 3,230,000
Tax Allocation Bonds
• In December 2013, the Successor Agency issued $25,180,000 tax allocation refunding bonds, which mature in amounts from $2,380,000 to $3,995,000, plus interest at 3.0% to 5.0% through September 1, 2021. Bond proceeds were used to refund the remaining outstanding amounts of $18,505,000 on the $38,070,000 Tax Allocation Refunding Bonds, Series 2003, $10,670,000 on the $15,445,000 Tax Allocation Bonds, Series 2005A, and $4,080,000 on the $7,215,000 Tax Allocation Bonds, Series 2005B. The refunding resulted in an economic gain (difference between present value of the debt service payments on the old and new debt) of $1,744,891 and a reduction in total debt service payments of $2,493,174. As of June 30, 2018 all refunded bonds have been redeemed.
The Bonds are not subject to optional redemption at the option of the Successor Agency or mandatory sinking fund redemption. At June 30, 2018, $13,970,000 was outstanding.
The bonds were issued pursuant to a program developed by the County of Los Angeles to assist successor agencies to refund obligations pursuant to AB 1484 in order to provide debt service savings.
Annual debt service requirements to maturity for the tax allocation bonds are as follows:
Principal Interest Total
Year ending June 30:2019 $ 3,230,000 617,750 3,847,750 2020 3,340,000 451,875 3,791,875 2021 3,405,000 283,250 3,688,250 2022 3,995,000 99,875 4,094,875
13,970,000 1,452,750 15,422,750 Add bond premium 1,000,306 — 1,000,306
Total $ 14,970,306 1,452,750 16,423,056
CITY OF ALHAMBRA Notes to Basic Financial Statements
June 30, 2018
85

Advances
• The City of Alhambra advanced various amounts to the Agency for redevelopment purposes. The activity and description of such advances for the year ended June 30, 2018 are as follows:
Balance at Balance at Due withinJune 30, 2017 Additions Retirements June 30, 2018 One Year
1997 Advance from the City $ 124,398 — (124,398) — — 1992 Advance from the City 301,961 — (301,961) — — Supplemental Revenue Augmentation
Fund Advance 137,304 — (137,304) — — $ 563,663 — (563,663) — —
• 1997 Advance from the City – In March 1997, the Agency entered into a reimbursement agreement with the City’s General Fund for the purchase of land for $291,688. The advance bears interest at 6% and is to be paid over a 20-year period. The Agency sold the land to a developer as part of the Ralph’s Shopping Center. At June 30, 2018, the advance has been fully repaid.
• 1992 Advance from the City – In August 1992, the Agency issued a note to purchase the Police Station from the City for $969,869. A down payment of $500,000 was made with a balance of $469,869 due within 30 days of the City’s vacating the property. The loan bears no interest.
In February 1997, the Agency entered into a reimbursement agreement with the City’s General Fund for the purchase of additional property for $231,335. The reimbursement agreement was added to the August 1992 note and is payable over a 20-year period with interest at 9%. The unpaid portion of this note has been deferred in the City’s Capital Outlay Capital Projects Fund. At June 30, 2018, the advance has been fully repaid.
• Supplemental Revenue Augmentation Fund Advance - In May 2010, the Agency was advanced from the Low- and Moderate Income Housing Fund an amount equal to the amount paid to the Supplemental Educational Revenue Augmentation Fund, $506,194 and $3,656,135, respectively. Also in May 2011, the Agency was advanced from the Low- and Moderate Income Housing Fund an amount equal to the amount paid to the Supplemental Educational Revenue Augmentation Fund, $104,205 and $752,745, respectively. At June 30, 2018, the advance has been fully repaid.
5. Fremont Plaza Retail Project
In May 1996, the City and Agency entered into a Cooperation Agreement with respect to the Fremont Plaza Retail Project (the Project). The City and Successor shared in the net lease revenues from the Project based on their respective pro rata share. The cost of the project was $9,453,946. Under terms of the Agreement, the City contributed the following:
Proceeds of HUD Section 108 note $ 3,000,000 Water Enterprise Fund contribution 900,000 Self-Insurance Internal Service
Fund contribution 900,000 Forgiveness of Agency note 656,295
CITY OF ALHAMBRA Notes to Basic Financial Statements
June 30, 2018
86
The Project was sold on May 5, 2016 for $24,880,000. As indicated above, a contribution was made by the Department of Housing and Urban Development Section 108 note contributed to the Project and as a result $7,067,037 was paid to the Community Development Block Grant Fund for share of net proceeds. Remaining proceeds retained by the Successor Agency at June 30, 2018 in the amount of $6,460,099 will be applied against future allocations from the County of Los Angeles.
6. Contingencies
Low- and Moderate-Income Housing
The Health and Safety Code Section 33334.2 requires a redevelopment agency to use at least 20% of tax increment revenues generated by a redevelopment project area to increase and improve the supply of low- and moderate-income housing in the community. State Assembly Bill 2080, enacted in September 1989, clarifies that for pre-1977 project areas that defer making the housing set-aside due to existing obligations and/or programs, all deferrals beginning with 1985 – 86 shall be considered deficits to the Low- and Moderate-Income Housing Fund, which the agency is required to eliminate in subsequent years in accordance with a plan to be determined by the agency. For fiscal years 1986 through 2008, the City’s unfunded commitment for its low- and moderate-income housing program from the Redevelopment Agency aggregated $7,747,275. This commitment was transferred from the former Redevelopment Agency to the Successor Agency as a result of dissolution of the Redevelopment Agency. During fiscal year 2017-18, a payment of $2,437,879 was made to the City. At June 30, 2018, the remaining unfunded commitment was $3,988,396.
CITY OF ALHAMBRA Notes to Basic Financial Statements
June 30, 2018
87


Supplementary Information

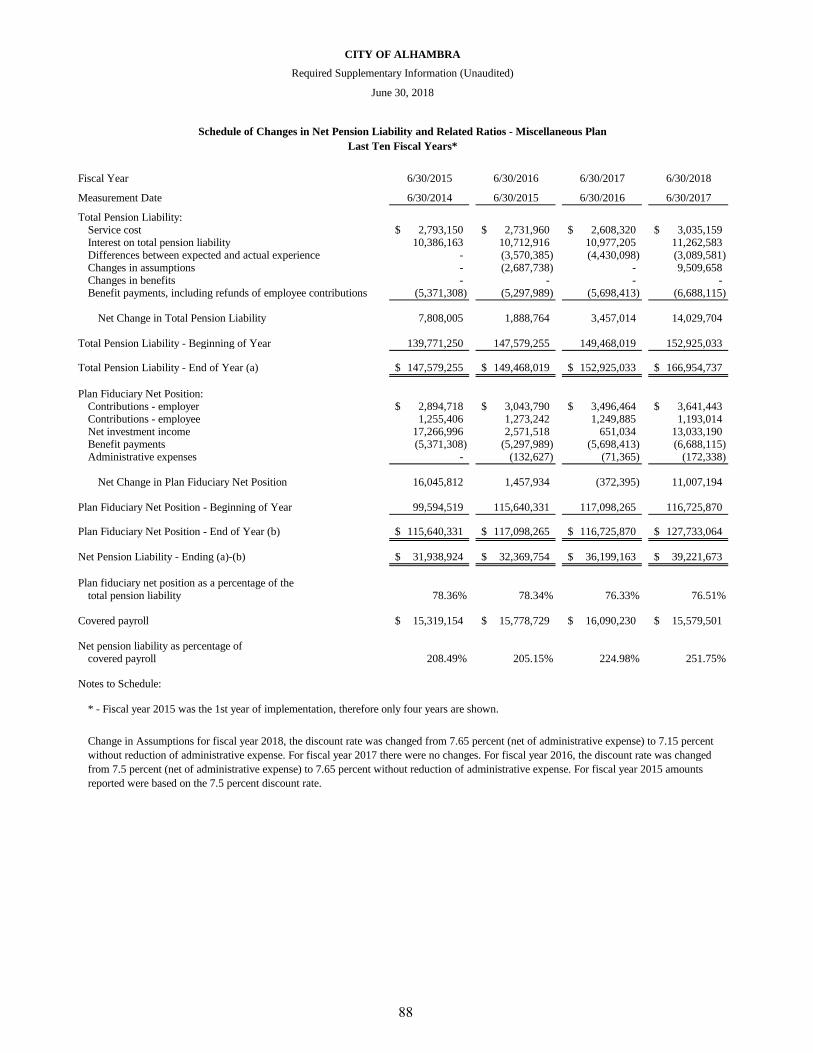
Fiscal Year 6/30/2015 6/30/2016 6/30/2017 6/30/2018
Measurement Date 6/30/2014 6/30/2015 6/30/2016 6/30/2017
Total Pension Liability:Service cost 2,793,150$ 2,731,960$ 2,608,320$ 3,035,159$ Interest on total pension liability 10,386,163 10,712,916 10,977,205 11,262,583 Differences between expected and actual experience - (3,570,385) (4,430,098) (3,089,581) Changes in assumptions - (2,687,738) - 9,509,658 Changes in benefits - - - - Benefit payments, including refunds of employee contributions (5,371,308) (5,297,989) (5,698,413) (6,688,115)
Net Change in Total Pension Liability 7,808,005 1,888,764 3,457,014 14,029,704
Total Pension Liability - Beginning of Year 139,771,250 147,579,255 149,468,019 152,925,033
Total Pension Liability - End of Year (a) 147,579,255$ 149,468,019$ 152,925,033$ 166,954,737$
Plan Fiduciary Net Position:Contributions - employer 2,894,718$ 3,043,790$ 3,496,464$ 3,641,443$ Contributions - employee 1,255,406 1,273,242 1,249,885 1,193,014 Net investment income 17,266,996 2,571,518 651,034 13,033,190 Benefit payments (5,371,308) (5,297,989) (5,698,413) (6,688,115) Administrative expenses - (132,627) (71,365) (172,338)
Net Change in Plan Fiduciary Net Position 16,045,812 1,457,934 (372,395) 11,007,194
Plan Fiduciary Net Position - Beginning of Year 99,594,519 115,640,331 117,098,265 116,725,870
Plan Fiduciary Net Position - End of Year (b) 115,640,331$ 117,098,265$ 116,725,870$ 127,733,064$
Net Pension Liability - Ending (a)-(b) 31,938,924$ 32,369,754$ 36,199,163$ 39,221,673$
Plan fiduciary net position as a percentage of thetotal pension liability 78.36% 78.34% 76.33% 76.51%
Covered payroll 15,319,154$ 15,778,729$ 16,090,230$ 15,579,501$
Net pension liability as percentage of covered payroll 208.49% 205.15% 224.98% 251.75%
Notes to Schedule:
* - Fiscal year 2015 was the 1st year of implementation, therefore only four years are shown.
Change in Assumptions for fiscal year 2018, the discount rate was changed from 7.65 percent (net of administrative expense) to 7.15 percent without reduction of administrative expense. For fiscal year 2017 there were no changes. For fiscal year 2016, the discount rate was changed from 7.5 percent (net of administrative expense) to 7.65 percent without reduction of administrative expense. For fiscal year 2015 amounts reported were based on the 7.5 percent discount rate.
Schedule of Changes in Net Pension Liability and Related Ratios - Miscellaneous PlanLast Ten Fiscal Years*
CITY OF ALHAMBRA
Required Supplementary Information (Unaudited)
June 30, 2018
88

Fiscal Year 6/30/2015 6/30/2016 6/30/2017 6/30/2018
Actuarially determined contribution 2,894,718$ 3,043,790$ 3,496,464$ 4,189,169$
Contributions in relation to the actuarially determined contributions (2,894,718) (3,043,790) (3,496,464) (4,189,169)
Contribution deficiency (excess) -$ -$ -$ -$
Covered payroll 15,778,729$ 16,090,230$ 15,579,501$ 16,204,797$
Contributions as a percentage of covered payroll 18.35% 18.92% 22.44% 25.85%
Notes to Schedule:
Valuation Date 6/30/2012 6/30/2013 6/30/2014 6/30/2015
Fiscal Year 2015Methods and Assumptions Used to Determine Contribution Rates:
Single and agent employers Entry ageAmortization method Level percentage of payroll, closedRemaining amortization period 15 yearsAsset valuation method 15-year smoothed marketInflation 2.75%Salary increases 3%Retirement age
period from 1997 to 2007Mortality
period from 1997 to 2007. Pre-retirement and Post-retirement mortality rates include 5years of projected mortality improvement using the Scale AA published by the Society of Actuaries
Fiscal Years 2016 thru 2018Methods and Assumptions Used to Determine Contribution Rates:
Single and agent employers Entry ageAmortization method Level percentage of payroll, closedAsset valuation method Market valueInflation 2.75%Salary increases 3%Retirement age
period from 1997 to 2007Mortality
period from 1997 to 2007. Pre-retirement and Post-retirement mortality rates include 5years of projected mortality improvement using the Scale AA published by the Society of Actuaries
* - Fiscal year 2015 was the 1st year of implementation, therefore only four years are shown.
Schedule of Contributions - Miscellaneous PlanLast Ten Fiscal Years*
CITY OF ALHAMBRA
Required Supplementary Information (Unaudited)
June 30, 2018
The probabilities of Retirement based on the 2010 CalPERS
The probabilities of mortality are based on the 2010 CalPERS
The probabilities of Retirement based on the 2010 CalPERS
The probabilities of mortality are based on the 2010 CalPERS
89

Fiscal Year 6/30/2015 6/30/2016 6/30/2017 6/30/2018
Measurement Date 6/30/2014 6/30/2015 6/30/2016 6/30/2017
Total Pension Liability:Service cost 4,268,154$ 4,055,533$ 4,222,598$ 4,482,059$ Interest on total pension liability 16,567,344 17,120,226 17,618,919 17,937,667 Differences between expected and actual experience - (3,363,167) - (5,540,772) Changes in assumptions - (4,269,785) (4,148,943) 15,154,564 Changes in benefits - - - - Benefit payments, including refunds of employee contributions (9,982,487) (10,418,211) (10,764,823) (11,277,617)
Net Change in Total Pension Liability 10,853,011 3,124,596 6,927,751 20,755,901
Total Pension Liability - Beginning of Year 223,755,094 234,608,105 237,732,701 244,660,452
Total Pension Liability - End of Year (a) 234,608,105$ 237,732,701$ 244,660,452$ 265,416,353$
Plan Fiduciary Net Position:Contributions - employer 5,194,226$ 5,623,821$ 6,223,922$ 6,588,203$ Contributions - employee 1,357,296 1,364,518 1,467,365 1,394,896 Net investment income 25,131,070 3,645,321 846,905 18,294,514 Benefit payments (9,982,487) (10,418,211) (10,764,823) (11,277,617) Administrative expenses - (188,049) (101,842) (243,282)
Net Change in Plan Fiduciary Net Position 21,700,105 27,400 (2,328,473) 14,756,714
Plan Fiduciary Net Position - Beginning of Year 145,378,143 167,078,248 167,105,648 164,777,175
Plan Fiduciary Net Position - End of Year (b) 167,078,248$ 167,105,648$ 164,777,175$ 179,533,889$
Net Pension Liability - Ending (a)-(b) 67,529,857$ 70,627,053$ 79,883,277$ 85,882,464$
Plan fiduciary net position as a percentage of thetotal pension liability 71.22% 70.29% 67.35% 67.64%
Covered payroll 14,727,367$ 15,169,188$ 14,967,276$ 15,613,233$
Net pension liability as percentage of covered payroll 458.53% 465.60% 533.72% 550.06%
Notes to Schedule:
* - Fiscal year 2015 was the 1st year of implementation, therefore only four years are shown.
Change in Assumptions for fiscal year 2018, the discount rate was changed from 7.65 percent (net of administrative expense) to 7.15 percent without reduction of administrative expense. For fiscal year 2017 there were no changes. For fiscal year 2016, the discount rate was changed from 7.5 percent (net of administrative expense) to 7.65 percent without reduction of administrative expense. For fiscal year 2015 amounts reported were based on the 7.5 percent discount rate.
Schedule of Changes in Net Pension Liability and Related Ratios - Safety PlanLast Ten Fiscal Years*
CITY OF ALHAMBRA
Required Supplementary Information (Unaudited)
June 30, 2018
90

Fiscal Year 6/30/2015 6/30/2016 6/30/2017 6/30/2018
Actuarially determined contribution 5,194,226$ 5,623,821$ 6,223,922$ 7,326,640$
Contributions in relation to the actuarially determined contributions (5,194,226) (5,623,821) (6,223,922) (7,326,640)
Contribution deficiency (excess) -$ -$ -$ -$
Covered payroll 15,169,188$ 14,967,276$ 15,613,233$ 14,960,642$
Contributions as a percentage of covered payroll 34.24% 37.57% 39.86% 48.97%
Notes to Schedule:
Valuation Date 6/30/2012 6/30/2013 6/30/2014 6/30/2015
Fiscal Year 2015Methods and Assumptions Used to Determine Contribution Rates:
Single and agent employers Entry ageAmortization method Level percentage of payroll, closedRemaining amortization period 15 yearsAsset valuation method 15-year smoothed marketInflation 2.75%Salary increases 3%Retirement age
period from 1997 to 2007Mortality
period from 1997 to 2007. Pre-retirement and Post-retirement mortality rates include 5years of projected mortality improvement using the Scale AA published by the Society of Actuaries
Fiscal Years 2016 thru 2018Methods and Assumptions Used to Determine Contribution Rates:
Single and agent employers Entry ageAmortization method Level percentage of payroll, closedAsset valuation method Market valueInflation 2.75%Salary increases 3%Retirement age
period from 1997 to 2007Mortality
period from 1997 to 2007. Pre-retirement and Post-retirement mortality rates include 5years of projected mortality improvement using the Scale AA published by the Society of Actuaries
* - Fiscal year 2015 was the 1st year of implementation, therefore only four years are shown.
Last Ten Fiscal Years*
CITY OF ALHAMBRA
Required Supplementary Information (Unaudited)
June 30, 2018
The probabilities of mortality are based on the 2010 CalPERS
The probabilities of mortality are based on the 2010 CalPERS
The probabilities of Retirement based on the 2010 CalPERS Experience
The probabilities of Retirement based on the 2010 CalPERS Experience
Schedule of Contributions - Safety Plan
91

Fiscal Year 6/30/2017 6/30/2018
Measurement Date 6/30/2016 6/30/2017
Total Pension Liability:Service cost 387,000$ 517,000$ Interest on total pension liability 544,000 484,000 Differences between expected and actual experience - - Changes in assumptions 2,059,000 (1,647,000) Changes in benefits - - Benefit payments (415,000) (472,000)
Net Change in Total Pension Liability 2,575,000 (1,118,000)
Total Pension Liability - Beginning of Year 14,120,000 16,695,000
Total Pension Liability - End of Year 16,695,000$ 15,577,000$
Covered payroll 28,275,000$ 33,034,000$
Net pension liability as percentage of covered payroll 59.05% 47.15%
Notes to Schedule:
* - Fiscal year 2017 was the 1st year of implementation, therefore only two years are shown.
No assets are accumulated in a trust that meets the criteria of paragraph 4 of Statement No. 73 of the Government Accounting Statndards Board.
Changes in assumptions: Fiscal year 2018 included an increase in the discount rate from 2.85% to 3.58%. Fiscal year 2017 included a decrease in the discount rate from 4% to 2.85%, decrease in inflationfrom 3% to 2.75%, decrease in payroll growth from 3.25% to 3%, and a decrease in benefit increases from 3% to no increase.
CITY OF ALHAMBRA
Required Supplementary Information (Unaudited)
June 30, 2018
Schedule of Changes in Total Pension Liability and Related Ratios - Other Pension PlanLast Ten Fiscal Years*
92
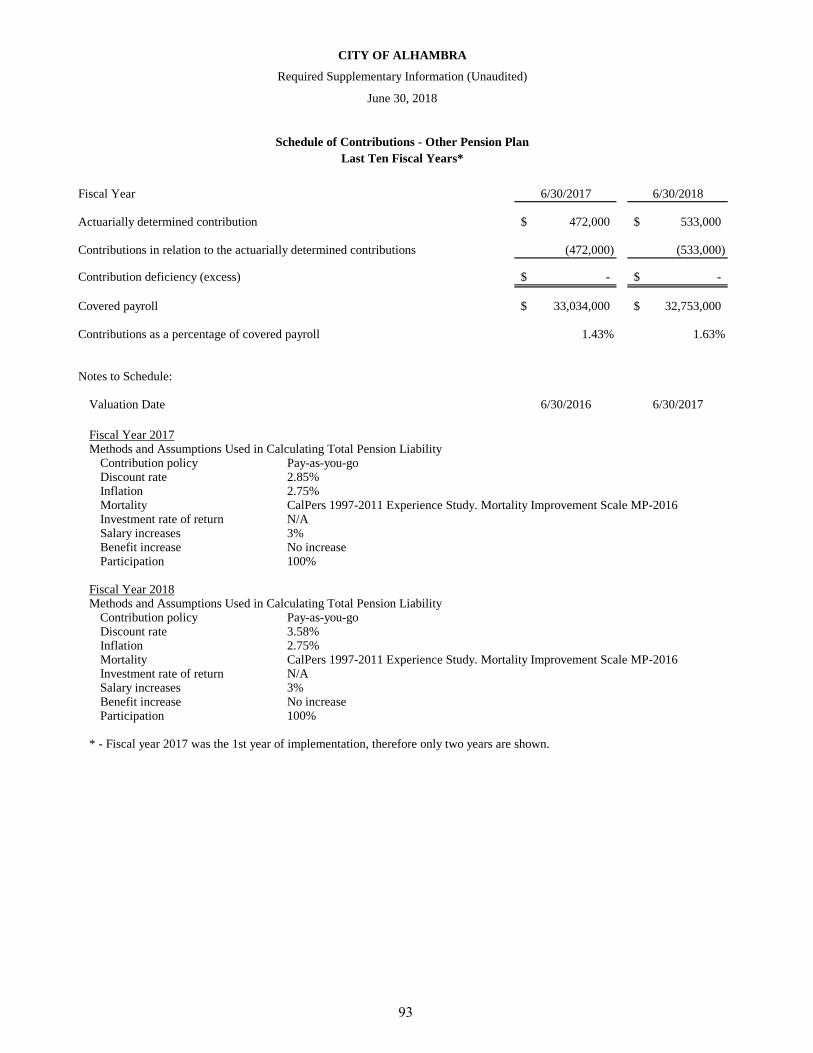
Fiscal Year 6/30/2017 6/30/2018
Actuarially determined contribution 472,000$ 533,000$
Contributions in relation to the actuarially determined contributions (472,000) (533,000)
Contribution deficiency (excess) -$ -$
Covered payroll 33,034,000$ 32,753,000$
Contributions as a percentage of covered payroll 1.43% 1.63%
Notes to Schedule:
Valuation Date 6/30/2016 6/30/2017
Fiscal Year 2017Methods and Assumptions Used in Calculating Total Pension Liability
Contribution policy Pay-as-you-goDiscount rate 2.85%Inflation 2.75%MortalityInvestment rate of return N/ASalary increases 3%Benefit increase No increaseParticipation 100%
Fiscal Year 2018Methods and Assumptions Used in Calculating Total Pension Liability
Contribution policy Pay-as-you-goDiscount rate 3.58%Inflation 2.75%MortalityInvestment rate of return N/ASalary increases 3%Benefit increase No increaseParticipation 100%
CITY OF ALHAMBRA
Required Supplementary Information (Unaudited)
June 30, 2018
Schedule of Contributions - Other Pension PlanLast Ten Fiscal Years*
CalPers 1997-2011 Experience Study. Mortality Improvement Scale MP-2016
* - Fiscal year 2017 was the 1st year of implementation, therefore only two years are shown.
CalPers 1997-2011 Experience Study. Mortality Improvement Scale MP-2016
93

Fiscal Year 6/30/2018
Measurement Date 6/30/2017
Total Other Post Employment Benefit Liability:Service cost 1,316,000$ Interest on total Other Post Employment Benefit liability 704,000 Differences between expected and actual experience - Changes in assumptions (2,817,000) Changes in benefits - Benefit payments (374,000)
Net Change in Total Other Post Employment Benefit Liability (1,171,000)
Total Other Post Employment Benefit Liability - Beginning of Year 23,556,000
Total Other Post Employment Benefit Liability - End of Year 22,385,000$
Covered employee payroll 31,193,000$
Total Other Post Employment Benefit liability as percentage of covered employee payroll 71.76%
Notes to Schedule:
* - Fiscal year 2018 is the 1st year of implementation, therefore only one year is shown.
Changes in assumptions include a decrease in the discount rate from 2.85% to 3.58%.
Schedule of Changes in Total Other Post Employment Benefits Liability and Related Ratios - PERS Health Plan
CITY OF ALHAMBRA
Required Supplementary Information (Unaudited)
June 30, 2018
Last Ten Fiscal Years*
94
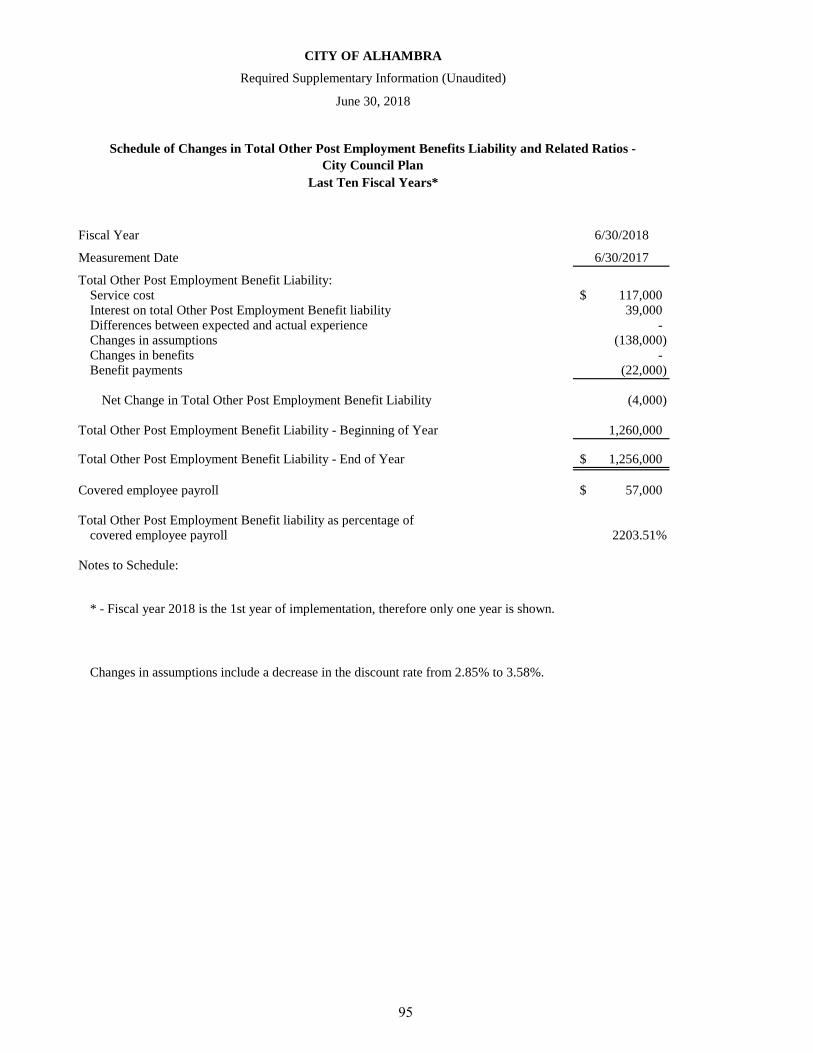
Fiscal Year 6/30/2018
Measurement Date 6/30/2017
Total Other Post Employment Benefit Liability:Service cost 117,000$ Interest on total Other Post Employment Benefit liability 39,000 Differences between expected and actual experience - Changes in assumptions (138,000) Changes in benefits - Benefit payments (22,000)
Net Change in Total Other Post Employment Benefit Liability (4,000)
Total Other Post Employment Benefit Liability - Beginning of Year 1,260,000
Total Other Post Employment Benefit Liability - End of Year 1,256,000$
Covered employee payroll 57,000$
Total Other Post Employment Benefit liability as percentage of covered employee payroll 2203.51%
Notes to Schedule:
* - Fiscal year 2018 is the 1st year of implementation, therefore only one year is shown.
CITY OF ALHAMBRA
Required Supplementary Information (Unaudited)
June 30, 2018
Last Ten Fiscal Years*
Schedule of Changes in Total Other Post Employment Benefits Liability and Related Ratios - City Council Plan
Changes in assumptions include a decrease in the discount rate from 2.85% to 3.58%.
95
CITY OF ALHAMBRA
Combining and Individual Fund Statements and Schedules
Year ended June 30, 2018

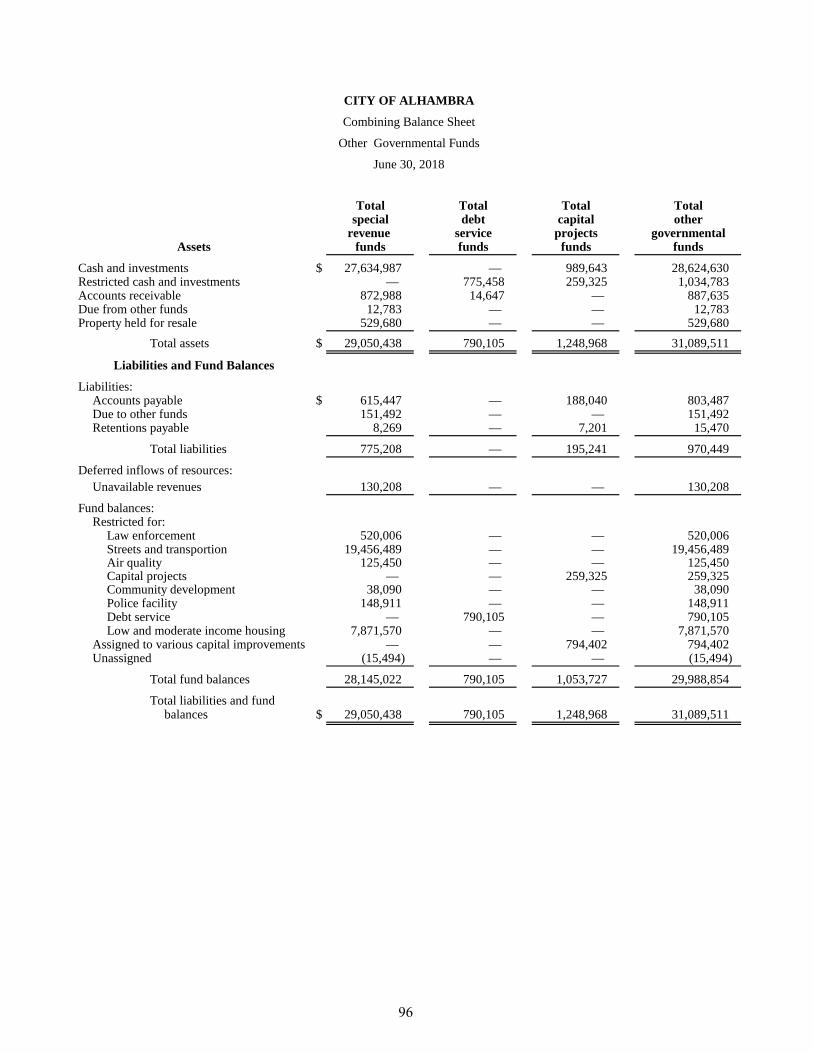
CITY OF ALHAMBRA
Combining Balance Sheet
Other Governmental Funds
June 30, 2018
Total Total Total Totalspecial debt capital other
revenue service projects governmentalAssets funds funds funds funds
Cash and investments $ 27,634,987 — 989,643 28,624,630 Restricted cash and investments — 775,458 259,325 1,034,783 Accounts receivable 872,988 14,647 — 887,635 Due from other funds 12,783 — — 12,783 Property held for resale 529,680 — — 529,680
Total assets $ 29,050,438 790,105 1,248,968 31,089,511
Liabilities and Fund Balances
Liabilities:Accounts payable $ 615,447 — 188,040 803,487 Due to other funds 151,492 — — 151,492 Retentions payable 8,269 — 7,201 15,470
Total liabilities 775,208 — 195,241 970,449
Deferred inflows of resources:Unavailable revenues 130,208 — — 130,208
Fund balances:Restricted for:
Law enforcement 520,006 — — 520,006 Streets and transportion 19,456,489 — — 19,456,489 Air quality 125,450 — — 125,450 Capital projects — — 259,325 259,325 Community development 38,090 — — 38,090 Police facility 148,911 — — 148,911 Debt service — 790,105 — 790,105 Low and moderate income housing 7,871,570 — — 7,871,570
Assigned to various capital improvements — — 794,402 794,402 Unassigned (15,494) — — (15,494)
Total fund balances 28,145,022 790,105 1,053,727 29,988,854
Total liabilities and fundbalances $ 29,050,438 790,105 1,248,968 31,089,511
96
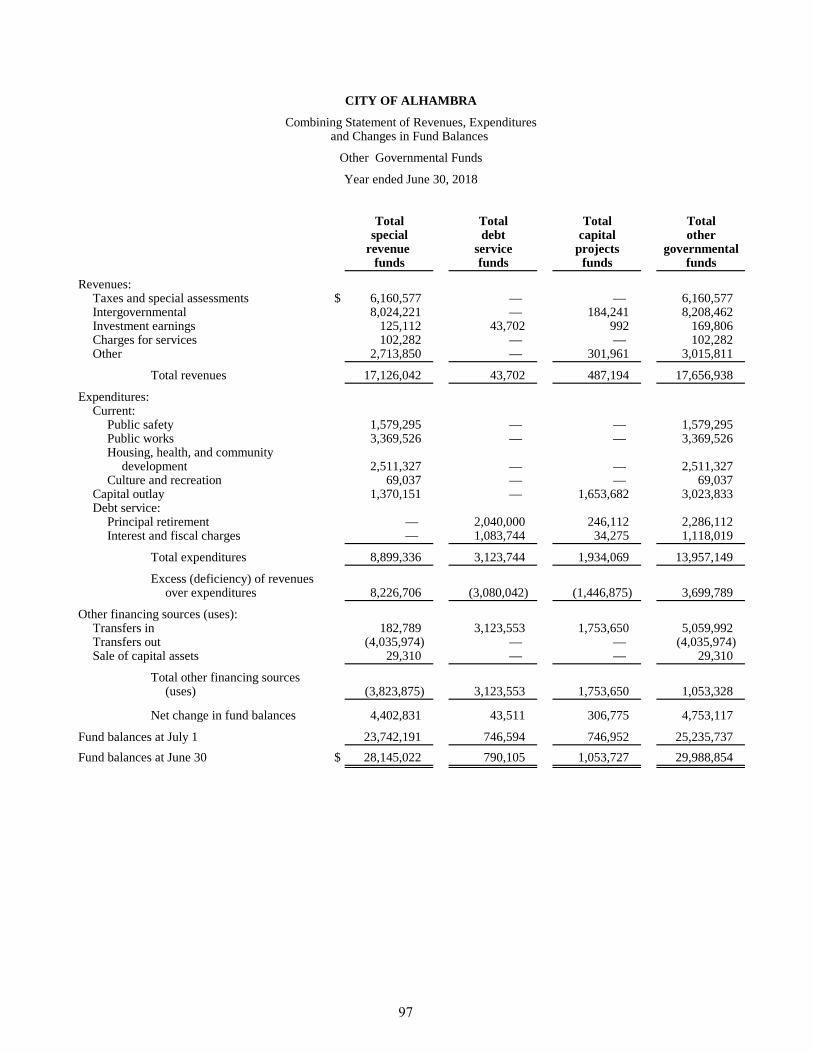
CITY OF ALHAMBRA
Combining Statement of Revenues, Expendituresand Changes in Fund Balances
Other Governmental Funds
Year ended June 30, 2018
Total Total Total Totalspecial debt capital other
revenue service projects governmentalfunds funds funds funds
Revenues:Taxes and special assessments $ 6,160,577 — — 6,160,577 Intergovernmental 8,024,221 — 184,241 8,208,462 Investment earnings 125,112 43,702 992 169,806 Charges for services 102,282 — — 102,282 Other 2,713,850 — 301,961 3,015,811
Total revenues 17,126,042 43,702 487,194 17,656,938
Expenditures:Current:
Public safety 1,579,295 — — 1,579,295 Public works 3,369,526 — — 3,369,526 Housing, health, and community
development 2,511,327 — — 2,511,327 Culture and recreation 69,037 — — 69,037
Capital outlay 1,370,151 — 1,653,682 3,023,833 Debt service:
Principal retirement — 2,040,000 246,112 2,286,112 Interest and fiscal charges — 1,083,744 34,275 1,118,019
Total expenditures 8,899,336 3,123,744 1,934,069 13,957,149
Excess (deficiency) of revenuesover expenditures 8,226,706 (3,080,042) (1,446,875) 3,699,789
Other financing sources (uses):Transfers in 182,789 3,123,553 1,753,650 5,059,992 Transfers out (4,035,974) — — (4,035,974) Sale of capital assets 29,310 — — 29,310
Total other financing sources(uses) (3,823,875) 3,123,553 1,753,650 1,053,328
Net change in fund balances 4,402,831 43,511 306,775 4,753,117
Fund balances at July 1 23,742,191 746,594 746,952 25,235,737 Fund balances at June 30 $ 28,145,022 790,105 1,053,727 29,988,854
97

OTHER SPECIAL REVENUE FUNDS
Special Revenue Funds are used to account for the proceeds of specific revenue sources (other than Capital Projects Funds and Expendable Trust Funds) that are legally restricted to expenditures for specified purposes. Funds included are:
Law Enforcement Fund – To account for funds provided by the United States Department of Justice and State of California for local law enforcement programs.
TDA Bikeway Fund – To account for revenues received from the State under the Transportation Development Act. Their use is restricted to the construction of bicycle and pedestrian facilities.
State Gas Tax Fund – To account for all state gas tax-related revenues and expenditures, including street repair, reconstruction, and maintenance. State law requires these gasoline taxes to be used to maintain the City’s street and highway system.
Proposition A Transportation Fund – To account for all revenues and expenditures associated with the 1/2% sales tax approved by Proposition A in 1980. All revenues of this fund must be expended for transportation-related items as established by the Los Angeles County Transportation Commission.
Proposition C Transportation Fund – To account for all revenues and expenditures associated with the 1/2% sales tax approved by Proposition C in 1990. All revenues of this fund must be expended for transportation-related items as established by the Los Angeles County Transportation Commission.
Measure R Transportation Fund – To account for all revenues and expenditures associated with the 1/2% sales tax approved by Measure R in 2008. All revenues of this fund must be expended for traffic relief and transportation upgrades as established by Metro.
Measure M Transportation Fund – To account for all revenues and expenditures associated with the 1/2% sales tax approved by Measure M in 2016. All revenues of this fund must be expended for transportation projects and programs as established by Metro.
Road Maintenance and Rehabilitation Fund – To account for all revenues and expenditures associated with the funding approved by State Senate Bill 1 in 2017. All revenues of this fund must be expended for eligible transportation purposes.
Air Quality Fund – To account for all revenues and expenditures associated with AB2766. All revenues and expenditures of this fund must be expended for air quality improvement projects as established by the South Coast Air Quality Management District.
Lighting and Landscape Maintenance Fund – To account for the costs associated with the City’s street lighting and landscape maintenance programs. These costs are deemed to benefit all property owners who are assessed their proportionate share of the costs. These assessments are placed on the property tax bill and collected and remitted by the County of Los Angeles.
Police Facility Assessment Fund – To account for the costs associated with the Citywide assessment district which was formed to pay debt service and other related costs of the police facility.

OTHER SPECIAL REVENUE FUNDS (CONTINUED)
Asset Forfeiture Federal/State Funds – To account for City’s share of asset forfeiture monies received from state and federal sources.
Disability Access Compliance Fund – To account for all revenues and expenditures received from a surcharge imposed on business licenses in accordance with SB1186.
Home and Rental Rehabilitation Grants Fund – To account for the receipt and expenditure of revenues from U.S. Department of Housing and Urban Development for the HOME program.
Housing Asset Fund – To account for the receipt and expenditure of the revenues received from housing assets of the former Alhambra Redevelopment Agency.
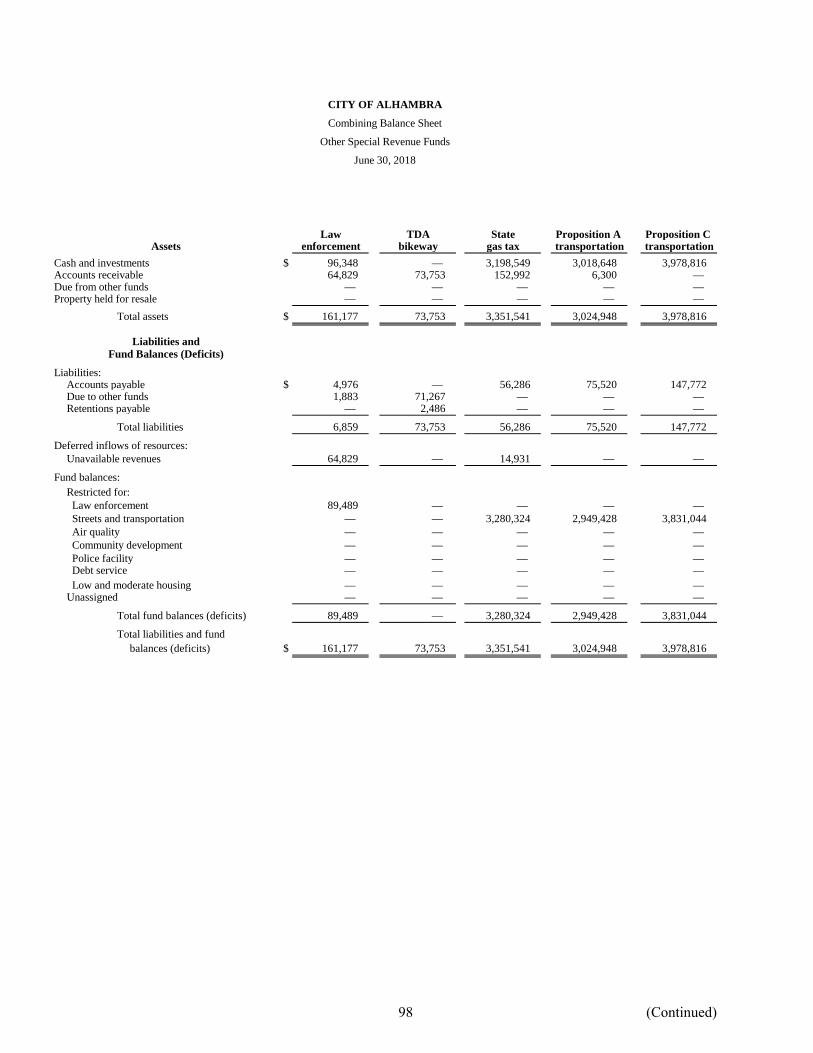
CITY OF ALHAMBRA
Combining Balance Sheet
Other Special Revenue Funds
June 30, 2018
Law TDA State Proposition A Proposition C Assets enforcement bikeway gas tax transportation transportation
Cash and investments $ 96,348 — 3,198,549 3,018,648 3,978,816 Accounts receivable 64,829 73,753 152,992 6,300 — Due from other funds — — — — — Property held for resale — — — — —
Total assets $ 161,177 73,753 3,351,541 3,024,948 3,978,816
Liabilities and Fund Balances (Deficits)
Liabilities:Accounts payable $ 4,976 — 56,286 75,520 147,772 Due to other funds 1,883 71,267 — — — Retentions payable — 2,486 — — —
Total liabilities 6,859 73,753 56,286 75,520 147,772
Deferred inflows of resources:Unavailable revenues 64,829 — 14,931 — —
Fund balances:Restricted for: Law enforcement 89,489 — — — — Streets and transportation — — 3,280,324 2,949,428 3,831,044 Air quality — — — — — Community development — — — — — Police facility — — — — — Debt service — — — — — Low and moderate housing — — — — — Unassigned — — — — —
Total fund balances (deficits) 89,489 — 3,280,324 2,949,428 3,831,044
Total liabilities and fund balances (deficits) $ 161,177 73,753 3,351,541 3,024,948 3,978,816
98
(Continued)

Road Maintenance Lighting andMeasure R Measure M & Rehabilitation landscape
Assets Transporation Transporation Transportation Air quality maintenanceCash and investments $ 2,459,811 912,266 325,284 97,361 5,605,649 Accounts receivable — — 184,230 28,617 186,144 Due from other funds — — — — — Property held for resale — — — — —
Total assets 2,459,811 912,266 509,514 125,978 5,791,793
Liabilities andFund Balances (Deficits)
Liabilities:Accounts payable 26,076 — — 528 210,439 Due to other funds — — — — — Retentions payable 824 — — — —
Total liabilities 26,900 — — 528 210,439
Deferred inflows of resources:Unavailable revenues — — — — 40,352
Fund balances:Restricted for: Law enforcement — — — — — Streets and transportation 2,432,911 912,266 509,514 — 5,541,002 Air quality — — — 125,450 — Community development — — — — — Police facility — — — — — Debt service — — — — — Low and moderate housing — — — — — Unassigned — — — — —
Total fund balances (deficits) 2,432,911 912,266 509,514 125,450 5,541,002
Total liabilities and fund balances (deficits) $ 2,459,811 912,266 509,514 125,978 5,791,793
CITY OF ALHAMBRA
Combining Balance Sheet
Other Special Revenue Funds
June 30, 2018
(Continued)
99
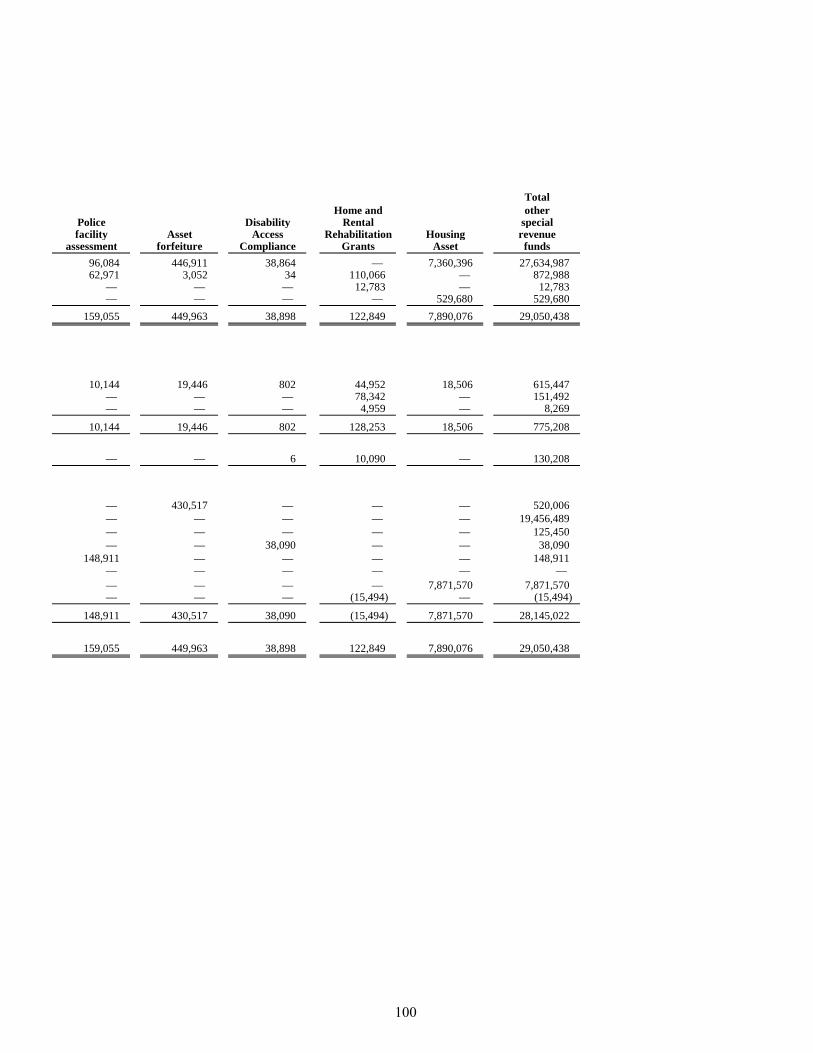
TotalHome and other
Police Disability Rental specialfacility Asset Access Rehabilitation Housing revenue
assessment forfeiture Compliance Grants Asset funds96,084 446,911 38,864 — 7,360,396 27,634,987 62,971 3,052 34 110,066 — 872,988
— — — 12,783 — 12,783 — — — — 529,680 529,680
159,055 449,963 38,898 122,849 7,890,076 29,050,438
10,144 19,446 802 44,952 18,506 615,447 — — — 78,342 — 151,492 — — — 4,959 — 8,269
10,144 19,446 802 128,253 18,506 775,208
— — 6 10,090 — 130,208
— 430,517 — — — 520,006 — — — — — 19,456,489 — — — — — 125,450 — — 38,090 — — 38,090
148,911 — — — — 148,911 — — — — — — — — — — 7,871,570 7,871,570 — — — (15,494) — (15,494)
148,911 430,517 38,090 (15,494) 7,871,570 28,145,022
159,055 449,963 38,898 122,849 7,890,076 29,050,438
100

THIS PAGE INTENTIONALLY LEFT BLANK

Law TDA State Proposition A Proposition Cenforcement bikeway gas tax transportation transportation
Revenues:Taxes and special assessments $ — — — — — Intergovernmental 185,671 73,753 1,806,425 1,618,768 1,337,943 Investment earnings 450 — 23,688 15,111 30,390 Charges for services — — — 87,509 — Other — — 9,390 161,528 —
Total revenues 186,121 73,753 1,839,503 1,882,916 1,368,333
Expenditures:Current:
Public safety 160,185 — 1,120,331 — — Public works — — 826,574 72,457 159,772 Housing, health, and community
development — — — 676,224 1,353,420 Culture and recreation — — — 69,037 —
Capital outlay 2,229 73,753 122,312 — 92,915
Total expenditures 162,414 73,753 2,069,217 817,718 1,606,107
Excess (deficiency) of revenuesover expenditures 23,707 — (229,714) 1,065,198 (237,774)
Other financing sources (uses):Transfers in — — 169,269 — — Transfers out — — — — (314,456) Sale of capital assets — — 120 — —
Total other financing sources (uses) — — 169,389 — (314,456) Net change in fund balances 23,707 — (60,325) 1,065,198 (552,230)
Fund balances at July 1 65,782 — 3,340,649 1,884,230 4,383,274 Fund balances (deficits) at June 30 $ 89,489 — 3,280,324 2,949,428 3,831,044
CITY OF ALHAMBRA
Combining Statement of Revenues, Expenditures,and Changes in Fund Balances (Deficits)
Other Special Revenue FundsYear ended June 30, 2018
101
(Continued)

Road Maintenance Lighting andMeasure R Measure M & Rehabilitation landscape
Transportation Transportation Transportation Air quality maintenance
Revenues:Taxes and special assessments $ — — — — 3,892,871 Intergovernmental 1,005,687 911,382 509,324 108,895 — Investment earnings 19,185 884 190 1,969 — Charges for services — — — — — Other 82,580 — — — 22,473
Total revenues 1,107,452 912,266 509,514 110,864 3,915,344
Expenditures:Current:
Public safety — — — — — Public works — — — — 2,310,723 Housing, health, and community
development — — — 91 — Culture and recreation — — — — —
Capital outlay 202,754 — — 314,078 333,578
Total expenditures 202,754 — — 314,169 2,644,301
Excess (deficiency) of revenuesover expenditures 904,698 912,266 509,514 (203,305) 1,271,043
Other financing sources (uses):Transfers in — — — 737 — Transfers out (877,828) — — — (668,987) Sale of capital assets — — — 29,190 —
Total other financing sources (uses) (877,828) — — 29,927 (668,987) Net change in fund balances 26,870 912,266 509,514 (173,378) 602,056
Fund balances at July 1 2,406,041 — — 298,828 4,938,946 Fund balances (deficits) at June 30 $ 2,432,911 912,266 509,514 125,450 5,541,002
(Continued)
CITY OF ALHAMBRA
Combining Statement of Revenues, Expenditures,and Changes in Fund Balances (Deficits)
Other Special Revenue FundsYear ended June 30, 2018
102

TotalHome and other
Police Disability Rental specialfacility Asset Access Rehabilitation Housing revenue
assessment forfeiture Compliance Grants Asset funds
2,267,706 — — — — 6,160,577 — 47,452 — 418,921 — 8,024,221
103 6,463 168 — 26,511 125,112 — — 14,773 — — 102,282 — — — — 2,437,879 2,713,850
2,267,809 53,915 14,941 418,921 2,464,390 17,126,042
4,854 293,925 — — — 1,579,295 — — — — — 3,369,526
— — — 461,183 20,409 2,511,327 — — — — — 69,037
24,517 204,015 — — — 1,370,151
29,371 497,940 — 461,183 20,409 8,899,336
2,238,438 (444,025) 14,941 (42,262) 2,443,981 8,226,706
— — — 12,783 — 182,789 (2,174,703) — — — — (4,035,974)
— — — — — 29,310
(2,174,703) — — 12,783 — (3,823,875) 63,735 (444,025) 14,941 (29,479) 2,443,981 4,402,831
85,176 874,542 23,149 13,985 5,427,589 23,742,191 148,911 430,517 38,090 (15,494) 7,871,570 28,145,022
103
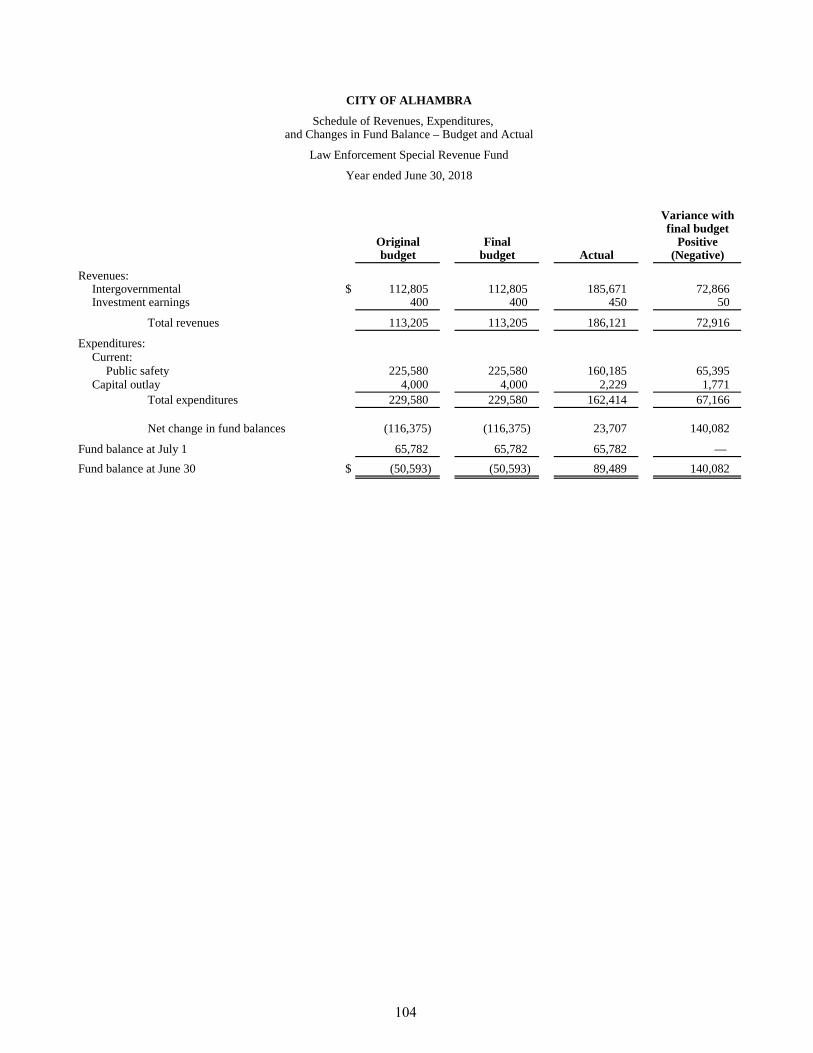
CITY OF ALHAMBRA
and Changes in Fund Balance – Budget and Actual
Law Enforcement Special Revenue Fund
Year ended June 30, 2018
Variance withfinal budget
Original Final Positivebudget budget Actual (Negative)
Revenues:Intergovernmental $ 112,805 112,805 185,671 72,866 Investment earnings 400 400 450 50
Total revenues 113,205 113,205 186,121 72,916
Expenditures:Current:
Public safety 225,580 225,580 160,185 65,395 Capital outlay 4,000 4,000 2,229 1,771
Total expenditures 229,580 229,580 162,414 67,166
Net change in fund balances (116,375) (116,375) 23,707 140,082
Fund balance at July 1 65,782 65,782 65,782 — Fund balance at June 30 $ (50,593) (50,593) 89,489 140,082
Schedule of Revenues, Expenditures,
104
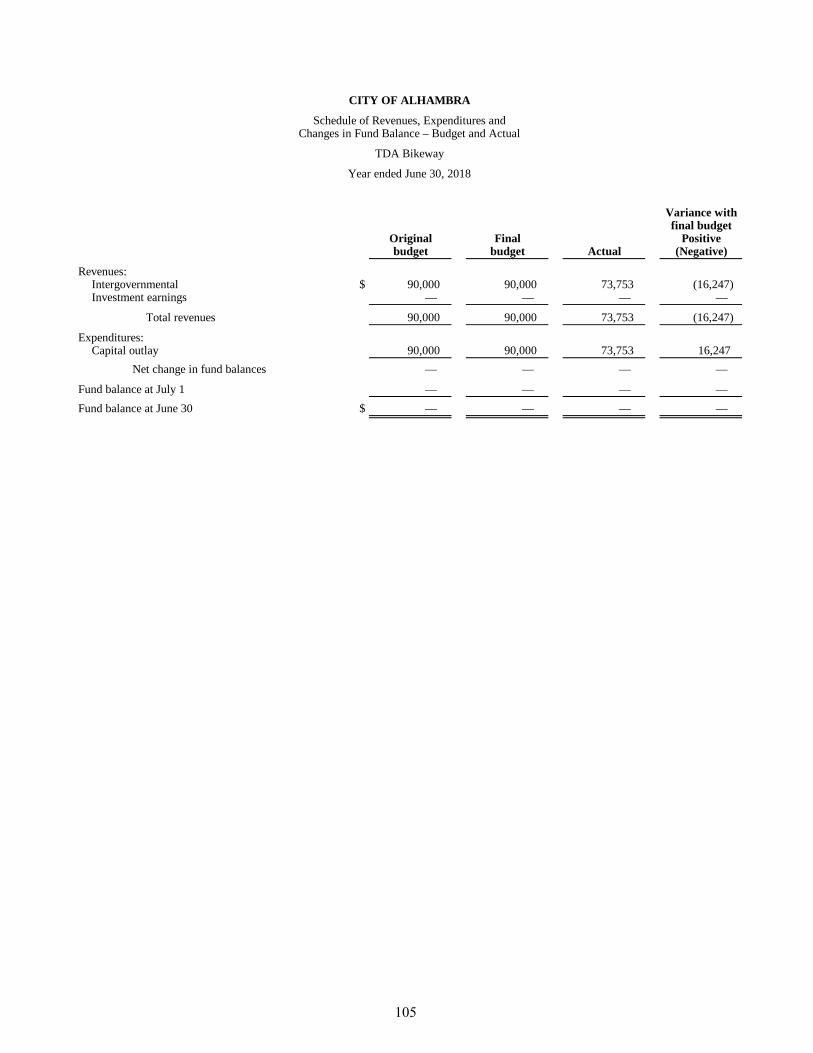
CITY OF ALHAMBRA
Changes in Fund Balance – Budget and Actual
TDA Bikeway
Year ended June 30, 2018
Variance withfinal budget
Original Final Positivebudget budget Actual (Negative)
Revenues:Intergovernmental $ 90,000 90,000 73,753 (16,247) Investment earnings — — — —
Total revenues 90,000 90,000 73,753 (16,247)
Expenditures:Capital outlay 90,000 90,000 73,753 16,247
Net change in fund balances — — — —
Fund balance at July 1 — — — — Fund balance at June 30 $ — — — —
Schedule of Revenues, Expenditures and
105

CITY OF ALHAMBRA
and Changes in Fund Balance – Budget and Actual
State Gas Tax Special Revenue Fund
Year ended June 30, 2018
Variance withfinal budget
Original Final Positivebudget budget Actual (Negative)
Revenues:Intergovernmental $ 1,820,406 1,820,406 1,806,425 (13,981) Investment earnings 22,200 22,200 23,688 1,488 Other — — 9,390 9,390
Total revenues 1,842,606 1,842,606 1,839,503 (3,103)
Expenditures:Current:
Public safety 1,234,684 1,234,684 1,120,331 114,353 Public works 1,132,883 1,132,883 826,574 306,309
Capital outlay 2,823,000 2,823,000 122,312 2,700,688
Total expenditures 5,190,567 5,190,567 2,069,217 3,121,350
Excess (deficiency) of revenues over expenditures (3,347,961) (3,347,961) (229,714) 3,118,247
Other financing sources:Transfers in 169,269 169,269 169,269 — Sale of capital assets — — 120 120
Total other financing sources 169,269 169,269 169,389 120
Net change in fund balances (3,178,692) (3,178,692) (60,325) 3,118,367
Fund balance at July 1 3,340,649 3,340,649 3,340,649 — Fund balance at June 30 $ 161,957 161,957 3,280,324 3,118,367
Schedule of Revenues, Expenditures
106

CITY OF ALHAMBRA
Changes in Fund Balance – Budget and Actual
Proposition A – Transportation Special Revenue Fund
Year ended June 30, 2018
Variance withfinal budget
Original Final Positivebudget budget Actual (Negative)
Revenues:Intergovernmental $ 1,610,003 1,610,003 1,618,768 8,765 Investment earnings 13,100 13,100 15,111 2,011 Charges for services 125,000 125,000 87,509 (37,491) Other 150,000 150,000 161,528 11,528
Total revenues 1,898,103 1,898,103 1,882,916 (15,187)
Expenditures:Current:
Public works 70,574 70,574 72,457 (1,883) Housing, health, and community development 812,411 812,411 676,224 136,187 Culture and recreation 71,302 71,302 69,037 2,265
Capital outlay 1,080,000 1,080,000 — 1,080,000
Total expenditures 2,034,287 2,034,287 817,718 1,216,569
Net change in fund balances (136,184) (136,184) 1,065,198 1,201,382
Fund balance at July 1 1,884,230 1,884,230 1,884,230 — Fund balance at June 30 $ 1,748,046 1,748,046 2,949,428 1,201,382
Schedule of Revenues, Expenditures and
107

CITY OF ALHAMBRA
Changes in Fund Balance – Budget and Actual
Proposition C – Transportation Special Revenue Fund
Year ended June 30, 2018
Variance withfinal budget
Original Final Positivebudget budget Actual (Negative)
Revenues:Intergovernmental $ 1,335,455 1,335,455 1,337,943 2,488 Investment earnings 25,300 25,300 30,390 5,090
Total revenues 1,360,755 1,360,755 1,368,333 7,578
Expenditures:Current:
Public works 180,571 180,571 159,772 20,799 Housing, health, and community development 1,749,153 1,749,153 1,353,420 395,733
Capital outlay — 415,089 92,915 322,174
1,929,724 2,344,813 1,606,107 738,706
Excess (deficiency) of revenues over (568,969) (984,058) (237,774) 746,284 expenditures
Other financing uses:Transfers out — (314,456) (314,456) —
Net change in fund balances (568,969) (1,298,514) (552,230) 746,284
Fund balance at July 1 4,383,274 4,383,274 4,383,274 — Fund balance at June 30 $ 3,814,305 3,084,760 3,831,044 746,284
Schedule of Revenues, Expenditures and
Total expenditures
108
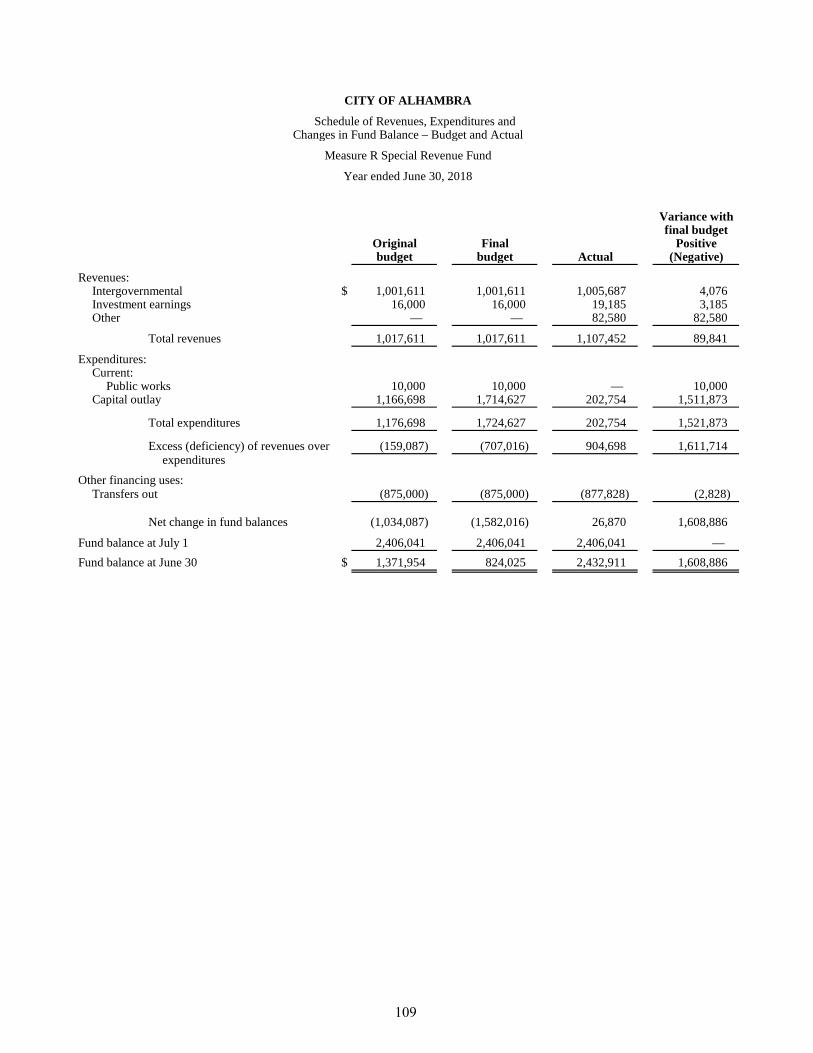
CITY OF ALHAMBRA
Changes in Fund Balance – Budget and Actual
Measure R Special Revenue Fund
Year ended June 30, 2018
Variance withfinal budget
Original Final Positivebudget budget Actual (Negative)
Revenues:Intergovernmental $ 1,001,611 1,001,611 1,005,687 4,076 Investment earnings 16,000 16,000 19,185 3,185 Other — — 82,580 82,580
Total revenues 1,017,611 1,017,611 1,107,452 89,841
Expenditures:Current: Public works 10,000 10,000 — 10,000 Capital outlay 1,166,698 1,714,627 202,754 1,511,873
Total expenditures 1,176,698 1,724,627 202,754 1,521,873
Excess (deficiency) of revenues over (159,087) (707,016) 904,698 1,611,714 expenditures
Other financing uses:Transfers out (875,000) (875,000) (877,828) (2,828)
Net change in fund balances (1,034,087) (1,582,016) 26,870 1,608,886
Fund balance at July 1 2,406,041 2,406,041 2,406,041 — Fund balance at June 30 $ 1,371,954 824,025 2,432,911 1,608,886
Schedule of Revenues, Expenditures and
109

CITY OF ALHAMBRA
Changes in Fund Balance – Budget and Actual
Measure M - Transportation Special Revenue Fund
Year ended June 30, 2018
Variance withfinal budget
Original Final Positivebudget budget Actual (Negative)
Revenues:Intergovernmental $ — — 911,382 911,382 Investment earnings — — 884 884
Total revenues — — 912,266 912,266
Fund balance at July 1 — — — — Fund balance at June 30 $ — — 912,266 912,266
Schedule of Revenues, Expenditures and
110
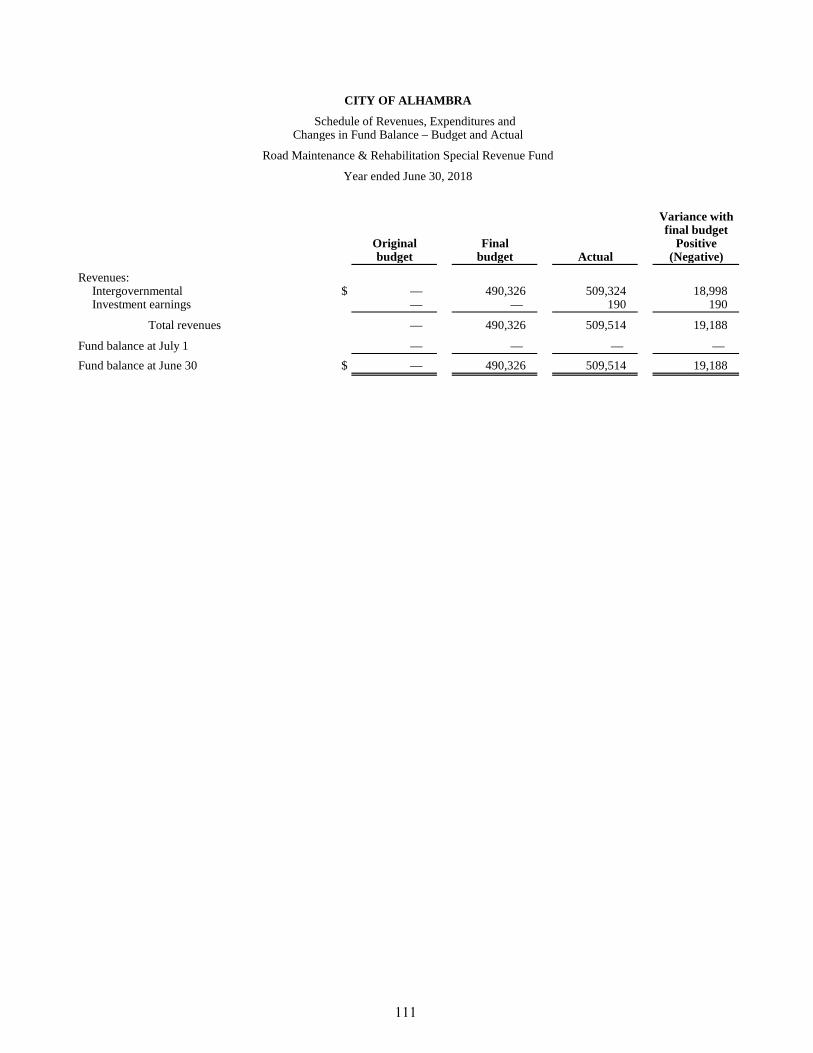
CITY OF ALHAMBRA
Changes in Fund Balance – Budget and Actual
Road Maintenance & Rehabilitation Special Revenue Fund
Year ended June 30, 2018
Variance withfinal budget
Original Final Positivebudget budget Actual (Negative)
Revenues:Intergovernmental $ — 490,326 509,324 18,998 Investment earnings — — 190 190
Total revenues — 490,326 509,514 19,188
Fund balance at July 1 — — — — Fund balance at June 30 $ — 490,326 509,514 19,188
Schedule of Revenues, Expenditures and
111

CITY OF ALHAMBRA
Changes in Fund Balance – Budget and Actual
Air Quality Special Revenue Fund
Year ended June 30, 2018
Variance withfinal budget
Original Final Positivebudget budget Actual (Negative)
Revenues:Intergovernmental $ 100,000 100,000 108,895 8,895 Investment earnings 1,700 1,700 1,969 269
Total revenues 101,700 101,700 110,864 9,164
Expenditures:Current:
Housing, health, and community development 28,575 28,575 91 28,484 Capital outlay 364,205 364,205 314,078 50,127
Total expenditures 392,780 392,780 314,169 78,611
Excess (deficiency) of revenues over (291,080) (291,080) (203,305) 87,775 expenditures
Other financing sources:Transfer in — — 737 737 Sale of capital assets — — 29,190 29,190
Total other financing sources — — 29,927 29,927
Net change in fund balances (291,080) (291,080) (173,378) 117,702
Fund balance at July 1 298,828 298,828 298,828 — Fund balance at June 30 $ 7,748 7,748 125,450 117,702
Schedule of Revenues, Expenditures and
112

CITY OF ALHAMBRA
Changes in Fund Balance – Budget and Actual
Lighting and Landscape Maintenance Special Revenue Fund
Year ended June 30, 2018
Variance withfinal budget
Original Final Positivebudget budget Actual (Negative)
Revenues:Taxes and assessments $ 3,717,447 3,717,447 3,892,871 175,424 Other 21,600 21,600 22,473 873
Total revenues 3,739,047 3,739,047 3,915,344 176,297
Expenditures:Current:
Public works 2,544,780 2,721,733 2,310,723 411,010 Capital outlay 1,103,667 1,118,767 333,578 785,189
Total expenditures 3,648,447 3,840,500 2,644,301 1,196,199
Excess of revenues over90,600 (101,453) 1,271,043 1,372,496
Other financing uses:Transfers out (627,078) (627,078) (668,987) (41,909)
Net change in fund balances (536,478) (728,531) 602,056 1,330,587
Fund balance at July 1 4,938,946 4,938,946 4,938,946 — Fund balance at June 30 $ 4,402,468 4,210,415 5,541,002 1,330,587
Schedule of Revenues, Expenditures and
expenditures
113

CITY OF ALHAMBRA
Changes in Fund Balance – Budget and Actual
Police Facility Assessment Special Revenue Fund
Year ended June 30, 2018
Variance withfinal budget
Original Final Positivebudget budget Actual (Negative)
Revenues:Taxes and assessments $ 2,200,000 2,200,000 2,267,706 67,706 Investment earnings — — 103 103
Total revenues 2,200,000 2,200,000 2,267,809 67,809
Expenditures:Current:
Public safety 5,708 5,708 4,854 854 Capital outlay 26,605 26,605 24,517 2,088
Total expenditures 32,313 32,313 29,371 2,942
Excess of revenues over2,167,687 2,167,687 2,238,438 70,751
Other financing uses:Transfers out (2,174,703) (2,174,703) (2,174,703) —
Net change in fund balances (7,016) (7,016) 63,735 70,751
Fund balance at July 1 85,176 85,176 85,176 — Fund balance at June 30 $ 78,160 78,160 148,911 70,751
Schedule of Revenues, Expenditures and
expenditures
114

Changes in Fund Balance – Budget and Actual
Asset Forfeiture Special Revenue Fund
Year ended June 30, 2018
Variance withfinal budget
Original Final Positivebudget budget Actual (Negative)
Revenues:Intergovernmental $ 55,000 55,000 47,452 (7,548) Investment Earnings 7,440 7,440 6,463 (977)
Total revenues 62,440 62,440 53,915 (8,525)
Expenditures:Current:
Public safety 248,661 370,161 293,925 76,236 Capital Outlay 229,425 218,925 204,015 14,910
Total expenditures 478,086 589,086 497,940 91,146
(415,646) (526,646) (444,025) 82,621
Fund balance at July 1 874,542 874,542 874,542 — Fund balance at June 30 $ 458,896 347,896 430,517 82,621
Schedule of Revenues, Expenditures and
CITY OF ALHAMBRA
Net change in fund balances
115

CITY OF ALHAMBRA
Changes in Fund Balance – Budget and Actual
Disability Access Compliance Fund
Year ended June 30, 2018
Variance withfinal budget
Original Final Positivebudget budget Actual (Negative)
Revenues:Charges for services $ 5,000 5,000 14,773 9,773 Investment earnings 126 126 168 42
Total revenues 5,126 5,126 14,941 9,815
Expenditures:Current:
Housing, health, and community development 5,000 5,000 — 5,000
Net change in fund balances 126 126 14,941 14,815
Fund balance at July 1 23,149 23,149 23,149 — Fund balance at June 30 $ 23,275 23,275 38,090 14,815
Schedule of Revenues, Expenditures and
116
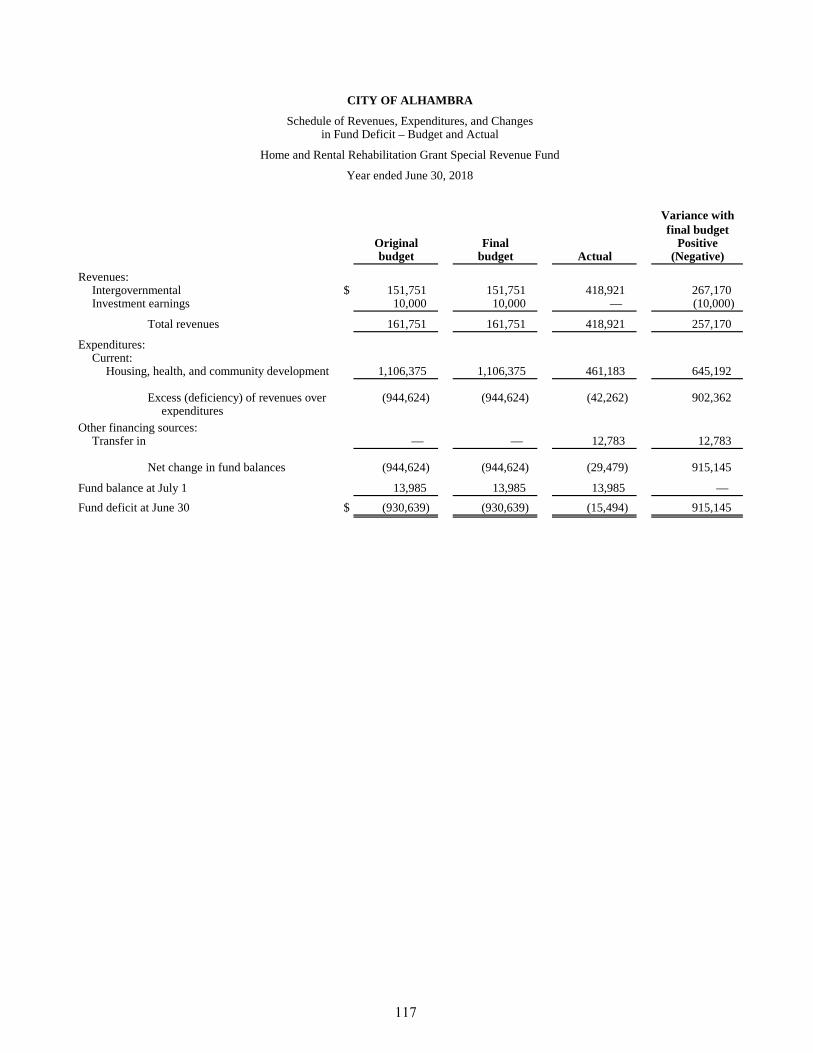
CITY OF ALHAMBRA
Schedule of Revenues, Expenditures, and Changesin Fund Deficit – Budget and Actual
Home and Rental Rehabilitation Grant Special Revenue Fund
Variance withfinal budget
Original Final Positivebudget budget Actual (Negative)
Revenues:Intergovernmental $ 151,751 151,751 418,921 267,170 Investment earnings 10,000 10,000 — (10,000)
Total revenues 161,751 161,751 418,921 257,170
Expenditures:Current:
Housing, health, and community development 1,106,375 1,106,375 461,183 645,192
Excess (deficiency) of revenues over (944,624) (944,624) (42,262) 902,362 expenditures
Other financing sources:Transfer in — — 12,783 12,783
Net change in fund balances (944,624) (944,624) (29,479) 915,145
Fund balance at July 1 13,985 13,985 13,985 — Fund deficit at June 30 $ (930,639) (930,639) (15,494) 915,145
Year ended June 30, 2018
117

CITY OF ALHAMBRA
Schedule of Revenues, Expenditures, and Changesin Fund Balance – Budget and Actual
Housing Assets Special Revenue Fund
Variance withfinal budget
Original Final Positivebudget budget Actual (Negative)
Revenues:Investment earnings $ 40,000 40,000 26,511 (13,489) Other 2,577,183 2,577,183 2,437,879 (139,304)
Total revenues 2,617,183 2,617,183 2,464,390 (152,793)
Expenditures:Current:
Housing, health, and community development 403,084 653,084 20,409 632,675
Total expenditures 403,084 653,084 20,409 632,675
Net change in fund balances 2,214,099 1,964,099 2,443,981 479,882
Fund balance at July 1 5,427,589 5,427,589 5,427,589 —
Fund balance at June 30 $ 7,641,688 7,391,688 7,871,570 479,882
Year ended June 30, 2018
118

OTHER DEBT SERVICE FUNDS
Debt Service Funds are used to account for the accumulation of resources for, and the payment of, general long-term debt principal and interest. Funds included are:
Lighting and Sidewalk Construction Fund – To accumulate monies for the payment of the 1994 $8,300,000 Public Works Maintenance and Improvement Bonds which are due with varying principal and interest amounts until maturity in 2018. Financing is provided by special assessments and contributions by the City as necessary.
Police Facility Fund – To accumulate monies for the payment of the $27,000,000 Alhambra Capital Improvement Corporation Certificates of Participation, Series 1992, which are due with varying principal and interest amounts until maturity in 2023. Financing is provided by special assessments.
Parking Authority Debt Service Fund – To account for revenues and expenditures used to repay the principal and interest on the Alhambra Parking Authority Lease Revenue Bonds.


CITY OF ALHAMBRA
Combining Balance Sheet
Other Debt Service Funds
June 30, 2018
Totalother
Lighting and debt sidewalk Police Parking service
Assets construction facility Authority funds
Restricted cash and investments $ 775,318 130 10 775,458 Accounts receivable 14,647 — — 14,647
Total assets $ 789,965 130 10 790,105
Fund Balances
Fund balances:Restricted for debt service $ 789,965 130 10 790,105
Total fund balances $ 789,965 130 10 790,105
119

CITY OF ALHAMBRA
Combining Statement of Revenues, Expenditures andChanges in Fund Balances
Other Debt Service Funds
Year ended June 30, 2018
Totalother
Lighting and debtsidewalk Police Parking service
construction facility Authority funds
Revenues:Investment earnings $ 43,562 130 10 43,702
Expenditures:Debt service:
Principal retirement 570,000 1,340,000 130,000 2,040,000 Interest and fiscal charges 54,512 744,863 284,369 1,083,744
Total expenditures 624,512 2,084,863 414,369 3,123,744
Deficiency of revenues overexpenditures (580,950) (2,084,733) (414,359) (3,080,042)
Other financing sources:Transfers in 624,321 2,084,863 414,369 3,123,553
Net change in fund balances 43,371 130 10 43,511
Fund balances at July 1 746,594 — — 746,594 Fund balances at June 30 $ 789,965 130 10 790,105
120

CITY OF ALHAMBRA
Schedule of Revenues, Expenditures, and Changesin Fund Balance – Budget and Actual
Lighting and Sidewalk Construction Debt Service Fund
Year ended June 30, 2018
Variance withfinal budget
Original Final Positivebudget budget Actual (Negative)
Revenues:Investment earnings $ 42,100 42,100 43,562 1,462
Expenditures:Debt service:
Principal retirement 570,000 570,000 570,000 — Interest and fiscal charges 54,512 54,512 54,512 —
Total expenditures 624,512 624,512 624,512 —
Deficiency of revenues overexpenditures (582,412) (582,412) (580,950) 1,462
Other financing sources:Transfers in 582,412 582,412 624,321 41,909
Net change in fund balances — — 43,371 43,371
Fund balance at July 1 746,594 746,594 746,594 — Fund balance at June 30 $ 746,594 746,594 789,965 43,371
121

CITY OF ALHAMBRA
Schedule of Revenues, Expenditures, and Changesin Fund Balance – Budget and Actual
Police Facility Debt Service Fund
Year ended June 30, 2018
Variance withfinal budget
Original Final Positivebudget budget Actual (Negative)
Revenues:Investment earnings $ — — 130 130
Expenditures:Debt service:
Principal retirement 1,340,000 1,340,000 1,340,000 — Interest and fiscal charges 744,863 744,863 744,863 —
Total expenditures 2,084,863 2,084,863 2,084,863 —
Deficiency of revenues overexpenditures (2,084,863) (2,084,863) (2,084,733) 130
Other financing sources:Transfers in 2,084,863 2,084,863 2,084,863 —
Net change in fund balances — — 130 130
Fund balance at July 1 — — — — Fund balance at June 30 $ — — 130 130
122

CITY OF ALHAMBRA
Schedule of Revenues, Expenditures, and Changesin Fund Balance – Budget and Actual
Parking Authority Debt Service Fund
Year ended June 30, 2018
Variance withfinal budget
Original Final Positivebudget budget Actual (Negative)
Revenues:Investment earnings $ — — 10 10
Expenditures:Debt service:
Principal retirement 130,000 130,000 130,000 — Interest and fiscal charges 284,369 284,369 284,369 —
Total expenditures 414,369 414,369 414,369 —
Deficiency of revenues overexpenditures (414,369) (414,369) (414,359) 10
Other financing sources:Transfers in 415,268 415,268 414,369 (899)
Net change in fund balances 899 899 10 (889)
Fund balance at July 1 — — — — Fund balance at June 30 $ 899 899 10 (889)
123


OTHER CAPITAL PROJECTS FUNDS
Capital Projects Funds account for financial resources to be used for the acquisition or construction of major capital facilities other than those financed by Enterprise Funds and Trust Funds. Funds included are:
Capital Outlay Fund – To account for future capital projects and acquisitions of the City as determined by the City Council.
Parking Authority Projects Fund – To account for proceeds received from the Alhambra Parking Authority Lease Revenue Bonds for the construction of the new parking structure facility and any other approved capital improvement projects.


CITY OF ALHAMBRA
Combining Balance Sheet
Other Capital Projects Funds
June 30, 2018
Totalother
Capital Parking Capital ProjectsAssets outlay Authority funds
Cash and investments $ 989,643 — 989,643 Restricted cash and investments — 259,325 259,325
Total assets $ 989,643 259,325 1,248,968
Liabilities and Fund Balances
Liabilities:Accounts payable $ 188,040 — 188,040 Retentions payable 7,201 — 7,201
Total liabilities 195,241 — 195,241
Fund balances:Restricted for capital projects — 259,325 259,325 Assigned for various capital improvements 794,402 — 794,402
Total fund balances 794,402 259,325 1,053,727
Total liabilities and fund balances $ 989,643 259,325 1,248,968
124

Totalother
Capital Parking Capital Projectsoutlay Authority funds
Revenues:Intergovernmental $ 184,241 — 184,241 Investmennt earnings — 992 992 Other 301,961 — 301,961
Total revenues 486,202 992 487,194
Expenditures:Capital outlay 1,653,682 — 1,653,682 Debt service:
Principal retirement 246,112 — 246,112 Interest and fiscal charges 34,275 — 34,275
Total expenditures 1,934,069 — 1,934,069
Deficiency of revenues over expenditures (1,447,867) 992 (1,446,875)
Other financing sources:Transfers in 1,753,650 — 1,753,650
Net change in fund balances 305,783 992 306,775
Fund balance at July 1 488,619 258,333 746,952 Fund balance at June 30 $ 794,402 259,325 1,053,727
CITY OF ALHAMBRA
Combining Statement of Revenues, Expenditures, andChanges in Fund Balances
Other Capital Projects Funds
Year ended June 30, 2018
125

CITY OF ALHAMBRA
Capital Outlay Capital Projects Fund
Year ended June 30, 2018
Variance withfinal budget
Original Final Positivebudget budget Actual (Negative)
Revenues:Intergovernmental $ — — 184,241 184,241 Other 301,961 301,961 301,961 —
Total revenues 301,961 301,961 486,202 184,241
Expenditures:Capital outlay 4,181,715 4,159,620 1,653,682 2,505,938 Debt service:
Principal retirement 246,112 246,112 246,112 — Interest and fiscal charges 34,275 34,275 34,275 —
Total expenditures 4,462,102 4,440,007 1,934,069 2,505,938 Deficiency of revenues over expenditures (4,160,141) (4,138,046) (1,447,867) 2,690,179
Other financing sources:Transfers in 3,151,778 3,151,778 1,753,650 (1,398,128)
Net change in fund balances (1,008,363) (986,268) 305,783 1,292,051
Fund balance at July 1 488,619 488,619 488,619 — Fund balance at June 30 $ (519,744) (497,649) 794,402 1,292,051
Schedule of Revenues, Expenditures, andChanges in Fund Balance – Budget and Actual
126
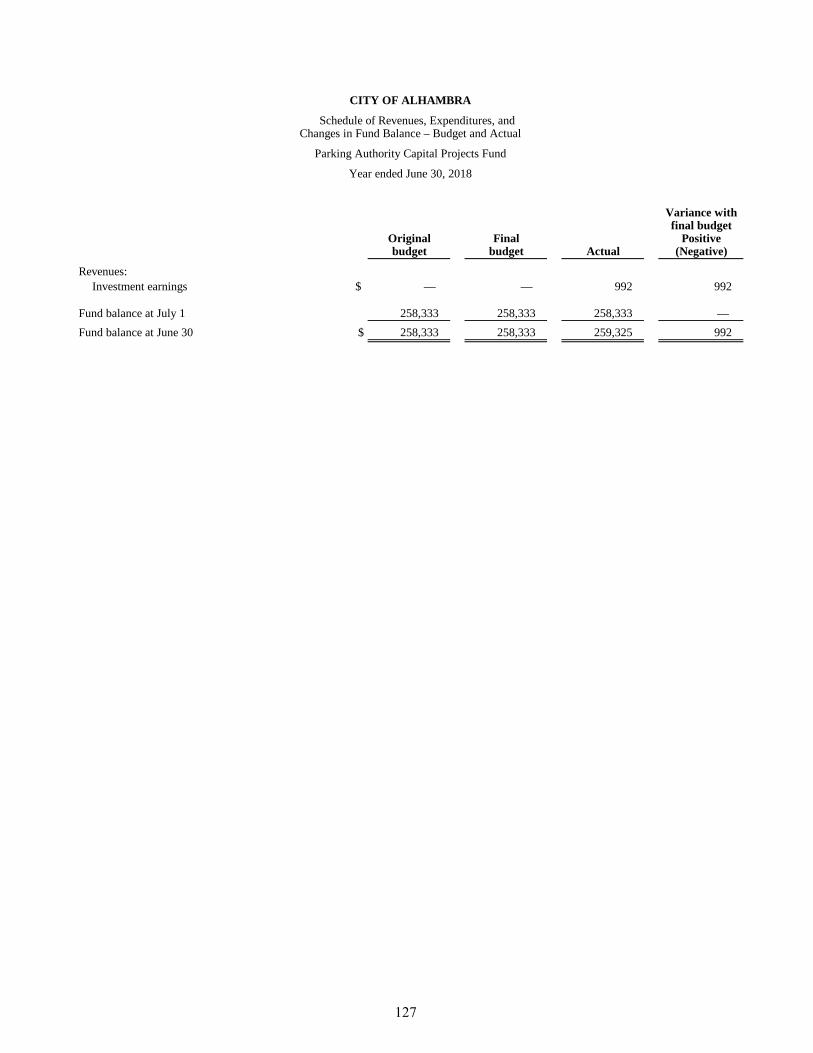
CITY OF ALHAMBRA
Parking Authority Capital Projects Fund
Year ended June 30, 2018
Variance withfinal budget
Original Final Positivebudget budget Actual (Negative)
Revenues:Investment earnings $ — — 992 992
Fund balance at July 1 258,333 258,333 258,333 — Fund balance at June 30 $ 258,333 258,333 259,325 992
Schedule of Revenues, Expenditures, andChanges in Fund Balance – Budget and Actual
127

INTERNAL SERVICE FUNDS
Internal Service Funds have been established to finance and account for goods and services provided by one City department to other City departments or agencies.
Equipment Fund – This fund accounts for the operation, maintenance, and replacement of certain equipment of the vehicular fleet utilized by governmental operating departments and enterprise activities on a rental-fee basis.
Self-Insurance Fund – This fund administers the City’s self-insured workers’ compensation, health insurance, and general liability programs. The fund collects premiums from departments and employees, records the related liability, and makes benefit payments through outside settlement agents.
Compensated Absences Fund – This fund accounts for the City’s compensated absences liability other than those liabilities accounted for in the Proprietary Funds. The fund assesses amounts from departments and makes final vested compensated absences payments to terminated or retired employees.


CITY OF ALHAMBRA
Totalinternal
Compensated serviceAssets Equipment Self-insurance absences funds
Current assets:Cash and investments $ 2,683,548 3,973,980 2,208,837 8,866,365 Accounts receivable 16,632 53,980 — 70,612 Prepaid items — 1,612,365 — 1,612,365
Total current assets 2,700,180 5,640,325 2,208,837 10,549,342 Capital assets:
Land — 237,950 — 237,950 Machinery and equipment 6,375,610 — — 6,375,610 Less accumulated depreciation (4,680,236) — — (4,680,236)
Total capital assets, net of accumulated depreciation 1,695,374 237,950 — 1,933,324
Total assets 4,395,554 5,878,275 2,208,837 12,482,666 Deferred outflow of resources:
Deferred amounts from pensions 233,258 152,921 — 386,179 Deferred amounts from other post employment
benefits 2,652 — — 2,652 Total deferred outflows 235,910 152,921 — 388,831
Liabilities and Net Position (Deficits)
Current liabilities:Accounts payable 169,746 396,477 — 566,223 Due to other funds — 2,757,631 — 2,757,631 Compensated absences 6,704 1,007 464,125 471,836 Deposits — 2,804 — 2,804 Current portion:
Self-insurance claims payable — 2,559,495 — 2,559,495
Total current liabilities 176,450 5,717,414 464,125 6,357,989
Long-term liabilities (net of current portion):Compensated absences 32,507 4,881 2,250,282 2,287,670 Pension liability 991,180 611,502 — 1,602,682 OPEB liability 134,310 — — 134,310 Self-insurance claims payable — 14,077,643 — 14,077,643
Total long-term obligations 1,157,997 14,694,026 2,250,282 18,102,305
Total liabilities 1,334,447 20,411,440 2,714,407 24,460,294 Deferred inflow of resources:
Deferred amounts from pensions 64,784 37,613 — 102,397 Deferred amounts from other post employment
benefits 14,736 — — 14,736 Total deferred inflow 79,520 37,613 — 117,133
Net position (deficits):Net investment in capital assets 1,695,374 237,950 — 1,933,324 Unrestricted 1,522,123 (14,655,807) (505,570) (13,639,254)
Total net position (deficits) $ 3,217,497 (14,417,857) (505,570) (11,705,930)
Combining Statement of Net Position (Deficits)
June 30, 2018
Internal Service Funds
128

CITY OF ALHAMBRA
Combining Statement of Revenues, Expenses, and Changes in Net Position
Internal Service Funds
Year ended June 30, 2018
Totalinternal
Compensated serviceEquipment Self-insurance absences funds
Operating revenues:Charges for services $ 1,918,328 — — 1,918,328 Self-insurance/compensated
absences contributions — 10,486,271 264,823 10,751,094
Total operating revenues 1,918,328 10,486,271 264,823 12,669,422
Operating expenses:Claims expense – liability — 4,590,094 — 4,590,094 Claims expense – workers’ compensation — 4,211,653 — 4,211,653 Claims expense – health insurance — 4,513,591 — 4,513,591 Compensated absences — — 756,744 756,744 Vehicle expense 1,282,456 — — 1,282,456 Depreciation 250,448 — — 250,448
Total operating expenses 1,532,904 13,315,338 756,744 15,604,986
Operating income (loss) 385,424 (2,829,067) (491,921) (2,935,564)
Nonoperating revenues (expenses):Interest income 11,910 30,272 18,614 60,796 Loss on disposal of equipment (8,778) — — (8,778) Other income 3,453 59,775 — 63,228
Total nonoperating revenues (expenses) 6,585 90,047 18,614 115,246
Income (loss) before transfers 392,009 (2,739,020) (473,307) (2,820,318)
Transfers in 13,530 34,330 — 47,860 Transfers out (80,666) (137,557) — (218,223)
Total transfers in (out) (67,136) (103,227) — (170,363)
Change in net position 324,873 (2,842,247) (473,307) (2,990,681)
Net position (deficits) at July 1, as restated 2,892,624 (11,575,610) (32,263) (8,715,249) Net position (deficits) at June 30 $ 3,217,497 (14,417,857) (505,570) (11,705,930)
129

CITY OF ALHAMBRA
Combining Statement of Cash Flows
Internal Service Funds
Year ended June 30, 2018
Totalinternal
Compensated serviceEquipment Self-insurance absences funds
Cash flows from operating activities:Cash received from customers $ 1,918,268 10,474,651 264,823 12,657,742 Cash paid for insurance premiums and self-insurance claims — (13,345,227) — (13,345,227) Cash paid for compensated absences claims (21,471) (5,412) (834,747) (861,630) Cash paid to suppliers for goods and services (779,726) — — (779,726) Cash paid to employees for services (357,667) (62,765) — (420,432) Other operating cash received — 59,775 — 59,775
Net cash provided by (used in) operating activities 759,404 (2,878,978) (569,924) (2,689,498)
Cash flows from noncapital financing activities:Cash received on loans from other funds — 2,757,631 — 2,757,631 Cash paid on loans from other funds — (515,782) — (515,782) Transfers from other funds 13,530 34,330 — 47,860 Transfers to other funds (80,666) (137,557) — (218,223)
Net cash provided by (used in) noncapital financing activities (67,136) 2,138,622 — 2,071,486
Cash flows from capital and related financing activities:
Acquisitions of capital assets (433,529) — — (433,529) Proceeds from sale of fixed assets 12,835 — — 12,835
Net cash used in capital and related financingactivities (420,694) — — (420,694)
Cash flows from investing activities: Interest received 11,910 30,272 18,614 60,796
Net increase (decrease) in cash and cash equivalents 283,484 (710,084) (551,310) (977,910)
Cash and cash equivalents at July 1 2,400,064 4,684,064 2,760,147 9,844,275 Cash and cash equivalents at June 30 $ 2,683,548 3,973,980 2,208,837 8,866,365
Cash and investments $ 2,683,548 3,973,980 2,208,837 8,866,365
Noncash investing, capital, and financing activities:(13,381) (30,740) (12,841) (56,962) Increase (decrease) in fair value of investments
130
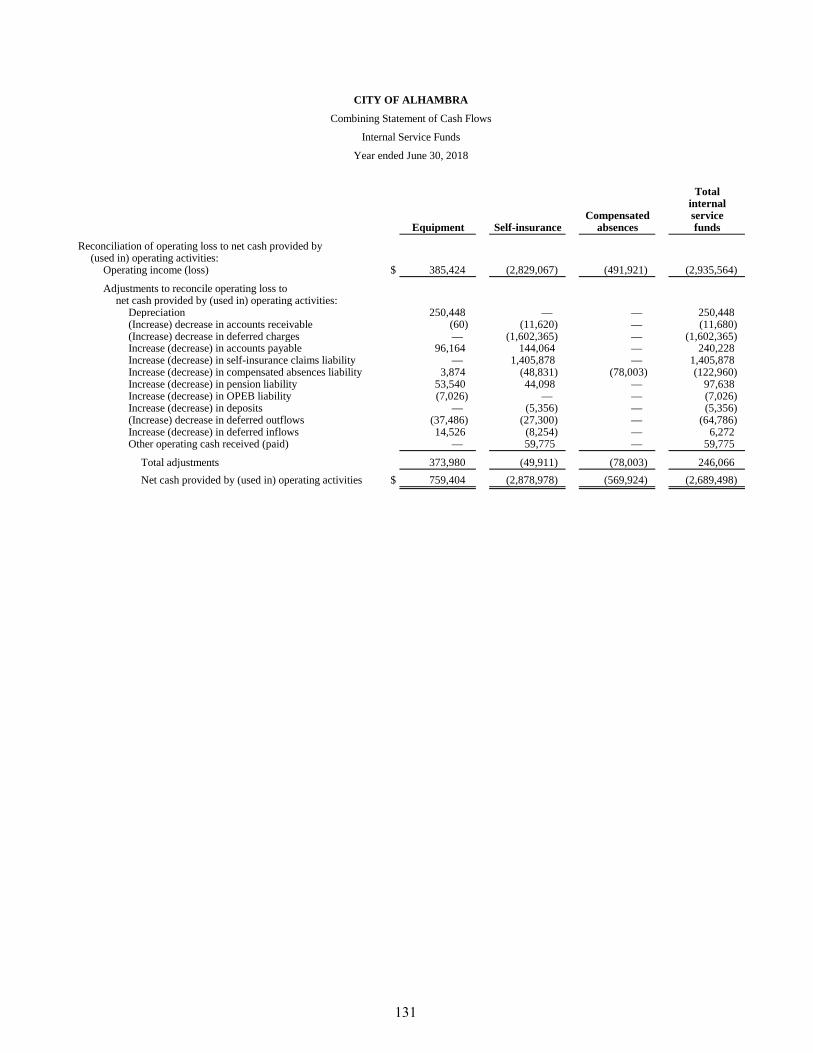
CITY OF ALHAMBRA
Combining Statement of Cash Flows
Internal Service Funds
Year ended June 30, 2018
Totalinternal
Compensated serviceEquipment Self-insurance absences funds
Reconciliation of operating loss to net cash provided by(used in) operating activities:
Operating income (loss) $ 385,424 (2,829,067) (491,921) (2,935,564)
Adjustments to reconcile operating loss tonet cash provided by (used in) operating activities:
Depreciation 250,448 — — 250,448 (Increase) decrease in accounts receivable (60) (11,620) — (11,680) (Increase) decrease in deferred charges — (1,602,365) — (1,602,365) Increase (decrease) in accounts payable 96,164 144,064 — 240,228 Increase (decrease) in self-insurance claims liability — 1,405,878 — 1,405,878 Increase (decrease) in compensated absences liability 3,874 (48,831) (78,003) (122,960) Increase (decrease) in pension liability 53,540 44,098 — 97,638 Increase (decrease) in OPEB liability (7,026) — — (7,026) Increase (decrease) in deposits — (5,356) — (5,356) (Increase) decrease in deferred outflows (37,486) (27,300) — (64,786) Increase (decrease) in deferred inflows 14,526 (8,254) — 6,272 Other operating cash received (paid) — 59,775 — 59,775
Total adjustments 373,980 (49,911) (78,003) 246,066 Net cash provided by (used in) operating activities $ 759,404 (2,878,978) (569,924) (2,689,498)
131

Statistical Section


STATISTICAL SECTION
This part of the City of Alhambra’s comprehensive annual financial report presents detailed information as a context for understanding what the information in the financial statements, note disclosures, and required supplementary information says about the City’s overall financial health.
Contents Page
Financial Trends 132
These schedules contain trend information to help the reader understand how the City’s financial performance and well-being have changed over time.
Revenue Capacity 137
These schedules contain information to help the reader assess the City’s ability to generate its property tax.
Debt Capacity 141
These schedules present information to help the reader assess the affordability of the City’s current levels of outstanding debt and its ability to issue additional debt in the future.
Demographic and Economic Information 147
These schedules offer demographic and economic indicators to help the reader understand the environment within which the City’s financial activities take place.
Operating Information 150
These schedules contain service and infrastructure data to help the reader understand how the information in the City’s financial report relates to the services the City provides and the activities it performs.


2009 2010 2011 2012 2013 2014 2015 2016 2017 2018
Net investment in capital assets $ 111,857,095 113,333,412 117,571,980 125,254,685 119,554,523 119,910,993 119,683,405 117,400,979 115,421,743 120,842,429 8,499,470 7,872,152 29,145,405 12,815,183 24,880,029 24,277,963 23,216,172 24,558,784 25,084,068 31,144,779
Unrestricted (deficit) (14,557,195) (10,548,144) (25,273,128) 4,297,460 (345,349) (98,784,269) (99,760,038) (85,151,340) (95,213,715) (115,404,022) $ 105,799,370 110,657,420 121,444,257 142,367,328 144,089,203 45,404,687 43,139,539 56,808,423 45,292,096 36,583,186
Net investment in capital assets $ 33,462,124 34,942,848 35,565,392 35,702,569 36,630,591 36,963,342 38,681,372 44,495,807 45,479,549 53,139,446 1,830,685 1,160,950 1,160,870 1,160,870 1,160,340 1,160,870 1,160,870 1,192,524 - -
Unrestricted (deficit) 14,183,095 16,768,604 18,676,679 23,703,279 25,477,477 20,565,272 22,645,476 18,270,056 19,400,292 11,637,079 $ 49,475,904 52,872,402 55,402,941 60,566,718 63,268,408 58,689,484 62,487,718 63,958,387 64,879,841 64,776,525
Net investment in capital assets $ 145,319,219 148,276,260 153,137,372 160,957,254 156,185,114 156,874,335 158,364,777 161,896,786 160,901,292 173,981,875 10,330,155 9,033,102 30,306,275 13,976,053 26,040,369 25,438,833 24,377,042 25,751,308 25,084,068 31,144,779
Unrestricted (deficit) (374,100) 6,220,460 (6,596,449) 28,000,739 25,132,128 (78,218,997) (77,114,562) (74,553,670) (75,813,423) (103,766,943) $ 155,275,274 163,529,822 176,847,198 202,934,046 207,357,611 104,094,171 105,627,257 113,094,424 110,171,937 101,359,711
Source: City of Alhambra Finance Department
Restricted
Primary government
Restricted
Total primary government net position
Total business-type activities net position
CITY OF ALHAMBRANet Position by Component
Last Ten Fiscal Years(accrual basis of accounting)
Businesss-type activities
Governmental activities
Restricted
Total government activities net position
132

2009 2010 2011 2012 2013 2014 2015 2016 2017 2018
$ 2,599,399 2,154,973 2,493,419 1,441,044 1,206,489 1,309,345 1,598,123 1,041,083 1,204,966 2,254,771 39,274,021 40,075,442 42,807,574 43,467,450 43,666,780 43,976,801 46,458,791 42,918,861 48,449,596 52,793,851
Public works 7,458,819 8,078,818 8,445,460 8,106,881 9,946,710 8,415,715 8,023,192 7,006,245 8,643,223 8,721,130 Housing, health, and community development 16,288,258 14,706,263 12,464,262 8,161,367 8,683,130 8,139,588 7,650,827 8,487,433 7,640,825 8,259,246 Culture and recreation 9,762,657 9,486,289 9,541,415 9,482,993 8,913,765 9,519,514 9,279,212 9,052,940 10,371,792 12,602,723 Interest on long-term debt 4,204,612 3,757,768 3,447,568 2,427,493 1,355,529 1,398,665 1,249,673 1,135,837 1,036,198 886,838
79,587,766 78,259,553 79,199,698 73,087,228 73,772,403 72,759,628 74,259,818 69,642,399 77,346,600 85,518,559
Water 12,646,555 15,664,688 16,841,738 17,571,245 18,530,841 16,863,678 16,510,569 16,311,997 17,159,580 17,748,467 Sewer and storm drain 1,325,972 1,165,562 1,665,141 2,053,522 1,788,731 1,851,342 1,974,071 3,263,093 2,339,224 3,480,155 Sanitation 8,412,422 8,314,584 8,640,626 8,581,865 8,606,409 8,694,414 8,564,911 8,618,426 8,942,478 9,244,338 Golf course/clubhouse 2,066,788 1,545,348 1,622,215 1,541,488 1,621,155 2,321,926 1,478,101 1,484,380 1,677,903 1,638,735
24,451,737 26,690,182 28,769,720 29,748,120 30,547,136 29,731,360 28,527,652 29,677,896 30,119,185 32,111,695 Total primary government expenses 104,039,503 104,949,735 107,969,418 102,835,348 104,319,539 102,490,988 102,787,470 99,320,295 107,465,785 117,630,254
Charges for services:General government 370,254 1,249,498 1,323,682 670,662 1,249,282 1,771,545 1,980,803 1,730,037 1,625,676 1,611,247 Public safety 4,116,371 4,708,584 4,796,633 5,094,315 4,974,492 4,768,708 4,783,375 4,848,663 4,845,879 4,767,875 Public works 231,925 717,115 817,561 799,264 901,502 730,946 808,084 686,121 710,766 861,322 Housing, health, and community development 3,117,619 3,621,392 8,931,894 3,670,906 3,139,965 4,107,468 4,712,569 2,878,375 4,458,206 4,500,184 Culture and recreation 672,158 642,950 556,879 565,293 699,061 652,413 715,831 769,481 803,866 948,396
Operating grants and contributions 8,160,683 8,946,952 7,811,223 11,362,119 9,371,187 8,035,043 9,416,083 7,787,874 7,772,546 9,846,179 Capital grants and contributions 3,280,012 4,009,245 6,302,102 1,724,680 1,992,813 890,309 951,304 1,116,073 1,011,554 3,745,923
19,949,022 23,895,736 30,539,974 23,887,239 22,328,302 20,956,432 23,368,049 19,816,624 21,228,493 26,281,126
Charges for services:Water 14,093,897 16,854,298 17,662,974 20,042,797 17,770,857 20,138,797 17,590,510 15,662,647 16,566,259 17,552,925 Sewer and storm drain 2,870,951 3,533,392 4,211,250 4,969,467 5,358,378 5,316,389 5,257,713 5,007,289 5,002,317 5,208,405 Sanitation 8,045,969 8,056,419 8,079,632 8,159,101 8,639,045 8,586,339 8,675,760 8,733,400 8,960,776 9,158,889 Golf course/clubhouse 1,808,266 1,805,396 1,767,913 1,876,052 1,785,118 1,768,206 1,667,428 1,624,973 1,646,587 1,628,346
Operating grants and contributions 36,714 684,730 476,018 45,824 22,626 22,240 22,489 - - - Capital grants and contributions - - - - - - - 233,000 - -
26,855,797 30,934,235 32,197,787 35,093,241 33,576,024 35,831,971 33,213,900 31,261,309 32,175,939 33,548,565 46,804,819 54,829,971 62,737,761 58,980,480 55,904,326 56,788,403 56,581,949 51,077,933 53,404,432 59,829,691
(59,638,744) (54,363,817) (48,659,724) (49,199,989) (51,444,101) (51,803,196) (50,891,769) (49,825,775) (56,118,107) (59,237,433) 2,404,060 4,244,053 3,428,067 5,345,121 3,028,888 6,100,611 4,686,248 1,583,413 2,056,754 1,436,870
(57,234,684) (50,119,764) (45,231,657) (43,854,868) (48,415,213) (45,702,585) (46,205,521) (48,242,362) (54,061,353) (57,800,563)
Total primary government program revenues
Total government activities expenses
Net (expense) revenueGovernment activities:
General governmentBusiness-type activities
General governmentPublic safety
Total government activities expenses
Total business-type activities program revenues
Total governmental activities program revenues
Businesss-type activities:
Businesss-type activities:
Program Revenues
Total business-type activities expenses
Governmental activities:
Changes in Net Position
Governmental activities:Expenses
CITY OF ALHAMBRA
(accrual basis of accounting)Last Ten Fiscal Years
133

2009 2010 2011 2012 2013 2014 2015 2016 2017 2018
Taxes27,777,842 25,904,413 25,930,647 20,444,955 17,209,958 15,983,618 25,695,352 17,221,634 18,061,055 19,008,940 13,131,359 12,091,702 12,574,181 13,123,551 14,681,954 15,103,394 15,672,583 16,811,427 16,977,165 17,247,093
4,599,566 4,522,434 4,379,377 4,314,006 4,306,280 4,176,807 4,200,198 3,674,579 3,457,468 3,884,135 Franchise tax 1,620,966 1,397,198 1,582,465 1,374,734 1,383,051 1,625,107 1,703,961 1,634,312 1,660,466 1,679,409 Business license tax 1,560,820 1,459,853 1,525,781 1,540,172 1,467,043 1,544,170 1,703,822 1,733,813 1,668,051 1,667,331
342,860 344,337 580,551 183,436 511,096 654,609 1,343,268 966,689 1,288,457 1,325,738 7,099,620 7,223,858 7,414,885 7,202,924 7,373,428 7,695,977 37,113 8,411,728 8,879,448 9,335,408 1,028,098 448,075 279,229 117,604 97,462 140,478 236,388 298,567 319,457 410,811 1,312,104 3,272,048 4,055,729 3,893,175 6,387,245 5,778,243 4,412,511 4,806,816 4,050,087 7,560,072
Gain from dissolution of AlhambraRedevelopment Agency - - - 17,127,661 - - - - - -
Sale of property - - - - - - - 7,067,037 685,073 - Return of sale proceeds - - - - - - - - (6,546,354) -
618,216 1,378,069 1,123,716 536,462 425,084 730,070 918,102 868,057 808,050 436,375 59,091,451 58,041,987 59,446,561 69,858,680 53,842,601 53,432,473 55,923,298 63,494,659 51,308,423 62,555,312
Business-type activities:440,663 198,203 125,419 114,178 108,708 142,339 257,655 310,702 283,950 253,300 202,195 332,311 100,769 240,940 269,937 231,891 564,699 444,611 354,543 333,986
(618,216) (1,378,069) (1,123,716) (536,462) (425,084) (730,070) (918,102) (868,057) (808,050) (436,375) 24,642 (847,555) (897,528) (181,344) (46,439) (355,840) (95,748) (112,744) (169,557) 150,911
59,116,093 57,194,432 58,549,033 69,677,336 53,796,162 53,076,633 55,827,550 63,381,915 51,138,866 62,706,223
(547,293) 3,678,170 10,786,837 20,658,691 2,398,500 1,629,277 5,031,529 13,668,884 (4,809,684) 3,317,879 2,428,702 3,396,498 2,530,539 5,163,777 2,982,449 5,744,771 4,590,500 1,470,669 1,887,197 1,587,781
$ 1,881,409 7,074,668 13,317,376 25,822,468 5,380,949 7,374,048 9,622,029 15,139,553 (2,922,487) 4,905,660
Total business-type activities
Unrestricted investment earnings
Unrestricted investment earnings
Change in net position
Source: City of Alhambra Finance Department
Businesss-type activities:Governmental activities:
Total primary government
Total primary government
Miscellaneous
Total governmental activities
(accrual basis of accounting)
Governmental activities:
Unrestricted intergovernmentalOther taxes
Property taxes and assessments
Transfers
Sales taxesUtility users tax
Transfers
Miscellaneous
CITY OF ALHAMBRAChanges in Net Position
Last Ten Fiscal Years
General revenues and other changes in net assets
134

2009 2010 2011 2012 2013 2014 2015 2016 2017 2018
$ 365,112 522,890 - - - - - - - - 8,746,072 7,557,236 - - - - - - - -
Nonspendable - - 46,522 51,556 367,253 229,879 241,014 204,108 183,620 335,128 Restricted - - - 119,495 29,217 9,338 80,763 132,155 96,298 109,827 Committed - - 7,294,001 7,367,005 9,066,012 9,199,106 10,092,235 9,752,721 9,778,291 20,675,889 Assigned - - 360,215 1,333,226 4,750,000 8,615,000 9,155,109 12,529,059 12,977,582 4,292,481 Unassigned - - 2,344,568 374,673 559,597 422,010 711,308 667,960 492,831 -
9,111,184 8,080,126 10,045,306 9,245,955 14,772,079 18,475,333 20,280,429 23,286,003 23,528,622 25,413,325
22,428,284 21,825,732 - - - - - - - -
9,551,317 9,282,330 - - - - - - - - (7,661,214) (7,545,656) - - - - - - - -
Nonspendable - - 8,926,332 6,828,432 6,379,987 - - - - - Restricted - - 22,672,174 13,455,344 16,009,120 23,666,876 22,740,138 31,477,928 24,747,138 29,209,946 Committed - - - - - - - - - - Assigned - - 270,055 - - - - 109,764 488,619 794,402 Unassigned - - (6,419,922) (903,290) (468,941) (227,422) (351,569) (118,756) (1,647,391) (5,147,225)
Total all other governmental funds 24,318,387 23,562,406 25,448,639 19,380,486 21,920,166 23,439,454 22,388,569 31,468,936 23,588,366 24,857,123
Total fund balances of governmental funds $ 33,429,571 31,642,532 35,493,945 28,626,441 36,692,245 41,914,787 42,668,998 54,754,939 47,116,988 50,270,448
Note: The City implemented GASB Statement 54 - Fund Balance Reporting and Government Fund Type Definitions for the fiscal year ended June 30, 2011 which changed the presentation of the financial data above.
Source: City of Alhambra Finance Department
ReservedGeneral Fund
CITY OF ALHAMBRAFund Balances of Governmental Funds
Last Ten Fiscal Years(modified accrual basis of accounting)
Unreserved
Special revenue fundsUnreserved, reported in:
All other governmental funds
Capital projects funds
Total general fund
Reserved
135

2009 2010 2011 2012 2013 2014 2015 2016 2017 2018
RevenuesTaxes and assessments $ 48,626,945 45,026,592 46,522,914 40,716,426 39,471,603 39,255,283 42,127,913 43,120,375 43,277,759 44,694,184 Licenses and permits 1,582,805 2,358,794 2,299,908 2,770,921 2,363,316 3,747,136 3,597,720 2,541,139 3,421,928 4,025,336 Intergovernmental 16,982,893 19,427,236 18,714,051 21,698,120 17,861,083 16,054,914 18,559,631 17,093,372 15,500,989 23,214,151 Investment earnings 2,684,660 2,297,144 1,944,025 1,411,878 975,001 1,105,703 905,885 898,483 877,653 714,120 Charges for services 3,838,378 4,359,652 5,525,040 4,593,070 5,516,889 4,765,806 5,936,547 5,207,527 6,312,194 5,777,488 Fines and forfeitures 2,447,778 2,779,388 2,635,261 2,896,230 2,691,271 2,586,402 2,556,868 2,523,435 2,566,037 2,500,167 Sale of property - - 4,574,440 - - - - - - - Other 2,028,670 2,532,749 3,871,871 3,501,797 5,856,252 6,017,557 4,447,961 4,004,789 3,994,309 6,764,016
Total revenues 78,192,129 78,781,555 86,087,510 77,588,442 74,735,415 73,532,801 78,132,525 75,389,120 75,950,869 87,689,462
ExpendituresCurrent:
General government 1,628,517 1,536,350 1,637,930 845,504 805,258 615,581 834,519 649,203 829,642 892,053 Public safety 38,043,590 38,267,493 39,097,289 40,806,858 40,737,400 41,863,526 42,680,608 44,118,244 46,210,089 47,622,703 Public works 4,089,876 4,074,480 4,025,650 3,684,696 3,309,247 4,074,220 3,990,566 3,927,835 3,846,802 4,208,625 Housing, health, and community development 6,128,649 9,341,786 5,947,773 6,238,845 7,319,093 8,051,158 7,217,479 8,322,877 7,464,293 8,091,908 Culture and recreation 8,682,199 8,140,923 7,706,239 7,198,675 7,329,956 7,969,674 7,677,061 8,063,827 8,478,211 8,848,921
Capital outlay 16,367,089 11,743,015 13,823,474 8,801,528 5,056,504 7,578,905 8,435,018 2,787,864 7,296,333 11,802,251 Debt service
Principal retirement 5,606,023 5,832,222 6,058,473 2,772,857 3,469,852 3,352,301 2,799,611 2,136,581 2,415,048 2,547,911 Interest and fiscal charges 4,427,486 4,136,512 3,828,575 2,588,833 1,634,600 1,545,838 1,539,872 1,403,415 1,303,740 1,160,308 Bond issuance costs - - - - - 303,130 - - - - Total expenditures 84,973,429 83,072,781 82,125,403 72,937,796 69,661,910 75,354,333 75,174,734 71,409,846 77,844,158 85,174,680
Excess (deficiency) of revenues over expenditures (6,781,300) (4,291,226) 3,962,107 4,650,646 5,073,505 (1,821,532) 2,957,791 3,979,274 (1,893,289) 2,514,782
Other financing sources (uses)Transfers in 15,256,365 14,695,984 11,355,057 8,232,977 6,389,865 6,062,993 6,825,538 6,196,182 6,074,781 7,556,990 Transfers out (14,274,750) (13,388,497) (11,034,646) (7,506,532) (5,661,429) (5,236,768) (9,047,169) (5,171,315) (7,104,910) (6,950,252) Issuance of debt - - - - - 6,565,000 - - - - Bond discount - - - - - (59,019) - - - - Capital lease obligations - - - - 674,062 - 14,304 - 1,143,715 - Sale of capital assets 1,140,347 16,820 (431,105) 12,423 1,589,801 53,065 3,747 14,763 3,033 31,940
Total other financing sources (uses) 2,121,962 1,324,307 (110,694) 738,868 2,992,299 7,385,271 (2,203,580) 1,039,630 116,619 638,678
Extraordinary items:Loss on the dissolution of the Alhambra
Redevelopment Agency - - - (12,521,398) - - - - - - Special item:
Sale of property - - - - - - - 7,067,037 685,073 - Return of sale proceeds - - - - - - - - (6,546,354) -
Net change in fund balances $ (4,659,338) (2,966,919) 3,851,413 (7,131,884) 8,065,804 5,563,739 754,211 12,085,941 (7,637,951) 3,153,460
Debt service as a percentage ofnoncapital expenditures 12.4% 12.8% 13.4% 8.0% 7.9% 7.5% 6.3% 5.1% 5.1% 4.6%
Source: City of Alhambra Finance Department
CITY OF ALHAMBRAChanges in Fund Balances of Governmental Funds
Last Ten Fiscal Years(modified accrual basis of accounting)
136

CITY OF ALHAMBRAAssessed Value and Estimated Actual Value of Taxable Property
Last Ten Fiscal Years
Fiscal year Taxable Totalended Secured Unsecured assessed direct tax
June 30, government valuations Exemptions value rate2009 6,611,212,168 171,146,951 (161,773,143) 6,620,585,976 0.30268 2010 6,756,365,487 172,461,196 (176,215,907) 6,752,610,776 0.30642 2011 6,801,592,929 164,293,035 (172,541,477) 6,793,344,487 0.28988 2012 6,961,089,764 164,968,850 (170,857,782) 6,955,200,832 0.26617 2013 7,121,777,461 159,173,191 (170,766,894) 7,110,183,758 0.27638 2014 7,449,905,865 154,125,833 (173,280,405) 7,430,751,293 0.15913 2015 7,798,374,828 156,230,224 (169,055,883) 7,785,549,169 0.15936 2016 8,180,383,058 153,901,981 (205,525,227) 8,128,759,812 0.15958 2017 8,614,331,127 155,338,883 (190,708,352) 8,578,961,658 0.15977 2018 9,037,174,800 156,725,298 (179,143,699) 9,014,756,399 0.15933
Note:
City
Source: Los Angeles County Auditor-Controller.
In 1978 the voters of the State of California passed Proposition 13 which limited property taxes to a total maximum rate of 1% based upon the assessed value of the property being taxed. Each year, the assessed value of property may be increased by an "inflation factor" (limited to a maximum increase of 2%). With few exceptions, property is only reassessed at the time it is sold to a new owner and the new assessed value is reassessed at the purchase price of the property sold. The assessed valuation data shown above represents the only data currently available with respect to the actual market value of taxable property and is subject to the limitations described above.
137

Agency 2008/09 2009/10 2010/11 2011/12 2012/13 2013/14 2014/15 2015/16 2016/17Basic Levy (1) 1.00000 1.00000 1.00000 1.00000 1.00000 1.00000 1.00000 1.00000 1.00000
Alhambra City School Dist 0.00000 0.00000 0.00000 0.00000 0.00000 0.00000 0.00000 0.00000 0.00000Alhambra Unified School District 0.03625 0.05151 0.05996 0.07411 0.05455 0.06666 0.06595 0.06558 0.06111Alhambra Usd Ds 1999 Series A 0.00000 0.00000 0.00000 0.00000 0.01305 0.01305 0.00000 0.00000 0.00000County Detention Facilities 1987 Debt 0.00000 0.00000 0.00000 0.00000 0.00000 0.00000 0.00000 0.00000 0.00000La Ccd Ds 2008 2012 Series F 0.00000 0.00000 0.00000 0.00000 0.01119 0.00000 0.00000 0.00000 0.00000La Community College District 0.02212 0.02311 0.04031 0.03530 0.03756 0.04454 0.04017 0.03575 0.03596La County Flood Control 0.00000 0.00000 0.00000 0.00000 0.00000 0.00000 0.00000 0.00000 0.00000Metropolitan Water District 0.00430 0.00430 0.00370 0.00370 0.00350 0.00350 0.00350 0.01800 0.02300Mwd Excl. From City Of La Area-2104001 0.00210 0.00210 0.00200 0.00200 0.00180 0.00000 0.00000 0.00000 0.00000San Gabriel Unified 0.09294 0.10070 0.10190 0.08454 0.10523 0.10082 0.11444 0.10684 0.10534San Gabriel Vly Mwd State Water Bond 0.02830 0.02830 0.02830 0.02830 0.02830 0.02830 0.02830 0.00000 0.00000Total Direct & Overlapping (2) Tax Rates 1.18600 1.21002 1.23617 1.22795 1.25518 1.25687 1.25236 1.22617 1.22541
City's Share of 1% Levy Per Prop 13 (3) 0.16425 0.16425 0.16425 0.16425 0.16425 0.16425 0.16425 0.16425 0.16425Redevelopment Rate (4) 1.01800 1.01800 1.01800 1.01800 — — — — — Total Direct Rate (5) 0.28992 0.29311 0.28988 0.26617 0.27638 0.15913 0.15936 0.15958 0.15977
Notes: (1) In 1978, California voters passed Proposition 13 which set property tax rate at a 1.00% fixed amount. This 1.00% is shared by all taxing agencies for which the subject property resides within.In addition to the 1.00% fixed amount property owners are charged taxes as a percentage of assessed property values for the payment of any voter approved bonds. (2) Overlapping rates are those of local and county governments that apply to property owners within the City. Not all overlapping rates apply to all city property owners.(3) City's share of 1% Levy is based on the City's share of the general fund tax rate area with the largest net taxable value within the city. ERAF general fund tax shifts may not be included intax ratio figures. (4) RDA rate is based on the largest RDA tax rate area (TRA) and includes only rate(s) from indebtedness adopted prior to 1989 per California State statute. RDA direct and overlapping ratesare applied onlyto the incremental property values. The approval of ABX1 26 eliminated Redevelopment from the State of California for the fiscal year 2012/13 and years thereafter.(5) Total Direct Rate is the weighted average of all individual direct rates applied by the government preparing the statiscal section information and excludes revenues derived from aircraft.
Beginning in 2013/14 the Total Direct Rate no longer includes revenue generated from the former redevelopment tax rate areas. Challenged to recognized enforceable obligations are assumedto have been resolved during 2012/13. For the purposes of this report, residual revenue is assumed to be distributed to the City in the same proportions as general fund revenue.Source: County of Los Angeles Tax Assessor and the HdL Companies.
CITY OF ALHAMBRADirect and Overlapping Property Tax Rates
(Rate Per $100 Of Taxable Value)Last Ten Fiscal Years
138

Percentage Percentage of total of total
Assessed assessed Assessed assessedvaluation valuation valuation valuation
Elite-TRC Alhambra Community LLC $ 223,968,075 2.48% $ — 0.00%Costco Wholwsale Corporation 36,670,976 0.41% — 0.00%Alhambra Holdings LLC 29,100,248 0.32% — 0.00%CFT NV Development LLC 25,377,600 0.28% — 0.00%Medical Investment Group 24,358,186 0.27% — 0.00%Stanley Sirott Trust 22,373,121 0.25% — 0.00%
21,860,245 0.24% 19,916,667 0.30%Bank Alhambra Property LLC 21,530,675 0.24% — 0.00%1801 Garvey Alhambra Apts LLC 21,336,140 0.24% — 0.00%Kohl's Department Stores Inc 19,695,150 0.22% — 0.00%Office Community LLC 0.00% 178,795,477 2.70%Price Company — 0.00% 32,401,361 0.49%Edwards Theatres Circuit — 0.00% 24,567,240 0.37%Ortel Corporation — 0.00% 16,142,816 0.24%Wayne C. & Millicent J.Tam Trust — 0.00% 15,555,837 0.23%International Extrusion Corporation — 0.00% 14,879,595 0.22%Alhambra Realty LLC — 0.00% 14,680,041 0.22%Alhambra Realty LLC — 0.00% 14,672,550 0.22%Alhambra Hospital Medical — 0.00% 14,296,017 0.22%
Total $ 446,270,416 4.94% $ 345,907,601 5.22%
Source: County of Los Angeles Tax Assessor and the HdL Companies.
CITY OF ALHAMBRAPrincipal Property Taxpayers
Current Year and Nine Years Ago
Home Depot U.S.A. Inc
2018 2009
139

Property Tax Levies and CollectionsLast Ten Fiscal Years
(Unaudited)
Fiscal Taxes Levied Collections inYear ended for the Percent Subsequent Percent
June 30 Fiscal Year Amount of Levy Years Amount (1) of Levy (1)2009 7,714,000 6,790,000 88 582,000 7,372,000 96 2010 7,814,000 7,152,000 92 938,000 8,090,000 104 2011 7,906,000 7,399,000 94 682,000 8,081,000 102 2012 8,169,000 7,649,000 94 508,516 8,157,516 100 2013 8,443,000 8,121,000 96 549,656 8,670,656 103 2014 8,813,808 8,618,285 98 718,398 9,336,683 106 2015 9,364,622 9,097,275 97 219,467 9,316,742 99 2016 9,797,283 9,483,239 97 249,463 9,732,702 99 2017 10,324,492 9,921,353 96 300,537 10,221,890 99 2018 10,758,822 10,155,157 94 399,568 10,554,725 98
(1) The City of Alhambra relies on information provided by the Los Angeles County Tax Assessor which does not clearly identify the yearcollected, thus the percentage of total collections to date to taxes levied for year may exceed 100%
Source: Los Angeles County Tax Assessor.
CITY OF ALHAMBRA
Collected within theFiscal Year of Levy Total Collections to Date
140

Fiscal Year Tax Certificates of Certificates of Total Percentage DebtEnded Allocation Participation/ Assessment Notes, Loan, Capital Lease Contractual Participation/ Primary of Personal Per
June 30 Bonds Lease Revenue Bonds Bonds and Advances Obligations Obligations Revenue Bonds Loans Government Income Capita
2009 47,179,508 27,582,358 4,710,000 5,542,493 73,851 3,855,831 14,005,740 1,957,812 104,907,593 N/A 1,184 2010 44,057,280 25,861,330 4,355,000 5,075,922 56,343 3,383,508 12,936,093 1,762,031 97,487,507 N/A 1,097 2011 40,805,052 24,061,002 3,980,000 4,572,400 37,941 2,952,079 12,345,749 1,566,250 90,320,473 N/A 1,009 2012 - 22,161,236 3,580,000 4,046,653 18,510 - 11,724,844 1,370,469 42,901,712 N/A 513 2013 - 20,197,309 3,155,000 2,828,396 599,697 - 11,078,098 1,174,688 39,033,188 N/A 463 2014 - 22,552,374 2,705,000 1,827,334 506,338 - 10,400,512 978,907 38,970,465 N/A 460 2015 - 20,549,342 2,225,000 1,613,160 420,265 - 9,695,106 783,126 35,285,999 N/A 416 2016 - 19,251,308 1,715,000 1,390,555 316,289 - 8,984,641 587,345 32,245,138 N/A 372 2017 - 17,868,275 1,175,000 1,159,186 1,201,325 - 7,342,598 391,563 29,137,947 N/A 335 2018 - 16,400,242 605,000 918,708 933,892 - 6,535,085 195,781 25,588,708 N/A 295
N/A - Not available
Source: City of Alhambra Finance Department
Note: Details regarding the city's outstanding debt can be found in the notes to the financial statements.
CITY OF ALHAMBRA
Ratios of Outstanding Debt by Type
Last Ten Fiscal Years
Business-type ActivitiesGovernmental Activities
141

TaxFiscal Year allocation Percent of
Ended bonds assessed PerJune 30 outstanding value (1) capita
2009 47,179,508 0.71% 532 2010 44,057,280 0.65% 496 2011 40,805,052 0.60% 456 2012 — 0.00% — 2013 — 0.00% — 2014 — 0.00% — 2015 — 0.00% — 2016 — 0.00% — 2017 — 0.00% — 2018 — 0.00% —
Source: City of Alhambra Finance Department
General bonded debt is debt payable with governmental fund resources and general obligation bonds recorded in enterprise funds (of which the City has none).
(1) Assessed value has been used because the actual value of taxable property is not readily available in the State of California.
CITY OF ALHAMBRARatios of General Bonded Debt Outstanding
Last Ten Fiscal years
142

PercentGross bonded applicable Net bondeddebt balance to city debt
Overlapping debt:*Metropolitan Water District $ 29,354,442 0.005 $ 1,420 L.A. CCD DS 2003 Taxable Series 2004B 2,115,000 1.135 24,010 L.A. CCD DS 2001 Taxable Series 2004A 31,555,000 1.135 358,219 LA CCD DS 2001, 2008 Series E-1 7,580,000 1.135 86,050 LA CCD DS 2003, 2008 Series F-1 7,575,000 1.135 85,993 LA CCD DS 2008, 2009 Taxable Series B 75,000,000 1.135 851,416
125,000,000 1.135 1,419,027 900,000,000 1.135 10,216,997
LA CCD DS 2008 2012 Series F 205,000,000 1.135 2,327,205 LA CCD DS 2013 REF BONDS 42,305,000 1.135 480,256 L.A. CCD DS 2008 Series G 1,664,870,000 1.135 18,899,969 LA CCD DS 2015 REF Series A 33,270,000 1.135 377,688 LA CCD DS 2015 REF Series B 272,085,000 1.135 3,088,769 LA CCD DS 2015 REF Series C 223,910,000 1.135 2,541,875 LA CCD DS 2008 Series I 175,565,000 1.135 1,993,052 LA CCD DS 2016 Ref Bonds 300,000,000 1.135 3,405,666 LA CCD DS 2016, 2017 SER A 100,000,000 1.135 1,135,222 San Gabriel USD DS 2008 Series A 9,424,370 0.065 6,117 San Gabriel USD DS 2010 Ref Bonds 6,075,000 0.065 3,943 San Gabriel USD DS 2012 Ref Bond Series B 12,348,464 0.065 8,015 San Gabriel USD DS 2008 Series C 2,040,000 0.065 1,324 San Gabriel USD DS 2015 Ref Bond Series A 22,968,437 0.065 14,909 San Gabriel USD DS 2015 Ref Bond Series B 33,425,000 0.065 21,696 Alhambra USD DS 1999 Series A 7,111,121 67.007 4,764,965 Alhambra USD DS 2005 Refund Bonds 4,565,000 67.007 3,058,880 Alhambra USD DS 2008 Series A SFID 15,654,708 67.007 10,489,786 Alhambra USD-Garvey DS 2004 Series B 22,199,695 67.007 14,875,400 Alhambra USD DS 2008 Series B-1 QSCB 8,618,000 67.007 5,774,683
34,315,000 67.007 22,993,530 Alhambra USD-Garvey DS 2016 Ref Series A 12,370,000 67.007 8,288,794 Alhambra USD DS 2005 Refund Bond Series B 23,160,000 67.007 15,518,874
Total overlapping debt 133,113,750 City direct debt:
Certificates of participation/Lease Revenue Bonds $ 16,400,242 Assessment bonds 605,000 Notes, loans, advances 918,708 Capital leases 933,892
Total city direct debt 18,857,842 Total overlapping and direct debt $ 151,971,592
Debt to assessed valuation ratios: Direct debt 0.00%Overlapping debt 1.78%Total debt 1.78%
* This fund is a portion of a larger agency, and is responsible for debt in areas outside the city.
LA CCD DS 2008, 2010 Tax Series DLA CCD DS 2008, 2010 Tax Series E (BABS)
2017/18 Assessed Valuation: $7,474,481,717 After Deducting $1,540,274,682 Incremental Value
CITY OF ALHAMBRADirect and Overlapping Debt
Current Year and Nine Years Ago(Unaudited)
Alhambra USD-Garvey DS 2012 Ref Series A
2018
143

PercentGross bonded applicable Net bondeddebt balance to city debt
Overlapping debt:LA CCD DS 2001 Ser-A 27,815,000 1.132 314,963 LA CCD DS 2003 Ser-B 77,040,000 1.132 872,362 LA CCD DS 2003Taxable Series 2004 B 23,385,000 1.132 264,800
75,105,000 1.132 850,451 432,345,000 1.132 4,895,654 383,000,000 1.132 4,336,897
LA CCD DS 2003, 2006 Series C 308,500,000 1.132 3,493,297 LACC DS 2001, 2008 Ser E-1 276,500,000 1.132 3,130,945 LACC DS 2001, 2008 Taxable Ser E-2 15,000,000 1.132 169,852 LACC DS 2003, 2008 Ser F-1 364,915,000 1.132 4,132,111 LACC DS 2003, 2008 Taxable F-2 425,000,000 1.132 4,812,483
11,087,600 0.027 2,988 6,708,892 0.027 1,808
17,285,000 0.027 4,658 San Gabriel USD DS 2002 Ser 2007 C 10,832,878 0.027 2,919 San Gabriel USD DS 2008 Ser A 20,548,245 0.027 5,537
6,655,561 67.325 4,480,846 33,988,627 67.325 22,882,792
8,785,000 67.325 5,914,488 80,759,695 67.325 54,371,343
Total overlapping debt 114,941,194 City direct debt:
Tax allocation bonds $ 47,179,508 Certificates of participation 27,582,358
Assessment bonds 4,710,000 Notes, loans, advances 5,542,493 Capital leases 73,851 Contractual obligations 3,855,831
Total city direct debt 88,944,041 Total overlapping and direct debt $ 203,885,235
Debt to assessed valuation ratios: Direct debt 0.00%Overlapping debt 2.09%Total debt 2.09%
This report reflects debt which is being repaid through voter-approved property tax indebtedness. It excludes mortgage revenue,tax allocation bonds, interim financing obligations, non-bonded capital obligations, and certificates of participation, unless providedby the city.
Overlapping governments are those that coincide, at least in part, with the geographic boundaries of the city. The percentage ofoverlapping debt applicable is estimated by taxable assessed values. Applicable percentages were estimated by determining theportion of another governmental unit's taxable assessed value that is within the city's boundaries and dividing it by each unit's total taxable assessed value.
LACC DS REF 2001 Series 2005 A
San Gabriel USD DS 2002 Series A
Alhambra USD DS 2004 Ser A
San Gabriel USD DS 2002 Series B
Alhambra USD DS 99 Series-A
Source: City of Alhambra Finance Department and the HdL Companies.
2008/09 assessed valuation: $5,486,867,506 after deducting $1,135,717,526 redevelopment increment.
LA CCD DS 2001 2006 Series B
Alhambra USD DS 2005 REF BDS
CITY OF ALHAMBRADirect and Overlapping Debt
Current Year and Nine Years Ago(Unaudited)
Alhambra USD DS 99 Series B
San Gabriel USD DS 2005 Refunding Bonds
LA CCD DS 2001 Series 2004A
2009
144

2009 2010 2011 2012 2013 2014 2015 2016 2017 2018
Assessed valuation $ 6,782,359,119 6,928,826,683 6,965,885,964 7,126,058,614 7,280,950,652 7,604,031,698 7,954,605,052 7,923,234,585 8,388,253,306 8,835,612,700
Conversion percentage 25% 25% 25% 25% 25% 25% 25% 25% 25% 25%
Adjusted assessed valuation 1,695,589,780 1,732,206,671 1,741,471,491 1,781,514,654 1,820,237,663 1,901,007,925 1,988,651,263 1,980,808,646 2,097,063,327 2,208,903,175
Debt limit percentage 15% 15% 15% 15% 15% 15% 15% 15% 15% 15%
Debt limit 254,338,467 259,831,001 261,220,724 267,227,198 273,035,649 285,151,189 298,297,689 297,121,297 314,559,499 331,335,476
0 0 0 0 0 0 0 0 0 0
$ 254,338,467 259,831,001 261,220,724 267,227,198 273,035,649 285,151,189 298,297,689 297,121,297 314,559,499 331,335,476
0% 0% 0% 0% 0% 0% 0% 0% 0% 0%
Source: City of Alhambra Finance DepartmentCounty of Los Angeles Tax Assessor
CITY OF ALHAMBRALegal Debt Margin Information
Last Ten Fiscal Years
The Government Code of the State of California provides for a legal debt limit of 15% of gross assessed valuation. However, this provision was enacted when assessed valuation was based upon 25% of market value. Effective with the 1981-82 fiscal year, each parcel is now assessed at 100% of market value (as of the most recent change in ownership for that parcel). The computations shown above reflect a conversion of assessed valuation data for each fiscal year from the current full valuation perspective to the 25% level that was in effect at the time the legal debt
i d b h S f C lif i f l l l d i hi
Total net debt applicable to limit
Legal debt margin
Total net debt applicable to the limitas a percentage of debt limit
145

Special WaterFiscal Assessments Tax SystemYear Collections Principal Interest Coverage Increment Principal Interest Coverage Net Revenue Principal Interest Coverage2009 $ 3,206,907 $ 335,000 $ 298,747 5.06 $ 9,928,859 $ 2,910,000 $ 2,185,533 1.95 $ 2,366,819 $ 525,000 $ 594,835 2.11 2010 3,192,399 355,000 277,616 5.05 8,341,468 3,030,000 2,060,451 1.64 1,893,046 550,000 579,043 1.68 2011 3,261,550 375,000 255,259 5.17 8,335,398 3,160,000 1,928,751 1.64 2,394,557 570,000 554,293 2.13 2012 3,435,974 400,000 231,525 5.44 9,117,355 3,285,000 1,797,309 1.79 3,354,406 600,000 519,691 3.00 2013 3,759,533 425,000 206,260 5.96 4,987,232 3,435,000 1,659,108 0.98 1,310,691 625,000 492,319 1.17 2014 3,522,728 450,000 179,463 5.60 6,948,835 (2) 1,394,436 4.98 4,758,713 655,000 463,746 4.25 2015 3,739,405 480,000 150,982 5.93 28,271 2,380,000 871,494 0.01 (3) 2,876,348 680,000 435,025 2.58 2016 3,681,461 510,000 120,663 5.84 5,214,628 2,815,000 1,055,550 1.35 1,774,810 710,000 406,740 1.59 2017 3,565,550 540,000 88,508 5.67 4,221,587 2,935,000 925,875 1.09 1,550,612 745,000 182,329 1.67 2018 3,659,311 570,000 54,512 5.86 4,221,587 3,080,000 775,500 1.09 1,077,803 695,000 186,260 1.22
(1) Through January 31, 2012, the date of dissolution of the Alhambra Redevelopment Agency, tax increment was reported within Governmental Activities. Beginning February 1, 2012, tax increment was reported within the Private Purpose Trust Fund.
(2) Bonds were refunded in December 2013, no principal payments were made in current year on new or refunded bonds.
(3) The Successor Agency to the City of Alhambra received a lesser amount of the increment since the Agency held excess tax increment from prior years which was available to funddebt service payments.
Note: Details regarding the city's outstanding debt can be found in the notes to the financial statements.
Source: City of Alhambra Finance Department
Debt Service
CITY OF ALHAMBRAPledged-Revenue Coverage
Last Ten Fiscal Years
Debt Service Debt Service
Special Assessment Bonds Tax Allocation Bonds (1) Water Revenue Certificates of Participation
146

(2) (2)Personal PerIncome Capita (2) (3)
Calendar (1) (thousands Personal Median UnemploymentYear Population of dollars) Income Age Rate2008 88,614 1,879,363 21,208 — 6.42009 88,846 1,840,621 20,717 36.4 10.02010 89,501 2,066,936 23,094 38.2 10.92011 83,661 2,028,528 24,247 38.7 10.62012 84,240 2,069,861 24,571 39.2 8.02013 84,697 2,131,061 25,161 39.8 6.52014 84,736 2,153,820 25,418 39.8 5.42015 86,782 2,107,510 24,285 40.3 4.42016 86,922 2,178,714 25,065 40.7 3.42017 86,665 2,199,150 25,375 41.0 3.1
Sources: (1) State Department of Finance(2) Estimates based on last available Census (HdL Companies)(3) State of California Employment Development Department
Demographic and Economic StatisticsLast Ten Calendar Years
CITY OF ALHAMBRA
147

Percentage Percentage Number of of Total Number of of Total
Employer Employees Employment Employees Employment
Los Angeles County Public Works 2,000 0.06% 3,600 N/AAlhambra City Schools 1,893 0.06% 2,136 N/AAlhambra Hospital 800 0.03% 600 N/AAlhambra City Hall 632 0.02% 650 N/ACostco 375 0.01% 369 N/AEMCORE Corp 315 0.01% N/A N/AEdison Company 300 0.01% 800 N/AHome Depot 260 0.01% N/A N/AEast LA Regional Center @ The Alhambra 251 0.01% N/A N/AUS Postal Office 250 0.01% N/A N/ATarget 200 0.01% 275 N/AEmpire Maintenance 30 0.00% 420 N/A
N/A - Not available
"Total Employment" as used above represents the total employment of all employers located within City limits.
Source: City of Alhambra Community Development Department and San Gabriel Valley Economic Partnership
2018 2009
CITY OF ALHAMBRAPrincipal Employers
Current Year and Nine Years Ago
148
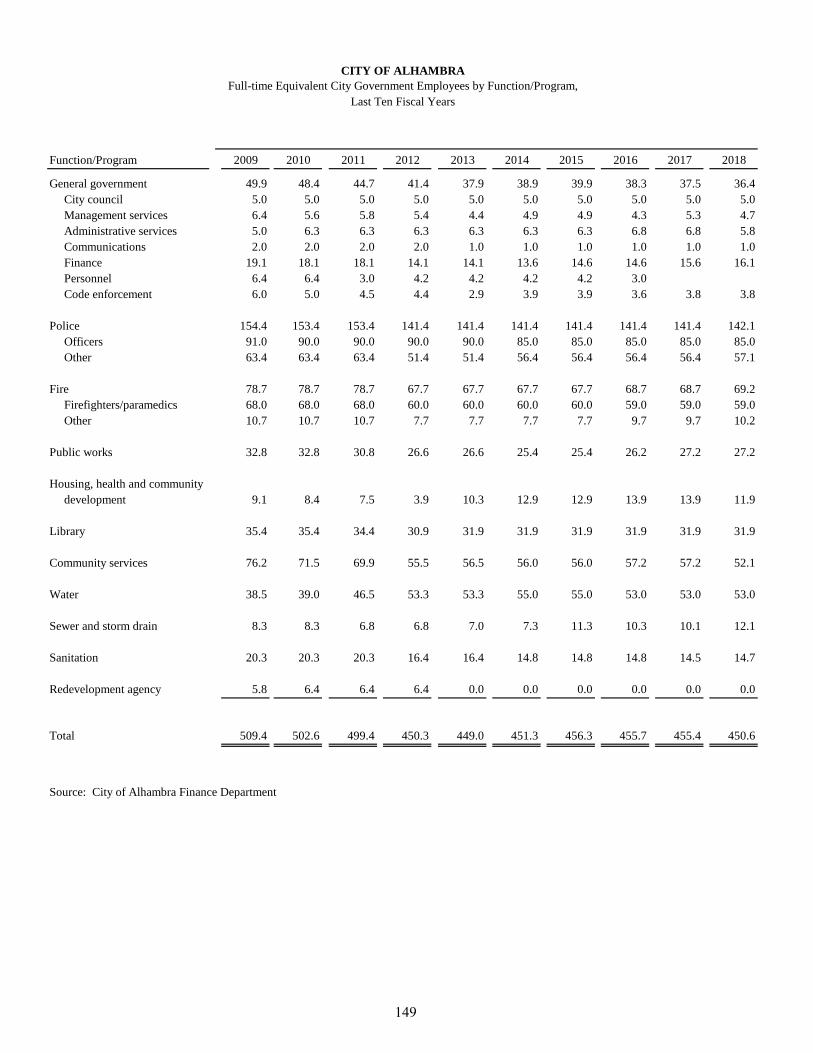
2009 2010 2011 2012 2013 2014 2015 2016 2017 2018
General government 49.9 48.4 44.7 41.4 37.9 38.9 39.9 38.3 37.5 36.4City council 5.0 5.0 5.0 5.0 5.0 5.0 5.0 5.0 5.0 5.0Management services 6.4 5.6 5.8 5.4 4.4 4.9 4.9 4.3 5.3 4.7Administrative services 5.0 6.3 6.3 6.3 6.3 6.3 6.3 6.8 6.8 5.8Communications 2.0 2.0 2.0 2.0 1.0 1.0 1.0 1.0 1.0 1.0Finance 19.1 18.1 18.1 14.1 14.1 13.6 14.6 14.6 15.6 16.1Personnel 6.4 6.4 3.0 4.2 4.2 4.2 4.2 3.0Code enforcement 6.0 5.0 4.5 4.4 2.9 3.9 3.9 3.6 3.8 3.8
Police 154.4 153.4 153.4 141.4 141.4 141.4 141.4 141.4 141.4 142.1Officers 91.0 90.0 90.0 90.0 90.0 85.0 85.0 85.0 85.0 85.0Other 63.4 63.4 63.4 51.4 51.4 56.4 56.4 56.4 56.4 57.1
Fire 78.7 78.7 78.7 67.7 67.7 67.7 67.7 68.7 68.7 69.2Firefighters/paramedics 68.0 68.0 68.0 60.0 60.0 60.0 60.0 59.0 59.0 59.0Other 10.7 10.7 10.7 7.7 7.7 7.7 7.7 9.7 9.7 10.2
Public works 32.8 32.8 30.8 26.6 26.6 25.4 25.4 26.2 27.2 27.2
Housing, health and community development 9.1 8.4 7.5 3.9 10.3 12.9 12.9 13.9 13.9 11.9
Library 35.4 35.4 34.4 30.9 31.9 31.9 31.9 31.9 31.9 31.9
Community services 76.2 71.5 69.9 55.5 56.5 56.0 56.0 57.2 57.2 52.1
Water 38.5 39.0 46.5 53.3 53.3 55.0 55.0 53.0 53.0 53.0
Sewer and storm drain 8.3 8.3 6.8 6.8 7.0 7.3 11.3 10.3 10.1 12.1
Sanitation 20.3 20.3 20.3 16.4 16.4 14.8 14.8 14.8 14.5 14.7
Redevelopment agency 5.8 6.4 6.4 6.4 0.0 0.0 0.0 0.0 0.0 0.0
Total 509.4 502.6 499.4 450.3 449.0 451.3 456.3 455.7 455.4 450.6
Source: City of Alhambra Finance Department
Function/Program
CITY OF ALHAMBRAFull-time Equivalent City Government Employees by Function/Program,
Last Ten Fiscal Years
149

2009 2010 2011 2012 2013 2014 2015 2016 2017 2018
Arrests 2,557 2,154 1,941 1,802 1,768 1,783 1,606 1,813 1,477 1,665 911 calls 21,567 21,441 23,028 29,744 28,983 27,003 25,410 23,527 21,728 21,741
FireNumber of emergency calls in city 4,717 4,717 5,301 4,849 5,505 5,749 5,237 5,807 5,982 6,694 Inspections 1,200 1,037 1,744 1,277 1,677 1,775 1,989 2,729 3,927 701
Street light bulbs replaced 1,379 981 875 902 856 956 952 950 975 988 Concrete repaired - linear feet 18,103 21,559 23,625 22,700 21,777 20,347 20,440 18,568 16,391 11,385 Graffiti abatement - square feet 318,582 145,522 146,830 146,176 104,327 99,050 78,659 73,091 23,983 18,818 Street sweeping miles 27,133 26,570 26,569 26,757 25,131 25,370 23,511 24,555 19,644 19,644 Trees trimmed 6,752 6,359 7,133 6,716 6,211 7,064 6,081 5,960 4,358 7,337
BuildingNumber of residential permits issued 715 741 717 758 712 777 537 602 893 711 Number of commercial permits issued 206 178 181 141 144 206 144 163 197 152
Number of recreation participants (1) 120,185 111,588 191,998 107,032 103,760 93,192 91,825 69,690 81,275 93,526 Number of facility rentals 5,427 5,592 3,644 4,225 1,237 1,536 4,747 4,421 4,189 4,975
101,297 103,033 104,214 102,813 103,182 103,461 103,007 104,291 105,462 105,596 Average daily consumption 13,627,000 12,459,819 12,204,162 12,085,306 12,471,520 12,798,402 11,490,011 10,007,723 10,382,000 10,480,000
16,442 16,763 16,801 16,804 16,832 16,898 16,931 16,639 17,074 17,090 2,550 2,555 2,555 2,555 2,555 2,555 2,555 2,555 2,555 2,555
SanitationNumber of trash pickups 18,877 18,869 18,835 18,807 18,929 18,937 18,958 18,981 19,000 19,021
555,072 548,948 580,332 612,732 589,853 574,543 593,007 550,056 477,963 413,908
LibraryNumber of items circulated 407,709 509,583 511,516 475,386 433,165 409,508 361,747 333,899 290,863 276,685 Number of items catalogued 18,964 21,048 18,276 16,873 18,416 16,959 16,968 15,174 15,518 15,489 Number of questions answered 96,467 107,648 104,154 113,406 114,119 115,177 96,036 101,194 98,187 92,529 Number of registrations 12,524 11,619 10,596 10,355 9,561 9,705 9,323 9,485 8,920 8,451 Children's program attendance 9,810 12,201 15,008 16,279 19,428 11,705 13,059 12,701 12,511 12,970
Golf course77,649 72,029 64,062 64,606 58,735 59,832 55,503 52,930 53,249 52,839
(1) Data collection method revised beginning 2009N/A - Not available
CITY OF ALHAMBRA
Source: City of Alhambra
Community transit ridership
SewerSewer service connectionsLift station inspections
Transit
Golf rounds played
Operating Indicators by FunctionLast Ten Fiscal Years
Meter reads
Parks and recreation
Water
Police
Public works
150

2009 2010 2011 2012 2013 2014 2015 2016 2017 2018
1 1 1 1 1 1 1 1 1 1
Fire4 4 4 4 4 4 4 4 4 4
Street lights 7,000 7,000 7,000 7,000 7,000 7,000 7,000 7,000 7,000 7,000130 130 130 130 130 130 130 130 130 130
Alleys (miles) 16 16 16 16 16 16 16 16 16 16
6 6 6 6 6 6 6 6 6 6BallfieldsCommunity centers 1 1 1 1 1 1 1 1 1 1
Water reservoir tanks 13 12 12 12 12 12 12 12 12 12Reservoir storage (millions of gallons) 27.58 27.58 27.58 27.58 27.58 27.58 27.58 27.58 27.58 27.58Wells 12 12 12 12 12 12 12 12 12 12
130 130 130 130 130 130 130 130 130 130 Storm catch basins 1,101 1,101 1,101 1,101 1,101 1,101 1,101 1,101 1,101 1,101
176,244 176,252 177,109 187,605 187,653 186,687 183,841 184,539 179,821 168,956
LibraryLibraries 1 1 1 1 1 1 1 1 1 1
Golf course1 1 1 1 1 1 1 1 1 1
N/A - Not available
Source: City of Alhambra
Street (miles)
Parks and recreation
TransitTotal community transit route miles
SewerSewer mains (miles)
Parks
CITY OF ALHAMBRACapital Asset Statistics by Function
Last Ten Fiscal Years
Water
Municipal golf courses
Public works
Fire stations
PoliceStations
151