CiteSpace II: Detecting and visualizing emerging trends...
19
JOURNAL OF THE AMERICAN SOCIETY FOR INFORMATION SCIENCE AND TECHNOLOGY, 57(3):359–377, 2006 This article describes the latest development of a generic approach to detecting and visualizing emerging trends and transient patterns in scientific literature. The work makes substantial theoretical and methodological contri- butions to progressive knowledge domain visualization. A specialty is conceptualized and visualized as a time- variant duality between two fundamental concepts in information science: research fronts and intellectual bases. A research front is defined as an emergent and transient grouping of concepts and underlying research issues. The intellectual base of a research front is its citation and co-citation footprint in scientific literature— an evolving network of scientific publications cited by research-front concepts. Kleinberg’s (2002) burst- detection algorithm is adapted to identify emergent research-front concepts. Freeman’s (1979) betweenness centrality metric is used to highlight potential pivotal points of paradigm shift over time. Two complementary visualization views are designed and implemented: cluster views and time-zone views. The contributions of the approach are that (a) the nature of an intellectual base is algorithmically and temporally identified by emergent research-front terms, (b) the value of a co-citation cluster is explicitly interpreted in terms of research-front con- cepts, and (c) visually prominent and algorithmically de- tected pivotal points substantially reduce the complexity of a visualized network. The modeling and visualization process is implemented in CiteSpace II, a Java applica- tion, and applied to the analysis of two research fields: mass extinction (1981–2004) and terrorism (1990–2003). Prominent trends and pivotal points in visualized net- works were verified in collaboration with domain experts, who are the authors of pivotal-point articles. Practical im- plications of the work are discussed. A number of chal- lenges and opportunities for future studies are identified. Introduction Scientific literature is characterized by two distinct cita- tion half-lives of articles: classic articles with persistently high citations and transient ones with their citations peaked within a short period of time (Price, 1965). Transient ones are much more common than classics (van Raan, 2000). The average length of time that a research article continues to be cited in the scientific literature is closely connected to the growth speed of the underlying research area (Abt, 1998). Understanding the dynamics of how transient articles trans- form the intellectual landscape of a scientific field has sig- nificant practical implications for scientists in a wide variety of disciplines. Emergent trends and abrupt changes in the scientific liter- ature can be associated with internal as well as external causes. Typical internal causes include new discoveries and scientific breakthroughs such as the discovery of an impact crater in mass-extinction research or the discovery of a supermassive black hole in astronomy. External ones may provoke scientists to study a subject matter from new per- spectives. For example, the September 11, 2001, terrorist attacks have raised a variety of new issues to be addressed by researchers in national security, health care, posttrau- matic stress disorder (PTSD) research, and many other areas. Detecting and understanding emerging trends and abrupt changes caused by such events in scientific disci- plines can significantly improve the ability of scientists to deal with the changes in a timely manner. It is worth noting that large-scale changes in complex systems characterized by self-organized criticality may take place without apparent triggering events (Bak & Chen, 1991). There is limited evi- dence to suggest that the growth of scientific literature may be connected to self-organized criticality (van Raan, 2000). In this article, we concentrate on changes associated with significant events. The concept of a research front was originally introduced by Price (1965) to characterize the transient nature of a research field. Price observed what he called the immediacy factor: There seems to be a tendency for scientists to cite the most recently published articles. In a given field, a research front refers to the body of articles that scientists actively cite. According to Price, a research front may consist of 40 to 50 recent articles. A research front has been studied in at least CiteSpace II: Detecting and Visualizing Emerging Trends and Transient Patterns in Scientific Literature Chaomei Chen College of Information Science and Technology, Drexel University, 3141 Chestnut Street, Philadelphia, PA 19104-2875. E-mail: [email protected] Received July 26, 2004; revised August 11, 2004; accepted February 7, 2005 © 2005 Wiley Periodicals, Inc. • Published online 14 December 2005 in Wiley InterScience (www.interscience.wiley.com). DOI: 10.1002/asi.20317
Transcript of CiteSpace II: Detecting and visualizing emerging trends...

JOURNAL OF THE AMERICAN SOCIETY FOR INFORMATION SCIENCE AND TECHNOLOGY, 57(3):359–377, 2006
This article describes the latest development of a genericapproach to detecting and visualizing emerging trendsand transient patterns in scientific literature. The workmakes substantial theoretical and methodological contri-butions to progressive knowledge domain visualization.A specialty is conceptualized and visualized as a time-variant duality between two fundamental concepts ininformation science: research fronts and intellectualbases. A research front is defined as an emergent andtransient grouping of concepts and underlying researchissues. The intellectual base of a research front is itscitation and co-citation footprint in scientific literature—an evolving network of scientific publications cited byresearch-front concepts. Kleinberg’s (2002) burst-detection algorithm is adapted to identify emergentresearch-front concepts. Freeman’s (1979) betweennesscentrality metric is used to highlight potential pivotalpoints of paradigm shift over time. Two complementaryvisualization views are designed and implemented:cluster views and time-zone views. The contributions ofthe approach are that (a) the nature of an intellectual baseis algorithmically and temporally identified by emergentresearch-front terms, (b) the value of a co-citation clusteris explicitly interpreted in terms of research-front con-cepts, and (c) visually prominent and algorithmically de-tected pivotal points substantially reduce the complexityof a visualized network. The modeling and visualizationprocess is implemented in CiteSpace II, a Java applica-tion, and applied to the analysis of two research fields:mass extinction (1981–2004) and terrorism (1990–2003).Prominent trends and pivotal points in visualized net-works were verified in collaboration with domain experts,who are the authors of pivotal-point articles. Practical im-plications of the work are discussed. A number of chal-lenges and opportunities for future studies are identified.
Introduction
Scientific literature is characterized by two distinct cita-tion half-lives of articles: classic articles with persistently
high citations and transient ones with their citations peakedwithin a short period of time (Price, 1965). Transient onesare much more common than classics (van Raan, 2000). Theaverage length of time that a research article continues to becited in the scientific literature is closely connected to thegrowth speed of the underlying research area (Abt, 1998).Understanding the dynamics of how transient articles trans-form the intellectual landscape of a scientific field has sig-nificant practical implications for scientists in a wide varietyof disciplines.
Emergent trends and abrupt changes in the scientific liter-ature can be associated with internal as well as externalcauses. Typical internal causes include new discoveries andscientific breakthroughs such as the discovery of an impactcrater in mass-extinction research or the discovery of asupermassive black hole in astronomy. External ones mayprovoke scientists to study a subject matter from new per-spectives. For example, the September 11, 2001, terroristattacks have raised a variety of new issues to be addressedby researchers in national security, health care, posttrau-matic stress disorder (PTSD) research, and many otherareas. Detecting and understanding emerging trends andabrupt changes caused by such events in scientific disci-plines can significantly improve the ability of scientists todeal with the changes in a timely manner. It is worth notingthat large-scale changes in complex systems characterizedby self-organized criticality may take place without apparenttriggering events (Bak & Chen, 1991). There is limited evi-dence to suggest that the growth of scientific literature maybe connected to self-organized criticality (van Raan, 2000).In this article, we concentrate on changes associated withsignificant events.
The concept of a research front was originally introducedby Price (1965) to characterize the transient nature of aresearch field. Price observed what he called the immediacyfactor: There seems to be a tendency for scientists to cite themost recently published articles. In a given field, a researchfront refers to the body of articles that scientists actively cite.According to Price, a research front may consist of 40 to 50recent articles. A research front has been studied in at least
CiteSpace II: Detecting and Visualizing Emerging Trendsand Transient Patterns in Scientific Literature
Chaomei ChenCollege of Information Science and Technology, Drexel University, 3141 Chestnut Street, Philadelphia, PA 19104-2875. E-mail: [email protected]
Received July 26, 2004; revised August 11, 2004; accepted February 7,2005
© 2005 Wiley Periodicals, Inc. • Published online 14 December 2005 inWiley InterScience (www.interscience.wiley.com). DOI: 10.1002/asi.20317

360 JOURNAL OF THE AMERICAN SOCIETY FOR INFORMATION SCIENCE AND TECHNOLOGY—February 1, 2006DOI: 10.1002/asi
three forms: (a) a cluster of co-cited articles (Chen & Morris,2003; Small & Griffith, 1974), (b) a cluster of co-cited articlesand all articles that cite the cluster (Garfield, 1994; Garfield &Torpie, 1964), and (c) a cluster of articles that cite a commongroup of articles (Morris, Yen, Wu, & Asnake, 2003).
The concept of an intellectual base is useful to furtherclarify the nature of a research front (Persson, 1994). If wedefine a research front as the state of the art of a specialty(i.e., a line of research), what is cited by the research frontforms its intellectual base. A specialty can be conceptualizedas a time-variant mapping from its research front to its intellectual base �(t).
The goal of our research is to develop a generic approachthat can be used to detect and visualize emerging trends andabrupt changes in over time. In particular, is agroup of words and phrases (i.e., terms) associated withemerging trends and sudden changes at time t. These terms arecalled research-front terms. �(t) consists of groups of articlescited by articles in which research-front terms were found.The following notions summarize these relations, for exam-ple, Stitle denotes a set of title terms; IsHotTopic (term, t) de-notes a Boolean function, and article0 → article denotes thatarticle0 cites article. In particular, we illustrate the use of thenew approach with two examples; one shows the impact of in-ternal events, and the other shows the impact of externalevents.
The rest of the article is organized as follows. First, wesummarize related work in detecting and visualizing emerg-ing trends and abrupt changes in transient networks as wellas quantitative studies of research fronts. Then we describe anew approach to detecting trends and changes in scientificliterature, especially those due to triggering events. The goalis to enable domain analysts and scientists to identify andunderstand structural and temporal patterns clearly. We illus-trate the new approach with two real-world examples: mass-extinction research (1981–2003) and terrorism research(1990–2003). The resultant research front maps are verifiedwith domain experts. The results also are evaluated byexamining the content of some of the relevant articles.
Detecting and Tracking the Evolution of a Specialty
Researchers have studied quantitative methods that canbe used to identify and track the essence of a research frontas it evolves over time. The transient nature of a researchfront poses challenges for scientists, research policy makers,
∧ article0 � article6
�(t) � 5article | term �°(t) ∧ term � article0
´ Sidentifier ∧ IsHotTopic (term, t)6
°(t) � 5term | term�Stitle ´ Sabstract ´ Sdescriptor
£(t) : °(t) � �(t)
°(t)£(t)
£(t) : °(t) � �(t)
°(t)£(t)
and many others to keep up with the rapid advances of thestate of the art in science. Understanding the dynamics ofa research front is essential for scientists, analysts, anddecision makers to be able to identify emerging trends andsudden changes in the body of scientific knowledge.
Research Fronts and Intellectual Bases
A research front represents the state-of-the-art thinking ofa research field. Price (1965) noticed the interesting ten-dency that the most frequently cited articles tend to be themost recent ones in the citation network of scientific articles.The immediacy effect gives a good explanation of the well-known phenomenon of articles being considered obsoles-cent a few years after their publication. Price described anearlier conjecture made by Burton and Kebler (1960) thatthe periodical literature may be composed of two distincttypes of literature with very different half-lives—the classicand the transient parts. The transient part essentially corre-sponds to what is called a research front. According to Price,“the research front builds on recent work, and the networkbecomes very tight” (p. 515). He estimated about 30 to40 articles published before a citing article would constitutethe research front relative to the citing article. Price arranged200 articles on the N-rays subject chronologically and useda matrix of citations (column articles cite row articles) todepict the research front of the subject, showing that theboundary of the research front was about 50 articles pub-lished prior to the citing article. Clearly, it would be useful ifthe movement of such relatively small networks of articlescan be tracked in the overwhelmingly large body of theliterature.
Typical questions regarding a research front may include:How did it get started? What is the state of the art? What arethe critical paths in its evolution? To address such questions,we need to detect and analyze emerging trends and abruptchanges associated with a research front over time. We alsoneed to identify the focus of a research front at a particulartime in the context of its intellectual base, to reveal signifi-cant intellectual turning points as a research front evolves,and to discover the interconnections between differentresearch fronts.
Researchers studied the evolution of a field of study froma variety of perspectives. Small and Griffith (1974) repre-sented currently activated scientific specialties as clusters ofco-cited articles. The nature of a co-citation cluster was de-termined by word profiles. Suppose an article Di in a clusterhas been cited by K citing articles Di1, Di2, . . . , Dik. The fourmost frequently found words in the titles of Dij’s are selectedto form the word profile of the article Di. By aggregating allthe word profiles within a cluster and selecting the top-Nmost frequent words, one can easily extend the method togenerate an N-word cluster profile. The distinct advantage ofusing such word profiles is its simplicity; however, the first-order word profiles were limited to the titles of the K citingarticles, thus they may not reveal the dynamics of underlyingthemes.

JOURNAL OF THE AMERICAN SOCIETY FOR INFORMATION SCIENCE AND TECHNOLOGY—February 1, 2006 361DOI: 10.1002/asi
Braam, Moed, and Raan (1991) defined a specialty as“focused attention by a number of scientific researchers to aset of related research problems and concepts” (p. 252).They studied the continuity and stability of a specialty interms of the similarity between co-citation clusters acrossconsecutive years. The similarity between two co-citationclusters is determined by comparing aggregated word pro-files of the clusters. They identified a series of similar co-citation clusters over years as different phases of the samespecialty, although they did not present graph-theoretical orother visual representations to illustrate the transformationfrom one phase to another.
In a study of research fronts and intellectual bases basedon articles published in the Journal of the American Societyfor Information Science between 1986 and 1990, Persson(1994) made a distinction between a research front and anintellectual base: “In bibliometric terms, the citing articlesform a research front, and the cited articles constitute anintellectual base” (p. 31). The intellectual base was repre-sented by co-citation clusters. By gradually lowering theco-citation threshold, he demonstrated what he called a step-wise enlargement of the intellectual base—the intellectualbase grew larger as more articles with lower co-citationswere added to the co-citation clusters. Persson found that anintellectual base was remarkably stable over a long period oftime. He noted that the correspondence between research-front clusters and intellectual-base clusters is not self-evident since there is no restriction in terms of what citedarticles were active when the research front was formed. Inthis article, we conceptualize a specialty as a time-variantmapping between its research front and its intellectual base.
Morris et al. (2003) described a timeline visualization ofa research front, defined as groups of articles that consis-tently cited a fixed, time-invariant group of base articles. Theresearch-front articles were clustered based on bibliographiccoupling (Kessler, 1963).
The Special Topics series (http://www.esi-topics.com) isa Web-based service directed by Henry Small at the Institutefor Scientific Information. The series reports scientificresearch areas that have experienced distinct advances interms of citation profiles. The Special Topics series hasdrawn upon decades of work by Small (1977, 1999b, 2003;Small & Griffith, 1974). Clusters of co-cited articles are ex-tracted from each year’s citation data. Clusters from adjacentyears are compared to identify new members as a sign of anemerging trend. The extent to which co-citation clusters inadjacent years overlap with one another provides a meansfor detecting the shift of research focus. Table 1 summarizesrelated work regarding research fronts and intellectual bases.
In this article, we chose not to restrict the citations to afixed, time-invariant intellectual base; instead, we expectthat a specialty’s intellectual base will change over timealong with the movement of its research front. In part, this isbecause we define a research front differently to emphasizeemerging trends and abrupt changes as the defining featuresof a research front. A research front is the domain of a time-variant mapping, and its intellectual base is the co-domain of
the mapping. Our new definition means that now the intel-lectual base of a research front is simply the citation trails ofthe research front in the literature.
Our goal is to determine to what extent the movement ofa research front is coupled with the stability of its intellectualbase. It also is of particular interest to identify what impactexternal events may have on the dynamics of the interrela-tionship between a research front and an intellectual base.For example, how does the discovery of compellingevidence shift the course of a research front?
Detecting Emerging Trends
There is a growing interest in detecting emerging trendsand tracking topics. Some researchers visualize varioustemporal patterns to aid trend detection (Erten, Harding,Kobourov, Wampler, & Yee, 2003), although it is stillcommon to identify a trend based on statistical profiles(Popescul, Flake, Lawrence, Ungar, & Giles, 2000; Roy,Gevry, & Pottenger, 2002).
Research in Topic Detection and Tracking has primarilyfocused on five types of tasks: (a) story segmentation,(b) topic detection, (c) topic tracking, (d) first-story detec-tion, and (e) story-link detection. Roy et al. (2002) surveyedexisting methods for trend detection. Kontostathis, Galitsky,Pottenger, Roy, and Phelps (2003) gave a comprehensivesurvey of trend detection in text data mining.
Allan, Papka, and Lavrenko (1998) described a singlepass algorithm for identifying new stories. Given a newlyreceived story and a collection of existing stories, if the col-lection has no similar stories then the story is identified as anew story. Their algorithm worked well to distinguish storieson the Oklahoma City bombing in 1995 from the earlier oneson the World Trade Center attacks, but it did not single outthe O.J. Simpson trial stories from other court cases.
Swan and Allan (1999) constructed a �2 distribution-based statistical model to determine the significance ofreceived information. They tested their approach with CNNbroadcast news and Reuters newswires, which is a subset ofthe Topic Detection and Tracking pilot study’s corpus.
Text analysis may help to identify the most popular wordsused in articles over a particular period of time. The move-ment of an underlying thematic flow can be captured bythe changes of such words. ThemeRiver (Havre, Hetzler,Whitney, & Nowell, 2002) is a visualization system that usesthe metaphor of a river to depict thematic flows over time ina collection of articles. The thematic changes are shownalong a time line of corresponding external events. A the-matic river consists of frequency streams of terms; thechanging width of a stream over time indicates the changesof term occurrences. The occurrence of an external eventmay be followed by sudden changes of thematic strengths.
Erten et al. (2003) described a temporal graph visualiza-tion of the categorization of articles in ACM conferenceproceedings using their system TGRIP to find the “hottest”topics in computing and identify steadily declining areas aswell as rapidly growing ones. Their category graph consisted

362 JOURNAL OF THE AMERICAN SOCIETY FOR INFORMATION SCIENCE AND TECHNOLOGY—February 1, 2006DOI: 10.1002/asi
Price
Small & Griffith
Braam et al.
Garfield
Persson
Morris et al.
CiteSpace II (thisarticle)
1965
1974
1991
1994
1994
2003
Transient clusters of activelycited recent (30–50) articlesfrom the perspective of a givenciting article
Co-citation clusters
Focused attention to a set ofrelated problems and concepts
Co-citation clusters plus citingarticles
Articles citing the same literature
Groups of articles consistentlyciting a fixed, time-invariantgroup of base articles
Emerging thematic trends andsurges of new topics
Not defined
Not defined
Citation image of aresearch front
Fixed, time-invariantgroups of articles
Co-citation network
Recentness ofcitations
Co-citation
Co-citation
Co-citation
Co-citation
Bibliographiccoupling
Hybrid networksof co-citedarticles andterms citingthese articles.
N/A
Cited articles labeled byword profiles derivedfrom citing articles
Word profiles
Articles labeled by titlewords
Cluster labeled bymanually examined titlewords
Terms from titles,abstracts, anddescriptors of abruptfrequency increase
TABLE 1. Definitions of research fronts and intellectual bases.
Author Year Research front Intellectual base Cluster Labeling
of multiple time slices. Changes between adjacent timeslices were shown as edges weighted in proportion to thecorresponding percent change. Trends in each year wereidentified by the top five title words that have the highest per-centage of use. Words such as design, system, and simulationwere persistently found on the list over time whereas ADA,database, and parallel were listed only for a few years be-fore they disappeared. Their study did not use citation data.
A clustering technique was reported for identifying tem-poral trends in the CiteSeer document database (Popesculet al., 2000). First, influential articles were identified basedon citations to seed clusters. Then, articles co-cited with theseeding article of a cluster were assigned to the cluster. Thesimilarity between two clusters was determined by articlesthey have in common. Clusters were characterized by mostfrequently used title words in member articles.
Identifying and Visualizing Specialties
In traditional co-citation analysis, much of the focus is onindividual clusters of co-cited articles, and few studies haveparticularly examined the interrelationships between specialtyclusters except for the work of Griffith, Small, Stonehill, andDey (1974) and Small (1999a) on disciplinary connections.Griffith et al. (1974) found that between-cluster co-citationlinks tend to be weaker than within-cluster co-citation links.
In a social network, the influence of an actor may dependon how he or she is connected to other members in the net-work. Granovetter (1973) emphasized the strength of weakties. Burt (1992) introduced the concept of structural holes.Within-cluster links are often stronger than between-clusterlinks. The focus of traditional citation-network analysis is on
strong links (i.e., within cluster links). To understand howspecialties and different thematic trends interact with eachother, it is essential to study the nature of long-range, be-tween-cluster links and understand why articles in differentspecialties were connected.
The centrality of a node is a graph-theoretical propertythat quantifies the importance of the node’s position in a net-work. A commonly used centrality metric is the betweennesscentrality (Freeman, 1979). It measures the percentage of thenumber of shortest paths in a network to which a given nodebelongs. Nodes with high-betweenness centrality tend tobe found in paths connecting different clusters. This featurehas been used in community-finding algorithms to identifyand separate clusters (Girvan & Newman, 2002).
Centrality metrics provide a computational method forfinding pivotal points between different specialties or tip-ping points in an evolving network. An advantage of sucha graph-theoretical method is that it is applicable to a widevariety of subject domains because the method is indepen-dent of any domain knowledge. Working with a smallnumber of pivotal points, instead of the entire network, hasseveral desirable practical implications. First, if these piv-otal points characterize the structural and dynamical natureof a domain, the user’s cognitive load would be considerablyreduced. Second, subsequent processing such as automatictext summarization and natural language processingalgorithms can be effectively limited to the small numberof more focused pivotal points. Third, a pivotal-point-based approach extends word-profile-based approachesbecause pivotal points are identified based on their globalgraph-theoretical properties whereas word profiles are basedon first-order frequencies.
JOURNAL OF THE AMERICAN SOCIETY FOR INFORMATION SCIENCE AND TECHNOLOGY—February 1, 2006 363DOI: 10.1002/asi
Citation networks and co-citation networks have beenlong studied in information science and other disciplines.Garfield’s historiography, for instance, is a directed graph ofarticles depicting citation links. HistCite is the most recentexample along this line of research (Garfield, Pudovkin, &Istomin, 2003). In contrast, co-citation networks are undi-rected graphs (Small, 1986; Small & Griffith, 1974). Anearlier example of visualizing co-citation networks is theSCI-Map system developed at the Institute for ScientificInformation. Rather than using the more commonly usedmultidimensional scaling, SCI-Map uses a two-dimensionallayout algorithm based on a geometric triangulation process.The triangulation starts with an arbitrarily chosen article andmaps it to the origin of the coordinate system. Next, it placesthe article that has the strongest co-citation link with the firstarticle. The position of the third article is triangulated usingdistances from the first two positions. The method gives thepriorities to the strongest links. As a result, the networkgrows from the center onward. According to Small (1999b),a drawback of the process is its dependence on the order inwhich objects are assigned. SCI-map scales the radius of anarticle to the cube root of its citation frequency to representthe number of citations as the volume of a sphere.
Link reduction, or network scaling, is a practical chal-lenge in visualizing complex networks such as co-citationnetworks. Real-world co-citation networks often have alarge number of links. Reducing the number of links shownat a time may improve the clarity of a visualized network.
Spatial configurations of multidimensional scaling do notshow links explicitly. In contrast, minimal spanning treesand Pathfinder network scaling (Schvaneveldt, 1990) selecta subset of the original links and form a simplified networkrepresentation. Pathfinder networks were initially adaptedfor author co-citation analysis and subsequently extendedto general co-citation analysis (Chen, 1999; Chen & Paul,2001). Pathfinder network scaling relies on a triangle in-equality test to determine whether a particular link should bepreserved or eliminated. The selection criterion is that asingle-link path’s weight should not exceed that of alterna-tive paths of multiple links. A Pathfinder network is superiorthan a multidimensional scaling in terms of preserving thechronological growth patterns in co-citation networks (Chen& Morris, 2003). Progressive Pathfinder network scaling isthe most recent development for visualizing the evolution ofa knowledge domain over time (Chen, 2004).
Several studies explored techniques for visualizingchanges of bibliographic networks, including a study of theevolution of the AIDS research (Small & Greenlee, 1980).VxInsight, developed at the Sandia National Laboratories,depicts a body of the scientific literature as a three-dimensional landscape (Boyack, Wylie, & Davidson, 2002).It allows users to spot trends over time by using a time-slider.Temporal patterns of the evolution of a three-dimensionalco-citation landscape were animated (Chen & Kuljis, 2003).
CiteSpace is a Java application for analyzing and visual-izing co-citation networks (Chen, 2004). Its primary goal isto facilitate the analysis of emerging trends in a knowledge
domain. It allows the user to take a time series of snapshotsof a domain and subsequently merge these snapshots. Theinitial version of CiteSpace was used to reveal turning pointsin superstring revolutions in physics; however, several is-sues remained unresolved when we implemented the firstversion of CiteSpace. To distinguish the substantial changessince our earlier report (Chen, 2004), we refer to the initialversion as CiteSpace I and the new version as CiteSpace II.Table 2 lists the major improvements in CiteSpace II. Themost distinctive new feature is the combination of computa-tional metrics and visual attributes of pivotal points. Themotivation is to substantially reduce the user’s cognitiveburden as he or she searches for pivotal points in a knowl-edge structure.
New features of CiteSpace II are related to three centralconcepts: burst detection, betweenness centrality, and het-erogeneous networks. A specialty is conceptualized as a map-ping function between a research front and its intellectualbase. This mapping function provides the basis of our con-ceptual framework to accommodate the three concepts.These concepts have instrumental roles in addressing threepractical issues: (a) identifying the nature of a research front,(b) labeling a specialty, and (c) detecting emerging trendsand abrupt changes in a timely manner.
CiteSpace II
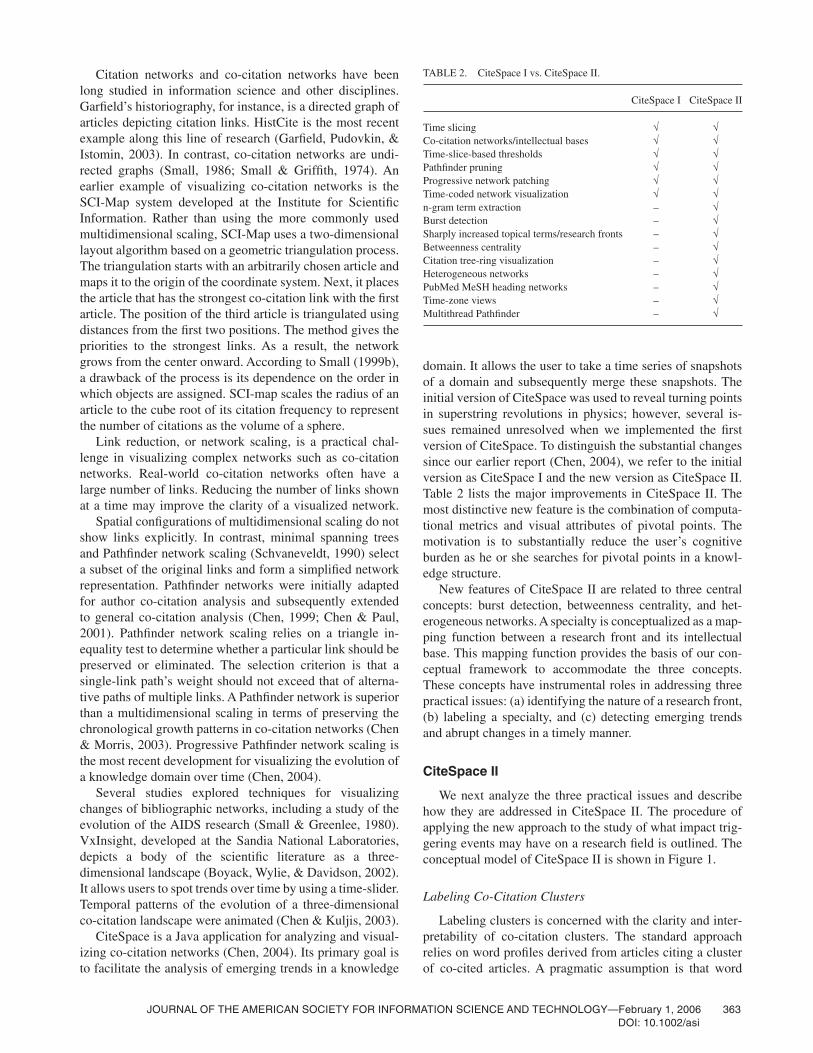
We next analyze the three practical issues and describehow they are addressed in CiteSpace II. The procedure ofapplying the new approach to the study of what impact trig-gering events may have on a research field is outlined. Theconceptual model of CiteSpace II is shown in Figure 1.
Labeling Co-Citation Clusters
Labeling clusters is concerned with the clarity and inter-pretability of co-citation clusters. The standard approachrelies on word profiles derived from articles citing a clusterof co-cited articles. A pragmatic assumption is that word
TABLE 2. CiteSpace I vs. CiteSpace II.
CiteSpace I CiteSpace II
Time slicing √ √Co-citation networks/intellectual bases √ √Time-slice-based thresholds √ √Pathfinder pruning √ √Progressive network patching √ √Time-coded network visualization √ √n-gram term extraction – √Burst detection – √Sharply increased topical terms/research fronts – √Betweenness centrality – √Citation tree-ring visualization – √Heterogeneous networks – √PubMed MeSH heading networks – √Time-zone views – √Multithread Pathfinder – √
364 JOURNAL OF THE AMERICAN SOCIETY FOR INFORMATION SCIENCE AND TECHNOLOGY—February 1, 2006DOI: 10.1002/asi
FIG. 1. The conceptual model of CiteSpace II. Time-sliced snapshots are devised to highlight changes of prominent specialties over time.
profiles characterize the nature of a co-citation cluster be-cause the words are from articles that shape the cluster in thefirst place. Word-profile approaches have drawbacks. First,word profiles may not converge to a focused message.Analysts and users will make a substantial amount of sense-making efforts to synthesize a diverse range of word profiles.Second, cluster labels based on aggregating word profilestend to be too broad to be useful. In practice, many userswould be interested in not only the most commonly usedterms but also terms that can lead to profound changes. Termsassociated with an emerging trend could be overshadowed bya broader and more persistent theme. For instance, a surge ofinterest in health care with reference to the threats of biolog-ical and chemical weapons may be easily outnumbered bythe more dominating terms such as biological weapons.
An ideal labeling method should distinguish emergingtrends and rapid changes at the foreground from more per-sistent themes at the background. Small (1999a) dealt with asimilar situation when he needed to explain the nature ofcross-disciplinary co-citation links. He suggested that a use-ful explanation should distinguish how the articles at the twoends of such a link differ and what they have in common.
Kleinberg’s (2002) burst-detection algorithm can beadapted for detecting sharp increases of interest in a specialty.Although Kleinberg’s original algorithm was developed todetect the bursts of single words, the algorithm is genericenough to be applied to a time series of multiword terms or ci-tations of articles. In CiteSpace II, a current research front isidentified based on such burst terms extracted from titles, ab-stracts, descriptors, and identifiers of bibliographic records.These terms are subsequently used as labels of clusters in het-erogeneous networks of terms and articles.
Improving the Timeliness of VisualizedCo-Citation Networks
Using citing terms to characterize a research front may im-prove our understanding of its intellectual base. Co-citationanalysis traditionally focuses on homogeneous networks of
co-cited articles. Newly published articles tend to be under-represented in such networks because they may not haveenough citations. In addition, word profiles are not normallyregarded as part of a co-citation network. Burst-detectionalgorithms can identify emergent terms regardless of howmany times their host articles are cited. Therefore, a newresearch front can be featured in the “big picture” even beforeit attracts enough citations.
In addition to the standard force-directed view, CiteSpaceII supports a time-zone view to highlight temporal patternsbetween a research front and its intellectual base.Atime-zoneview consists of an array of vertical strips as time zones. Thetime zones are arranged chronologically from left to right sothat a research front points back to its intellectual base. Thelayout algorithm is a modified spring embedder algorithmsuch that the horizontal movement of an item is restricted toits own time zone, but its vertical movement is completely de-termined by its connections to items in other time zones. Thegoal is to make a specialty easily recognizable. The design ofa time-zone view resembles the overall layout of time-line vi-sualization (Morris et al., 2003). In terms of the major differ-ences, time-zone views in CiteSpace II simultaneously showcited articles and citing terms to highlight the mapping be-tween a research front and its intellectual base.
Computationally Identifying Pivotal Points
We assume that transitions between transient researchfronts are traceable in terms of citations and co-citations. As-sume a are b are prominent research fronts at time t andt � ∆t, with corresponding landmark articles a and b in theirintellectual bases �a� ( a) and �b� ( b). Two clus-ters of co-cited articles would emerge; a would be the centerof one and b would be the center of the other. Articles onpaths exclusively connecting the two clusters {p(i)} charac-terize the transition from a to b. We refer to such {p(i)}as pivotal points, turning points, or tipping points.
In CiteSpace I (Chen, 2004), users only have one wayto identify pivotal points by visually scanning a visualized
°°
°£°£
°°

JOURNAL OF THE AMERICAN SOCIETY FOR INFORMATION SCIENCE AND TECHNOLOGY—February 1, 2006 365DOI: 10.1002/asi
network for nodes that bridge different clusters.An advantageof this approach is that no additional computing is required;however, a drawback is that users have no way to ensure thatall the important pivotal points are found except by doing abrute-force visual search of all nodes in the network.
CiteSpace II makes it easier for users to identify pivotalpoints. In addition to inspecting salient visual attributes, theuser easily can see nodes with high betweenness centrality(Freeman, 1979). Pivotal points are computationally identifiedand rendered so that they become preattentative, or pop out, inthe visualized network. Pivotal points are highlighted in thedisplay with a purple ring so that they stand out in a visualizednetwork. Graph-theoretically identifiable pivotal points allowus to reduce networkwide operations to the subset of pivotalnodes only to improve the interpretability of the network.
Procedure
The procedure of using CiteSpace II is described in thefollowing steps, followed by illustrative examples to demon-strate the new features.
1. Identify a knowledge domain using the broadest possibleterm. This is to ensure that subsequent analysis covers allmajor components of a knowledge domain (e.g., massextinction).
2. Data collection: Currently, the primary source of data isthe Web of Science. CiteSpace II also allows users todownload bibliographic records directly from PubMed, aprimary repository of medical literature. The topicalterms identified in the first step are used to retrieve bibli-ographic records from the Web of Science, includingtitles, abstracts, and cited references. Each bibliographicrecord represents a citing article whereas a cited refer-ence included in each record is called a cited article.
3. Extract research front terms: CiteSpace II first collectsn-grams, or terms, from titles, abstracts, descriptors, andidentifiers of citing articles in a dataset. The present study
used single words or phrases of up to four words. Forexample, terrorism and posttraumatic stress disorder arevalid terms. Research-front terms are determined by thesharp growth rate of their frequencies.
4. Time slicing: In CiteSpace II, users specify the range of theentire time interval and the length of a single time slice.
5. Threshold selection: CiteSpace II allows users to specifythree sets of threshold levels for citation counts, co-citation counts, and co-citation coefficients. The specifiedthresholds are applied to three time slices, namely theearliest slice, the middle one, and the last one. Linearinterpolated thresholds are assigned to the rest of slices. Inthis study, bipartite networks of research-front terms andintellectual base articles were constructed. Such networkscontain three types of links: (a) co-occurring researchfront terms, (b) co-cited intellectual base articles, and (c) aresearch-front term citing an intellectual base article.
6. Pruning and merging: Pathfinder network scaling is the de-fault option in CiteSpace II for network pruning (Chen,2004; Schvaneveldt, 1990). Users choose whether to applythe scaling operation to individual networks. Pathfindernetwork scaling is an asymptotically expensive algorithm.CiteSpace II implements a concurrent version of the algo-rithm to process multiple networks simultaneously, whichsubstantially reduces the overall waiting time. NetworksGi � (Vi, Ei) and Gj � (Vj, Ej) from different time slicesmay have overlapping vertices and edges, i.e., Vi ∩ Vj � ∅and Ei ∩ Ej � ∅. CiteSpace II merges individual networksby taking a set union of all the vertices and selecting linksthat do not violate a triangle inequality condition inoverlapping areas between networks. Users can choosewhether to prune the merged network as a whole.
7. Layout: CiteSpace II supports a standard graph view anda time-zone view.
8. Visual inspection: CiteSpace II enables users to interactwith the visualization of a knowledge domain in severalways. The user may control the display of visual attrib-utes and labels as well as a variety of parameters used bythe underlying layout algorithms. Figure 2 illustrates thevisual attributes of an article node.
FIG. 2. Citation tree rings represent the citation history of an article. The color of a citation ring denotes the time of corresponding citations. The thicknessof a ring is proportional to the number of citations in a given time slice. The small number next to the center of a node is the citations throughout the entiretime interval.

366 JOURNAL OF THE AMERICAN SOCIETY FOR INFORMATION SCIENCE AND TECHNOLOGY—February 1, 2006DOI: 10.1002/asi
9. Verify pivotal points. The significance of a marked piv-otal point can be verified by asking domain experts (e.g.,authors of pivotal-point articles) and/or examining theliterature (e.g., passages containing citations of a pivotal-point article). A particularly interesting direction of re-search is the development of tools that can automaticallysummarize the value of a pivotal point. Digital libraries,automated text summarization, machine learning, andseveral other fields are among the most promisingsources of input.
Case Studies
We demonstrate the new features of CiteSpace with casestudies of two research fields: mass-extinction research(1981–2003) and terrorism research (1990–2003). Bothfields have experienced profound changes as a result of trig-gering events.
Mass-extinction research (1981–2003). Five major massextinctions have taken place on Earth in the past. Themost widely known mass extinction is the K-T extinctions65 million years ago, which led to the extinction of di-nosaurs. Causes of mass extinctions have been debated bycatastrophists and gradualists. Catastrophists stress therole of catastrophic events in triggering mass extinctionswhereas gradualists believe that mass extinctions in gen-eral are a prolonged process and that no single event candetermine the course of mass extinctions. The most fa-mous catastrophic theory is known as the impact theory,proposed in the early 1980s to explain the K-T extinctions(Alvarez, Alvarez, Asaro, & Michel, 1980). According tothe theory, a gigantic asteroid hit the earth and led to theextinctions of many species. The impact crater was identi-fied in 1990. The goal of this case study was to see towhat extent emerging trends and sudden changes can bedetected with reference to specialties associated with theimpact theory.
There are several key questions to be answered by the casestudy. What is the latest research front in mass-extinctionresearch? How did the impact-theory research front evolveover the last 20 years? What are the “hottest” research-frontterms? Which articles are associated with these terms?
The input data for CiteSpace II were retrieved from cita-tion index databases via the Web of Science based on a topicsearch for articles published between 1981 and 2003 onmass extinction. The scope of the search included four topicfields in each bibliographic record: title, abstract, descrip-tors, and identifiers. The search was limited to articles inEnglish only. The resultant dataset contains a total of 771records. A total of 333 research-front terms were detectedfrom the four topic fields of these records. The 23-year timespan between 1981 and 2003 was divided into twelve 2-yeartime slices. Three sets of threshold levels, namely citationthreshold (c), co-citation threshold (cc), and co-citationcoefficient threshold (ccv), were set as follows: (2, 1, 10),(3, 1, 0), and (3, 2, 10).
Terrorism research (1990–2003). The 1995 OklahomaCity bombing and the September 11, 2001, terrorist attacksare among the most traumatic terrorism events. Unlike themass-extinction case, each event may alter the course ofresearch. How did the research community respond to suchevents and ramifications? What are the emerging researchfronts in this field of research? How are they related toearlier research fronts?
The terrorism research (1990–2003) dataset consists of1,776 records resulted from a topic search on terrorism inthe Web of Science. A total of 1,108 research-front termswere found. The entire time interval of 1990 to 2003 was di-vided into seven 2-year slices. The seven corresponding net-works were subsequently merged into a panoramic networkto depict the changes of dominating research issues over theentire 14-year time span. CiteSpace II configurations aresummarized in the next section.
Results
This section is organized in two parts: mass extinction(1981–2004) and terrorism (1990–2003). The followingnotations are used: D—a set of articles, T—a set of terms,G(T1, T2, . . . ,TN)—a multipartite network of node types{T (k)}, for example, G(D) and G(T, D), �{Gi}—a networkmerged from snapshot networks {Gi}, � is the mergeoperation, and PF(G)—a Pathfinder network of G.
Mass Extinction (1981–2004)
We describe four visualizations of the mass-extinctiondataset produced by four configurations in CiteSpace II: (a) amerged network of co-cited articles �{Gt(D)}, (b) a mergednetwork of Pathfinder-pruned individual co-citation net-works �{PF(Gt(D))}, (c) a Pathfinder-pruned hybridnetwork PF(G(T, D)), and (d) the Pathfinder-pruned hybridnetwork PF(G(T, D)) shown in time-zone view.
Table 3 shows the first configuration for a 515-articleco-citation network �{Gt(D)}. Note that no articles wereselected from the first two slices. It took less than 10 secondsto complete the process in CiteSpace II.
The most prominent article in the visualization isAlvarez-1980. It was this article that first introduced the im-pact theory (see Figure 3). The central area was surroundedby five densely connected clusters. In CiteSpace II, the usercan select a cluster of items and find matching records inPubMed. Medical Subject Headings (MeSH) assigned tomatched articles were ranked by their occurrences so thatthey serve as labels of the selected cluster. The number at thecorner of each rectangle in Figure 3 is the number of articlesin the selected region. For example, MeSH term GeologicSediments was assigned to 8 of the 100 selected articles.Since PubMed primarily covers the medical literature, de-pending on the subject domain, articles in a visualized net-work may or may not have matching records in PubMed.
This �{Gt(D)} network is the result of merging severaltime-slice networks. Co-citation networks do not explicitly

JOURNAL OF THE AMERICAN SOCIETY FOR INFORMATION SCIENCE AND TECHNOLOGY—February 1, 2006 367DOI: 10.1002/asi
TABLE 3. The construction configuration for a 515-article co-citation network.
2-year slices c cc ccv No. Articles No. Nodes No. Links
1981–1982 2 1 0.15 64 0 01983–1984 2 1 0.19 27 0 01985–1986 2 1 0.23 163 7 141987–1988 2 2 0.28 205 8 161989–1990 2 2 0.32 331 7 101991–1992 2 2 0.36 1,687 123 3531993–1994 3 3 0.40 2,004 31 591995–1996 3 3 0.38 2,908 47 301997–1998 3 3 0.36 4,503 142 5221999–2000 3 3 0.34 5,994 156 4362001–2002 3 3 0.32 7,431 300 1,1812003–2004 4 4 0.30 7,092 101 243
Total 32,409 922(515) 2,864
feature research fronts; rather, they represent the footprint ofa research front. As a result, such networks do not readilylend themselves to answer questions such as: “Why did aparticular cluster of co-cited articles emerge? Which re-search front is being involved?”
The second configuration generated a 541-article network�{PF(Gt(D))}, merging individual Pathfinder networks ofco-cited articles. In addition, lower threshold levels were as-signed to the earlier time slices. It took 24.6 seconds to com-plete the process. The results are summarized in Table 4.
The lower threshold levels increased the number ofselected articles in the 1981–1982 and 1983–1984 slices,although these newly selected articles were cited only oncein the dataset. These articles were not selected by the firstconfiguration. These articles appeared to be widely co-cited.In 1981–1982, 1,555 co-citation links were found among62 articles. Similarly, 2,964 co-citation links were foundamong 156 articles in 1985–1986.As shown in Figure 4, thesearticles are essentially one or two co-citation links away fromAlvarez-1980 (Alvarez et al., 1980). The cluster located to the
right of the visualization was apparently formed recentlybecause the prevalent red rings in this cluster indicate thatthey were cited in 2003–2004. Highly cited articles in thiscluster include Bowring-1998, Renne-1995, Hallam-1997,and Wignall-1992. Raup-1982 is the second most highlycited article in the older cluster centered at Alvarez-1980.
The third configuration specifies a hybrid network ofresearch-front terms and intellectual-base articles. The mostrecent cluster is positioned as the upper cluster in Figure 5.This cluster includes research-front terms such as LateFrasnian, Atomospheric CO2, and carbon cycle. The cen-tral area is associated with research front terms such asCretaceous-Tertiary Boundary and Late Cretaceous, whichare the key concepts of the impact theory.
In addition to the three visualizations, a time-zone view isshown in Figure 6, which emphasizes the temporal relation-ships. The time-zone view reveals three remarkable clustersstretched over time. Each cluster corresponds to a specialty inmass-extinction research. The lowest major cluster in themap, full of green lines if shown in color, is the K-T extinction
FIG. 3. A 515-node network of co-cited articles on mass extinction (1981–2004) based on twelve 2-year slices. Five clusters and the central area are markedby MeSH terms assigned to articles in individual clusters. MeSH terms were retrieved from PubMed on demand. The number at the corner of each rectangleis the number of articles found in the cluster. The youngest cluster is a 100-article cluster in the lower left of the visualization.

368 JOURNAL OF THE AMERICAN SOCIETY FOR INFORMATION SCIENCE AND TECHNOLOGY—February 1, 2006DOI: 10.1002/asi
TABLE 4. The second configuration, including Pathfinder pruning and lower threshold levels.
2-year slices c cc ccv No. Articles No. Nodes (unique) No. Links
1981–1982 1 1 0.35 64 62 1,5551983–1984 1 1 0.35 27 26 3251985–1986 1 1 0.35 163 156 2,9641987–1988 2 2 0.35 205 8 161989–1990 2 2 0.35 331 7 101991–1992 2 2 0.35 1,687 123 3531993–1994 3 3 0.35 2,004 31 601995–1996 3 3 0.35 2,907 47 301997–1998 3 3 0.35 4,497 142 5231999–2000 4 4 0.35 5,990 59 682001–2002 4 4 0.35 7,427 145 3642003–2004 5 5 0.35 7,091 53 93
Total 32,393 859(541) 6,361
FIG. 4. The network of 541 co-cited articles based on 12 Pathfinder-pruned snapshot networks. The first three slices now present in the visualization. Themost prominent cluster (i.e., the cluster to the right) also is the most recent one.
FIG. 5. A 569-node hybrid network of cited articles and citing terms (Time taken � 28 s).

JOURNAL OF THE AMERICAN SOCIETY FOR INFORMATION SCIENCE AND TECHNOLOGY—February 1, 2006 369DOI: 10.1002/asi
FIG. 6. A time-zone view of mass-extinction research, showing three prominent lines of research: the K-T extinction thread (the second-lowest cluster), theLate Frasnian extinction thread (the middle cluster), and the Permian extinction thread (the upper cluster).
debate thread. Starting with Alvarez-1980, this thread main-tained a strong presence for the next 10 years until it started todiminish in 1991–1992 and disappeared from the map after1995–1996. Many articles in this cluster were still cited in2003–2004, as indicated by the color of their outmost rings ofcitations. The most recent research-front terms include NorthAmerica, fossil record, and Late Cretaceous.
The middle cluster, consisting of yellow links, started be-fore the 1980s and ended in 1997. The thread contains arti-cles Johnson-1985 and Copper-1986. The size of this threadis smaller than the K-T extinction thread. Because the threadhas a research-front term Late Frasnian, we call it the Late-Frasnian thread. On a geological scale, the Frasnian Age ispart of the Late Devonian Period between 386 and 375 mil-lion years ago. Late Devonian mass extinction is one of thefive major mass extinctions at the boundary between theFrasnian and Famennian ages. Explanations for this massextinction include an episode of global cooling, and associ-ated lowering of sea level, and Meteorite impacts.
The cluster near the top of the map is predominated byorange links, representing an evolving thread. It started withWignall-1992 (Wignall, 1992), reinforced by Bowring-1998, and recently added Becker-2001 (Becker, Poreda,Hunt, Bunch, & Rampino, 2001). Permian-Triassic-boundary and South China are two research-front terms de-tected in 2001. Becker-2001 is entitled “Impact Event at thePermian-Triassic Boundary.” A simple search on the Web for“Becker, Permian, and Triassic” confirmed that Becker-2001presented evidence for a major impact associated with thePermian mass extinction. Becker et al. (2004) published amore recent article in Science entitled “Bedout: A PossibleEnd-Permian Impact Crater Offshore NorthwesternAustralia.” Bedout is the name of a crater. Its significanceto the Permian mass-extinction research is expected to be
comparable to that of the Chicxulub crater to the K-T impacttheory. The discovery of the Chicxulub crater dramaticallyboosted the credibility of the K-T impact theory. Encouragedby the successful puzzle-solving experience, many scientistsappear to have adapted the same approach to solve a differ-ent puzzle—by applying the impact theory to an earlier massextinction. Finding the impact crater is the next logical step.Identifying a Permian-Triassic boundary impact crater hasattracted the attention of many researchers. It was in thiscontext that the current research front has emerged.
The time-zone visualization along with three questions(see Figure 7) were sent to Dr. Paul Wignall at Leeds Univer-sity in the United Kingdom to verify the aforementionedobservation because he authored two pivotal-point articles inthe Permian extinction thread (Wignall & Hallam, 1992;Wignall & Hallam, 1993). He confirmed that the K-T extinc-tion debate was slowing down since the mid 1990s becausemuch of the debate was resolved as a result of the discoveryof the Chicxulub impact crater: “Many people still work onthis extinction event but many others have now moved tolook at the end-Permian mass extinction, which is why thereis continued interest in my work.” The research front termLate Frasnian was first found in 1997 in this thread. Inanswering the question of why the thread in the middleappears to come to an end, Wignall explained that the threadwas related to Copper’s work on the Late Devonian massextinction. It has not been an active line of research primar-ily due to the lack of supporting data.
In summary, the time-zone view conveys a picture of thedecade-long trends consistent with the observation of a do-main expert. The K-T extinction thread ended about the timethe Permian extinction thread started to take off. Was it be-cause scientists were encouraged by the outcome of the K-Textinction debate? The recent series of work by Becker et al.

370 JOURNAL OF THE AMERICAN SOCIETY FOR INFORMATION SCIENCE AND TECHNOLOGY—February 1, 2006DOI: 10.1002/asi
FIG. 7. The time-zone visualization along with three questions sent to Dr. Wignall for comment. He is the author of two pivotal-point articles identified inthe visualization.
(2004) indeed bears a considerable amount of resemblanceto the K-T debate in the 1980s, notably the impact theoryand the search for the impact crater. It would be very reveal-ing to track how this thread will evolve in the near future.
Compared with earlier visualizations, the new methods inCiteSpace II have improved the clarity and interpretabilityof visualizations. In our 2002 case study of mass-extinctionresearch (Chen, Cribbin, Macredie, & Morar, 2002), the goalwas to reconstruct the history of a scientific field by visual-izing the evolution of its co-citation network not onlychronologically but also retrospectively. The most cited arti-cle can be identified by the tallest citation bar, and the main-stream specialty can be identified by the color groupingsbased on Principal Component Analysis. Walter Alvarez’s(1997) book was used as the primary source to interpret thethree-dimensional models—a two-dimensional co-citationnetwork as the base map and a one-dimensional citation pro-file. Although three-dimensional models vividly reproduced
the growth of the citation landscape, identifying emergingtrends in such models turned out to be a challenging task.The new visualizations in CiteSpace II enable us to identifynot only groundbreaking articles such as Alvarez et al.(1980) but also critical points in the course of transition fromone specialty to another. Identifying pivotal points purelybased on the topological properties of a network has practi-cal values. For example, one can quickly identify a smallnumber of domain experts and seek their advice on specificissues. In the following example, several domain experts areidentified in this way as part of an in-depth validation of themethod.
Terrorism Research (1990–2003)
Merging seven snapshot networks led to a 335-nodehybrid network of terms and articles. Threshold levels aresummarized in Table 5. It took 8 seconds to build the merged
TABLE 5. The CiteSpace configuration used for visualizing the terrorism research dataset (1990–2003).Threshold levels are set for citations (c), co-citations (cc), and co-citation coefficients (ccv). The number ofarticles in each slice is the total number of articles that were cited within the slice. The number of nodes is thenumber of articles and terms that pass the thresholds. The number of links is the number of links within a slice.
2-year slices c cc ccv No. Articles No. Nodes (unique) No. Links
1990–1991 2 1 0.10 1,455 15 271992–1993 2 1 0.11 1,372 32 1371994–1995 2 1 0.12 1,527 12 191996–1997 2 1 0.14 2,735 109 1,5041998–1999 3 2 0.15 3,037 31 752000–2001 3 2 0.18 5,518 47 2112002–2003 3 2 0.22 18,366 182 649
Total 34,010 428(335) 2,622

JOURNAL OF THE AMERICAN SOCIETY FOR INFORMATION SCIENCE AND TECHNOLOGY—February 1, 2006 371DOI: 10.1002/asi
network in CiteSpace II on an IBM ThinkPad with a1.6 GHz Pentium processor and 1 GB RAM.
CiteSpace II implements a multithread version ofPathfinder to reduce the overall waiting time. When Cite-Space II was configured to extract a Pathfinder network fromeach slice in this example, the process took 20 seconds tocomplete. Given the rich information it represents, this isexpected to be a reasonable trade-off.
The terrorism research map has three prominent clusters(see Figure 8): (a) Cluster A (CA) is body injuries in terroristbombing (upper left, green), containing research-front termsbody injuries and terrorist bombing; (b) Cluster B (CB) is healthcare in response to the threat of biological and chemicalweapons (upper right, yellow-orange), containing terms healthcare and chemical weapons, and (c) Cluster C (CC) is psy-chological and psychiatric impacts of the September 11, 2001,
FIG. 8. Three prominent clusters emerge in the 335-node hybrid network of cited article (intellectual bases) and citing terms (research fronts): CA: bodyinjuries in terrorist bombing (upper left, green), CB: health care systems in response to the threat of mass destructive biological and chemical weapons (upperright, yellow-orange), and CC: psychological-psychiatric impacts of September 11, 2001, terrorist attacks (lower central, orange).

372 JOURNAL OF THE AMERICAN SOCIETY FOR INFORMATION SCIENCE AND TECHNOLOGY—February 1, 2006DOI: 10.1002/asi
attacks (lower middle, orange), containing the termsSeptember 11, United States, and posttraumatic stress disorder.
CA represents the specialty on body injuries in terroristbombing, especially from surgeons’ perspectives. It includesintellectual-base articles such as Cooper-1983 (Cooper,Maynard, Cross, & Hill, 1983), Frykberg-1988 (Frykberg,Tepas, & Alexander, 1989), and Katz-1989 (Katz, Ofek,Adler, Abramowitz, & Krausz, 1989). CB represents thehealth-care specialty, containing two substructures. Its lefthalf is in bright yellow, and its right half is in orange. The lefthalf includes the term emergency medical, and the right one isdominated by the term health care. Both parts are concernedwith the vulnerability of the health care and emergency sys-tems in response to the potentially massive damages causedby biological and chemical weapons. CA and CB are con-nected via a single pivotal point Mallonee-1996 (Malloneeet al., 1996) (centrality � 55%). The pivotal article reporteda comprehensive study of the casualties caused by the 1995Oklahoma City bombing. It is connected to CA because itdealt with body injuries and casualties in a terrorist bombing.On the other hand, it also is connected to CB because ofthe large number of injuries and casualties caused by theOklahoma City bombing, which is a central concern of CB.
CC represents the specialty that is concerned withpsychological and psychiatric disorders as a result of theSeptember 11, 2001, attacks. The PTSD thread includesa 2001 PTSD survey Schuster-2001 (Schuster et al., 2001), a2002 PTSD survey Galea-2002 (Galea et al., 2002), and a1999 PTSD study of the Oklahoma City bombing North-1999 (North et al., 1999). Galea-2002 and North-1999 alsoare identified as pivotal points. Galea-2002 is the singlebridge between CA and CC whereas North-1999 is the single
bridge between CB and CC. CB and CC are connected by apivotal link between Holloway-1997 (Holloway, Norwood,Fullerton, Engel, & Ursano, 1997) and North-1999.Holloway-1997 resides in CB, which is about the healthcare preparedness in response to possible mass destruc-tive terrorism attacks; the psychological perspective ofHolloway-1997, among other issues, echoes the PTSDaspect of terrorism research. The only other link between CB
and CC is via a single term: United States.The significance of North-1999 in the entire “big picture”
became clearer as we examined the context of its citations.At a glimpse, one can easily and intuitively find articles thatare worth a closer look. In CiteSpace II, users can examinethe details at several levels. At the top level, the labels of themost prominent items are displayed by default. CiteSpace IIprovides a number of interactive controls for users to adjustthe amount of information shown at this level based on var-ious threshold values. At the second level, the user can bringup one-line reference details by a single click on a node inthe network. The user can access further details by a doubleclick on a node.
Figure 9 shows a local view of the overview visualizationin Figure 8. This view shows a number of pivotal points be-tween the three clusters (i.e., CA, CB, and CC) and the titles ofpivotal-point articles. Two of them are associated with the1995 Oklahoma City bombing: Mallonee-1996 on bodyinjuries and North-1999 on PTSD among the survivors. Post-September 11, 2001, studies of PTSD heavily drew upon theexperiences and findings from the Oklahoma City bombing.On the other hand, the research focus shifted from the sur-vivors of the direct blast in the Oklahoma City bombing, asstudied by North-1999, to wider populations. PTSD studies
FIG. 9. Three prominent research fronts in the field of terrorism research.

JOURNAL OF THE AMERICAN SOCIETY FOR INFORMATION SCIENCE AND TECHNOLOGY—February 1, 2006 373DOI: 10.1002/asi
of the September 11 attacks (e.g., Galea-2002; Schlenger-2001), focused on people who were indirectly exposed to theSeptember 11 attacks in New York primarily from the massmedia. CiteSpace II was able to draw our attention to thesignificant connection between North-1999 and Galea-2002 at a specialty level. The precise nature of the connectionwas discovered in a subsequent survey targeted to domainexperts, namely the authors of the pivotal-point articles. Thesurvey results are described in the following section.
We also generated a time-zone view of the terrorism re-search. Due to the limited space, we summarize the majorfindings only. Three major threads emerged. The OklahomaCity bombing thread came to an end in 1997. The mostrecent terms—health care and after September 11—werefound in the research front of bioterrorism. The two termswere first detected in 2003. The PTSD thread was stretchedacross the entire time interval, suggesting that PTSDresearch has a long history despite the fact that it becameprominent in the terrorism research only recently. PTSDresearch studies a broad range of stressors (e.g., triggers ofstress such as natural disasters as well as terrorism). Theevents of September 11 added a new perspective andexpanded the traditional scope of PTSD.
Table 6 lists research-front terms that emerged between1990 and 2003. Terms associated with the September 11,2001, attacks include chemical-weapons and anthrax-vaccine in 2001, New-York and posttraumatic stress disorderin 2002, and health-care and after-September in 2003.Terms associated with the Oklahoma City bombing, includ-ing blast-injuries and federal-building, surged in 1996. Notethat PTSD was spelled out as posttraumatic in 1996, but
as post-traumatic in 2002 after the September 11, 2001,attacks. Mental-health is a closely related concept to PTSD;frequencies of both terms jumped up substantially in 1996after the Oklahoma City bombing.
Evaluations
The nature of identified pivotal points was evaluated intwo ways: (a) a questionnaire to authors of pivotal-pointarticles as domain experts and (b) content analysis of pas-sages in which pivotal-point articles were cited and co-cited.Due to the limited space, we only present the questionnairein this article.
A questionnaire containing four questions was e-mailedto authors of pivotal-point articles. The goal of the evalua-tion was to verify that these pivotal points indeed represent acrucial point in an intellectual transition, a shift of focus, ora change of perspective in the knowledge domain in ques-tion. In the questionnaire, we asked each domain expertabout the significance of their pivotal-point articles and thenature of connections to neighboring pivotal-point articles.The questionnaire was e-mailed to eight domain expertsalong with hyperlinks to high-resolution images. Threeexperts were not reachable because their e-mail addresseswere no longer valid. The remaining five experts replied andanswered all questions. Due to the limited space, we discussone expert’s answers in detail and summarize other experts’answers. Further details are available from the author uponrequest.
Galea-2002 and North-1999 are the two pivotal-pointarticles in the PTSD cluster. Dr. Sandro Galea, the first
Terms Frequency
2003health-care 47after-September 32care-workers 9attacks 8security 7
2002
New-York 111post-traumatic-stress-disorder 70North-Korea 30homeland-security 24international-community 14bin-laden 13health-protection 13
2001
11-september 75chemical-weapons 23America’s-response 20anthrax-vaccine 11
2000
law-enforcement 14task-force 14new-terrorism 7
Terms Frequency
1999biological-weapon(s) 16emergency-medical 11emergency-management 6
1998
organophosphate-poisoning 9
1997
terrorist-bombings 15blast-overpressure 14warfare-agents 10Tokyo-subway 9mass-disaster 8biological-terrorism 7gastrointestinal-tract 6lung-injury 6traumatic-events 6Buenos-Aires 3
1996
blast-injuries (injury) 29mental-health 19posttraumatic-stress 17federal-building 6
Terms Frequency
1995peace-process 10couple-violence 7emergency-room 7common-couple 6sarin-vapor 6major-trauma 5
1994
national-security 8
1993
united-states 21international-news 6criminal-justice 5nuclear-weapons 4
1992
Northern-Ireland 8gulf-war 6political-violence 6United-Kingdom 6blast-loading 5blast-lung 2Iowa-state 2
TABLE 6. Research-front terms surged between 1990 and 2003.

374 JOURNAL OF THE AMERICAN SOCIETY FOR INFORMATION SCIENCE AND TECHNOLOGY—February 1, 2006DOI: 10.1002/asi
author of Galea-2002, provided the following answersregarding Galea-2002.
1. What is the significance of the issue(s) addressed by yourarticle?
I think our article was the first to use a validated instrumentto document psychological disorders that were linked to theSeptember 11 terrorist attacks showing the psychologicalconsequences of terrorism. There was intense interest in theSeptember 11 attacks and our article provided some empiricrationale for the speculation about potential consequences ofthe attacks.
2. What was the major impact or implication of your articleon subsequent research?
There have been a number of articles that have been pub-lished after the September 11 attacks, all discussing in somerespect the psychological consequences of those attacks/potential implications of terrorism. I think our article (a) es-tablished the importance of terrorist events for populationmental health (b) clearly laid out the fact that persons in thegeneral population (not just victims) can have psychologicaldisorders after a mass disaster.
3. Your article has been frequently cited together with thefollowing pivotal points (see details in the table). Couldyou explain the possible nature of such connections?
• North, C.S., et al. (1999) Psychiatric disordersamong survivors of the Oklahoma City bombing.JAMA, 282(8), 755–762.
• Mallonee, S., et al. (1996) Physical injuries and fa-talities resulting from the Oklahoma City bombing.JAMA, 276(5), 382–387.
I think the “real link” is the first of these two articles. TheSeptember 11 attacks were perceived as the “next” big attackafter the Oklahoma City bombing and as such early after theattacks there were a lot of references to Oklahoma City. TheNorth paper was the “standard” paper after the OklahomaCity bombing and as such people inevitably made compar-isons between the two (very different) papers.
4. In your opinion, does your article represent a shift offocus, or a change of perspective?
I think our article identified “everyone in the city” as poten-tially at risk for PTSD after terrorism, this is not an uncontro-versial observation and broadens what people previouslythought of as “exposures” to a disaster. In that regard yes, itrepresents a change in perspective. Subsequent articles haveembraced that perspective, although others have contested it.
Other experts also offered their comments, includingDr. Eric Frykberg on pivotal-point article Frykberg-1988 inCA and Dr. Todd Sandler on pivotal-point article Sandler1983 (Sandler, Tschirhart, & Cauley, 1983). Dr. CarolNorth provided valuable insights and interpretations in a30-minute telephone interview.
Frykberg explained the significance of Frykberg-1988in CA: “as a collective review of hundreds of bombing inci-dents in the literature, it represents the first time to my knowl-edge that the patterns and severity of injury of casualties of
terrorist bombings were analyzed to derive general principlesof management, showing that once patterns were identified,preparation and planning is possible to improve outcome.”Frykberg-1988 introduced a new outcome measure of med-ical management, namely critical mortality, and concludedthat triage is a critical factor in casualty outcome sinceaccurate and rapid identification of that small minorityneeding immediate care is essential to saving lives inimmediate jeopardy.
North-1999 is one of the two pivotal points in the PTSDcluster. North explained in a telephone interview that al-though the PTSD cluster appeared swiftly after the September11 attacks, PTSD research has a long history. Earlier PTSDstudies were associated with the Vietnam War, the Gulf War,and natural disasters such as earthquakes and hurricanes.Terrorism is a relatively new type of stressor in PTSD re-search. The sudden popularity of PTSD in terrorism researchis largely due to a number of PTSD studies after theSeptember 11, 2001, attacks. These studies, along with theearlier PTSD studies of the Oklahoma City bombing, have es-tablished PTSD as a prominent aspect of terrorism research.
North also noted the bioterrorism research front in CB asan active area of research. Since bioterrorism is regarded asa special type of terrorism, lessons learned from terrorismresearch in general could be applicable to bioterrorism. Asshown in a time-zone view, the research-front term health-care in CB belongs to a current and active research front.North also suggested one way to distinguish the prominentPTSD studies in the cluster in terms of the populations theystudied. For example, North-1999 studied the directlyinjured victims at the scene of the Oklahoma City bombing.Galea-2002 sampled from the entire population in Manhat-tan, a much broader population than the immediate victimsat the World Trade Center scene. Schuster-2001 studied theprevalence of terrorism-triggered PTSD in an even broaderpopulation—the entire population across the United States.Schlenger-2002 studied populations increasingly furtheraway from New York.
Discussions and Future Work
CiteSpace II is a system that could be potentially used bya wide range of users, notably scientists, science policy re-searchers, and research students, to detect and visualizeemerging trends and radical changes in scientific disciplinesover time. It can be used to explore the dynamics of a spe-cialty in terms of a time-variant mapping from a researchfront to its intellectual base. The innovative combination ofcomputational and visualization techniques has substantiallysharpened the focus of progressive knowledge domainvisualization techniques initially proposed and implementedin CiteSpace I. The results of the two case studies are en-couraging, especially in light of the validations of domainexperts.
The fully integrated representation of research fronts andintellectual bases in the same network visualization has threepractical advantages. First, using surged topical terms rather

JOURNAL OF THE AMERICAN SOCIETY FOR INFORMATION SCIENCE AND TECHNOLOGY—February 1, 2006 375DOI: 10.1002/asi
than the most frequently occurring title words is particularlysuitable for detecting emerging trends and abrupt changes.In visualized networks, research-front terms are explicitlylinked to intellectual-base articles. This design presents acompact representation of the duality between a researchfront and its intellectual base. Second, research-front termsnaturally lend themselves to be used as labels of specialties.Third, it overcomes a common drawback of word-profile-based labeling approaches. Aggregated word profiles maynot converge to an intrinsic focus. Terms selected based onsudden increased popularity measures are particularlysuitable to characterize a current research front.
The divide-and-conquer strategy has captured thedynamics of evolving specialties efficiently. The ability toidentify pivotal points algorithmically largely reduces users’cognitive load. In this study, we validated the pivotal pointsin terrorism research with domain experts. More compre-hensive evaluative studies are recommended to investigatethe effect of alternative centrality metrics.
The Pathfinder algorithm extracts the most salient patternsfrom a network, but it does not scale well. CiteSpace IIimplements a concurrent version of the algorithm. The con-current Pathfinder algorithm has substantially optimized thenetwork scaling module, although it still took 6,000 secondsto process 14 networks and merge them into a 1,704-node net-work. We also are investigating parallel solutions using clus-ter computing techniques. Currently, an optimal configurationon a single PC is to limit the visualization to a dozen snapshotnetworks of 200 to 300 nodes per network so that the processcan be completed within tens of seconds.
A long-term challenge is to develop a seamless environ-ment in which users can explore the literature of a scientificdiscipline at various levels of granularity. Pivotal points mayserve as users’ signposts and help them to track an evolvingspecialty. Another challenging issue to be addressed is anintegration of citation index and co-citation index with text-processing techniques at the full-text level. Such integra-tions enable users to not only identify important patterns andrelations based on citation indexing but actually access thefirsthand information in original articles. In a sense, this lineof research may fulfill what Vannevar Bush had envisagedin 1945.
In this article, we have described CiteSpace II as a systemdevised to facilitate the study of evolving specialties in theform of a time-variant duality between a research front andits intellectual base. There are several possible directionsto extend the research. For example, the linkage betweenscientific literature and technological inventions, namely be-tween articles and patents, has been a central topic in areassuch as research policy, science and technology indicators,and knowledge diffusion (Carpenter, Cooper, & Narin,1980; Tijssen & Vanraan, 1994); however, much workremains; users need tools that can turn a vast amount of datainto crystal-clear and instructive messages.
An increasingly important link is between governmentfunding agencies and scientists’outputs. Identifying trends inresearch-grant solicitations and awarded grants is vital for
scientists. The ability to identify the connections between afunding trend and an existing intellectual base can substan-tially improve the competitiveness of universities andresearch laboratories. In addition to the horizontal-expansionopportunities, a number of application domains are particu-larly in need of trend detection and topic-tracking tools,including bioinformatics and national security-related areassuch as intelligence analysis.
A far-reaching research agenda is to develop deepknowledge discovery and data-mining techniques and syner-gize with knowledge domain visualization challenges. Thework of Swanson (1986, 1989) on discovering logically re-lated noninteractive literature and hypothesis formation(Smalheiser & Swanson, 1998) is particularly relevant.
Due to the limited access to the full-text version of arti-cles in various sources, we were not able to locate as manyinstances of citation context as we had hoped. This experi-ence raised a practical question concerning the extent towhich analysts need to access the literature. In an idealscenario, one would have access to the full text of all theciting and cited articles from a comprehensive digitallibrary. In reality, the closest sources include the ACMDigital Library and the IEEE Explorer. In an even more re-alistic setting, one would get started with full-text access tojust a few core journals in a field. Open-access repositoriessuch as arXive and CiteSeer would be good testbeds. Infuture work, we plan to extend and tailor our tools to ana-lyze trends in these sources.
Conclusions
In conclusion, the new features introduced to CiteSpaceII for detecting and visualizing emerging trends and abruptchanges in a field of research have produced promising andencouraging results. The major findings are that
• the surge of interest is an informative indicator for a newresearch front;
• using heterogeneous networks of terms and articles provides acomprehensive representation of the dynamics of a specialty;
• research-front terms are informative cluster labels;• citation tree-ring visualizations are visually appealing and
semantically interpretable;• betweenness centrality metrics identify semantically valid
pivotal points.
Challenges and opportunities also are identified in this articlefor future work. In summary, the major challenges are to
• empirically evaluate the strengths and weaknesses of usingburst terms as cluster summaries as opposed to using wordprofiles;
• empirically compare the pivotal points identified by be-tweenness centrality versus points identified by alternativecentrality metrics;
• develop seamlessness environments by adapting andincorporating automated text summarization and naturallanguage-processing techniques in addition to statisticalapproaches so that visual exploration and everyday scientificactivities can be integrated closely;

376 JOURNAL OF THE AMERICAN SOCIETY FOR INFORMATION SCIENCE AND TECHNOLOGY—February 1, 2006DOI: 10.1002/asi
• integrate the visualizations of research fronts and intellectualbases with full-text digital libraries;
• implement and compare trend detection and topic-trackingtechniques;
• expand the work to heterogeneous data types such as patentsand grant awards.
The provision of a tool-like CiteSpace II enables analyststo perform quantitative and qualitative studies of scientific-subject domains more easily. In terms of intellectual contribu-tions, the study shows the potential of a practical tool forimproving our understanding of a research field. The studyalso demonstrates how the experience and findings of thestudy have led to an understanding of more challenges andmore opportunities ahead. By drawing the strengths from mul-tiple disciplines, the research becomes a melting pot to turnotherwise isolated techniques into an integrative environment.
We have demonstrated the potential of an integrative ap-proach to the visualization and analysis of the evolution of afield of research. In particular, we have focused on variouspractical issues concerning detecting emerging trends andabrupt changes in transient research fronts. The encouragingresults indicate that this is a promising line of research withpotentially wide-ranging benefits to users from differentdisciplines.
Acknowledgments
The author is grateful for generous help from Dr. PaulWignall at Leeds University, England, on the mass-extinctionstudy and Dr. Carol North, Professor of Psychiatry,Washington University School of Medicine; Dr. SandroGalea, the Center for Urban Epidemiologic Studies, NewYork Academy of Medicine; Dr. Eric Frykberg, Professor ofSurgery, University of Florida; and Dr. Todd Sandler, Schoolof International Relations, University of Southern California,on the terrorism-research study. The author acknowledges a2002 Citation Research Grant from the American Society forInformation Science and Technology and the Institute forScientific Information. CiteSpace is available at http://cluster.cis.drexel.edu/~cchen/citespace.
References
Abt, H.A. (1998). Why some papers have long citation lifetimes. Nature,395, 756–757.
Allan, J., Papka, R., & Lavrenko, V. (1998). Online new event detection andtracking. Proceedings of ACM SIGIR (pp. 37–45).
Alvarez, L.W., Alvarez, W., Asaro, F., & Michel, H.V. (1980). Extraterres-trial cause for the cretaceous-tertiary extinction. Science, 208(4448),1095–1098.
Alvarez, W. (1997). T. Rex and the crater of doom. New York: VintageBooks.
Bak, P., & Chen, K. (1991). Self-organized criticality. Scientific American,264(1), 46–53.
Becker, L., Poreda, R.J., Basu, A.R., Pope, K.O., Harrison, T.M., Nichol-son, C., & Iasky, R. (2004). Bedout: A possible end-Permian impactcrater offshore of northwestern Australia. Science, 304(5676),1469–1476.
Becker, L., Poreda, R.J., Hunt, A.G., Bunch, T.E., & Rampino, M. (2001).Impact event at the Permian-Triassic boundary: Evidence from extrater-restrial noble gases in fullerenes. Science, 291(5508), 1530–1533.
Boyack, K.W., Wylie, B.N., & Davidson, G.S. (2002). Domain visualiza-tion using VXinsight for science and technology management. Journal ofthe American Society for Information Science and Technology, 53(9),764–774.
Braam, R.R., Moed, H.F., & Raan, A.F.J.v. (1991). Mapping of science bycombined co-citation and word analysis: II. Dynamical aspects. Journalof the American Society for Information Science, 42(4), 252–266.
Burt, R.S. (1992). Structural holes: The social structure of competition.Cambridge, MA: Harvard University Press.
Burton, R.E., & Kebler, R.W. (1960). The “half-life” of some scientific andtechnical literatures. American Documentation, 11, 18–22.
Bush, V. (1945). As we may think. Atlantic Monthly, 176(1), 101–108.Carpenter, M.P., Cooper, M., & Narin, F. (1980). Linkage between basic
research literature and patents. Research Management, 23(2), 30–35.Chen, C. (1999). Visualising semantic spaces and author co-citation
networks in digital libraries. Information Processing and Management,35(2), 401–420.
Chen, C. (2004). Searching for intellectual turning points: Progressiveknowledge domain visualization. Proceedings of the National Academyof Sciences, USA, 101 (Suppl.), 5303–5310.
Chen, C., Cribbin, T., Macredie, R., & Morar, S. (2002). Visualizing andtracking the growth of competing paradigms: Two case studies. Journalof the American Society for Information Science and Technology, 53(8),678–689.
Chen, C., & Kuljis, J. (2003). The rising landscape: A visual exploration ofsuperstring revolutions in physics. Journal of the American Society forInformation Science and Technology, 54(5), 435–446.
Chen, C., & Morris, S. (2003). Visualizing evolving networks: Minimumspanning trees versus pathfinder networks. Proceedings of IEEE Sympo-sium on Information Visualization (pp. 67–74), Seattle, WA: IEEEComputer Society Press.
Chen, C., & Paul, R.J. (2001). Visualizing a knowledge domain’s intellec-tual structure. Computer, 34(3), 65–71.
Cooper, G.J., Maynard, R.L., Cross, N.L., & Hill, J.F. (1983). Casualtiesfrom terrorist bombings. Journal of Trauma, 23(11), 955–967.
Erten, C., Harding, P.J., Kobourov, S.G., Wampler, K., & Yee, G. (2003).Exploring the computing literature using temporal graph visualization(Tech. Rep. TR0304), University of Arizona.
Freeman, L.C. (1979). Centrality in social networks: Conceptual clarifica-tion. Social Networks, 1, 215–239.
Frykberg, E.R., Tepas, J.J., & Alexander, R.H. (1989). The 1983 Beirut Air-port terrorist bombing: Injury patterns and implications for disaster man-agement. American Surgeon, 55(3), 134–141.
Galea, S., Ahern, J., Resnick, H., Kilpatrick, D., Bucuvalas, M., Gold, J., &Vlahov, D. (2002). Psychological sequelae of the September 11 terroristattacks in New York City. New England Journal of Medicine, 346(13),982–987.
Garfield, E. (1994). Scientography: Mapping the tracks of science. CurrentContents: Social & Behavioural Sciences, 7(45), 5–10.
Garfield, E., Sher, I.H., & Torpie, R.J. (1964). The use of citation data in writ-ing the history of science. Philadelphia: Institute for Scientific Information.
Garfield, E., Pudovkin, A.I., & Istomin, V.S. (2003). Why do we need algo-rithmic historiography? Journal of the American Society for InformationScience and Technology, 54(5), 400–412.
Girvan, M., & Newman, M.E.J. (2002). Community structure in social andbiological networks. Proceedings of the National Academy of Sciences,USA, 99, 8271–8276.
Granovetter, M. (1973). Strength of weak ties. American Journal ofSociology, 8, 1360–1380.
Griffith, B.C., Small, H., Stonehill, J.A., & Dey, S. (1974). The structure ofscientific literatures: II. Towards a macro- and microstructure for science.Science Studies, 4, 339–365.
Havre, S., Hetzler, E., Whitney, P., & Nowell, L. (2002). Themeriver:Visualizing thematic changes in large document collections. IEEETransactions on Visualization and Computer Graphics, 8(1), 9–20.
JOURNAL OF THE AMERICAN SOCIETY FOR INFORMATION SCIENCE AND TECHNOLOGY—February 1, 2006 377DOI: 10.1002/asi
Holloway, H.C., Norwood, A.E., Fullerton, C.S., Engel, C.C.J., & Ursano,R.J. (1997). The threat of biological weapons: Prophylaxis and mitiga-tion of psychological and social consequences. Journal of the AmericanMedical Association, 278(5), 425–427.
Katz, E., Ofek, B., Adler, J., Abramowitz, H.B., & Krausz, M.M. (1989).Primary blast injury after a bomb explosion in a civilian bus. Annals ofSurgery, 209(4), 484–488.
Kessler, M.M. (1963). Bibliographic coupling between scientific papers.American Documentation, 14, 10–25.
Kleinberg, J. (2002). Bursty and hierarchical structure in streams. Proceed-ings of the 8th ACM SIGKDD Conference on Knowledge Discovery andData Mining (pp. 91–101), Edmonton, Alberta, Canada: ACM Press.
Kontostathis, A., Galitsky, L., Pottenger, W.M., Roy, S., & Phelps, D.J.(2003). A survey of emerging trend detection in textual data mining. InM. Berry (Ed.), A comprehensive survey of text mining (pp. 185–224).Heidelberg, Germany: Springer-Verlag.
Mallonee, S., Shariat, S., Stennies, G., Waxweiler, R., Hogan, D., & Jordan,F. (1996). Physical injuries and fatalities resulting from the OklahomaCity bombing. Journal of the American Medical Association, 276(5),382–387.
Morris, S.A., Yen, G., Wu, Z., & Asnake, B. (2003). Timeline visualizationof research fronts. Journal of the American Society for InformationScience and Technology, 55(5), 413–422.
North, C.S., Nixon, S.J., Shariat, S., Mallonee, S., McMillen, J.C.,Spitznagel, E.L., & Smith, E.M. (1999). Psychiatric disorders amongsurvivors of the Oklahoma City bombing. Journal of the AmericanMedical Association, 282(8), 755–762.
Persson, O. (1994). The intellectual base and research fronts of JASIS1986–1990. Journal of the American Society for Information Science,45(1), 31–38.
Popescul, A., Flake, G.W., Lawrence, S., Ungar, L.H., & Giles, C.L. (2000).Clustering and identifying temporal trends in document databases.Proceedings of IEEE Advances in Digital Libraries (ADL 2000)(pp. 173–182), Washington, DC.
Price, D.D. (1965). Networks of scientific papers. Science, 149, 510–515.Roy, S., Gevry, D., & Pottenger, W.M. (2002). Methodologies for trend
detection in textual data mining. Proceedings of the Textmine ‘02Workshop at the 2nd SIAM Conference on Data Mining.Retrieved July 1, 2004, from http://www.cse.lehigh.edu/~billp/pubs/ETDMethodologies.pdf
Sandler, T., Tschirhart, J.T., & Cauley, J. (1983). A theoretical analysis oftransnational terrorism.American Political Science Review, 77(4), 36–54.
Schlenger, W.E., Caddell, J.M., Ebert, L., Jordan, B.K., Rourke, K.M.,Wilson, D., Thalji, L., Dennis, J.M., Fairbank, J.A., & Kulka, R.A.(2002). Psychological reactions to terrorist attacks. Journal of theAmerican Medical Association, 288(5), 581–588.
Schuster, M.A., Stein, B.D., Jaycox, L.H., Collins, R.L., Marshall, G.N.,Elliott, M.N., Zhou, A.J., Kanouse, D.E., Morrison, J.L., & Berry, S.H.(2001). A national survey of stress reactions after the September 11,2001, terrorist attacks. New England Journal of Medicine, 345(20),1507–1512.
Schvaneveldt, R.W. (Ed.). (1990). Pathfinder associative networks: Studiesin knowledge organization. Norwood, NJ: Ablex.
Smalheiser, N.R., & Swanson, D.R. (1998). Using Arrowsmith: A com-puter-assisted approach to formulating and assessing scientific hypothe-ses. Computer Methods and Programs in Biomedicine, 57(3), 149–153.
Small, H. (1986). The synthesis of specialty narratives from co-citationclusters. Journal of the American Society for Information Science, 37(3),97–110.
Small, H. (1999a). A passage through science: Crossing disciplinaryboundaries. Library Trends, 48(1), 72–108.
Small, H. (1999b). Visualizing science by citation mapping. Journal of theAmerican Society for Information Science, 50(9), 799–813.
Small, H. (2003). Paradigms, citations, and maps of science: A personalhistory. Journal of the American Society for Information Science andTechnology, 54(5), 394–399.
Small, H., & Greenlee, E. (1980). Citation context analysis and the structureof paradigms. Journal of Documentation, 36(September), 183–196.
Small, H.G. (1977). A co-citation model of a scientific specialty: A longitu-dinal study of collagen research. Social Studies of Science, 7, 139–166.
Small, H.G., & Griffith, B.C. (1974). The structure of scientific literatures:I. Identifying and graphing specialties. Science Studies, 4, 17–40.
Swan, R., & Allan, J. (1999). Extracting significant time varying featuresfrom text. Proceedings of 8th Conference on Information KnowledgeManagement (CIKM ’99) (pp. 38–45), Kansas City, MO: ACM Press.
Swanson, D.R. (1986). Undiscovered public knowledge. Library Quarterly,56(2), 103–118.
Swanson, D.R. (1989). Online search for logically related noninteractivemedical literatures—A systematic trial-and-error strategy. Journal of theAmerican Society for Information Science, 40(5), 356–358.
Tijssen, R.J.W., & Vanraan, A.F.J. (1994). Mapping changes in science andtechnology—Bibliometric co-occurrence analysis of the r-and-d litera-ture. Evaluation Review, 18(1), 98–115.
van Raan, A. (2000). On growth, ageing, and fractal differentiation ofscience. Scientometrics, 47(2), 347–362.
Wignall, P.B., & Hallam, A. (1992). Anoxia as a cause of the Permian/Trias-sic extinction: Facies evidence from northern Italy and the western UnitedStates. Palaeogeography, Palaeoclimatology, Palaeoecology, 93, 21–46.
Wignall, P.B., & Hallam, A. (1993). Griesbachian (earliest Triassic)palaeoenvironmental changes in the salt range, Pakistan and SoutheastChina and their bearing on the Permo-Triassic mass extinction. Palaeo-geography, Palaeoclimatology, Palaeoecology, 102, 215–237.


![Detecting Carbon Monoxide Poisoning Detecting Carbon ...2].pdf · Detecting Carbon Monoxide Poisoning Detecting Carbon Monoxide Poisoning. Detecting Carbon Monoxide Poisoning C arbon](https://static.fdocuments.us/doc/165x107/5f551747b859172cd56bb119/detecting-carbon-monoxide-poisoning-detecting-carbon-2pdf-detecting-carbon.jpg)