Cis 516
12
Availability Distribution
-
Upload
tracythomp -
Category
Technology
-
view
188 -
download
0
Transcript of Cis 516

Availability Distribution

Average Availability

Alarms Graph

Reports Top N Reports Business Views
Servers
Routers
Switches
Top 10 Reports Switches Health ReportA report on top 10 Switches Ports by Rx TrafficIdentify ports with heavy incoming traffic Ports by Tx TrafficIdentify ports with heavy outgoing traffic Ports by Rx ErrorsIdentify ports with most Receive errors
Services
Top 10 Reports HTTP Servers by Response TimeIdentify Web servers with high Response Time SMTP Servers by Response TimeIdentify SMTP servers with high Response Time MySQL Servers by Response TimeIdentify MySQL servers with high Response Time
FTP Servers by Response TimeIdentify FTP servers with high Response Time Telnet Servers by Response TimeIdentify Telnet servers with high Response Time
Domain Controller
Top 10 Reports DCs by CPU UtilizationIdentify busy DCs with high CPU Utilization DCs by Memory UtilizationIdentify overloaded DCs with high Memory Utilization
DCs by Disk UtilizationIdentify overloaded DCs with high Disk Utilization Detailed Reports All DCs Availability ReportGet availability report for all DCss
All Devices
Inventory Reports
Inventory Reports ServersServers Inventory Report DesktopsDesktops Inventory Report All DevicesAll Devices Inventory Report
SNMP Enabled DevicesSNMP Inventory Report Non SNMP DevicesNon SNMP Inventory Report
© Copyright 2003-2007, AdventNet Inc.

Top 10 Reports All Devices by CPU UtilizationIdentify busy devices with high CPU Utilization All Devices by Memory UtilizationIdentify overloaded devices with high Memory Utilization Devices by Disk UtilizationIdentify overloaded devices with high Disk Utilization Interfaces by Rx TrafficIdentify devices with heavy incoming traffic Interfaces by Tx TrafficIdentify devices with heavy outgoing traffic
Interfaces by Rx ErrorsIdentify interfaces with high incoming errors Interfaces by Tx ErrorsIdentify interfaces with high outgoing errors Interfaces by Rx UtilizationIdentify devices with heavy incoming traffic utilization Interfaces by Tx UtilizationIdentify devices with heavy outgoing traffic utilization All Devices Availability ReportGet availability report for all devices
Top 10 Reports Routers Health ReportA report on top 10 Routers Routers by CPU UtilizationIdentify busy routers with high CPU Utilization Routers by Memory UtilizationIdentify overloaded routers with high Memory Utilization Interfaces by Rx TrafficIdentify interfaces with heavy incoming traffic Interfaces by Tx TrafficIdentify interfaces with heavy outgoing traffic

Servers by Rx UtilizationIdentify servers with heavy incoming traffic utilization Servers by Tx UtilizationIdentify servers with heavy outgoing traffic utilization Volumes with Least Free SpaceIdentify disk partitions with least free space Volumes with Most Free SpaceIdentify disk partitions with most free space Detailed Reports All Servers Disk Usage ReportGet partition wise disk usage report for all servers All Servers Availability Report
Interfaces by Rx ErrorsIdentify interfaces with high incoming errors Interfaces by Tx ErrorsIdentify interfaces with high outgoing errors Interfaces by Rx UtilizationIdentify interfaces with high % Receive utilization Interfaces by Tx UtilizationIdentify interfaces with high % Transmit utilization Detailed Reports All Interfaces Availability ReportGet availability report for all interfaces

:
You can discover a specific device using OpManager. This option is useful when you don't want to discover an entire network.
Device Name/IP Address: Type either the IP Address or the Device Name of the device to be discovered. Example: 192.168.4.20.Netmask: Type the correct netmask. Example: 255.255.255.0. Credentials to use: Select appropriate credentials required for the device. Credentials are required for collecting data for various parameters through snmp or wmi/cli protocols. When you choose all credentials, appropriate credentials for the device will be detected automatically and gets mapped to the device.

Discover Devices
Add Device
Services
SNMP Parameters
Credential Settings
Discovery

Home Alarms Admin Reports Support
ServiceDesk Plus
NetFlow Analyzer
OpManager Support
Request Support
Receive technical support for OpManager
Chat
Have a quick chat with OpManager techies for clarifications.
Knowledge Base
Solutions for common problemsTelephone Numbers
+1-888-720-9500 (Toll free)
Need Features?
Think you need a feature in OpManager? Let us know
Jump To

ManageEngine OpManager - Page : 1Availability Report - 70.10.211.151Last 24 hoursAvailability State DiagramAvailability StatisticsOptions Uptime(%)Today 100.0%Yesterday 0.0%Last 7 days 0.0%Last 30 days 0.0%This week 0.0%Last week 0.0%This month 0.0%Last month 0.0%

Availability State Diagram
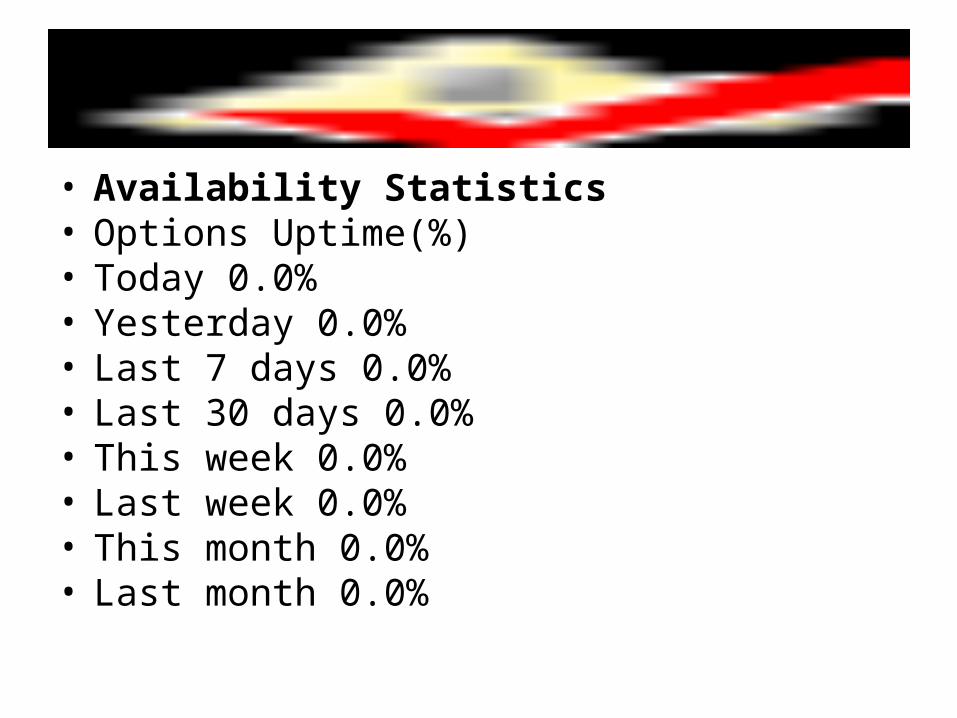
• Availability Statistics• Options Uptime(%)• Today 0.0%• Yesterday 0.0%• Last 7 days 0.0%• Last 30 days 0.0%• This week 0.0%• Last week 0.0%• This month 0.0%• Last month 0.0%