
CHSA - Region IX Update February 23, 2016caheadstart.org/2016 Conference/Len_Opening.pdf · CHSA -...
19
Prepared by Region IX Office of Head Start CHSA - Region IX Update February 23, 2016
Transcript of CHSA - Region IX Update February 23, 2016caheadstart.org/2016 Conference/Len_Opening.pdf · CHSA -...

Prepared by Region IX Office of Head Start
CHSA - Region IX Update
February 23, 2016

Region 9 Office of Head Start | February 23, 2016| California Head Start Association
Today’s Agenda
2016 Budget
EHS-CCP News
Changing Landscape
Regional Office Updates
OHS Monitoring Trends
CLASS

Region 9 Office of Head Start | February 23, 2016| California Head Start Association
FY 2016 Budget
► OHS appropriation at $9.17 billion
► Includes an increase of approximately $570 million for Head Start including: $294 Million to lengthen the program day and year
$135 million to expand Early Head Start, including through Child Care Partnerships.
Cost of Living Adjustment (COLA) for HS/EHS/EHS-CCP grantees
► OHS will release a Program Instruction to provide additional information

Region 9 Office of Head Start | February 23, 2016| California Head Start Association
EHS Expansion and EHS - Childcare
Partnership Grants Forecast
► Estimated FOA post date = May 2, 2016
► Estimated application due date = July 1, 2016
► Estimated award date = February 28, 2017
► http://www.acf.hhs.gov/hhsgrantsforecast/index.cfm?switch=grant.view&gff_grants_forecastInfoID=73942
http://www.acf.hhs.gov/hhsgrantsforecast/index.cfm?switch=grant.view&gff_grants_forecastInfoID=73942
http://www.acf.hhs.gov/hhsgrantsforecast/index.cfm?switch=grant.view&gff_grants_forecastInfoID=73942
http://www.acf.hhs.gov/hhsgrantsforecast/index.cfm?switch=grant.view&gff_grants_forecastInfoID=73942

Region 9 Office of Head Start | February 23, 2016| California Head Start Association
FY2016 OHS Monitoring
http://eclkc.ohs.acf.hhs.gov/hslc/grants/monitoring

Region 9 Office of Head Start | February 23, 2016| California Head Start Association
FY2016 OHS Monitoring
http://eclkc.ohs.acf.hhs.gov/hslc/grants/monitoring

Region 9 Office of Head Start | February 23, 2016| California Head Start Association
Changing Landscape
► Impact of Transitional Kindergarten
► Proliferation of preschool services
► Increased Community Need for Infant / toddler care
Full day services / full year services
► Workforce Development Concerns
Lack of Qualified staff / shortage
Teacher turnover / retention
Comparable teacher salaries
► Quality Services / School Readiness Improved outcomes for children
Alignment with schools
Emphasis on Professional Development / Coaching

Region 9 Office of Head Start | February 23, 2016| California Head Start Association
Percent of California Children Aged 3 and 4
Being Served in Head Start Programs
36.38% 40.05%
43.68%
61.35% 57%
51.02%
0.00%
10.00%
20.00%
30.00%
40.00%
50.00%
60.00%
70.00%
80.00%
90.00%
100.00%
2013 2014 2015
Children Age 3 Children Age 4

Region 9 Office of Head Start | February 23, 2016| California Head Start Association
Enrollment Reductions and Conversions
from 2013 - Present
0
5
10
15
20
25
2013 2014 2015
7
3
10
3
20 23
Slot Reduction Slot Conversion
Region 9 Office of Head Start | February 23, 2016| California Head Start Association
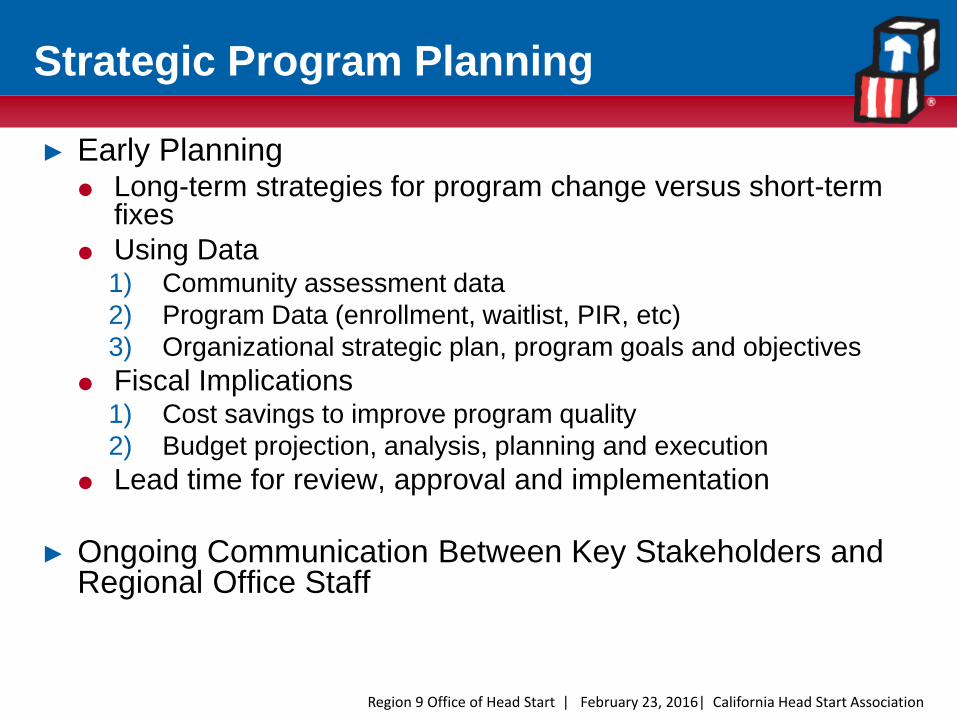
Strategic Program Planning
► Early Planning Long-term strategies for program change versus short-term
fixes
Using Data 1) Community assessment data
2) Program Data (enrollment, waitlist, PIR, etc)
3) Organizational strategic plan, program goals and objectives
Fiscal Implications 1) Cost savings to improve program quality
2) Budget projection, analysis, planning and execution
Lead time for review, approval and implementation
► Ongoing Communication Between Key Stakeholders and Regional Office Staff

Region 9 Office of Head Start | February 23, 2016| California Head Start Association
Regional Office
► Grantee support team includes collaboration between program, fiscal and T/TA
► Regional T/TA system focused on technical assistance using Process Consultation
► GS and ECS jointly support grantees
► Added Health Specialist position- will provide direct support to grantees in the areas of health, child health and safety, and disabilities. Request through your Program Specialist.
► Added Systems Specialist position- will support the Office of Head Start and the Office of Child Care regional offices and TTA staff. Request through your Program Specialist.

Region 9 Office of Head Start | February 23, 2016| California Head Start Association
Number of Final Monitoring Reports – 74 (to date)
Number of Reports without ANCs or Deficiencies – 48
Number of Reports with ANCs – 24
Number of Reports with Deficiencies – 3
Number of Reports with Concerns – 22
FY 2015 Region 9 Monitoring

Region 9 Office of Head Start | February 23, 2016| California Head Start Association
44.7%
3.7%
46.8%
14.8%
0
10
20
30
40
50
60
70
80
90
100
Environmental Health & Safety (47 Final Reports to Date)
Fiscal Integrity & ERSEA(27 Final Reports to Date)
Pe
rce
nta
ge o
f Fi
nal
Re
po
rts
Region 9 Percentage of Final Reports with Cited Areas
Concerns
Non-Compliances & Deficiencies*
FY 2015 Cited Performance Standards
* 3 Areas of Deficiency - Environmental
Health & Safety

Region 9 Office of Head Start | February 23, 2016| California Head Start Association
FY 2015 Cited Performance Standards
Environmental
Health & Safety
1304.22(a)(3); 1304.53(a)(10)(vi,vii,xiv)
The grantee did not ensure exits were clearly visible and evacuation routes and emergency procedures were clearly marked so the path to safety outside was unmistakable. The grantee did not ensure that smoke detectors were tested regularly.
1304.22(c)(1);
1304.22(c)(2);
1304.22(c)(4)
The grantee did not ensure medications were properly stored and administered.
Expired rescue medication was observed in a setting, posing risk to the child if it
did not work when administered.
1304.22(e)(1)(ii-iii) In up to 10% of the program’s settings, proper hand-washing techniques were not
used or hand-washing did not occur at the appropriate times.
1304.22(e)(3-5) Non-porous gloves were not worn by staff when they were in contact with spills
of bodily fluids (e.g. urine, feces, blood, or eye discharge) or all areas exposed to
the spills were not cleaned and sanitized by staff immediately.
In settings in which diapering was observed staff did not practice proper
sanitation and hygiene procedures.
1304.52(i)(l)(iii) The grantee did not ensure all staff abided by the program’s standards of conduct
requiring no child to be left alone or unsupervised while under their care.
1304.53(a)(5) The grantee did not make at least 35 square feet of usable indoors space per child
available for the care of and use by children.
1304.53(a)(7)
The grantee did not provide for maintenance of the facilities – ex: ceiling tiles in
the children’s bathroom were stained and sagged; grantee did not ensure
electrical outlets accessible to children were designed to prevent shock.

Region 9 Office of Head Start | February 23, 2016| California Head Start Association
FY 2015 Cited Performance Standards
Environmental
Health & Safety
Continued
1304.53(a)(10)(viii-x)
1304.53(b)(l)(iii)
In up to 10% of the program’s settings, the program did not provide safe,
clean, and appropriate indoor and outdoor learning environments.
1304.53(g)(4) The grantee did not ensure each teacher working exclusively with infants and toddlers had responsibility for no more than four infants and toddlers, and no more than eight infants and toddlers were placed in any one group.
1305.43(a)(7-8); 1304.53
(a)(7-10)
The grantee did not provide for safety and security of all children by
keeping facilities, materials, and Head Start equipment well maintained,
clean, and in good repair.
1306.32(a)(3, 5) The grantee did not ensure classes serving predominantly: 3-year-old
children maintained an average size between 15 and 17 children; 4 or 5-
year-old children maintained a size between 17 and 20 children.
1310.10(d)(2,4) One or two buses inspected were missing one or more of the following:
safety equipment for use in an emergency, including a charged fire
extinguisher that is properly mounted with a sign indicating its location;
seatbelt cutter and a sign indicating its location.
1310.10 (g) The grantee did not ensure that children are only released to a parent or
legal guardian.
648A(g)(3)(A-C) The grantee did not ensure criminal record checks (CRCs) were conducted
prior to hiring staff.

Region 9 Office of Head Start | February 23, 2016| California Head Start Association
FY 2015 Cited Performance Standards
Fiscal Integrity &
ERSEA
1304.51(h) Reimbursement from USDA/CACFP was reduced due to late or incomplete
reports, or costs were disallowed by USDA/CACFP, but no Head Start funds
were used to cover costs that should have been paid by USDA/CACFP.
1309.54 The grantee did not ensure it maintained compliance with the Davis-Bacon
Act.
230, App A (A)(2)(b) The grantee did not ensure indirect costs claimed were allowable and
conformed to the specific terms of the Nonprofit Rate Agreement.
230, App B (8)(i) The grantee did not ensure incentive compensation paid to employees was
based on individual employee performance, entered in good faith before
services were rendered, and reasonable.
74.23(a)(3) The grantee did not ensure all costs claimed as matching contributions were
necessary and reasonable for the proper and efficient accomplishment of
project or program objectives.
74.23(i)(l) The grantee did not ensure in-kind contributions were documented and
supported by the same methods used by the recipient for its own employees.
Region 9 Office of Head Start | February 23, 2016| California Head Start Association
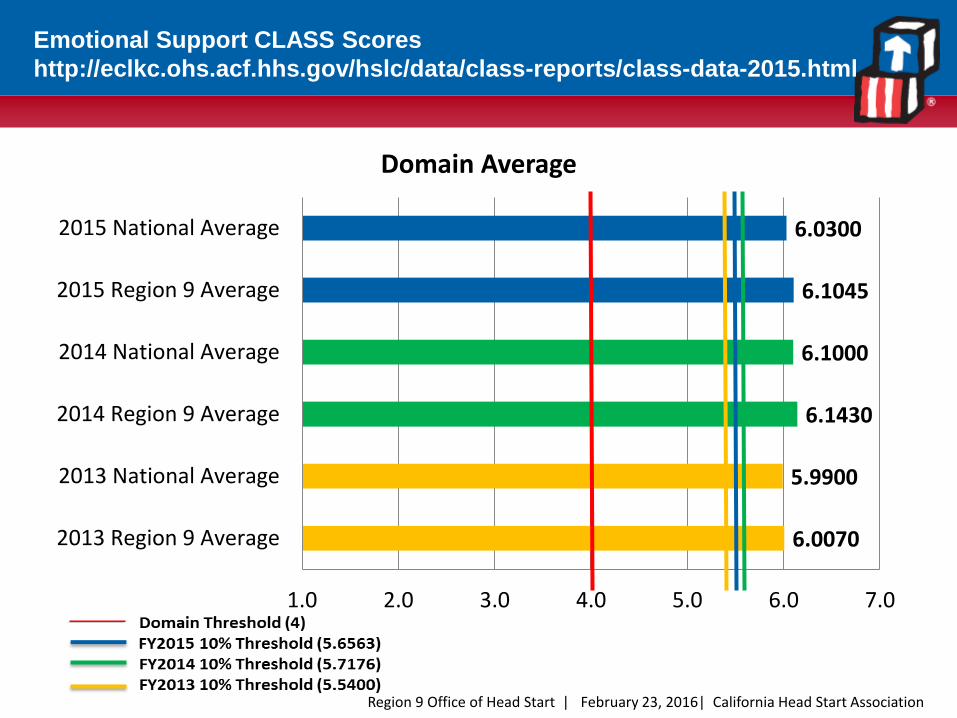
Emotional Support CLASS Scores
http://eclkc.ohs.acf.hhs.gov/hslc/data/class-reports/class-data-2015.html
6.0070
5.9900
6.1430
6.1000
6.1045
6.0300
1.0 2.0 3.0 4.0 5.0 6.0 7.0
2013 Region 9 Average
2013 National Average
2014 Region 9 Average
2014 National Average
2015 Region 9 Average
2015 National Average
Domain Average

Region 9 Office of Head Start | February 23, 2016| California Head Start Association
Classroom Organization CLASS Scores
http://eclkc.ohs.acf.hhs.gov/hslc/data/class-reports/class-data-2015.html
5.6026
5.6300
5.8288
5.8333
5.8687
5.8000
1.0 2.0 3.0 4.0 5.0 6.0 7.0
2013 Region 9 Average
2013 National Average
2014 Region 9 Average
2014 National Average
2015 Region 9 Average
2015 National Average
Domain Average

Region 9 Office of Head Start | February 23, 2016| California Head Start Association
Instructional Support CLASS Scores
http://eclkc.ohs.acf.hhs.gov/hslc/data/class-reports/class-data-2015.html
2.6272
2.7200
2.8825
2.9000
2.8957
2.8800
1.0 1.5 2.0 2.5 3.0 3.5 4.0
2013 Region 9 Average
2013 National Average
2014 Region 9 Average
2014 National Average
2015 Region 9 Average
2015 National Average
Domain Average
Domain Threshold (2) FY2015 10% Threshold (2.2262) FY2014 10% Threshold (2.2027) FY2013 10% Threshold (2.1100)


