Chromosomal Evolution of Malaria Vectors Ashley N. … Evolution of Malaria Vectors Ashley N. Peery...
125
Chromosomal Evolution of Malaria Vectors Ashley N. Peery Dissertation submitted to the faculty of the Virginia Polytechnic Institute and State University in partial fulfillment of the requirements for the degree of Doctor of Philosophy In Entomology Igor V. Sharakhov, Chair Zachary N. Adelman Dana M. Hawley Maria V. Sharakhovar Zhijian Tu April 29 th 2016 Blacksburg, VA Keywords: chromosomal evolution, vector-borne disease, malaria, mosquitoes
Transcript of Chromosomal Evolution of Malaria Vectors Ashley N. … Evolution of Malaria Vectors Ashley N. Peery...
Chromosomal Evolution of Malaria Vectors
Ashley N. Peery
Dissertation submitted to the faculty of the Virginia Polytechnic Institute and State
University in partial fulfillment of the requirements for the degree of
Doctor of Philosophy
In
Entomology
Igor V. Sharakhov, Chair
Zachary N. Adelman
Dana M. Hawley
Maria V. Sharakhovar
Zhijian Tu
April 29th 2016
Blacksburg, VA
Keywords: chromosomal evolution, vector-borne disease, malaria, mosquitoes
Chromosomal Evolution of Malaria Vectors
Ashley N. Peery
ABSTRACT
Abstract (academic):
International malaria control initiatives such as the Roll Back Malaria Initiative
(RBM) and the Medicines for Malaria Venture (MMV) mobilize resources and spur
research aimed at vector control as well as the treatment and eventual eradication of
the disease. These efforts have managed to reduce incidence of malaria by an
estimated 37% worldwide since 2000. However, despite the promising success of
control efforts such as these, the World Health Organization reports a staggering
438,000 deaths from malaria in 2015. The continuing high death toll of malaria as
well as emerging insecticide and antimalarial drug resistance suggests that while
encouraging, success in reducing malaria incidence may be tenuous. Current vector
control strategies are often complicated by ecological and behavioral heterogeneity of
vector mosquito populations. As an additional obstruction, mosquito genomes are
highly plastic as evidenced by the wealth or chromosomal inversions that have
occurred in this genus. Chromosomal inversions have been correlated with differences
in adaptation to aridity, insecticide resistance, and differences in resting behavior.
However, a good understanding of the molecular mechanisms for inversion
generation is still lacking. One possible contributor to inversion formation in
Anopheles mosquitoes includes repetitive DNA such as transposable elements (TEs),
tandem repeats (TRs) and inverted repeats (IRs). This dissertation provides physical
maps for two important malaria vectors, An. stephensi and An. albimanus (Ch.2 and
Ch. 3) and then applies those maps to the identification of inversion breakpoints in
malaria mosquitoes. Repeat content of each chromosomal arm and the molecular
characterization of lineage specific breakpoints is also investigated (Ch. 2 and Ch.4).
Our study reveals differences in patterns of chromosomal evolution of Anopheles
mosquitoes vs. Drosophila. First, mosquito chromosomes tend to shuffle as intact
elements via whole arm translocations and do not under fissions or fusions as seen in
fruitflies. Second, the mosquito sex chromosome is changing at a much higher rate
relative to the autosomes in malaria mosquitoes than in fruit flies. Third, our
molecular characterization of inversion breakpoints indicates that TEs and TRs may
participate in inversion genesis in an arm specific manner.
Chromosomal Evolution of Malaria Vectors
Ashley N. Peery
General Audience Abstract:
Malaria is a complex and devastating disease vectored by the bite of a female
Anopheles mosquito. This disease claimed an estimated 438,000 lives in 2015. The
mobilization of funding and resources as part of global malaria eradication initiatives
have reduced the global incidence of malaria by 37% in the last 15 years. Deaths from
malaria are also 60% lower vs. the year 2000. These promising gains are threatened
by the ability of Anopheles mosquitoes to adapt in the face of malaria control efforts.
Anopheles mosquito chromosomes are known to be highly plastic, as evidenced by
numerous chromosomal inversions. Recent years have seen increases in insecticide
resistance, and behavioral change in mosquito populations that allow them to avoid
insecticides and remain prolific vectors of disease. This ability of mosquito vectors to
adapt threatens to unravel recent progress towards a malaria free world. The project
presented in this dissertation explore mechanisms of chromosomal evolution,
specifically the potential role of repetitive DNA in the generation of chromosomal
inversions. The exploration of chromosomal inversions was facilitated by the creation
of physical maps for Anopheles species. Prominent malaria vectors An. stephensi
andAn. albimanus were physically mapped in Chapter 2 and Chapter 3 respectively.
In chapter 1 and chapter 3 physical maps are utilized for the identification of
chromosomal inversion breakpoints using 2 species (Ch. 2) and many species (Ch. 4).
Repeat content was quantified along each chromosomal arm (Ch 2,4) and in inversion
breakpoint regions (Ch 3). This dissertation presents physical maps for two important
malaria species that have been applied to the study of chromosomal evolution and will
also serve as community tools for further study of malaria mosquitoes. Our work on
chromosomal evolution has revealed the Anopheles chromosomes tend to undergo
translocations as intact elements and do not under fissions and fusions as seen in
fruitflies. We also find that the malaria mosquito sex chromosome changes much
more rapidly relative to the autosomes than in fruitflies. Additionally, repetitive DNA
including transposable elements (TEs) and tandem repeats (TRs) may be encouraging
chromosomal inversions but with differing roles on different chromosomal arms.

iv
Dedication
This dissertation is dedicated to the crazy man who decided to continue dating me,
(and later marry me!) even after I warned him that I would break up with him if our
relationship got in the way of my PhD. I can’t imagine my life without you.
Acknowledgements
To Dr. Igor Sharakhov: Thanks for taking a chance on the enthusiastic young kid you
met in 2009. You were patient enough to accept the blunders of my untrained hands
and you have shaped me into the scientist that I am today.
To Dr. Maria Sharakhova: You are a master of cytogenetics and I appreciate you
sharing those skills with me. Learning from you over the years has opened my eyes to
the beautiful and fascinating detail of mosquito chromosomes.
To Dr. Z. Adelman, Dr. D. Hawley, and Dr. Z. Tu: Thanks so much for broadening
my perspectives as I pursued my research.
To Captain Phillip J.P. George, PhD: Under your mentorship I learned scientific
technique, self sufficiency, and a greater than average appreciation of NIN and Muse.
Thanks for your advice on professional and personal matters over the last 7 years. I
wish you happiness in your future because I have no doubt that you will be successful.
To Dr. Atashi Sharma: You are the best PhD buddy a girl could ask for and I’m so
glad we became friends even if you beat me in the race to a PhD. I owe my love of
chickpea curry and my chai snobbery to you. Start looking out for you! You deserve
nothing less than unadulterated happiness.
To Fan Yang, MSLFS: Fan, I have enjoyed learning and working alongside you over
the years. Thanks for your friendship and support.
To Dr. Maryam Kamali, Dr. Nick Kinney, and Jiyoung Lee, MS: Being in the lab for
40+ hours a week sharing the same resources means that your lab mates can feel more
like your housemates. You guys are among the best housemates!
Maryam, your gentle, motherly kindness was very comforting to me in difficult
periods of my work.
Nick, the quality of your cynical humor is matched only by your wit and analytical
prowess. I will surely miss working with you in my next job. Thanks so much for all
your help with coding.
Jiyoung, your dedication is inspiring. I admire your single-minded pursuit of your
goals and your passionate defense of your opinions. Thanks for commiserating,
snacking and celebrating with me as the occasion required. *Digital HUGS*
To Sidney, Olivia, Carolyn, and Emily: Friends are the family you get to choose.
Thanks for being mine and supporting me through all this. May we have parties sillier

v
than the lumberjack party and more beautiful than the winter wonderland in our
futures.
To Alice and Steve: You two have provided me with numerous meals, jokes and
afternoons unwinding with the flowers. Thanks for sharing your cathedral and being
part of my life.
To my Family: It has been loooooong journey to this PhD. I couldn’t have done this
without you. You are always there when I need you.
vi
Attributions
This dissertation is the result of many collaborations:
Ch2:
Conceived and designed experiments: ZT and IVS; Data generation, analysis and
presentation: XJ, AP, AS, ABH, MK, MVS, AK, BW, CO, DL, KE, KM, JMCT,
JMCR, MAR, MRR, MU, NP, PA, PG, RK, RS, RMW, SL, SM, VLMD, YQ, ZT;
Writing of the manuscript: XJ, ABH, AAJ, AP, AS, JMCR, KDV, KM, KP, MK,
MAR, MMR, SL, IVS, and ZT; Provided resources and tools and critical reviewed
manuscript: XC, YS
Ch 3:
GA made cytogenetic map
GA measured proportions of each chromosome
ANP and MS made figure for ovarian nurse cell
ANP and GA performed FISH experiments
ANP and GA identified missassembly via physical mapping
ANP compared physical map to previous genetic map
MVS, IVS conceived experiments
MVS, ANP, GA, and IVS wrote the manuscript
Ch 4:
GA and AN physically mapped An. atroparvus
GA and ANP physically mapped An. albimanus
XJ identified 1:1 orthologs, syntenic blocks /chromosomal breakpoints
XJ quantified rates of rearrangement in 5 Anopheles species
XJ scaffolded the genomes of An. stephensi, An. dirus, and An. minimus
ANP tested scaffolding predictions in An. stephensi
ANP quantified TEs, IRs and TRs in breakpoint regions and 100 KB windows of
An. gambiae, An. stephensi, An.dirus and An. minimus (breaks and WG)
ANP performed statistical tests
JL ran repeat masker and provided ANP with output
NAK wrote a perl script to filter output of IRs and TRs and identify overlapping
repeats
ZT provided An. stephensi repeat library
IVS conceived experiments
ANP, XJ and IVS wrote manuscript
vii
TABLE OF CONTENTS
CHAPTER 1. LITERATURE REVIEW
1.1 The burden of malaria……………………………………………………1
1.2 Genome mapping…………………………………………………………5
1.3 Molecular characterization of insect genomes and genome
evolution……………………………………………………………….….9
CHAPTER 2. GENOME ANALYSIS OF A MAJOR URBAN MALARIA
VECTOR MOSQUITO, ANOPHELES STEPHENSI
2.1 Abstract…………………………………………………………………13
2.2 Background…………………………………………………………… .13
2.3 Results………………………………………………………………… 15
2.3.1 Draft genome sequence of An. stephensi: Assembly and
verification………………………………………………….15
2.3.2 Physical mapping……………………………………………..15
2.3.3 Gene annotation……………………………………………….16
2.3.4 Global transcriptome analysis…………………………………16
2.3.5 Immunity genes………………………………………………...17
2.3.6 Salivary genes………………………………………………….18
2.3.7 Repeat Content…………………………………………………19
2.3.8 Genome landscape: a chromosomal arm perspective…………..19
2.3.9 Molecular organization of pericentric heterochromatin………..20
2.3.10 Y chromosome………………………………………………..21
2.3.11 Synteny and gene order evolution…………………………….21
2.3.12 Rates of chromosome evolution in Drosophila and
Anopheles……………………………………………………………………………..22
2.4 Conclusions……………………………………………………………....23
2.5 Methods…..………………………………………………………………24
2.5.1 Strain selection…………..……………………………………..24
2.5.2 Sample collection…………………………………..…………..24
2.5.3 Sequencing……………………………………………………..24
2.5.4 Genome assembly……………………………………………...25
2.5.5 De novo illumina assembly with celera………………………..25
2.5.6 De novo 454 and Illumina pseudo 454 reads assembly
with newbler 2.8……………………………………………...25
2.5.7 Gap filling with PacBio reads……………………………...…..26
2.5.8 Further scaffolding with bac-ends…………………..…………26
2.5.9 Assembly validation…………………………………………...26
2.5.10 Constructing the physical map………………………………..27
2.5.11 Annotation……………...……………………………………..28
2.5.12 Orthology…………………………………..………………....28
2.5.13 Transcriptomics………………………………………………28
2.5.14 Ontology………………………………………………………29
2.5.15 Non-coding RNA…………………..…………………………29
2.5.16 Transposable elements and other interspersed repeats………..29
2.5.17 Simple repeats………………………………………………...29
2.5.18 Identification of S/MARs…………………………..…………30
2.5.19 Synteny, gene order evolution and inversions………………..30
2.6 Data access……………………………………………………………….31
viii
2.7 List of additional files……………………………………………………31
2.8 Author contributions……………………………………………………..32
2.9 Acknowledgements ……………………………………………………...32
CHAPTER 3: A PHYSICAL GENOME MAP OF NEOTROPICAL MALARIA
VECTOR, ANOPHELES ALBIMANUS 3.1 Abstract…………………………………………………………………..43
3.2 Introduction………………………………………………………………43
3.3 Materials and Methods…………………………………………………...46
3.3.1 Mosquito strain and larvae preservations………………………46
3.3.2 Chromosome preparation and map development………………46
3.3.3 Fluorescent in situ hybridization……………………………….46
3.4 Results……………………………………………………………………47
3.4.1 A cytogenetic photomap of An. albimanus…………………….47
3.4.2 A physical map for the An. albimanus genome………………...48
3.5 Discussion………………………………………………………………..49
3.6 Conclusions………………………………………………………………51
CHAPTER 4: INSIGHTS INTO RATES AND MECHANISMS OF
CHROMOSOMAL EVOLUTION IN ANOPHELES FROM MULTI-SPECIES
GENOMIC ANALYSIS
4.1 Abstract…………………………………………………………………59
4.2 Introduction……….……………………………………………………..59
4.3 Results……………………………………………………………………64
4.3.1 Identification of genome misassemblies………………………64
4.3.2 Scaffolding genomes based on conserved syntenic segments and
genome rearrangement………………………………………65
4.3.3 Genome rearrangement analysis………………………………65
4.3.4 Physical mapping and confirmation of gluing predictions……66
4.3.5 Transposable elements…………………………………………67
4.3.6 Inverted repeats in 4 species…………………………………...68
4.3.7 Simple tandem repeats in 4 species…………………………...68
4.3.8 Comparison of breakpoints to the whole genome……………...69
4.3.9 Rates of inversion in Anopheles………………………………..70
4.3.10 Correlations of repeats with rates of chromosomal breakage...70
4.4 Discussion/conclusions…………………………………………………..71
4.7 Methods…………………………………………………………………96
4.7.1 Identification of genome misassemblies………………………96
4.7.2 Scaffolding genomes based on conserved syntenic segments and
genome rearrangement………………………………………96
4.7.3 Genome rearrangement analysis……………………………….97
4.7.4 Physical mapping and confirmation of gluing predictions…….97
4.7.5 Transposable elements ………………………………………98
4.7.6 Inverted repeats………………………………………………98
4.7.7 Simple tandem repeats………………………………………..99
4.7.8 Comparison of breakpoints to the whole genome…………….99
4.7.9 Statistical tests for molecular features…………………………99
4.7.10 Rates of inversion in Anopheles………………………………99
4.7.11 Correlations of repeats with rates of chromosomal breakage.100

ix
CHAPTER 5: SUMMARY
5.1 General discussion and overview………………………………101
5.2 Review of Ch. 2………………………………………………101
5.3 Review of Ch. 3………………………………………………102
5.4 Review of Ch. 4………………………………………………103
REFERENCES………………………………………………………………….105
x
LIST OF FIGURES
Chapter 2
2.10.1 Physical Map, An. stephensi………………………………………….33
2.10.2 Orthology……………………………………………………………..34
2.10.3 Gene clustering according to expression profile……………………..35
2.10.4 Genome landscape……………………………………………………36
2.10.5 Average density/100KB/arm…………………………………………37
2.10.6 FISH with Aste72A, rDNA and DAPI on mitotic chromosomes……38
2.10.7 Synteny………………………………………………………………39
2.10.8 Breaks per 100 genes per million years in Anopheles and
Drosophila………………………………………………………………….40
Chapter 3
3.8.1 A typical salivary gland nucleus from An. albimanus…………………56
3.8.2 A physical map for An. albimanus……………………………………..57
3.8.3 A comparison of genetic and physical maps for chromosome 2………58
Chapter 4
4.6.1 Scaffold linkage in An. stephensi Indian strain………………………...86
4.6.2 Phylogenetic tree based on genome rearrangements…………………...87
4.6.3 Chromosomal rearrangements rates .......................................................87
4.6.4 Improved map An. stephensi…………………………………………...88
4.6.5 Comparison of repeats in 4 species…………………………………….88
4.6.6 % Repeats in 4 species by element……………………………………..89
4.6.7 Mean % repeats in 4 species by element……………………………….90
4.6.8 % Repeats in breaks vs. whole genome………………………………..91
4.6.9 Mean % Repeats in breaks vs. whole genome…………………………92
4.6.10 TEs in WG or break by element………………………………………93
4.6.11 TRs in WG or break by element………………………………………94
4.6.12 IRs in WG or break by element……………………………………….95
xi
LIST OF TABLES
Chapter 2
2.11.1 Assembly statistics……………………………………………………41
2.11.2 Physical map information……………………………………………41
2.11.3 Transposable elements and other interspersed repeats………………42
Chapter 3
3.7.1 Measurements and proportions of An. albimanus polytene
chromosomes………………………………………………………………..52
3.7.2 Misassemblies within the An. albimanus genome……………………..52
3.7.3 Sizes and chromosomal positions of An. albimanus superontigs………53
3.7.4 Correspondence of An. albimanus physical map with previously
published genetic map………………………………………………..55
Chapter 4
S16 Genome rearrangements in Drosophila………………………………...62
4.5.1 The number of one-to-one orthologs identified for each chromosomal
element………………………………………………………………76
4.5.2 The number of genome rearrangements for individual chromosomal
elements on different tree branches………………………………….76
4.5.3 Mapped supercontigs in An. stephensi……………………………………..77
4.5.4 Species differences in mean % Repeats………………………………..82
4.5.5 Differences in Repeats by Element…………………………………….83
4.5.6 Breaks vs. whole genome………………………………………………83
4.5.7 Rates of inversion by element………………………………………….84
4.5.8 Correlation of inversion rates with repeat content by element…………84
1
Chapter 1: Literature Review
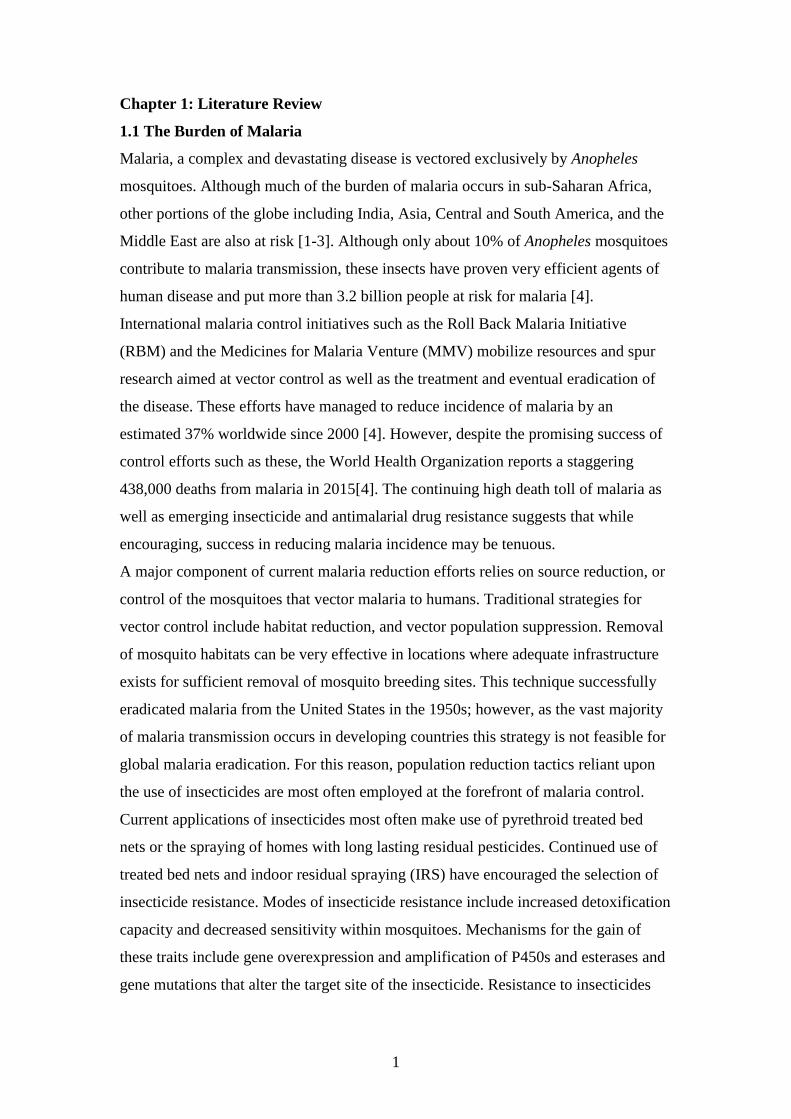
1.1 The Burden of Malaria
Malaria, a complex and devastating disease is vectored exclusively by Anopheles
mosquitoes. Although much of the burden of malaria occurs in sub-Saharan Africa,
other portions of the globe including India, Asia, Central and South America, and the
Middle East are also at risk [1-3]. Although only about 10% of Anopheles mosquitoes
contribute to malaria transmission, these insects have proven very efficient agents of
human disease and put more than 3.2 billion people at risk for malaria [4].
International malaria control initiatives such as the Roll Back Malaria Initiative
(RBM) and the Medicines for Malaria Venture (MMV) mobilize resources and spur
research aimed at vector control as well as the treatment and eventual eradication of
the disease. These efforts have managed to reduce incidence of malaria by an
estimated 37% worldwide since 2000 [4]. However, despite the promising success of
control efforts such as these, the World Health Organization reports a staggering
438,000 deaths from malaria in 2015[4]. The continuing high death toll of malaria as
well as emerging insecticide and antimalarial drug resistance suggests that while
encouraging, success in reducing malaria incidence may be tenuous.
A major component of current malaria reduction efforts relies on source reduction, or
control of the mosquitoes that vector malaria to humans. Traditional strategies for
vector control include habitat reduction, and vector population suppression. Removal
of mosquito habitats can be very effective in locations where adequate infrastructure
exists for sufficient removal of mosquito breeding sites. This technique successfully
eradicated malaria from the United States in the 1950s; however, as the vast majority
of malaria transmission occurs in developing countries this strategy is not feasible for
global malaria eradication. For this reason, population reduction tactics reliant upon
the use of insecticides are most often employed at the forefront of malaria control.
Current applications of insecticides most often make use of pyrethroid treated bed
nets or the spraying of homes with long lasting residual pesticides. Continued use of
treated bed nets and indoor residual spraying (IRS) have encouraged the selection of
insecticide resistance. Modes of insecticide resistance include increased detoxification
capacity and decreased sensitivity within mosquitoes. Mechanisms for the gain of
these traits include gene overexpression and amplification of P450s and esterases and
gene mutations that alter the target site of the insecticide. Resistance to insecticides
2
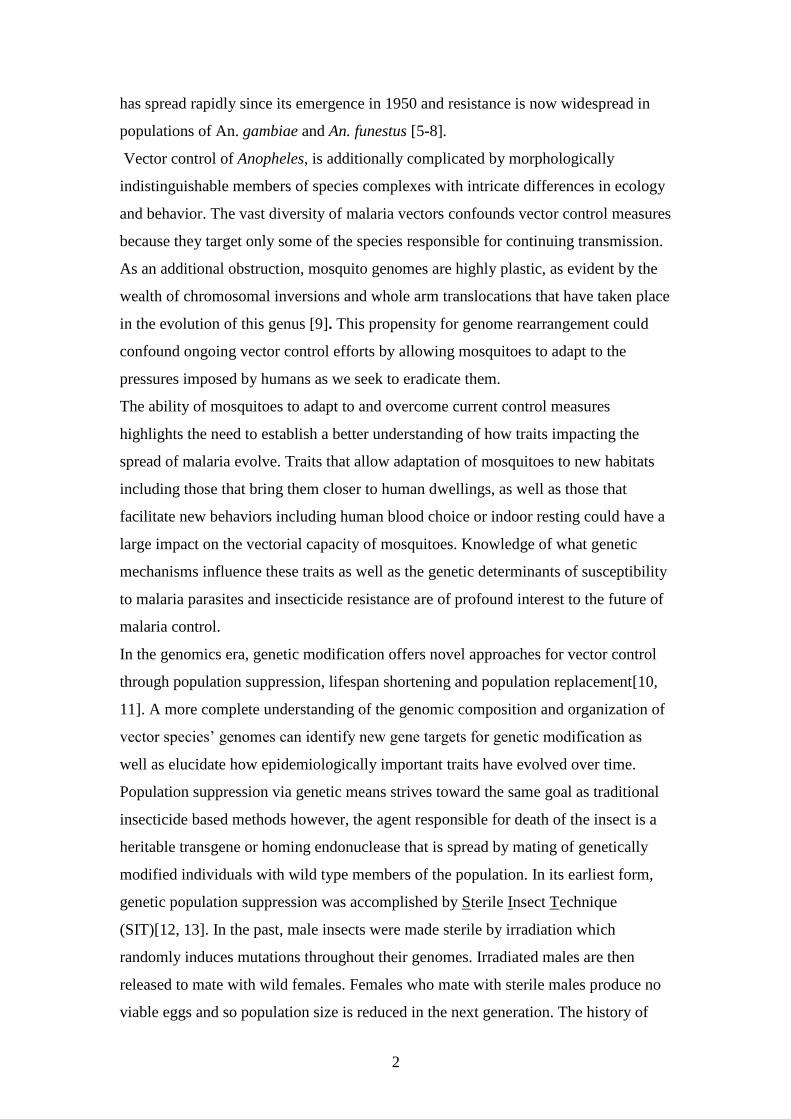
has spread rapidly since its emergence in 1950 and resistance is now widespread in
populations of An. gambiae and An. funestus [5-8].
Vector control of Anopheles, is additionally complicated by morphologically
indistinguishable members of species complexes with intricate differences in ecology
and behavior. The vast diversity of malaria vectors confounds vector control measures
because they target only some of the species responsible for continuing transmission.
As an additional obstruction, mosquito genomes are highly plastic, as evident by the
wealth of chromosomal inversions and whole arm translocations that have taken place
in the evolution of this genus [9]. This propensity for genome rearrangement could
confound ongoing vector control efforts by allowing mosquitoes to adapt to the
pressures imposed by humans as we seek to eradicate them.
The ability of mosquitoes to adapt to and overcome current control measures
highlights the need to establish a better understanding of how traits impacting the
spread of malaria evolve. Traits that allow adaptation of mosquitoes to new habitats
including those that bring them closer to human dwellings, as well as those that
facilitate new behaviors including human blood choice or indoor resting could have a
large impact on the vectorial capacity of mosquitoes. Knowledge of what genetic
mechanisms influence these traits as well as the genetic determinants of susceptibility
to malaria parasites and insecticide resistance are of profound interest to the future of
malaria control.
In the genomics era, genetic modification offers novel approaches for vector control
through population suppression, lifespan shortening and population replacement[10,
11]. A more complete understanding of the genomic composition and organization of
vector species’ genomes can identify new gene targets for genetic modification as
well as elucidate how epidemiologically important traits have evolved over time.
Population suppression via genetic means strives toward the same goal as traditional
insecticide based methods however, the agent responsible for death of the insect is a
heritable transgene or homing endonuclease that is spread by mating of genetically
modified individuals with wild type members of the population. In its earliest form,
genetic population suppression was accomplished by Sterile Insect Technique
(SIT)[12, 13]. In the past, male insects were made sterile by irradiation which
randomly induces mutations throughout their genomes. Irradiated males are then
released to mate with wild females. Females who mate with sterile males produce no
viable eggs and so population size is reduced in the next generation. The history of
3
SIT insect control begins with the control of the agricultural pest, the new world
screw worm, Cochliomyia hominivorax. By continued release of irradiated, sterile-
male flies this obligate endoparasite was eradicated from the southern United States
and Mexico. Maintenance of this program, however, requires continual release of
sterile insects at the periphery of the eradication zone- an undertaking that consumes
considerable money and resources[14]. Lower mating competitiveness of irradiated
sterile males also poses an additional complication to this approach. Recent advances
in genome editing and adaptation of these techniques to mosquito systems offers
numerous approaches for the genetic control of mosquitoes[15-18]. By employing
Zinc Finger nucleases (ZFNs), TALENs, and CRISPRs, researchers can now
precisely edit genomes and engineer transgenes with the goal of gender specific
elimination of mosquitoes at particular life stages. These methods allow scientists to
affect population suppression via Release of Insects carrying a Dominant Lethal
(RIDL).
The precision with which researchers are now able to manipulate genomes provides
them with many options in terms of how they might choose to exploit SIT and RIDL
methods for the control of mosquito populations. For example, lethal transgenes could
target males, females, or both sexes[19]. Lethal transgenes targeting both sexes could
crash a population faster than methods targeting only females and they would be self-
limiting-especially if the transgene-carrying insects died before they reached
reproductive age. Female killing has intuitive advantages because the disease causing
culprits are removed from the population, but male carriers continue dissemination of
the transgene in the population. Agent based modelling of 4 transgene RIDL scenarios
suggests that a transgene lethal in the late larval stages of both sexes provides the
most efficient strategy for population suppression. This scenario models best
ostensibly because transgenes lethal in late stages of larval development can exploit
density dependent larval mortality. Modeling favors bisex lethal transgenes over
female killing because males, which can propagate the transgene in the population can
also harbor the wild type alleles. A greater number of transgenic insects must be
released to overcome the reservoir or wild type alleles[20].
Another approach to vector control currently being tested makes use of host
manipulation resulting from infection with Wolbachia, a large and pervasive genus of
bacteria that naturally infects as many as 60% of all arthropod species. Infection with
Wolbachia results in very interesting manipulation of the hosts. In species naturally
4
infected with Wolbachia, various outcomes including skewing of sex ratios, male
killing, increased fecundity, lifespan shortening and refractoriness to parasites have
been reported[21-25]. Release of Wolbachia-infected insects made refractory to
disease pathogens or with shortened lifespans that prevent pathogen transmission
could provide a means of replacing vector populations with insects that pose no threat
of spreading human disease. Population suppression is also possible by exploiting
Wolbachia’s natural means of self-propagation [10]. The bacteria is maternally
inherited and copulations between infected males with uninfected females results in
cytoplasmic incompatibility with no viable offspring. Similarly, infected females
inseminated by a male infected with a different strain of Wolbachia also fail to
produce live offspring. Cytoplasmic incompatibility provides an avenue for the
reduction of vector species populations and because methods that exploit Wolbachia
require no direct modification of a vectors’ genome, this method is sometimes viewed
as a less invasive alternative to RIDL methods that make use of genetically modified
insects. Wolbachia is known to naturally infect disease vector species including Aedes
albopictus, the primary vector of chikungunya, and Culex pipiens, a vector of West
Nile virus. A strain of the bacteria originating in Drosophila, wMelpop has also been
introduced to Aedes aegypti, and 2 natural populations stably inheriting the bacteria
now exist in Australia[26, 27]. Efforts to infect Anopheles stephensi, successfully
incorporated an Ae. albopictus Wolbachia, wAlbB into a lab colony[28]. Although
Wolbachia could offer a very promising and novel method for control of vector borne
disease, the inevitable evolution of Wolbachia raises concerns of unintended
consequences resulting from this method’s use. A 2015 study by Martinez and
colleagues correlated strong antiviral effects with reductions in other life history traits
including fecundity and lifespan[24]. The potential for natural selection to select
against antiviral activity in favor of reducing the negative impacts of infection on
lifespan and fecundity equates to a potential for loss of efficacy of vector borne
disease programs based on the bacteria[24].
Among the most amazing and potentially useful manipulations imposed by Wolbachia
on its hosts is the protection from pathogen infection the bacteria can provide. In
different hosts infection with Wolbachia has been shown to inhibit dengue virus,
chikungunya, filarial worms, yellow fever virus, West Nile virus and Plasmodium
falciparum [29]. In other scenarios however, Wolbachia infection can increase
susceptibility of the insect to pathogen infection. Wolbachia infection in Culex
5
tarsalis increases susceptibility of the mosquito to West Nile virus [30]. Although
Plasmodium falciparum was inhibited in wAlbB infected An. stephensi, susceptibility
to murine malaria, P. berghei, was increased in An. gambiae infected with
wAlbB[31]. This result piques the possibility that human malaria parasites more
closely related to P. berghei such as P. ovale, P. knowleski, P. malariae and P. vivax
might also flourish in mosquitoes infected with wAlbB[31]. The effects of Wolbachia
infection on these other human malaria parasites has not yet been tested, but in
locations where more than one human malaria parasites coexist, malaria control
efforts utilizing Wolbachia could inadvertently amplify one strain of malaria while
limiting another. How Wolbachia manipulates its insect hosts remains unclear but
studies associating gene expression and epigenetic changes with Wolbachia infection
could perhaps shed some light on the interaction of the bacteria within its hosts. The
availability and assembly of insect genomes will facilitate further exploration of this
topic and other emerging technologies for mosquito control.
1.2 Genome mapping
The low cost of genome sequencing and concerted sequencing efforts such as the 12
Drosophila Genomes and the 16 Anopheles Genomes Projects have produced a surfeit
of genome data that provides an essential platform from which comparative genomics
studies become possible [9, 32]. However, draft genome assemblies are often
published in databases as a collection of sequences that have been assembled to the
contig or supercontig level. At this level of assembly how supercontigs fit together
into chromosomes is unknown and inferences about genome landscape, population
genetics, and chromosomal evolution are limited.
The assembly of sequence supercontigs into chromosomes can be achieved by
considering the linkage of genetic markers (known as genetic or linkage mapping)
through inheritance, or by physically mapping sequence information to chromosomal
locations through the use of fluorescently labeled probes[33]. In species where a
reliable source of distinct chromosomes is not available, genetic linkage mapping is
used and this technique employs recombination rates to assign genetic markers to
linkage groups. Linkage groups often correspond 1:1 with chromosomes and so can
be analyzed in the same way as chromosomes. Historically, researchers were limited
to tracking the inheritance of gene variants with measurable differences in phenotype
however, this greatly limited the number of markers that were available for study.
Later developments in the techniques of molecular genetics expanded the list of
6
markers to include other markers including variable number tandem repeats (VNTRs),
restriction fragment length polymorphisms (RFLPs) and single nucleotide
polymorphisms (SNPs) which all have heritable polymorphisms[34, 35].
Despite the lack of easily distinguishable chromosomes, genetic linkage studies have
been utilized to explore chromosomal evolution in the gene order of Lepidoptera,
revealing synteny between Haliconius melpomene and Bombyx mori as well as
evidence for chromosomal fusions during the evolution of this species[36]. Genetic
mapping based on RFLP and microsatellite polymorphism in mosquitoes of the Culex
pipiens complex was able to assemble 10.4% of the genome into the three linkage
groups[37]. Despite the low genomic coverage of this map, the genetic markers
developed in this study will be useful for population comparisons with other Culex
species. Even greater advances were possible in A. aegypti where genetic mapping
assigned 58% of the genome to chromosomes and corrected misassembly within the
genome[38].
One advantage of genetic mapping is the ability to associate genomic loci with
phenotypic variation. In Anopheles arabiensis, for example, quantitative trait loci
(QTLs) were identified to help explain the mechanisms of resistance to pyrethroid
insecticides in regions of Africa[39]. Genetic mapping has also identified genomic
regions in Aedes aegypti that influence the interaction between host and pathogen
genotype and explain variation in vectorial capacity[40].
In species that possess easily obtainable sources of visually distinct chromosomes,
physically mapping genomic supercontigs to chromosomes is a good method for
assembling a genome to the chromosomal level. High quality polytene chromosomes
such as are produced by numerous rounds of endoreplication in the salivary glands
and ovaries of Diptera including Drosophila and Anopheles render physical mapping
convenient in these species. The genome sequence of Drosophila melanogaster was
published in 2000. Later efforts in the Drosophila community produced 11 additional
genome sequences for Drosophila species. Physical mapping of supercontigs to
chromosomes isolated from salivary glands of these 12 species provided the basis for
a large scale comparison of orthologous gene positions. Examination of gene order in
these 12 species revealed that gene membership is largely conserved between
homologous arms within Drosophila despite numerous chromosomal fusions and
fissions that have taken place during the evolution of Drosophila [41, 42]. The
7
identification of fixed inversion breakpoints, and estimates for rates of chromosomal
evolution also became possible within this comparative genomics context.
In the major African malaria vector An. gambiae, nearly 2000 bacterial artificial
chromosome BAC clones were physically mapped to chromosomes in the initial
publication of the genome [43]. It is now known that the An. gambiae Pink Eye
STandard (PEST) strain mosquitos that the genome sequence is based on were
hybrids of two incipient species: An. coluzzi and An. gambiae. This mixed genetic
background resulted in a mosaic genome of inflated size due to the presence of
multiple haplotype supercontigs. Pericentromeric regions were poorly assembled in
the initial publication, but later efforts aimed at improving the assembly placed an
additional 5.34 MB to regions near the centromeres and also filled gaps between
supercontigs. This work also removed supercontigs suspected of originating from
bacterial contamination and identified sequences belonging to alternative haplotypes
and the ever elusive mosquito Y chromosome [44].
The efforts of the An. gambiae genome project yielded a high quality genome
assembly and a valuable platform for comparative genomics. Interspecies cross
hybridization studies have established arm homology between An. gambiae and many
Anopheles species [45-49]. Finer scale cross hybridization studies examining gene
shuffling and chromosomal inversions demonstrated that different chromosomal arms
exhibit varying tolerance to gene disruption, and that chromosomal inversions tend to
capture similar sets of genes in species facing similar environmental pressure [49, 50].
The recent publication of 16 additional Anopheles genomes and the subsequent
generation of low coverage physical maps for 5 species spanning 100 million years of
evolutionary history allowed study of chromosomal evolution on a scale not
previously obtainable in mosquitoes. This study revealed higher rates of evolution on
the sex chromosomes relative to the autosomes and confirmed that like Drosophila,
gene membership is largely conserved on homologous chromosomal arms. Unlike
Drosophila however, chromosomal arms in Anopheles shuffle via whole arm
translocation but do not exhibit fissions and fusions [9].
Physical mapping in disease vectors belonging to Aedes and Culex is complicated by
poor sequence assembly quality and a lack of high quality polytene chromosomes.
However, recent developments easing the procurement and recognition of mitotic
chromosomes is overcoming these obstacles [51, 52]. By employment of a two-step
mapping approach, where a landmark probe is used to aid in the identification of
8
mitotic chromosomes, localization of 45% of the Aedes aegypti genome and 13% of
the Culex quinquefasciatus genome to chromosomes became possible. These
advances improved not only the genome assemblies but also updated the
nomenclature and integrated the physical and genetic maps for these vector species.
Clustering of the QTLs in the genome of A. aegypti suggests that traits related to
vectorial capacity and vector competence might be controlled by fewer genomic loci
than previously expected [51]. Chromosome based examination of genomic features
including transposable elements (TEs), satellites and genes also resulted from the
physical mapping of A. aegypti and will eventually become possible in C.
quinquefasciatus as the chromosomal assembly improves [52].
In insects such as mosquitoes, where selective breeding is easy and fast generation
times are common- genetic mapping is possible as long as sufficient polymorphic
markers exist within the population. The feasibility is limited, however, if few
polymorphic markers have been identified or if the population is genetically very
homogeneous. In An. albimanus for example, 50 microsatellite markers were
sufficient to create a well-supported linkage map for chromosome 2, but very few
markers segregated on chromosome 3 or the sex chromosome [53]. In A. aegypti, low
rates of recombination across all chromosomes prevented the assignment of order and
orientation to genetic markers that occupied the same mitotic band[38]. The resolution
of genetic maps is further limited in areas of lower recombination. Centromeric
regions have been shown to display recombination suppression spanning 20% of the
chromosome in D. melanogaster, 40% in An. gambiae and 47% in A. aegypti [38].
Physical maps offer improved resolution compared to genetic maps but without the
guidance of a genome sequence, markers can redundantly cover the same
chromosomal regions and fail to provide homogenous coverage along the
chromosome. The availability of genome sequences however enables the researcher to
select probes with prior knowledge of which supercontigs they belong to and prevent
uneven coverage.
The integration of physical and genetic maps provides an opportunity to associate
chromosomal loci with phenotypic traits while also allowing the precise ordering and
orientation of supercontigs along the chromosome. The improved resolution of an
integrated map or iMap, will ease studies aimed at exploring how the genome
landscape varies along chromosomes. Additionally, the publication of genome
sequences for more species will facilitate efficient physical mapping and in turn,
9
syntenic relationships and evolution of mosquito species can be explored in greater
breadth.
1.3 Molecular characterization of insect genomes and genome landscape
Somewhat paradoxically, only a small proportion of mosquito species bear the blame
for the global malaria crisis. As demonstrated by the Anopheles gambiae complex,
vectorial capacity can vary considerably even in related species coexisting in the same
locality[54]. This variation begs the question of what processes are shaping some
mosquitoes into prolific disease spreaders while others are of no consequence to
human health? Cytology and comparisons of gene order in several Anopheles species
has revealed that chromosomal inversions and whole arm translocations have shuffled
mosquito genomes over hundreds of millions of years, distinguishing species and
providing variation within species[55].
Before genome sequencing, mosquito chromosomal inversions were detected by
studying banding patterns of polytene chromosomes. Using this technique, pioneer,
Mario Coluzzi was able to differentiate morphologically indistinguishable species
within the Anopheles gambiae complex based on fixed chromosomal inversions
(COLUZZI 1966). Additional study by Coluzzi and others detected extensive
polymorphic inversions in interbreeding populations of the same species with
alternative inversion arrangements conferring different behaviors and ecology[56-58].
Further study has catalogued numerous polymorphic inversions associated with
adaptation to drier climates, changes in resting behavior and resistance to
insecticides[59]. Interestingly, it has been noted that inversions occur with different
frequency on different chromosomal arms [60, 61]. For example, chromosome 2R
hosts a disproportionate amount of polymorphic inversions relative to all other
chromosomal arms. Alternatively, the sex chromosome appears entirely devoid of
polymorphic inversions but has accumulated far more fixed inversions than the
autosomes[9, 60, 61]. These data suggest that different parts of the genome are more
tolerant of rearrangement than others and contribute differently to the evolution and
adaptation of species.
Several explanations have been proposed to explain chromosomal arm specific
differences in rates evolution. The observation of breakpoint reuse in mammals and
insects supplanted hypothesis of random inversions and encouraged hypothesis of
some non-random “fragile regions” within the genome that are more susceptible to
breakage[62-65]. A definitive reason for fragility of particular regions is still up for
10
debate. Other ideas suggest that chromosomal breakage is limited by how tolerant a
particular group of genes is to disruption. These two ideas were tested in Drosophila
and the authors found that both mechanisms have likely been at work in this
lineage[66]. Later work, however, engineered a chromosomal inversion in a very well
conserved syntenic region that was thought to be preserved by “functional contraints”.
They were unable to determine any reduction in fitness to the organism[67].
The development of molecular cloning, DNA sequencing, and algorithms for the
detection of repeats has provided a means of exploring the content of specific
inversion breakpoint regions of both fixed and polymorphic inversions. A study of the
fixed 2R+o inversion in the An. gambiae complex uncovered degraded remains of
transposable elements (TEs)[68]. Polymorphic inversion 2Rj was flanked by two
segmental duplications (SDs) [69]. Other studies in mosquito, fruitfly, yeast and
human have uncovered various repeats including TEs, SDs, inverted repeats (IRs) and
tandem repeats (TRs) in the vicinity of chromosomal inversions[70-76]. The
proximity of these repeats to breakpoints hints at a possible role played by repeats in
the formation of chromosomal inversions. Despite some evidence for the occurrence
of repetitive elements in inversion breakpoints of Diptera, other studies have also
failed to detect repeats in inversion breakpoints[77, 78]. One particularly large study
undertaken by Ranz and colleagues found that more than half of the 29 breakpoints
they considered lacked repetitive elements. In fact, they only found repeats in 2/29
breaks [79]. This evidence, and lack thereof, highlights the ongoing debate about the
molecular context of inversion genesis in Diptera.
The inclination for mosquito genomes to change imparts tremendous adaptive
potential and spells disastrous consequences for humankind as we seek to eradicate
mosquito-borne disease. Unraveling the role of repeats in inversion genesis will assist
humans in disarming our winged foe. At present we are facing a dearth of clear
evidence elucidating the causative mechanisms for chromosomal inversion in Diptera;
however the availability of many new genome sequences and assembled genomes
provides exciting opportunities for testing of these hypotheses in Anopheles.
11
Chapter 2: Genome analysis of a major urban malaria vector mosquito,
Anopheles stephensi
Xiaofang Jiang1,2*, Ashley Peery3*, A. Brantley Hall1,2, Atashi Sharma3, Xiao-
Guang Chen4, Aleksey Komissarov5, Michelle M. Riehle6, Yogesh
Shouche7, Maria V. Sharakhova3, Dan Lawson8, Robert M. Waterhouse9,10,11,12,
Nazzy Pakpour13, Peter Arensburger14, Victoria L. M. Davidson15, Karin
Eiglmeier16, Scott Emrich17, Phillip George3, Ryan Kennedy18, Chioma
Oringanje19, Yumin Qi2, Robert Settlage20, Marta Tojo21, Jose M. C. Tubio22,
Maria Unger23, Bo Wang13, Kenneth D. Vernick16, Jose M. C. Ribeiro25, Anthony
A. James24, Kristin Michel15, Michael A. Riehle19, Shirley Luckhart13, Igor V.
Sharakhov1,3§, Zhijian Tu1,2§
1Program of Genetics, Bioinformatics, and Computational Biology, Virginia Tech,
Blacksburg, VA, USA 2Department of Biochemistry, Virginia Tech, Blacksburg, VA, USA 3Department of Entomology, Virginia Tech, Blacksburg, VA, USA 4Department of Pathogen Biology, Southern Medical University, Guangzhou,
Guangdong, China 5Theodosius Dobzhansky Center for Genome Bioinformatics, St. Petersburg State
University, and Institute of Cytology Russian Academy of Sciences, St. Petersburg,
Russia 6Department of Microbiology, University of Minnesota, Minneapolis, MN, USA 7National Center for Cell Science, Pune University Campus, Ganeshkhind, Pune,
India 8European Molecular Biology Laboratory, European Bioinformatics Institute,
Wellcome Trust Genome Campus, Hinxton, Cambridge CB10 1SD, United Kingdom 9Department of Genetic Medicine and Development, University of Geneva Medical
School, rue Michel-Servet 1, 1211 Geneva, Switzerland 10Swiss Institute of Bioinformatics, rue Michel-Servet 1, 1211 Geneva, Switzerland 11Computer Science and Artificial Intelligence Laboratory, Massachusetts Institute of
Technology, 32 Vassar Street, Cambridge, MA, USA 12The Broad Institute of MIT and Harvard, 7 Cambridge Center, Cambridge, MA,
USA 13Department of Medical Microbiology and Immunology, University of California,
Davis, CA, USA 14Biological Sciences Department, California State Polytechnic University Pomona,
CA, USA 15Division of Biology, Kansas State University, Manhattan, KS, USA 16Department of Parasitology and Mycology, Unit of Insect Vector Genetics and
Genomics, Institut Pasteur, Paris, France and CNRS Unit of Hosts, Vectors and
Pathogens (URA3012), Paris, France. 17Department of Computer Science and Engineering, University of Notre
Dame, Notre Dame, IN, USA 18Department of Bioengineering and Therapeutic Sciences, University of California,
San Francisco, California, USA 19Department of Entomology, University of Arizona, Tucson, AZ, USA 20Virginia Bioinformatics Institute, Virginia Tech, Blacksburg, VA, USA
12
21Department of Physiology, School of medicine – CIMUS, Instituto de
Investigaciones Sanitarias, University of Santiago de Compostela, Spain 22Wellcome Trust Sanger Institute, Hinxton, Cambridgeshire, UK. 23Department of Biological Sciences, University of Notre Dame, Notre Dame, IN,
USA 24Departments of Microbiology & Molecular Genetics and Molecular Biology &
Biochemistry , University of California, Irvine CA, USA 25Section of Vector Biology, Laboratory of Malaria and Vector Research, National
Institute of Allergy and Infectious Diseases, Rockville, MD, USA
* Equal contribution, listed by alphabetical order § Corresponding authors
Email addresses:
IVS: [email protected]
Email addresses of other authors are provided during online submission.
13
2.1 Abstract
Background
Anopheles stephensi is the key vector of malaria throughout the Indian subcontinent
and Middle East and an emerging model for molecular and genetic studies of
mosquito-parasite interactions. The “type” form of the species is responsible for the
majority of urban malaria transmission across its range.
Results
Here we report the genome sequence and annotation of the Indian strain of the “type”
form of An. stephensi. The 221 Mb genome assembly represents >92% of the entire
genome and was produced using a combination of 454, Illumina, and PacBio
sequencing. Physical mapping assigned 62% of the genome onto chromosomes,
enabling chromosome-based analysis. Comparisons between An. stephensi and An.
gambiae revealed a high rate of gene order reshuffling on the X chromosome,
exceeding not only the rate on the autosomes but also the rate on the Drosophila X
chromosome. Anopheles stephensi has more heterochromatin in pericentric regions
but less repetitive DNA in chromosome arms than An. gambiae. We also identified a
number of Y-chromosome contigs and BACs. Interspersed repeats constitute 7.1% of
the assembled genome while LTR retrotransposons alone comprise >49% of the Y
contigs. RNA-seq analyses provide new insights into mosquito innate immunity,
development, and sexual dimorphism.
Conclusions
The genome analysis described in this manuscript provides a resource and platform
for fundamental and translational research into a major urban malaria vector.
Chromosome-bases investigations provide unique perspectives on Anopheles
chromosome evolution. RNA-seq analysis and studies of immunity genes offer new
insights into mosquito biology and mosquito-parasite interactions.
2.2 Background
Mosquitoes in the genus Anopheles are the primary vectors of human malaria
parasites and the resulting disease is one of the most deadly and costly in history[80,
81]. Publication and availability of genome sequences accelerates research that not
14
only enhances our basic understanding of vector biology and vector-parasite
interactions, but also contributes to new strategies for combating malaria[43]. Recent
application of next-generation sequencing technologies to mosquito genomics offers
exciting opportunities to expand our understanding of mosquito biology in many
important vector species and harness the power of comparative genomics. Such
information will further facilitate the development of new strategies to combat
malaria and other mosquito-borne diseases. Anopheles stephensi is among the ~60
species considered important in malaria transmission and is the key vector of urban
malaria on the Indian subcontinent and the Middle East[82, 83]. Of the three forms:
type, mysorensis, and intermediate, the former is responsible for the majority, if not
all, of urban malaria transmission across its range and accounts for approximately
12% of all transmission in India[84]. Thus efforts to control it can be expected to
contribute significantly to the malaria eradication agenda[85, 86]. Anopheles
stephensi is amenable to genetic manipulations such as transposon-based germline
transformation[87], genome-wide mutagenesis[88], site-specific integration[89],
genome-editing[90] and RNAi-based functional genomics analysis[91]. Our
understanding of the interactions between An. stephensi and the malaria parasites is
rapidly improving[28, 92-96]. Thus An. stephensi is emerging as a model species for
genetic and molecular studies. We report here the genome sequence of the Indian
strain of the “type” form of An. stephensi as a resource and platform for fundamental
and translational research. We also provide unique perspectives on Anopheles
chromosome evolution and offer new insights into mosquito biology and mosquito-
parasite interactions.
15
2.3 Results and discussion
2.3.1 Draft genome sequence of An. stephensi: Assembly and verification
The An. stephensi genome was sequenced using 454 GS FLX, Illumina HiSeq, and
PacBio RS technologies (Additional file 1: Table S1). The 454 reads comprised 19.4x
coverage: 12.2x from single-end reads, 2.2x from 3 kilobase (kb) paired-end reads,
3.4x from 8 kb paired-end reads, and 1.7x from 20 kb paired-end reads. The majority
of 454 reads ranged from 194 to 395 base-pairs (bp) in length. A single lane of
Illumina sequencing of male genomic DNA resulted in 86.4x coverage of 101 bp
paired-end reads with an average insert size of ~200 bp. Ten cells of PacBio RS
sequencing of male genomic DNA produced 5.2x coverage with a median length of
1,295 bp. A hybrid assembly combining 454 and Illumina data produced a better
overall result than using 454 data alone (Materials and methods). The resulting
assembly was further improved by filling gaps with error-corrected PacBio reads and
scaffolding with BAC-ends. The current assembly, verified using various methods as
described in Materials and methods, contains 23,371 scaffolds spanning 221 Mb that
includes 11.8 Mb of gaps (Table 2.12.2.12.1). The N50 scaffold size is 1.59 Mb and
the longest scaffold is 5.9 Mb. The number of scaffolds is inflated because we choose
to set the minimum scaffold length to 500 bp to include repeat-rich short scaffolds.
The assembled size of 221 Mb is consistent with the previous estimate of the An.
stephensi genome size of ~235 Mb[97].
2.3.2 Physical mapping
Mapping of 227 probes was sufficient to position 86 scaffolds on the An. stephensi
polytene chromosomes (Figure 2.11.1; Table 2.12.2; Additional file 2). These 86
scaffolds comprise 137.14 Mb or 62% of the assembled genome. Our physical map
includes 28 of the 30 largest scaffolds and we were able to assign orientation to 32 of
the 86 scaffolds. We expect that relatively little of the heterochromatin was captured
in our chromosomal assembly based on the morphology of the chromosomes in
regions to which the scaffolds mapped. For this reason, subsequent comparisons with
An. gambiae on molecular features of the genome landscape exclude regions of
known heterochromatin from the An. gambiae dataset. Anopheles stephensi and An.
gambiae have different chromosome arm associations with 2L of An. gambiae
16
homologous to 3L of An. stephensi[49]. Therefore, all ensuing discussion of synteny
between the two species refers to An. stephensi chromosome arms listed in
homologous order to those of An. gambiae: X, 2R, 3L, 3R, and 2L. While draft
genomes also are available for An. darlingi and An. sinensis[98, 99], we focused our
comparative analysis on An. stephensi and An. gambiae, the only two species that
have chromosome-based assembly.
2.3.3 Gene annotation
A total of 11,789 protein-encoding genes were annotated in the An. stephensi genome
using a combination of homology and de novo prediction. These gene models have
been submitted to NCBI (GCA_000300775.2) and are hosted at VectorBase
(https://www.vectorbase.org/Anopheles_stephensiI/Info/Index). The average
transcript length was 3,666 bp and the average number of exons per transcript was
4.18. A total 10,492 (89.0%) of the 11,789 predicted An. stephensi protein-encoding
genes had orthologs in An. gambiae, Aedes aegypti and Drosophila melanogaster
(Figure 2).
2.3.4 Global Transcriptome Analysis
Eleven RNA-seq samples were prepared from 0-1, 2-4, 4-8, and 8-12 hour post-egg
deposition embryos, larvae, pupae, adult males, adult females, non-blood-fed ovaries,
blood-fed ovaries, and 24 hours post-blood-fed female carcass without ovaries[100].
The corresponding genes were clustered into 20 distinct groups ranging in size from 8
to 2,106 genes per group on the basis of similar expression patterns (Figure 2.11.3).
Many of the clusters correspond to either a specific developmental stage or sex
(Additional files 3 and 4). A search for over-represented gene ontology (GO) terms in
the 20 clusters found that many of the co-regulated genes have similar inferred
functions or roles. Adult females require a protein-rich blood-meal for oogenesis and
thus are the most interesting sex from a health perspective. Genes in clusters 1, 10,
and 17 are induced after blood-feeding in the female soma. These clusters are
enriched for genes encoding proteins with proteolytic activity, including serine
peptidases, involved in blood-meal digestion. Mosquitoes have undergone lineage-
specific amplification of serine peptidases when compared to Drosophila, many of
17
which are found in the three clusters described above. Cluster 9 contains 258 genes
that showed peak expression in the pupa and it is enriched for genes whose products
are involved in exoskeleton development. GO analyses of other clusters are described
in the supplementary text.
We also identified 241 and 313 genes with female- or male-biased expression,
respectively (Additional file 5). The male-biased genes were enriched for those whose
products are involved in spermatogenesis and the detection of sound. Male
mosquitoes detect potential mates using their Johnston’s organ, which has twice the
number of sensory neurons as that of the females [101, 102]. The female-biased genes
were enriched for those whose products are involved in proteolysis and other
metabolic processes likely relevant to blood digestion.
2.3.5 Immunity genes
Manual annotation was performed on genes involved in innate immunity including
those that encode the LRR immune (LRIM) and the Anopheles Plasmodium-
responsive leucine-rich repeat 1 (APL1) proteins, and the genes of the Toll, immune
deficiency (IMD), insulin/insulin-like growth factor signaling (IIS), mitogen-activated
protein kinase (MAPK) and TGF- signaling pathways. A number of studies have
demonstrated the importance of these genes or pathways in mosquito defense against
parasites or viruses[92-96, 103-105]. Manual analysis showed overall agreement with
the automated annotation and improved the gene models in some cases (Additional
files 6 and 7). A high level of orthology is generally observed between An.
stephensi and An. gambiae and we highlight here a few potentially interesting
exceptions. Anopheles stephensi may have only one APL1 gene (ASTEI002571)
instead of the three APL1 gene cluster found in An. gambiae (Additional file 1: Figure
S1). We also observed the apparent lack of TOLL1B and 5B sequences in An.
stephensi, which in An. gambiae are recent duplications of TOLL1A, 5A,
respectively. Whether these differences between the two species are true or simply
artifacts resulting from mis-assembly requires further experimental validation[106].
Expression profiles of all immunity genes were analyzed using the 11 RNA-seq
samples to provide insights into their biological functions (Additional file 8). For
example, FKBP12, a protein known to regulate both transforming growth factor
18
(TGF)- and target of rapamycin (TOR) signaling, showed abundant transcript levels
across immature stages and adult tissues (Additional file 1: Figure S2). The high
expression levels of AsteFKBP12 in all examined stages and tissues were remarkable
and unexpected. Examination of existing publicly-available microarray data
confirmed these expression levels and patterns[107]. FKBP12 in mammals forms a
complex with rapamycin and FKBP-rapamycin-associated protein (FRAP) to inhibit
TOR[108]. Given that TOR signaling is fundamental to many biological functions in
mammals[109] and cumulative data support the same for D. melanogaster[110], a
high level of FBKP12 expression may be critical for tight regulation of TOR activity
in An. stephensi and perhaps An. gambiae[111]. Expression patterns of the An.
gambiae FKBP12 ortholog (AGAP012184) from microarray datasets
(http://funcgen.vectorbase.org/expression-browser/gene/AGAP012184) support the
hypothesis that this protein is involved in a broad array of anopheline physiologies,
including development, bloodfeeding, molecular form-specific insecticide resistance,
circadian rhythm, desiccation resistance, mating status, and possibly also broad
regulation of infection based on studies with murine (Plasmodium berghei) and
human (Plasmodium falciparum) malaria parasites. Whether these same physiologies
and others are regulated by FKBP12 in An. stephensi will require experimental
confirmation. Given that signaling pathways regulating embryonic pattern formation
in Drosophila (e.g., the Toll pathway[112]) have been co-opted in the adult fly for
regulation of various physiologies including metabolism and immune defense, the
data presented here support the hypothesis that pathways integral to adult biology in
adult anophelines also have been similarly co-opted from important developmental
roles.
2.3.6 Salivary genes
Saliva of blood feeding arthropods contains a cocktail of pharmacologically active
components that disarm their host’s blood clotting and platelet aggregation, induce
vasodilation and affect inflammation and immunity. These salivary proteins are under
accelerated evolution most likely due to their host’s immune pressure. A previous
salivary gland transcriptome study identified 37 salivary proteins in An. stephensi,
most of which are shared with An. gambiae, including mosquito and Anopheles-
specific protein families[113]. The current assembly of the An. stephensi genome
19
allowed for insights into the genomic organization of salivary gland genes, many of
which occur as tandem repeated gene families that arose by gene duplication events.
Tandem repeated gene families often are poorly annotated by automated approaches,
therefore, manual annotation was necessary to improve the salivary gland gene
models (Additional files 9 and 10). In particular, An. gambiae has 8 genes of the D7
family, which has modified odorant binding domains (OBD) that strongly bind
agonists of platelet aggregation and vasoconstriction (histamine, serotonin,
epinephrine and norepinephrine)[114].Three of these genes have two OBD’s while
the remaining five only have one domain each. As in An. gambiae, the short forms are
oriented in tandem and in the opposite orientation of the long form genes.
However, An. stephensi has apparently collapsed the second long form to create a
sixth short form.
2.3.7 Repeat content
Transposable elements (TEs) and other unclassified interspersed repeats constitute
7.1% of the assembled An. stephensi genome (Table 2.12.3; Additional file 11). TE
occupancy of the euchromatic genome in D. melanogaster and An. gambiae is 2% and
16%, respectively[43]. Thus variations in the size of the genomes correlate with
different amounts of repetitive DNA in these three species. More than 200 TEs have
been annotated. DNA transposons and miniature inverted-repeat TEs (MITEs)
comprise 0.44% of the genome. Non-LTR retrotransposons (or LINEs) comprise
2.36% of the genome. Short intersperse nuclear elements (SINEs), although less than
300 bp in length, are highly repetitive and comprise 1.7% of the genome. There is
considerable diversity among the LTR-retrotransposons although they occupy only
0.7% of the genome. Approximately 2% of the genome consists of interspersed
repeats that remain to be classified.
2.3.8 Genome landscape: a chromosomal arm perspective
The density of genes, TEs, and short tandem repeats (STRs) for each chromosome
were determined based on the physical map (Figure 2.11.4). The average numbers of
genes for each chromosome arm are consistent with those in An. gambiae. The X had
the lowest number of genes per 100 kb, and the highest densities of genes per 100 kb
20
were seen on 2R and 3L (Figure 2.11.5; Additional file 1: Tables S2 and S3).
Chromosomes 2R and 3L also contain the greatest numbers of polymorphic
inversions[115]. Genes functioning as drivers of adaptation could be expected to
occur in greater densities on chromosome arms with higher numbers of polymorphic
inversions[116].
Anopheles stephensi has a lower density of transposable elements across all
chromosome arms than An. gambiae (Figure 2.11.5; Additional file 1: Tables S2 and
S3; Additional file 12). The density of transposable elements on the An. stephensi X is
more than twice that of the autosomes. A comparison of the An. stephensi simple
repeat densities with those in An. gambiae euchromatin showed that densities in the
latter were ~2-2.5x higher (Figure 2.11.5; Additional file 1: Tables S2 and S3). The
greatest densities of simple repeats were found on the X chromosome and this is
consistent with a previous study in An. gambiae[50]. Although An. stephensi shows
lower densities of simple repeats across all arms compared to An. gambiae, its X
appears to harbor an overrepresentation of simple repeats compared to its autosomes.
Scaffold/Matrix-associated regions (S/MARs) can potentially affect chromosome
mobility in the cell nucleus and rearrangements during evolution[117, 118] and these
were found to be enriched in the 2L and 3R arms (Figure 2.11.5; Additional file 1:
Tables S2 and S3).
2.3.9 Molecular organization of pericentric heterochromatin
We observed clear differences in heterochromatin staining patterns when comparing
mitotic chromosome squashes prepared from imaginal discs of An. gambiae and An.
stephensi. An. stephensi appears to have more pericentric heterochromatin than An.
gambiae (Additional file 1: Figure S3). This is particularly evident in sex
chromosomes. Mitotic X chromosomes in An. stephensi possess much more
pericentric heterochromatin compared with X chromosomes from several different
strains of An. gambiae. Finally, the Y chromosome in An. stephensi has a large block
of heterochromatin. We further investigated whether particular tandem repeats are
concentrated in heterochromatin. Aste72A and Aste190A, the two repeats with
highest coverage in raw genomic data reads, were selected as probes for FISH
analysis (Additional file 13). Aste72A, which comprises approximately 1% of the raw
21
genomic reads, was mapped to the pericentric heterochromatin of X and Y
chromosomes (Figure 2.11.6). Aste190A, which comprises approximately 2% of the
raw genomic reads, was mapped to centromere of both autosomes (Additional file 1:
Figure S4). The Aste72A tandem repeat has a 26.7% mean GC-content and
contributes significantly to the AT-rich peak in the plot of GC distribution of raw
genomic reads (Additional file 1: Figure S5).
2.3.10 Y chromosome
Anopheles mosquitoes have heteromorphic sex-chromosomes where males are
heterogametic sex (XY) and females homogametic (XX)[119]. The high repetitive
DNA content of Y chromosomes makes them difficult to assemble and they often are
ignored in genome projects. An approach called the chromosome quotient[120] was
used to identify 57 putative Y sequences spanning 50,375 bp (Additional files 14 and
15). All of these sequences are less than 4,000 bp in length and appear to be highly
repetitive. Five BACs that appeared to be Y-linked based on the CQs of their end
sequences were analyzed by sequencing and their raw PacBio reads were assembled
with the HGAP assembler[121]. Eleven contigs spanning 196,498 bp of predicted Y-
linked sequences were obtained (Additional files 16 and 17). The 57 Y-linked
sequences and 11 contigs from the Y-linked BACs represent currently the most
abundant set of Y sequences in any Anopheles species. RepeatMasker analysis using
the annotated An. stephensi interspersed repeats showed that the An. stephensi Y
sequences comprise ~65% interspersed repeats. LTR retrotansposons alone occupy
~49% of the annotated Y (Additional files 18 and 19).
2.3.11 Synteny and gene order evolution
We used the chromosomal location and orientation of 6,448 1:1 orthologs from An.
gambiae and An. stephensi to examine synteny and estimate the number of
chromosomal inversions between these two species (Figure 2.11.7; Additional file
20). Syntenic blocks were defined as those in which all genes within the block had the
same order and orientation with respect to one another in both genomes. The X
chromosome has markedly more inversions than the autosomes. The number of
chromosomal inversions that might have happened since An. stephensi and An.
22
gambiae last shared a common ancestor were determined with GRIMM[122] and
SPRING[123]. We calculated the density of inversions per chromosome arm ignoring
breakpoint reuse and assuming two breakpoints per inversion (Additional file 1:
Tables S4 and S5). The length of An. gambiae euchromatin was used as a proxy for
the size of the An. stephensi chromosomes[124]. The density of inversions per
megabase on the X chromosome supports the conclusion that it is much more prone to
rearrangement than the autosomes. Another way of analyzing chromosome evolution
is to consider how likely genes are to be rearranged into a different order on any given
chromosome. We calculated the density of breaks per 100 genes for each
chromosomal arm. The results are consistent with the density of breaks per megabase.
Genes on the X are greater than four times more likely to change order than those on
the autosomes.
2.3.12 Rates of chromosome evolution in Drosophila and Anopheles
Recent studies have established that both Anopheles and Drosophila species have
high rates of chromosomal evolution as compared with mammalian species[42, 50,
125-131]. We compared the number of breaks per gene and breaks per megabase for
each chromosome to understand the differences in the rates of chromosome evolution
between Drosophila and Anopheles (Additional file 1: Tables S6 and S7). These
results reveal a high rate of gene order reshuffling in the mosquito X chromosome as
compared with autosomes, and even with the Drosophila X chromosome, which was
thought to have a high rate of rearrangements (Figure 2.11.8). We correlated densities
of different molecular features including simple repeats, TEs, genes, and S/MARs
with the rates of rearrangement calculated for each arm (Additional file 1: Tables S8-
S13). The strongest correlations were found among the rates of evolution across all
chromosome arms and the densities of microsatellites, minisatellites and satellites in
both An. gambiae and An. stephensi. The highly-positive correlations between rates of
inversion across all chromosome arms and satellites of different sizes are due most
likely to the co-occurring abundance of satellites and inversions on the X
chromosome. Rates of inversions and satellite densities are much lower on the
autosomes. From the autosomal perspective, S/MARs were moderately correlated
negatively with fixed inversions and polymorphic inversions.
23
2.4 Conclusions
The genome assembly of the type-form of the Indian strain of An. stephensi was
produced using a combination of 454, Illumina, and PacBio sequencing and verified
by analysis of BAC clones and ESTs. Physical mapping was in complete agreement
with the genome assembly and resulted in a chromosome-based assembly that
includes 62% of the genome. Such an assembly enabled analysis of chromosome arm-
specific differences that are seldom feasible in next-gen genome projects.
Comparative analyses between An. stephensi and An. gambiae showed that
the Anopheles X has a high rate of chromosomal rearrangement as compared with
autosomes, despite the lack of polymorphic inversions in the X chromosomes in both
species. Additionally, the difference between the rates of X chromosome and
autosome evolution is much more striking in Anopheles than in Drosophila. The high
rate of evolution in X correlates well with the density of simple repeats. Our data
indicate that overall high rates of chromosomal evolution are not restricted
to Drosophila but may be a feature common to Diptera.
The genome landscape of An. stephensi is characterized by relatively low repeat
content compared to An. gambiae. Anopheles stephensi appears to have larger amount
of repeat-rich heterochromatin in pericentric regions but far less repetitive sequences
in chromosomal arms as compared with An. gambiae. Using a newly developed
chromosome quotient method, we identified a number of Y-chromosome contigs and
BACs, which together represent currently the most abundant set of Y sequences in
any Anopheles species.
The current assembly contains 11,789 predicted protein coding genes, 127 miRNA
genes, 434 tRNA genes, and 53 fragments of rRNA
genes. Anopheles stephensi appears to have fewer gene duplications than An.
gambiae according to orthology analysis, which may explain the slightly lower
number of gene models.
This genome project is accompanied by the first comprehensive RNAseq-based
transcriptomic analysis of an Anopheles mosquito. Twenty gene clusters were
24
identified according to gene expression profiles, many of which are stage or sex-
specific. GO term analysis of these gene clusters provided biological insights and
leads for important research. For example, male-biased genes were enriched for genes
involved in spermatogenesis and the detection of sound.
Close attention was paid to genes involved innate immunity including LRIMS, APL1,
and proteins in the Toll, IMD, insulin, and TGF- signaling pathways. High level of
orthology is generally observed between An. stephensi and An. gambiae. RNAseq
analysis, which was corroborated by other expression analysis methods, provided
novel insights. For example, a protein known to interact with both TOR and TGF-
signaling pathways showed intriguingly abundant mRNA expression in a wide range
of tissues, providing new leads for insights into both TOR and TGF- signaling in
mosquitoes.
2.5 Methods
2.5.1 Strain selection
We chose to sequence the Indian strain of An. stephensi, a representative of the type
form. The lab colony from which we selected mosquitoes for sequencing was
originally established from wild mosquitoes collected in India. The lab colony has
been maintained continuously for many generations so we did not attempt to inbreed
it.
2.5.2 Sample collection
DNA was isolated from more than 50 adult male and female An. stephensi using the
Qiagen (Hilden, Germany) DNeasy Blood and tissue kit following the suggested
protocol. The integrity of the DNA was verified by running an aliquot on a 1%
agarose gel to visualize any degradation. Total RNA was isolated using the standard
protocol of the mirVana RNA isolation kit (Life Technologies, Carlsbad, CA).
2.5.3 Sequencing
The An. stephensi genome was sequenced to 19.4x coverage using 454 FLX Titanium
sequencing performed by the Virginia Bioinformatics Institute (VBI) core laboratory.
Sequencing was performed on four different libraries: a single-end shotgun library,
and 3 kb, 8 kb and 20 kb mate-pair libraries. A 200bp insert size library produced
25
from male An. stephensi genomic DNA was prepared and subjected to a single lane of
Illumina HiSeq. Genomic DNA from male An. sequence was subjected to 10 SMRT
cells of Pacific Biosciences (PacBio) v1 sequencing. Sanger sequencing performed by
Amplicon Express was used to sequence 7,263 BAC-ends.
2.5.4 Genome assembly
We used several approaches to combine the Illumina and 454 data to generate a better
assembly. Newbler can take raw Illumina data as input, so we tried a Newbler
assembly with the 454 and Illumina data. However, this resulted in a worse assembly
than 454 alone. We had much more success with the strategy used to assemble the
Solenopsis invicta genome[132]. First we assembled the Illumina data then cut the
assembly into pseudo-454 reads, and then used these reads along with the real 454
data as input to Newbler[133].
2.5.5 De novo Illumina assembly with Celera
We assembled the paired-end Illumina reads using the Celera assembler[134] with the
parameters: ”overlapper = ovl; unitigger = bogart; utgBubblePopping = 1;
kickOutNonOvlContigs = 1; cgwDemoteRBP = 0; cgwMergeMissingThreshold = 0.5;
merSize = 14”. The Celera assembler output comprise 41,213 contigs spanning 212.8
Mb. The N50 contig size of this assembly was 16.8 kb.
2.5.6 De novo 454 and Illumina pseudo-454 reads assembly with Newbler 2.8
The contigs of the aforementioned Illumina assembly were shredded informatically
into 400 bp pieces with overlapping 200 bp to approximate 454 reads. To artificially
simulate coverage depth, we started the shredding at offsets of: 0, 10, and 20.
Shredding the Illumina assembly resulted in 2,452,038 pseudo-454 reads simulating
4.17x coverage.
We generated an assembly of the 454 and pseudo-454 reads with Newbler 2.8 using
the ”-het -scaffold -large -s 500” parameters. The resulting assembly contained 23,595
scaffolds spanned 221 Mb. The scaffold N50 size was 1.34 Mb. Mitochondrial DNA
(1 scaffold), and other contamination (87 scaffolds) were identified by blastn and
removed from the assembly.
26
2.5.7 Gap-filling with PacBio Reads
PacBio data was used to fill gaps in the scaffolds to further improve the genome
assembly. We error-corrected raw PacBio reads using the 454 sequencing data with
the Celera pacBioToCa pipeline. pacBiotoCa produced 0.88 Gb of error-corrected
PacBio reads. Using the error-corrected PacBio data as input, Pbjelly[135] was used
to fill gaps with parameters: ”-minMatch 30 -minPctIdentity 98 -bestn 10 -n
Candidates 5 -maxScore -500 -nproc 36-noSplitSubreads”. Pbjelly filled 1,310 gaps
spanning 5.4 Mb.
2.5.8 Further Scaffolding with BAC-ends
The scaffolds of the assembly were improved subsequently through the integration of
3,527 BAC-end pairs (120 kb ± 70 kb) using the Bambus scaffolder[136] (Additional
file 21). The BAC-end sequences were mapped to the scaffolds using Nucmer[137].
The output files were used to generate the ”.contig” format files required for Bambus.
In total, 275 links between scaffolds were detected. Of these, 169 were retained as
potential valid links, which are links connected by uniquely mapped BAC-ends. Links
confirmed by less than two BAC-ends were rejected. A total of 46 links were retained
that together connected 22 scaffolds, increasing the N50 scaffold size from 1,378 kb
to 1,572 kb.
2.5.9 Assembly Validation
CEGMA (Core Eukaryotic Genes): We used CEGMA[138] to search for the number
of core eukaryotic genes to test the completeness and correctness of the genome
assembly. CEGMA provides additional information as to whether the entire core
eukaryotic genes are present (>70%) or only partially present (>20% and <70%). In
total, CEGMA found 96.37% of the 248 core eukaryotic genes to be present, and
97.89% of the core eukaryotic genes to be partially present.
BAC-ends: We checked whether BAC-ends align concordantly to the genome to
study the structural correctness of the de novo assembly. BAC-ends were aligned to
the scaffolds using NUCMER. In order to ensure unambiguous mapping, only
sequences that aligned to a unique location with >95% coverage and 99% identity
were used. In total, 21.6% of the BAC-end sequence pairs could be aligned to a
27
unique position in the An. stephensi genome with these stringent criteria. Pairs of
BAC-end sequence that aligned discordantly to a single scaffold were considered
indicative of potential mis-assembly. Only 4 of 717 aligned BAC-end pairs aligned
discordantly with the assembly confirming overall structural correctness.
ESTs: An. stephensi EST sequences were downloaded from both the NCBI and
VectorBase. We screened the EST sequences to remove any residual vector sequence.
The screened ESTs were aligned to the assembly with GMAP[139]. In total, 35,367
out of 36,064 ESTs aligned to the assembly. Of these, 26,638 aligned over at least
95% of their length with an identity >98%. The high percentage of aligned ESTs
demonstrates the near-completeness of the An. stephensi genome assembly.
Fluorescent in situ hybridization (FISH) - Slides were prepared from ovaries of lab
reared, half-gravid females of the An. stephensi Indian wild-type strain. Slide
preparation and hybridization experiments followed the techniques described in
Sharakhova et al[124]. Fluorescent microscope images were converted to black and
white and inverted in adobe photoshop. FISH signals were mapped to specific bands
or interbands on the physical map for An. stephensi presented by Sharakhova et
al[140].
2.5.10 Constructing the Physical Map
For the chromosomal based genome assembly, all probes mapped by in situ
hybridization by Sharakhova[140] and this study were aligned to the final version of
the An. stephensi genome using NCBI blast+ blastn. Different blastn parameters were
used for probes from different sources to determine if the probe was kept in the final
assembly. An e-value of 1e-40 and an identity of >95% was required for probes from
An. stephensi. An e-value of 1e-5 was required for probes from species other than An.
stephensi. Probes that mapped to more than one location in the genome were
discarded. The work by Sharakhova et al[140] hybridized 345 probes however, only
~200 probes from that study were maintained in the final chromosomal assembly. An
additional 27 PCR products and BAC clones were hybridized to increase the coverage
of our chromosomal assembly.
28
2.5.11 Annotation
The genome assembly was annotated initially using the MAKER pipeline[141]. This
software synthesizes the results from ab initio gene prediction with experimental gene
evidence to produce final annotations. Within the MAKER framework,
RepeatMasker[142] was used to mask low-complexity genomic sequence based on
the repeat library from previous prediction. First, ESTs and proteins were aligned to
the genome by MAKER using BLASTn and BLASTx, respectively. MAKER uses the
program Exonerate to polish BLAST hits. Next, within the MAKER framework,
SNAP[143] and AUGUSTUS[144] were run to produce ab initio gene predictions
based on the initial training data. SNAP and AUGUSTUS were run once again inside
of MAKER using the initial training obtained from the ESTs and protein alignments
to produce the final annotations.
2.5.12 Orthology
Orthologs of predicted An. stephensi genes were assigned by OrthoDB[145].
Information about orthologous genes for An. gambiae, Ae. aegypti, and D.
melanogaster also were downloaded from OrthoDB. Enrichment analysis was
performed for categories of orthologs using the methods provided in the ontology
section.
2.5.13 Transcriptomics
RNA-seq from 11 samples including: 0-1, 2-4, 4-8, and 8-12 hour embryos, larva,
pupa, adult males, adult females, non-blood-fed ovaries, blood-fed ovaries, and
female carcass without ovaries as described[100] were used for transcriptome
analysis. These RNA-seq samples are available from the NCBI SRA (SRP013839).
Tophat[146] was used to align these RNA-seq reads to the An. stephensi genome and
HTSeq-count [147] was used to generate an occurrence table for each gene in each
sample. The numbers of alignments to each gene in each sample then were clustered
using MBCluster.Seq[148], an R package designed to cluster genes by expression
profile based on Poisson or Negative-Binomial models. MBCluster.Seq generated 20
clusters. To visualize these results we performed regularized log transformation to the
original occurrence tables for all 20 clusters using DESeq2[149]. The results were
plotted using ggplot2[150].
29
2.5.14 Ontology
Gene ontology (GO) terms were assigned for the 20 clusters of predicted An.
stephensi genes. GO terms were assigned using Blast2Go[151]. The predicted
proteins is blasted against the NCBI non-redundant protein database and scanned with
InterProScan[152] against InterPro's signatures. We also identified enzymatic
functions according to the KEGG map module within Blast2GO. After GO terms
were assigned, GO-slim results were generated for the available annotation based on
the Generic GO slim mapping. The GO terms assigned by Blast2GO were subject to
GO term enrichment. Overrepresented GO terms were identified using a
hypergeometric test using the GOstats package in R[153].
2.5.15 noncoding RNA
We used tRNAScan-SE[154] with the default eukaryotic mode to predict 434 tRNAs
in the An. stephensi genome (Additional file 1: Table S14; Additional file 22). Other
noncoding RNAs were predicted with INFERNAL[155] by searching against Rfam
database version 11.0[156]. A total of 53 fragmental ribosomal RNA, 34 snRNA, 7
snoRNA, 127 miRNA, and 148 sequences with homology to the An. gambiae self-
cleaving riboswitch were predicted at an e-value cutoff of 1e-5.
2.5.16 Transposable elements and other interspersed repeats
Transposable element discovery and classification were performed on the An.
stephensi scaffold sequences using previously-described pipelines for LTR-
retrotransposons, non-LTR-retrotransposons, SINEs, DNA-transposons, and MITEs,
followed by manual inspection[157]. The manually-annotated TE libraries then were
compared with the RepeatModeler output to remove redundancy and to correct mis-
classification by RepeatModler. A repeat library was produced that contains all
manually-annotated TEs and non-redundant sequences from RepeatModeler. The
repeat library was used to run RepeatMasker at default settings on the An. stephensi
assembly to calculate TE copy number and genome occupancy.
2.5.17 Simple repeats
To quantify the number of microsatellites, minisatellites, and satellites present in the
mapped scaffolds for each chromosome, these scaffolds were divided into strings of
100,000 bp and then concatenated into a multi-FASTA file representing an An.
30
stephensi pseudo chromosome. Scaffolds were oriented when possible, and all
unoriented scaffolds were given the default positive orientation for that chromosome.
The multiFASTA file for each pseudo-chromosome was analyzed using a local copy
of TandemRepeatsFinder v 4.07b[158]. Parameters for the analysis followed those
used by Xia et al, 2010: microsatellites were those of period size 2-6 with copy
number of 8+. Minisatellites had period size 7-99 while repeats were considered
satellites if they had a period size of 100+. Both satellites and minisatellites were
considered only if they had a copy number of 2+. Simple repeats were recorded only
if they had at least 80% identity.
2.5.18 Identification of S/MARs
Scaffold/matrix associated regions were identified using the SMARTest bioinformatic
tool provided by Genomatix[159]. Densities of genes and TEs per 100 kb window
were calculated using Bedtools coverage based on the genome annotation and TE
annotation respectively.
2.5.19 Synteny, gene order evolution, and inversions
One-to-one orthologs from An. gambiae and An. stephensi were identified using
OrthoDB and their locations on the An. gambiae and An. stephensi scaffolds
determined. Comparative positions of the genes on the scaffolds based on ontology
relationships were plotted using genoPlotR. Scaffolds that mapped using two or more
probes were oriented properly, but those anchored by only one probe were used in
their default orientation. The number of synteny blocks for each pair of homologous
chromosome arms between An. stephensi and An. gambiae was determined from the
images output from genoPlotR. Two criteria were imposed to determine the number
of synteny blocks: the orientation of orthologous genes, and whether genes remained
in the same order on the chromosome of An. stephensi as in An. gambiae. Thus, a
group of genes is assigned to the same synteny block if it has the same orientation and
order in both species. Synteny blocks were numbered 1,2,3,4 ...etc. along the
chromosome by assigning An. gambiae as the default gene order. Anopheles stephensi
was considered rearranged compared to An. gambiae when the numbering of synteny
blocks was the same in both species but the order was rearranged in An. stephensi.
After quantifying the number of synteny blocks and the amount of gene
rearrangement between the two species, we estimated the number of chromosomal
31
inversions between them using the programs Genome Rearrangements in Mouse and
Man (GRIMM[122]) and Sorting Permutation by Reversals and block-INterchanGes
(SPRING [123]).
2.6 Data access
The An. stephensi genome assembly has been deposited in GenBank under the
accession number ALPR00000000 and is available at www.VectorBase.org. The raw
sequence data used for genome assembly is available in the NCBI SRA: 454 -
SRP037783, Illumina - SRP037783 and PacBio - SRP037783. The BAC-ends used
for scaffolding are available from the NCBI dbGSS accession numbers: KG772729 -
KG777469. RNA-Seq data can be accessed at the NCBI SRA with ID SRP013839.
2.7 Additional files
Additional file 1: this file includes supplemental text, supplemental figures, and
supplemental Tables.
Additional files 2-22 are provided as Additional_Files2-22.tar.gz. We also provide a
link for all additional files in case the reviewers find it useful
(http://tu08.fralin.vt.edu/share/Additional%20Files/)
Additional file 2: Physical Map Data.xlsx
Additional file 3: Lists of genes in clusters.xlsx
Additional file 4: Cluster ontology.txt
Additional file 5: Sex-biased genes list and GO terms.xlsx
Additional file 6: Revised annotation for immunity-related genes.gff3
Additional file 7: Sequences of immunity-related genes.fasta
Additional file 8: RNA-seq expression profile of immunity-related genes.xlsx
Additional file 9: Revised annotation for salivary genes
Additional file 10: Sequences of salivary genes
Additional file 11: Repeat sequences
Additional file 12: Genome Landscape.xlsx
Additional file 13: Tandem repeat sequences.fa
Additional file 14: Chromosome quotients of putative Y-linked scaffolds
Additional file 15: Sequences of putative Y-linked scaffolds
Additional file 16: Chromosome quotients of Y-linked BACs
Additional file 17: Sequences of Y-linked BACs
Additional file 18: Repeat masker output of Y-linked BACs and Y-linked scaffolds
Additional file 19: Repeat masker output of Y-linked BACs
Additional file 20: Synteny Blocks.docx
Additional file 21: BAC-ends dbGSS accession numbers.txt
Additional file 22: Non-coding RNA annotation.txt
32
2.8 Author contributions
Conceived and designed experiments: ZT and IVS; Data generation, analysis and
presentation: XJ, AP, AS, ABH, MK, MVS, AK, BW, CO, DL, KE, KM, JMCT,
JMCR, MAR, MRR, MU, NP, PA, PG, RK, RS, RMW, SL, SM, VLMD, YQ, ZT;
Writing of the manuscript: XJ, ABH, AAJ, AP, AS, JMCR, KDV, KM, KP, MK,
MAR, MMR, SL, IVS, and ZT; Provided resources and tools and critical reviewed
manuscript: XC, YS
2.9 Acknowledgements
This work is supported by the Fralin Life Science Institute and the Virginia
Experimental Station, and by NIH grants AI77680 and AI105575 to ZT, AI094289
and AI099528 to IVS, AI29746 to AAJ, AI095842 to KM, AI073745 to MAR,
AI080799 and AI078183 to SL, AI042361 and AI073685 to KDV. RMW is
supported by Marie Curie International Outgoing Fellowship PIOF-GA-2011-303312.
XC is supported by GDUPS (2009). YS thanks the Department of Biotechnology,
Government of India for the financial support.
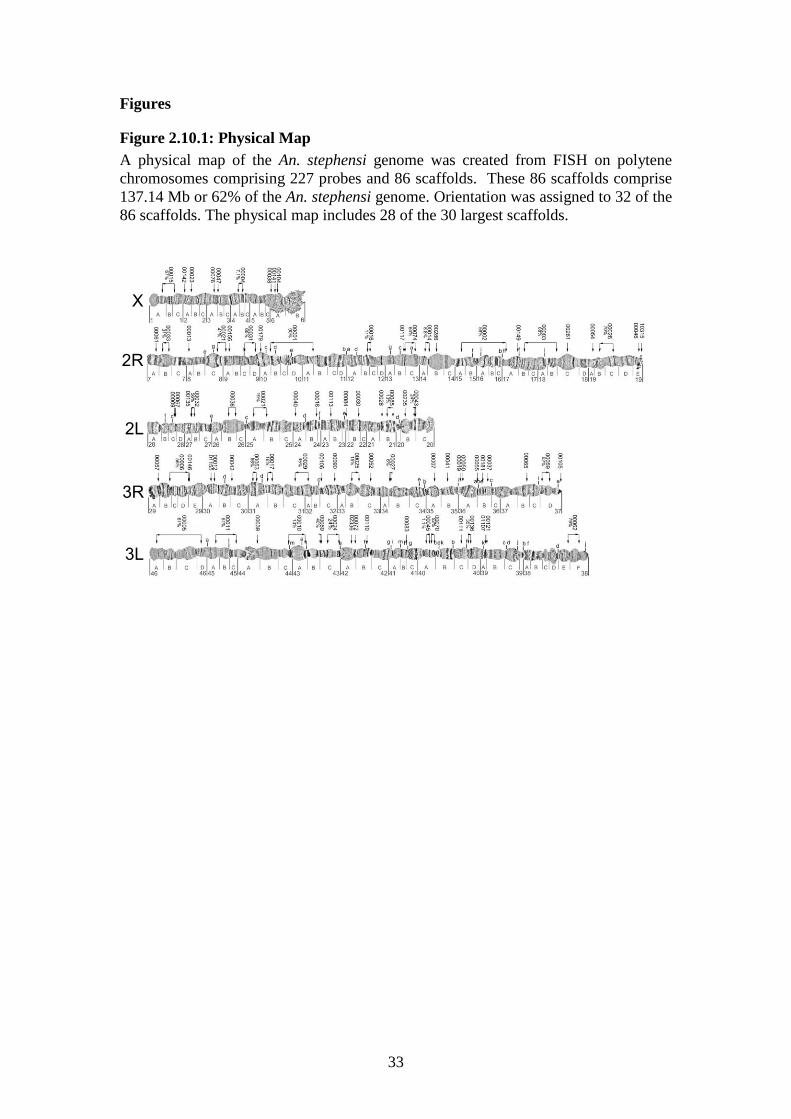
33
Figures
Figure 2.10.1: Physical Map
A physical map of the An. stephensi genome was created from FISH on polytene
chromosomes comprising 227 probes and 86 scaffolds. These 86 scaffolds comprise
137.14 Mb or 62% of the An. stephensi genome. Orientation was assigned to 32 of the
86 scaffolds. The physical map includes 28 of the 30 largest scaffolds.
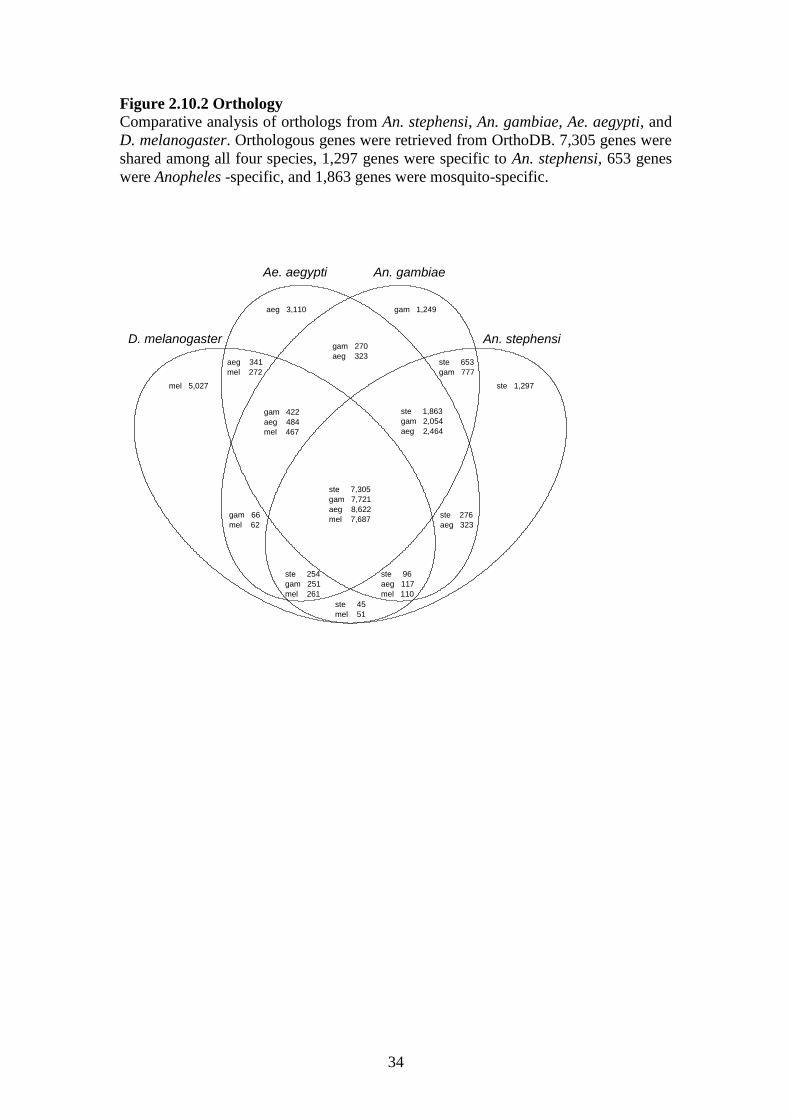
34
Figure 2.10.2 Orthology Comparative analysis of orthologs from An. stephensi, An. gambiae, Ae. aegypti, and
D. melanogaster. Orthologous genes were retrieved from OrthoDB. 7,305 genes were
shared among all four species, 1,297 genes were specific to An. stephensi, 653 genes
were Anopheles -specific, and 1,863 genes were mosquito-specific.
An. stephensi
Ae. aegypti
D. melanogaster
An. gambiae
mel 5,027
ste 45
mel 51
ste 254
gam 251
mel 261
ste 96
aeg 117
mel 110
ste 7,305
gam 7,721
aeg 8,622
mel 7,687gam 66
mel 62
ste 276
aeg 323
gam 422
aeg 484
mel 467
ste 1,863
gam 2,054
aeg 2,464
gam 270
aeg 323aeg 341
mel 272
ste 653
gam 777
ste 1,297
aeg 3,110 gam 1,249
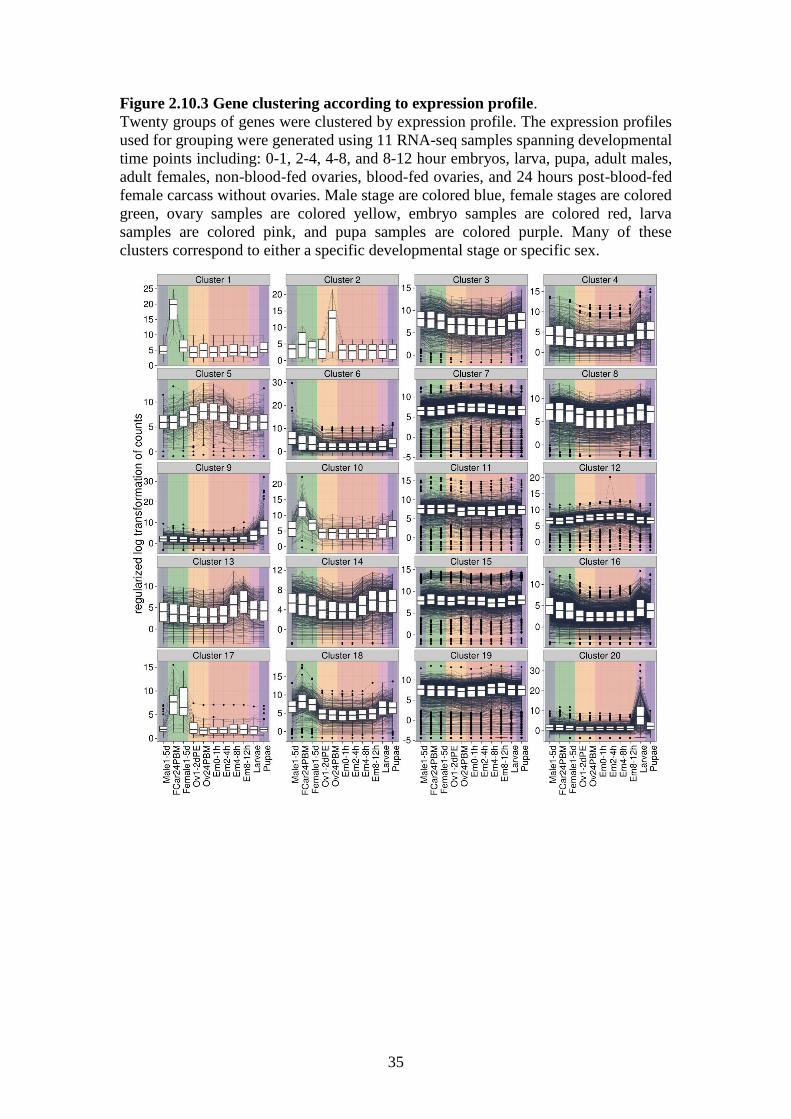
35
Figure 2.10.3 Gene clustering according to expression profile.
Twenty groups of genes were clustered by expression profile. The expression profiles
used for grouping were generated using 11 RNA-seq samples spanning developmental
time points including: 0-1, 2-4, 4-8, and 8-12 hour embryos, larva, pupa, adult males,
adult females, non-blood-fed ovaries, blood-fed ovaries, and 24 hours post-blood-fed
female carcass without ovaries. Male stage are colored blue, female stages are colored
green, ovary samples are colored yellow, embryo samples are colored red, larva
samples are colored pink, and pupa samples are colored purple. Many of these
clusters correspond to either a specific developmental stage or specific sex.
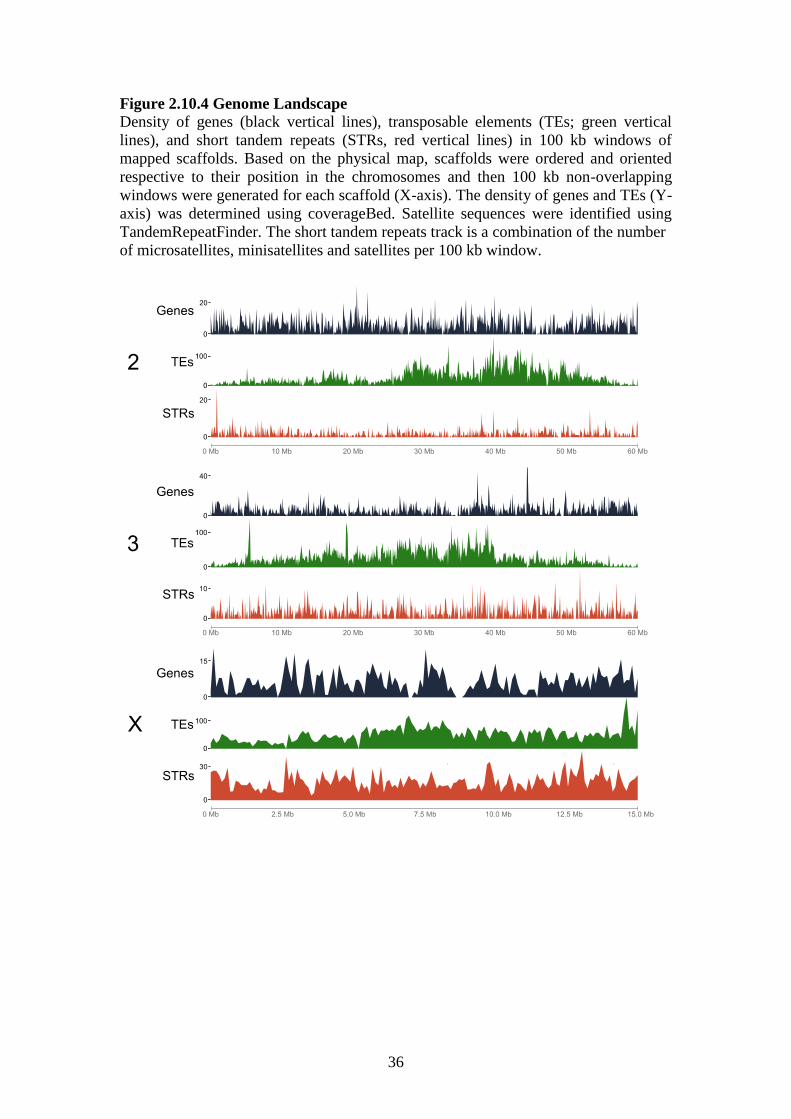
36
Figure 2.10.4 Genome Landscape Density of genes (black vertical lines), transposable elements (TEs; green vertical
lines), and short tandem repeats (STRs, red vertical lines) in 100 kb windows of
mapped scaffolds. Based on the physical map, scaffolds were ordered and oriented
respective to their position in the chromosomes and then 100 kb non-overlapping
windows were generated for each scaffold (X-axis). The density of genes and TEs (Y-
axis) was determined using coverageBed. Satellite sequences were identified using
TandemRepeatFinder. The short tandem repeats track is a combination of the number
of microsatellites, minisatellites and satellites per 100 kb window.
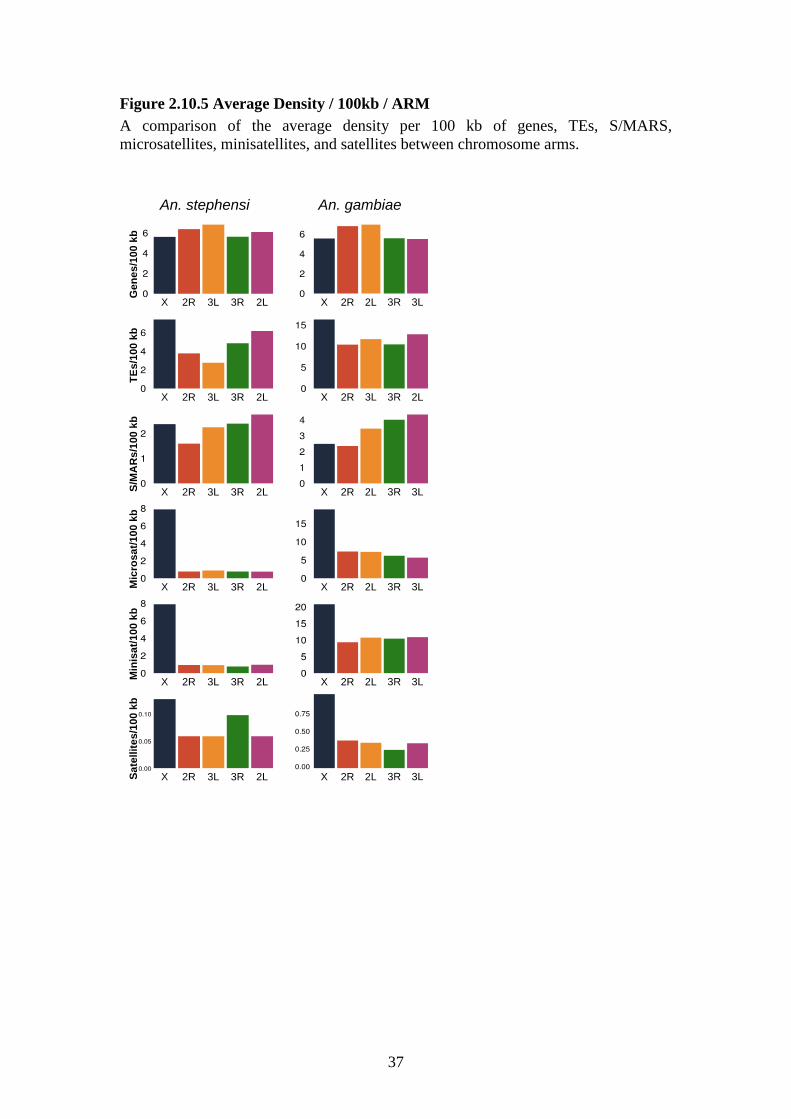
37
Figure 2.10.5 Average Density / 100kb / ARM
A comparison of the average density per 100 kb of genes, TEs, S/MARS,
microsatellites, minisatellites, and satellites between chromosome arms.
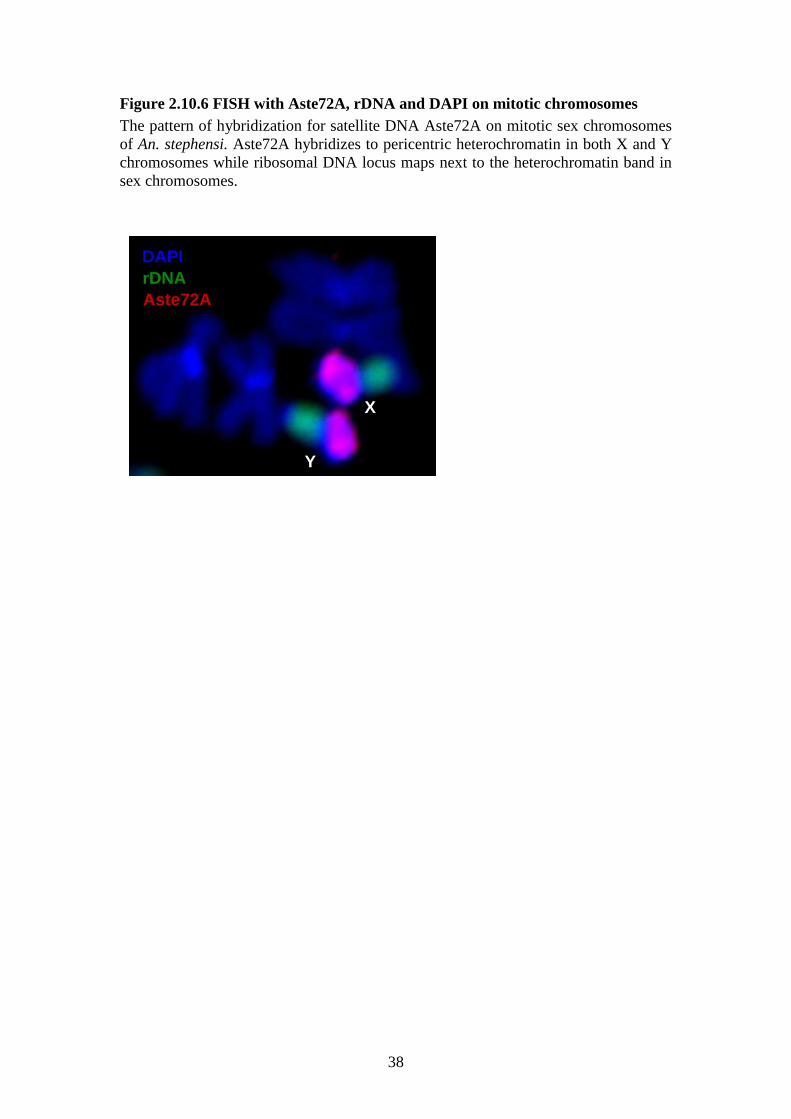
38
Figure 2.10.6 FISH with Aste72A, rDNA and DAPI on mitotic chromosomes
The pattern of hybridization for satellite DNA Aste72A on mitotic sex chromosomes
of An. stephensi. Aste72A hybridizes to pericentric heterochromatin in both X and Y
chromosomes while ribosomal DNA locus maps next to the heterochromatin band in
sex chromosomes.
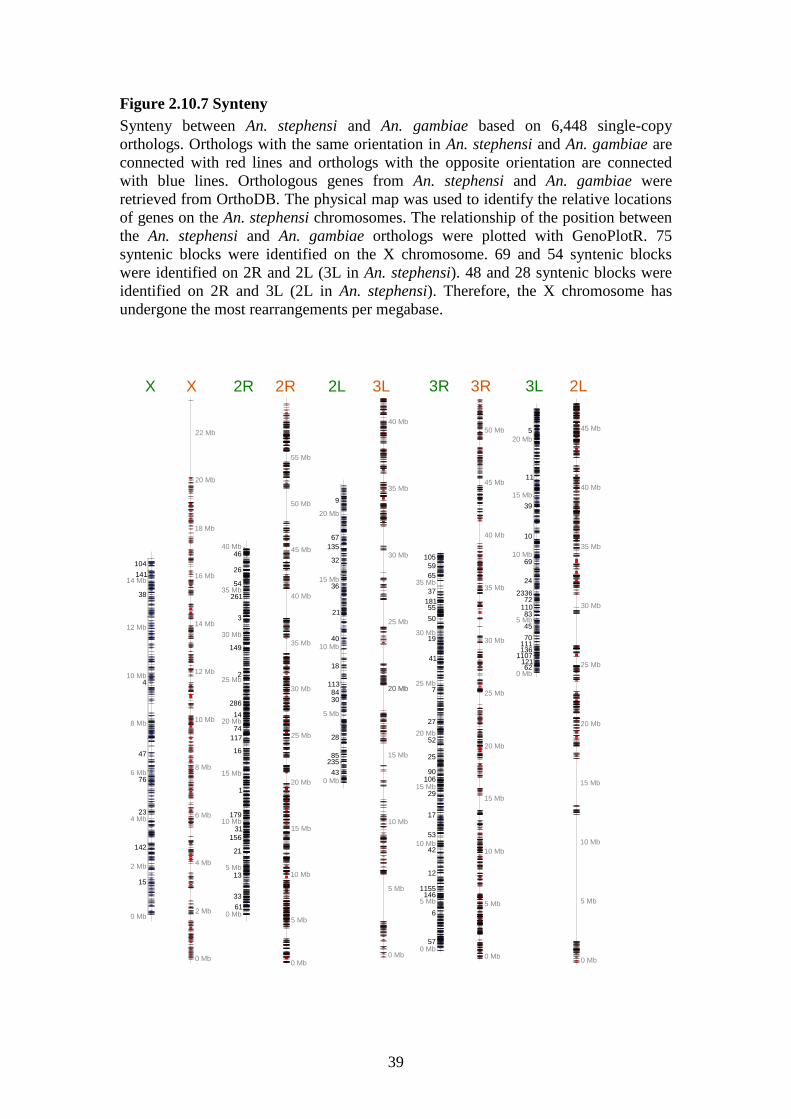
39
Figure 2.10.7 Synteny
Synteny between An. stephensi and An. gambiae based on 6,448 single-copy
orthologs. Orthologs with the same orientation in An. stephensi and An. gambiae are
connected with red lines and orthologs with the opposite orientation are connected
with blue lines. Orthologous genes from An. stephensi and An. gambiae were
retrieved from OrthoDB. The physical map was used to identify the relative locations
of genes on the An. stephensi chromosomes. The relationship of the position between
the An. stephensi and An. gambiae orthologs were plotted with GenoPlotR. 75
syntenic blocks were identified on the X chromosome. 69 and 54 syntenic blocks
were identified on 2R and 2L (3L in An. stephensi). 48 and 28 syntenic blocks were
identified on 2R and 3L (2L in An. stephensi). Therefore, the X chromosome has
undergone the most rearrangements per megabase.
43
23585
28
3084
113
18
40
21
36
32
135
67
9
15 Mb
0 Mb
5 Mb
10 Mb
20 Mb
0 Mb
5 Mb
10 Mb
15 Mb
20 Mb20 Mb
25 Mb
30 Mb
35 Mb
40 Mb
15
142
23
76
47
4
38
141
104
0 Mb
2 Mb
4 Mb
6 Mb
8 Mb
10 Mb
12 Mb
14 Mb
0 Mb
2 Mb
4 Mb
6 Mb
8 Mb
10 Mb
12 Mb
14 Mb
16 Mb
18 Mb
20 Mb
22 Mb
62121
110713611170
45
8311072
2336
24
69
10
39
11
5
0 Mb
5 Mb
10 Mb
15 Mb
20 Mb
0 Mb
5 Mb
10 Mb
15 Mb
20 Mb
25 Mb
30 Mb
35 Mb
40 Mb
45 Mb
61
33
13
21
156
31
179
1
16
117
74
14
286
2
149
3
261
54
26
46
0 Mb
5 Mb
10 Mb
15 Mb
20 Mb
25 Mb
30 Mb
35 Mb
40 Mb
0 Mb
5 Mb
10 Mb
15 Mb
20 Mb
25 Mb
30 Mb
35 Mb
40 Mb
45 Mb
50 Mb
55 Mb
2R2R 3L2LX X 2L3L
6
1155
12
42
53
17
29
10690
25
52
27
7
41
19
50
55181
37
65
59
105
57
146
0 Mb
5 Mb
10 Mb
15 Mb
20 Mb
25 Mb
30 Mb
35 Mb
0 Mb
5 Mb
10 Mb
15 Mb
20 Mb
25 Mb
30 Mb
35 Mb
40 Mb
45 Mb
50 Mb
3R 3R

40
Figure 2.10.8 Breaks per 100 Genes per million years in Anopheles and
Drosophila.
These results reveal a high rate of gene order reshuffling in the X chromosome as
compared with autosomes, and even with the Drosophila X chromosome.
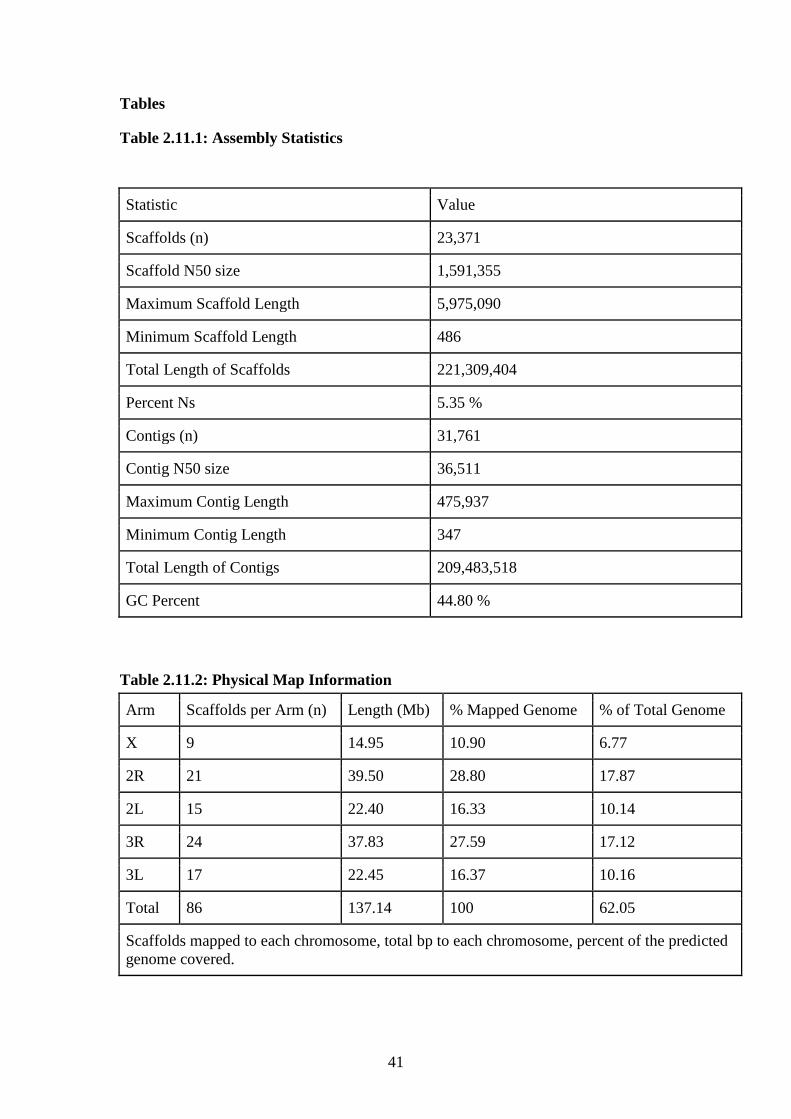
41
Tables
Table 2.11.1: Assembly Statistics
Statistic Value
Scaffolds (n) 23,371
Scaffold N50 size 1,591,355
Maximum Scaffold Length 5,975,090
Minimum Scaffold Length 486
Total Length of Scaffolds 221,309,404
Percent Ns 5.35 %
Contigs (n) 31,761
Contig N50 size 36,511
Maximum Contig Length 475,937
Minimum Contig Length 347
Total Length of Contigs 209,483,518
GC Percent 44.80 %
Table 2.11.2: Physical Map Information
Arm Scaffolds per Arm (n) Length (Mb) % Mapped Genome % of Total Genome
X 9 14.95 10.90 6.77
2R 21 39.50 28.80 17.87
2L 15 22.40 16.33 10.14
3R 24 37.83 27.59 17.12
3L 17 22.45 16.37 10.16
Total 86 137.14 100 62.05
Scaffolds mapped to each chromosome, total bp to each chromosome, percent of the predicted
genome covered.
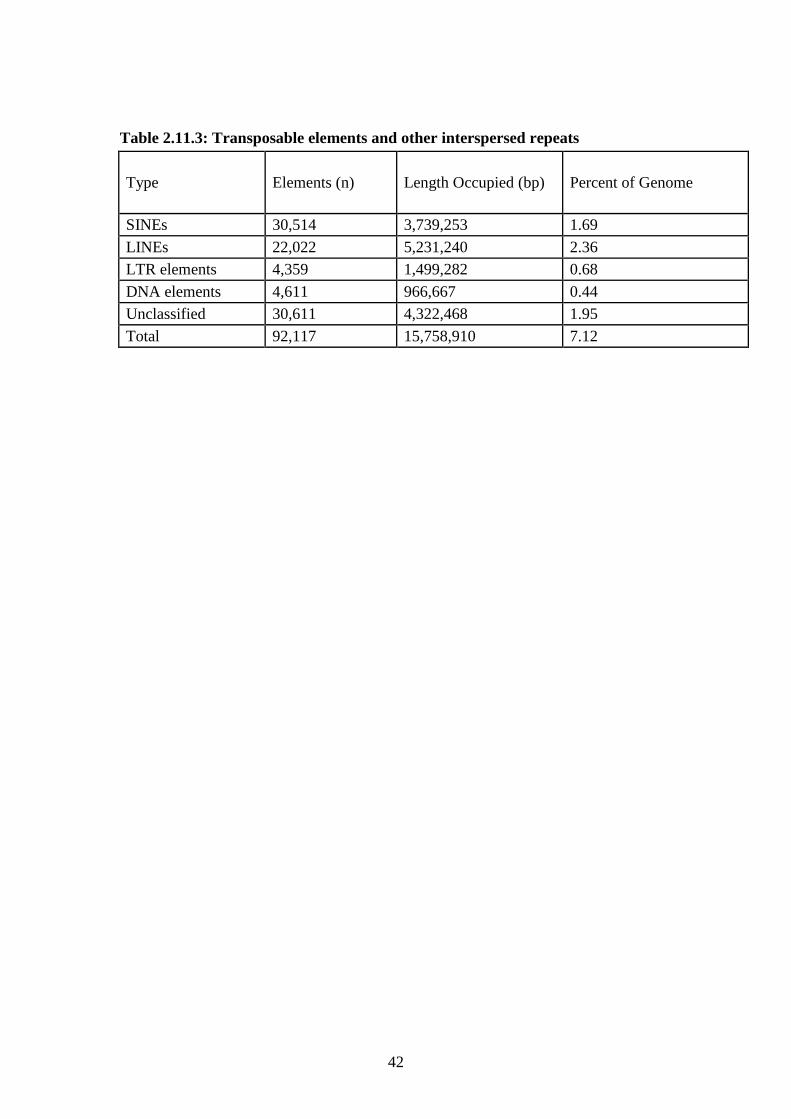
42
Table 2.11.3: Transposable elements and other interspersed repeats
Type Elements (n) Length Occupied (bp) Percent of Genome
SINEs 30,514 3,739,253 1.69
LINEs 22,022 5,231,240 2.36
LTR elements 4,359 1,499,282 0.68
DNA elements 4,611 966,667 0.44
Unclassified 30,611 4,322,468 1.95
Total 92,117 15,758,910 7.12
43
Chapter 3: A physical genome map of Neotropical malaria vector Anopheles
albimanus
3.1 Abstract
The genome assembly of the Neotropical malaria vector Anopheles albimanus is the
smallest among 16 malaria mosquito genomes. Preliminary physical mapping placed
~75% of the genome to the drawn cytogenetic map. However, a detailed physical
genome map was still lacking. In this study we develop a high resolution photomap
with completely straightened polytene chromosomes from the salivary glands of the
mosquito. Based on this map we construct a physical genome map utilizing
fluorescent in situ hybridization of PCR amplified DNA probes to the chromosomes.
This physical map orders and orients 32 genomic supercontigs comprising 96% of the
genome and currently represents the most compete physical genome map among
Anopheles. The study reveals that several of the largest genomic supercontigs are
misassembled. Based on additional sequence analysis these supercontigs are now
divided into 2-4 smaller supercontigs. Thus, our study demonstrates that physical
mapping is a powerful tool for improving the quality of draft genome assemblies for
mosquitoes.
3.2 Introduction
Anopheles albimanus is one of the dominant malaria vectors in the Americas
[160]. This species is widely distributed in the Neotropical region stretching from the
southern United States to northern Peru and the Caribbean Islands. It is the major
contributor to malaria transmission in the coastal areas of this region. Like other
species from this Neotropical region, An. albimanus is a member of subgenus
Nyssorhynchus. Unlike other species from genus Anopheles that usually belong to
species complexes, no evidence for cryptic species of this vector has been described
[161, 162]. The availability of morphological mutants and biochemical markers
allowed development of a genetic linkage map for An. albimanus [163]. This map was
later integrated with microsatellite markers [53].
Like other mosquitoes from the genus Anopheles, An. albimanus has high
quality polytene chromosomes in salivary glands, [164] and this species is well
studied cytogenetically. The first drawn map and detailed description of
chromosomal banding patterns for An. albimanus was developed by W. Keppler in
1973 [165]. This paper also determined that chromosomes of An. albimanus are
44
remarkably uniform, with no rearrangements between strains. This lack of
chromosomal polymorphism is unusual for Anopheles [60, 61]. A comprehensive
cytogenetic study conducted later, on samples from 11 distant localities in Columbia,
found only one small inversion on chromosome X. This inversion was present in low
frequency and only in certain populations [162]. Comparisons of the chromosomal
banding patterns also revealed no similarities between An. albimanus chromosomes
and other Anopheles from subgenus Cellia and Anopheles [165]. Recognizable
banding patterns that can be used for arm homology reconstruction were only found
within the species from subgenus Nyssorhynchus, which includes An. albimanus. The
first successful in situ hybridization on chromosomes of An. albimanus was
performed using histone genes from Drosophila melanogaster [166].
The first cytogenetic photomap for the salivary gland polytene chromosomes
of An. albimanus delineated further banding details relative to previously published
drawn maps, and represented a vast improvement in photomapping in this species
[47]. After molecular cytogenetic techniques were developed for the African malaria
vector, An. gambiae [167, 168], An. albimanus was the first mosquito investigated for
interspecies chromosome comparison by cross in situ hybridization [47]. Direct
mapping of 17 DNA probes from An. gambiae onto chromosomes of An. albimanus
allowed reconstruction of arm homology between the species from two different
subgenera- Cellia and Nyssorhynchus. It was demonstrated that autosomes of these
mosquitoes are rearranged in a whole-arm translocation manner. The study also found
numerous paracentric inversions within chromosomal arms but no pericentric
inversions or partial arm translocations. . Interspecies in situ hybridization was later
applied to explore chromosomal rearrangements in other Anopheles species [50, 125,
169]. These studies revealed that the whole-arm translocations and paracentric
inversions within chromosomal arms are common rearrangements in genus
Anopheles.
The genomics era has offered new opportunities to study chromosomal
evolution in mosquitoes. The An. albinamus genome was sequenced within the 16
Anopheles genome project which has allowed validation of chromosomal evolution
hypothesis on a previously unattainable scale. [9]. The genome assembly generated by
Illumina sequencing for An. albinamus was relatively small compared to other species
of Anopheles. At 170 Mb, the genome consists of 204 scaffolds with N50=18 Mb.
This study utilized previously mapped markers [47].to develop a physical map
45
covering 75% of the An. albinamus genome. An interspecies chromosome
comparison was then conducted on 5 mosquito species which also possessed
chromosomal genome assemblies. In addition to An. albimanus, the study included
three species from subgenus Cellia: An. gambiae, An. stephensi, and An. funestus; and
one species from subgenus Anopheles: An. atroparvus. The study supports the
hypothesis that chromosomal arms in Anopheles reshuffle between chromosomes via
whole-arm translocations, but unlike Drosophila, do not undergo fissions or fusions.
This work also revealed that the sex chromosome, X, exhibits the highest rate of the
chromosomal rearrangements among chromosomal arms, and displays the highest rate
of gene movement to other chromosomes. Although it was not included in publication
of 16 Anopheles genome cluster [9], the physical map used for that study raised the
question of possible misassembly within the An. albimanus genome. During the
alignment of the previously mapped markers [47] to the genome assembly one large
scaffold, KB672397, contained probes which were physically mapped to different
chromosomal arms. Further investigation by identifying the chromosomal positions of
orthoglous genes in An. gambiae revealed likely misassembly within 6 An. albimanus
supercontigs. The suspected misassemblies broke scaffolds sized 1.8 MB-24 MB into
2-4 pieces of variable sizes.
Here we report a chromosomal genome assembly of the An. albimanus
reflecting 96% genome assignment to chromosomes. To facilitate physical mapping
we developed a detailed cytogenetic photomap for polytene chromosomes from
salivary glands of An. albimanus. Chromosomes on this map were completely
straightened that make them convenient for physical mapping of the genomic
supercontigs. To further assist in physical mapping we also provide detailed
description of major cytogenetic landmarks for all chromosomal arms. Our physical
mapping corrects misassembly within the genome and tests scaffold gluing
predictions resulting in the most complete chromosomal assembly for any mosquito to
date. Our study identifies 15 misassemblies in 6 supercontigs within the current
genome assembly of this mosquito. Based on these data and additional sequence
alignments the An. albimanus genome to the reference genome of An. gambiae these
misassemblies are corrected in the reference An. albimanus genome hosted by
Vectorbase. The availability of genome assemblies for multiple Anopheles species
also allowed the development of a computational technique called “scaffold gluing”

46
wherein syntenic gene order from many related species can be used to predict the
merging or “gluing” of scaffolds in other species. Our study demonstrated that this
technique is useful for filling gaps in chromosomal assemblies and improving genome
assembly quality. With these findings our work demonstrates that physical mapping
can be effectively used for improvement of mosquito genome assemblies. The
physical map developed in this study for Neotropical malaria vector An. albimanus
can be further utilized for exploration of chromosomal evolution in mosquitoes.
3.3 Material and methods
3.3.1 Mosquito strain and larvae preservations
We utilized An. albimanus, STECLA strain mosquitoes from a laboratory
colony hosted in the Fralin Life Science Institute, Virginia Tech, USA. The strain was
originally colonized from an El Salvador population and the Virginia Tech colony
was obtained courtesy the Malaria Research and Reference Reagent Resource (MR4)
(MRA-126, MR4, ATCC Manassas Virginia). Larvae were grown in a growth
chamber at 27ºC, with 12 hours of light and darkness per day. Fourth instar specimens
were fixed in cold Carnoy`s solution (3 ethanol : 1 glacial acetic acid by volume) for
no less than two weeks at -20 ºC.
3.3.2 Chromosome preparation and map development
For one chromosome preparation, salivary glands were dissected from one or
two larvae. Salivary glands were bathed in a drop of 50% propionic acid for 5
minutes, and squashed as previously described [124]. The quality of the preparation
was assessed on an Olympus CX41 (Olympus America Inc., Melville, NY) phase
contrast microscope. High quality preparations were then flash frozen in liquid
nitrogen and immediately placed in cold 50% ethanol. After a minimum of two hours,
preparations were dehydrated in an ethanol series (70%, 90%, and 100%) and air
dried. Chromosome images were observed using Olympus BX41 microscope
(Olympus America Inc., Melville, NY) with attached CCD camera Qcolor5 (Olympus
America Inc., Melville, NY). Images were combined, straightened, shaped, and
cropped in AdobePhotoshop CS2 (George et al., 2010). The chromosome
nomenclature was adopted from previously published chromosome maps for salivary
glands of An. albimanus [47, 165] .
3.3.3 Fluorescent in situ hybridization
For probe preparation gene-specific primers were designed to amplify unique
exon sequences from the beginning and end of each of the scaffold using the Primer-
47
blast software (Ye et al., 2012) developed at NCBI
(http://www.ncbi.nlm.nih.gov/tools/primer-blast/). Primer design was based on gene
annotations from the An. albimanus Vectorbase genome assembly AalbS1
(www.vectorbase.org/organisms/anopheles-albimanus/stecla/aalbs1). PCR was
performed using 2X Immomix DNA polymerase (Bioline USA Inc, MA, USA) and
standard Immomix amplification protocol. Amplified fragments were labeled by
random primers with Cy3 and Cy5 fluorescent dyes (GE Health Care, UK Ltd,
Buckinghamshire, UK and Enzo Biochem, Enzo Life Sciences Inc., Farmingdale, NY
) or TAMRA-5-dUTP (Biosan, Novosibirsk, Russia), using Random Primers DNA
Labeling System (Invitrogen, Carlsbad, CA, USA). Fluorescent in situ hybridization
(FISH) was performed using previously described standard protocol (Sharakhova et
al. 2006). DNA probes were hybridized to the chromosomes at 39°C overnight in
hybridization solution (50% Formamide; 10% Sodium Dextransulfate, 0.1% Tween
20 in 2XSSC, ph 7.4). Then the chromosomes were washed in 0.2XSSC (Saline-
Sodium Citrate: 0.03M Sodium Chloride, 0.003M Sodium Citrate) and counterstained
with DAPI in ProLong Gold Antifade Mountant (Thermo Fisher Scientific Inc.,
USA).
3.4 Results
3.4.1 A cytogenetic photomap of An. albimanus
An. albimanus exhibits a chromosomal complement typical for Anopheles
where 2n=6. The chromosomes are represented by two pairs of metacentric
autosomes and one pair of subtelocentric sex chromosomes [164]. Because of
homologous pairing, the chromosomal complement in salivary glands of An.
albimanus is represented by 5 chromosomal arms: the smallest arm is the X-
chromosome, the longest the 2R arm, and almost equal in length the 2L, 3R and 3L
arms (Table 3.7.1). A typical chromosomal spread is shown in Figure 3.8.1. The
autosomal centromeres are visibly bound together in a chromocenter and the short X
chromosome has dissociated from the autosomes but remains nearby. In this study, we
constructed a photomap for the polytene chromosomes from salivary glands of An.
albimanus (Figure 3.8.2) using phase contrast images of unstained chromosomes.
This approach allowed us to obtain clear banding pattern of the chromosomes.
Chromosomes were straightened using AdobePhotoshop and divided into 45
numbered divisions and 110 lettered subdivisions. The division borders and

48
nomenclature were adopted from a drawn map [165] and a photomap [47] that were
previously developed for polytene chromosomes from the salivary glands of An.
albimanus.
Chromosomal arms of An. albimanus have regions with reproducible, distinct
morphology, or landmarks, that can be used for arm recognition. The lengths of the X
chromosome and 2R arm make them easily identifiable as shortest and longest arms
among the rest of the chromosomal complement. Additional landmarks for X-
chromosome are a bell-shaped telomere end with a pair of dark bands in the middle of
region 1a and a light puffy area in the second part of region 3A. All autosomal
telomeres of An. albimanus have flared ends with only slight differences in
morphology thus using them as landmarks for arm identification is difficult.
Centromeres are usually significantly underpolytenized and often are not properly
spread due to the formation of a chromocenter. For these reasons we rely on internal
chromosomal regions for arm identification of An. albimanus. Three very thin bands
in region 7A, and a dark thick band surrounded by two thin bands close to the
centromere in region 15B can be used as robust landmarks for arm 2R. Despite their
nearly equal length, 2L, 3R, and 3L arms can be easily distinguished by distinct
landmarks in the middle of the arms. A pair of dark bands in 17A-B and a wide dark
band in the middle of the arm in region 20A can be recognized as landmarks for arm
2L. The major landmark for arm 3R is a wide granulated band surrounded by two
dark bands in region 34B. A series of three dark bands surrounded by light areas in
region 30A and a wide thick band in region 28B can be used as additional landmarks
for this arm. In some specimens we observed a big puff in region 31A-31B that looks
like a Balbiani ring. If present, this puff can be also utilized as a strong landmark for
3R. Arm 3L can be recognized by a pair of bands in region 37B that are located near
the chromocenter and usually surrounded by unstructured chromatin. Additional
landmarks for this arm are a light puffy area in region 39B-38A surrounded by two
bands (region 39A, 38B).
3.4.2 A physical map for the An. albimanus genome
A physical mapping via FISH placed 24 of the 204 supercontigs included in
the An. albimanus assembly hosted by Vectorbase. Due to a large N50 value for the
An. albimanus assembly these 24 supercontigs were sufficient to assign ~98% of the
genome to chromosomal locations. The largest supercontig, KB672286 (30.8 MB)
49
covers nearly all of chromosomal arm 3L, from region 38C to 45A. Our Genome
analysis and physical mapping identified and corrected a total of 13 misassemblies
within 6 scaffolds. We propose that misassembled scaffolds be renamed using letters
to denote different fragments originating from misassembly within a supercontig. For
example, supercontig KB672435 (15.38 MB) was found to be composed of 3
misassembled fragments that localized to 2 places on 2R and one location on 2L. We
have named these pieces KB672435A (3.38MB), KB672435B (7.09 MB), and
KB672435C (3.72 MB). Our study found that all 13 physically mapped cases of
misassembly are associated with physical gaps between genomic contigs that were
erroneously bridged by a longer read. A summary of all identified and mapped
misassembled supercontigs is provided in Table 3.7.2.
Using our proposed nomenclature where each misassembled fragment of a
supercontig is counted as its own supercontig we have placed a total of 32
supercontigs (Table 3.7.3). Euchromatic regions of chromosomal arms are well
covered on our map with the exception of one gap on 3R in region 33A. Gaps also
remain in the heterochromatic centromeres of arms X, 2R, 3R, and 3L. The sizes and
numbers of supercontigs necessary to cover each arm varied considerably, even
among arms of similar size. Arm 2L, for example, is nearly completely covered by 3
large scaffolds. In contrast, supercontigs comprising sequences of 3R are contained in
8 scaffolds (Table 3.7.2, Figure 3.8.1 ).
Six of the mapped scaffolds were predicted to be merged into larger scaffolds based
on synteny data published in the supplemental materials of Neafsey et al., 2015. We
confirmed merging predictions on X, 2R and 3R (Table 3.7.2, in red text).
3.5 Discussion
This study developed a physical map for the genome of the dominant malaria
vector in Central America, An. albimanus. To proceed with physical mapping we
constructed a new cytogenetic map for the salivary gland polytene chromosomes of
this mosquito. Although the original publication of the drawn chromosome map
described banding patterns of An. albimanus chromosomes, in general this map was
too simple to be used for physical mapping (Keppler et al., 1973). The photomap
developed later for An. albimanus significantly improved the overall clarity of the
chromosomes’ structure [47] and allowed positioning of 17 DNA probes that were
hybridized to the chromosomes using in situ hybridization. After the genome of An.
albimanus was released, availability of this physical map allowed placement of 75%
50
of the genome to chromosomes [9]. However, the first cytogenetic photomap
developed for An. albimanus chromosomes was not designed for large-scale physical
genome mapping and this map hindered efforts for a more complete chromosomal
assembly in this species. The cytogenetic photomap constructed in this study has two
advantages that make it convenient for physical mapping applications. First,
chromosomes are completely straightened and flattened, so that relative position of
bands along the arm are not obscured. Second, major landmarks for arm recognition
are described in detail, rendering identification of chromosomal arms much easier.
This improved map allowed placement of 98% of the An. albimanus genome to the
chromosomes resulting in the most complete physical genome map developed for any
mosquito.
Our study supplements a classical molecular biology technique with
computational approaches of the genomics era. The results demonstrate how
bioinformatic approaches can work synergistically with physical mapping to
efficiently map the largest supercontigs, systematically identify and correct
misassembly, and fill gaps within genomes for higher quality assemblies.
Misassemblies identified computationally certainly could have been identified using
FISH alone but the process of identifying boundaries of the misassembly within
supercontigs would have been much more time consuming. As chromosomal
assemblies are developed for many more Anopheles species the predictive power of
orthologous positions within related species will become an immensely powerful tool
for the identification of genome misassembly.
The identification of misassembly within multiple supercontigs in the genome
of An. ablimanus highlights the need for physical mapping to validate the accuracy of
genome assemblies. All cases of misassembly were accompanied by physical gaps
between contigs that were incorrectly bridged. The generation of the An. albimanus
genome assembly made use of large insert mate pairs with inserts ranging from 38-
40kb that assisted in assembly across repetitive regions within mosquito
genomes[170]. Although large inserts were necessary to traverse repetitive regions
these large inserts can introduce error into genome assemblies by the creation of
chimeric mate pairs that unite random segments of sequence within the assembly[171-
173]. Physical mapping will provide an essential quality control in the assembly of
these genomes to the chromosomal level.
51
The availability of a genetic map for chromosome 2 allowed us to compare the
order of scaffolds on physical map to the order of genetic markers published earlier
(Penilla et al., 2009). The analysis revealed a strong correspondence between the
order of scaffolds on physical map and the microsatellites on the genetic map. The
correspondence in position in centi-Morgans (cM) on the genetic map with the order
of scaffolds on physical map has a strong linear relationship with R2=0.8705. The
correlation between position on the two maps is strong and positive with R=0.933
(Figure 3.8.3, Table 3.7.4). The position of 2 microsatellites, 0008, and 0125 reside
in contradictory locations between our physical map and the cM distance indicated in
the previous study (Penilla et al., 2009). This disparity is most likely due to a lack of
resolution near the telomere of 2R on the genetic map.
3.6 Conclusions
The genome map developed in this study for Neotropical malaria vector An.
albimanus demonstrates the power of integrating cytogentic and physical mapping
with sequence and synteny information from related species. Using this approach we
were able to generate a high coverage physical map for An. albimanus that surpasses
that of even the best studied malaria mosquito, An. gambiae. Additionally, our
physical mapping efforts placed 13 fragments within 6 misassembled supercontigs
highlighting the importance of physical mapping for accurate genome assembly. By
drawing upon syntenic relationships in related species we were able to confirm that 6
supercontigs could be merged into larger supercontigs as predicted earlier (Neafsey et
al, 2015). The ability to fill gaps in genome assemblies promises to assist in
improving the accuracy of fixed inversion breakpoint identification in studies of
chromosomal evolution and also facilitate the reconstruction of more accurate genome
landscapes.
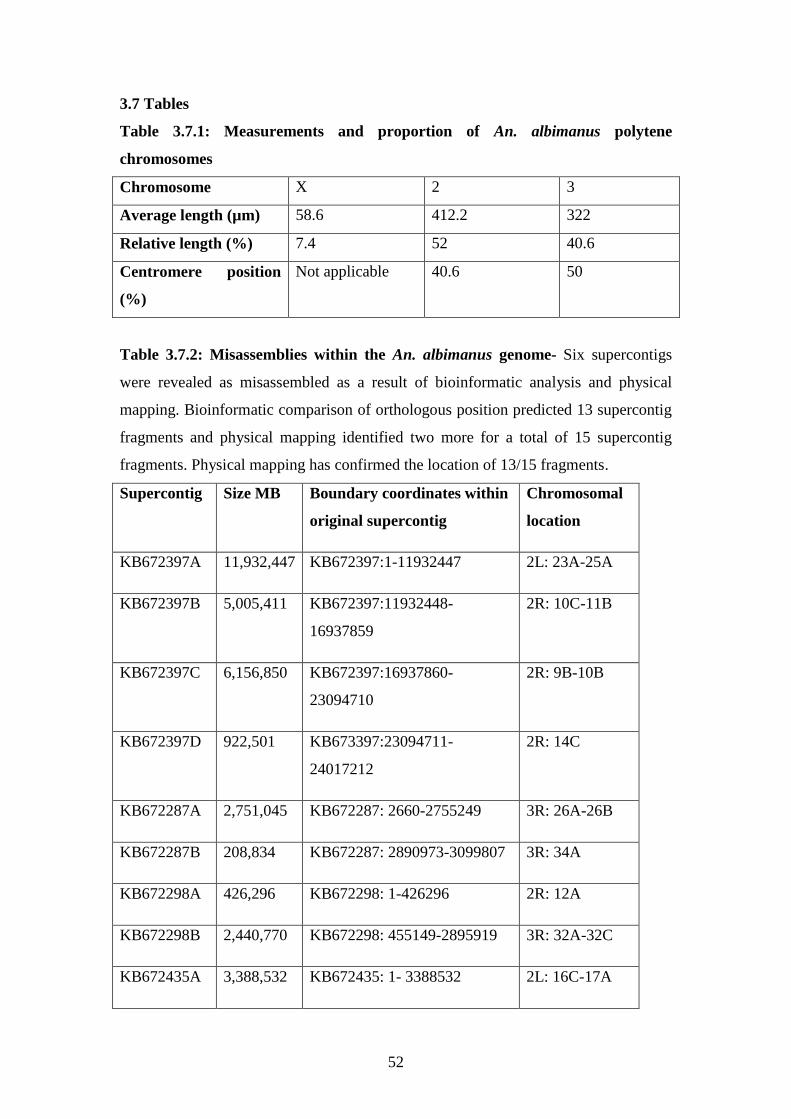
52
3.7 Tables
Table 3.7.1: Measurements and proportion of An. albimanus polytene
chromosomes
Chromosome X 2 3
Average length (µm) 58.6 412.2 322
Relative length (%) 7.4 52 40.6
Centromere position
(%)
Not applicable 40.6 50
Table 3.7.2: Misassemblies within the An. albimanus genome- Six supercontigs
were revealed as misassembled as a result of bioinformatic analysis and physical
mapping. Bioinformatic comparison of orthologous position predicted 13 supercontig
fragments and physical mapping identified two more for a total of 15 supercontig
fragments. Physical mapping has confirmed the location of 13/15 fragments.
Supercontig Size MB Boundary coordinates within
original supercontig
Chromosomal
location
KB672397A 11,932,447 KB672397:1-11932447 2L: 23A-25A
KB672397B 5,005,411 KB672397:11932448-
16937859
2R: 10C-11B
KB672397C 6,156,850 KB672397:16937860-
23094710
2R: 9B-10B
KB672397D 922,501 KB673397:23094711-
24017212
2R: 14C
KB672287A 2,751,045 KB672287: 2660-2755249 3R: 26A-26B
KB672287B 208,834 KB672287: 2890973-3099807 3R: 34A
KB672298A 426,296 KB672298: 1-426296 2R: 12A
KB672298B 2,440,770 KB672298: 455149-2895919 3R: 32A-32C
KB672435A 3,388,532 KB672435: 1- 3388532 2L: 16C-17A
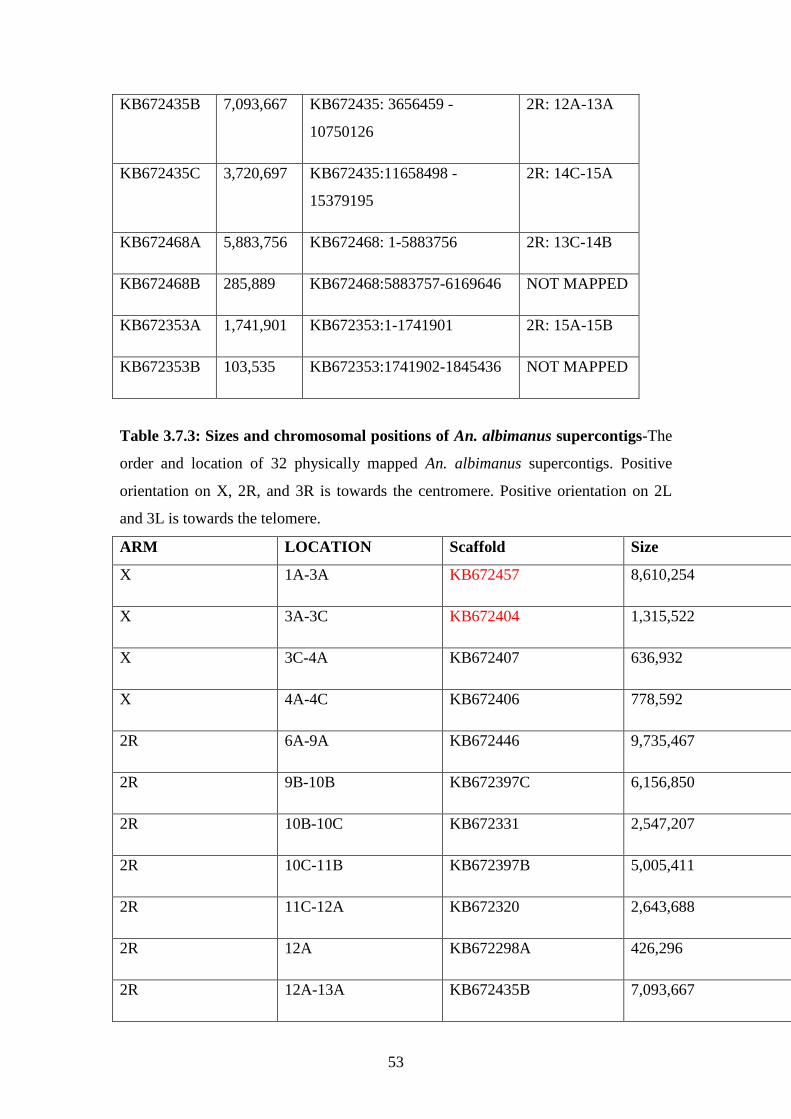
53
KB672435B 7,093,667 KB672435: 3656459 -
10750126
2R: 12A-13A
KB672435C 3,720,697 KB672435:11658498 -
15379195
2R: 14C-15A
KB672468A 5,883,756 KB672468: 1-5883756 2R: 13C-14B
KB672468B 285,889 KB672468:5883757-6169646 NOT MAPPED
KB672353A 1,741,901 KB672353:1-1741901 2R: 15A-15B
KB672353B 103,535 KB672353:1741902-1845436 NOT MAPPED
Table 3.7.3: Sizes and chromosomal positions of An. albimanus supercontigs-The
order and location of 32 physically mapped An. albimanus supercontigs. Positive
orientation on X, 2R, and 3R is towards the centromere. Positive orientation on 2L
and 3L is towards the telomere.
ARM LOCATION Scaffold Size
X 1A-3A KB672457 8,610,254
X 3A-3C KB672404 1,315,522
X 3C-4A KB672407 636,932
X 4A-4C KB672406 778,592
2R 6A-9A KB672446 9,735,467
2R 9B-10B KB672397C 6,156,850
2R 10B-10C KB672331 2,547,207
2R 10C-11B KB672397B 5,005,411
2R 11C-12A KB672320 2,643,688
2R 12A KB672298A 426,296
2R 12A-13A KB672435B 7,093,667
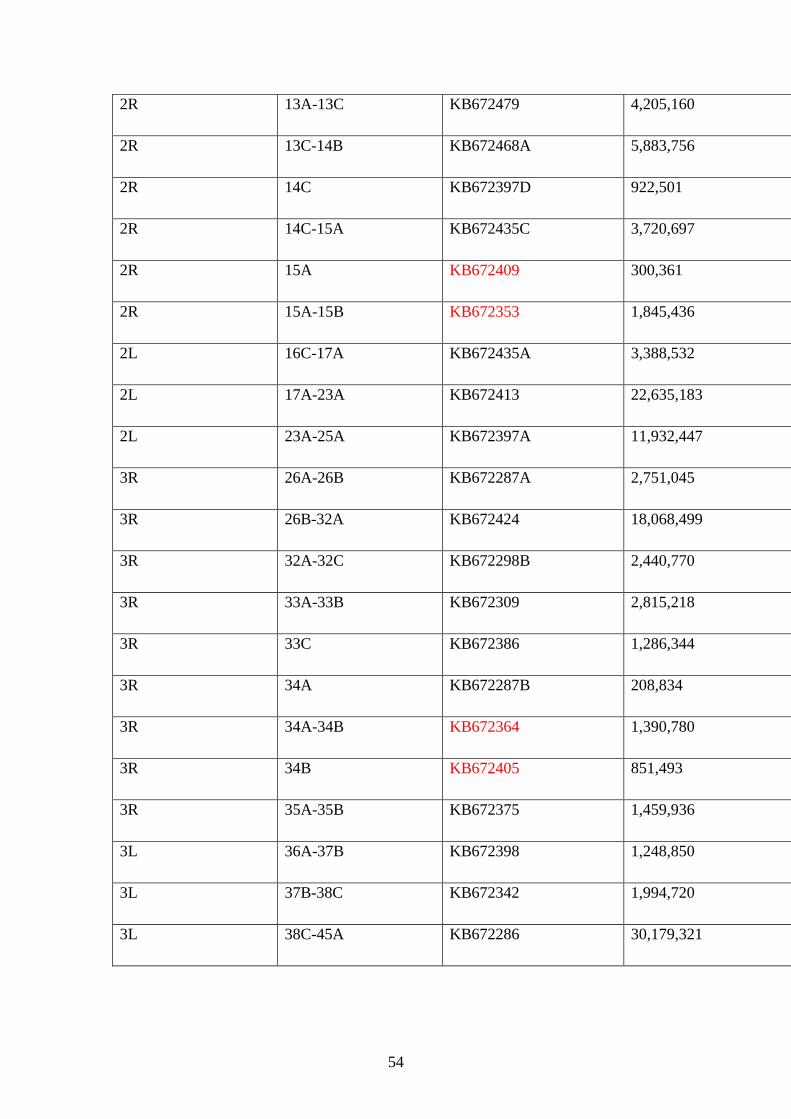
54
2R 13A-13C KB672479 4,205,160
2R 13C-14B KB672468A 5,883,756
2R 14C KB672397D 922,501
2R 14C-15A KB672435C 3,720,697
2R 15A KB672409 300,361
2R 15A-15B KB672353 1,845,436
2L 16C-17A KB672435A 3,388,532
2L 17A-23A KB672413 22,635,183
2L 23A-25A KB672397A 11,932,447
3R 26A-26B KB672287A 2,751,045
3R 26B-32A KB672424 18,068,499
3R 32A-32C KB672298B 2,440,770
3R 33A-33B KB672309 2,815,218
3R 33C KB672386 1,286,344
3R 34A KB672287B 208,834
3R 34A-34B KB672364 1,390,780
3R 34B KB672405 851,493
3R 35A-35B KB672375 1,459,936
3L 36A-37B KB672398 1,248,850
3L 37B-38C KB672342 1,994,720
3L 38C-45A KB672286 30,179,321
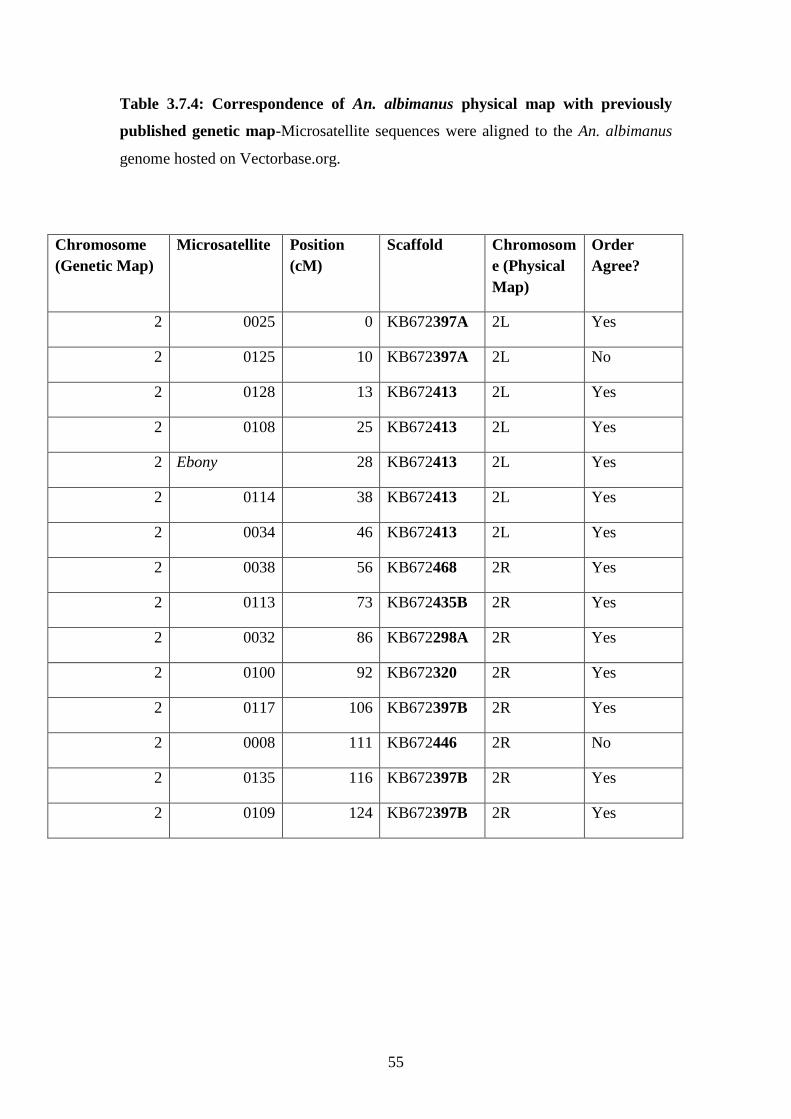
55
Table 3.7.4: Correspondence of An. albimanus physical map with previously
published genetic map-Microsatellite sequences were aligned to the An. albimanus
genome hosted on Vectorbase.org.
Chromosome
(Genetic Map)
Microsatellite Position
(cM)
Scaffold Chromosom
e (Physical
Map)
Order
Agree?
2 0025 0 KB672397A 2L Yes
2 0125 10 KB672397A 2L No
2 0128 13 KB672413 2L Yes
2 0108 25 KB672413 2L Yes
2 Ebony 28 KB672413 2L Yes
2 0114 38 KB672413 2L Yes
2 0034 46 KB672413 2L Yes
2 0038 56 KB672468 2R Yes
2 0113 73 KB672435B 2R Yes
2 0032 86 KB672298A 2R Yes
2 0100 92 KB672320 2R Yes
2 0117 106 KB672397B 2R Yes
2 0008 111 KB672446 2R No
2 0135 116 KB672397B 2R Yes
2 0109 124 KB672397B 2R Yes
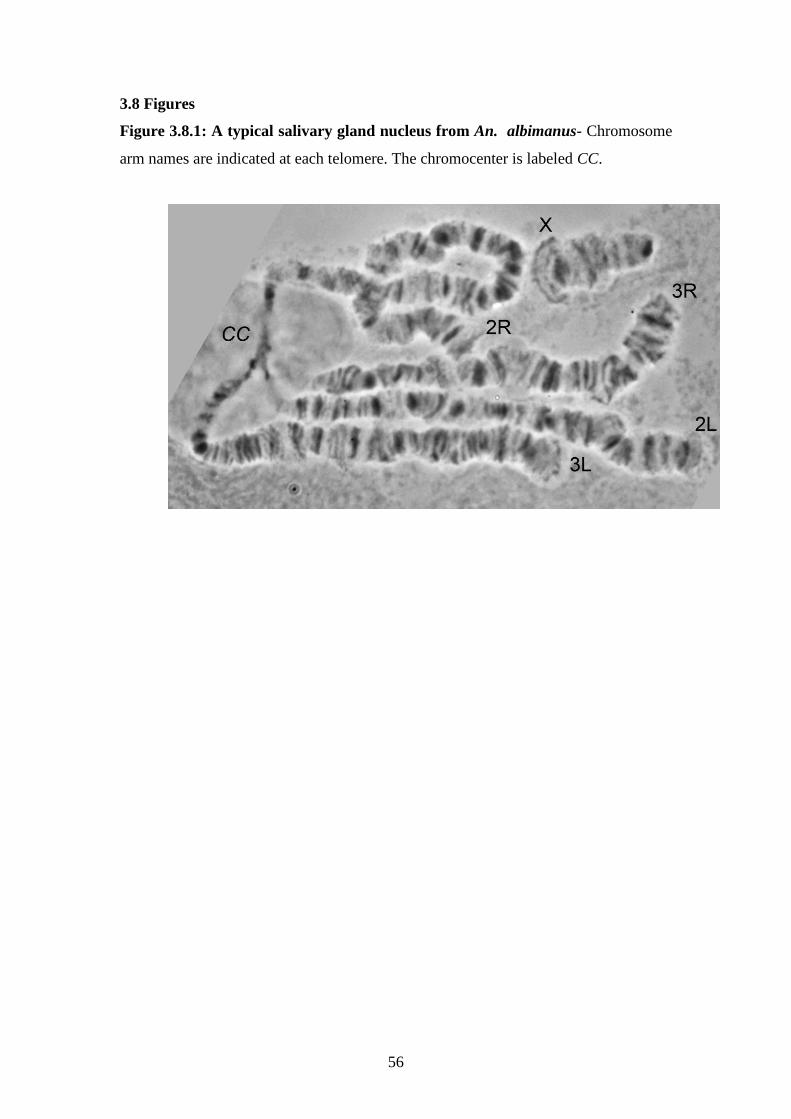
56
3.8 Figures
Figure 3.8.1: A typical salivary gland nucleus from An. albimanus- Chromosome
arm names are indicated at each telomere. The chromocenter is labeled CC.
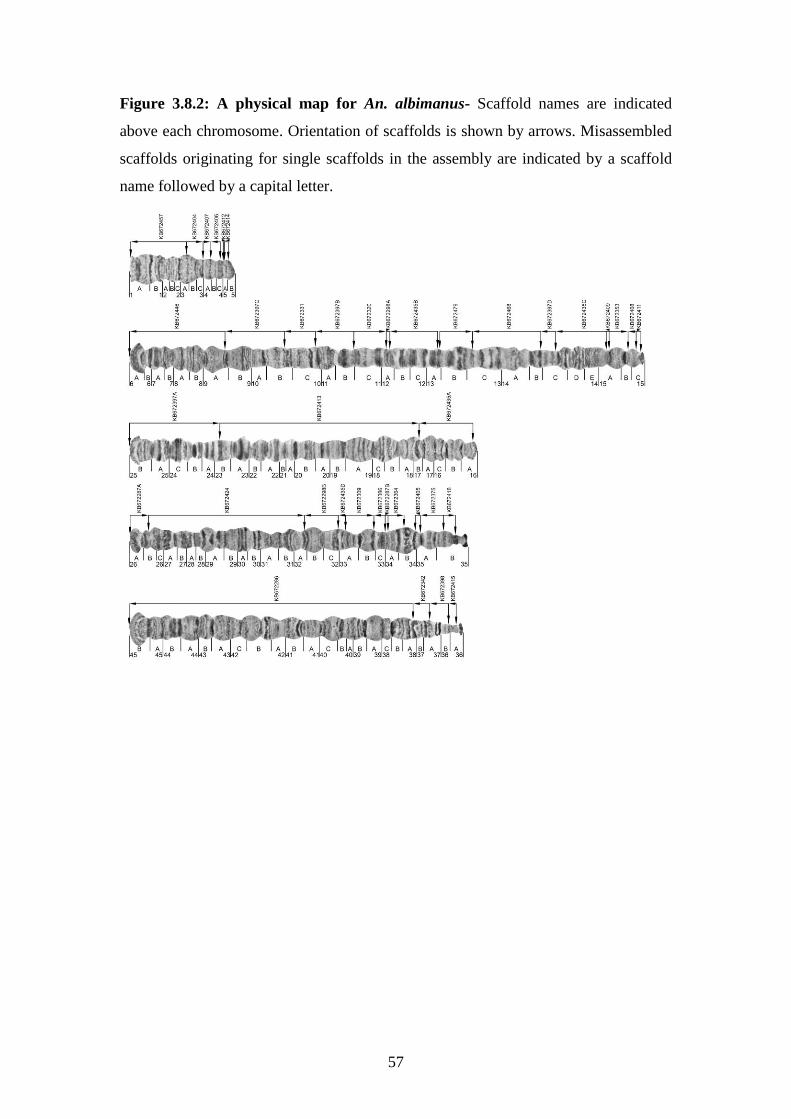
57
Figure 3.8.2: A physical map for An. albimanus- Scaffold names are indicated
above each chromosome. Orientation of scaffolds is shown by arrows. Misassembled
scaffolds originating for single scaffolds in the assembly are indicated by a scaffold
name followed by a capital letter.
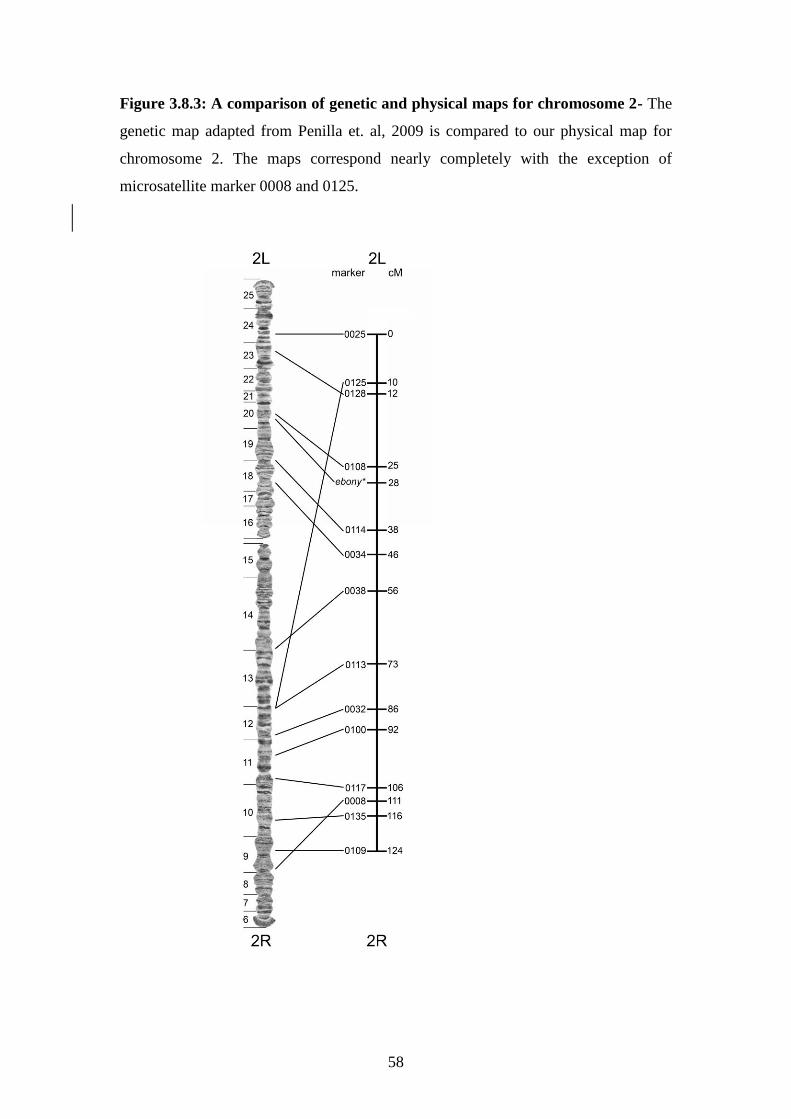
58
Figure 3.8.3: A comparison of genetic and physical maps for chromosome 2- The
genetic map adapted from Penilla et. al, 2009 is compared to our physical map for
chromosome 2. The maps correspond nearly completely with the exception of
microsatellite marker 0008 and 0125.
59
Chapter 4: Insights into rates and mechanisms of chromosomal evolution
in Anopheles from multi-species genomic analysis.
4.1 Abstract
Until recently, a lack of well assembled genomes hindered genome evolution studies
in Anopheles species; however recent sequencing efforts and the combined power of
computational and physical mapping approaches have yielded several assemblies
which are suitable for whole genome comparison. In this work, we present an
improved chromosomal assembly for An. stephensi, identified species specific fixed
chromosomal inversion breakpoints, and explored the repeat content of inversion
breakpoint regions. We found that the sex chromosome is evolving the fastest in all
species and it also contains significantly more transposable elements (TEs) tandem
repeats (TRs) and inverted repeats (IRs) in all species. Our results indicate unique
distributions of TEs, and TRs in the genomes of An. dirus, An. gambiae, An. minimus
and An. stephensi. The densities of repeats vary by chromosomal arm, however TEs
were consistently overrepresented in the breakpoint regions of all species.
Correlations between repeat coverage and the rate of chromosomal breakage indicates
that repeats may be contributing differently to evolution on different chromosomal
arms. These findings demonstrate high rates of chromosomal evolution in mosquitoes
and provide the ground work for further investigation into mechanisms and biological
significance of genome rearrangements. Additionally, genome assembly
improvements and the identification of evolutionarily conserved blocks will aide in
the search for novel candidates for genetic control strategies of disease vectors.
4.2 Introduction
Insect adaptation for blood-feeding on humans is a relatively rare occurrence, but this
behavior imparts resounding consequences for the human race. Although only about
100 of the ~10,000 described species who blood feed do so preferentially on humans,
the recent upsurge in mosquito borne diseases such as Zika and chikungunya
showcase the social and economic effects of vector borne disease[174, 175]. In better
60
studied mosquito borne diseases such as malaria and dengue, mosquito vectors are
rapidly evolving metabolic and behavioral mechanisms for counteracting chemical
means of mosquito control[176-178]. The rapid evolution and capacity of disease
vectors to adapt leaves governments and public health agencies in great need of new
tools and a better understanding of how mosquitoes are adapting to overcome existing
control strategies.
Previous work has demonstrated a rapid rate of chromosomal evolution in Dipteran
genomes as evidenced by the extensive reshuffling of genes that takes place even
between very closely related species[42, 179]. It is also clear that rates of evolution
are not uniform throughout the genome[9, 50, 62, 66]. The molecular basis of non-
uniform rates of evolution as of yet remains poorly understood, but the investigation
of specific inversion breakpoints in Drosophila and Anopheles have found inverted
repeats (IRs), tandem repeats (TRs), segmental duplications (SDs), and the vestiges of
transposable elements (TEs)[69, 125, 180, 181]. The presence of these repeat
sequences in inversion breakpoints potentially aids in ectopic recombination or double
stranded break (DSB) formation, and suggests a possible role for these repeats in the
genesis of chromosomal inversions.
In Drosophila, analysis of 29 interspecific chromosomal breakpoints revealed that
inverted duplications of genes rather than repetitive sequences were more common in
breakpoint regions suggesting that staggered breaks were the most common
mechanism for inversion genesis[79]. A subsequent study investigating two models
for genome evolution, “fragile regions” and “functional constraints” concluded that
some combination of the two forces was at work in shaping genome evolution of
Drosophila species with fragile regions being more common especially on the sex
chromosome[66]. Other work in D. mojavensis supports multiple mechanisms of
breakpoint genesis including ectopic recombination between inverted stretches of
non-repetitive DNA, and possible fragile regions[181].
In mosquito species, Xia et al. explored whether arm specific differences in inversion
frequency are correlated with differences in the genomic landscape of each
chromosomal arm. They explored this hypothesis using comparative mapping of An.
gambiae and An. stephensi, and applied Bayesian statistical models to analyze the
61
genomic landscape of individual An. gambiae chromosomal arms. Their results
indicated that differences in chromosomal arm content with respect to repeats, genes,
and scaffold/matrix associated regions (S/MARs) likely contribute to the differences
in inversion fixation rate and rates of evolution observed between different arms[50].
Later work by Sharakhova et al., compared gene order in An. gambiae, An. stephensi
and An. funestus and demonstrated that different chromosomal arms exhibit varying
tolerance to gene disruption, and that chromosomal inversions tend to capture similar
sets of genes in species facing similar environmental pressure[49]. This study
demonstrated that the fastest evolving 2R autosomal arm was enriched with gene
blocks conserved between only a pair of species. In contrast, all identified syntenic
blocks were preserved on the slowly evolving 3R arm of An. gambiae and on the
homologous arms of An. funestus and An. stephensi. These works represent the first
investigation into the molecular context for chromosomal evolution in Anopheles.
With genomic data now available for many more species, analysis of Anopheles
patterns of evolution is now possible on a much greater scale.
Because syntenic relationships between species can be leveraged to detect
misassembly and further assemble related genomes, the availability of many mosquito
genomes empowers the vector biology community in ways that were not previously
possible[182]. More complete genome assemblies can be utilized to investigate
evolutionary processes or for fine scale interrogation of the genetic factors controlling
epidemiologically important traits. Additionally, well assembled genomes ease the
development of genetic tools for mosquito control and vector borne disease
prevention.
Recent, concerted efforts to sequence and assemble the genomes of many medically
and agriculturally important arthropods have provided a wealth of genome data that
can be used in comparative genomics studies and allow patterns of evolution to be
discerned. Efforts by individual researchers and collaborative efforts such as the
Anopheles 16 Genomes consortium (AGC) have produced the genomes of more than
20 vector and non-vector Anopheles species. Comparative genomic studies of these
genomes have already begun to bear fruit and shed light on patterns of genome
evolution in Anopheles. By utilizing gene order information from 6 physically
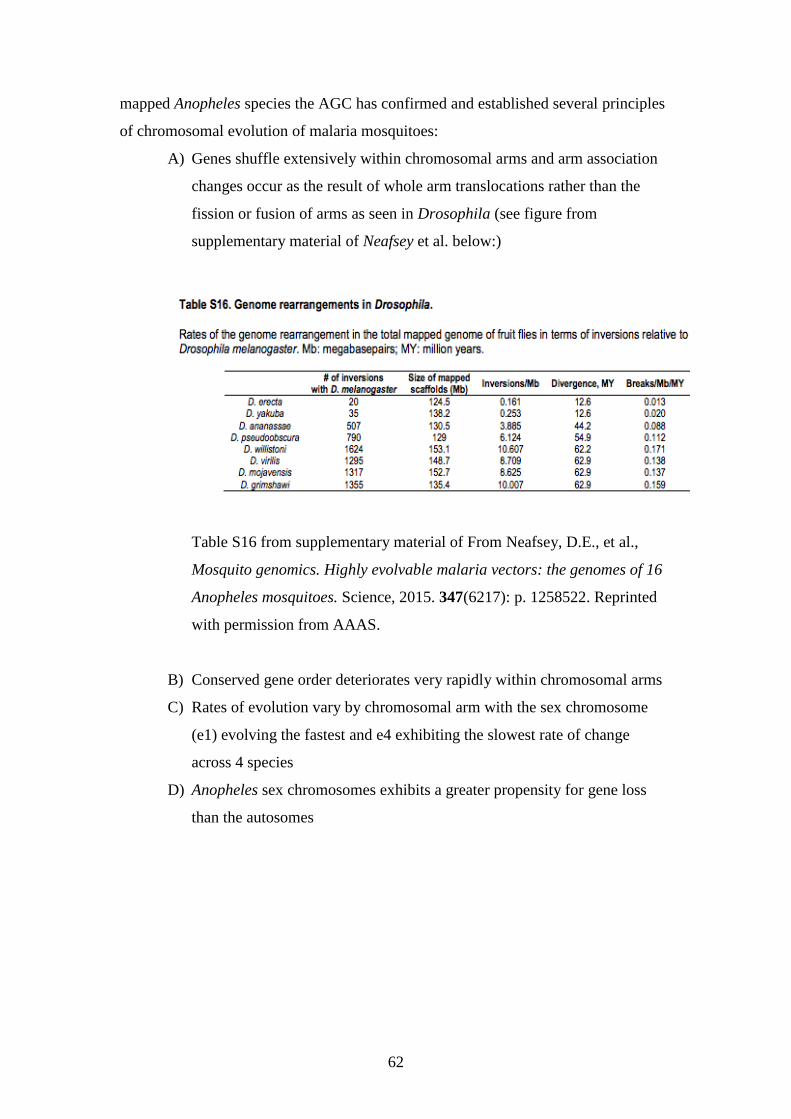
62
mapped Anopheles species the AGC has confirmed and established several principles
of chromosomal evolution of malaria mosquitoes:
A) Genes shuffle extensively within chromosomal arms and arm association
changes occur as the result of whole arm translocations rather than the
fission or fusion of arms as seen in Drosophila (see figure from
supplementary material of Neafsey et al. below:)
Table S16 from supplementary material of From Neafsey, D.E., et al.,
Mosquito genomics. Highly evolvable malaria vectors: the genomes of 16
Anopheles mosquitoes. Science, 2015. 347(6217): p. 1258522. Reprinted
with permission from AAAS.
B) Conserved gene order deteriorates very rapidly within chromosomal arms
C) Rates of evolution vary by chromosomal arm with the sex chromosome
(e1) evolving the fastest and e4 exhibiting the slowest rate of change
across 4 species
D) Anopheles sex chromosomes exhibits a greater propensity for gene loss
than the autosomes
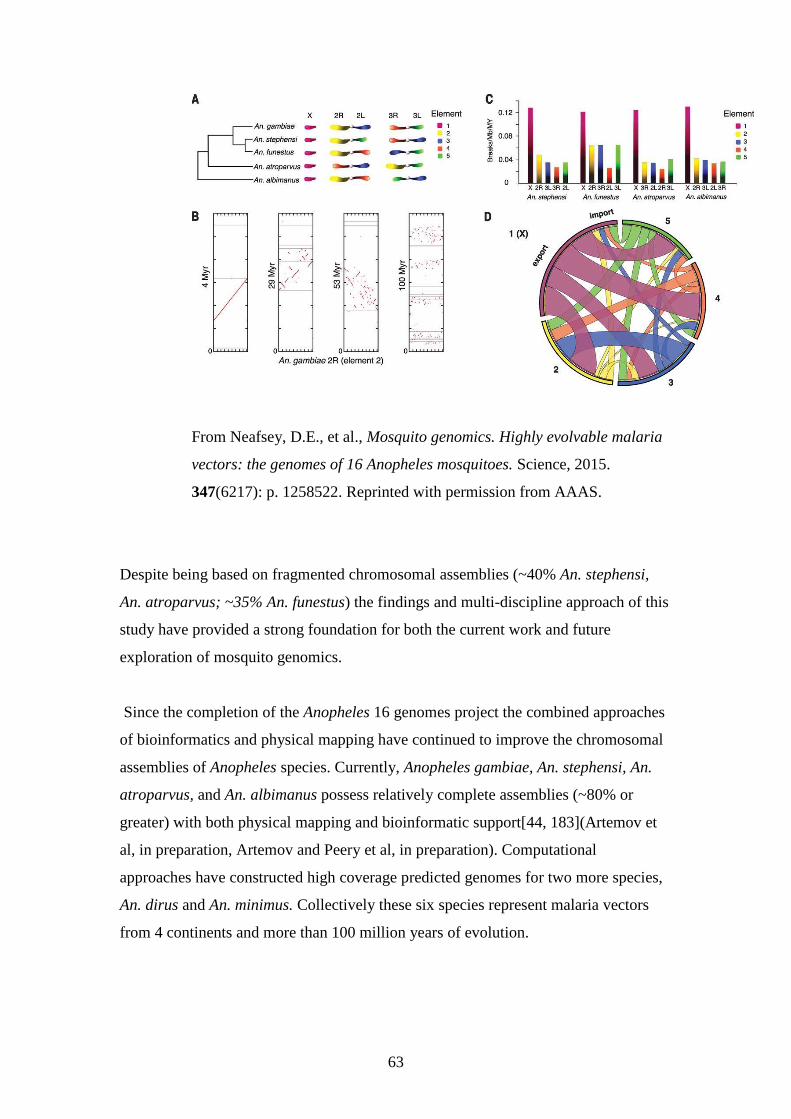
63
From Neafsey, D.E., et al., Mosquito genomics. Highly evolvable malaria
vectors: the genomes of 16 Anopheles mosquitoes. Science, 2015.
347(6217): p. 1258522. Reprinted with permission from AAAS.
Despite being based on fragmented chromosomal assemblies (~40% An. stephensi,
An. atroparvus; ~35% An. funestus) the findings and multi-discipline approach of this
study have provided a strong foundation for both the current work and future
exploration of mosquito genomics.
Since the completion of the Anopheles 16 genomes project the combined approaches
of bioinformatics and physical mapping have continued to improve the chromosomal
assemblies of Anopheles species. Currently, Anopheles gambiae, An. stephensi, An.
atroparvus, and An. albimanus possess relatively complete assemblies (~80% or
greater) with both physical mapping and bioinformatic support[44, 183](Artemov et
al, in preparation, Artemov and Peery et al, in preparation). Computational
approaches have constructed high coverage predicted genomes for two more species,
An. dirus and An. minimus. Collectively these six species represent malaria vectors
from 4 continents and more than 100 million years of evolution.
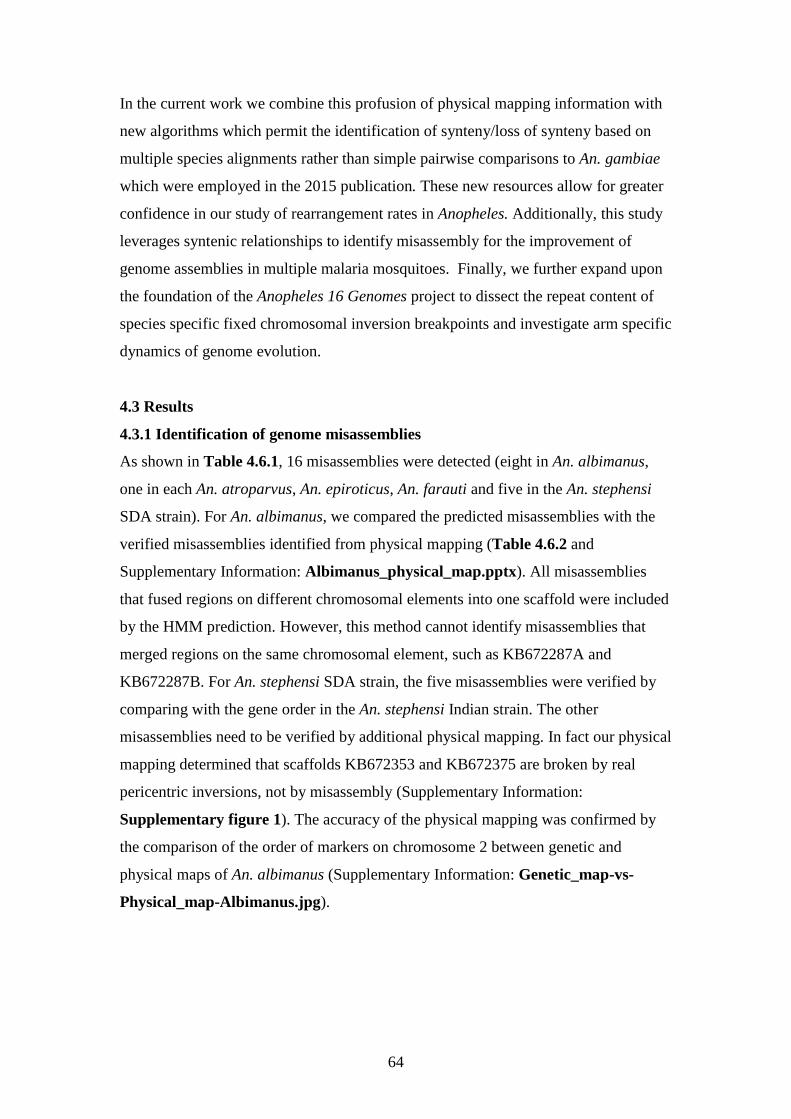
64
In the current work we combine this profusion of physical mapping information with
new algorithms which permit the identification of synteny/loss of synteny based on
multiple species alignments rather than simple pairwise comparisons to An. gambiae
which were employed in the 2015 publication. These new resources allow for greater
confidence in our study of rearrangement rates in Anopheles. Additionally, this study
leverages syntenic relationships to identify misassembly for the improvement of
genome assemblies in multiple malaria mosquitoes. Finally, we further expand upon
the foundation of the Anopheles 16 Genomes project to dissect the repeat content of
species specific fixed chromosomal inversion breakpoints and investigate arm specific
dynamics of genome evolution.
4.3 Results
4.3.1 Identification of genome misassemblies
As shown in Table 4.6.1, 16 misassemblies were detected (eight in An. albimanus,
one in each An. atroparvus, An. epiroticus, An. farauti and five in the An. stephensi
SDA strain). For An. albimanus, we compared the predicted misassemblies with the
verified misassemblies identified from physical mapping (Table 4.6.2 and
Supplementary Information: Albimanus_physical_map.pptx). All misassemblies
that fused regions on different chromosomal elements into one scaffold were included
by the HMM prediction. However, this method cannot identify misassemblies that
merged regions on the same chromosomal element, such as KB672287A and
KB672287B. For An. stephensi SDA strain, the five misassemblies were verified by
comparing with the gene order in the An. stephensi Indian strain. The other
misassemblies need to be verified by additional physical mapping. In fact our physical
mapping determined that scaffolds KB672353 and KB672375 are broken by real
pericentric inversions, not by misassembly (Supplementary Information:
Supplementary figure 1). The accuracy of the physical mapping was confirmed by
the comparison of the order of markers on chromosome 2 between genetic and
physical maps of An. albimanus (Supplementary Information: Genetic_map-vs-
Physical_map-Albimanus.jpg).
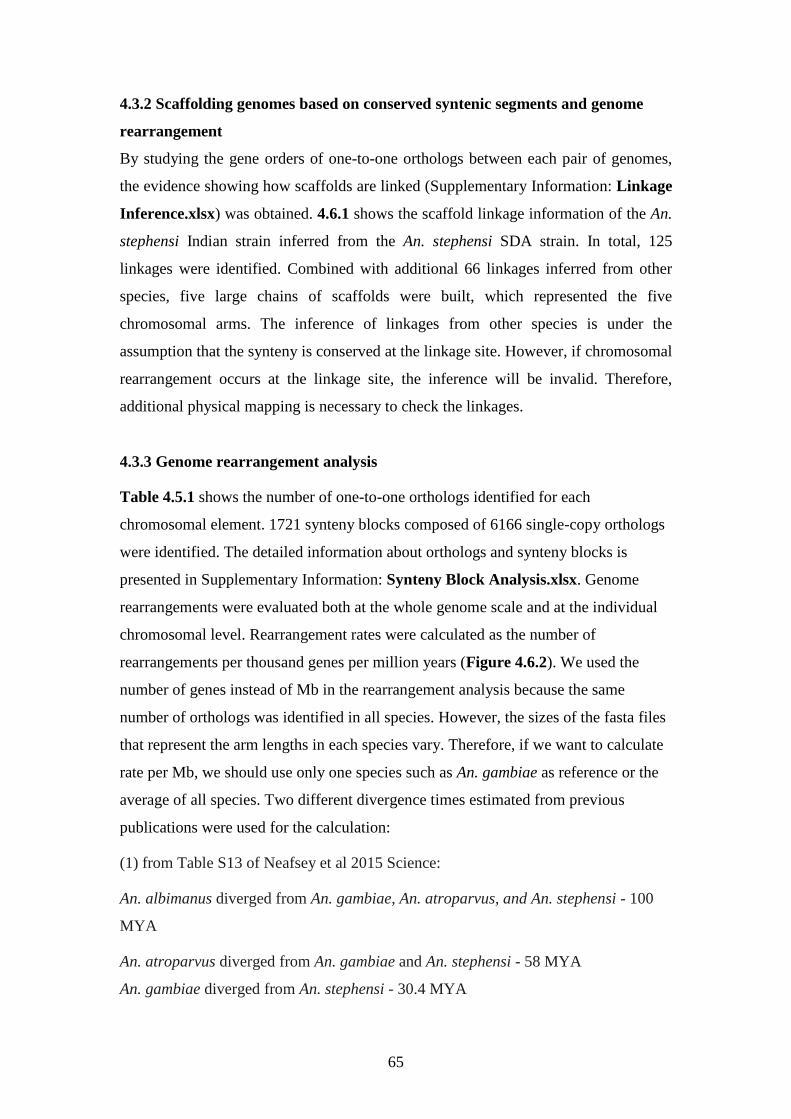
65
4.3.2 Scaffolding genomes based on conserved syntenic segments and genome
rearrangement
By studying the gene orders of one-to-one orthologs between each pair of genomes,
the evidence showing how scaffolds are linked (Supplementary Information: Linkage
Inference.xlsx) was obtained. 4.6.1 shows the scaffold linkage information of the An.
stephensi Indian strain inferred from the An. stephensi SDA strain. In total, 125
linkages were identified. Combined with additional 66 linkages inferred from other
species, five large chains of scaffolds were built, which represented the five
chromosomal arms. The inference of linkages from other species is under the
assumption that the synteny is conserved at the linkage site. However, if chromosomal
rearrangement occurs at the linkage site, the inference will be invalid. Therefore,
additional physical mapping is necessary to check the linkages.
4.3.3 Genome rearrangement analysis
Table 4.5.1 shows the number of one-to-one orthologs identified for each
chromosomal element. 1721 synteny blocks composed of 6166 single-copy orthologs
were identified. The detailed information about orthologs and synteny blocks is
presented in Supplementary Information: Synteny Block Analysis.xlsx. Genome
rearrangements were evaluated both at the whole genome scale and at the individual
chromosomal level. Rearrangement rates were calculated as the number of
rearrangements per thousand genes per million years (Figure 4.6.2). We used the
number of genes instead of Mb in the rearrangement analysis because the same
number of orthologs was identified in all species. However, the sizes of the fasta files
that represent the arm lengths in each species vary. Therefore, if we want to calculate
rate per Mb, we should use only one species such as An. gambiae as reference or the
average of all species. Two different divergence times estimated from previous
publications were used for the calculation:
(1) from Table S13 of Neafsey et al 2015 Science:
An. albimanus diverged from An. gambiae, An. atroparvus, and An. stephensi - 100
MYA
An. atroparvus diverged from An. gambiae and An. stephensi - 58 MYA
An. gambiae diverged from An. stephensi - 30.4 MYA
66
(2) from Figure S10A of Neafsey et al 2015 Science:
An. albimanus diverged from An. gambiae, An. atroparvus, and An. stephensi - 100
MYA
An. atroparvus diverged from An. gambiae and An. stephensi - 80.3 MYA
An. gambiae diverged from An. stephensi - 41.5 MYA.
The Fontaine et al 2015 paper reports much smaller divergence times for An.
epiroticus and An. christyi than those proposed in Figure S10A of Neafsey et al 2015
Science. The X chromosome showed significantly higher evolution rate over time
compared with the autosomes.
4.3.4 Physical mapping and confirmation of gluing predictions in An. stephensi
Indian strain
Physical mapping allowed us to place probes from 36 supercontigs which were not
previously mapped for a total of 124 (122 on map) supercontigs mapped in this
species. The newly mapped probes added 39.78 MB to the mapped genome of An.
stephensi and bring the total mapped genome for this species to 176.375 MB or
~79.6%. (Figure 4.6.4). This level of coverage, while still less than An. gambiae and
An. albimanus, was considered sufficient for whole genome comparisons.
Physical mapping demonstrated large scale agreement between our mapped order of
supercontigs and the order predicted by gluing. Glued and mapped positions of
supercontigs agree in 108/115 supercontigs that were common to both procedures.
The 7 conflicts between the two procedures occur on X, 2R and 2L. On X,
supercontigs 00142 and 00015 are in opposite order in mapped vs. predicted location.
On 2R, 00077 and 00149 are in reversed order on the physical map. On 2L, two
groups of supercontigs are in an inverted order on the physical map relative to gluing
predictions: 00049, 00030, 00028 and 00085, and 00043, 00093, and 00066. There
are 3 inconsistencies in the predicted orientation of supercontigs vs their mapped
orientation. Supercontigs 00034 (2L), 00044 (2L), 00025 (3R) all have a mapped
67
orientation opposite that predicted by gluing. (Figure 4.6.4: Physical Map for An.
stephensi, Table 4.5.3: Mapped supercontigs in An. stephensi)
4.3.5 Transposable Elements
Transposable element coverage varied between species and between chromosomal
elements within species. Of the 4 species considered, An. gambiae was by far the
most repeat rich with an average of 9.66% TEs/100kb. The An. stephensi genome
possessed an average of 3.46% TEs per 100kb while An. minimus and An. dirus were
far more modest at an average of 2.23% and 1.53% TEs per 100kb respectively.
These differences in mean %TEs were statistically significant according to a one-way
ANOVA at the p< .05 level [F(3, 8074) = 826.12, p<.0001]. (Figure: 4.6.2; Table
4.5.2)
Based on previous data we expected to see clear differences in %TE of the sex
chromosome (e1) vs. the autosomes. Our results demonstrate this trend in all species
except An. stephensi where the e5 (M=4.503, SD=3.36) has a mean %TEs that is not
statistically different from e1 (M=4.901, SD= 3.42), according to a post-hoc
comparison by a Tukeys HSD test. If all autosomes are pooled however, the average
% TEs in autosomes is lower than that of e1 (one-way ANOVA at p<.05
[F(1,1895)=35.50, p<.0001]).
Autosomal elements of all species clustered into 2 or 3 groups when tested for
statistically significant differences in mean %TEs. In An. gambiae, autosomes e3, e4,
and e5 all had similar means while e2 clustered alone with significantly lower %TEs
(Tukeys HSD, e3(M=9.661, SD=10.82), e4(M=8.581, SD=8.35), e5(M=9.604,
SD=10.07), e2(M=7.343, SD=8.68)). In An. stephensi, mean %TE of e2 was
significantly lower than e4, but the mean of e3 did not differ from the either e2 or e4
(Tukeys HSD, e2(M=2.698, SD=2.34), e4(M=3.34, SD=3.082), e3(M=3.109,
SD=2.95)). In An. dirus, the sex chromosome clustered alone with the highest mean
%TEs (e1(M=3.184, SD=2.70)). Element 5 had significantly greater % TEs relative to
the other autosomes but not as high as that seen in e1(e5(M=1.623, SD=1.70)).
Element 4 clustered alone with the lowest %TEs while e2 and e3 were similar to both
e4 and e5 in terms of mean %TEs (e4(M=1.266, SD=1.63), e2(M=1.339, SD=1.59),
e3(M=1.336, SD=1.40)). Anopheles minimus autosomes clustered into 3 groups: e5
had the highest mean %TEs (e5(M=2.622, SD=2.27). Element 3 had lower % TEs
68
than e5 and e2 but higher than e4 which had substantially lower mean %TEs relative
to the other autosomes (e3(M=2.144, SD=2.16), e2(M=2.483, SD= 2.22),
e4(M=.6301, SD=.560)). Mean %TEs of e2 was similar to both e5 and e3(Figure
4.6.3; Figure 4.6.4; Table 4.5.3)
4.3.6 Inverted repeats in 4 species
The inverted repeat content in An. dirus, An. gambiae, An. minimus, and An. stephensi
was very low, at least an order of magnitude lower than the coverage of tandem
repeats and 2 orders of magnitude lower than transposable elements. Even at these
very low coverages the An. gambiae genome contains the greatest coverage of IRs
(.042%) followed by An. dirus (.023%) while An. minimus (.009%) and An. stephensi
(.006%) were similar in terms of IRs and no statistically significant differences were
detected between these two species (One-way ANOVA [F(3,8074)=101.1, p<.0001],
Tukeys HSD An. gambiae (M=.041, SD=.112), An. dirus (M=.023, SD=.067), An.
minimus (M=.008, SD=.036), An. stephensi (M=.005, SD=.047)).
When considering possible differences between the chromosomal elements within
each species our analysis revealed that the sex chromosome contains the greatest
coverage of IRs in all species. A post-hoc Tukey HSD test finds significant
difference in mean %IRs in An. dirus and An. gambiae e1 vs the autosomes, but no
differences between e1 and the autosomes in An. stephensi (An. dirus e1(M=.0451,
SD=.093, An. gambiae (M=.0965, SD=.186)). In An. minimus e5 was similar to both
e1 and other autosomes (An. minimus e1(M=.0200, SD=.053), e5(M=.0115,
SD=.039)). There were no differences between autosomes in An. dirus, An. gambiae
and An. stephensi but minimus autosomes clustered into 3 overlapping groups (An.
minimus (e2(M=.0074, SD=.035), e3(M=.0092, SD=.037), e4(M=.0027, SD=.017)).
(Figure 4.6.3; Figure 4.6.4; Table 4.5.3).
4.3.7 Simple tandem repeats in 4 species
Simple tandem repeats were present in the genomes of An. dirus, An. gambiae, An.
minimus and An. stephensi at lower coverage than TEs; a one-way ANOVA detected
significant differences between each of the four species [F(3,8074)=390.69, p>.0001].
Anopheles gambiae had the greatest average coverage of TRs (M=1.28%, SD= 1.73)
69
followed by An. dirus (M=.713%, SD=.66), An. stephensi (M=.393%, SD=.28) and
An. minimus (M=.328%, SD= .37). (Table 4.5.2)
A post-hoc Tukeys HSD test demonstrates that the sex chromosome harbors greater
average coverage of TRs compared to the autosomes in all 4 species. Average
coverage of TRs on the autosomes varied by species. Anopheles gambiae presented
no statistically significant differences between autosomes while mean %TRs in An.
dirus, An. minimus and An. stephensi autosomes clustered into 2 statistically different
groups.(An. gambiae e1(M=2.492, SD=1.15), e2(M=1.013, SD=1.18), e3(M=1.161,
SD=1.24), e4(M=1.206, SD=2.49), e5(M=1.193, SD=1.75)), (An. dirus e1(M=1.618,
SD=1.00), e2(M=.6149, SD=.348), e3(M=.6143, SD=.471), e4(M=.5854, SD=.363),
e5(M=.7302, SD=.942)), (An. minimus e1(M=.6072, SD=.447), e2(M=.3133,
SD=.329), e3(M=.3434, SD=.428), e4(M=.2076, SD=.262), e5(M=.3059, SD=.346)),
(An. stephensi e1(M=.6808, SD=.331), e2(M=.3553, SD=.262), e3(M=.3689,
SD=.233), e4(M=.3390, SD=.213), e5(M=.4139, SD=.344)) (Table 4.5.2; Figure
4.6.4 )
4.3.8 Comparison of breakpoints to the whole genome
Our hypothesis posits that repeats such as transposable elements, simple tandem
repeats and inverted repeats increase the fragility in regions of the genome where they
accumulate and thus increase the likelihood of chromosomal breakage, misrepair of
double stranded breaks (DSBs) and inversion formation. With that hypothesis we
expected to see greater coverage of TEs, TRs and IRs in breakpoint regions relative to
the rest of the genome. Our results demonstrate this trend for TEs, but a less straight
forward relationship between TRs and IR content in breakpoint regions (Table 4.5.4).
We compared the average coverage of TEs, IRs, and TRs in breakpoint regions and
the whole genome in 4 species. The average coverage of TEs was at least 1.9X greater
in breakpoint regions relative to the rest of the genome and these differences were
statistically significant in An. dirus, An. gambiae, An. minimus and An. stephensi.
Significant differences in tandem repeats were also observed in all species. The
average density of simple tandem repeats was 1.6x and 2.4x higher in An. gambiae
and An. stephensi, respectively, but ~1.5x lower in breakpoint regions of An. dirus
and 1.6x lower in An. minimus. Inverted repeats were overrepresented in the
70
breakpoints of An. stephensi and underrepresented in breakpoint regions of An. dirus
and An. minimus. Anopheles dirus breaks contained 4x less inverted repeats on
average than the rest of the genome. Breakpoints of An. minimus were entirely devoid
of inverted repeats. The average density of IRs in breakpoints of An. gambiae were
not significantly different from the whole genome.
4.3.9 Rates of inversion in Anopheles
To assess possible differences in the rate of inversion of different chromosomal arms
we pooled the rate of inversion for each chromosomal arm across An. albimanus, An.
atroparvus, An. gambiae, An. stephensi and An. minimus. We then used a one-way
ANOVA followed by a Tukey HSD test [F (4, 20) =8.89, p<.0003]; (e1(M=3.328,
SD=1.57), e2(M=.924, SD=.428), e3(M=.836, SD=.402), e4(M=.826, SD=.55),
e5(M=.792, SD.575). This test divides the mean rate of evolution for chromosomal
elements into 2 groups. The sex chromosome clusters alone in one group while all
autosomes are pooled in a second group. These results indicate that the sex
chromosome is evolving at different rate than the autosomes. (Table 4.5.5)
4.3.10 Correlation of Repeats with Rate of Chromosomal Breakage
We correlated the rate of chromosomal breakage with the mean coverage of TEs, TRs
and IRs for each chromosomal arm in An. gambiae and An. stephensi (Table 4.5.6).
In An. gambiae, if all chromosomal arms are considered then we observe strong
positive correlations with all repeat types. To determine if any chromosomal arm was
biasing our correlations we repeated the analysis removing each chromosomal arm
one at a time. The strong positive correlation persists unless the sex chromosome is
excluded from the analysis. These results suggest that the high coverage of repeats
and fast rate of evolution on e1 account for most of the the observed positive
correlation. To determine if any one autosome was responsible for the negative
correlations observed we repeated the analysis excluding e1 and each of the
autosomes one at a time. In the absence of e1 and e2 correlations between rate of
chromosomal breakage and mean coverage of repeats becomes positive for all repeat
types indicating that e2, with the highest rate of autosomal breakage and among the
lowest coverage of repeats, was responsible for much of the negative correlation.
Although the correlation coefficients become positive with the exclusion of e1 and e2
the correlation between rate of breakage and the different repeat types are not
71
particularly strong suggesting that these repeats do not explain much of the variation
in rate of breakage for e3, e4, or e5 in An. gambiae.
In An. stephensi, correlations between rate of breakage and coverage of repeats with
all chromosomal arms reveal strong positive correlations between rate of breakage
and the mean coverage TRs and IRs but only a weak positive correlation is observed
for %TEs. Removal of e1 from that analysis changes the correlation values for all
repeat types to negative values. As in An. gambiae, it appears that the high coverage
and high rate of breakage on e1 accounts for most of the positive correlations between
rate of chromosomal breakage and coverage of these repeat types. The weak positive
correlation between %TEs and the rate of breakage (.48) for all chromosomal arms
appears to result from the effects of e5. Removal of e5 changes the correlation value
to a strong positive .87. This effect of e5 is most likely due to the low rate of breakage
on e5 and the high coverage of TEs on this arm. In An. stephensi, the mean %TEs of
e5 is not statistically different from e1, however, the rate of chromosomal breakage on
this arm is much lower than e1. Removal of e1 and e5 from the correlation analysis
produces a strong positive correlation (.74) between the rates of breakage and mean
%TR in e2, e3, and e4. These results could suggest differing roles of tandem repeats
on e5 relative to the other autosomes.
4.4 Discussion/Conclusions
At present, many genomes are being published as unfinished collections of
supercontigs and the applications of genomes in this state are limited. Computational
tools such as the syntenic scaffolding described here is an invaluable tool that
promises to increase the coverage of genome assemblies and permit further study of
genome evolution and chromosomal landscapes that are not otherwise possible.
Although our computational approach for genome assembly to the chromosomal level
requires further validation, the high level of agreement between predicted and mapped
supercontig order in An. stephensi suggests that this method can help bring unfinished
genomes to a level of completion that is more useful to the scientific community.
Additionally, computational predictions of genomic misassembly can be combined
with physical mapping to speed the process of chromosomal assembly and yield more
72
accurate genome assemblies. More accurate genome assemblies in turn will assist in
identification of novel gene targets and position effects of transgene insertions.
Our results reveal striking differences in the dynamics of sex chromosome vs.
autosome evolution in the genus Anopheles. The chromosome is rearranging more
than three times as quickly as the autosomes in all species and this faster rate of
chromosomal rearrangement corresponds with our hypothesis of much greater
densities of TEs, TRs and IRs on e1 contributing to chromosomal rearrangement.
Because of the disproportionate contribution of sex chromosomes to hybrid
incompatibility and speciation, extensive shuffling of genes underscores the potential
capability for malaria mosquitoes to evolve and further differentiate into new
species[184-186].
The vastly excessive accumulation of repeats on the sex chromosome coupled with
high rate of gene loss points to a “heterochromatization” of the sex chromosome in
Anopheles[170]. A lack of recombination between the X and the Y could explain both
the accumulation of repeats and the loss of genes from e1, and indeed most evidence
suggests that the X and Y do not recombine though occasional exchange of genetic
material has been postulated in An. gambiae and few other Anopheles subgenera[187-
190]. This pattern of occasional recombination would do very little to prevent the
accumulation of repeats resulting in the high rates of rearrangements on e1.
Our arm by arm correlation analysis provides clues that different repeat types could
contribute to arm specific mechanisms of breakage. Given that mosquito
chromosomal arms remain intact over evolutionary time, displaying no partial arm
translocations or pericentric inversions, the possibility of distinct mechanisms for
breakage is not unexpected. In An. gambiae, we find that the negative correlation
between rate of breakage on autosomes and %TEs is due to e2. Despite the fast rate of
breakage this arm has a lower coverage of TEs. Its possible that other molecular
features with recombinogenic power, such as segmental duplications, populate the
breakpoint regions of e2. Previous work and recent studies are highlighting the
recombinogenic effect of segmental duplications (SDs) in the genomes of human,
primates and fruitflies [191-193]. Xia et al found that segmental duplications are
present in higher proportions on the fastest evolving autosomes: 2R and 3L of An.
73
gambiae. The coverage of SDs on these arms was in even higher proportions then on
the sex chromosome. Further studies should be able to delineate if SDs co-occur with
higher rates of evolution on autosomes of other mosquito species.
In An. stephensi e5 accounts for the negative correlation between %TRs and rate of
breakage in autosomes. Removal of this arm from the analysis yields a strong positive
correlation (.749) for the rate of breakage in e2, e3, and e4 and the coverage of TRs.
Tandem repeats are significantly higher in break points of An. stephensi so these
elements may be playing a major role in the evolution of e2, e3, and e4 but not e5.
The negative correlation between coverage of TEs and rate of autosomal breakage is
contradictory to our finding of greater coverage of TEs in breakpoints of all
chromosomal arms in all species that we considered. There are several possible
reasons for this apparent contradiction in our data. One possible explanation involves
the important distinction that not all TEs are capable of causing DNA DSBs. A finer
analysis is necessary to determine if the TEs present within the breakpoints are
actually capable of generating the DNA DSBs that are necessary for the formation of
chromosomal inversions. A more detailed analysis of the TEs within breakpoints may
remove repeats that mislead our correlations.
Another explanation for the contradiction in our results could be that TEs do not
actually relate to the induction of chromosomal breakage. A correlation does not
indicate causation and the co-localization of TEs with other features that encourage
breakage or misrepair could lead to spurious correlations. In yeast, strong correlations
between origins of replication, tRNAs and Ty elements and LTRs and rearrangement
sites have been established. These different features co-localize within the yeast
genome so it is entirely possible that one or two of the features encourage genomic
rearrangement and the others have accumulated in the repair process but have no role
in genomic instability[194]. Although yeast and mosquitoes are very different
organisms a similar confounding effect of TEs with other true causes of chromosomal
fragility is possible. The erosion of TE sequences over time further complicates the
untangling of TEs as a cause or effect of genomic instability. Our analysis only allows
investigation of inversion breakpoints as they exist in the present. However, if further
analysis of TEs in recently derived inversion breakpoints revealed young, intact TEs
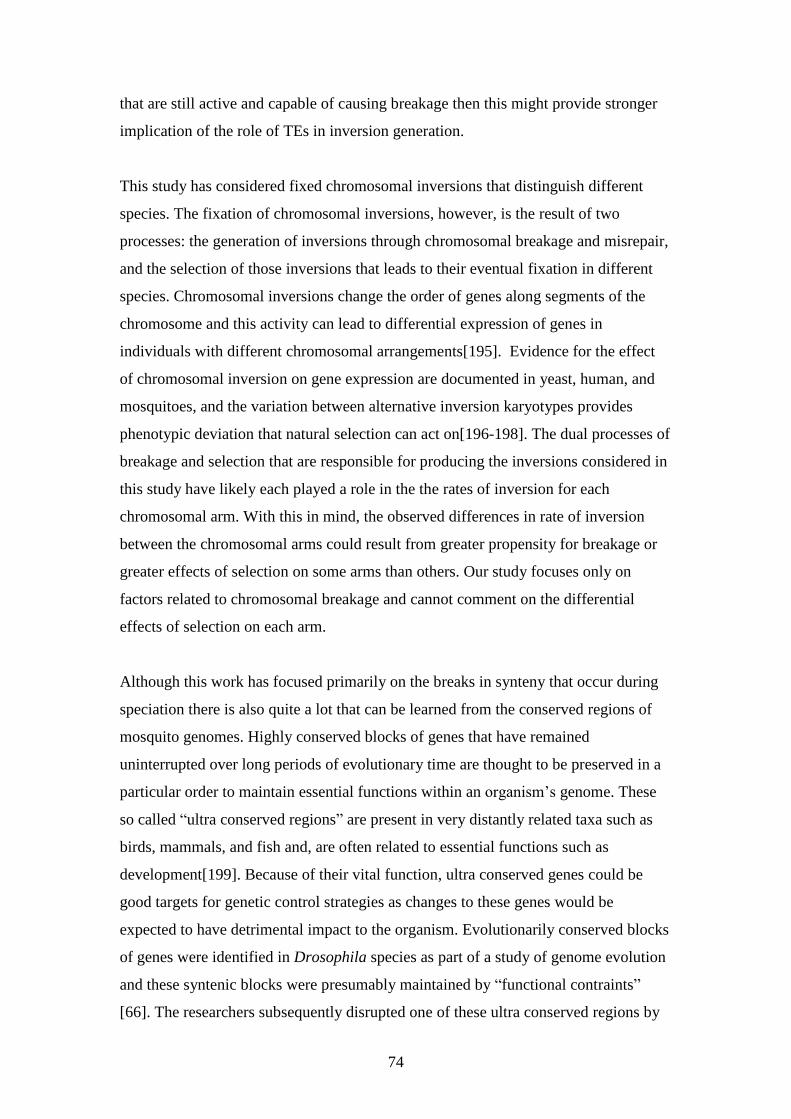
74
that are still active and capable of causing breakage then this might provide stronger
implication of the role of TEs in inversion generation.
This study has considered fixed chromosomal inversions that distinguish different
species. The fixation of chromosomal inversions, however, is the result of two
processes: the generation of inversions through chromosomal breakage and misrepair,
and the selection of those inversions that leads to their eventual fixation in different
species. Chromosomal inversions change the order of genes along segments of the
chromosome and this activity can lead to differential expression of genes in
individuals with different chromosomal arrangements[195]. Evidence for the effect
of chromosomal inversion on gene expression are documented in yeast, human, and
mosquitoes, and the variation between alternative inversion karyotypes provides
phenotypic deviation that natural selection can act on[196-198]. The dual processes of
breakage and selection that are responsible for producing the inversions considered in
this study have likely each played a role in the the rates of inversion for each
chromosomal arm. With this in mind, the observed differences in rate of inversion
between the chromosomal arms could result from greater propensity for breakage or
greater effects of selection on some arms than others. Our study focuses only on
factors related to chromosomal breakage and cannot comment on the differential
effects of selection on each arm.
Although this work has focused primarily on the breaks in synteny that occur during
speciation there is also quite a lot that can be learned from the conserved regions of
mosquito genomes. Highly conserved blocks of genes that have remained
uninterrupted over long periods of evolutionary time are thought to be preserved in a
particular order to maintain essential functions within an organism’s genome. These
so called “ultra conserved regions” are present in very distantly related taxa such as
birds, mammals, and fish and, are often related to essential functions such as
development[199]. Because of their vital function, ultra conserved genes could be
good targets for genetic control strategies as changes to these genes would be
expected to have detrimental impact to the organism. Evolutionarily conserved blocks
of genes were identified in Drosophila species as part of a study of genome evolution
and these syntenic blocks were presumably maintained by “functional contraints”
[66]. The researchers subsequently disrupted one of these ultra conserved regions by
75
an engineered chromosomal inversion but found no detrimental effect to the
organism’s fitness[67]. The modified organisms did display some different responses
to volatile chemicals so it is unclear if these differences could translate to a reduction
in fitness outside of the lab.
Our study which has localized evolutionarily conserved blocks and sites of genomic
rearrangement within the genomes of malaria mosquitoes provides the ground work
for further exploration of evolutionary dynamics in Anopheles mosquitoes. Further
study promises to elucidate the role of different classes of interspersed repeats in
shaping malaria vector genomes. Upon completion of sequencing and assembly of
multiple Culex and Aedes species comparisons of evolutionary dynamics within
Culicidae will also be possible. Comparisons of genome evolution among these
genera can provide insights into how evolutionary processes might differ in more
repeat rich genomes.
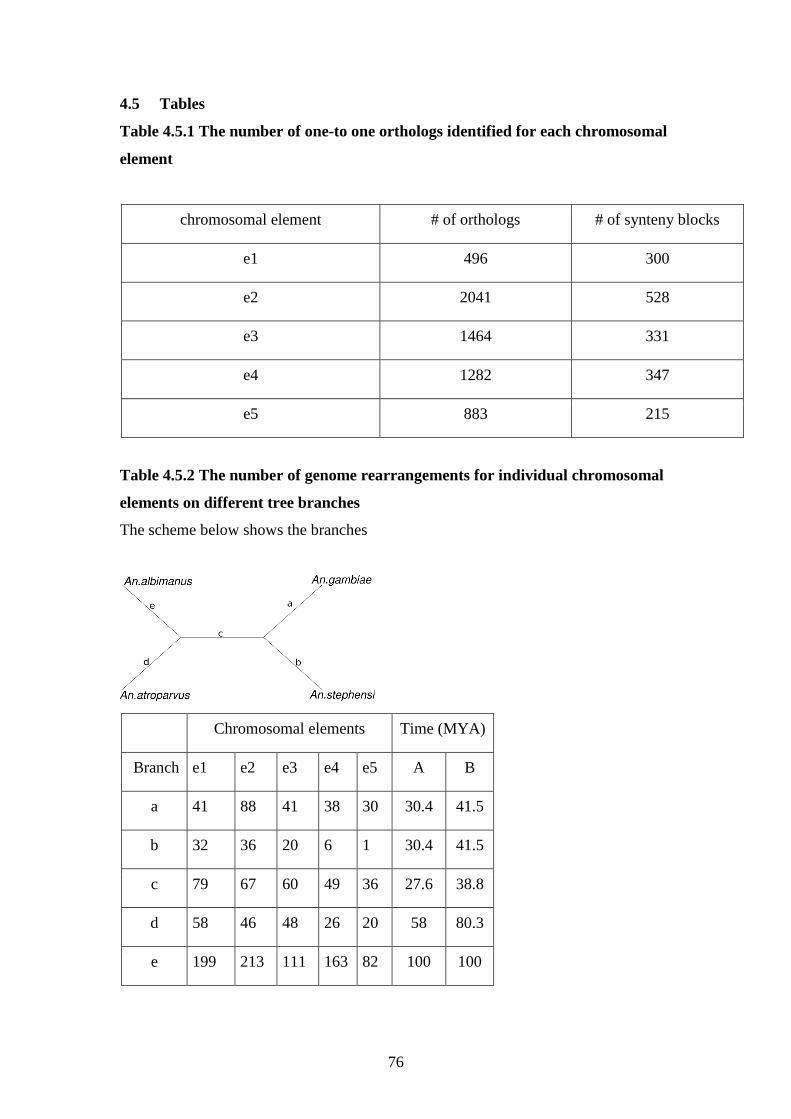
76
4.5 Tables
Table 4.5.1 The number of one-to one orthologs identified for each chromosomal
element
chromosomal element # of orthologs # of synteny blocks
e1 496 300
e2 2041 528
e3 1464 331
e4 1282 347
e5 883 215
Table 4.5.2 The number of genome rearrangements for individual chromosomal
elements on different tree branches
The scheme below shows the branches
Chromosomal elements Time (MYA)
Branch e1 e2 e3 e4 e5 A B
a 41 88 41 38 30 30.4 41.5
b 32 36 20 6 1 30.4 41.5
c 79 67 60 49 36 27.6 38.8
d 58 46 48 26 20 58 80.3
e 199 213 111 163 82 100 100
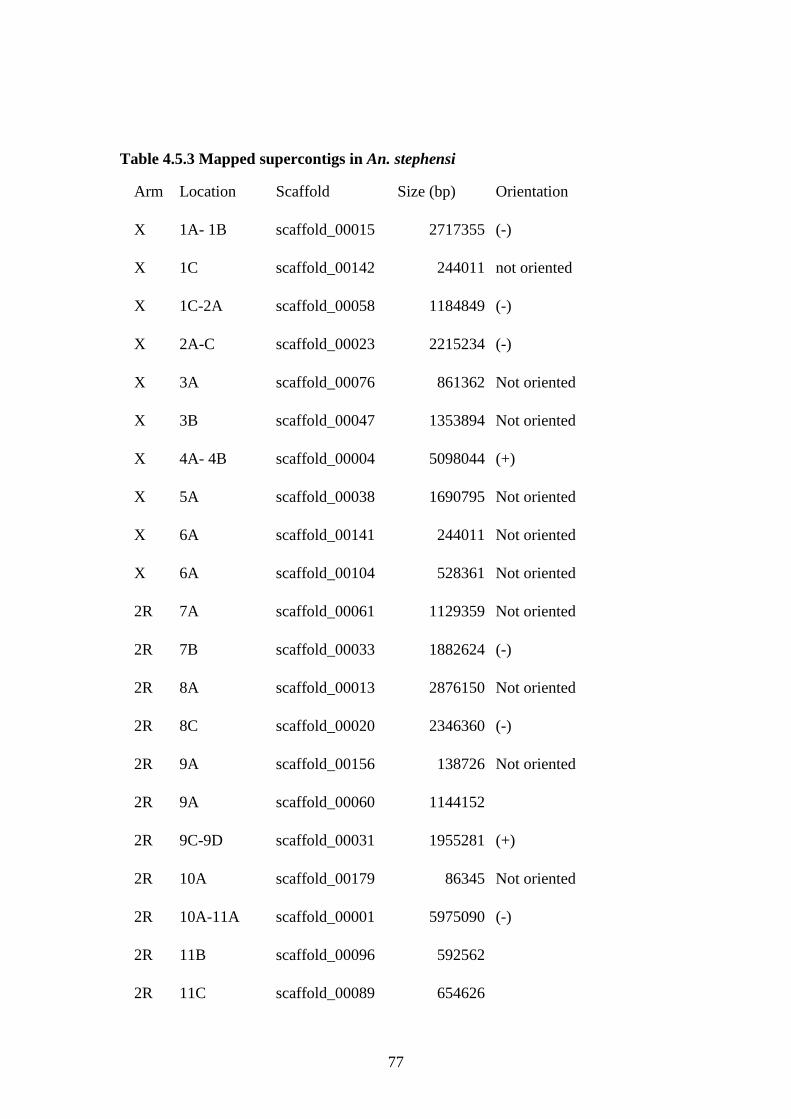
77
Table 4.5.3 Mapped supercontigs in An. stephensi
Arm Location Scaffold Size (bp) Orientation
X 1A- 1B scaffold_00015 2717355 (-)
X 1C scaffold_00142 244011 not oriented
X 1C-2A scaffold_00058 1184849 (-)
X 2A-C scaffold_00023 2215234 (-)
X 3A scaffold_00076 861362 Not oriented
X 3B scaffold_00047 1353894 Not oriented
X 4A- 4B scaffold_00004 5098044 (+)
X 5A scaffold_00038 1690795 Not oriented
X 6A scaffold_00141 244011 Not oriented
X 6A scaffold_00104 528361 Not oriented
2R 7A scaffold_00061 1129359 Not oriented
2R 7B scaffold_00033 1882624 (-)
2R 8A scaffold_00013 2876150 Not oriented
2R 8C scaffold_00020 2346360 (-)
2R 9A scaffold_00156 138726 Not oriented
2R 9A scaffold_00060 1144152
2R 9C-9D scaffold_00031 1955281 (+)
2R 10A scaffold_00179 86345 Not oriented
2R 10A-11A scaffold_00001 5975090 (-)
2R 11B scaffold_00096 592562
2R 11C scaffold_00089 654626
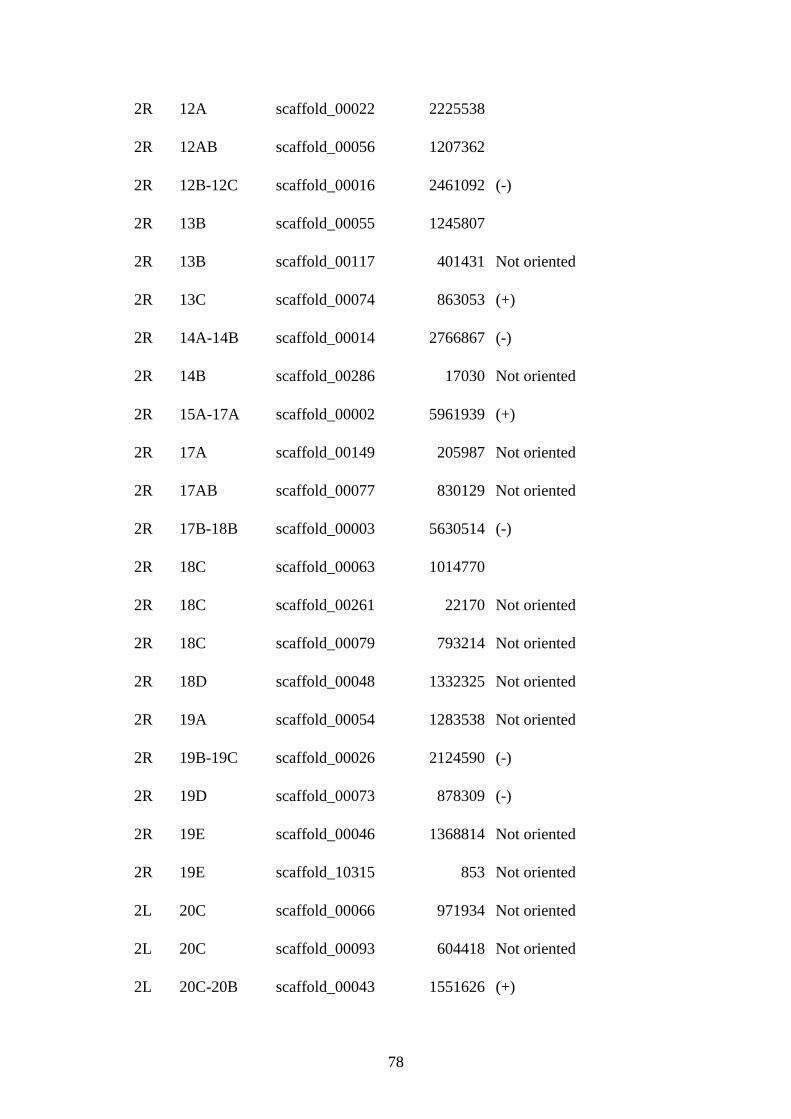
78
2R 12A scaffold_00022 2225538
2R 12AB scaffold_00056 1207362
2R 12B-12C scaffold_00016 2461092 (-)
2R 13B scaffold_00055 1245807
2R 13B scaffold_00117 401431 Not oriented
2R 13C scaffold_00074 863053 (+)
2R 14A-14B scaffold_00014 2766867 (-)
2R 14B scaffold_00286 17030 Not oriented
2R 15A-17A scaffold_00002 5961939 (+)
2R 17A scaffold_00149 205987 Not oriented
2R 17AB scaffold_00077 830129 Not oriented
2R 17B-18B scaffold_00003 5630514 (-)
2R 18C scaffold_00063 1014770
2R 18C scaffold_00261 22170 Not oriented
2R 18C scaffold_00079 793214 Not oriented
2R 18D scaffold_00048 1332325 Not oriented
2R 19A scaffold_00054 1283538 Not oriented
2R 19B-19C scaffold_00026 2124590 (-)
2R 19D scaffold_00073 878309 (-)
2R 19E scaffold_00046 1368814 Not oriented
2R 19E scaffold_10315 853 Not oriented
2L 20C scaffold_00066 971934 Not oriented
2L 20C scaffold_00093 604418 Not oriented
2L 20C-20B scaffold_00043 1551626 (+)
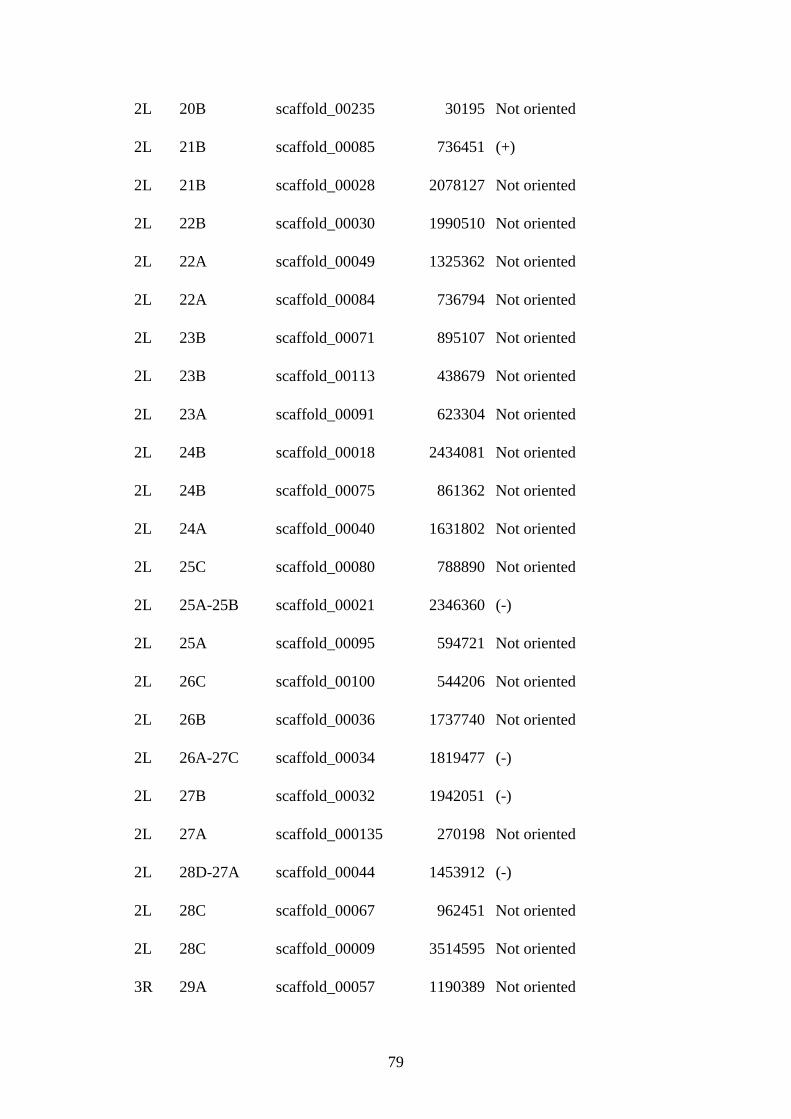
79
2L 20B scaffold_00235 30195 Not oriented
2L 21B scaffold_00085 736451 (+)
2L 21B scaffold_00028 2078127 Not oriented
2L 22B scaffold_00030 1990510 Not oriented
2L 22A scaffold_00049 1325362 Not oriented
2L 22A scaffold_00084 736794 Not oriented
2L 23B scaffold_00071 895107 Not oriented
2L 23B scaffold_00113 438679 Not oriented
2L 23A scaffold_00091 623304 Not oriented
2L 24B scaffold_00018 2434081 Not oriented
2L 24B scaffold_00075 861362 Not oriented
2L 24A scaffold_00040 1631802 Not oriented
2L 25C scaffold_00080 788890 Not oriented
2L 25A-25B scaffold_00021 2346360 (-)
2L 25A scaffold_00095 594721 Not oriented
2L 26C scaffold_00100 544206 Not oriented
2L 26B scaffold_00036 1737740 Not oriented
2L 26A-27C scaffold_00034 1819477 (-)
2L 27B scaffold_00032 1942051 (-)
2L 27A scaffold_000135 270198 Not oriented
2L 28D-27A scaffold_00044 1453912 (-)
2L 28C scaffold_00067 962451 Not oriented
2L 28C scaffold_00009 3514595 Not oriented
3R 29A scaffold_00057 1190389 Not oriented
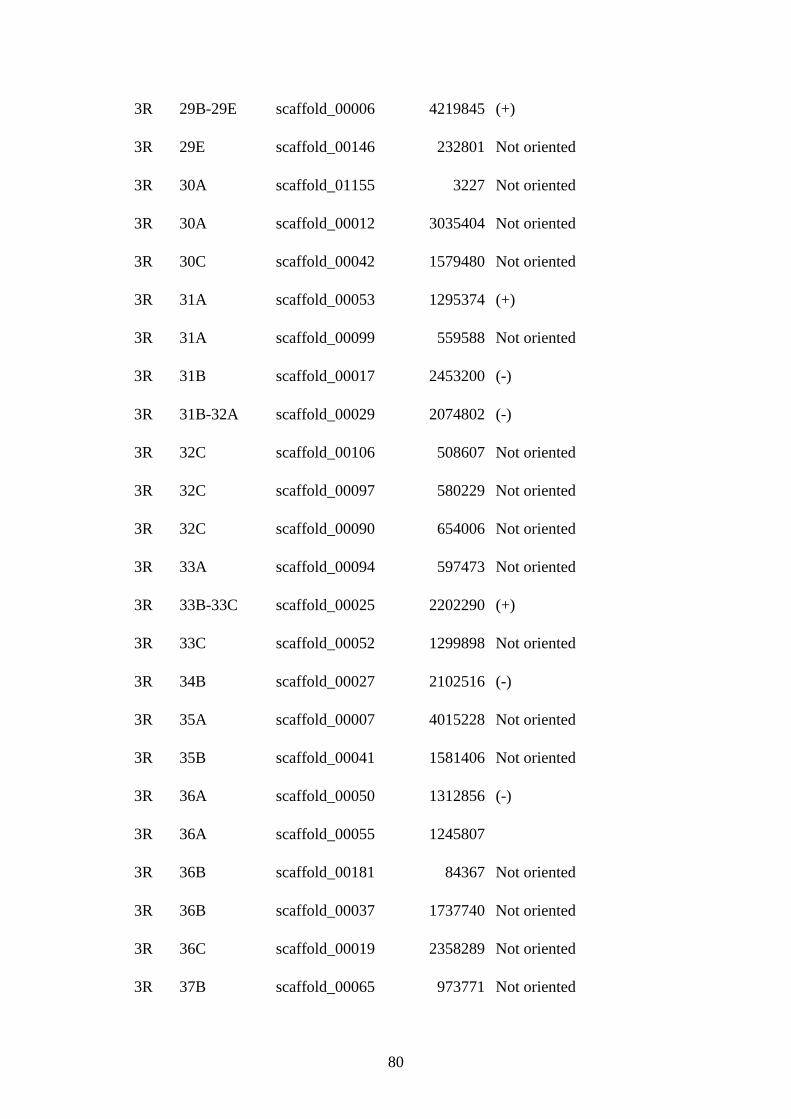
80
3R 29B-29E scaffold_00006 4219845 (+)
3R 29E scaffold_00146 232801 Not oriented
3R 30A scaffold_01155 3227 Not oriented
3R 30A scaffold_00012 3035404 Not oriented
3R 30C scaffold_00042 1579480 Not oriented
3R 31A scaffold_00053 1295374 (+)
3R 31A scaffold_00099 559588 Not oriented
3R 31B scaffold_00017 2453200 (-)
3R 31B-32A scaffold_00029 2074802 (-)
3R 32C scaffold_00106 508607 Not oriented
3R 32C scaffold_00097 580229 Not oriented
3R 32C scaffold_00090 654006 Not oriented
3R 33A scaffold_00094 597473 Not oriented
3R 33B-33C scaffold_00025 2202290 (+)
3R 33C scaffold_00052 1299898 Not oriented
3R 34B scaffold_00027 2102516 (-)
3R 35A scaffold_00007 4015228 Not oriented
3R 35B scaffold_00041 1581406 Not oriented
3R 36A scaffold_00050 1312856 (-)
3R 36A scaffold_00055 1245807
3R 36B scaffold_00181 84367 Not oriented
3R 36B scaffold_00037 1737740 Not oriented
3R 36C scaffold_00019 2358289 Not oriented
3R 37B scaffold_00065 973771 Not oriented
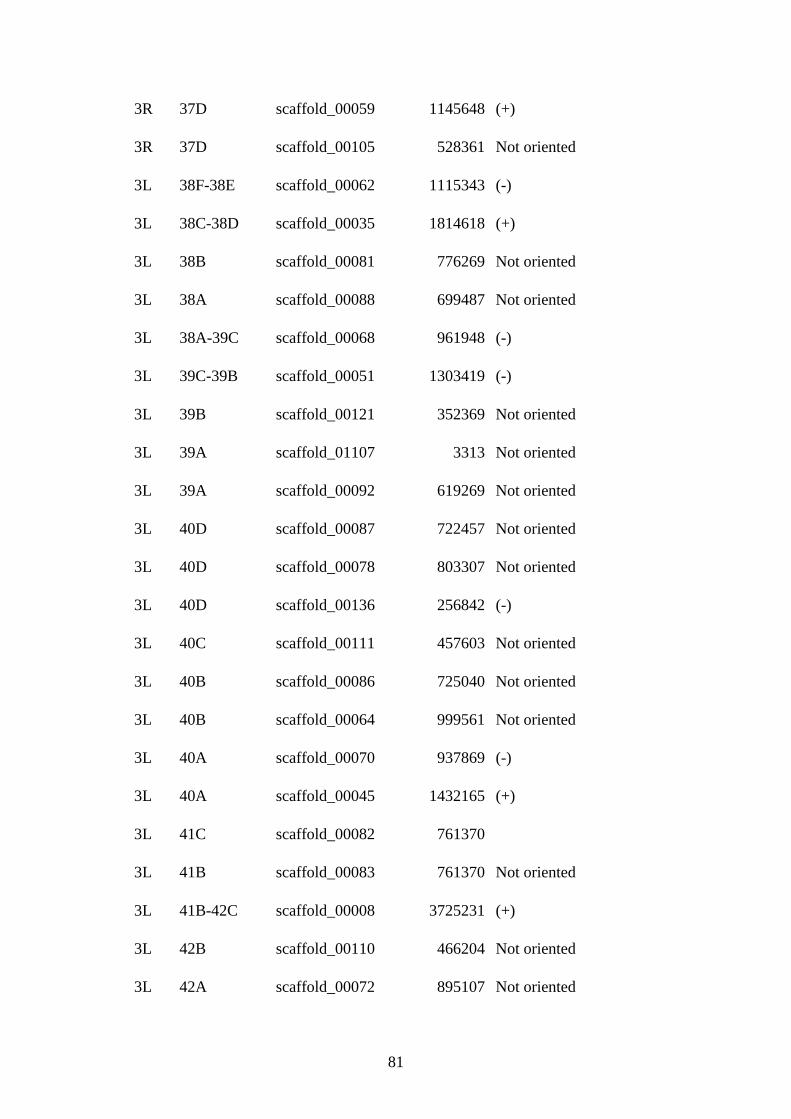
81
3R 37D scaffold_00059 1145648 (+)
3R 37D scaffold_00105 528361 Not oriented
3L 38F-38E scaffold_00062 1115343 (-)
3L 38C-38D scaffold_00035 1814618 (+)
3L 38B scaffold_00081 776269 Not oriented
3L 38A scaffold_00088 699487 Not oriented
3L 38A-39C scaffold_00068 961948 (-)
3L 39C-39B scaffold_00051 1303419 (-)
3L 39B scaffold_00121 352369 Not oriented
3L 39A scaffold_01107 3313 Not oriented
3L 39A scaffold_00092 619269 Not oriented
3L 40D scaffold_00087 722457 Not oriented
3L 40D scaffold_00078 803307 Not oriented
3L 40D scaffold_00136 256842 (-)
3L 40C scaffold_00111 457603 Not oriented
3L 40B scaffold_00086 725040 Not oriented
3L 40B scaffold_00064 999561 Not oriented
3L 40A scaffold_00070 937869 (-)
3L 40A scaffold_00045 1432165 (+)
3L 41C scaffold_00082 761370
3L 41B scaffold_00083 761370 Not oriented
3L 41B-42C scaffold_00008 3725231 (+)
3L 42B scaffold_00110 466204 Not oriented
3L 42A scaffold_00072 895107 Not oriented
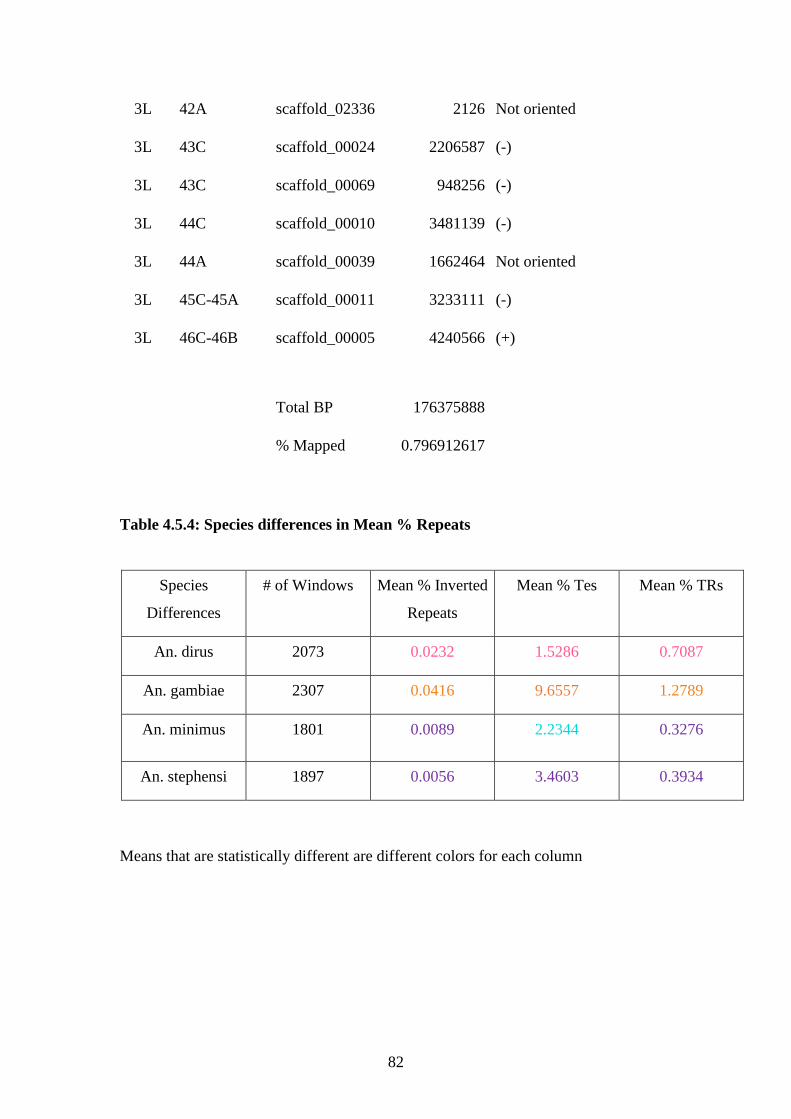
82
3L 42A scaffold_02336 2126 Not oriented
3L 43C scaffold_00024 2206587 (-)
3L 43C scaffold_00069 948256 (-)
3L 44C scaffold_00010 3481139 (-)
3L 44A scaffold_00039 1662464 Not oriented
3L 45C-45A scaffold_00011 3233111 (-)
3L 46C-46B scaffold_00005 4240566 (+)
Total BP 176375888
% Mapped 0.796912617
Table 4.5.4: Species differences in Mean % Repeats
Species
Differences
# of Windows Mean % Inverted
Repeats
Mean % Tes Mean % TRs
An. dirus 2073 0.0232 1.5286 0.7087
An. gambiae 2307 0.0416 9.6557 1.2789
An. minimus 1801 0.0089 2.2344 0.3276
An. stephensi 1897 0.0056 3.4603 0.3934
Means that are statistically different are different colors for each column
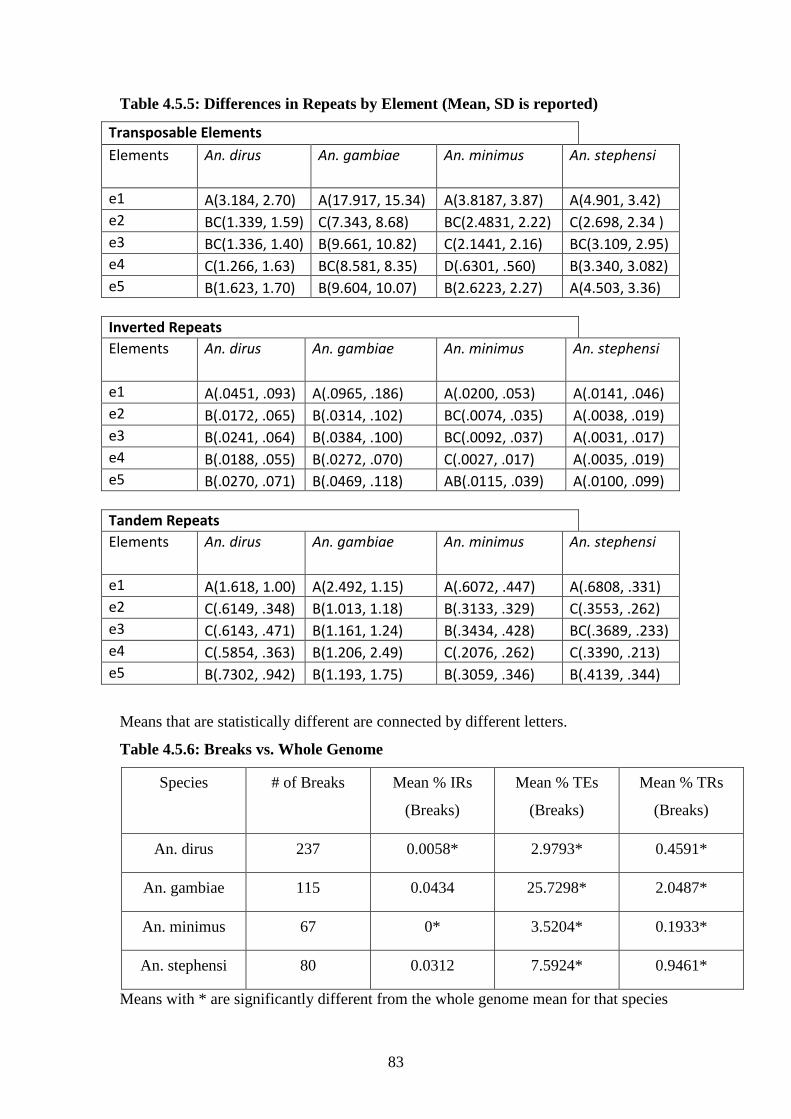
83
Table 4.5.5: Differences in Repeats by Element (Mean, SD is reported)
Transposable Elements
Elements An. dirus An. gambiae An. minimus An. stephensi
e1 A(3.184, 2.70) A(17.917, 15.34) A(3.8187, 3.87) A(4.901, 3.42)
e2 BC(1.339, 1.59) C(7.343, 8.68) BC(2.4831, 2.22) C(2.698, 2.34 )
e3 BC(1.336, 1.40) B(9.661, 10.82) C(2.1441, 2.16) BC(3.109, 2.95)
e4 C(1.266, 1.63) BC(8.581, 8.35) D(.6301, .560) B(3.340, 3.082)
e5 B(1.623, 1.70) B(9.604, 10.07) B(2.6223, 2.27) A(4.503, 3.36)
Inverted Repeats
Elements An. dirus An. gambiae An. minimus An. stephensi
e1 A(.0451, .093) A(.0965, .186) A(.0200, .053) A(.0141, .046)
e2 B(.0172, .065) B(.0314, .102) BC(.0074, .035) A(.0038, .019)
e3 B(.0241, .064) B(.0384, .100) BC(.0092, .037) A(.0031, .017)
e4 B(.0188, .055) B(.0272, .070) C(.0027, .017) A(.0035, .019)
e5 B(.0270, .071) B(.0469, .118) AB(.0115, .039) A(.0100, .099)
Tandem Repeats
Elements An. dirus An. gambiae An. minimus An. stephensi
e1 A(1.618, 1.00) A(2.492, 1.15) A(.6072, .447) A(.6808, .331)
e2 C(.6149, .348) B(1.013, 1.18) B(.3133, .329) C(.3553, .262)
e3 C(.6143, .471) B(1.161, 1.24) B(.3434, .428) BC(.3689, .233)
e4 C(.5854, .363) B(1.206, 2.49) C(.2076, .262) C(.3390, .213)
e5 B(.7302, .942) B(1.193, 1.75) B(.3059, .346) B(.4139, .344)
Means that are statistically different are connected by different letters.
Table 4.5.6: Breaks vs. Whole Genome
Species # of Breaks Mean % IRs
(Breaks)
Mean % TEs
(Breaks)
Mean % TRs
(Breaks)
An. dirus 237 0.0058* 2.9793* 0.4591*
An. gambiae 115 0.0434 25.7298* 2.0487*
An. minimus 67 0* 3.5204* 0.1933*
An. stephensi 80 0.0312 7.5924* 0.9461*
Means with * are significantly different from the whole genome mean for that species
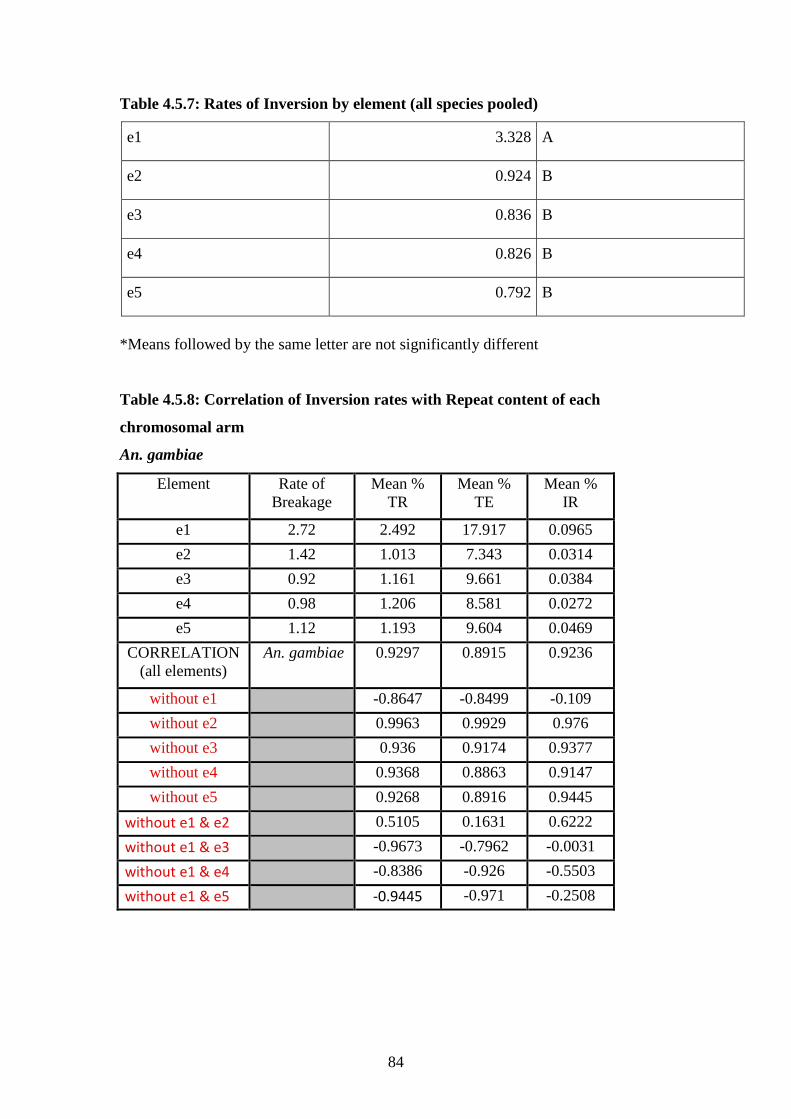
84
Table 4.5.7: Rates of Inversion by element (all species pooled)
e1 3.328 A
e2 0.924 B
e3 0.836 B
e4 0.826 B
e5 0.792 B
*Means followed by the same letter are not significantly different
Table 4.5.8: Correlation of Inversion rates with Repeat content of each
chromosomal arm
An. gambiae
Element Rate of
Breakage
Mean %
TR
Mean %
TE
Mean %
IR
e1 2.72 2.492 17.917 0.0965
e2 1.42 1.013 7.343 0.0314
e3 0.92 1.161 9.661 0.0384
e4 0.98 1.206 8.581 0.0272
e5 1.12 1.193 9.604 0.0469
CORRELATION
(all elements)
An. gambiae 0.9297 0.8915 0.9236
without e1 -0.8647 -0.8499 -0.109
without e2 0.9963 0.9929 0.976
without e3 0.936 0.9174 0.9377
without e4 0.9368 0.8863 0.9147
without e5 0.9268 0.8916 0.9445
without e1 & e2 0.5105 0.1631 0.6222
without e1 & e3 -0.9673 -0.7962 -0.0031
without e1 & e4 -0.8386 -0.926 -0.5503
without e1 & e5 -0.9445 -0.971 -0.2508
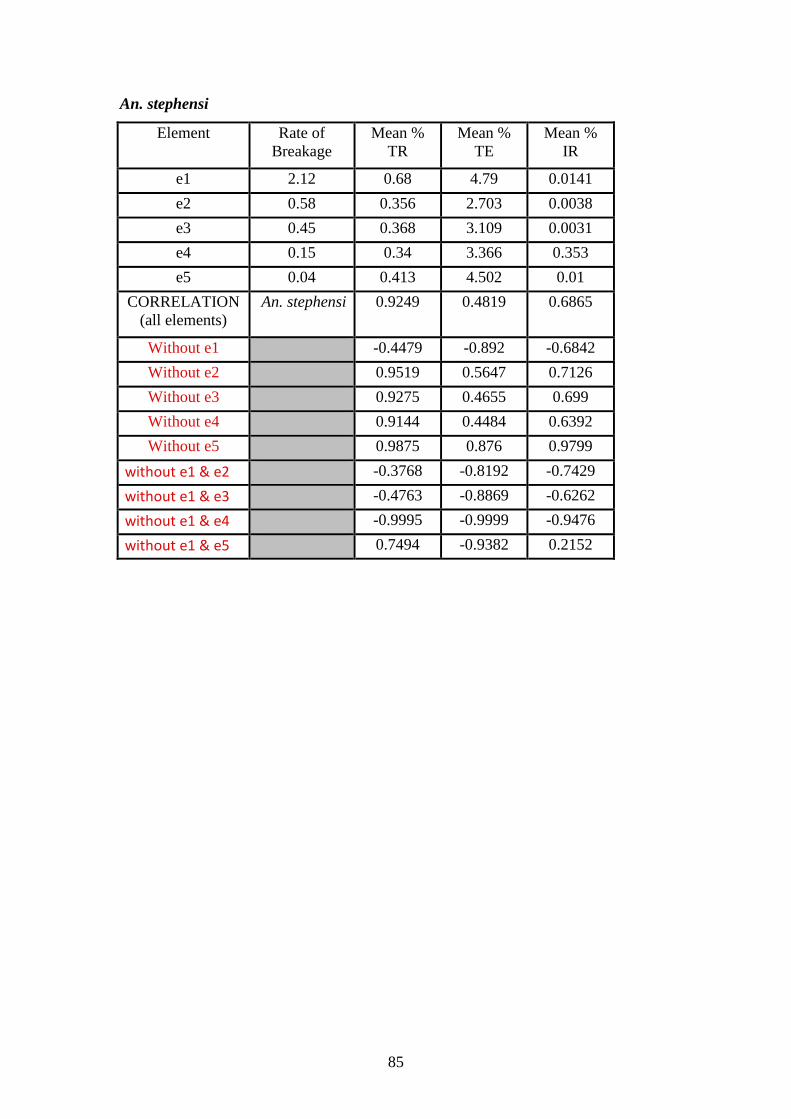
85
An. stephensi
Element Rate of
Breakage
Mean %
TR
Mean %
TE
Mean %
IR
e1 2.12 0.68 4.79 0.0141
e2 0.58 0.356 2.703 0.0038
e3 0.45 0.368 3.109 0.0031
e4 0.15 0.34 3.366 0.353
e5 0.04 0.413 4.502 0.01
CORRELATION
(all elements)
An. stephensi 0.9249 0.4819 0.6865
Without e1 -0.4479 -0.892 -0.6842
Without e2 0.9519 0.5647 0.7126
Without e3 0.9275 0.4655 0.699
Without e4 0.9144 0.4484 0.6392
Without e5 0.9875 0.876 0.9799
without e1 & e2 -0.3768 -0.8192 -0.7429
without e1 & e3 -0.4763 -0.8869 -0.6262
without e1 & e4 -0.9995 -0.9999 -0.9476
without e1 & e5 0.7494 -0.9382 0.2152
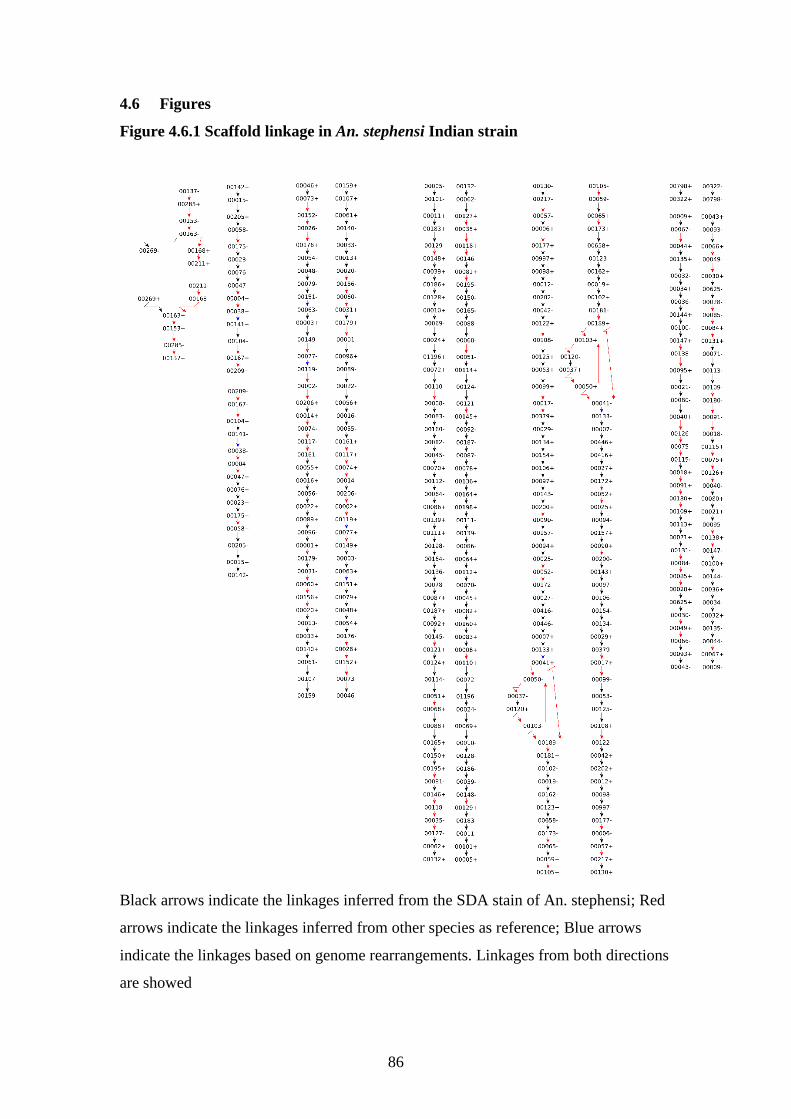
86
4.6 Figures
Figure 4.6.1 Scaffold linkage in An. stephensi Indian strain
Black arrows indicate the linkages inferred from the SDA stain of An. stephensi; Red
arrows indicate the linkages inferred from other species as reference; Blue arrows
indicate the linkages based on genome rearrangements. Linkages from both directions
are showed
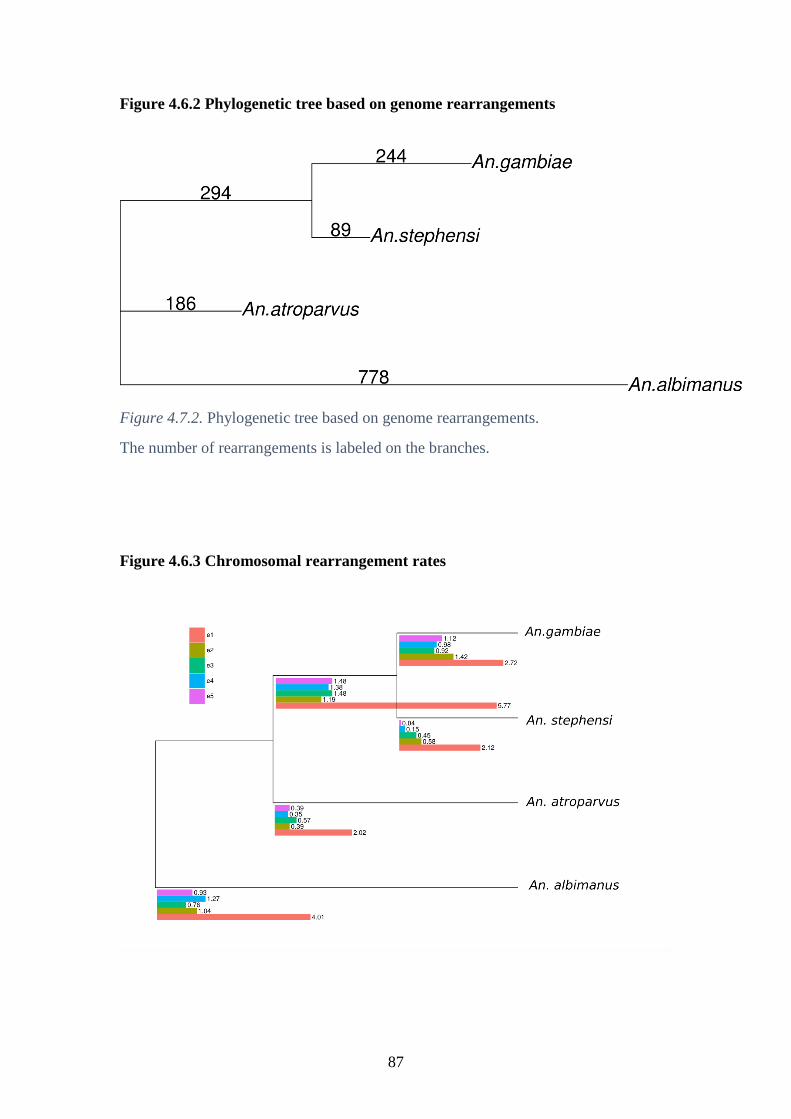
87
Figure 4.6.2 Phylogenetic tree based on genome rearrangements
Figure 4.7.2. Phylogenetic tree based on genome rearrangements.
The number of rearrangements is labeled on the branches.
Figure 4.6.3 Chromosomal rearrangement rates
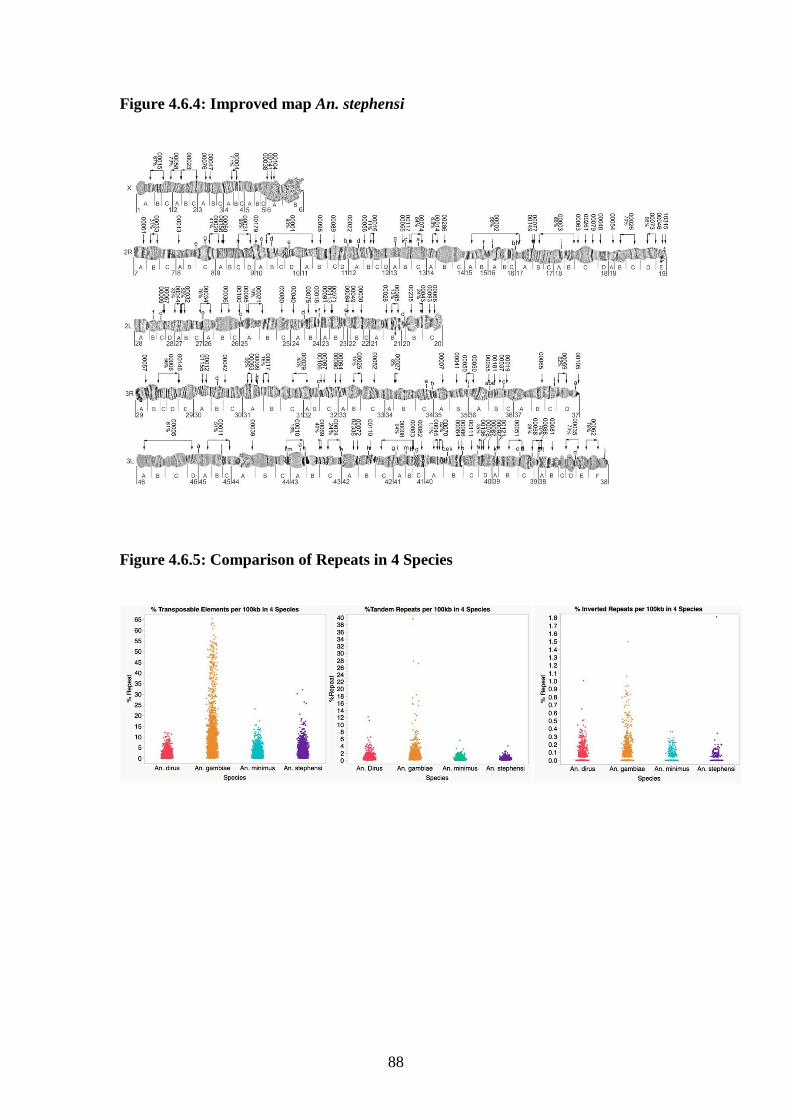
88
Figure 4.6.4: Improved map An. stephensi
Figure 4.6.5: Comparison of Repeats in 4 Species
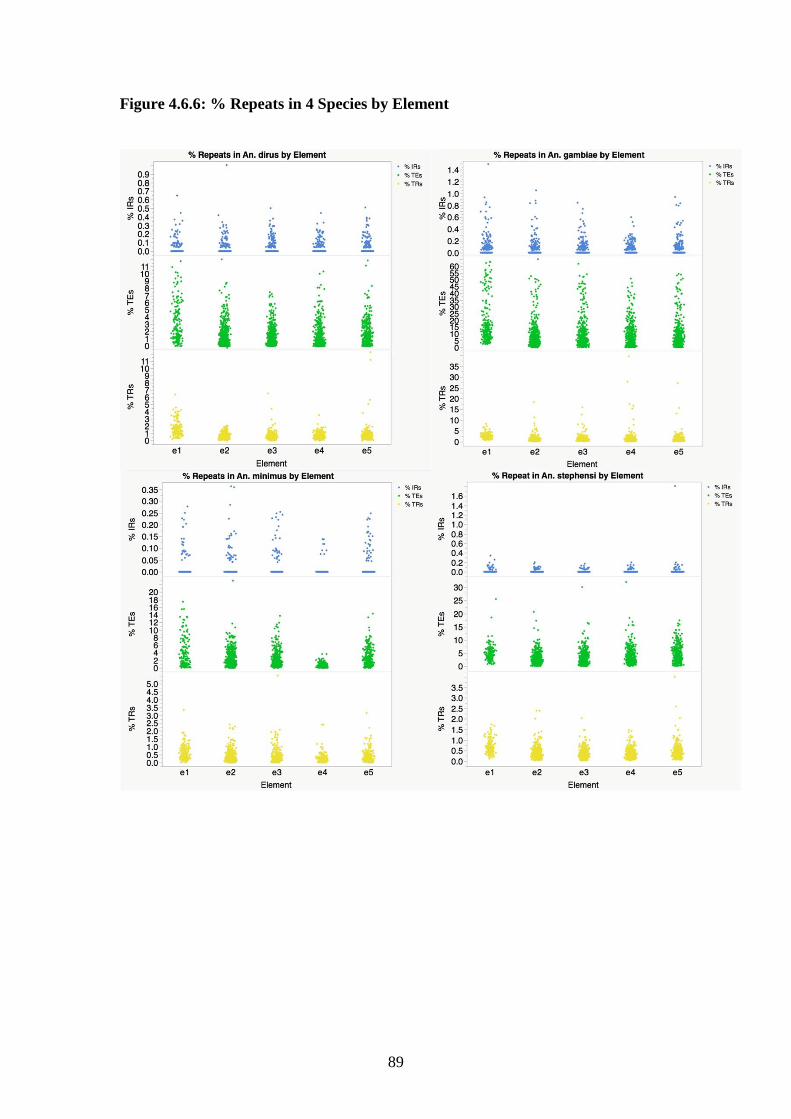
89
Figure 4.6.6: % Repeats in 4 Species by Element
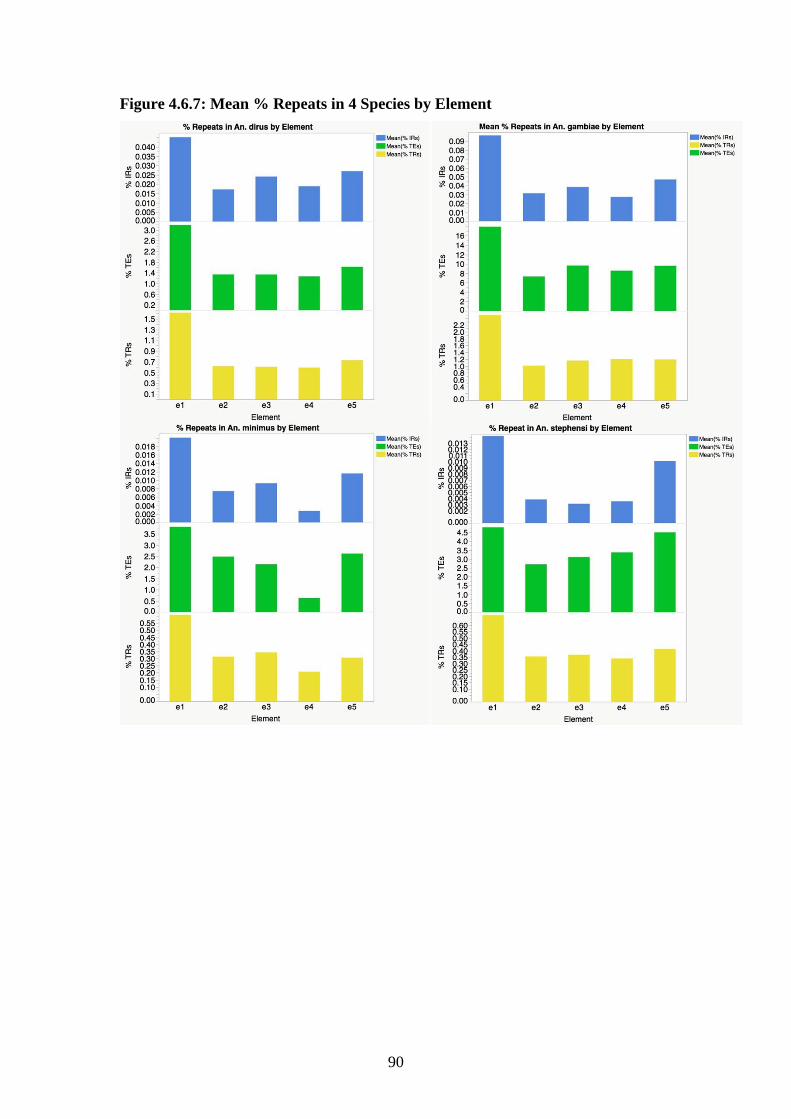
90
Figure 4.6.7: Mean % Repeats in 4 Species by Element
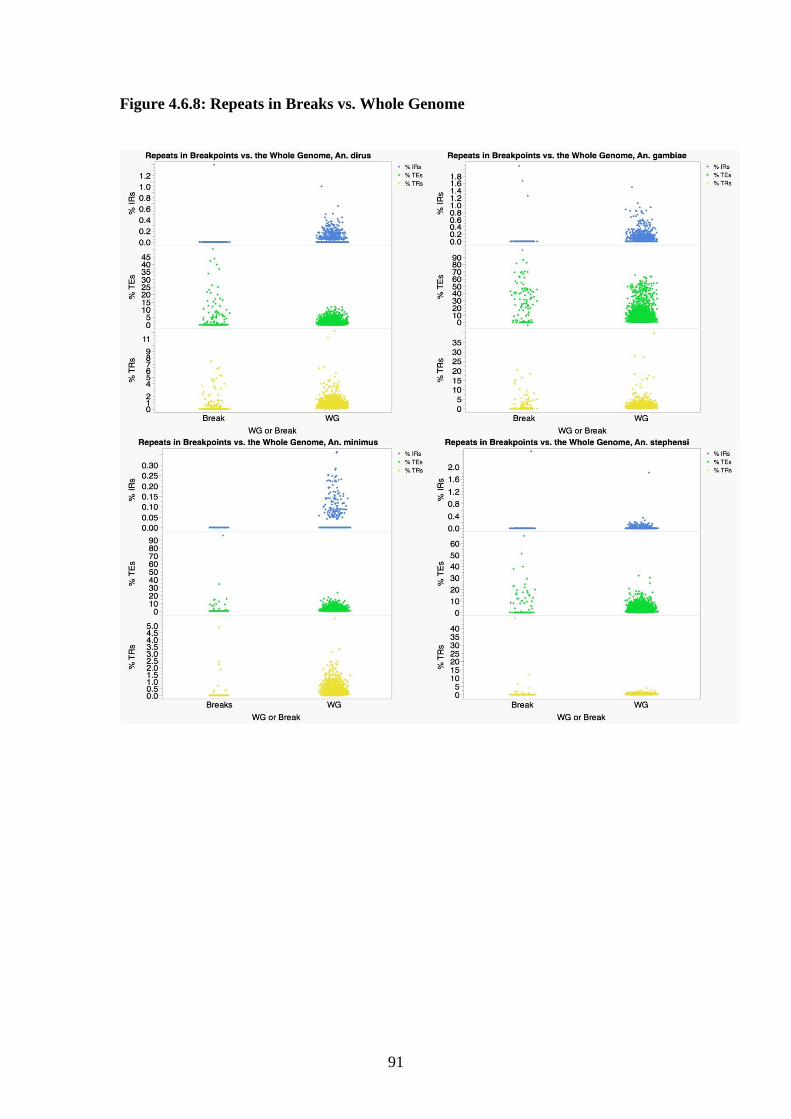
91
Figure 4.6.8: Repeats in Breaks vs. Whole Genome
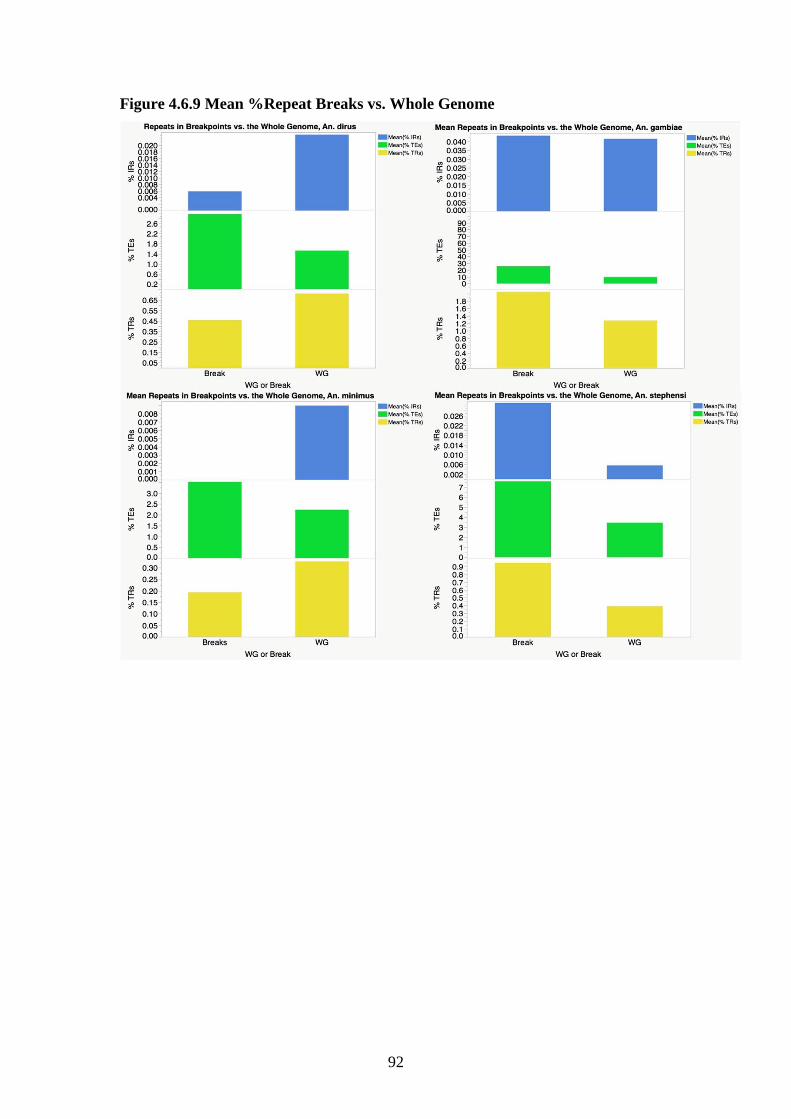
92
Figure 4.6.9 Mean %Repeat Breaks vs. Whole Genome
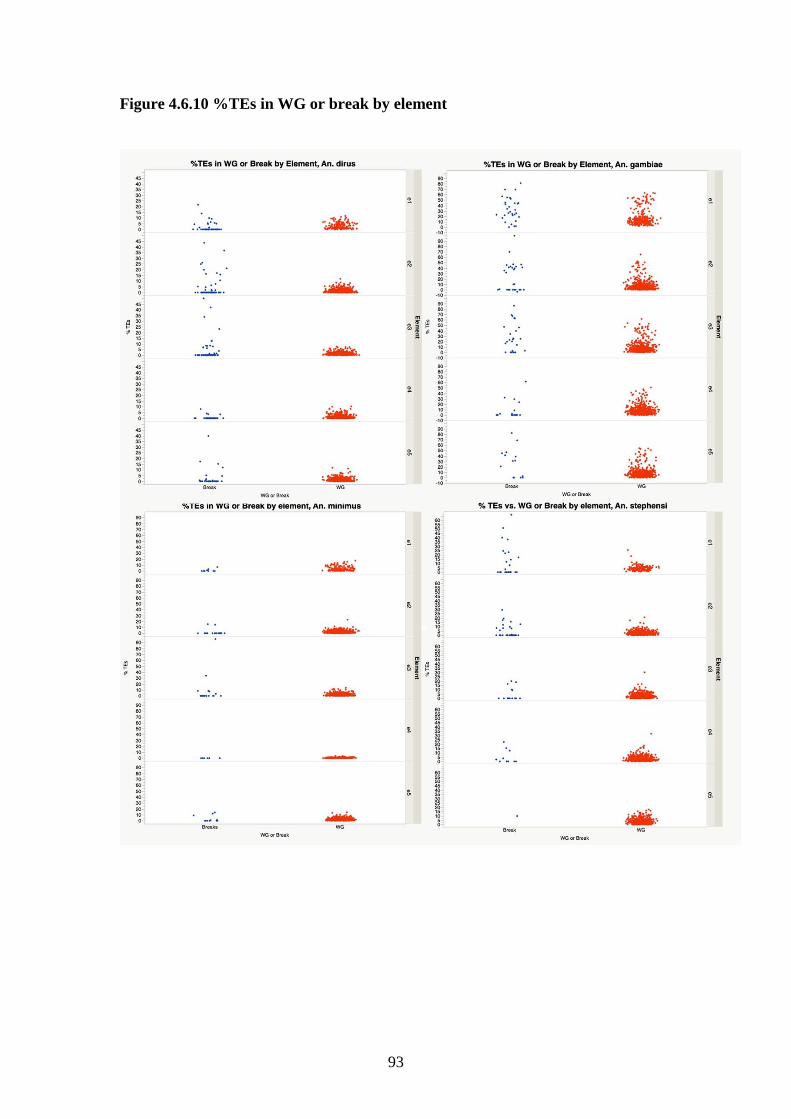
93
Figure 4.6.10 %TEs in WG or break by element
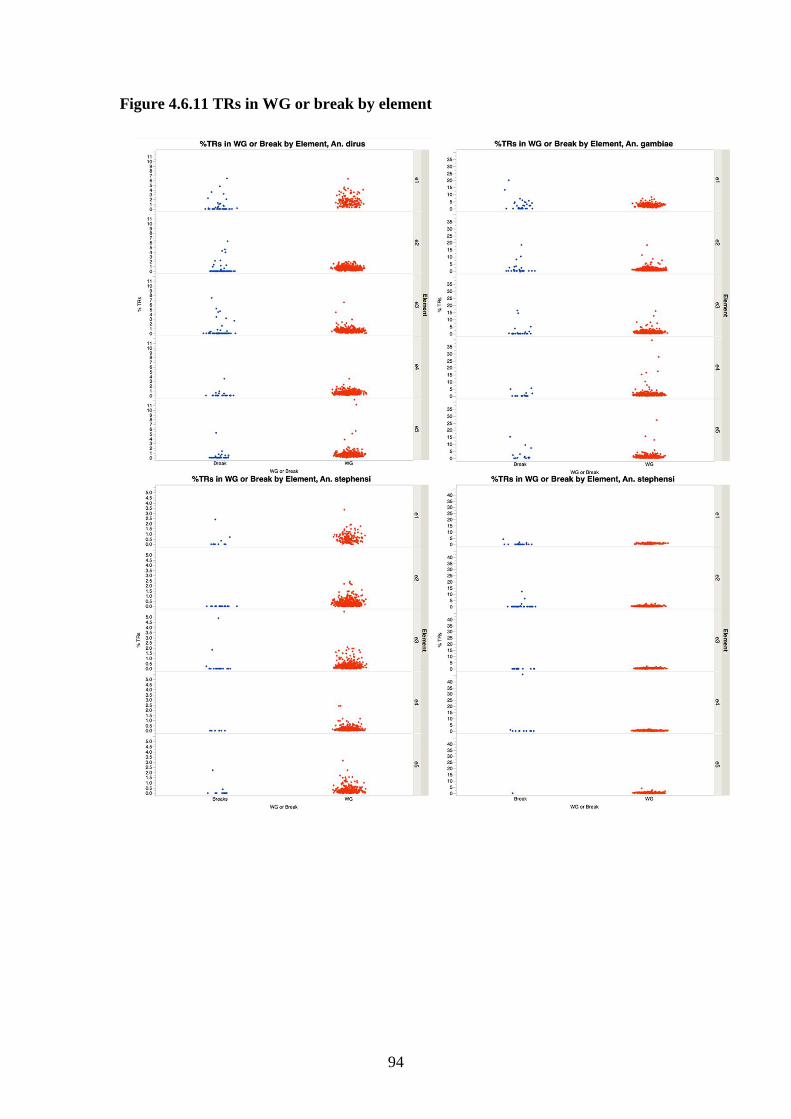
94
Figure 4.6.11 TRs in WG or break by element
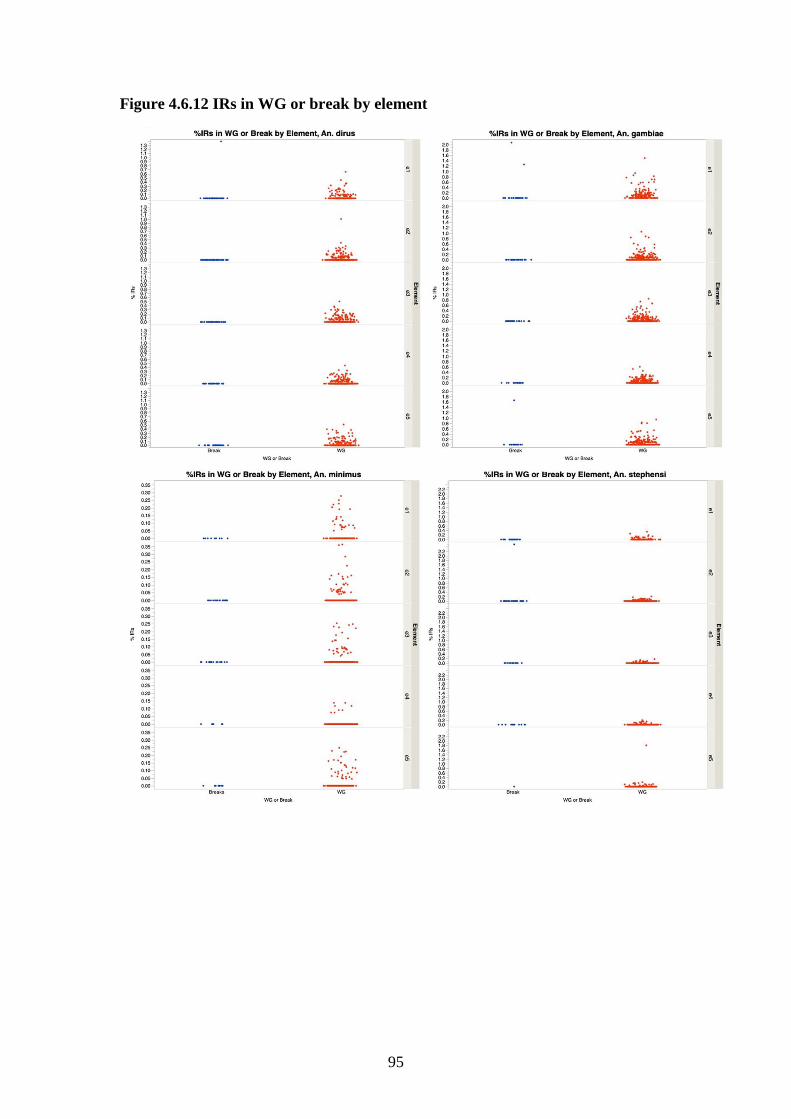
95
Figure 4.6.12 IRs in WG or break by element
96
4.7 Methods
4.7.1 Identification of genome misassemblies
In the evolution of Anophelines, chromosomal inversions are assumed to be
paracentric and translocations are at the whole chromosome arm level. As a result, the
gene exchange between chromosomal elements is expected to be limited to gene
transposition. As gene transposition is not frequent and generally limited to single
genes, if large blocks of genes on the same scaffold have orthologs on different
chromosomal elements, the scaffold is likely misassembled. A Hidden Markov model
(HMM) was used to identify misassemblies in 18 Anopheles genomes, namely An.
albimanus, An. arabiensis, An. atroparvus, An. christyi, An. culicifacies, An, durus,
An.epiroticus, An. farauti, An. funestus, An. gambiae, An. maculatus, An. melas, An.
merus, An. minimus, An. quadriannutatus, An. sinensis, An. stephensi Indian strain
and SDA strain. Genomes and annotations of these species were downloaded from
VectorBase and Anophelinae orthology information was obtained from OrthoDB. The
probability of each ortholog located on a chromosomal element was estimated based
on its chromosomal distribution in An. gambiae. Combined with arbitrary
transposition rate, the emission probability matrix was constructed. The chance of
misassembly occurred between two neighboring genes can be represented by a state
transition rate to build transition probability matrix. The Viterbi algorithm was used to
predict the most likely chromosomal element each gene is on. Scaffolds with genes
assigned to more than one chromosomal element were considered misassembled.
4.7.2 Scaffolding genomes based on conserved syntenic segments and genome
rearrangement
The order of scaffolds can be inferred from the conserved synteny. As shown in
Figure 1, if the last gene on scaffold A and the first gene on scaffold B in Indian
strain An. stephensi are neighboring genes in the SDA strain, the three prime end of
scaffold A should be linked to the five prime end of scaffold B in the Indian strain
assembly. This approach can also be used to link scaffolds inferred from a close
species if the synteny is conserved. This approach will be invalid if a recent genome
rearrangement resulted in a breakpoint between scaffolds. If the breakpoint occurred
within a scaffold, as in Figure 2, further scaffolding is possible.
97
4.7.3 Genome rearrangement analysis
Physical mapping information was used to order scaffolds for An. albimanus, An.
atroparvus and the An. stephensi Indian strain (Supplementary Information:
Order_of_Mapped_Scaffolds.xlsx). The above three species and An. gambiae were
used for the genome rearrangement analysis. Single-copy orthologs presented in four
species were determined and used to identify synteny blocks. Synteny blocks were
defined as genomic regions where the order and orientation of genes were conserved
in all species. Synteny blocks were numbered and signed based on the gene order and
orientation in An. gambiae. Phylogenies were constructed based on the order of
synteny blocks for multi-chromosomal genomes using the Multiple Genome
Rearrangements (MGR) tool. The same analysis was applied to individual
chromosomal elements. The scaffolding predicted by the HMM approach was not
used for the rearrangement analysis because:
a. The evidence based the synteny from different species can be inconsistent
making the decision which arrangement to choose difficult.
b. Even if the evidence is consistent, it can be incorrect if there is a recent
chromosomal inversion.
The only genome used from the HMM approach was An. stephensi as shown in
Figure 3.
4.7.4 Physical mapping and confirmation of gluing predictions in An. stephensi
Indian strain
Physical mapping by fluorescence in-situ hybridization (FISH) was used to confirm
gluing predictions in An. stephensi. DNA probes sized 800-2000 bp were designed
from gene exons at each end of glued supercontigs. To target only the largest
unmapped supercontigs we chose only to map supercontigs numbered 00001-00100
that had not been previously mapped. DNA probes were amplified using PCR with
Immomix(citation for company) and gene product was then labeled with Cy3, Cy5, or
fluorescein dyes via “nick translation” protocols that have been described before
[124]. FISH and subsequent image processing and mapping was performed as
previously described.
98
4.7.5 Transposable elements
We quantified transposable elements in 4 Anopheles species possessing both a repeat
library and at least some information regarding order and orientation of supercontigs
along the chromosomal elements. Anopheles gambiae, An. stephensi, An. minimus
and An. dirus satisfied these criteria and their genomes were analyzed using
RepeatMasker via NCBI’s RMBLAST, version 2.2.27+. Anopheles gambiae, An.
dirus and An. minimus were repeat masked against the repeat library for the species
available at Vectorbase.org. Anopheles stephensi Indian was repeat masked against
the repeat library for this strain obtained from Z. Tu. Prior to repeat detection, each
genome was broken into 100kb windows and sorted by chromosomal coordinates.
The output was filtered in Microsoft Excel to remove simple repeats, low complexity
repeats, unknown repeat families and redundant repeats with more than 80% domain
overlap. Filtered results were then sorted by Window ID using the “.groupby”
function in the pandas module for Python and then summed to find the total number
of repeat base pairs per window. The statistics software, JMP, was used to test for
statistically significant differences between different species, as well as differences
between whole genome and breakpoint regions, and different chromosomal elements
within species.
4.7.6 Inverted repeats
Inverted repeats were assessed in An. dirus, An. gambiae, An. minimus, and An.
stephensi using the linux compatible version of Inverted Repeats Finder available at:
https://tandem.bu.edu/irf/irf307.linux.download.html. Specifically, our study was
interested in quantifying IRs which cause genetic instability. To target small IRs
suspected of being recombinogenic in other species we used IRF parameters 2 3 5 80
10 40 200 7 -t4 207 -d -h. Relevant lines of the resulting .dat file were extracted using
awk and formatted into a .csv file using find and replace. IRs with less that 80%
match were removed from the dataset using awk. Nested IRs were detected using a
Perl script that detected overlapping repeats (provided my NAK, also used for
detection of overlapping TRs). Overlapping repeats with the greatest Smith-Waterman
score were retained in the dataset while redundant repeats with lower scores were
removed. The filtered and formatted .csv was then analyzed in the pandas module for
python to obtain total bp IRs in each 100 KB window. Percent IRs were calculated
and these data were imported into JMP Pro11 software to check for statistically
significant differences between the whole genome mean %IRs in different species,
99
element differences in mean, and mean %IRs between breakpoint regions and the
whole genome.
4.7.7 Simple tandem repeats
Simple Tandem Repeats were quantified in An. dirus, An. gambiae, An. minimus, and
An. stephensi using the linux compatible version of Tandem Repeats finder available
at: https://tandem.bu.edu/trf/trf407b.linux.download.html. Parameters 2 7 7 80 10 50
500 –f –d were used when running the program. The resulting .dat file was filtered to
remove repeats with <80% match and <2 copy number using awk. Overlapping and
nested repeats were detected using a Perl script provided by NAK and redundant
repeats with lower Smith-Waterman scores were removed from the dataset. Tandem
Repeat bp were summed using the pandas module for python as described for the
other repeat types. Percent tandem repeat for each 100kb window was then calculated
and statistically significant differences were then assessed in JMP as described for
other repeat types.
4.7.8 Comparison of breakpoints to the whole genome
Predicted breakpoints greater than 20kb in size were removed from our datasets. This
left 237 breaks in An. dirus, 115 in An. gambiae, 67 in An. minimus and 80 in An.
stephensi. Mean %TE, %IR, and %TR were compared to the corresponding mean in
the whole genome for each species and statistically significant differences were
determined by a one-way ANOVA.
4.7.9 Statistical tests for molecular features
Statistical tests were performed using JMP Statistical software. Our study used post
hoc statistics to make comparisons of mean %TEs, mean %TRs, and mean %IRs
between: species, chromosomal elements (within species), and breakpoints vs. the
whole genome (within species). Species and chromosomal element differences in
each repeat type were determined using an ANOVA followed by a Tukeys HSD test
to examine which groups were different from each other. A Tukeys HSD was selected
to control for experiment wise error as we were comparing 4 species groups and 5
chromosomal elements.
Mean coverage of molecular features in breakpoints within a species were compared
to the whole genome means for that species using a one-way ANOVA
4.7.10 Rates of inversion in anopheles
We calculated rates of inversion in An. albimanus, An. atroparvus, An. gambiae, and
An. stephensi by dividing the number of chromosomal rearrangements on each
100
chromosomal arm by arm size in MB and MY divergence multiplied by 2. To restate,
rate of rearrangement= #breaks/arm size (MB)/(2*MY divergence time). To
determine whether the sex chromosome is evolving faster than the autosomes we ran
a student’s T-test on the rates of chromosomal breakage/MY for all elements pooled
across all species.
4.7.11 Correlations of repeats with rates of chromosomal breakage
Rates of chromosomal breakage for each chromosomal arm were correlated with
mean %TEs, IRs, and TRs in An. gambiae and An. stephensi. Correlations were
performed in JMP using the Multivariate function. To test for confounding effects due
to the much greater repeat density on the sex chromosome, correlation was calculated
with and without e1 means. To test for arm specific differences each autosome was
excluded from that analysis one at a time.
Acknowledgements: We would like to acknowledge members of the Sharakhov lab
especially, Nick Kinney for assistance with perl scripts.
101
Chapter 5: Summary
5.1 General discussion and overview
Malaria vectors possess great ability to adapt. The evolution of behavioral and
metabolic resistance to insecticides threatens to unravel recent success in reducing the
global burden of malaria. As malaria vectors continue to adapt, and overcome the
weapons we use against them, government agencies are in want of new tools to
employ in the fight to eliminate vector borne disease. In this battle, a better
understanding traits such as insecticide resistance and spreading to new environments
is crucial to the future of malaria control. Hugely collaborative genome sequencing
projects have produced genome sequences for more than 20 vector and non-vector
mosquitoes and the raw materials are now available for the creation of many new
genetic tools. Progress in genetic and physical mapping eases the process of
assembling genomes to the chromosomal level and has provided an opportunity for
comparative genomics studies with many members of genus Anopheles. Multi-species
comparison of many members of this group can elucidate the evolutionary processes
that have produced such efficient vectors of disease. Additionally, genome maps and
knowledge of genome landscapes can greatly assist in understanding the genetic basis
for epidemiologically important traits, and understanding modes of adaptation. This
information in turn aids in the search for novel gene targets for genetic control of
mosquitoes.
5.2 Review of chapter 2
Anopheles stephensi is an important vector of malaria in India and the middle east.
We sequenced and assembled the Indian strain by employing a combination of
Illumina, 454 and PacBio sequencing. This combined approach allowed us to take
advantage of the long reads of PacBio to bridge gaps, and balance that with the
greater accuracy of the shorter read Ilumina and 454 technologies. Our genome
sequence is accompanied by a physical map representing 62% of the An. stephensi
genome. Despite the fragmentation of this chromosomal assembly, gene order
comparisons between An. gambiae and An. stephensi allowed quantification of
chromosomal rearrangements that have occurred in the 30.4 million years since these
102
two species diverged. Our results indicate a much faster rate of chromosomal
rearrangement on the sex chromosome, despite a distinct lack of polymorphic
inversions this arm. Additionally the faster rate of evolution corresponds with higher
densities of TEs and satellite DNA. A comparison of the rates of evolution between
An. stephensi and An. gambiae to those of Drosophila indicates that fast rates of
rearrangement observed in Anopheles are a feature common to Diptera.
Our genome study includes an RNA-seq based analysis of transcriptomics that
generated expression profiles for many life stage and gender specific genes. This
information will be useful for later studies seeking to discern the genetic basis for
important traits and behaviors. A few very important subsets of genes including those
related to immunity, the sialome and the Y chromosome. Insights gained from these
targeted analyses promise to enrich further studies of these vital aspects of mosquito
biology.
5.3 Review of chapter 3
Anopheles albimanus is a dominant vector of malaria in central America whose
genome was recently sequenced as part of the Anopheles 16 genomes project. This
mosquito possesses a compact genome of ~170 MB, which has been assembled into a
small number of very large supercontigs. These genomic attributes combined with the
availability of high quality polytene chromosomes from the salivary glands make this
vector a good candidate for chromosomal mapping. Additionally, this species is
evolutionarily distant from other physically mapped species An. gambiae and An.
stephensi. The addition of a physical map for An. albimanus would permit studies of
genome rearrangement over both short and long distances within genus Anopheles.
A low coverage physical map was published for this species in 2000 by Cornell and
Collins which allowed 75% of the genome to be placed to chromosomes. Although
this photomap vastly improves the clarity of banding patterns over previous drawn
maps, some chromosomal subdivisions were lacking and images were not completely
flattened or straightened. These shortcomings could obscure relative distance between
bands and render this map insufficient for physical mapping of the whole genome.
Our new cytogenetic map for An. albimanus corrects these inadequacies and offers
103
detailed description of chromosomal landmarks. Our improvements will permit use of
this map by a wider audience within the scientific community.
Physical mapping of genomic supercontigs onto An. albimanus chromosomes via
fluorescent in situ hybridization (FISH) allowed us to localize 98% of the sequenced
genome to chromosomal locations. In the course of our physical mapping we
identified 9 misassemblies within 5 supercontigs. These misassemblies broke some of
the largest supercontigs into 2-4 pieces of variable size. Further investigation of sites
of misassembly indicate that 100% of misassembly co-occur with physical gaps
between contigs of the genomic sequence that were incorrectly bridged. These
findings underscore the importance of physical mapping for validation of
computational approaches and ensuring accuracy in genome assemblies.
Our physical map which comprises 98% of the An. albimanus genome is the highest
coverage genome map for any mosquito species to date. This map is a high quality
tool that improves upon previous physical maps and corrects mistakes within the
assembly. The order of supercontigs on our map is in very high agreement with a
previous cytogenetic map published in 2009. Our high coverage map is a valuable
tool that can be applied to study of genome evolution in Anopheles and promises to
help uncover patterns and modes of genomic rearrangement in malaria vectors.
5.4 Review of chapter 4
As part of global efforts at malaria eradication, 16 vector and non-vector Anopheles
genomes were sequenced and made available to researchers. This is a huge milestone
for the malaria research community and will undoubtedly play a critical role in
research that will eventually eliminate this devastating disease. In the initial
publication of the 16 genomes project, orthologs within the low coverage
chromosomal assemblies for An. albimanus, An. funestus, An. stephensi, and An.
atroparvus were compared to An. gambiae to study chromosomal evolution over 100
million years. This study yielded several important insights into modes of evolution in
malaria vectors and provides a foundation for many future works
Since the 16 genomes concentrated efforts have improved the quality of chromosomal
assemblies; An. stephensi, An. atroparvus and An. albimanus now possess relatively
104
complete genome assemblies at ~80 or greater. Syntenic relationships have also been
leveraged to predict the chromosomal order of supercontigs in An. stephensi, An.
dirus and An. minimus. New computational approaches have also enabled
multispecies alignments for identifying lineage specific inversion breakpoints rather
than the pairwise alignments that were used in the original publication. We utilized
these resources for a detailed analysis of genome rearrangement breakpoints wherein
repetitive DNA including transposable elements(TEs), tandem repeats(TRs) and
inverted repeats(IRs) were quantified and compared to the whole genome.
Our study found that syntenic relationships provide a reliable prediction of
supercontig order along mosquito chromosomes. We were able to test the validity of
this approach in An. stephensi Indian strain and found very high agreement between
the physical map and predicted order of supercontigs. Although this approach requires
further evaluation in other species, these results support syntenic scaffolding as a
viable method for assembly of genomes to the chromosomal level. The combination
of computational methods such as syntenic scaffolding with physical mapping
promises to speed the process of chromosomal assembly in future studies.
Our examination of rates of evolution corroborated previous works which
demonstrate that the X chromosome evolves much faster and hosts much higher
densities of repeats relative to the autosomes. Correlations of repeats to the rate of
breakage for each arm in An. stephensi and An. gambiae reveals strong, positive
correlations but only if the sex chromosome is included in the analysis. Without the
sex chromosome correlations become moderately negative or disappear all together.
An arm by arm correlation analysis suggests that different repeat types may contribute
to chromosomal breakage on different chromosomal arms. In An. gambiae e2
accounts for the negative correlation between autosomal breakage and %TRs. In An.
stephensi removal of e1 and e5 results in a strong positive correlation between rates of
inversion of e2, e3, and e4 and coverage of TRs. This indicates that TRs may play a
major role in the genesis of inversions on all autosomes except e5.
Investigation of the molecular content of breakpoints revealed transposable elements
are consistently overrepresented in breakpoint regions of all species across all arms.
These findings contradict negative correlations between autosomal rates of breakage
105
and coverage of TEs. These contradictory results could suggest that some other
molecular feature is at work, perhaps in addition to TEs, on the autosomes. Based on
previous work, one good candidate for genomic instability on autosomes are
Segmental duplications (SDs) which were found in greater density on several
autosomes than on the sex chromosome. Other possible explanations for the
contradiction between correlations and the molecular content of breakpoints include a
lack of distinction in our study between autonomous and non autonomous TEs within
breakpoints. Further analysis is required to filter out TEs that are not capable of
creating chromosomal breaks. It is also possible that the greater coverage of TEs in
breakpoint regions reflects a confounding association unrelated to the generation of
chromosomal inversions. Our study cannot rule out differential effects of selection on
different chromosomal arms which could also account for differences in rates of
breakage independently of repeat content.
Although this study has focused primarily on the parts of mosquito genomes that have
changed, the blocks of genes which have remained intact over evolutionary time are
also important. Evolutionarily conserved regions presumably contain genes of vital
function to survival of the organism. As such, characterization of these genes can
perhaps provide more detailed insights into the genetic basis of many aspects of
mosquito biology. From the applied standpoint, characterization of these genes will
perhaps reveal novel genes that can be repurposed into “genetic kill switches” in the
genetic control of mosquitoes.
References
1. Sinka, M.E., et al., The dominant Anopheles vectors of human malaria in the
Asia-Pacific region: occurrence data, distribution maps and bionomic précis. Parasites & Vectors, 2011. 4(1): p. 1-46.
2. Sinka, M.E., et al., The dominant Anopheles vectors of human malaria in Africa, Europe and the Middle East: occurrence data, distribution maps and bionomic précis. Parasites & Vectors, 2010. 3(1): p. 1-34.
3. Sinka, M.E., et al., The dominant Anopheles vectors of human malaria in the Americas: occurrence data, distribution maps and bionomic précis. Parasit Vectors, 2010. 3.
4. Organization, W.H. World Malaria Report 2015. 2015 [cited 2015. 5. Coetzee, M. and L.L. Koekemoer, Molecular systematics and insecticide
resistance in the major African malaria vector Anopheles funestus. Annu Rev Entomol, 2013. 58: p. 393-412.
106
6. Djouaka, R., et al., Exploring Mechanisms of Multiple Insecticide Resistance in a Population of the Malaria Vector <italic>Anopheles funestus</italic> in Benin. PLoS ONE, 2011. 6(11): p. e27760.
7. Riveron, J.M., et al., Rise of multiple insecticide resistance in Anopheles funestus in Malawi: a major concern for malaria vector control. Malaria Journal, 2015. 14: p. 344.
8. Sande, S., et al., The emergence of insecticide resistance in the major malaria vector Anopheles funestus (Diptera: Culicidae) from sentinel sites in Mutare and Mutasa Districts, Zimbabwe. Malaria Journal, 2015. 14: p. 466.
9. Neafsey, D.E., et al., Mosquito genomics. Highly evolvable malaria vectors: the genomes of 16 Anopheles mosquitoes. Science, 2015. 347(6217): p. 1258522.
10. Alphey, L., Genetic control of mosquitoes. Annu Rev Entomol, 2014. 59: p. 205-24.
11. Alphey, L. and N. Alphey, Five things to know about genetically modified (GM) insects for vector control. PLoS Pathog, 2014. 10(3).
12. Reichard, R.E., Area-wide biological control of disease vectors and agents affecting wildlife. Rev Sci Tech, 2002. 21(1): p. 179-85.
13. Alphey, L., Sterile-Insect Methods for Control of Mosquito-Borne Diseases: An. 2010. 10(3): p. 295-311.
14. Readshaw, J.L., Screwworm eradication a grand delusion? Nature, 1986. 320(6061): p. 407-10.
15. Aryan, A., et al., TALEN-based gene disruption in the dengue vector Aedes aegypti. PLoS One, 2013. 8.
16. Hammond, A., et al., A CRISPR-Cas9 gene drive system targeting female reproduction in the malaria mosquito vector Anopheles gambiae. Nat Biotech, 2016. 34(1): p. 78-83.
17. Kistler, Kathryn E., Leslie B. Vosshall, and Benjamin J. Matthews, Genome Engineering with CRISPR-Cas9 in the Mosquito <em>Aedes aegypti</em>. Cell Reports. 11(1): p. 51-60.
18. DeGennaro, M., et al., Orco mutant mosquitoes lose strong preference for humans and are not repelled by volatile DEET. Nature, 2013. 498.
19. Fu, G., et al., Female-specific flightless phenotype for mosquito control. Proc Natl Acad Sci U S A, 2010. 107.
20. Gentile, J.E., S.S.C. Rund, and G.R. Madey, Modelling sterile insect technique to control the population of Anopheles gambiae. Malaria Journal, 2015. 14: p. 92.
21. Zeh, D.W., J.A. Zeh, and M.M. Bonilla, Wolbachia, sex ratio bias and apparent male killing in the harlequin beetle riding pseudoscorpion. Heredity, 2005. 95(1): p. 41-49.
22. Fry, A.J., M.R. Palmer, and D.M. Rand, Variable fitness effects of Wolbachia infection in Drosophila melanogaster. Heredity, 2004. 93(4): p. 379-389.
23. Riparbelli, M.G., et al., Wolbachia-Mediated Male Killing Is Associated with Defective Chromatin Remodeling. PLoS ONE, 2012. 7(1): p. e30045.
24. Martinez, J., et al., Should Symbionts Be Nice or Selfish? Antiviral Effects of Wolbachia Are Costly but Reproductive Parasitism Is Not. PLoS Pathog, 2015. 11(7): p. e1005021.
25. Hedges, L.M., et al., Wolbachia and virus protection in insects. Science, 2008. 322(5902): p. 702.
26. Hoffmann, A.A., et al., Successful establishment of Wolbachia in Aedes populations to suppress dengue transmission. Nature, 2011. 476(7361): p. 454-7.
27. Hoffmann, A.A., et al., Stability of the wMel Wolbachia Infection following invasion into Aedes aegypti populations. PLoS Negl Trop Dis, 2014. 8(9): p. e3115.
107
28. Bian, G., et al., Wolbachia invades Anopheles stephensi populations and induces refractoriness to Plasmodium infection. Science, 2013. 340(6133): p. 748-51.
29. Bourtzis, K., et al., Harnessing mosquito-Wolbachia symbiosis for vector and disease control. Acta Trop, 2014. 132(63): p. 16.
30. Dodson, B.L., et al., <italic>Wolbachia</italic> Enhances West Nile Virus (WNV) Infection in the Mosquito <italic>Culex tarsalis</italic>. PLoS Negl Trop Dis, 2014. 8(7): p. e2965.
31. Hughes, G.L., et al., Wolbachia strain wAlbB enhances infection by the rodent malaria parasite Plasmodium berghei in Anopheles gambiae mosquitoes. Appl Environ Microbiol, 2012. 78(5): p. 1491-5.
32. Evolution of genes and genomes on the Drosophila phylogeny. Nature, 2007. 450(7167): p. 203-218.
33. Brown, S.E., et al., Integration of the Aedes aegypti mosquito genetic linkage and physical maps. Genetics, 2001. 157(3): p. 1299-305.
34. Severson, D.W., RFLP analysis of insect genomes, in The Molecular Biology of Insect Disease Vectors: A Methods Manual, J.M. Crampton, C.B. Beard, and C. Louis, Editors. 1997, Springer Netherlands: Dordrecht. p. 309-320.
35. Genomes, 2nd edition. 2nd ed. 2002, Oxford, U.K.: BIOS Scientific Publishers. 572.
36. Pringle, E.G., et al., Synteny and Chromosome Evolution in the Lepidoptera: Evidence From Mapping in Heliconius melpomene. Genetics. 2007 Sep;177(1):417-26. doi:10.1534/genetics.107.073122.
37. Hickner, P.V., et al., Composite linkage map and enhanced genome map for Culex pipiens complex mosquitoes. J Hered, 2013. 104(5): p. 649-55.
38. Juneja, P., et al., Assembly of the Genome of the Disease Vector <italic>Aedes aegypti</italic> onto a Genetic Linkage Map Allows Mapping of Genes Affecting Disease Transmission. PLoS Negl Trop Dis, 2014. 8(1): p. e2652.
39. Witzig, C., et al., Genetic mapping identifies a major locus spanning P450 clusters associated with pyrethroid resistance in kdr-free Anopheles arabiensis from Chad. Heredity, 2013. 110(4): p. 389-397.
40. Fansiri, T., et al., Genetic Mapping of Specific Interactions between <italic>Aedes aegypti</italic> Mosquitoes and Dengue Viruses. PLoS Genet, 2013. 9(8): p. e1003621.
41. Schaeffer, S.W., et al., Polytene chromosomal maps of 11 Drosophila species: the order of genomic scaffolds inferred from genetic and physical maps. Genetics, 2008. 179(3): p. 1601-1655.
42. Bhutkar, A., et al., Chromosomal rearrangement inferred from comparisons of 12 Drosophila genomes. Genetics, 2008. 179(3): p. 1657-1680.
43. Holt, R.A., et al., The genome sequence of the malaria mosquito Anopheles gambiae. Science, 2002. 298(5591): p. 129-49.
44. Sharakhova, M.V., et al., Update of the Anopheles gambiae PEST genome assembly. Genome Biol, 2007. 8(1): p. R5.
45. Sharakhova, M.V., et al., A standard cytogenetic photomap for the mosquito Anopheles stephensi (Diptera: Culicidae): application for physical mapping. J Med Entomol, 2006. 43(5): p. 861-6.
46. Artemov, G.N., et al., A standard photomap of ovarian nurse cell chromosomes in the European malaria vector Anopheles atroparvus. Med Vet Entomol, 2015. 17(10): p. 12113.
47. Cornel, A.J. and F.H. Collins, Maintenance of chromosome arm integrity between two Anopheles mosquito subgenera. J Hered, 2000. 91(5): p. 364-70.
48. Sharakhova, M.V., et al., Cytogenetic map for Anopheles nili: application for population genetics and comparative physical mapping. Infection, genetics
108
and evolution : journal of molecular epidemiology and evolutionary genetics in infectious diseases, 2011. 11(4): p. 746-754.
49. Sharakhova, M.V., et al., Arm-specific dynamics of chromosome evolution in malaria mosquitoes. BMC Evol Biol, 2011. 11: p. 91.
50. Xia, A., et al., Genome landscape and evolutionary plasticity of chromosomes in malaria mosquitoes. PLoS One, 2010. 5(5): p. e10592.
51. Timoshevskiy, V.A., et al., An Integrated Linkage, Chromosome, and Genome Map for the Yellow Fever Mosquito <italic>Aedes aegypti</italic>. PLoS Negl Trop Dis, 2013. 7(2): p. e2052.
52. Timoshevskiy, V., et al., Genomic composition and evolution of Aedes aegypti chromosomes revealed by the analysis of physically mapped supercontigs. BMC Biology, 2014. 12(1): p. 27.
53. Penilla, R.P., et al., Towards a Genetic Map for Anopheles albimanus: Identification of Microsatellite Markers and a Preliminary Linkage Map for Chromosome 2. The American Journal of Tropical Medicine and Hygiene, 2009. 81(6): p. 1007-1012.
54. Coluzzi, M., Heterogeneities of the malaria vectorial system in tropical Africa and their significance in malaria epidemiology and control. Bull World Health Organ, 1984. 62(Suppl): p. 107-13.
55. Sharakhov, I.V., G.N. Artemov, and M.V. Sharakhova, Chromosome evolution in malaria mosquitoes inferred from physically mapped genome assemblies. Journal of Bioinformatics and Computational Biology, 2016. 14(02): p. 1630003.
56. Brooke, B.D., et al., Stable chromosomal inversion polymorphisms and insecticide resistance in the malaria vector mosquito Anopheles gambiae (Diptera: Culicidae). J Med Entomol, 2002. 39(4): p. 568-73.
57. Fouet, C., et al., Adaptation to aridity in the malaria mosquito Anopheles gambiae: chromosomal inversion polymorphism and body size influence resistance to desiccation. PLoS One, 2012. 7(4): p. e34841.
58. Mnzava, A.E., M.J. Mutinga, and C. Staak, Host blood meals and chromosomal inversion polymorphism in Anopheles arabiensis in the Baringo District of Kenya. J Am Mosq Control Assoc, 1994. 10(4): p. 507-10.
59. Ayala D, U.A.a.G.J., Adaptation through chromosomal inversions in Anopheles. Front. Genet. , (2014).
60. Coluzzi, M., et al., A polytene chromosome analysis of the Anopheles gambiae species complex. Science, 2002. 298(5597): p. 1415-8.
61. Pombi, M., et al., Chromosomal plasticity and evolutionary potential in the malaria vector Anopheles gambiae sensu stricto: insights from three decades of rare paracentric inversions. BMC Evol Biol, 2008. 8.
62. González, J., F. Casals, and A. Ruiz, Testing chromosomal phylogenies and inversion breakpoint reuse in Drosophila. Genetics, 2007. 175.
63. Puerma, E., et al., Characterization of the Breakpoints of a Polymorphic Inversion Complex Detects Strict and Broad Breakpoint Reuse at the Molecular Level. Molecular Biology and Evolution, 2014. 31(9): p. 2331-2341.
64. Pevzner, P. and G. Tesler, Human and mouse genomic sequences reveal extensive breakpoint reuse in mammalian evolution. Proceedings of the National Academy of Sciences, 2003. 100(13): p. 7672-7677.
65. Ruiz-Herrera, A., J. Castresana, and T.J. Robinson, Is mammalian chromosomal evolution driven by regions of genome fragility? Genome Biol, 2006. 7(12): p. R115.
66. Grotthuss, M.v.o.n., M. Ashburner, and J. Ranz, Fragile regions and not functional constraints predominate in shaping gene organization in the genus Drosophila. Genome Research, 2010. 20.
109
67. Diaz-Castillo, C., X.Q. Xia, and J.M. Ranz, Evaluation of the role of functional constraints on the integrity of an ultraconserved region in the genus Drosophila. PLoS Genet, 2012. 8(2): p. e1002475.
68. Kamali, M., et al., A new chromosomal phylogeny supports the repeated origin of vectorial capacity in malaria mosquitoes of the Anopheles gambiae complex. PLoS Pathog, 2012. 8(10): p. e1002960.
69. Coulibaly, M.B., et al., Segmental Duplication Implicated in the Genesis of Inversion 2<italic>Rj</italic> of <italic>Anopheles gambiae</italic>. PLoS One, 2007. 2(9): p. e849.
70. Cáceres, M., M. Puig, and A. Ruiz, Molecular characterization of two natural hotspots in the Drosophila buzzatii genome induced by transposon insertions. Genome research, 2001. 11.
71. Delprat, A., et al., The transposon Galileo generates natural chromosomal inversions in Drosophila by ectopic recombination. PloS One, 2009. 4.
72. Sharakhov, I.V., et al., Breakpoint structure reveals the unique origin of an interspecific chromosomal inversion (2La) in the Anopheles gambiae complex. Proceedings of the National Academy of Sciences of the United States of America, 2006. 103(16): p. 6258-6262.
73. Lobo, N.F., et al., Breakpoint structure of the Anopheles gambiae 2Rb chromosomal inversion. Malar J, 2010. 9: p. 293.
74. Feuk, L., et al., Discovery of Human Inversion Polymorphisms by Comparative Analysis of Human and Chimpanzee DNA Sequence Assemblies. PLoS Genet, 2005. 1(4): p. e56.
75. Lu, S., et al., Short Inverted Repeats Are Hotspots for Genetic Instability: Relevance to Cancer Genomes. Cell Reports, 2015. 10(10): p. 1674-1680.
76. Mathiopoulos, K.D., et al., Cloning of inversion breakpoints in the Anopheles gambiae complex traces a transposable element at the inversion junction. Proc Natl Acad Sci U S A, 1998. 95(21): p. 12444-9.
77. Wesley, C.S. and W.F. Eanes, Isolation and analysis of the breakpoint sequences of chromosome inversion In(3L)Payne in Drosophila melanogaster. Proceedings of the National Academy of Sciences, 1994. 91(8): p. 3132-3136.
78. Matzkin, L.M., et al., The structure and population genetics of the breakpoints associated with the cosmopolitan chromosomal inversion In(3R)Payne in Drosophila melanogaster. Genetics, 2005. 170(3): p. 1143-52.
79. Ranz, J.M., et al., Principles of genome evolution in the Drosophila melanogaster species group. PLoS Biology, 2007. 5.
80. Feachem, R.G.A., et al., Shrinking the malaria map: progress and prospects. Lancet, 2010. 376.
81. Cheng, C., et al., Ecological genomics of Anopheles gambiae along a latitudinal cline: a population-resequencing approach. Genetics, 2012. 190(4): p. 1417-32.
82. Rafinejad, J., et al., Effect of washing on the bioefficacy of insecticide-treated nets (ITNs) and long-lasting insecticidal nets (LLINs) against main malaria vector Anopheles stephensi by three bioassay methods. J Vector Borne Dis, 2008. 45.
83. Sharma, V.P., Current scenario of malaria in India. Parassitologia, 1999. 41. 84. Gakhar, S.K., R. Sharma, and A. Sharma, Population genetic structure of
malaria vector Anopheles stephensi Liston (Diptera: Culicidae). Indian J Exp Biol, 2013. 51.
85. Murray, C.J.L., et al., Global malaria mortality between 1980 and 2010: A systematic analysis. Lancet, 2012. 2012.
86. Alonso, P.L., et al., A research agenda to underpin malaria eradication. PLoS Med, 2011. 8.
110
87. Nolan, T., et al., piggyBac-mediated germline transformation of the malaria mosquito Anopheles stephensi using the red fluorescent protein dsRED as a selectable marker. J Biol Chem, 2002. 277.
88. O'Brochta, D.A., et al., piggyBac transposon remobilization and enhancer detection in Anopheles mosquitoes. Proceedings of the National Academy of Sciences, 2011. 108(39): p. 16339-16344.
89. Isaacs, A.T., et al., Transgenic Anopheles stephensi coexpressing single-chain antibodies resist Plasmodium falciparum development. Proc Natl Acad Sci U S A, 2012. 109.
90. Smidler, A.L., et al., Targeted mutagenesis in the malaria mosquito using TALE nucleases. PLoS One, 2013. 8.
91. Brown, A.E., et al., Stable and heritable gene silencing in the malaria vector Anopheles stephensi. Nucleic Acids Res, 2003. 31.
92. Dong, Y., et al., Engineered anopheles immunity to Plasmodium infection. PLoS Pathog, 2011. 7.
93. Garver, L.S., Y. Dong, and G. Dimopoulos, Caspar controls resistance to plasmodium falciparum in diverse anopheline species. PLoS Pathog, 2009. 5.
94. Luckhart, S., et al., Sustained activation of Akt elicits mitochondrial dysfunction to block Plasmodium falciparum infection in the mosquito host. PLoS Pathog, 2013. 9.
95. Mitri, C., et al., Density-dependent impact of the human malaria parasite Plasmodium falciparum gametocyte sex ratio on mosquito infection rates. Proc Roy Soc Lond B Biol Sci, 2009. 276.
96. Pakpour, N., et al., Ingested human insulin inhibits the mosquito NF-κB-dependent immune response to Plasmodium falciparum. Infect Immun, 2012. 80.
97. Rai, K.S. and W.C. Black Iv, Mosquito Genomes: Structure, Organization, and Evolution. Advances in Genetics, 1999. 41: p. 1-33.
98. Marinotti, O., et al., The genome of Anopheles darlingi, the main neotropical malaria vector. Nucleic Acids Res, 2013. 41.
99. Zhou, D., et al., Genome sequence of Anopheles sinensis provides insight into genetics basis of mosquito competence for malaria parasites. BMC Genomics, 2014. 15.
100. Criscione, F., et al., A unique Y gene in the Asian malaria mosquito Anopheles stephensi encodes a small lysine-rich protein and is transcribed at the onset of embryonic development. Insect Mol Biol, 2013. 22.
101. Göpfert, M.C. and D. Robert, Active auditory mechanics in mosquitoes. Proc Roy Soc Lond B Biol Sci, 2001. 268.
102. Gibson, G., B. Warren, and I.J. Russell, Humming in tune: sex and species recognition by mosquitoes on the wing. J Assoc Res Otolaryngol, 2010. 11.
103. Xi, Z., J.L. Ramirez, and G. Dimopoulos, The Aedes aegypti toll pathway controls dengue virus infection. PLoS Pathog, 2008. 4.
104. Price, I., et al., In vivo, in vitro, and in silico studies suggest a conserved immune module that regulates malaria parasite transmission from mammals to mosquitoes. J Theor Biol, 2013. 334.
105. Horton, A.A., et al., The mitogen-activated protein kinome from Anopheles gambiae: identification, phylogeny and functional characterization of the ERK, JNK and p38 MAP kinases. BMC Genomics, 2011. 12.
106. Riehle, M.M., et al., Anopheles gambiae APL1 is a family of variable LRR proteins required for Rel1-mediated protection from themalaria parasite, Plasmodium berghei. PLoS ONE, 2008. 3.
107. Baker, D.A., et al., A comprehensive gene expression atlas of sex- and tissue-specificity in the malaria vector. Anopheles gambiae BMC Genomics, 2011. 12.
111
108. Choi, J., et al., Structure of the FKBP12-rapamycin complex interacting with the binding domain of human FRAP. Science (New York, NY), 1996. 273.
109. Laplante, M. and D.M. Sabatini, mTOR signaling in growth control and disease. Cell, 2012. 149.
110. Grewal, S.S., Insulin/TOR signaling in growth and homeostasis: A view from the fly world. Int J Biochem Cell Biol, 2009. 41.
111. Arsic, D. and P.M. Guerin, Nutrient content of diet affects the signaling activity of the insulin/target of rapamycin/p70 S6 kinase pathway in the African malaria mosquito Anopheles gambiae. J Insect Physiol, 2008. 54.
112. Anderson, K.V., L. Bokla, and C. Nüsslein-Volhard, Establishment of dorsal-ventral polarity in the Drosophila embryo: the induction of polarity by the Toll gene product. Cell, 1985. 42.
113. Valenzuela, J.G., et al., Exploring the salivary gland transcriptome and proteome of the Anopheles stephensi mosquito. Insect Biochem Mol Biol, 2003. 33.
114. Ribeiro, J.M.C., B.J. Mans, and B. Arcà, An insight into the sialome of blood-feeding Nematocera. Insect Biochem Mol Biol, 2010. 40.
115. Mahmood, F. and R.K. Sakai, Inversion polymorphisms in natural populations of Anopheles stephensi. Can J Genet Cytol, 1984. 26(5): p. 538-46.
116. Hoffmann, A.A., C.M. Sgrò, and A.R. Weeks, Chromosomal inversion polymorphisms and adaptation. Trends Ecol Evol, 2004. 19.
117. Baricheva, E.A., et al., DNA from Drosophila melanogaster β-heterochromatin binds specifically to nuclear lamins in vitro and the nuclear envelope in situ. Gene, 1996. 171.
118. Dechat, T., et al., Nuclear lamins: major factors in the structural organization and function of the nucleus and chromatin. Genes Dev, 2008. 22.
119. Baker, R.H. and R.K. Sakai, Triploids and male determination in the mosquito, Anopheles culicifacies. J Hered, 1979. 70.
120. Hall, A.B., et al., Six novel Y chromosome genes in Anopheles mosquitoes discovered by independently sequencing males and females. BMC Genomics, 2013. 14.
121. Chin, C.S., et al., Nonhybrid, finished microbial genome assemblies from long-read SMRT sequencing data. Nat Methods, 2013. 10.
122. Tesler, G., GRIMM: genome rearrangements web server. Bioinformatics, 2002. 18(3): p. 492-3.
123. Lin, Y.C., et al., SPRING: a tool for the analysis of genome rearrangement using reversals and block-interchanges. Nucleic Acids Res, 2006. 34(Web Server issue): p. W696-9.
124. Sharakhova, M., et al., Genome mapping and characterization of the Anopheles gambiae heterochromatin. BMC Genomics, 2010. 11(1): p. 459.
125. Sharakhov, I.V., et al., Inversions and gene order shuffling in Anopheles gambiae and A. funestus. Science, 2002. 298(5591): p. 182-5.
126. Schaeffer, S.W., et al., Polytene chromosomal maps of 11 Drosophila species: the order of genomic scaffolds inferred from genetic and physical maps. Genetics, 2008. 179.
127. Ranz, J.M., et al., Principles of genome evolution in the Drosophila melanogaster species group. PLoS Biol, 2007. 5.
128. Ranz, J.M., F. Casals, and A. Ruiz, How malleable is the eukaryotic genome? Extreme rate of chromosomal rearrangement in the genus Drosophila. Genome Res, 2001. 11(2): p. 230-239.
129. Peng, Q., P.A. Pevzner, and G. Tesler, The fragile breakage versus random breakage models of chromosome evolution. PLoS Comput Biol, 2006. 2.
130. Chaisson, M.J., B.J. Raphael, and P.A. Pevzner, Microinversions in mammalian evolution. Proc Natl Acad Sci U S A, 2006. 103.
112
131. Bourque, G. and P.A. Pevzner, Genome-scale evolution: reconstructing gene orders in the ancestral species. Genome Res, 2002. 12(1): p. 26-36.
132. Wurm, Y., et al., The genome of the fire ant Solenopsis invicta. Proc Natl Acad Sci U S A, 2011. 108.
133. Kumar, S. and M.L. Blaxter, Comparing de novo assemblers for 454 transcriptome data. BMC Genomics, 2010. 11.
134. Denisov, G., et al., Consensus generation and variant detection by Celera Assembler. Bioinformatics, 2008. 24.
135. English, A.C., et al., Mind the gap: upgrading genomes with Pacific Biosciences RS long-read sequencing technology. PLoS One, 2012. 7.
136. Pop, M., D.S. Kosack, and S.L. Salzberg, Hierarchical scaffolding with Bambus. Genome Res, 2004. 14.
137. Kurtz, S., et al., Versatile and open software for comparing large genomes. Genome Biol, 2004. 5.
138. Parra, G., K. Bradnam, and I. Korf, CEGMA: a pipeline to accurately annotate core genes in eukaryotic genomes. Bioinformatics, 2007. 23.
139. Wu, T.D. and C.K. Watanabe, GMAP: a genomic mapping and alignment program for mRNA and EST sequences. Bioinformatics, 2005. 21.
140. Sharakhova, M.V., et al., Genome mapping and characterization of the Anopheles gambiae heterochromatin. BMC Genomics, 2010. 11.
141. Cantarel, B.L., et al., MAKER: an easy-to-use annotation pipeline designed for emerging model organism genomes. Genome Res, 2008. 18.
142. Tempel, S., Using and understanding RepeatMasker. Methods Mol Biol, 2012. 859.
143. Korf, I., Gene finding in novel genomes. BMC Bioinformatics, 2004. 5. 144. Stanke, M., et al., AUGUSTUS: a web server for gene finding in eukaryotes.
Nucleic Acids Res, 2004. 32. 145. Waterhouse, R.M., et al., OrthoDB: a hierarchical catalog of animal, fungal
and bacterial orthologs. Nucleic Acids Res, 2013. 41. 146. Trapnell, C., L. Pachter, and S.L. Salzberg, TopHat: discovering splice
junctions with RNA-Seq. Bioinformatics, 2009. 25. 147. Anders, S., P.T. Pyl, and W. Huber, HTSeq - A Python framework to work
with high-throughput sequencing data. Bioinformatics, 2014. 148. Si, Y., et al., Model-based clustering for RNA-seq data. Bioinformatics, 2014.
30. 149. Love, M.I., W. Huber, and S. Anders, Moderated estimation of fold change
and dispersion for RNA-Seq data with DESeq2. 2014. 150. Wickham, H., ggplot2. Wiley Interdiscipl Rev Comput Stat, 2011. 3. 151. Conesa, A., et al., Blast2GO: a universal tool for annotation, visualization and
analysis in functional genomics research. Bioinformatics, 2005. 21. 152. Quevillon, E., et al., InterProScan: protein domains identifier. Nucleic Acids
Res, 2005. 33. 153. Falcon, S. and R. Gentleman, Using GOstats to test gene lists for GO term
association. Bioinformatics, 2007. 23. 154. Lowe, T.M. and S.R. Eddy, tRNAscan-SE: a program for improved detection
of transfer RNA genes in genomic sequence. Nucleic Acids Res, 1997. 25. 155. Nawrocki, E.P., D.L. Kolbe, and S.R. Eddy, Infernal 1.0: inference of RNA
alignments. Bioinformatics, 2009. 25. 156. Griffiths-Jones, S., et al., Rfam: an RNA family database. Nucleic Acids Res,
2003. 31. 157. Nene, V., et al., Genome sequence of Aedes aegypti, a major arbovirus
vector. Science, 2007. 316. 158. Benson, G., Tandem repeats finder: a program to analyze DNA sequences.
Nucleic Acids Res, 1999. 27(2): p. 573-80.
113
159. van Hoof, A., et al., Exosome-mediated recognition and degradation of mRNAs lacking a termination codon. Science, 2002. 295(5563): p. 2262-4.
160. Sinka, M.E., et al., The dominant Anopheles vectors of human malaria in the Americas: occurrence data, distribution maps and bionomic précis. Parasites & Vectors, 2010. 3(1): p. 1-26.
161. Arredondo-Jimenez, J.I., et al., Tests for the existence of genetic determination or conditioning in host selection by Anopheles albimanus (Diptera: Culicidae). J Med Entomol, 1992. 29(5): p. 894-7.
162. Narang, S.K., J.A. Seawright, and M.F. Suarez, Genetic structure of natural populations of Anopheles albimanus in Colombia. J Am Mosq Control Assoc, 1991. 7(3): p. 437-45.
163. Narang, S.K. and J.A. Seawright, Linkage map of the mosquito (Anopheles albimanus) (2n=6), in Genetic maps, locus maps of complex genomes, S.J. O'Brein, Editor. 1989, Cold Spring Harbor Laboratory Press: New York. p. 3269-3272.
164. Hobbs, J.H., Cytogenetics of Anopheles albimanus (Diptera:Culicidae). Ann Entomol Soc Am, 1962. 55: p. 245-251.
165. Keppler, W.J., J.B. Kitzmiller, and M.G. Rabbani, The salivary gland chromosomes of Anopheles albimanus. J Am Mosq Control Assoc, 1973. 33: p. 42-49.
166. Narang, S.K. and J.A. Seawright, In situ hybridization mapping of histone genes in Anopheles albimanus. J Am Mosq Control Assoc, 1993. 9(2): p. 147-9.
167. Zheng, L., et al., Low-resolution genome map of the malaria mosquito Anopheles gambiae. Proc Natl Acad Sci U S A, 1991. 88(24): p. 11187-91.
168. della Torre, A., et al., Physical map of the malaria vector Anopheles gambiae. Genetics, 1996. 143(3): p. 1307-11.
169. Sharakhova, M.V., et al., A physical map for an Asian malaria mosquito, Anopheles stephensi. Am J Trop Med Hyg, 2010. 83(5): p. 1023-7.
170. Neafsey, D.E., et al., The evolution of the Anopheles 16 genomes project. G3 (Bethesda), 2013. 3(7): p. 1191-4.
171. Schatz, M.C., A.L. Delcher, and S.L. Salzberg, Assembly of large genomes using second-generation sequencing. Genome Res, 2010. 20(9): p. 1165-73.
172. Henson, J., G. Tischler, and Z. Ning, Next-generation sequencing and large genome assemblies. Pharmacogenomics, 2012. 13(8): p. 901-15.
173. Simpson, J.T. and M. Pop, The Theory and Practice of Genome Sequence Assembly. Annu Rev Genomics Hum Genet, 2015. 16: p. 153-72.
174. Gabrieli, P., A. Smidler, and F. Catteruccia, Engineering the control of mosquito-borne infectious diseases. Genome Biology, 2014. 15(11): p. 1-9.
175. Mlakar, J., et al., Zika Virus Associated with Microcephaly. New England Journal of Medicine, 2016. 374(10): p. 951-958.
176. Liu, N., Insecticide Resistance in Mosquitoes: Impact, Mechanisms, and Research Directions. Annual Review of Entomology, 2015. 60(1): p. 537-559.
177. Russell, T.L., et al., Increased proportions of outdoor feeding among residual malaria vector populations following increased use of insecticide-treated nets in rural Tanzania. Malar J, 2011. 10.
178. Sougoufara, S., et al., Biting by Anopheles funestus in broad daylight after use of long-lasting insecticidal nets: a new challenge to malaria elimination. Malar J, 2014. 13.
179. Zdobnov, E.M., et al., Comparative Genome and Proteome Analysis of Anopheles gambiae and Drosophila melanogaster. Science, 2002. 298(5591): p. 149-159.
180. Kamali, M., et al., Multigene Phylogenetics Reveals Temporal Diversification of Major African Malaria Vectors. PLoS One, 2014. 9(4): p. e93580.
114
181. Guillén, Y. and A. Ruiz, Gene alterations at Drosophila inversion breakpoints provide prima facie evidence for natural selection as an explanation for rapid chromosomal evolution. BMC Genomics, 2012. 13(1): p. 1-18.
182. Aganezov, S., N. Sitdykova, and M.A. Alekseyev, Scaffold assembly based on genome rearrangement analysis. Comput Biol Chem, 2015. 57: p. 46-53.
183. Jiang, X., et al., Genome analysis of a major urban malaria vector mosquito, Anopheles stephensi. Genome Biology.
184. Johnson, N.A., The genetics of sex chromosomes: evolution and implications for hybrid incompatibility. 2012. 1256: p. E1-22.
185. Cattani, M.V. and D.C. Presgraves, Incompatibility Between X Chromosome Factor and Pericentric Heterochromatic Region Causes Lethality in Hybrids Between Drosophila melanogaster and Its Sibling Species. Genetics, 2012. 191(2): p. 549-59.
186. Crawford, J.E., et al., Reticulate Speciation and Barriers to Introgression in the Anopheles gambiae Species Complex. Genome Biology and Evolution, 2015. 7(11): p. 3116-3131.
187. Krzywinski, J., et al., Isolation and Characterization of Y Chromosome Sequences From the African Malaria Mosquito Anopheles gambiae. Genetics, 2004. 166(3): p. 1291-1302.
188. Hall, A.B., et al., Radical remodeling of the Y chromosome in a recent radiation of malaria mosquitoes. Proceedings of the National Academy of Sciences, 2016.
189. Sakai, R.K., et al., Crossing-over in the long arm of the X and Y chromosomes in Anopheles culicifacies. Chromosoma. 74(2): p. 209-218.
190. Fraccaro, M., et al., Karyotype, DNA replication and origin of sex chromosomes in Anopheles atroparvus. Chromosoma. 55(1): p. 27-36.
191. Goidts, V., et al., Segmental duplication associated with the human-specific inversion of chromosome 18: a further example of the impact of segmental duplications on karyotype and genome evolution in primates. Hum Genet, 2004. 115(2): p. 116-22.
192. Bailey, J.A. and E.E. Eichler, Primate segmental duplications: crucibles of evolution, diversity and disease. Nat Rev Genet, 2006. 7(7): p. 552-564.
193. Calvete, O., et al., Segmental duplication, microinversion, and gene loss associated with a complex inversion breakpoint region in Drosophila. Mol Biol Evol, 2012. 29(7): p. 1875-1889.
194. Di Rienzi, S.C., et al., Fragile Genomic Sites Are Associated with Origins of Replication. Genome Biology and Evolution, 2009. 1: p. 350-363.
195. Kirkpatrick, M., How and why chromosome inversions evolve. PLoS Biology, 2010. 8.
196. Naseeb, S., et al., Widespread Impact of Chromosomal Inversions on Gene Expression Uncovers Robustness via Phenotypic Buffering. Molecular Biology and Evolution, 2016.
197. de Jong, S., et al., Common inversion polymorphism at 17q21.31 affects expression of multiple genes in tissue-specific manner. BMC Genomics, 2012. 13(1): p. 1-6.
198. Lee, Y., et al., Chromosome Inversions, Genomic Differentiation and Speciation in the African Malaria Mosquito Anopheles gambiae. PLoS One, 2013. 8(3).
199. Woolfe, A., et al., Highly conserved non-coding sequences are associated with vertebrate development. PLoS Biol, 2005. 3(1): p. e7.


![The Dominant Mosquito Vectors of Human Malaria in India...species [1]. In the Southeast Asian region, India alone contributes to nearly 80% of malaria cases with the largest population](https://static.fdocuments.us/doc/165x107/6015889ad2216001204c1673/the-dominant-mosquito-vectors-of-human-malaria-in-india-species-1-in-the.jpg)