Cholla T809 Condition Assessment...
20
Cholla T809 Condition Assessment Report Provided by students of Northern Arizona University with the support of Arizona Public Service Andrew Morin, Richard Barnes, Kyle Wiedeman, Scott Lederhos, Kenneth Elgin 5/2/2013 We stipulate that APS is to take these results along with our conclusion about Unit 2’s transformer as only academic recommendations.
Transcript of Cholla T809 Condition Assessment...

Cholla T809 Condition Assessment Report
Provided by students of Northern Arizona University with the support of Arizona Public Service
Andrew Morin, Richard Barnes, Kyle Wiedeman, Scott Lederhos, Kenneth Elgin
5/2/2013
We stipulate that APS is to take these results along with our conclusion about Unit 2’s transformer as only academic recommendations.

1
Contents Research ................................................................................................................................................. 3
Why do Transformers fail? ................................................................................................................... 3
Insulation......................................................................................................................................... 3
Design ............................................................................................................................................. 3
Lightning .......................................................................................................................................... 3
Overloading ..................................................................................................................................... 4
What tests can be used to assess the condition of a transformer? ....................................................... 4
Dissolved Gas-in-Oil Analysis ............................................................................................................ 4
Water Content Test ......................................................................................................................... 4
Dielectric Strength Test .................................................................................................................... 4
Acidity Number ................................................................................................................................ 5
Furaldehyde Test ............................................................................................................................. 5
Turns Ratio Test ............................................................................................................................... 5
Winding Resistance Test .................................................................................................................. 5
Excitation Current Test .................................................................................................................... 5
Frequency Response Analysis Test ................................................................................................... 5
Power Factor Test ............................................................................................................................ 6
References .......................................................................................................................................... 7
Testing .................................................................................................................................................... 8
Testing- Prior to Spring 2013 Outage ................................................................................................... 8
Dissolved Gas Analysis ..................................................................................................................... 8
Key Gases ........................................................................................................................................ 8
Dornenburg’s Ratio ........................................................................................................................ 10
Rogers Ratio .................................................................................................................................. 10
Duval’s Triangle ............................................................................................................................. 11
Water Content Analysis ................................................................................................................. 12
Dissolved Gas Analysis - Oxygen ..................................................................................................... 14
Hot Spot Analysis ........................................................................................................................... 15

2
Preliminary Conclusion ...................................................................................................................... 16
Testing – During Outage .................................................................................................................... 16
Overall Power Factor ..................................................................................................................... 16
Bushing C1 Power Factor ............................................................................................................... 17
Bushing C2 Power Factor ............................................................................................................... 17
Turns Ratio Test ............................................................................................................................. 18
Degree of Polymerization............................................................................................................... 18
Testing – After Outage ....................................................................................................................... 19
Dissolved Gas Analysis (DGA) ......................................................................................................... 19
Closing Remarks .................................................................................................................................... 19
3
Research
Why do Transformers fail?
Insulation
In the research conducted by the team we found common causes for transformers to fail. Insulation failures were the main cause of transformer failures in a study done by the Hartford Steam Boiler Inspection & Insurance Company [1]. There are four main reasons as to why insulation fails: moisture, acidity, heat, and oxidation [1]. As insulation ages it will naturally slowly breakdown [2]. Localized hotspots in a transformer will increase the premature aging of the insulation [2]. Overloading and a degraded cooling system will cause severe aging of the winding insulation. This type of failure is a typical end of life failure [2]. If a transformer is running abnormally hot and/or puts out less than normal voltage you can assume winding insulation failure causing windings to be shorted together [2].
Design
Design, materials, and workmanship are the second leading cause of transformer failure according to the Hartford Steam Boiler Inspection & Insurance Company [1]. This type of failure includes situations like loose or unsupported leads, inadequate core insulation, poor brazing, loose blocking, improper connection of dislike metals, and improper tightening of bolted connections [1]. Loose clamping can result in arcing/sparking discharges which produce fine carbon contaminants everywhere, particularly on the top frame surface [2]. Also, loose clamping can cause the coil assembly to relax which can cause discharges and fine carbon contaminants inside the windings [2]. Oil contamination is also one of the top reasons for transformer failure [1]. The oil can get contaminated in storage, transportation, and while in the transformer [3]. Transformer oil mainly gets contaminated while in use inside the transformer. Paper insulation can dissolve in the transformer from electrical and thermal stresses [3]. The electric fields inside a transformer can cause conducting contaminants to move towards high field intensity, and develop a bridge [3]. This bridge can cause arcing, and a hotspot further breaking down the oil [3].
Lightning
An investigation into failures claims that 17.32% of transformers fail because of lightning strikes [4]. These lightning strikes can produce extreme voltages that transformers cannot handle. In fact, the voltages can approach close to a million volts [5]. The impulse created by lightning causes large magnitude traveling waves that causes serious harm to the electrical and mechanical integrity of the transformer [6]. These failures could be a high magnitude overvoltage, a nonlinear distribution along the winding, which could make a high voltage between turns, or resonance/partial-resonance in the high voltage winding if they coincide with the excitation frequencies [7]. If the surge from the strike appears at the terminals “The transformer main insulation (the insulation between HV winding and LV winding, HV winding and core, or HV windings) will be threatened because of the large magnitude of the lightning surge. On the other hand, the insulation between turns at the beginning of the HV winding is often disproportionally more stressed because of the large potential gradient appearing in the initial voltage distribution. Similar to switching over voltages and very fast transients, it is possible that lightning overvoltage may excite partial winding resonance in the transformer windings. The distance between the arrester and the transformer will determine the overvoltage magnitude at the transformer HV terminals [7].” Line-surges and external short circuits can cause the same type of damage as lightning strikes. Some companies have even started
4
to categorize these surge types more than lighting strikes, because the strike was not “confirmed” even though it may have been suspected [1].
Overloading
An overload is when a transformer’s load exceeds its rated capacity. Overloading also causes a transformer to fail and will significantly reduce the transformers life-cycle [8]. Overloading also increases the deterioration of the transformer’s insulation [8]. When determining overload practices, the top-oil temperatures should not be the sole guide used, because there are major differences between this temperature and the temperature of hot-spots within the transformer [8]. “The hottest-spot winding temperature is the principal factor in determining life due to loading. The temperature cannot be measured directly because of the hazards in placing a temperature detector at the proper location because of voltage. Standard allowances have, therefore, been obtained from tests made in the laboratory. The hottest-spot copper temperature is the sum of the temperature of the cooling medium, the average temperature rise of the copper, and the hottest-spot allowance. The hottest-spot allowance at rated load is 10 °C for transformers with 55 °C average winding temperature rise by resistance and 15 °C for transformers with 65 °C average winding temperature rise by resistance [8].“ Overload has been said to account for 2% of transformer failures [6].
What tests can be used to assess the condition of a transformer? There are numerous tests that can be done to assess the health of a transformer. The majority of the oil tests can be done while the transformer is online by taking a non-invasive oil sample. Other electrical tests have to be done while the transformer is not in service.
Dissolved Gas-in-Oil Analysis
The Dissolved Gas Analysis test analyses oil samples from a transformer and helps predict which components that could be faulty. The different types of gases and the amount of those gases in the oil sample indicate any irregular behavior that is happening in the transformer. The gases are vacuumed from tightly-sealed containers that obtain small oil samples from transformers [9].
Water Content Test
The Water Content Test gives a reading for how much water, in parts per million, is in the liquid insulating material (commonly mineral oil) inside the transformer. This test is important due to the negative effect that water has on the dielectric material when is inside a transformer. A high water content in the insulating material will lower its dielectric breakdown voltage. This can cause critical failure in the transformer when the transformer’s voltage overcomes the lower dielectric breakdown voltage [9].
Dielectric Strength Test
The oil in a transformer is meant to insulate electrical material from discharging or arcing due to the high voltage coming into the transformer. The dielectric strength of an insulating material is a measure of the material’s ability to withstand electrical stress without failing. This test passes an electric current across a gap and records the voltage at which an arc occurs and when the dielectric

5
strength breaks down [10]. This measurement is compared to the original dielectric strength and the condition of the transformer is predicted from that comparison.
Acidity Number
For oil analysis, testing the acidity of the oil can find problems with the insulation of the transformer. Acids inside the transformer can come from overheating the oil which causes decomposition and oxidation. Acids also come from moisture due to poor insulation. A high acidity level in the oil is an indication of the rate of deterioration of the oil. Sludge is an inevitable by-product of an acid situation so it is neglected [11].
Furaldehyde Test
In transformers, their solid insulation material is made of paper to help separate wires and prevent arcing. Furaldehyde are chemicals that are created when the cellulose paper inside the transformer degrades due to overheating [10]. These Furaldehyde chemicals that are found in the liquid insulation material of the transformer can give an indication of the status of the solid insulation and give a prediction of the health of the transformer.
Turns Ratio Test
A Turns Ratio Test is a common test for a transformer. The basic procedure is to apply a voltage to the input of the transformer and measure the resulting voltage on the output. The ratio of the two voltages is then compared to the ratio on the transformers nameplate. A deviation of more than 0.5% suggests that there is a turn to turn fault within the transformer [12]. This test is an effective tool for understanding the health of the transformers winding insulation.
Winding Resistance Test
The winding resistance test is an effective way to measure for opens or severely damaged windings. The tap changers of a transformer also affect the resistance measured and could be tested during this procedure [13]. The winding resistance of each phase is compared to each other; a deviation less than 1% is acceptable. Also, these resistances should be checked against past Winding Resistance test results, if applicable.
Excitation Current Test
An Excitation Current Test is a way to detect damage to the transformers core and/or its windings. The procedure is to apply a voltage to each HV winding and measure the resulting current. The applied voltage is normally no more than 10% of the rated voltage of that winding [6]. The results of the two phases on the outside should be within 15% of each other. The center phase has a lower magnetic reluctance, which results in a lower excitation current [6].
Frequency Response Analysis Test
The frequency response analysis test is used to determine movement of the transformers core, windings, or other mechanical faults. The basic idea of this test is to see how the transformer transmits a low voltage signal that changes in frequency [14]. By plotting the swept frequency vs. amplitude (dB) a fault is shown when the graph of one phase varies significantly from the other two.

6
Power Factor Test
The power factor test is an effective method of testing the strength of the transformers insulation before a fault occurs. The test is done by taking the ratio of the capacitive current and the resistive current, known as the Power Factor [15]. Ambient temperature and relative humidity are taken into account while performing this test. There are tables which are used to compensate for these external factors. A PF less than 1% is expected for a transformer in good condition [6].

7
References [1] W. H. Bartley. “An Analysis of Transformer Failures, Part 2 – Causes, Prevention and Maximum
Service Life,” Internet : http://www.hsb.com/TheLocomotive/uploadedFiles/ArticleLibrary/An%20Analysis%20of%20Transformer%20Failures,%20Part%202.pdf, 2011 [Oct 26 2012]
[2] H. Ding, R. Heywood, J. Lapworth, S. Ryder. "Why Transformers Fail," Doble Power Test Ltd.,
Guildford, U.K., 2009 [3] G. Chen, M. H. Zuber. "Pre-breakdown Characteristics of Contaminated Power Transformer Oil,"
University of Southampton, Southampton, U.K., [4] W. H. Bartley. “Investigating Transformer Failures,” Internet: http://www.weidmann-
solutions.cn/huiyi/Seminar%202006%20New%20Mexico/2006bartleypaperyes.pdf, 2006 [Oct 26 2012]
[5] HD Supply Untilities. “Transformer Basics.” Internet: http://www.feca.com/HDS_BASIC.pdf, June 11,
2009 [Oct 26 2012] [6] W.H, Bartley. ”Failure Analysis of Transformers.” Internet:
http://www.imia.com/downloads/external_papers/EP09_2003.pdf, September 2009 [Oct 26 2012] [7] Xuzhu Dong. “Study of Power Transformer Abnormalities and IT Applications in Power Systems,”
Doctoral dissertation, Virginia Polytechnic Institute, USA, 2002 [8] Facilities Engineering Branch. “PERMISSIBLE LOADING OF OIL-IMMERSED TRANSFORMERS AND
REGULATORS.” Denver, Colorado. Internet http://www.usbr.gov/power/data/fist/fist1_5/vol1-5.pdf [Oct 29 2012]
[9] R. Turcotte. “Trans former Oil Testing,” Internet:
http://www.hsb.com/TheLocomotive/uploadedFiles/ArticleLibrary/Transformer%20Oil%20Testing.pdf [Oct 23 2012]
[10] I.A.R. Gray. “A Guide to Transformer Analysis,” Internet:
http://www.satcs.co.za/Transformer_Oil_Analysis.pdf [Oct 29 2012] [11] I.A.R. Gray. “Evaluation of Transformer Solid Insulation,” Internet:
http://www.satcs.co.za/Evaluation_of_Transformer_Solid_Insulation-rev2.pdf [Oct 29 2012] [12] Jeff Jowett Megger. “Transformer Turn Ratio Testing,” Internet:
http://www.netaworld.org/files/neta-journals/NWwtr05JowettFeature.pdf, Nov 12, 2005 [Oct 23 2012]
[13] “Winding Resistance Testing,” Internet: http://www.irispower.com/PDF/WRT-100_english.PDF [Oct
25 2012] [14] Charles Sweetser. Dr Tony McGrail. “Sweep Frequency Response Analysis Transformer Applications”
[Oct 27 2012] [15] “Power Factor testing,” Internet:
http://www.documentation.emersonprocess.com/groups/public_assetoptprodlit/documents/articles_articlesreprints/ershvm_allar0807e_03-yt-08.pdf [Oct 26 2012]

8
Testing
Testing- Prior to Spring 2013 Outage
Dissolved Gas Analysis
For the analysis of the dissolved gasses that are in the transformer oil we used four different methods that we have found to be useful during our research. The four methods of dissolved gas analysis are Key Gases, Dornenburg’s Ratio, Rogers Ratio, and Duval’s Triangle. All of these tools, expect for Duval’s Triangle, are thoroughly discussed in the IEEE Guide for the Interpretation of Gases Generated in Oil-Immersed Transformers. The downside to these techniques is that don’t tell you about whether a fault is active of if it only occurred in the past. Due to inaccuracies, none of these methods should be used alone for interpretation of dissolved gas. However, using the results from all four techniques during analysis can be useful in predicting what type of faults may have occurred inside of a transformer. We have been and will continue to analyze the dozens of gas samples which has been provided to us by APS. Using each of these four techniques on all of our data would be a time consuming and daunting task. To help us with this issue we have programmed these analysis tools into excel. This enables us to paste the gas data into a spreadsheet and the results from each technique are then automatically generated. This is a useful tool for us to analyze our current data. In addition, APS will also be able to use this for studying future gas samples.
Key Gases
The Key Gases technique evaluates the relative proportions of Carbon Monoxide, Hydrogen, Methane, Ethane, Ethylene, and Acetylene. This method is helpful in interpreting the general type of fault which may be located in the transformer. The premise is that certain gases will only form under specific operating conditions of the transformer. Tables 1 through 4 are used for the key gases analysis.
Table 1 Overheated Oil

9
Table 2 Overheated Cellulose
Table 3 Partial Discharge in Oil
Table 4
Arching in Oil

10
Dornenburg’s Ratio
Two of the tools we used for dissolved gas analysis compare ratios of the key gases described earlier. Dornenburg Ratio is not often used because it requires high concentration of gases to be present in order for the analysis to be considered valid. This being said, if the gas concentrations are great enough then Dornenburg Ratio analysis can be an effective tool.
Table 5 Dornenburg Ratios for Key Gases
Rogers Ratio
Roger’s ratio is similar to Dornenburg’s ratio because it not only looks at the ratio of key gases found but also requires a minimum concentration for the gas sample to provide credible results. However, this tool has been used for thousands of transformers and has provided credible results.
Table 7 Roger’s Ratios for Key Gases
*There will be a tendency for the ratios R2 and R5 to increase to a ratio above 3 as the discharge develops in intensity

11
Duval’s Triangle
The Duval Triangle dissolved gas analysis tool has also been proven to be helpful in interpreting possible faults within a transformer. It uses the proportions of the three key gases Acetylene, Ethylene, and Methane to determine what type of fault may have occurred in the transformer. Duval’s Triangle should be used with caution because it will always say that there is some kind of fault in the transformer even if it is operating normally. In most cases, this tool is used after a fault has been determined by some other method to verify the results. The benefit of this tool is that it will not only determine the type of fault but also the severity.
Figure 4
Duval Triangle

12
Below is a DGA sample taken on October 10 24th, 2012. During this time period two of the four oil
pumps were inactive causing improper circulation for cooling the mineral oil. All four DGA methods
indicate overheating of the oil which in likely due to the inactive pumps.
Ethylene 218.9954
Doernenburg ratio: Thermal Fault
Hydrogen 52.1718
Methane 107.0636
Rogers ratio: Thermal Fault<700°C
Ethane 137.2955
Acetylene 0.2361
Duval Triangle: Thermal Fault>700°C
CO 31.5989
TDCG 547.3613
Key Gas: Thermal - Oil
Water Content Analysis
Analyzing the data received from APS, we can infer some of the problems the transformer has gone through in the past. One of the test results that will be looked at will be the results from the water content test. The water content test detects the moisture content in parts per million (ppm) of the liquid insulation.
Figure 5
Dissolved Gas Analysis Data Received from APS
13
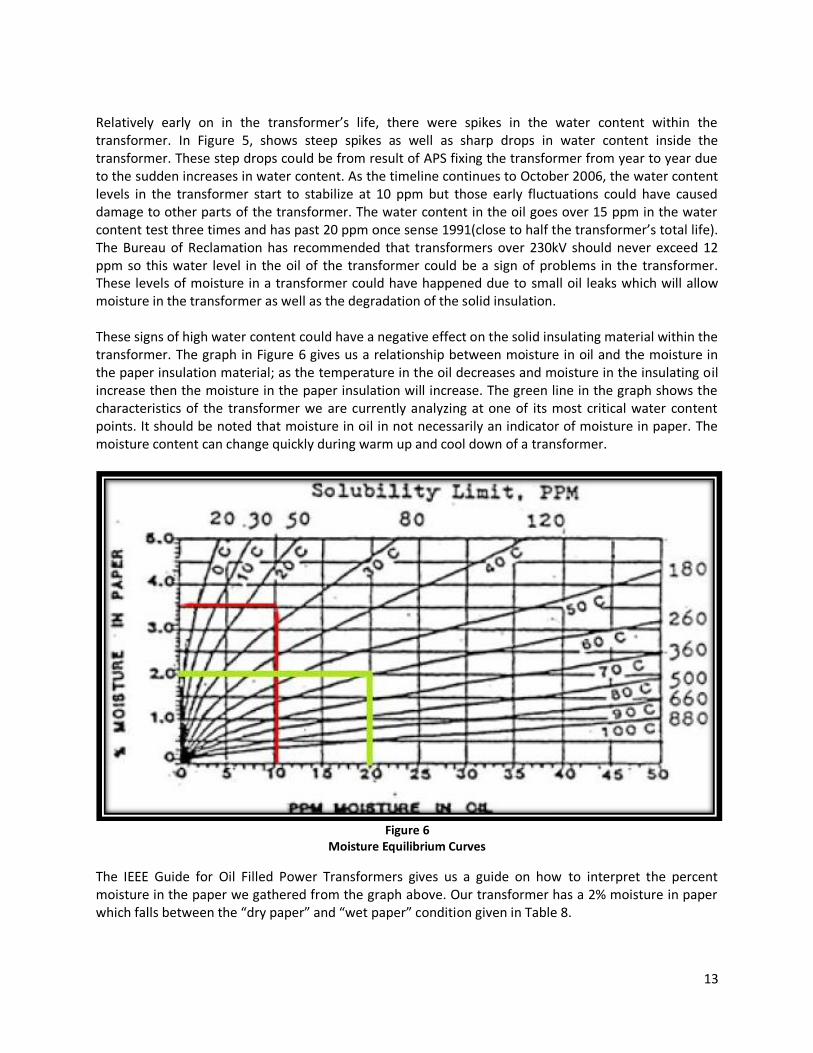
Relatively early on in the transformer’s life, there were spikes in the water content within the transformer. In Figure 5, shows steep spikes as well as sharp drops in water content inside the transformer. These step drops could be from result of APS fixing the transformer from year to year due to the sudden increases in water content. As the timeline continues to October 2006, the water content levels in the transformer start to stabilize at 10 ppm but those early fluctuations could have caused damage to other parts of the transformer. The water content in the oil goes over 15 ppm in the water content test three times and has past 20 ppm once sense 1991(close to half the transformer’s total life). The Bureau of Reclamation has recommended that transformers over 230kV should never exceed 12 ppm so this water level in the oil of the transformer could be a sign of problems in the transformer. These levels of moisture in a transformer could have happened due to small oil leaks which will allow moisture in the transformer as well as the degradation of the solid insulation. These signs of high water content could have a negative effect on the solid insulating material within the transformer. The graph in Figure 6 gives us a relationship between moisture in oil and the moisture in the paper insulation material; as the temperature in the oil decreases and moisture in the insulating oil increase then the moisture in the paper insulation will increase. The green line in the graph shows the characteristics of the transformer we are currently analyzing at one of its most critical water content points. It should be noted that moisture in oil in not necessarily an indicator of moisture in paper. The moisture content can change quickly during warm up and cool down of a transformer.
Figure 6
Moisture Equilibrium Curves
The IEEE Guide for Oil Filled Power Transformers gives us a guide on how to interpret the percent moisture in the paper we gathered from the graph above. Our transformer has a 2% moisture in paper which falls between the “dry paper” and “wet paper” condition given in Table 8.

14
Table 8 Guidelines for interpretation of % moisture by dry weight of paper [18]
% Moisture by dry weight in paper Condition
0-2 Dry paper
2-4 Wet paper
>4.5 Excessively wet paper
Dissolved Gas Analysis - Oxygen
It is critical for life extension to keep transformers as dry and as free of oxygen as possible. Cellulose degrades much faster than oil because it contains oxygen within its molecular structure. The degradation process generates water, carbon dioxide and furfurals, and is accelerated by external sources of oxygen, high temperature and high levels of oil acidity. The dissolved gas analysis data we received from APS in Figure 7 shows that there was a spike of oxygen close to two years ago. This spike of oxygen does not help the life of the transformer but stands as an incident that would reduce the life of the transformer. The rise in oxygen could signal more water that was added to the paper insulation and signal further reduction of the insulating properties of the paper.
Figure 7
Dissolved Gas Analysis Data Received from APS

15
Hot Spot Analysis
Recently, thermal images were taken of the transformer we are assessing which indicated that there were areas of extreme heat compared to the rest of the transformer, in Figure 8. Reasons why there was a high water content in the transformer could be from degradation in the solid insulation material between the coils of the transformer. Natural wear on the solid insulation could pose health problem with the transformer because this drops the insulating material’s strength. Drops in the solid insulating material strength can cause arching between the coils inside of the transformer and cause local hot spots in certain areas of the transformer. Common among many of the transformer failures is a short turn. The shorted turn develops as a result of breakdown of the solid insulation which causes winding temperature to shoot up. The transformer shows signs of a short turn which would suggest that it’s at the end of its life.
Figure 8
Thermal Picture Comparison of the Unit 2 Transformer

16
Preliminary Conclusion Further tests need to be done to provide an accurate condition assessment for the transformer. Figure 9 describes the characteristics of a transformer when the insulation age drops after certain high load stresses. It can be seen that past failures and stress affect the state of the transformer. When additional tests are completed during and after the outage we can make our condition assessment.
Figure 9 A Conceptual Failure Model
Testing – During Outage The following is the analysis of tests performed on April 1st 2013 for the U2 GSU. These tests were performed when the transformer was offline, and after the visual inspection. This occurred just prior to the transformer going back online.
Overall Power Factor
The purpose of the Overall Power Factor test is to check for moisture and contamination in the oil and embedded in the cellulose. A power factor greater than 1% for this test indicates that there may be unwanted moisture or contamination in the transformer. All of these tests’ points were well below the 1% limit. This is shown in the highlighted section of Table 9.
17
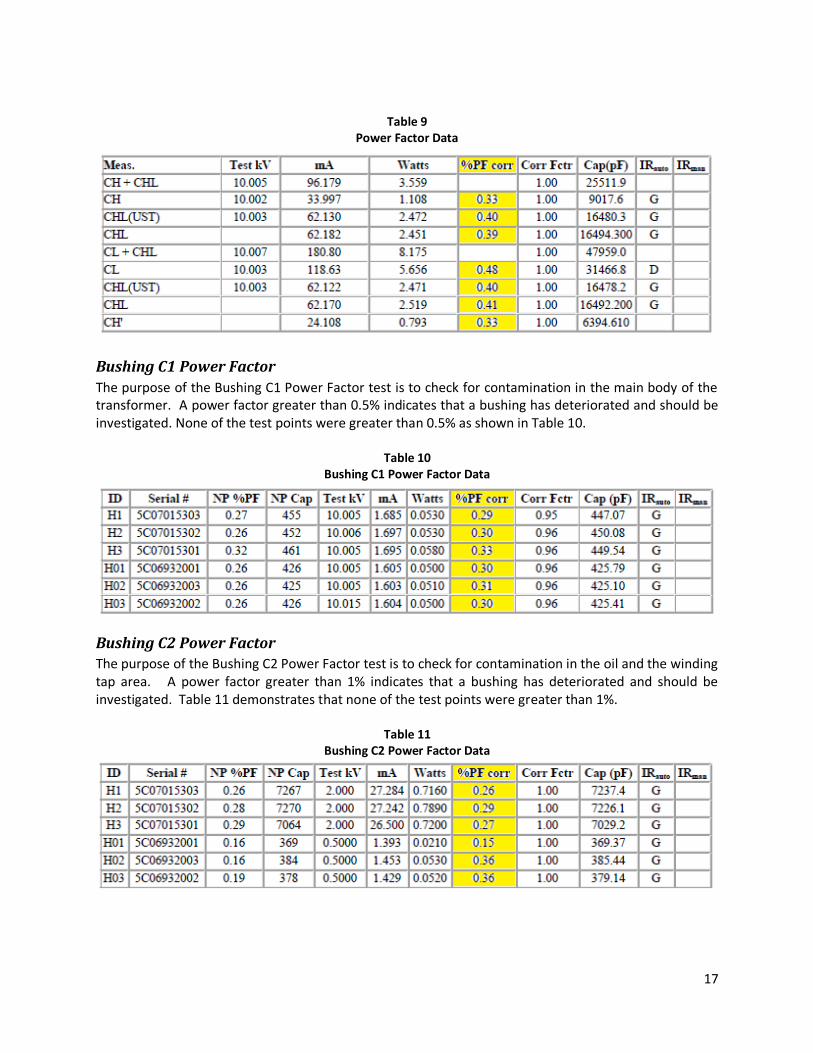
Table 9
Power Factor Data
Bushing C1 Power Factor
The purpose of the Bushing C1 Power Factor test is to check for contamination in the main body of the transformer. A power factor greater than 0.5% indicates that a bushing has deteriorated and should be investigated. None of the test points were greater than 0.5% as shown in Table 10.
Table 10 Bushing C1 Power Factor Data
Bushing C2 Power Factor
The purpose of the Bushing C2 Power Factor test is to check for contamination in the oil and the winding tap area. A power factor greater than 1% indicates that a bushing has deteriorated and should be investigated. Table 11 demonstrates that none of the test points were greater than 1%.
Table 11 Bushing C2 Power Factor Data

18
Turns Ratio Test
The purpose of the Turns Ratio test is to check for shorts in the transformer windings. The U2 GSU is used in the tap changer position 4. With the tap changer in this position, the minimum turn ratio value is 13.741 and the maximum limit is 13.879. None of the winding ratios measured outside of the acceptable range. This data was captured in Table 12.
Table 12
Turns Ratio Data
Degree of Polymerization
During the visual inspection of the transformer, several cellulose insulation samples were taken from varies areas of the transformer. These samples were sent to Doble Engineering for Degree of Polymerization (DP) testing. A DP test will indicate the remaining life of the paper insulation of the transformer. Cellulosic insulation with DP values of 200 or below is considered near or at the end of the reliable life and at this point the paper insulation has become mechanically compromised. Midlife is approximated at a DP of 400 and new paper typically has a DP of about 1000 to 1300. Aging of the cellulose insulation within a transformer is very rarely uniform and, therefore, the location where the sample is taken is important. Out of the 6 samples tested the worst case is that the paper insulation has 86% of its life remaining. This is very good for a transformer that has been in service for 38 years. This information is shown in Table 13.
Table 13 Degree of Polymerization Data
Sample # Report #
Sample Date DP
Estimated Remaining Life to DP
200 (%)
1 126644 04/03/2013 849 95
2 126644 04/03/2013 903 97
3 126644 04/03/2013 927 98
4 126644 04/03/2013 759 90
5 126644 04/03/2013 690 86
6 126644 04/03/2013 849 95

19
Testing – After Outage The following section contains the analysis of the data collected after the transformer was placed back
into service on April 1st, 2013.
Dissolved Gas Analysis (DGA)
Below is the DGA from the most recent oil sample from the transformer. This sample was taken on April 22nd, 2013, approximately 3 weeks after the transformer was put back into service. Three of the four DGA methods show that there is “No Fault” with the transformer. Duval’s triangle does not have the option to suggest that there is no fault and should only be used when another DGA method indicates there is a fault.
ppm
Ethylene 23.1981
Dornenburg’s ratio: No Fault
Hydrogen 9.1989
Methane 20.9397
Rogers ratio: No Fault
Ethane 42.8143
Acetylene 0
Duval Triangle: Thermal Fault>700°C
CO 43.7089
TDCG 139.8599
Key Gas: No Fault
Closing Remarks None of the tests performed indicate that the transformer is in poor condition. From the analysis of data from test performed during the outage and dissolved gas analysis we are confident that the transformer can continue to operate normally. We recommend monthly sampling of the mineral oil for Dissolved Gas Analysis and oil fluid tests. Any steady increase of gases or abnormalities in the fluid test during the monthly samples should be investigated immediately.