Choice of urea-spray models in CFD simulations of urea … · Choice of urea-spray models ......
24
Competence Centre for Catalysis - KCK Choice of urea-spray models in CFD simulations of urea-SCR systems Andreas Lundström & Henrik Ström Competence Centre for Catalysis / Chemical Reaction Engineering Department of Chemical Engineering and Environmental Science Chemical Reaction Engineering Chalmers University of Technology S - 412 96 Göteborg Sweden E-mail: [email protected] [email protected] and
Transcript of Choice of urea-spray models in CFD simulations of urea … · Choice of urea-spray models ......

Competence Centre for Catalysis - KCK
Choice of urea-spray modelsin CFD simulations
of urea-SCR systems
Andreas Lundström & Henrik Ström
Competence Centre for Catalysis / Chemical Reaction Engineering
Department of Chemical Engineering and Environmental ScienceChemical Reaction Engineering
Chalmers University of TechnologyS - 412 96 Göteborg
Sweden
E-mail: [email protected]@chalmers.se and
2/24 Competence Centre for Catalysis - KCK
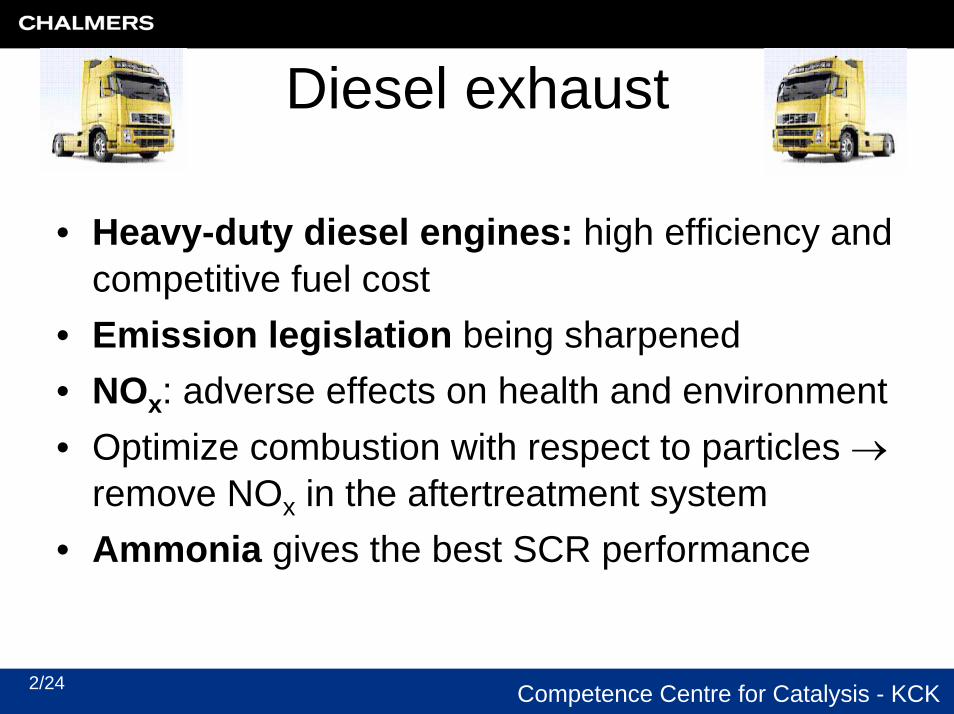
Diesel exhaust
• Heavy-duty diesel engines: high efficiency and competitive fuel cost
• Emission legislation being sharpened• NOx: adverse effects on health and environment• Optimize combustion with respect to particles →
remove NOx in the aftertreatment system• Ammonia gives the best SCR performance
3/24 Competence Centre for Catalysis - KCK
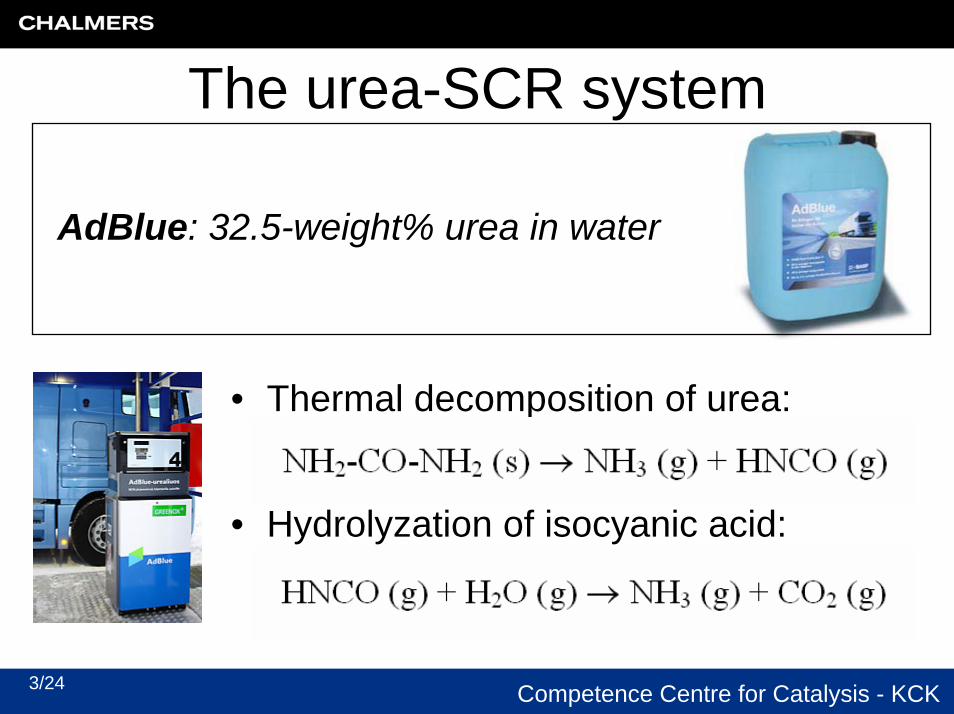
The urea-SCR system
• Thermal decomposition of urea:
• Hydrolyzation of isocyanic acid:
AdBlue: 32.5-weight% urea in water
4/24 Competence Centre for Catalysis - KCK
Outline
1. The investigated urea-SCR system2. Eulerian-Lagrangian modeling in CFD
- Force balance- Sub-models for the discrete phase- Heat and mass transfer- Results are influenced by modeling choices
3. Volume of Fluid modeling in CFD- Simulation setup- Comparison of droplet distortion
4. Influence of material data quality5. Summary6. Future work

5/24 Competence Centre for Catalysis - KCK
The investigated urea-SCR system
Single-phase AdBlue injector Droplet size range: 5 – 300 µm
Pulsating injection Sauter mean diameter: ~ 120 µm
Hollow cone spray Mean diameterN: ~ 90 µm
• Water evaporation and urea decomposition is modeled
• Droplets hitting walls are logged and removed – i.e. no wall-film modeling

6/24 Competence Centre for Catalysis - KCK
Eulerian-Lagrangian modeling in CFD
( )
,
,,2
Re1824
ip i
p i D pp p i p i x
p p
dx udt
du Cm m u u F
dt dµ
ρ
=
= − +
Fluent, Inc.
• External forces to include in the Lagrangian force balance equations (Fx)
• Sub-models for droplet drag coefficient (CD), including effects of droplet distortion
• Sub-model for turbulent dispersion of droplets and its sensitivity to the choice of turbulence model

7/24 Competence Centre for Catalysis - KCK
Overview of external forcesFORCE DUE TO FORMULA NEGLECT
Gravitational force GravitationWhen τd is small
Virtual mass force Acceleration of the surrounding gas
Brownian motion Collisions with molecules
Lift force Velocity gradient ?Rotational force Rotation of droplet
When the lift force is neglected
Termophoretic force Temperature gradient
?
History force Build-up of boundary layer at acceleration ?
( )pg p x
p
F m gρ ρ
ρ
−=
( )vm vm g d d gdF C u u udt
ρ= − − gd ρρ >>
5 2
216Brownian
p p c
TFd C t
µσξπ ρ
=∆
Kn < 0.015
2 212L f c LF U a Cρ π=
2 212L R f c L RF U a Cρ π+ +=
( )( )( )
26 Kn 11 3 Kn 1 2 2 Kn
p s tT
m t
d C K C TFC K C Tπ µ
ρ+ ∂
= −+ + + x∂
( )0
26p
p
tf p
History p f ft p
d U UdF r d
tτπρ µ τ
τ
−= ⋅
−∫
8/24 Competence Centre for Catalysis - KCK
Estimating lift force effects
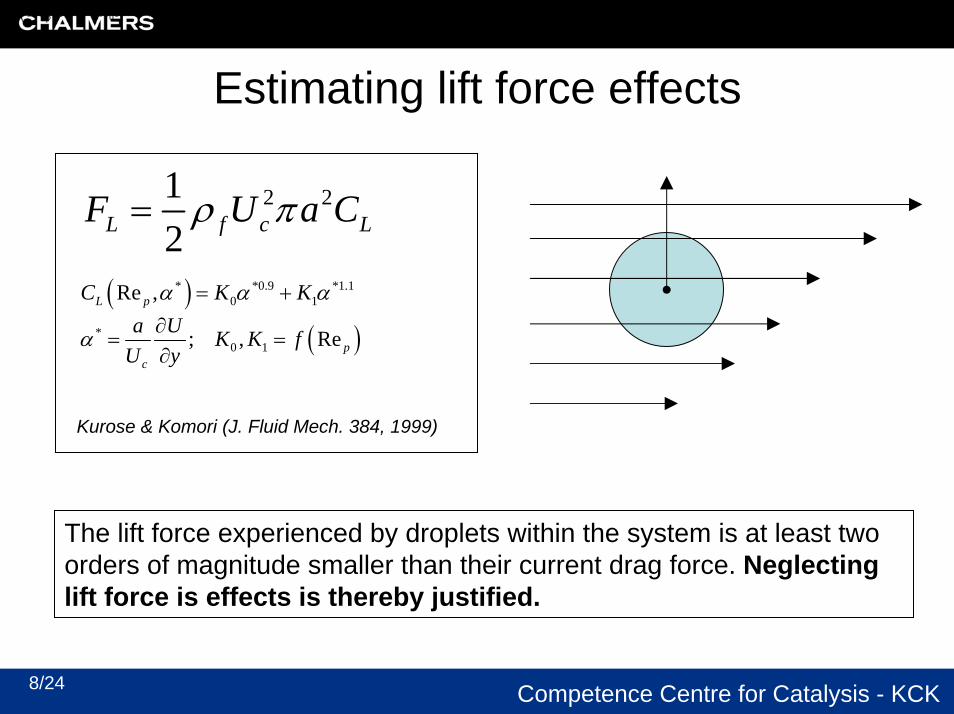
2 212L f c LF U a Cρ π=
( )* *0.9 *1.10 1Re ,L pC K Kα α α= +
( )* *0.9 *1.10 1Re ,L pC K Kα α α= +
( )*0 1; , Re p
c
a U K K fU y
α ∂= =
∂
Kurose & Komori (J. Fluid Mech. 384, 1999)
The lift force experienced by droplets within the system is at least two orders of magnitude smaller than their current drag force. Neglecting lift force is effects is thereby justified.
9/24 Competence Centre for Catalysis - KCK
Estimating thermophoretic effects
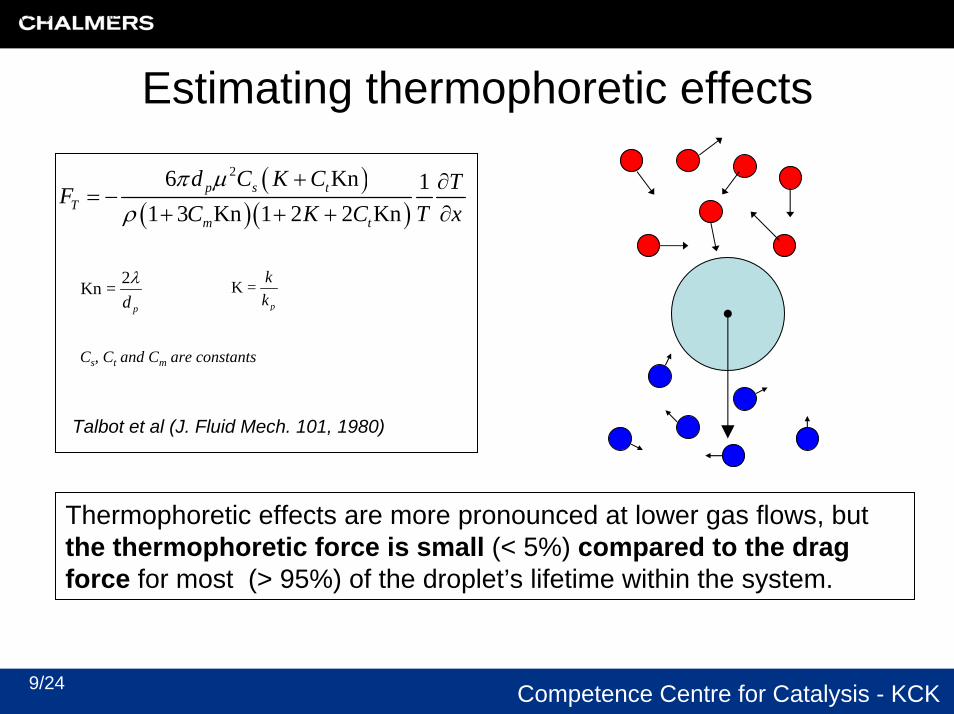
( )( )( )
26 Kn 11 3 Kn 1 2 2 Kn
p s tT
m t
d C K C TFC K C T xπ µ
ρ+ ∂
= −+ + + ∂
2Kn =pdλ
( )* *0.9 *1.10 1Re ,L pC K Kα α α= +
Talbot et al (J. Fluid Mech. 101, 1980)
K =p
kk
Cs, Ct and Cm are constants
Thermophoretic effects are more pronounced at lower gas flows, but the thermophoretic force is small (< 5%) compared to the drag force for most (> 95%) of the droplet’s lifetime within the system.

10/24 Competence Centre for Catalysis - KCK
Estimating history effects
( )0
26p
p
tf p
History p f ft p
d U UdF r d
tτπρ µ τ
τ
−= ⋅
−∫
Crowe, C. T. Multiphase Flow Handbook (2006)
History effects are very sensitive to other modeling
choices!
0%
5%
10%
15%
20%
base case + DRW base case + DRWHIGH GAS FLOW LOW GAS FLOW
Relative importance* Turbulent dispersion of
droplets will affect importance of the history
force.
*Percent of injected parcels experiencing Fhistory/Fdrag higher than 10% for more than 10% of their time in the domain
DRW = Discrete Random Walk (model for turbulent dispersion of droplets)
11/24 Competence Centre for Catalysis - KCK
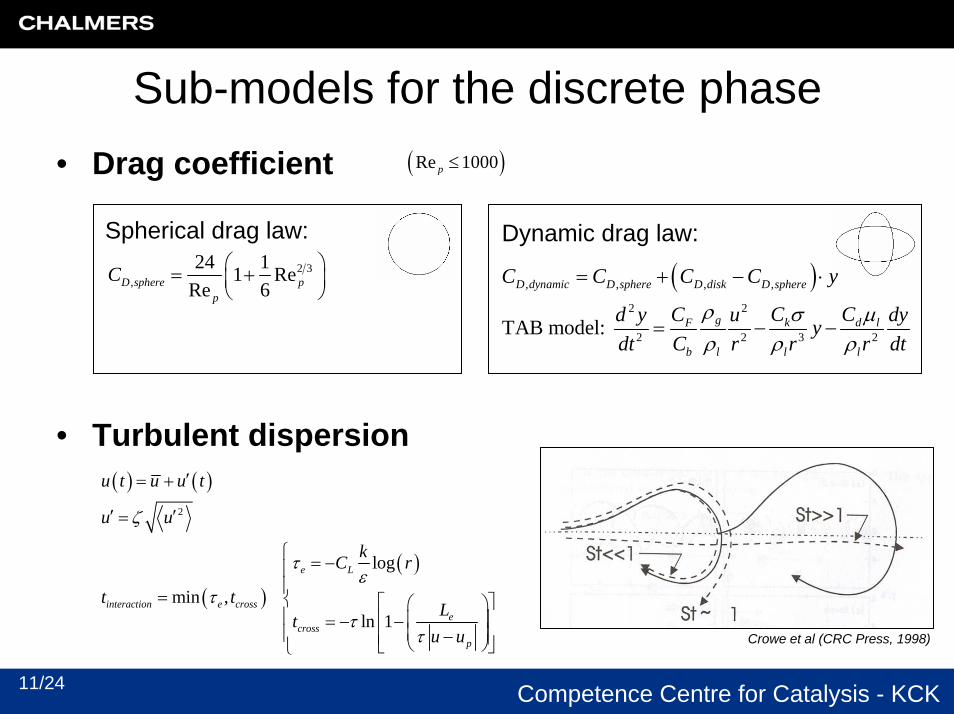
Sub-models for the discrete phase• Drag coefficient
• Turbulent dispersion
Crowe et al (CRC Press, 1998)
( ) ( )
( )( )
2
log
min ,ln 1
e L
interaction e crosse
crossp
u t u u t
u u
kC r
t tLt
u u
ζ
τε
ττ
τ
′= +
′ ′=
⎧ = −⎪⎪= ⎨ ⎡ ⎤⎛ ⎞⎪ ⎢ ⎥⎜ ⎟= − −
⎜ ⎟⎪ −⎢ ⎥⎝ ⎠⎣ ⎦⎩
( )Re 1000p ≤
( ), , , ,
2 2
2 2 3 2TAB model:
D dynamic D sphere D disk D sphere
g k d lF
b l l l
C C C C y
C CCd y u dyydt C r r r dt
ρ σ µρ ρ ρ
= + − ⋅
= − −
Dynamic drag law:2 3
,24 11 Re
Re 6D sphere pp
C ⎛ ⎞= +⎜ ⎟⎝ ⎠
Spherical drag law:

12/24 Competence Centre for Catalysis - KCK
Droplet heat and mass transfer
(dp = 30 µm)
( )( ), ,
p pp p s p vap
i c i s i
dT dmm c hA T T h
dt dtN k c c
∞
∞
⎧= − + ∆⎪
⎨⎪ = −⎩
( )pp p s p
dTm c hA T T
dt ∞= −
( ) ( ) ( ),
,
4 1 0.23 Re ln 1p p pd
p p p decomposition
d d c T Tkdt c d hρ
∞ ∞∞
∞
⎡ ⎤−= + +⎢ ⎥
∆⎢ ⎥⎣ ⎦
Stage of evaporation or decomposition
Heat and mass balances
A. Evaporation of water
B. Heating of urea
C. Decomposition of urea(at constant temperature ~ 425 K)
13/24 Competence Centre for Catalysis - KCK
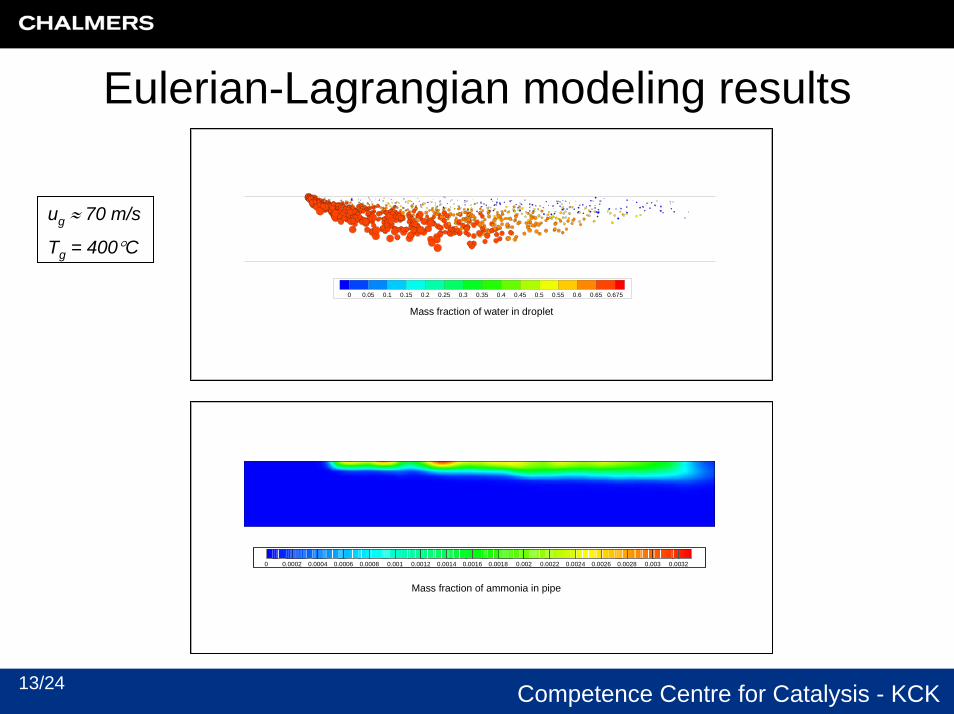
Eulerian-Lagrangian modeling results
0 0.05 0.1 0.15 0.2 0.25 0.3 0.35 0.4 0.45 0.5 0.55 0.6 0.65 0.675
Mass fraction of water in droplet
ug ≈ 70 m/s
Tg = 400°C
0 0.0002 0.0004 0.0006 0.0008 0.001 0.0012 0.0014 0.0016 0.0018 0.002 0.0022 0.0024 0.0026 0.0028 0.003 0.0032
Mass fraction of ammonia in pipe

14/24 Competence Centre for Catalysis - KCK
Results are influenced by model choices
• HIGH GAS FLOW CASE
• Switching to a dynamic drag law decreases wall hit with 43%• Simulating turbulent dispersion increases wall hit with 37%• Using both the dynamic drag law and turbulent dispersion
increases wall hit with 47%
• LOW GAS FLOW CASE
• Simulating turbulent dispersion increases decomposition efficiency with 14%
(ug ≈ 70 m/s, Tg = 400°C)
Decomposition efficiency: 21.4% Wall hit: 4.4%
(ug ≈ 25 m/s, Tg = 300°C)
Decomposition efficiency: 32.9% Wall hit: 20.9%
15/24 Competence Centre for Catalysis - KCK
Explanations for model choice sensitivity
• Dynamic drag coefficient speeds up droplet adaptation to the gas flow ⇒ large effect on wall hit at high gas flows
• Turbulent dispersion will increase heat and mass transfer rates at low relative velocities ⇒ increases decomposition efficiency at low gas flows
• Turbulent dispersion predicts small droplets/urea particles on injector side of pipe will be thrown towards the wall ⇒ increases extent of wall hit and predicts different variety of droplet types at the walls
Droplet properties at wall hit crucial for wall modeling!

16/24 Competence Centre for Catalysis - KCK
Turbulence model
2 3 4 5 6 7-0.08
-0.06
-0.04
-0.02
0
0.02
0.04
0.06
0.08
Turbulent fluctuating velocity [m/s]
Pipe
Y-c
oord
inat
e [m
]
RSM u´ (plane)RSM v´ (main gas flow direction)RNG k-e
u
v
Turbulent fluctuating velocity across the pipe cross-section in a fully developed turbulent flow for a high gas flow case (ug ≈ 75 m/s) in a straight exhaust gas pipe
Changing from RNG k-ε to a Reynolds stress model will increase wall hit with 9.6% for a straight pipe with a high gas flow (≈ 70 m/s).
?Modeling turbulent dispersion increases the sensitivity to the
choice of turbulence model!

17/24 Competence Centre for Catalysis - KCK
Volume of Fluid modeling
• Used in conjunction with Eulerian-Lagrangian modeling to give a detailed resolution of individual droplet behavior– Heat and Momentum transfer
• May only be used on a small number of droplets

18/24 Competence Centre for Catalysis - KCK
Comparison of droplet distortion
VOF and TAB simulations for 50 and 100 (µm) droplets in a 70 (m/s) gas flow
100 (µm) 50 (µm)
VOF and TAB simulations agree well in predicting droplet oscillation frequency and amplitude

19/24 Competence Centre for Catalysis - KCK
Comparison of drag forces
VOF, Dynamic- and Spherical-drag law simulations of 300 and 100 (µm) droplets in 70 (m/s) gas flow under constant material properties
Dynamic drag law gives a better description of real droplet drag than the spherical drag law.

20/24 Competence Centre for Catalysis - KCK
AdBlue material data
• The need for good data in simulations?
Measurements of:viscositydensitysurface tension
mass fraction of Urea [%W]
Tem
pera
ture
[o C]
Kinematic viscosity of Urea (cSt)
0.9 0.95 1 1.05
1.1 1.15 1.21.25 1.3
1.351.4
0.951
1.05
1.05
1.1
1.1
1.15
1.15
1.2 1.25
1.3
30 35 40 45 50 55 60 65 7020
30
40
50
60
70
80
21/24 Competence Centre for Catalysis - KCK
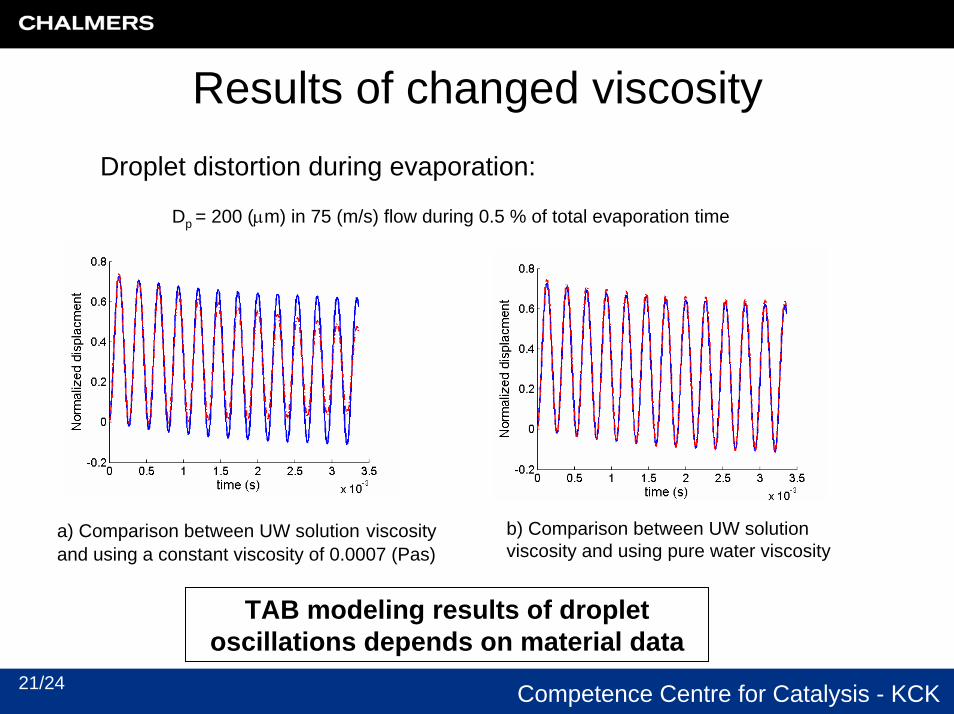
Results of changed viscosityDroplet distortion during evaporation:
Dp = 200 (µm) in 75 (m/s) flow during 0.5 % of total evaporation time
b) Comparison between UW solution viscosity and using pure water viscosity
a) Comparison between UW solution viscosity and using a constant viscosity of 0.0007 (Pas)
TAB modeling results of droplet oscillations depends on material data

22/24 Competence Centre for Catalysis - KCK
Effects on drag
Drag coefficient predicted using TAB and spherical drag law models for:
UW-solution with property dependent or constant viscosity
Dynamic drag law applicable for ~0.3% of total evaporation time
Prediction of drag is insensitive to changes in material properties
23/24 Competence Centre for Catalysis - KCK
Summary
• Choice of models influences the results!• Lagrangian force balance
– Drag force and gravitational force– History force?
• Drag coefficient– TAB model provides good descriptions of droplet distortion
• Turbulent dispersion– Large effects– Sensitivity to the choice of turbulence model
• Material data– Material data quality is of minor importance when predicting drag

24/24 Competence Centre for Catalysis - KCK
Future work
• Continued work comparing evaporation rates for VOF and Eulerian-Lagrangian modeling
• Development of urea-decomposition kinetics
• Wall-droplet interaction modeling