CHOCOLATES - · PDF fileChocolates To evaluate consumers attitude towards the usage of...
28
CHOCOLATES Submitted by: Jyoti luthra Devanshu singhal Afzal Dheeraj Gupta
Transcript of CHOCOLATES - · PDF fileChocolates To evaluate consumers attitude towards the usage of...

CHOCOLATES
Submitted by:
Jyoti luthra
Devanshu singhal
Afzal
Dheeraj Gupta

OBJECTIVES
• To analyze the consumers brand preferences for
Chocolates
• To evaluate consumers attitude towards the usage
of Chocolates
• To evaluate consumers perception about the
important factors pertaining to Chocolates
purchase decision

HYPOTHESES
• Sales of different brand of Chocolates are uniformly distributed i.e. there is no significant difference in the sales of different Chocolates brands.
• There is no significant difference among the consumers of Chocolates on the factors like age, gender etc towards their attitude about the usage of chocolate.
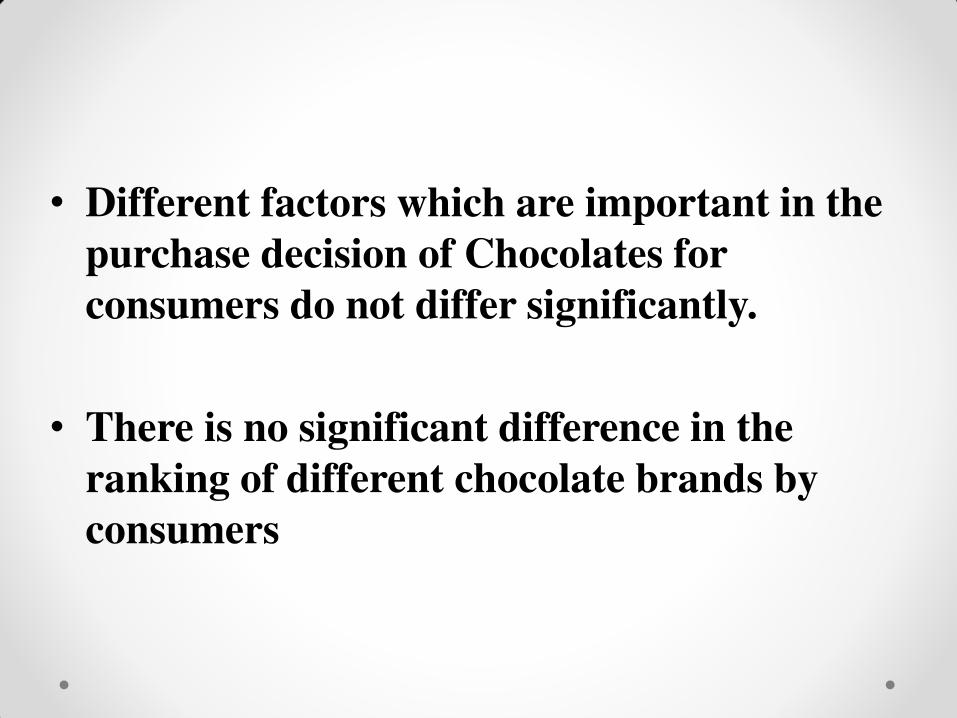
• Different factors which are important in the
purchase decision of Chocolates for
consumers do not differ significantly.
• There is no significant difference in the
ranking of different chocolate brands by
consumers
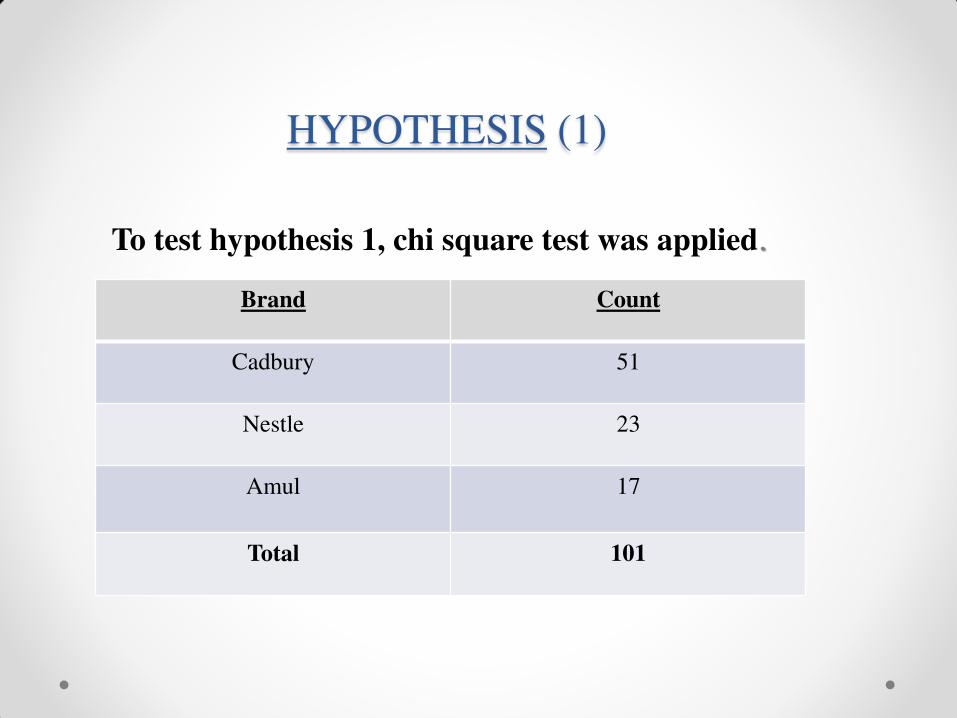
HYPOTHESIS (1)
To test hypothesis 1, chi square test was applied.
Brand Count
Cadbury 51
Nestle 23
Amul 17
Total 101

• Chi square value (calculated) = 21.71
• Critical Chi square value (0.05, 2) = 5.995
• Chi square value (calculated) is greater than
critical chi square value, hence hypothesis 1 is
rejected and it can be concluded that sales of
different brand of chocolates are not uniformly
distributed

HYPOTHESIS (2)
Hypothesis 2 (a): Consumers of the different
age group do not differ significantly on their
attitude towards consumption of chocolates.
To test this hypothesis ANOVA was applied with
following results.

Anova Single Factor
Groups Count Sum Average Variance
Under 18-25 59 3443 58.35593 32.26768
26-35 19 1059 55.73684 26.539801
36-45 9 498 55.3333 40.5
46-55 7 398 56.85714 104.8095
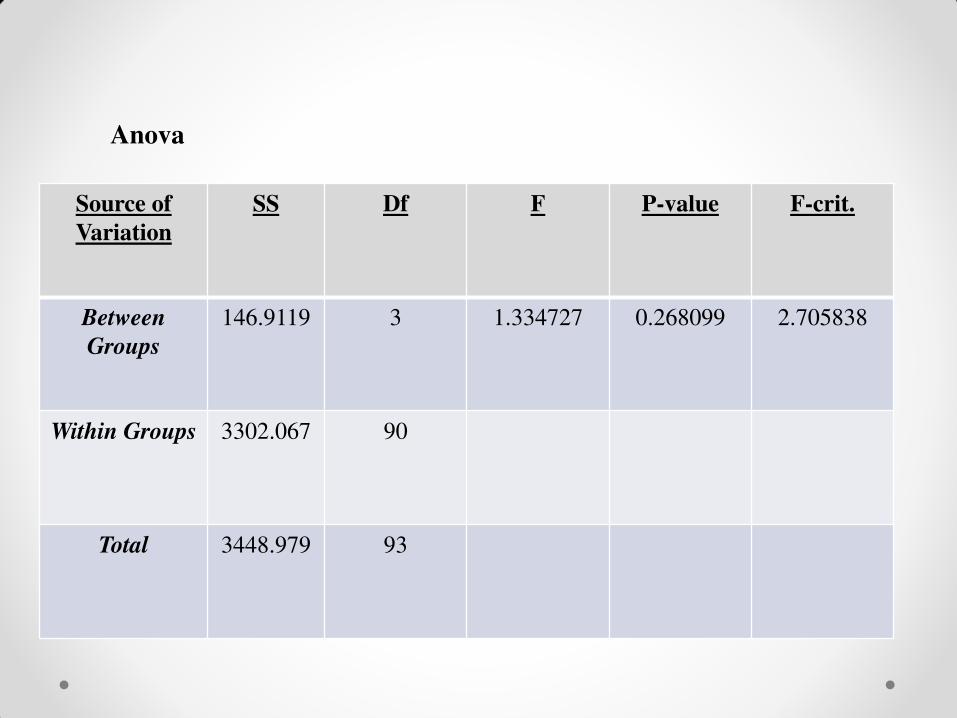
Anova
Source of
Variation
SS Df F P-value F-crit.
Between
Groups
146.9119 3 1.334727 0.268099 2.705838
Within Groups 3302.067 90
Total 3448.979 93

Since F calculated is less than F critical at 95% significance
level, hence Null hypothesis is accepted.
So, it can be concluded that consumes of the different age group
do not differ significantly on their attitude towards
consumption of chocolates.
Hypothesis 2 (b): Male and female consumers do not differ
significantly in their attitude towards consumption of chocolate
To test this hypothesis z test was applied with following results
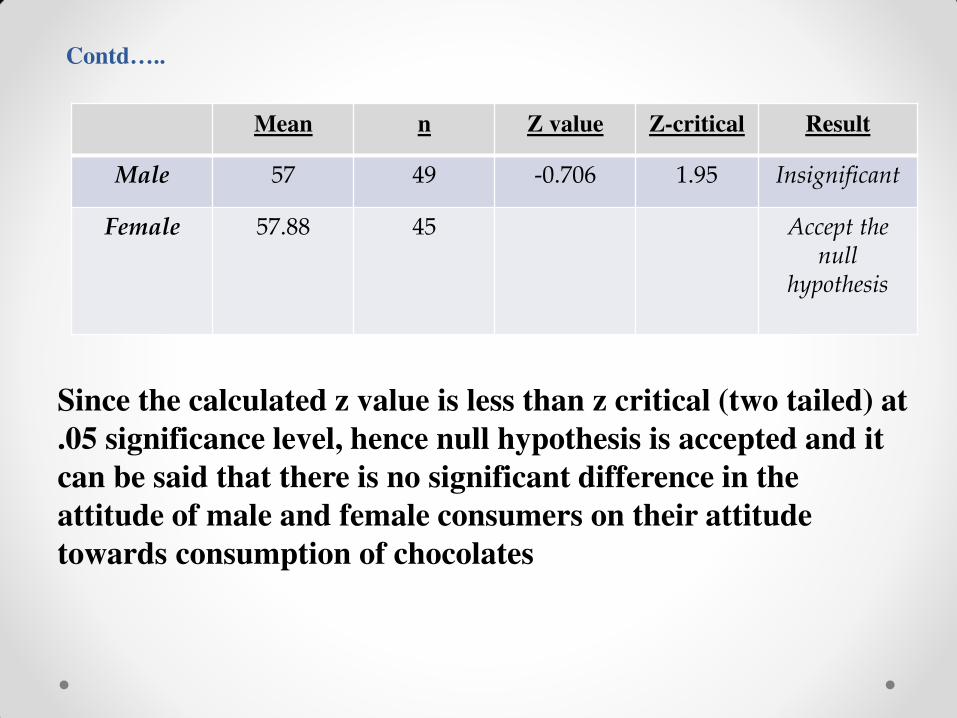
Since the calculated z value is less than z critical (two tailed) at
.05 significance level, hence null hypothesis is accepted and it
can be said that there is no significant difference in the
attitude of male and female consumers on their attitude
towards consumption of chocolates
Mean n Z value Z-critical Result
Male 57 49 -0.706 1.95 Insignificant
Female 57.88 45 Accept the null
hypothesis
Contd…..

Hypothesis 2 (c): Married and unmarried consumers do not
differ significantly in their attitude towards consumption of
chocolate.
To test this hypothesis z test was applied with following results
Since the calculated z value is less than z critical (two tailed) at .05
significance level, hence null hypothesis is accepted and it can be said that
there is no significant difference in the attitude of married and unmarried
consumers on their attitude towards consumption of chocolates
Mean N Z value Z critical Result
Married 56.61 36 -0.99 1.95 Insignificant
Unmarried 57.93 58 Accept the
null
hypothesis

HYPOTHESIS (3)
Different factors which are
important in the purchase decision of
Chocolates for consumers do not
differ significantly
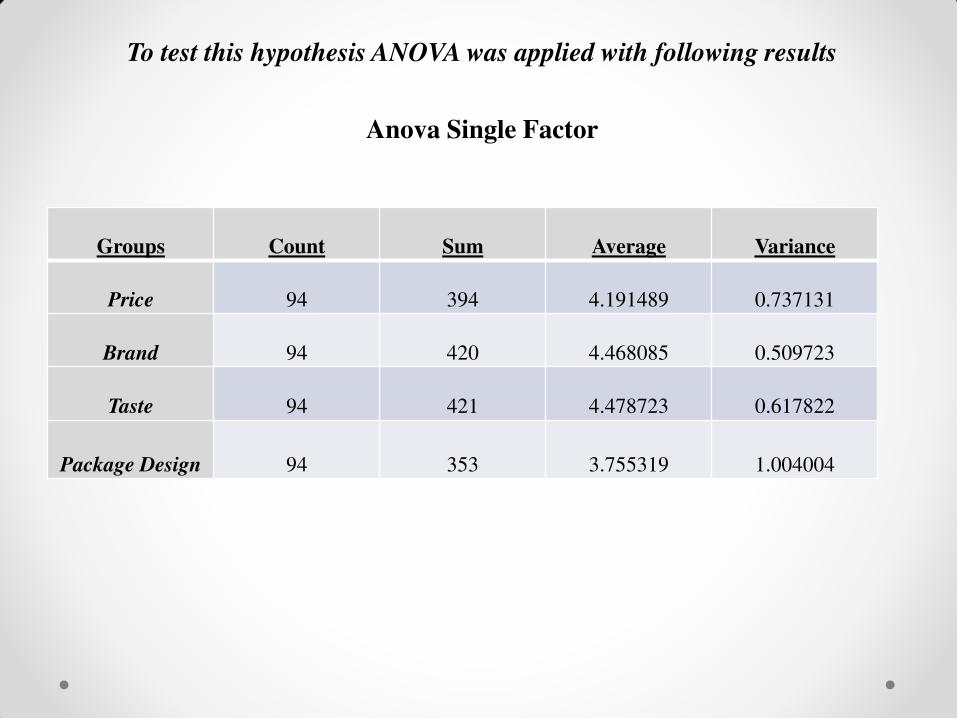
To test this hypothesis ANOVA was applied with following results
Anova Single Factor
Groups Count Sum Average Variance
Price 94 394 4.191489 0.737131
Brand 94 420 4.468085 0.509723
Taste 94 421 4.478723 0.617822
Package Design 94 353 3.755319 1.004004

Since F calculated is greater than F critical at 95% significance level,
hence Null hypothesis is rejected.
So, it can be concluded that different factors which are important in the
purchase decision of Chocolates for consumers differ significantly
ANOVA
Source of
Variation SS df MS F P-value F crit
Between
Groups 32.44681 3 10.8156 15.08095 2.78E-09 2.628903
Within
Groups 266.7872 372 0.71717
Total 299.234 375

HYPOTHESIS (4)
There is no significant difference in the ranking of different chocolate brands by consumers.
To test this hypothesis, Friedman Test of Non – Parametric statistic was applied
Chi square value (calculated by Friedman equation) = 34.10
Critical Chi square value (0.05, 2 ) = 5.995

Chi square value (calculated) is greater than critical
chi square value, hence this hypothesis is rejected
and it can be concluded that there is significant
difference in the ranking of different chocolate
brands by consumers

DESCRIPTIVE STATISTICS ANALYSIS
Most popular brand:
Cadbury
Brand Count
• Cabdury 51
• Nestle 23
• Amul 17
Total 91
56% 25%
19%
0%
Cadbury
Nestle
Amul

Cadbury Nestle Amul
Rank
1 54 26 14
Rank
2 25 44 25
Rank
3 15 24 55

54
25
15
0
26
44
24
14
25
55
0
10
20
30
40
50
60
Rank 1 Rank 2 Rank 3
Cadbury
Nestle
Amul

UNDER 18-25 59
26-35 19
36-45 9
46-55 7

63%
20%
10%
7%
Age Profile
UNDER 18-25
26-35
36-45
46-55

51% 49%
MALE FEMALE

51%
49%
0%
MARRIED
UNMARRIED
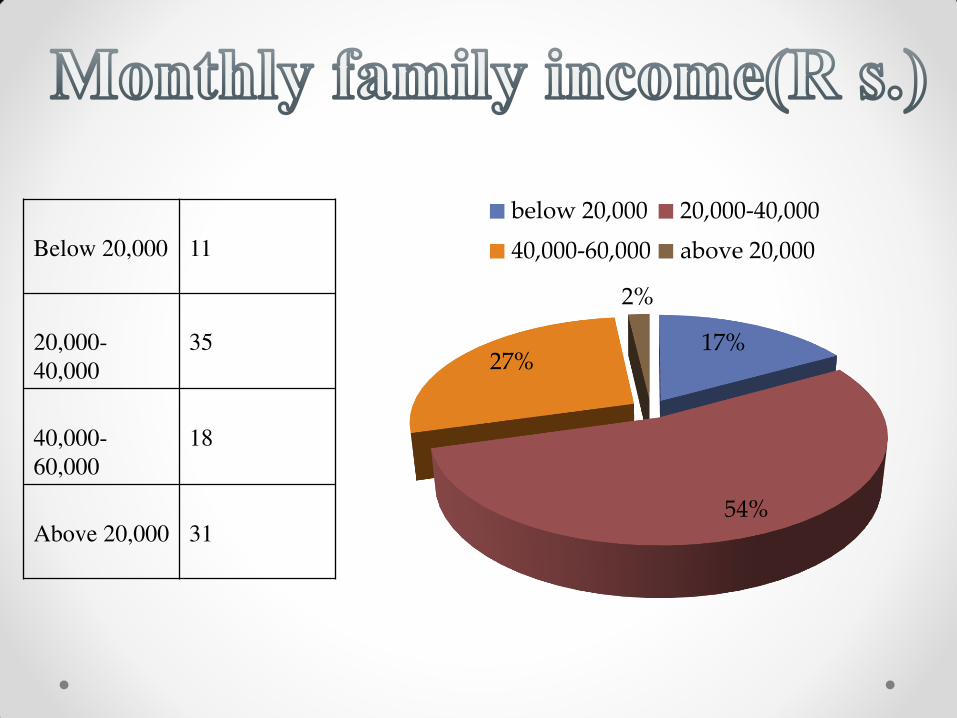
Below 20,000
11
20,000-
40,000
35
40,000-
60,000
18
Above 20,000
31
17%
54%
27%
2%
below 20,000 20,000-40,000
40,000-60,000 above 20,000

Under
graduate
8
Graduate
50
Post-graduate
36
others
0
8%
53%
38%
1%
under
graduate
graduate
post-graduate
others

49%
12%
17%
20%
2% 0%
students service bsiness
professionals others
STUDENT
46
SERVICE
11
BUSINESS
16
PROFESSIO
NALS
19
OTHERS
2

THANKYOU