China's Economic ties with ASEAN Countries
43
March 17, 2015 Disclaimer: This paper is the product of professional research performed by staff of the U.S.-China Economic and Security Review Commission, and was prepared at the request of the Commission to support its deliberations. Posting of the report to the Commission’s website is intended to promote greater public understanding of the issues addressed by the Commission in its ongoing assessment of U.S.- China economic relations and their implications for U.S. security, as mandated by Public Law 106-398 and Public Law 108-7. However, the public release of this document does not necessarily imply an endorsement by the Commission, any individual Commissioner, or the Commission’s other professional staff, of the views or conclusions expressed in this staff research report. Nargiza Salidjanova, Senior Analyst, Economics and Trade and Iacob Koch-Weser, Former Policy Analyst, Economics and Trade with Jason Klanderman, Former Research Intern China’s Economic Ties with ASEAN: A Country-by-Country Analysis
-
Upload
dr-dev-kambhampati -
Category
Business
-
view
504 -
download
0
Transcript of China's Economic ties with ASEAN Countries

March 17, 2015
Disclaimer: This paper is the product of professional research performed by staff of the U.S.-China Economic and Security Review
Commission, and was prepared at the request of the Commission to support its deliberations. Posting of the report to the Commission’s
website is intended to promote greater public understanding of the issues addressed by the Commission in its ongoing assessment of U.S.-
China economic relations and their implications for U.S. security, as mandated by Public Law 106-398 and Public Law 108-7. However, the
public release of this document does not necessarily imply an endorsement by the Commission, any individual Commissioner, or the
Commission’s other professional staff, of the views or conclusions expressed in this staff research report.
Nargiza Salidjanova, Senior Analyst, Economics and Trade
and
Iacob Koch-Weser, Former Policy Analyst, Economics and Trade
with
Jason Klanderman, Former Research Intern
China’s Economic Ties with ASEAN:
A Country-by-Country Analysis
U.S.-China Economic and Security Review Commission
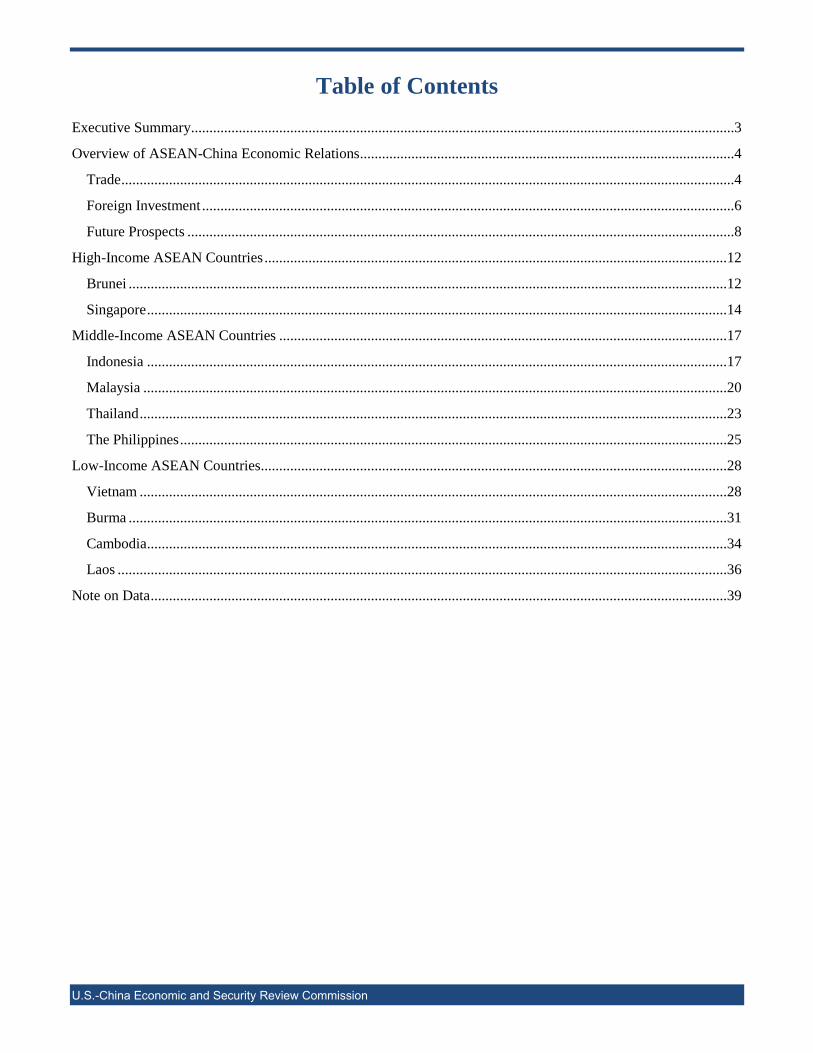
Table of Contents
Executive Summary....................................................................................................................................................3
Overview of ASEAN-China Economic Relations ......................................................................................................4
Trade .......................................................................................................................................................................4
Foreign Investment .................................................................................................................................................6
Future Prospects .....................................................................................................................................................8
High-Income ASEAN Countries ..............................................................................................................................12
Brunei ...................................................................................................................................................................12
Singapore ..............................................................................................................................................................14
Middle-Income ASEAN Countries ..........................................................................................................................17
Indonesia ..............................................................................................................................................................17
Malaysia ...............................................................................................................................................................20
Thailand ................................................................................................................................................................23
The Philippines .....................................................................................................................................................25
Low-Income ASEAN Countries ...............................................................................................................................28
Vietnam ................................................................................................................................................................28
Burma ...................................................................................................................................................................31
Cambodia ..............................................................................................................................................................34
Laos ......................................................................................................................................................................36
Note on Data .............................................................................................................................................................39

U.S.-China Economic and Security Review Commission 3
Executive Summary The Association of Southeast Asian Nations (ASEAN) is a pillar of the postwar order in East Asia. Founded in
1967 by Indonesia, Malaysia, the Philippines, Singapore, and Thailand, principally to coordinate security policy
during the Cold War, the bloc was significantly enlarged in the 1990s, when it took in low-income countries Burma
(Myanmar), Cambodia, Laos, and Vietnam. At the height of the 1997–1998 Asian financial crisis, China and
ASEAN forged a closer relationship. The two sides subsequently launched a currency swap initiative (the Chiang-
Mai Initiative) and began negotiations on an ASEAN-China Free Trade Area (ACFTA), which entered into force
in 2010.
Today, the complex relationship between China and ASEAN combines aspects of cooperation and tension. China’s
aggressive posturing in the South China Sea illustrates its increasing naval capabilities and willingness to deploy
them, whether to secure offshore hydrocarbons and fisheries or to exact leverage over its smaller neighbors to the
south. At the same time, China’s rise exerts a powerful pull on ASEAN economies, from component manufacturing
in Malaysia to banking in Singapore and copper mining in Burma. At once a manufacturing hub and an important
source of capital, China has the potential to buoy the ASEAN economies, but also to create structural imbalances
that damage the region in the long run.
This paper assesses China’s relative significance for individual ASEAN economies. It starts with an overview of
China’s trade and investment relations with ASEAN as a whole. The paper then provides descriptive statistics on
each ASEAN country’s composition of foreign trade by product and top trade partner, as well as foreign direct
investment (FDI) flows. It also provides a brief analysis of commercial disputes and bilateral cooperation with
China.
While each country’s relationship with China is unique, trade and investment data reveal some noteworthy trends:
China, the world’s second-largest economy, consistently appears among the top five trade partners for
ASEAN members. But the degree of dependence on China as a source of exports, imports, or both varies.
Where wealthier ASEAN countries have a diverse set of trading partners, poorer ASEAN countries depend
heavily on China, especially as a source of imports. Vietnam’s share of Chinese export and import flows
with ASEAN has increased substantially, while Singapore’s share has dropped.
Since full enactment of the ACFTA in 2010, ASEAN’s goods trade with China has gone from surplus to a
deficit that reached $45 billion in 2013. Thailand and Malaysia were the only countries that ran a goods
trade surplus with China in 2013. The causal link between ASEAN’s deficit and ACFTA merits scrutiny.
Manufactured goods, particularly machinery and electronics, are still a major source of ASEAN-China
trade, illustrating the extent and durability of regional production networks. In terms of manufactures
imports from China, Cambodia is the exception, due to its outsize reliance on Chinese textiles. On the
export side, Indonesia and Burma are outliers, as their shipments to China are concentrated in fuels and
minerals.
Although its outbound direct investment has been rising rapidly, China is still marginal to ASEAN’s overall
FDI receipts. According to data from China’s Ministry of Commerce (MOFCOM), China contributed a
mere 2.3 percent of ASEAN’s total FDI inflows in 2013. FDI flows are also small relative to China’s trade
with ASEAN. ASEAN in 2013 accounted for 10.7 percent of China’s total trade, but only 6.7 percent ($35.7
billion) of China’s global outbound investment stock. Even allowing for the possibility that MOFCOM may
be undercounting actual flows (for example, by not factoring in investment originating in Hong Kong), the
fact remains China is not yet a major investor in ASEAN.
Singapore, according to official statistics, is China’s major FDI partner in ASEAN, making substantial
direct investments into China ($7.2 billion in 2013, or over 6 percent of the world total) and also receiving
the lion’s share of Chinese FDI to ASEAN (41 percent of stocks by the end of 2013). This likely
overestimates actual flows, since Chinese companies may invest in ASEAN via subsidiaries in Singapore.
Even so, it is clear that Singapore plays a unique role as a financial hub linking China to ASEAN, in lieu
of mature capital markets in the rest of the region.
U.S.-China Economic and Security Review Commission 4
Overview of ASEAN-China Economic Relations
Trade
ACFTA is part of ASEAN’s broader push toward signing preferential trade agreements outside the multilateral
framework of the World Trade Organization (WTO), in line with the global proliferation of preferential trade
agreements outside the WTO. ASEAN countries have signed dozens of individual free trade agreements (FTAs)
within and beyond the Asia region, including with major economies in Europe and North America. Over the past
four years, ASEAN has led an initiative to combine five of its individual agreements (with Australia and New
Zealand, China, India, Japan, and Korea, respectively) into the so-called Regional Comprehensive Economic
Partnership (RCEP). RCEP negotiations were launched in November 2012, and are slated for completion by year-
end 2015.
Proponents of RCEP argue it could deepen economic integration in Asia, the region that has been the focal point of
global trade growth over the past decade. Detractors counter that RCEP, like ACFTA, is likely to be a shallow
agreement amenable to ASEAN’s heterogeneous member states, and as such will not make a major impact on
regional economic ties. RCEP excludes many of the advanced trade provisions promoted by the United States, such
as those governing regulatory convergence, digital goods and services, and intellectual property. Skeptics also argue
that despite China’s official policy to defer to ASEAN as the leader in regional integration,1 China may come to
dominate the development of RCEP.
Four ASEAN countries—Brunei, Malaysia, Singapore, and Vietnam—are party to the Trans-Pacific Partnership
(TPP), a high-standard, “mega-regional” trade agreement the United States is negotiating with 11 other countries
(including Australia, Canada, Chile, Japan, Mexico, New Zealand, and Peru) throughout the Asia Pacific region.2
TPP sets itself apart from RCEP in terms of the scope and depth of its provisions, and does not include China.
Although TPP has many purposes, most of which are exclusively economic, it could also have an indirect bearing
on the balance of power in the Asia region, in terms of solidifying U.S. partnerships in the face of China’s growing
influence. The primary challenges to completing a meaningful TPP agreement are Japan’s reluctance to open its
agricultural sector and the failure of the U.S. Congress to pass a new Trade Promotion Authority (TPA) bill to grant
the president fast-track negotiating authority.
The majority (75.8 percent) of ASEAN’s trade in 2013 was with countries outside the bloc, a testament to the
region’s trade openness.3 China was the largest individual trading partner (14 percent share of ASEAN trade), while
the United States was the fourth largest (8.2 percent share).4 Several ASEAN members have established integrated
supply chains with both China and Northeast Asia, largely as a function of China’s emergence as the world’s
manufacturing and assembly hub. ASEAN’s share of China’s trade with the world has also been increasing (see
Table 2).
Although ACFTA suggests mutually beneficial economic relations, the reality is that since full enactment of the
agreement in 2010, ASEAN’s goods trade with China has gone from surplus to a $45 billion deficit in 2013 (see
Table 1). In terms of individual trade partners, it is notable that Vietnam’s share of Chinese export and import flows
with ASEAN has increased substantially over the past decade, while Singapore’s share has dropped.

U.S.-China Economic and Security Review Commission 5
Table 1: China’s Bilateral Trade with ASEAN Countries
(US$ billions)
Source: China Ministry of Commerce, via CEIC database.
1998 2003 2008 2013 1998 2003 2008 2013
Exports 10,919 30,935 114,139 244,133 100% 100% 100% 100%
Imports 12,589 47,350 117,012 199,402 100% 100% 100% 100%
Balance (1,670) (16,415) (2,873) 44,731 100% 100% 100% 100%
Exports 560 34 130 1,704 5.1% 0.1% 0.1% 0.7%
Imports 0 311 83 87 0.0% 0.7% 0.1% 0.0%
Balance 560 (277) 47 1,617
Exports 3,901 8,873 32,325 45,886 35.7% 28.7% 28.3% 18.8%
Imports 4,226 10,486 20,092 29,969 33.6% 22.1% 17.2% 15.0%
Balance (325) (1,613) 12,233 15,918
Exports 1,172 4,482 17,210 36,947 10.7% 14.5% 15.1% 15.1%
Imports 2,462 5,754 14,387 31,479 19.6% 12.2% 12.3% 15.8%
Balance (1,290) (1,272) 2,823 5,469
Exports 1,594 6,142 21,383 45,941 14.6% 19.9% 18.7% 18.8%
Imports 2,675 13,998 32,131 60,068 21.2% 29.6% 27.5% 30.1%
Balance (1,080) (7,856) (10,748) (14,128)
Exports 1,170 3,829 15,521 32,738 10.7% 12.4% 13.6% 13.4%
Imports 2,423 8,829 25,636 38,518 19.2% 18.6% 21.9% 19.3%
Balance (1,253) (5,000) (10,116) (5,780)
Exports 1,499 3,094 9,088 19,836 13.7% 10.0% 8.0% 8.1%
Imports 517 6,309 19,508 18,205 4.1% 13.3% 16.7% 9.1%
Balance 982 (3,215) (10,420) 1,631
Exports n.a. 908 1,979 7,349 n.a. 2.9% 1.7% 3.0%
Imports n.a. 170 645 2,810 n.a. 0.4% 0.6% 1.4%
Balance n.a. 738 1,335 4,540
Exports n.a. 295 1,095 3,411 n.a. 1.0% 1.0% 1.4%
Imports n.a. 26 39 361 n.a. 0.1% 0.0% 0.2%
Balance n.a. 268 1,056 3,050
Exports n.a. 98 268 1,721 n.a. 0.3% 0.2% 0.7%
Imports n.a. 11 149 1,021 n.a. 0.0% 0.1% 0.5%
Balance n.a. 87 119 701
Exports 1,024 3,180 15,139 48,599 9.4% 10.3% 13.3% 19.9%
Imports 217 1,455 4,343 16,886 1.7% 3.1% 3.7% 8.5%
Balance 806 1,725 10,797 31,714
US$ million Share of ASEAN (%)
High-Income
Low-Income
Middle-Income
Malaysia
The Philippines
Singapore
Thailand
Vietnam
ASEAN Total
Brunei
Burma
Cambodia
Indonesia
Laos

U.S.-China Economic and Security Review Commission 6
Table 2: China’s Trade with ASEAN and the Rest of the World
(US$ billions; share %)
Source: China Ministry of Commerce, via CEIC database.
Foreign Investment
China is becoming a prominent outbound investor, making use of its large foreign exchange reserves and seeking
to reduce its excessive levels of investment in the domestic market. Chinese global outbound investment flows grew
from just over $34 billion in 2003 to $525.7 billion in 2013.5 The combination of rising outbound FDI and a
slowdown in foreign investment into China has led to a rapid reduction in China’s net FDI surplus, from $46 billion
in 2006 to $11 billion last year.6 At the same time, global FDI in ASEAN has been on the rise, increasing from just
over $300 billion in 2003 to over $1.5 trillion in 2013 (see Figure 1).
However, China contributed a mere 2.3 percent of total FDI into ASEAN in 2013. According to MOFCOM,
ASEAN accounted for 6.7 percent of China’s global outbound investment stock at year-end 2013, a total of $35.7
billion. The actual rate is likely quite a bit higher when taking into account investments not notified to the Chinese
authorities in order to avoid administrative red tape; investments originating in Hong Kong; reinvestments by
companies already based overseas; and other technical issues regarding investment reporting. * For several
countries, the value of certain deals is already much larger than the totals reported by MOFCOM. Even so, it is fair
to say Chinese outbound investment in ASEAN is still early-stage.
* China’s Ministry of Commerce (MOFCOM) publishes FDI figures that differ from the investment flows recorded by the State
Administration of Foreign Exchange (SAFE), a subsidiary of the central bank that publishes China’s international investment position
(IIP) on a quarterly basis. MOFCOM’s FDI statistics have been problematic because they are based largely on administrative project
approvals and often only track the first (predominately Hong Kong), and not final, destination for outflows. For further discussion, see
Daniel Rosen and Thilo Hanemann, New Realities in the U.S.-China Investment Relationship (Rhodium Group, April 29, 2014).
http://rhg.com/notes/newrealities-in-the-us-china-investment-relationship.
2003 2008 2013 2003 2008 2013 2003 2008 2013
World (US$ bn) 413$ 1,132$ 1,949$ 438$ 1,429$ 2,211$ 852$ 2,561$ 4,160$
ASEAN 11.46% 10.34% 10.23% 7.06% 7.99% 11.04% 9.19% 9.03% 10.66%
Non-ASEAN Asian economies 45.07% 36.88% 32.06% 39.22% 30.19% 32.07% 42.06% 33.15% 32.06%
Hong Kong 2.70% 1.14% 0.83% 17.41% 13.35% 17.41% 10.27% 7.95% 9.64%
New Zealand 0.25% 0.17% 0.42% 0.18% 0.18% 0.19% 0.21% 0.17% 0.30%
Taiwan 11.95% 9.13% 8.03% 2.06% 1.81% 1.84% 6.86% 5.05% 4.74%
Korea 10.45% 9.91% 9.39% 4.59% 5.17% 4.13% 7.43% 7.27% 6.59%
Australia 1.77% 3.21% 5.05% 1.43% 1.56% 1.70% 1.59% 2.29% 3.27%
Japan 17.96% 13.32% 8.33% 13.56% 8.13% 6.80% 15.70% 10.42% 7.52%
China's Largest Trade Partners 21.06% 18.94% 19.12% 37.54% 38.15% 31.97% 29.54% 29.66% 25.95%
United States 8.20% 7.20% 7.83% 21.10% 17.66% 16.67% 14.84% 13.03% 12.52%
EU 12.86% 11.74% 11.29% 16.44% 20.50% 15.30% 14.70% 16.63% 13.42%
Rest of World 22.40% 33.84% 38.60% 16.19% 23.67% 24.92% 19.20% 28.16% 31.33%
TotalExportsImports

U.S.-China Economic and Security Review Commission 7
Figure 1: World and Chinese FDI Stock in ASEAN
(US$ trillions; share %)
Source: Chinese FDI in Asia figures from China Ministry of Commerce, via CEIC database; world FDI in ASEAN from the United
Nations Conference on Trade and Development statistics (UNCTAD STAT).
In many respects, Singapore is an outlier. As Table 3 demonstrates, the city-state has received the lion’s share of
Chinese FDI (41 percent by the end of 2013). As a global financial powerhouse with a sophisticated economy, it is
also the only ASEAN member that (according to official Chinese statistics at least) has made substantial investments
in mainland China. In 2013, Singapore FDI in China was $7.2 billion (over 6 percent of the world total). Table 4
shows cumulative FDI in China by ASEAN members for the 2002–2013 period. With the exception of Singapore,
ASEAN investment flowing into China is very small, and in the case of low-income countries, barely noticeable.
Table 3: Stock of Chinese FDI in ASEAN Countries
(US$ millions)
Source: China Ministry of Commerce, via CEIC database.
0.0%
0.5%
1.0%
1.5%
2.0%
2.5%
-
0.5
1.0
1.5
2.0
2003 2005 2007 2009 2011 2013
World China's share of World total
2003 2008 2013
Brunei 0.1$ 7$ 72$
Singapore 165$ 3,335$ 14,751$
Indonesia 54$ 543$ 4,657$
Malaysia 101$ 361$ 1,668$
Thailand 151$ 437$ 2,472$
The Philippines 9$ 87$ 692$
Burma 10$ 500$ 3,570$
Cambodia 59$ 391$ 2,849$
Laos 9$ 305$ 2,771$
Vietnam 29$ 522$ 2,167$
High-Income
Low-Income
Middle-Income

U.S.-China Economic and Security Review Commission 8
Table 4: Estimated Cumulative Utilized FDI to China, 2002–2013
(US$ millions)
Source: China Ministry of Commerce, via CEIC database.
Note: Cumulative data are the sum of annual data and do not reflect disinvestment or current value.
Future Prospects
The coming years could mark a turning point in the ASEAN-China relationship. ASEAN members are shifting from
complementing to competing with China’s economic activity, expanding their exports to Western markets while
attracting foreign investment from multinational corporations that in the past turned to China as their preferred site
for low-cost manufacturing. China’s real wages are increasing, in tandem with an aging society, a byproduct of the
One-Child Policy. In parallel, ASEAN’s developing members will experience the rise of a consumer-oriented
middle class, which could shift economic activity from export-oriented manufacturing toward domestic
consumption.
ASEAN could also become a leading service provider to China’s rising middle class. Tourism is an important source
of services exports for many ASEAN countries, particularly Thailand. In 2012 (latest data available) Chinese
tourists made up the second-largest group visiting ASEAN countries, totaling just under ten million visitors (10.4
percent of total tourism), while the United States was seventh with just under three million visitors (3.3 percent).7
Any benefits from trade must be weighed against tensions in the security realm. China is involved in territorial
disputes in the South China Sea with five ASEAN members: Brunei, Indonesia, Malaysia, the Philippines, and
Vietnam.* At the same time, through new initiatives and institutions, the Chinese leadership has revealed a bold
new vision for the Asia Pacific. First, China has spearheaded the establishment of two institutions that might change
the calculus for foreign investment in ASEAN: the New Development Bank (NDB), and the Asian Infrastructure
Investment Bank (AIIB). The NDB has an initial capital of $50 billion, and may prove to be highly beneficial to
developing countries if it provides funding for basic services, emergency assistance, policy lending, and funding to
conflict-affected states. The NDB aims to improve electricity, transport, telecommunications, and water and
sewage—areas of major shortage in many developing countries. 8 The AIIB will have a mandate to fund
infrastructure projects to promote regional connectivity and economic cooperation.9
China has a much larger say in the workings of both banks than in other multilateral lending institutions such as the
World Bank—which can have far-reaching implications for the future of ASEAN-China relations. Nine ASEAN
members have joined the AIIB, with Indonesia, the lone holdout, expected to join soon. Some observers expect the
NDB to follow Chinese investment practices and focus less on improving environment, social development, and
governance in a lender country—ultimately propagating corruption in countries such as Burma and Cambodia.10
China wants to develop two massive, interconnected trade and infrastructure networks: the land-based “Silk Road
Economic Belt,” stretching from Xi’an to Venice, Italy, and the “21st Century Maritime Silk Road,” which swings
* For more information, see U.S. China Economic and Security Review Commission, 2013 Annual Report to Congress, November 2013,
pp. 266-269. http://www.uscc.gov/Annual_Reports/2013-annual-report-congress.
share of
World total
share of
Asia total
Brunei 2,535.7$ 0.24% 0.37%
Singapore 47,152$ 4.39% 6.91%
Indonesia 1,290$ 0.12% 0.19%
Malaysia 4,082$ 0.38% 0.60%
Thailand 1,761$ 0.16% 0.26%
The Philippines 1,845$ 0.17% 0.27%
Burma 74$ 0.01% 0.01%
Cambodia 141$ 0.01% 0.02%
Laos 39$ 0.00% 0.01%
Vietnam 37$ 0.00% 0.01%
High-Income
Middle-Income
Low-Income
U.S.-China Economic and Security Review Commission 9
in a giant loop from Venice through the Indian Ocean, ultimately reaching China’s southeastern Fujian Province
via the Taiwan Strait. The success of China’s plan depends on support from its Asian neighbors, ASEAN in
particular. This makes resolving the maritime territorial disputes a pressing matter, and China has been using its
vast financial resources to reassure its neighbors and win support. For example, in 2010, China launched the China-
ASEAN Investment Cooperation Fund (“CAF”), which has a mandate to support infrastructure projects. And most
recently, at the November 2014 China-ASEAN Summit held in Burma, Chinese Premier Li Keqiang announced
$20 billion in loans for regional infrastructure development.11 At the same summit, Premier Li dubbed the next ten
years a “diamond decade” for China-ASEAN relations.12
At the November 2014 Asia-Pacific Economic Cooperation (APEC) Summit, China also got all APEC members to
officially endorse the Free Trade Area of the Asia-Pacific (FTAAP). Although FTAAP demonstrates China’s
commitment to a free trade area that includes the United States, it is unclear whether China would accede to the
high standards the United States has required of its TPP counterparts. Indeed, China’s pursuit of FTAAP could
detract from U.S. efforts to complete TPP, as most key economies in the region would be involved in both
negotiations.
If FTAAP does proceed, China’s strategy in those talks could be shaped by the numerous bilateral agreements it is
currently pursuing. Whereas ACFTA is a basic trade agreement that does little beyond reducing tariffs and rules-
of-origin requirements for goods shipments, China’s recent agreements with advanced economies do significantly
more. Last year, China completed bilateral FTAs with South Korea and Australia, providing these countries with
preferential access to its market in specific areas, such as information technology and retail services.* The U.S.-
China bilateral investment treaty (BIT) talks, which commenced in summer 2013, could also give some indication
to whether and how China will accede to the high-standard provisions under negotiation in the TPP. The China-
Canada BIT, signed in September 2012, does not include certain provisions the United States would like to see,
such as pre-establishment national treatment of foreign companies entering China.13
An emerging domain of ASEAN-China trade, less influenced by trade agreements, is fuel and mineral resources.
Singapore, located between the Indian Ocean and Northeast Asia, serves as a hub for the Asian energy market, with
substantial port and refinery infrastructure. Indonesia is not a major oil producer, but is able to service China’s
growing demand for liquefied natural gas, high-quality coal, and biofuels. For several other countries in the bloc,
fuels account for a significant share of goods shipments to China; some of these statistics may reflect processed
fuels originally imported as crude oil from the Middle East and Africa. The bloc is also home to a range of
nonferrous metals, such as nickel and copper, of which China is now the largest consumer. Mining activity is taking
place in some of ASEAN’s poorest regions, such as Cambodia and Burma.
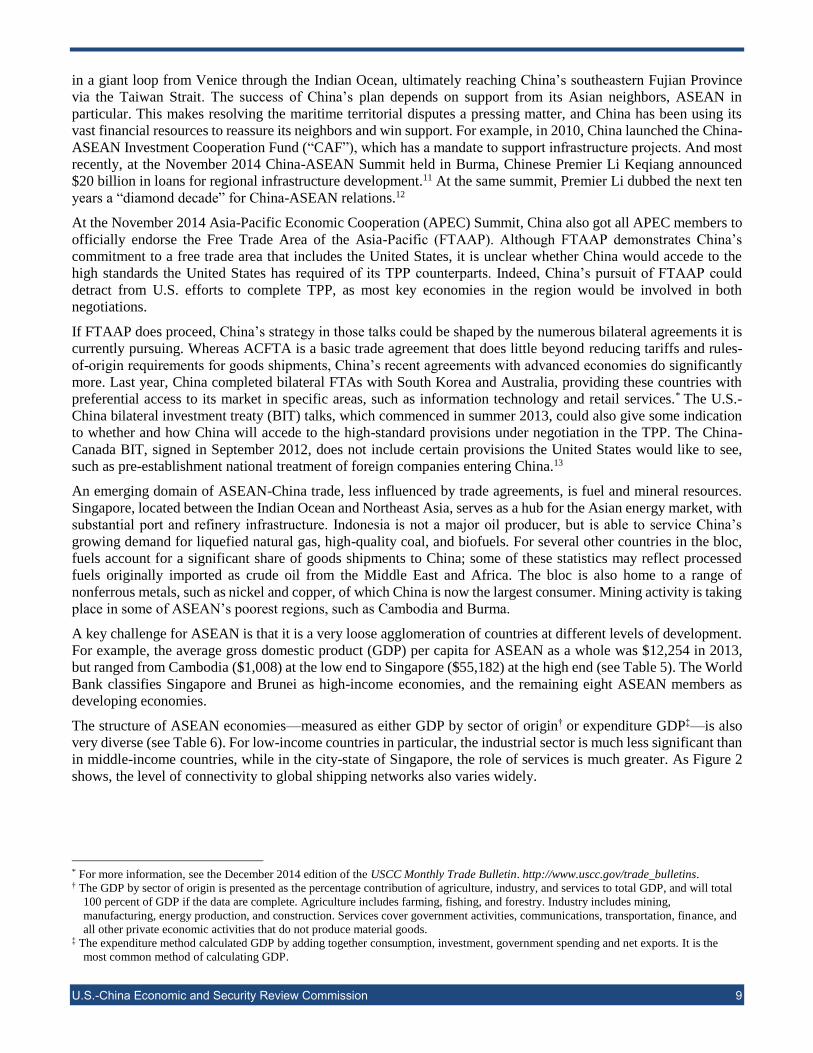
A key challenge for ASEAN is that it is a very loose agglomeration of countries at different levels of development.
For example, the average gross domestic product (GDP) per capita for ASEAN as a whole was $12,254 in 2013,
but ranged from Cambodia ($1,008) at the low end to Singapore ($55,182) at the high end (see Table 5). The World
Bank classifies Singapore and Brunei as high-income economies, and the remaining eight ASEAN members as
developing economies.
The structure of ASEAN economies—measured as either GDP by sector of origin† or expenditure GDP‡—is also
very diverse (see Table 6). For low-income countries in particular, the industrial sector is much less significant than
in middle-income countries, while in the city-state of Singapore, the role of services is much greater. As Figure 2
shows, the level of connectivity to global shipping networks also varies widely.
* For more information, see the December 2014 edition of the USCC Monthly Trade Bulletin. http://www.uscc.gov/trade_bulletins. † The GDP by sector of origin is presented as the percentage contribution of agriculture, industry, and services to total GDP, and will total
100 percent of GDP if the data are complete. Agriculture includes farming, fishing, and forestry. Industry includes mining,
manufacturing, energy production, and construction. Services cover government activities, communications, transportation, finance, and
all other private economic activities that do not produce material goods. ‡ The expenditure method calculated GDP by adding together consumption, investment, government spending and net exports. It is the
most common method of calculating GDP.
U.S.-China Economic and Security Review Commission 10
Table 5: GDP per Capita by ASEAN Country
(current US$)
Source: World Bank.
Table 6: ASEAN Country GDP Composition
Source: U.S. Central Intelligence Agency (CIA).
Note: Estimates for 2012 or 2013, depending on country.
2003 2008 2013
Brunei 18,542 37,094 38,563
Singapore 23,574 39,722 55,182
Indonesia 1,076 2,178 3,475
Malaysia 4,427 8,460 10,514
Thailand 2,212 4,118 5,779
The Philippines 1,016 1,921 2,765
Cambodia 360 743 1,008
Laos 360 887 1,646
Myanmar n.a. n.a. n.a.
Vietnam 531 1,165 1,911
High-Income
Middle-Income
Low-Income
Agriculture Industry Services
Brunei 1% 71% 28%
Singapore 0% 29% 71%
Indonesia 14% 47% 39%
Malaysia 11% 41% 48%
Thailand 12% 44% 44%
The Philippines 11% 32% 57%
Burma 38% 20% 42%
Cambodia 35% 24% 41%
Laos 25% 32% 37%
Vietnam 19% 39% 42%
High-Income
Low-Income
Middle-Income

U.S.-China Economic and Security Review Commission 11
Figure 2: Liner Shipping Connectivity Index: China, ASEAN, and Major Asian Economies
(2004 maximum average = 100)*
Source: World Bank.
Adding to ASEAN members’ economic heterogeneity are their political differences. ASEAN members present a
mix of democratic and authoritarian regimes. They are far from achieving the common borders, mutual defense,
fiscal pacts, and monetary union that Europe enjoys through the European Union (EU), eurozone, and North Atlantic
Treaty Organization (NATO). ASEAN’s consensus-based approach to diplomacy—referred to as the “ASEAN
way”—often results in agreements that are diluted or ineffectual. This begins to matter more as China’s economic
and strategic engagement with ASEAN deepens; China prefers to resolve territorial disputes and other difficult
issues either bilaterally or through “divide and conquer” tactics. Nonetheless, ASEAN members united in May 2014
to jointly express “serious concerns” about China’s aggressive behavior in the South China Sea.14
* The Liner Shipping Connectivity Index captures how well countries are connected to global shipping networks. It is computed by the
United Nations Conference on Trade and Development (UNCTAD) based on five components of the maritime transport sector: number
of ships, their container-carrying capacity, maximum vessel size, number of services, and number of companies that deploy container
ships in a country's ports. For each component a country's value is divided by the maximum value of each component in 2004, the five
components are averaged for each country, and the average is divided by the maximum average for 2004 and multiplied by 100. The
index generates a value of 100 for the country with the highest average index in 2004. The underlying data come from Containerisation
International Online.
-
50
100
150
200
2005 2010 2014

U.S.-China Economic and Security Review Commission 12
High-Income ASEAN Countries
Brunei
Although Brunei is a small country, it has strategic importance. China has emphasized the millennia-old relationship
between the two countries, and has sought to leverage economic ties to secure the Brunei sultanate’s backing of
Chinese interests in Southeast Asia.15 Maritime territorial disputes present a challenge to the bilateral relationship,
as Brunei and China both lay claim to the Louisa Reef, a small atoll in the South China Sea. However, Brunei’s
sultanate has not occupied any of the territory and, according to some experts, tends to downplay the issue with
Beijing by focusing on multilateral mechanisms for dispute resolution.16
Brunei’s oil-based economy has created one of the wealthiest populations in the world. The country’s nominal GDP
per capita ranked 27th in the world in 2013, and fifth in terms of purchasing power parity (PPP).17 According to
World Bank data, from 2003 to 2013, Brunei recorded average real GDP growth of 0.90 percent, akin to advanced
economies and far below the overall ASEAN pace. Net exports account for 45 percent of Brunei’s GDP, a higher
share than either consumption (40 percent) or fixed investment (15 percent).18 Crude oil and natural gas production
comprise 60 percent of Brunei’s GDP and more than 90 percent of its exports.19
In terms of energy security, Brunei could become a significant provider of oil and gas to China’s energy-intensive
economy. China became the world’s largest net oil importer in 2013, and is actively seeking ways to diversify its
imports and secure energy closer to home. Energy shipments from Brunei do not pass through the Malacca Straits,
a maritime chokepoint for China-bound shipments from the Middle East and Africa.
Outside the energy sector, the two countries have taken preliminary steps to strengthen the commercial relationship
in agriculture. China and Brunei signed a Memorandum of Understanding (MOU) on agricultural cooperation in
2012, and in 2014, Brunei and Guangxi Province inked an MOU to supply halal-certified foods into the Chinese
market. 20 The latter agreement reflects China’s growing interest in purchasing premium meat products from
overseas.
Brunei ran a bilateral trade deficit with China in 2013 after enjoying a surplus for most of the preceding decade (see
Table 8). But counter to China’s importance for other ASEAN countries, it is not among Brunei’s top trade partners,
as Table 7 demonstrates. Japan and South Korea, like China major energy consumers, together account for over
half of Brunei’s total goods exports. Even among import partners, China ranks only fourth, behind Malaysia (21.9
percent), Singapore (19.1 percent), and the United States (11.9 percent). This likely reflects Brunei’s exclusion from
the regional production networks that form the backbone of China’s trade with the ASEAN region.
Table 7: Brunei Top Export and Import Partners, 2013
Source: World Bank.
Value
(US$ m)
Share
(%)
Value
(US$ m)
Share
(%)
1 Japan 4,553$ 39.8% 1 Malaysia 792$ 21.9%
2 South Korea 1,867$ 16.3% 2 Singapore 690$ 19.1%
3 India 864$ 7.5% 3 US 431$ 11.9%
4 Australia 836$ 7.3% 4 China 406$ 11.2%
5 Vietnam 602$ 5.3% 5 Japan 209$ 5.8%
Other 2,725$ 23.8% Other 1,084$ 30.0%
Total 11,447$ 100.0% Total 3,612$ 100%
Exports Imports

U.S.-China Economic and Security Review Commission 13
Table 8: China’s Goods Trade with Brunei
(US$ millions)
2003 2004 2005 2006 2007 2008 2009 2010 2011 2012 2013
export 34 48 53 100 113 130 248 368 744 1,252 1,704
import 311 251 208 215 242 83 282 639 562 356 87
balance -277 -204 -155 -116 -129 47 -34 -272 183 897 1,617
Source: China Ministry of Commerce, via CEIC database.
Fuels accounted for 96 percent of Brunei’s exports to the world in 2013 (see Figure 3), and likewise, for 92 percent
of the country’s exports to China. On the import side, Brunei relies disproportionately on China as a source of basic
manufactures. The country’s top imports from China in 2013 were mechanical and electric goods (32 percent),
metals (24 percent), plastic or rubber (12 percent), and textiles and clothing (6 percent). Brunei’s imports from other
countries include a larger percentage of transport equipment, food, and other miscellaneous goods.
Figure 3: Breakdown of Brunei’s Trade with the World, 2013
Exports Imports
Source: World Bank.
fuels96%
mach and elec24%
metals13%
transport.13%
food8%
fuels8%
other34%

U.S.-China Economic and Security Review Commission 14
Figure 4: Breakdown of Brunei’s Trade with China, 2013
Exports Imports
Source: World Bank.
Chinese data show Chinese FDI in Brunei has increased from $130,000 in 2003 to over $72 million in 2013 (see
Table 9). However, Chinese FDI still accounted for less than 1 percent of total FDI in Brunei in 2013. The only
investment of note came in February 2014, when petrochemical giant Zhejiang Hengyi Group Co. formed a 70-30
joint venture with Damai Holdings Limited, a wholly owned subsidiary of Strategic Development Capital Fund
(SDCF), a Brunei government trust sub-fund to undertake the Oil Refinery and Aromatics Cracker Plant Project at
Pulau Muara Besar. According to China’s Xinhua news agency, Hengyi Industries is planning the investment,
construction, operations and maintenance of an Integrated Oil Refinery and Aromatics Cracker plant on Pulau
Muara Besar. The investment for Phase 1 of the project is expected to amount to approximately $4 billion, creating
about 780 job opportunities in the country.21
Table 9: Stock of Chinese FDI in Brunei
(US$ millions)
2003 2004 2005 2006 2007 2008 2009 2010 2011 2012 2013
0.1 0.1 2 2 4 7 17 46 66 66 72
Source: China Ministry of Commerce, via CEIC database.
Singapore
Like Brunei, Singapore is a small and wealthy ASEAN member. At just over 5.3 million people, it has the bloc’s
second-smallest population, and with GDP per capita of $55,182 in 2013, well above the World Bank’s high-income
group threshold. At the same time, Singapore’s economy is more dynamic and diversified than Brunei’s. Real GDP
growth averaged 6.2 percent from 2003 through 2013, among the highest rates in the Asia region.
With a trade-to-GDP ratio around 300 percent, the city-state relies heavily on commerce. It is one of the largest
trading centers in the world, as well as an important transit site for energy shipments from the Middle East to
Northeast Asia. Singapore’s container port is the world’s second-largest behind Shanghai.22 Singapore is a prolific
signatory of trade agreements, and was among the first countries to sign a bilateral FTA with China. Inked in 2008,
it complemented the ACFTA, to which Singapore is also a party, underscoring the strength of the Singapore-China
commercial and diplomatic relationship.23 At the same time, Singapore has transitioned toward services, which
fuels92%
chemicals7%
mach and elec32%
metals24%
plastic or
rubber12%
misc7%
textiles6%
other19%

U.S.-China Economic and Security Review Commission 15
contributed 71 percent of GDP in 2013.24 Singapore specializes in wealth management and is a leader in human
resources, though it still exports certain electronics and chemicals manufactures.
Unlike most ASEAN members, Singapore is a substantial investor in China, a trend that dates back to the early
period of China’s market opening in the 1980s. Between 2003 and 2013, cumulative Singapore FDI in China stood
at $44 billion, accounting for fully 41 percent of all ASEAN investment. In 2013 alone, Singapore invested $7.2
billion, 6 percent of China’s total inflows. Singapore is investing in China across various industries: Logistics,
finance, electronic information, equipment manufacturing, chemicals, automobiles and motorcycles, consumer
services, and pharmaceuticals. As China’s industrial activity migrates inland, Singaporean firms are also shifting
their investments toward western Chinese cities such as Chengdu and Chongqing.25
Singapore is collaborating with China on important infrastructure projects as well. In 2007, for example, the two
countries initiated the Sino-Singapore Tianjin Eco-city project, intended to serve as an example of sustainable, eco-
friendly urbanization.26 They have collaborated to build up Datansha Island in the provincial capital of Guangzhou,
and to develop the Sino-Singapore Guangzhou Knowledge City, which seeks to attract knowledge-based industries
to China.27
Though Singapore keeps a diverse portfolio of trade partners, China is its second-largest export and largest import
partner (see Table 10). Malaysia is the other major trade partner, largely as a function of geographic proximity. The
United States is Singapore’s fifth-largest export partner, accounting for nearly 6 percent of exports, valued at $23.9
billion.
Table 10: Singapore Export and Import Partners, 2013
Source: World Bank.
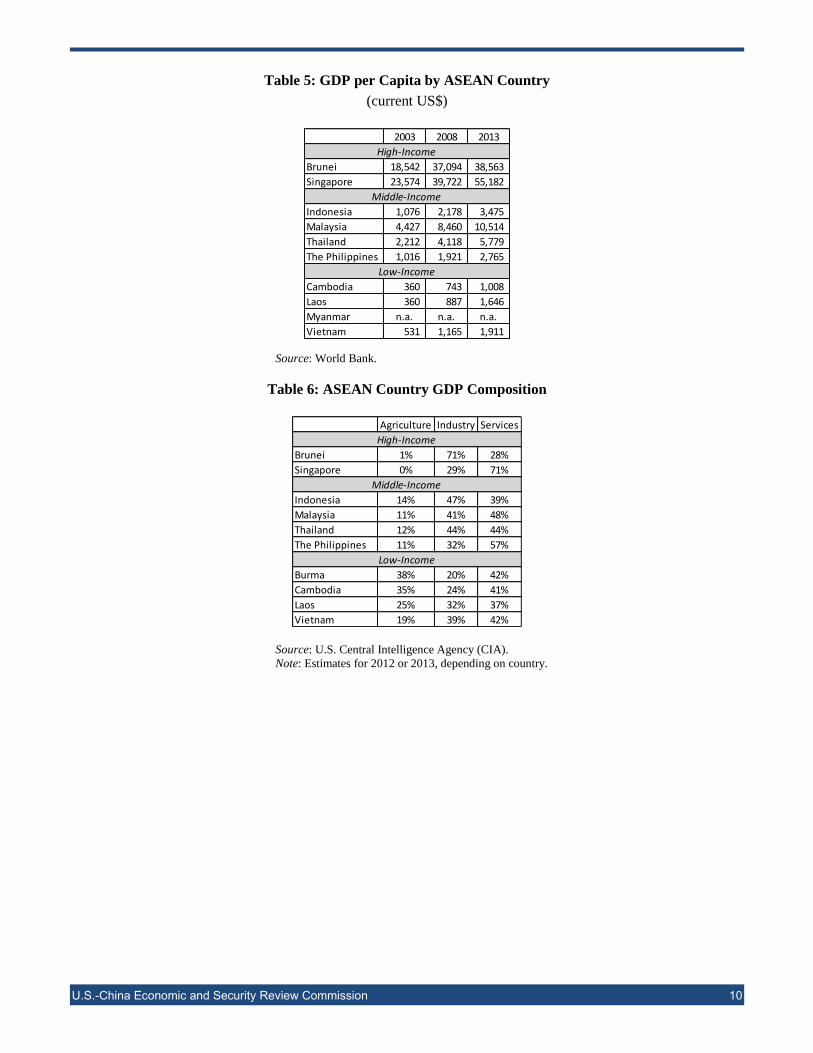
Due to Singapore’s role as an energy transit hub, about one-third of its imports and exports consist of fuels and
petrochemicals (see Figure 5). These products, however, play less of a role in Singapore’s trade with China, over
half of which—on both the export and import sides—consists of machinery and electrical products (see Figure 6),
mirroring Singapore’s overall trade composition.
Value
(US$ m)
Share
(%)
Value
(US$ m)
Share
(%)
1 Malaysia 49,912$ 12.2% 1 China 43,689$ 11.7%
2 China 48,369$ 11.8% 2 Malaysia 40,829$ 10.9%
3 Hong Kong 45,829$ 11.2% 3 US 38,856$ 10.4%
4 Indonesia 40,546$ 9.9% 4 Other Asia 28,987$ 7.8%
5 US 23,945$ 5.8% 5 South Korea 24,030$ 6.4%
Other 201,649$ 49.2% Other 196,625$ 52.7%
Total 410,250$ 100% Total 373,016$ 100%
Exports Imports
U.S.-China Economic and Security Review Commission 16
Figure 5: Breakdown of Singapore’s Trade with the World, 2013
Exports Imports
Source: World Bank.
Figure 6: Breakdown of Singapore’s Trade with China, 2013
Exports Imports
Source: World Bank.
Singapore temporarily reduced its growing goods trade deficit with China during the global financial crisis in 2009–
2010. Since then, however, its bilateral deficit has expanded at a rapid rate, to a new high of $15.9 billion in 2013
(see Table 11).
Table 11: China’s Goods Trade with Singapore
(US$ millions)
2003 2004 2005 2006 2007 2008 2009 2010 2011 2012 2013
export 8,873 12,695 16,716 23,188 29,680 32,325 30,089 32,374 35,586 40,874 45,886
import 10,486 14,002 16,531 17,675 17,520 20,092 17,737 24,680 27,859 28,517 29,969
balance -1,613 -1,306 186 5,513 12,159 12,233 12,353 7,694 7,727 12,357 15,918
Source: China Ministry of Commerce, via CEIC database.
mach and elec43%
fuels18%
misc13%
chemicals9%
plastic or
rubber4%
other13%
mach and elec38%
fuels32%misc
6%
chemicals5%
metals4% other
15%
mach and elec54%fuels
11%plastic
or rubber
10%
chemicals10%
misc8%
other7%
mach and elec61%
fuels9%
metals9%
misc5%
chemicals4% other
12%
U.S.-China Economic and Security Review Commission 17
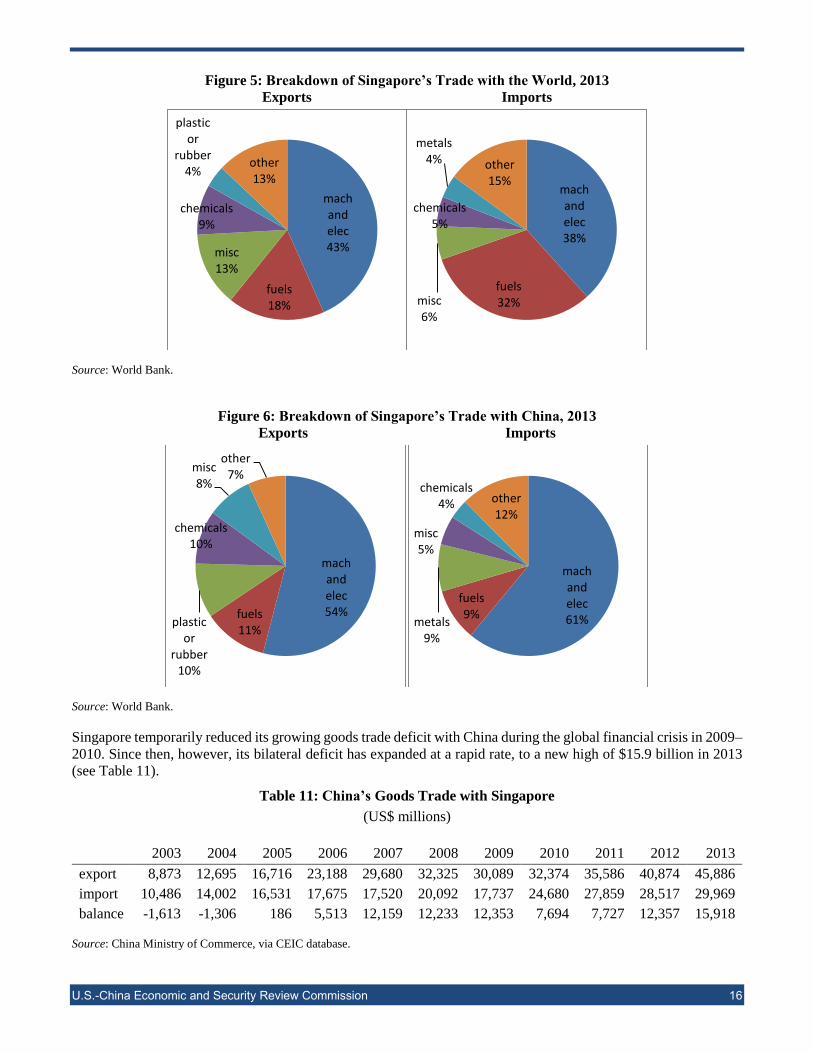
As Table 12 shows, from 2003 through 2013, Chinese FDI in Singapore grew from just under $165 million to over
$14 billion. Though China still accounted for a fraction of total FDI in Singapore in 2013, the upward trend is
impressive, as Chinese FDI in Singapore more than tripled from 2009 to 2013. In addition, it is very likely that
some FDI flows registered by Chinese authorities as going to Singapore are actually destined for other ASEAN
countries.
Table 12: Stock of Chinese FDI in Singapore
(US$ millions)
2003 2004 2005 2006 2007 2008 2009 2010 2011 2012 2013
165 233 325 468 1,444 3,335 4,857 6,069 10,603 12,383 14,751
Source: China Ministry of Commerce, via CEIC database.
Data from the Heritage Global Investment Tracker suggests that China’s initial investments in Singapore, dating
from 2006 to 2011, were concentrated in energy, transport, and shipping. More recently, the biggest deals have been
in the real estate sector. Commercial property developers China Vanke and Shandong Bright Ruby, as well as the
internet services giant Alibaba, acquired properties in 2013-2014. 28 As one of the safest places in Asia to invest
capital, Singapore has become an attractive means for wealthy Chinese individuals to diversify their assets beyond
the Mainland’s volatile property and stock markets. Singapore is central to the boom in China’s outbound real estate
investment, which is also manifest in cities such as Hong Kong, London, Los Angeles, and New York.29
As a center of Asian and global finance, Singapore is an attractive destination for Chinese companies seeking to list
on the Singapore stock exchange.30 Singapore’s two sovereign wealth funds, Temasek Holdings and Government
of Singapore Investment Corp., have made several investments in coordination with China’s sovereign wealth fund,
China Investment Corp.* The Monetary Authority of Singapore completed a massive RMB 300 billion ($48.3
billion) bilateral currency swap agreement with the People’s Bank of China (PBOC) in 2010, one of the first such
swaps between the PBOC and a foreign government.31
Middle-Income ASEAN Countries
Indonesia
Of ASEAN’s 602 million residents, roughly 250 million live in Indonesia, the most populous country in the bloc.
In nominal GDP terms, Indonesia is the largest economy in ASEAN. Together with China and India, Indonesia is
one of only three developing economies in Asia that are members of the Group of 20 (G20). The country’s real
GDP growth averaged 5.8 percent from 2003 through 2012, the fourth highest of all ASEAN members.32 However,
Indonesia remains a relatively poor country: According to World Bank, GDP per capita was $3,475 in 2013, placing
it on the higher end of lower-middle-income countries. Indonesia struggles with poverty and unemployment,
inadequate infrastructure, corruption, a complex regulatory environment, and unequal resource distribution among
regions.33 At 13 percent of GDP, agriculture retains a large share of overall economic activity, while services
account for smaller share of GDP than industry.34
Indonesia’s trade-to-GDP ratio of 43 percent is one of the lowest in the ASEAN bloc. Unlike most of its neighbors,
Indonesia runs a goods trade deficit with the world. China represents Indonesia’s second-largest export market and
its largest source of imports (see Table 13). Along with Japan and Singapore, it is the primary contributor to
Indonesia’s trade deficit. This was not always the case: Table 14 shows the transition of Indonesia’s trade balance
* For additional analysis, see Iacob Koch-Weser and Owen Haake, China Investment Corporation: Recent Developments in Performance,
Strategy, and Governance (U.S.-China Economic and Security Review Commission, June 2013). http://www.uscc.gov.

U.S.-China Economic and Security Review Commission 18
with China from a surplus to a deficit, starting in 2007. Imports from China rose steadily from over $4 billion in
2003 to $12.6 billion in 2007, and increased to almost $37 billion in 2013.
Table 13: Indonesian Export and Import Partners, 2013
Source: World Bank.
Table 14: China’s Goods Trade with Indonesia
(US$ millions)
2003 2004 2005 2006 2007 2008 2009 2010 2011 2012 2013
export 4,482 6,257 8,349 9,453 12,609 17,210 14,744 21,978 29,263 34,293 36,947
import 5,754 7,212 8,430 9,610 12,380 14,387 13,538 20,760 31,323 32,033 31,479
balance -1,272 -955 -81 -157 229 2,823 1,206 1,219 -2,059 2,260 5,469
Source: China Ministry of Commerce, via CEIC database.
The composition of trade between China and Indonesia resembles a resources-for-manufactures pattern. Nearly half
of Indonesia’s imports from China are machinery and electrical products, to the extent that China constitutes one-
third of Indonesia’s foreign purchases in this category. Conversely, fuels, metals, wood, and vegetable products
make up three-quarters of Indonesia’s exports to China, compared to 45 percent of its exports to the world. Along
with Australia, Indonesia is a key supplier of coal and liquefied natural gas to China’s energy-intensive coastal
areas, which have difficulty accessing fuel inputs from China’s northwestern regions. One could also group
Indonesia with China’s principal commodity suppliers in Africa and Latin America.
Value
(US$ m)
Share
(%)
Value
(US$ m)
Share
(%)
1 Japan 27,086$ 14.8% 1 China 29,849$ 16.0%
2 China 22,601$ 12.4% 2 Singapore 25,581$ 13.7%
3 Singapore 16,686$ 9.1% 3 Japan 19,284$ 10.3%
4 US 15,741$ 8.6% 4 Malaysia 13,322$ 7.1%
5 India 13,031$ 7.1% 5 South Korea 11,592$ 6.2%
Other 87,407$ 47.9% Other 87,001$ 46.6%
Total 182,552$ 100% Total 186,629$ 100%
Exports Imports

U.S.-China Economic and Security Review Commission 19
Figure 7: Breakdown of Indonesia’s Trade with the World, 2013
Exports Imports
Note: Veg = Vegetables.
Source: World Bank.
Figure 8: Breakdown of Indonesia’s Trade with China, 2013
Exports Imports
Note: Veg = Vegetables.
Source: World Bank.
Indonesia has taken a mixed approach to economic diplomacy with China. On one hand, it has signed bilateral trade
agreements with South Korea and Japan but not with China, suggesting—like India—a preference for closer trade
relations with China’s wealthier neighbors. When the United States, the EU, and Japan filed separate WTO dispute
cases against China in March 2012 concerning its export restrictions on rare earth minerals, tungsten, and
molybdenum, Indonesia joined each of these complaints as a third party.35 Concurrently, Jakarta has signed
numerous MOUs with Beijing, including bilateral cooperation in the energy and mineral sectors (2006), intellectual
property rights (2013), and a fishery partnership (2013).36
Chinese outbound FDI into Indonesia has growth over the past decade (see Table 15), as China went from a net
receiver to a net sender of FDI to Indonesia. The Heritage Global Investment Tracker, which traces individual
Chinese investments, identifies dozens of Chinese investments and contracts in Indonesia between 2005 and 2014,
with a combined worth of some $31 billion. 37 That is far in excess of the investment values MOFCOM has recorded.
fuels31%
veg13%
mach and elec9%
textiles7%
plastic or
rubber7%
other33%
fuels25%
mach and elec24%
metals10%
chemicals9%
transport.6%
other26%
fuels37%
minerals16%
veg14%
plastic or
rubber9%
wood8%
other16%
mach and elec47%
metals12%
chemicals11%
textiles8%
plastic or
rubber4%
other18%

U.S.-China Economic and Security Review Commission 20
Of this value, approximately $12 billion went into the coal, gas, and oil sectors, and a further $6.6 billion into the
steel sector, demonstrating the resource-seeking motives of Chinese investors in Indonesia.38
Table 15: Stock of Chinese FDI in Indonesia
(US$ millions)
2003 2004 2005 2006 2007 2008 2009 2010 2011 2012 2013
54 122 141 226 679 543 799 1,150 1,688 3,098 4,657
Source: China Ministry of Commerce, via CEIC database.
In conjunction with direct investment, China is becoming an important lender to Indonesia, a net debtor country. In
2009, when a crash in coal prices nearly sunk Bumi Resources, one of China’s largest coal producers, China’s
sovereign wealth fund CIC stepped in with a $1.9 billion loan.39 Rumors circulated in 2011 that CIC would disburse
$4 billion in additional loans to Indonesian infrastructure projects, though it appears this money was not
transferred.40 During President Xi’s visit to Indonesia in October 2013, however, Indonesian firms secured deals
worth some $33 billion. That included a $1.8 billion loan from China Development Bank, China’s policy bank, to
PT OKI Pulp & Paper Mills to build a mill in Sumatra, as well as funding for five Boeing 777-300ER planes for PT
Garuda Indonesia.41
Malaysia
Malaysia’s economy has performed well over the past decade. Real GDP growth averaged 5 percent between 2003
and 2013, catapulting the country to the higher end of upper-middle-income countries, and behind only Singapore
and Brunei in terms of wealth among ASEAN members. Trade has been an important part of Malaysia’s success—
the country’s trade-to-GDP ratio is over 150 percent, and net exports contributed 8.9 percent of GDP in 2013.42
With top-five trade partners making up less than half of the country’s total goods trade, Malaysia is not reliant on
any one trade partner. The United States is a top-five partner, but two-thirds of Malaysian trade takes place in the
Asia region. Once integral to Japan’s “flying geese” manufacturing operations in Southeast Asia, Malaysia now
trades considerably more with China than with Japan (see Table 17). Whether or not Malaysia runs a trade surplus
with China depends on the data one references. According to MOFCOM, Malaysia was one of only two ASEAN
members to achieve a surplus with China in 2013 (the other was Thailand), and as Table 16 shows, Malaysia’s
surplus with China grew from $7.8 billion in 2003 to $14 billion in 2013. World Bank data, on the other hand,
indicates Malaysia registered a goods trade deficit with China of nearly $3.3 billion in 2013 (see Table 17).
Table 16: China’s Goods Trade with Malaysia
(US$ millions)
2003 2004 2005 2006 2007 2008 2009 2010 2011 2012 2013
exports 6,142 8,085 10,618 13,540 17,702 21,383 19,636 23,820 27,910 36,529 45,941
imports 13,998 18,162 20,108 23,577 28,737 32,131 32,224 50,396 62,026 58,253 60,068
balance -7,856 -10,077 -9,490 -10,037 -11,036 -10,748 -12,589 -26,577 -34,115 -21,723 -14,128
Source: China Ministry of Commerce, via CEIC database.

U.S.-China Economic and Security Review Commission 21
Table 17: Malaysia Export and Import Partners, 2013
Source: World Bank.
Malaysia is deeply integrated into regional supply chains. Machinery and electrical products accounted for 48
percent of its exports and 57 percent of its imports in 2013 (see Figure 9). This pattern is magnified in Malaysia’s
trade with China. An interesting aspect of Malaysia’s trade is its export of fuel products. The country only produced
640,000 barrels per day (bpd) in 2013, less than 1 percent of global supplies. By comparison, neighboring Indonesia
produced 942,000 bpd, and China 4.46 million bpd. Yet, fuels accounted for 22 percent of Malaysian exports to the
world, and 11 percent of its exports to China.
Figure 9: Breakdown of Malaysia’s Trade with the World, 2013
Exports Imports
Source: World Bank.
Value
(US$ m)
Share
(%)
Value
(US$ m)
Share
(%)
1 Singapore 31,872$ 13.9% 1 China 33,774$ 16.4%
2 China 30,785$ 13.5% 2 Singapore 25,459$ 12.3%
3 Japan 25,318$ 11.1% 3 Japan 17,913$ 8.7%
4 US 18,461$ 8.1% 4 US 16,204$ 7.9%
5 Thailand 16,675$ 7.3% 5 Thailand 12,294$ 6.0%
Other 105,404$ 46.1% Other 100,606$ 48.8%
Total 228,515$ 100% Total 206,250$ 100%
Exports Imports
mach and elec37%
fuels22%
veg8%plastic
or rubber
7%
metals5%
other21%
mach and elec43%
plastic or
rubber12%
veg11%
fuels11%
metals8%
other15%

U.S.-China Economic and Security Review Commission 22
Figure 10: Breakdown of Malaysia’s Trade with China, 2013
Exports Imports
Source: World Bank.
Malaysia has been among China’s top ASEAN trading partners since 2008, and the two countries’ leaders have
pledged to deepen trade and economic cooperation. During the November 2014 APEC leaders’ meeting in Beijing,
China’s President Xi Jinping called for the two sides to build industrial parks in Qinzhou (a city in China’s Guangxi
Province) and Kuantan (the capital of Pahang, the third-largest state in Malaysia) as “flagship projects” for China-
Malaysia cooperation and models for China-ASEAN cooperation.43 President Xi further called for enhanced
bilateral cooperation on law enforcement and safety, and people-to-people exchanges. To facilitate bilateral trade
and investment, Malaysia and China extended their bilateral currency swap agreement in 2012, increasing the total
value from RMB 80 billion ($12.7 billion) to RMB 180 billion ($28.6 billion).44
Chinese FDI stock in Malaysia, according to official statistics, is much smaller than in Indonesia, and has grown at
a lower rate (see Table 18). This trend is substantiated by data from Heritage Global Investment Tracker: Chinese
investments and contracts in Malaysia are fewer in number and amount to only about half the value ($16 billion in
Malaysia, versus $31 billion in Indonesia). 45 Nonetheless, China is making some investments in Malaysian steel,
aluminum, and palm oil processing plants, and is also expanding a port in a new industrial zone on the Malaysian
east coast.46 Other ventures include Chinese state-owned conglomerate Greenland Holding Group’s plan to invest
$3.25 billion in two property projects.47
Table 18: Stock of Chinese FDI in Malaysia
(US$ millions)
2003 2004 2005 2006 2007 2008 2009 2010 2011 2012 2013
101 123 187 197 275 361 480 709 798 1,026 1,668
Source: China Ministry of Commerce, via CEIC database.
For years, Malaysia was one of the few ASEAN countries that invested more in China than China invested in it.
Flows of Malaysian FDI into China grew from $251 million in 2003 to over $400 million in 2009, at which point
the trend reversed. By 2013, flows of Malaysian FDI in China stood at $280 million, while flows of Chinese FDI
into Malaysia reached a new high of $616 million. One of Malaysia’s major deals in China took place in 2011 in
the telecommunications sector, where Malaysia’s Digi Telecommunications supplied network infrastructure to ZTE
Corp., a state-owned telecommunications giant that competes with Huawei Technologies Co. Ltd.48
mach and elec43%
plastic and
rubber12%
veg11%
fuels11%
metals8%
other15%
mach and elec56%
metals13%
chemicals6%
misc6%
plastic or
rubber3%
other16%
U.S.-China Economic and Security Review Commission 23
Thailand
Thailand, the fourth most populous country and second-largest economy in ASEAN, is classified by the World
Bank as an upper-middle-income country. According to World Bank, its GDP per capita of $5,779 was the fourth
highest among ASEAN countries in 2013. And yet, Thailand over the past decade recorded the second-lowest GDP
growth rate of all ASEAN members (only Brunei was lower). The Thai economy has been particularly susceptible
to external economic shocks. The 1997–1998 Asian financial crisis precipitated bank runs and enormous capital
outflows. Buoyed by strong exports and a prudent monetary policy, Thailand regained economic stability in the
early 2000s, but the global economic recession severely cut Thai exports, with most sectors experiencing double-
digit drops. In late 2011, Thailand's recovery was interrupted by severe flooding in the industrial areas in Bangkok
and its five surrounding provinces, to the detriment of the manufacturing sector.49
With a trade-to-GDP ratio of 139 percent in 2013, Thailand—like Malaysia—is a very open economy.50 A unique
aspect of Thai trade is the export of services, particularly tourism. This likely explains why Thailand runs a trade
deficit in goods with the world, but according to the World Bank and CIA World Factbook, achieves net exports of
goods and services (as measured by expenditure GDP).
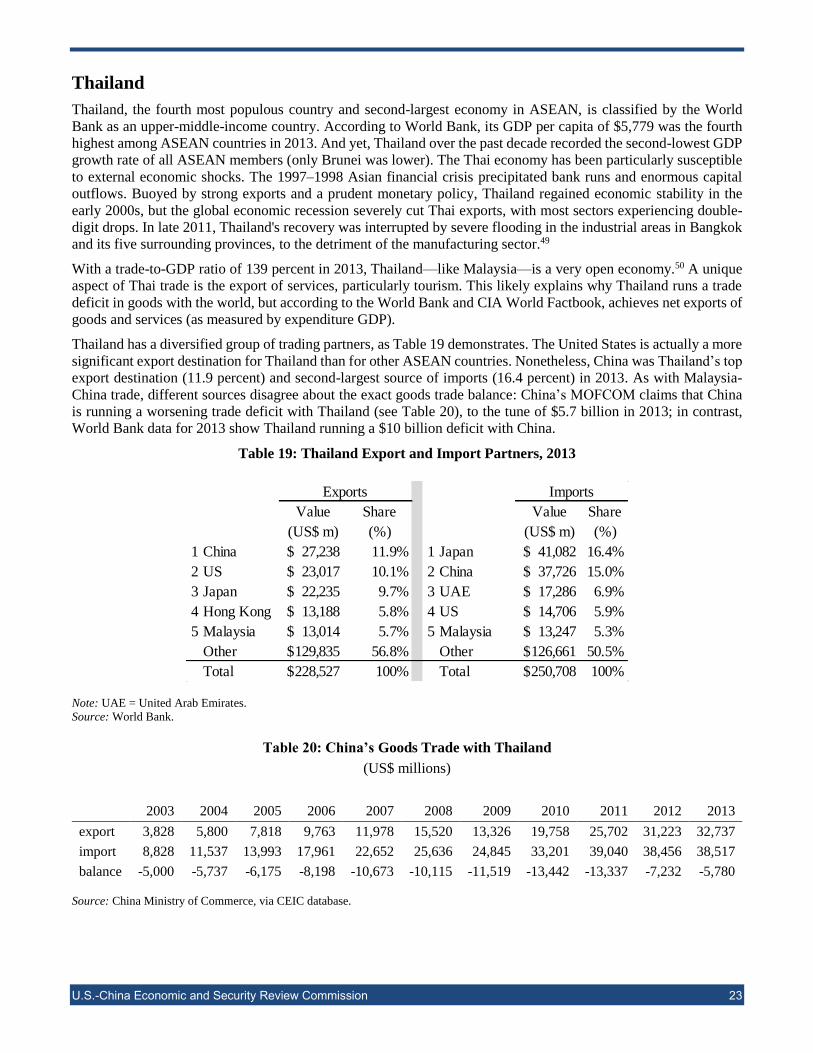
Thailand has a diversified group of trading partners, as Table 19 demonstrates. The United States is actually a more
significant export destination for Thailand than for other ASEAN countries. Nonetheless, China was Thailand’s top
export destination (11.9 percent) and second-largest source of imports (16.4 percent) in 2013. As with Malaysia-
China trade, different sources disagree about the exact goods trade balance: China’s MOFCOM claims that China
is running a worsening trade deficit with Thailand (see Table 20), to the tune of $5.7 billion in 2013; in contrast,
World Bank data for 2013 show Thailand running a $10 billion deficit with China.
Table 19: Thailand Export and Import Partners, 2013
Note: UAE = United Arab Emirates.
Source: World Bank.
Table 20: China’s Goods Trade with Thailand
(US$ millions)
2003 2004 2005 2006 2007 2008 2009 2010 2011 2012 2013
export 3,828 5,800 7,818 9,763 11,978 15,520 13,326 19,758 25,702 31,223 32,737
import 8,828 11,537 13,993 17,961 22,652 25,636 24,845 33,201 39,040 38,456 38,517
balance -5,000 -5,737 -6,175 -8,198 -10,673 -10,115 -11,519 -13,442 -13,337 -7,232 -5,780
Source: China Ministry of Commerce, via CEIC database.
Value
(US$ m)
Share
(%)
Value
(US$ m)
Share
(%)
1 China 27,238$ 11.9% 1 Japan 41,082$ 16.4%
2 US 23,017$ 10.1% 2 China 37,726$ 15.0%
3 Japan 22,235$ 9.7% 3 UAE 17,286$ 6.9%
4 Hong Kong 13,188$ 5.8% 4 US 14,706$ 5.9%
5 Malaysia 13,014$ 5.7% 5 Malaysia 13,247$ 5.3%
Other 129,835$ 56.8% Other 126,661$ 50.5%
Total 228,527$ 100% Total 250,708$ 100%
Exports Imports

U.S.-China Economic and Security Review Commission 24
Thailand’s trade with China is quite distinctive. Taken together, machinery and electrical products, plastic or rubber,
and chemicals accounted for fully two-thirds of Thai exports to China in 2013, compared to scarcely 45 percent of
its exports to the world. On the other hand, transport equipment plays almost no role in Thai exports to China, even
though it is an important component of its shipments to the world.
Figure 11: Breakdown of Thailand’s Trade with the World, 2013
Exports Imports
Source: World Bank.
Figure 12: Breakdown of Thailand’s Trade with China, 2013
Exports Imports
Source: World Bank.
Thailand’s large agricultural sector should provide it with commercial opportunities as China’s new urban consumer
class develops a taste for higher-quality fruits and vegetables from overseas. However, China’s own agricultural
interests constitute an impediment to free trade between the two countries. China signed a special agreement with
Thailand in 2003 to eliminate tariffs on fruits and vegetables under the Early Harvest program within ACFTA.51
However, the agreement also includes numerous exemptions and phase-outs that protect both Thai and Chinese
farmers, who are each wary of being outcompeted in specific subsectors.
mach and elec29%
plastic or
rubber13%
transport.13%
food8%
fuels6%
other31%
mach and elec27%
fuels21%metals
12%stone and glass8%
transport.8%
other24%
plastic or
rubber34%
mach and elec21%
chemicals12%
veg10%
fuels9%
other14%
mach and elec50%
metals13%
chemicals8%
transport.5%
misc5%
other19%
U.S.-China Economic and Security Review Commission 25
Thailand has acted as a third party to eight WTO trade disputes involving China. Of the eight disputes, however,
only five involved claims against China. Thailand has twice supported Chinese claims regarding steel products: a
2002 complaint against the United States concerning safeguard measures against imports of certain steel products;
and a 2006 claim against some European communities on antidumping measures on certain iron or steel fasteners
from China. Thailand also supported China’s 2011 complaint regarding U.S. antidumping measures on shrimp and
diamond sawblades from China.52
The five cases in which Thailand supported complaints against China involved a diverse array of industries.
U.S. complaint against China regarding imports of automobile parts, and Canada’s same claim against
China, filed a few weeks after the original U.S. complaint (2006);
U.S. complaint against China on lack of protection and enforcement of intellectual property rights (2011);
EU complaint against China on antidumping duties on x-ray security inspection equipment from the EU
(2011);
U.S. complaint on Chinese antidumping and countervailing duty measures on broiler products from the
United States (2011).53
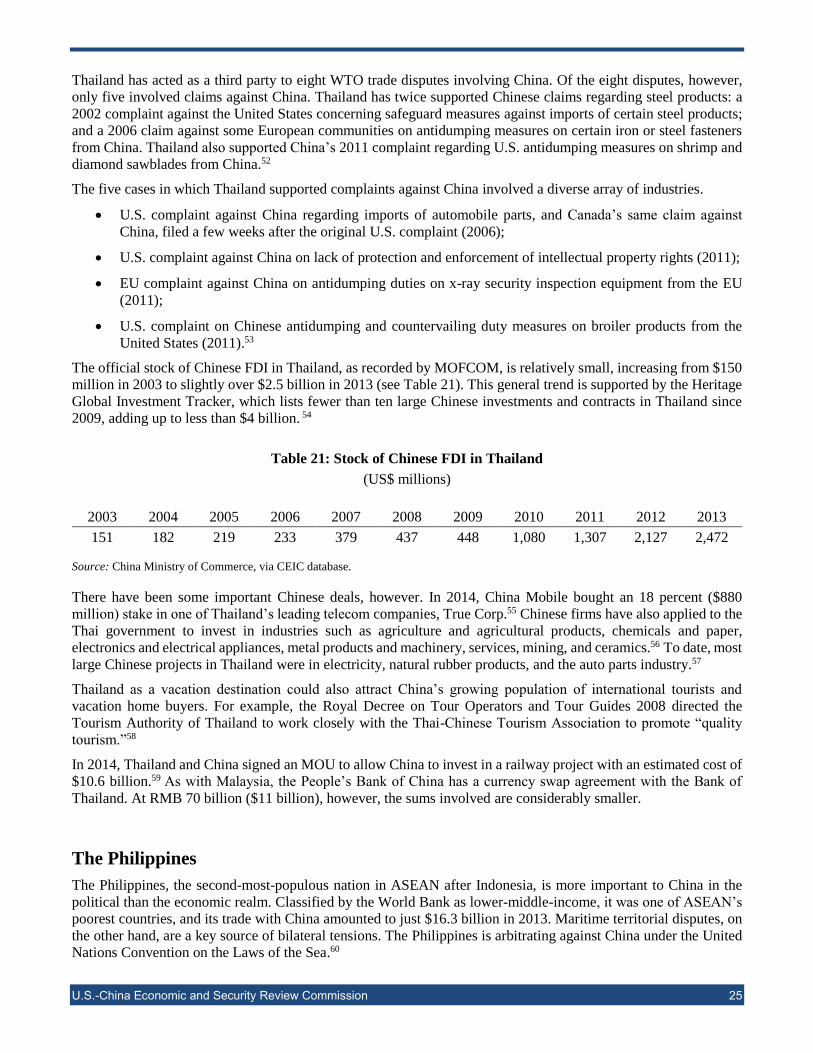
The official stock of Chinese FDI in Thailand, as recorded by MOFCOM, is relatively small, increasing from $150
million in 2003 to slightly over $2.5 billion in 2013 (see Table 21). This general trend is supported by the Heritage
Global Investment Tracker, which lists fewer than ten large Chinese investments and contracts in Thailand since
2009, adding up to less than $4 billion. 54
Table 21: Stock of Chinese FDI in Thailand
(US$ millions)
2003 2004 2005 2006 2007 2008 2009 2010 2011 2012 2013
151 182 219 233 379 437 448 1,080 1,307 2,127 2,472
Source: China Ministry of Commerce, via CEIC database.
There have been some important Chinese deals, however. In 2014, China Mobile bought an 18 percent ($880
million) stake in one of Thailand’s leading telecom companies, True Corp.55 Chinese firms have also applied to the
Thai government to invest in industries such as agriculture and agricultural products, chemicals and paper,
electronics and electrical appliances, metal products and machinery, services, mining, and ceramics.56 To date, most
large Chinese projects in Thailand were in electricity, natural rubber products, and the auto parts industry.57
Thailand as a vacation destination could also attract China’s growing population of international tourists and
vacation home buyers. For example, the Royal Decree on Tour Operators and Tour Guides 2008 directed the
Tourism Authority of Thailand to work closely with the Thai-Chinese Tourism Association to promote “quality
tourism.”58
In 2014, Thailand and China signed an MOU to allow China to invest in a railway project with an estimated cost of
$10.6 billion.59 As with Malaysia, the People’s Bank of China has a currency swap agreement with the Bank of
Thailand. At RMB 70 billion ($11 billion), however, the sums involved are considerably smaller.
The Philippines
The Philippines, the second-most-populous nation in ASEAN after Indonesia, is more important to China in the
political than the economic realm. Classified by the World Bank as lower-middle-income, it was one of ASEAN’s
poorest countries, and its trade with China amounted to just $16.3 billion in 2013. Maritime territorial disputes, on
the other hand, are a key source of bilateral tensions. The Philippines is arbitrating against China under the United
Nations Convention on the Laws of the Sea.60

U.S.-China Economic and Security Review Commission 26
Nonetheless, the two countries have signed a multitude of MOUs and other agreements spanning over 20 sectors,
including in defense, energy cooperation, and maritime issues.61 In a 2004 MOU, China and the Philippines agreed
to intensify the level of exchanges of their defense official and military officers, and to strengthen cooperation on
defense and military security issues.62
The Philippine economy is driven by consumption, which accounted for 84.1 percent of GDP in 2013 (close to the
United States’ high levels). The Philippines ran a goods trade deficit equivalent to 9 percent of total trade in 2013,
a high figure by ASEAN standards. According to the World Bank, the industrial sector accounted for only 32
percent of Philippine GDP in 2013, considerably lower than for fellow middle-income countries Indonesia,
Malaysia, and Thailand.
Unlike in most ASEAN countries, Philippine exports are quite concentrated among the top-five trade partners (64.5
percent), and Japan remains a larger trade partner than China (see Table 22). The Philippine balance of trade with
China deteriorated in 2013, going from a decade of surplus to a $1.6 billion deficit (see Table 23). This stands in
contrast to the country’s surplus with the Asia region as a whole.
Table 22: Philippine Export and Import Partners, 2013
Source: World Bank.
Table 23: China’s Goods Trade with the Philippines
(US$ millions)
2003 2004 2005 2006 2007 2008 2009 2010 2011 2012 2013
export 3,094 4,264 4,689 5,737 7,505 9,088 8,590 11,564 14,259 16,772 19,836
import 6,309 9,062 12,870 17,676 23,128 19,507 11,935 16,199 17,995 19,677 18,204
balance -3,215 -4,797 -8,181 -11,938 -15,623 -10,419 -3,345 -4,634 -3,736 -2,905 1,631
Source: China Ministry of Commerce, via CEIC database.
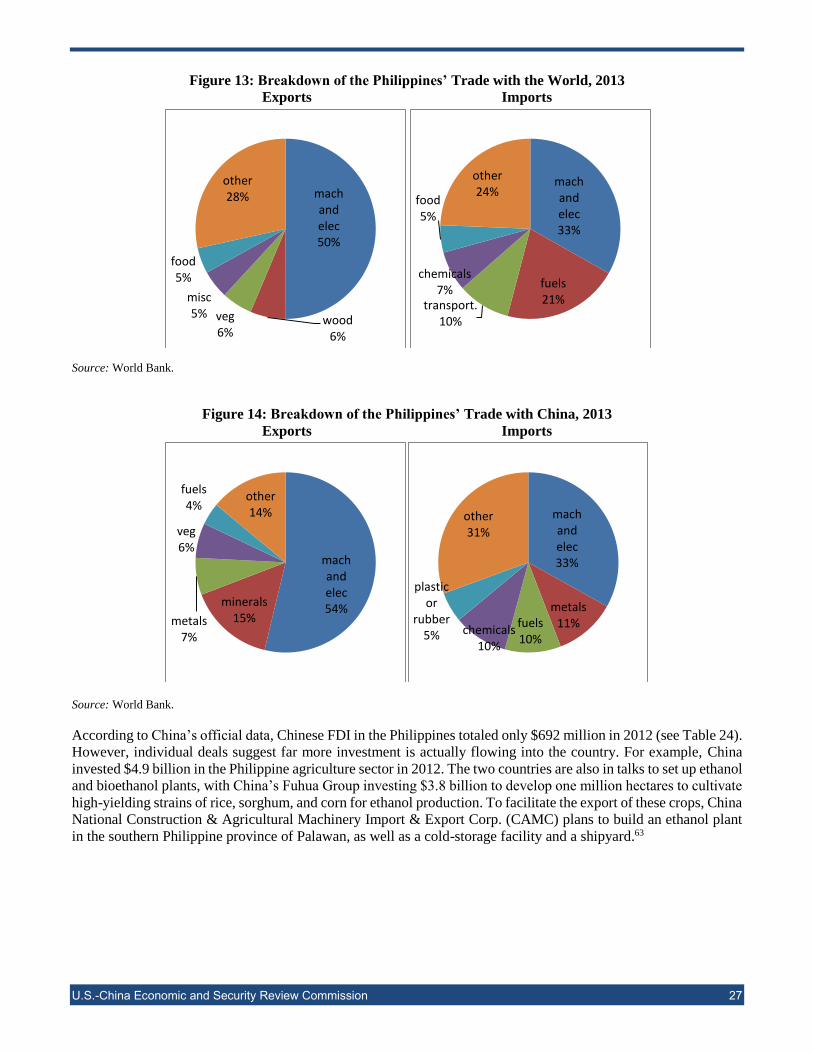
Metals, minerals, vegetable products, and fuels account for 32 percent of Philippine exports to China, a higher share
than for its exports to the world. Ascribing a resources-for-manufactures pattern to Philippine-China trade, however,
is exaggerated. Machinery and electrical products accounted for the largest portion of Philippine exports in 2013,
followed by shipments of food, agriculture, and wood products. This same pattern was reflected in its trade with
China (see Figures 13 and 14), though China is unique for its large purchases of Philippine minerals.
Value
(US$ m)
Share
(%)
Value
(US$ m)
Share
(%)
1 Japan 11,423$ 21.2% 1 China 8,554$ 13.1%
2 US 7,832$ 14.5% 2 US 7,081$ 10.9%
3 China 6,582$ 12.2% 3 Japan 5,586$ 8.6%
4 Hong Kong 4,418$ 8.2% 4 Other Asia 5,120$ 7.9%
5 Singapore 4,014$ 7.4% 5 South Korea 5,026$ 7.7%
Other 19,709$ 36.5% Other 33,730$ 51.8%
Total 53,978$ 100% Total 65,097$ 100%
Exports Imports
U.S.-China Economic and Security Review Commission 27
Figure 13: Breakdown of the Philippines’ Trade with the World, 2013
Exports Imports
Source: World Bank.
Figure 14: Breakdown of the Philippines’ Trade with China, 2013
Exports Imports
Source: World Bank.
According to China’s official data, Chinese FDI in the Philippines totaled only $692 million in 2012 (see Table 24).
However, individual deals suggest far more investment is actually flowing into the country. For example, China
invested $4.9 billion in the Philippine agriculture sector in 2012. The two countries are also in talks to set up ethanol
and bioethanol plants, with China’s Fuhua Group investing $3.8 billion to develop one million hectares to cultivate
high-yielding strains of rice, sorghum, and corn for ethanol production. To facilitate the export of these crops, China
National Construction & Agricultural Machinery Import & Export Corp. (CAMC) plans to build an ethanol plant
in the southern Philippine province of Palawan, as well as a cold-storage facility and a shipyard.63
mach and elec50%
wood6%
veg6%
misc5%
food5%
other28%
mach and elec33%
fuels21%transport.
10%
chemicals7%
food5%
other24%
mach and elec54%
minerals15%metals
7%
veg6%
fuels4%
other14% mach
and elec33%
metals11%fuels
10%chemicals
10%
plastic or
rubber5%
other31%

U.S.-China Economic and Security Review Commission 28
Table 24: Stock of Chinese FDI in the Philippines
(US$ millions)
2003 2004 2005 2006 2007 2008 2009 2010 2011 2012 2013
9 10 19 22 43 87 143 387 494 593 692
Source: China Ministry of Commerce, via CEIC database.
Considering its status as a lower-middle-income country, the Philippines has actually made investments in mainland
China. The investors include the snack food company Oishi, the San Miguel brewery, and real estate businesses
like Ding Feng Real Estate Co., which specializes in mixed-use developments such as condominiums, shopping
malls, and hotels.64
Low-Income ASEAN Countries
Vietnam
Vietnam, ASEAN’s third-most-populous nation, is a lower-income country. The GDP share of agriculture is still
quite high at 19 percent, and the industrial sector accounts for only 39 percent of GDP.65 But Vietnam is poised to
break into the middle-income group and mature into a manufactures-based economy. The country achieved robust
growth averaging 6.4 percent between 2003 and 2013, the fourth highest among ASEAN countries. In 2013, real
GDP grew by 5.4 percent.66
The diplomatic relationship between China and Vietnam has suffered due to China’s aggressive territorial claims
in the South China Sea and memories of the 1979 Sino-Vietnamese War. At the same time, the two governments
share an affinity as socialist market economies, in addition to deep cultural ties. In late 2013, Hanoi and Beijing
signed an MOU to increase trade and economic cooperation by creating four new economic zones along the
Vietnam-China border by 2020. Other Vietnam-China MOUs cover such topics as human trafficking, educational
exchanges, and nuclear exchanges. The Vietnam National University of Agriculture, in particular, has more than
15 agreements with Chinese universities on student exchange and educational programming.67
Vietnam’s trade with China is very imbalanced by ASEAN standards. On the export side, China was only Vietnam’s
third-largest partner in 2012 (11 percent) (latest data available, see Table 25). The United States (17 percent) and
Japan (12 percent) accounted for a much larger share. On the other hand, China is by far Vietnam’s largest import
partner, comprising 26 percent of Vietnamese imports in 2012, well ahead of South Korea (14 percent) and Japan
(10 percent). Thus, while Vietnam runs a trade surplus with the rest of the world, it has a large and growing trade
deficit with China, which amounted to $31 billion in 2013 (see Table 26).

U.S.-China Economic and Security Review Commission 29
Table 25: Vietnam Export and Import Partners, 2012
Source: World Bank.
Table 26: China’s Goods Trade with Vietnam
(US$ millions)
2003 2004 2005 2006 2007 2008 2009 2010 2011 2012 2013
export 3,180 4,260 5,639 7,468 11,906 15,139 16,303 23,122 29,091 34,225 48,599
import 1,455 2,478 2,549 2,486 3,214 4,343 4,741 6,970 11,108 16,230 16,886
balance 1,725 1,782 3,090 4,982 8,691 10,797 11,562 16,151 17,983 17,995 31,714
Source: China Ministry of Commerce, via CEIC database.
Vegetable products and fuels account for 40 percent of Vietnamese exports to China, versus 21 percent to the world.
Not surprisingly, textiles and footwear account for less than 10 percent of exports to China, versus 23 percent to the
world. Conversely, machinery and electronic products and textiles account for a larger share of Vietnamese imports
from China than from elsewhere.
Figure 15: Breakdown of Vietnam’s Trade with the World, 2012
Exports Imports
Source: World Bank.
Value
(US$ m)
Share
(%)
Value
(US$ m)
Share
(%)
1 US 19,680$ 17.2% 1 China 29,034$ 25.5%
2 Japan 13,064$ 11.4% 2 South Korea 15,535$ 13.7%
3 China 12,835$ 11.2% 3 Japan 11,602$ 10.2%
4 South Korea 5,580$ 4.9% 4 Other Asia 8,534$ 7.5%
5 Malaysia 4,500$ 3.9% 5 Singapore 6,690$ 5.9%
Other 58,870$ 51.4% Other 42,385$ 37.3%
Total 114,529$ 100% Total 113,780$ 100%
Exports Imports
mach and elec24%
textiles16%
veg11%
fuels10%
footwear7%
other32%
mach and elec31%
metals12%fuels
10%textiles
10%
chemicals9%
other28%

U.S.-China Economic and Security Review Commission 30
Figure 16: Breakdown of Vietnam’s Trade with China, 2012
Exports Imports
Source: World Bank.
In spite of the bilateral trade imbalance, Vietnam has on several occasions supported Chinese complaints in the
WTO as a third party. In all, Vietnam has been involved as a third party to five dispute cases against China, and in
five dispute cases supporting Chinese claims.68 Vietnam has joined China in:
A 2009 complaint against the United States on measures affecting imports of certain passenger vehicle and
light truck tires from China;
A 2010 complaint against the EU on antidumping measures on certain footwear from China;
A 2011 complaint against the United States on antidumping measures on shrimp and diamond sawblades
from China;
A 2012 complaint against the United States on countervailing and antidumping measures on certain
products from China;
A 2013 complaint against the United States concerning certain methodologies and their application to
antidumping proceedings involving China.
Vietnam acted against China in the United States’ 2012 complaint concerning countervailing and antidumping
duties on grain oriented flat-rolled electrical steel from the United States, and the aforementioned triple complaint
by the United States, Japan, and the EU concerning measures related to China’s export restrictions on rare earths.
Vietnam is careful to avoid the impression that it is becoming dependent on the Chinese economy. Minister of
Finance Dinh Tien Dung contended in June 2014 that Vietnam was not very dependent on Chinese loans, and that
Chinese investments account for less than 1 percent of Vietnam’s total market capitalization.69 Indeed, given the
size of Vietnam’s economy, it is noteworthy that Chinese FDI stock in the country stood at just $2.2 billion in 2013,
less than China’s FDI stock in Burma, Cambodia, and even Laos (see Table 27).
Table 27: Stock of Chinese FDI in Vietnam
(US$ millions)
2003 2004 2005 2006 2007 2008 2009 2010 2011 2012 2013
29 160 229 254 397 522 729 987 1,291 1,604 2,167
Source: China Ministry of Commerce, via CEIC database.
veg23%
mach and elec19%fuels
17%
plastic or
rubber13%
textiles8%
other20%
mach and elec44%
textiles14%
metals11%
chemicals9%
fuels7%
other15%

U.S.-China Economic and Security Review Commission 31
Chinese investments in Vietnam are concentrated in the garment, textile, and real estate sectors. In 2013, Jiangsu
Julun Textiles Group Co. Ltd. constructed a $68 million manufacturing facility in Vietnam.70 The Hong Kong-
based real estate company Sunwah Group recently invested around $200 million in an apartment building project
in Ho Chi Minh City’s Binh Thanh District, and China’s Texhong Group invested $215 million in a project to
develop infrastructure in Quang Ning Province’s 660-hectare Hai Ha Industrial Park.71
Burma
In 1962, Burma (also known as Myanmar) came under the control of a military dictatorship, leading to international
isolation. In November 2010, the Union Solidarity and Development Party (USDP), a military-backed political
party, held Burma’s first election in over 20 years. Burma became a member of ASEAN in 1997, and in 2014
assumed the rotating chairmanship over ASEAN—an historic departure for a state long considered an international
pariah.72
Burma is classified as low-income by the World Bank (GNI per capita of $1,035 or less in 2012).73 Its real GDP
growth reached double-digits in the mid-2000s, dropped sharply after the global financial crisis, and then recovered
in recent years, to an estimated 6.8 percent in 2013.74 Agriculture amounts to 38 percent of the economy, reflecting
a lack of industrial development. The service sector, accounting for 42 percent of GDP, is centered on mineral
extraction. Trade is a relatively small part of Burma’s economy, equivalent on average to less than 50 percent of
GDP from 2003 through 2011—significantly less than the ASEAN average of 119.2 percent. Starting in 2008,
however, the trend shifted upward, likely owing to Burma’s market opening and ratification of a new constitution
that year.75
Burma runs a very large trade deficit with the world (equivalent to nearly half of its total trade). It also relies heavily
on regional trading partners: Eighty-one percent of its exports and 87 percent of its imports are with partners in
Asia. China is Burma’s largest import partner and second-largest export partner. As bilateral trade has grown,
Burma’s trade deficit with China has expanded from $738 million in 2003 to over $4.5 billion in 2013 (see Table
29). China accounted for 58 percent of Burma’s total trade deficit in 2013.
Table 28: Burma Top Export and Import Partners, 2013
Source: UN Comtrade.
Value
(US$ m)
Share
(%)
Value
(US$ m)
Share
(%)
1 Thailand 4,033$ 37.9% 1 China 7,339$ 39.9%
2 China 2,857$ 26.9% 2 Thailand 3,789$ 20.6%
3 India 1,366$ 12.8% 3 Singapore 2,245$ 12.2%
4 Japan 759$ 7.1% 4 Japan 1,057$ 5.7%
5 South Korea 488$ 4.6% 5 India 743$ 4.0%
Other 1,137$ 10.7% Other 3,234$ 17.6%
Total 10,640$ 100% Total 18,407$ 100%
Exports Imports

U.S.-China Economic and Security Review Commission 32
Table 29: China’s Goods Trade with Burma
(US$ millions)
2003 2004 2005 2006 2007 2008 2009 2010 2011 2012 2013
export 908 939 935 1,207 1,692 1,979 2,279 3,481 4,825 5,675 7,349
import 170 207 274 253 371 645 646 963 1,677 1,299 2,810
balance 738 732 660 955 1,321 1,335 1,634 2,518 3,148 4,376 4,540
Source: China Ministry of Commerce, via CEIC database.
In 2011 (latest data available), Burma’s largest global exports were minerals (44 percent), vegetable and animal
products (21 percent), and wood (14 percent) (see Figure 17). Its exports to China are similarly resource-driven,
though wood accounts for a larger share of the basket. Timber smuggling into China presents a serious threat to
Burma’s virgin forests.76 While Burma depends on foreign markets for most manufactured goods, its imports from
China are concentrated in industrial products, led by machinery and electrical goods (27 percent), transport
equipment (19 percent), textiles (13 percent), and chemicals (5 percent). Whereas textiles account for 12 percent of
Burma’s exports to the world, they barely play any part in its goods shipments to China.
Figure 17: Breakdown of Burma’s Trade with the World, 2011
Exports Imports
Source: UN Comtrade.
minerals
44%
veg16%
wood14%
textiles12%
animal5%
other9%
mach and elec22%
metals14%
transport.13%
minerals9%
textiles9%
other33%

U.S.-China Economic and Security Review Commission 33
Figure 18: Breakdown of Burma’s Trade with China, 2011
Exports Imports
Source: UN Comtrade.
Burma approved $44 billion in inbound foreign investment between 1988 and 2013. The largest share went toward
electricity infrastructure ($19 billion), oil and gas ($13.6 billion), and mining ($2.3 billion).77 Contrary to its
marginal status in most ASEAN countries, China’s outbound FDI is quite pronounced in Burma, accounting for
over 25 percent of the country’s total inflows in 2012 and for a third of all foreign investment Burma approved
between 1988 and 2013.78 MOFCOM records lower figures of Chinese FDI, but nonetheless shows Chinese FDI
stock in Burma doubling from $900 million in 2009 to $1.9 billion in 2010 and over $3.5 billion in 2013 (see Table
30).
Table 30: Stock of Chinese FDI in Burma
(US$ millions)
2003 2004 2005 2006 2007 2008 2009 2010 2011 2012 2013
10 20 24 163 262 500 930 1,947 2,182 3,094 3,570
Source: China Ministry of Commerce, via CEIC database.
Chinese companies have invested extensively in large-scale infrastructure projects in Burma. In the process, they
have incited local opposition on environmental grounds and concerns about the net benefits to local communities.
In 2011, Burmese President Thein Sein halted the construction of a Chinese-backed $3.7 billion hydropower dam
project due to opposition by local Burmese. The dam was to supply electricity to China. In November of the same
year, protests took place to temporarily stop a Chinese-backed copper mine project.79 Talks regarding a multibillion-
dollar railway linking Burma’s west coast with Kunming, a provincial capital in southwest China, have also have
been put on hold.80
A cornerstone of Chinese investment in Burma is the Sino-Burmese pipeline project, which is to ferry Middle
Eastern and African oil and gas overland to China from the Indian Ocean. As part of the project, China agreed in
2010 to loan Burma $2.4 billion.81 However, the project has encountered a number of obstacles, including tensions
between Burmese and Chinese workers and opposition from local communities that feel unjustly compensated for
their loss of land and livelihoods.82
Recently, Sino-Burmese relations have regained momentum. The two countries signed seven MOUs in 2013
concerning hydroelectric dam the construction, which contained provisions on knowledge and technology sharing.83
Other recent MOUs include a clean development management project and an agreement to allow Burmese workers
to work legally in China.84 In 2013, the Burmese Parliament approved a $100 million loan from China to fund a
cooperative program to support Burmese farmers and the urban poor.85 Chinese Premier Li Keqiang paid an official
wood31%
minerals
26%
plastic or
rubber13%
veg11%
animal7%
other12%
mach and elec27%
transport.19%
textiles13%
metals19%
chem5%
other17%

U.S.-China Economic and Security Review Commission 34
visit to Burma last November, leading to twenty new trade deals worth $8 billion, including a $200 million
microcredit loan targeting poverty reduction.86
Cambodia
Demographically and economically, Cambodia is one of the smallest countries in Asia. From 2003 through 2012,
its economy averaged 8 percent growth a year, one of the highest rates in ASEAN, fueled by tourism and the
garment industry. Textile and garment-related industries employ some 400,000 people (in a country of 15 million)
and constitute around 70 percent of Cambodia’s total exports.87 Home to the Angkor Wat temple complex, a UN
World Heritage site, Cambodia typically welcomes over two million tourist visitors per year, and according to the
World Bank, tourism accounted for 23 percent of Cambodian goods and services exports in 2012.
Cambodia is still among the poorest countries in Asia, however, with GDP per capita of $1,008 in 2013.88 It ranks
136 out of 187 countries captured in the United Nations Human Development Index, just ahead of Laos (137) and
Burma (150).89 Economic development is stifled by corruption, income inequality, and lack of employment and
education opportunities. 90 The Cambodian government relies on foreign donors for more than half its fiscal
budget.91 Agriculture accounts for over one-third of GDP and 56 percent of total employment. Only 23 percent of
the economy is composed of industry—the labor-intensive textile industry generates jobs but adds limited value to
GDP.92
Although similar to Burma in terms of level of development, Cambodia’s trade with the world is quite different. Of
all ASEAN members, Cambodia is the least reliant on regional ties, as almost 60 percent of exports go to countries
outside Asia. Indeed, the United States is its top export destination, primarily due to textile shipments (see Table
31). Like most ASEAN members, Cambodia has a steadily growing trade deficit with China, which increased from
$268 million in 2003 to over $3 billion in 2013 (see Table 32).
Table 31: Cambodia Top Export and Import Partners, 2013
Source: World Bank.
Table 32: China’s Goods Trade with Cambodia
(US$ millions)
2003 2004 2005 2006 2007 2008 2009 2010 2011 2012 2013
export 295 452 536 698 881 1,095 905 1,347 2,319 2,706 3,411
import 26 30 27 35 51 39 36 95 185 215 361
balance 268 423 509 663 830 1,056 869 1,253 2,134 2,491 3,050
Source: China Ministry of Commerce, via CEIC database.
Value
(US$ m)
Share
(%)
Value
(US$ m)
Share
(%)
1 US 2,174$ 23.5% 1 China 3,004$ 32.6%
2 Hong Kong 1,587$ 17.2% 2 US 1,125$ 12.2%
3 Singapore 793$ 8.6% 3 Thailand 1,095$ 11.9%
4 UK 718$ 7.8% 4 Vietnam 987$ 10.7%
5 Germany 615$ 6.7% 5 Hong Kong 668$ 7.2%
Other 3,361$ 36.3% Other 2,348$ 25.4%
Total 9,248$ 100% Total 9,227$ 100%
Exports Imports
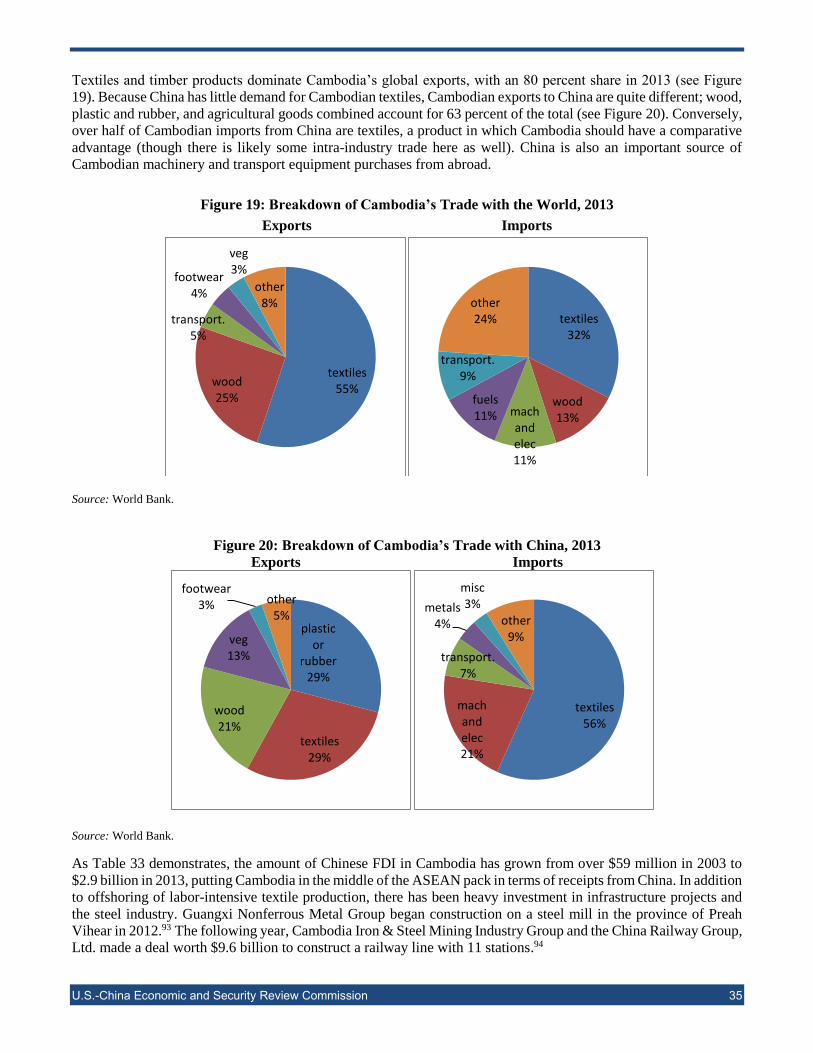
U.S.-China Economic and Security Review Commission 35
Textiles and timber products dominate Cambodia’s global exports, with an 80 percent share in 2013 (see Figure
19). Because China has little demand for Cambodian textiles, Cambodian exports to China are quite different; wood,
plastic and rubber, and agricultural goods combined account for 63 percent of the total (see Figure 20). Conversely,
over half of Cambodian imports from China are textiles, a product in which Cambodia should have a comparative
advantage (though there is likely some intra-industry trade here as well). China is also an important source of
Cambodian machinery and transport equipment purchases from abroad.
Figure 19: Breakdown of Cambodia’s Trade with the World, 2013
Exports Imports
Source: World Bank.
Figure 20: Breakdown of Cambodia’s Trade with China, 2013
Exports Imports
Source: World Bank.
As Table 33 demonstrates, the amount of Chinese FDI in Cambodia has grown from over $59 million in 2003 to
$2.9 billion in 2013, putting Cambodia in the middle of the ASEAN pack in terms of receipts from China. In addition
to offshoring of labor-intensive textile production, there has been heavy investment in infrastructure projects and
the steel industry. Guangxi Nonferrous Metal Group began construction on a steel mill in the province of Preah
Vihear in 2012.93 The following year, Cambodia Iron & Steel Mining Industry Group and the China Railway Group,
Ltd. made a deal worth $9.6 billion to construct a railway line with 11 stations.94
textiles55%
wood25%
transport.5%
footwear4%
veg3%
other8%
textiles32%
wood13%mach
and elec11%
fuels11%
transport.9%
other24%
plastic or
rubber29%
textiles29%
wood21%
veg13%
footwear3% other
5%
textiles56%
mach and elec21%
transport.7%
metals4%
misc3%
other9%
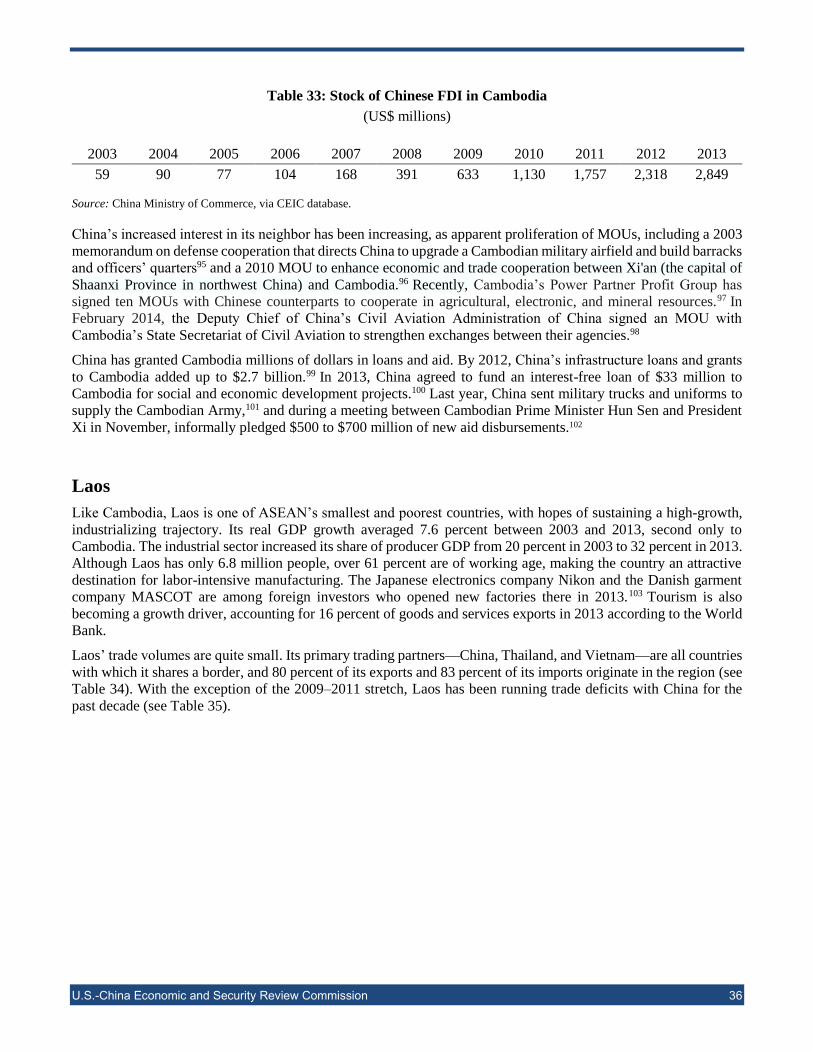
U.S.-China Economic and Security Review Commission 36
Table 33: Stock of Chinese FDI in Cambodia
(US$ millions)
2003 2004 2005 2006 2007 2008 2009 2010 2011 2012 2013
59 90 77 104 168 391 633 1,130 1,757 2,318 2,849
Source: China Ministry of Commerce, via CEIC database.
China’s increased interest in its neighbor has been increasing, as apparent proliferation of MOUs, including a 2003
memorandum on defense cooperation that directs China to upgrade a Cambodian military airfield and build barracks
and officers’ quarters95 and a 2010 MOU to enhance economic and trade cooperation between Xi'an (the capital of
Shaanxi Province in northwest China) and Cambodia.96 Recently, Cambodia’s Power Partner Profit Group has
signed ten MOUs with Chinese counterparts to cooperate in agricultural, electronic, and mineral resources.97 In
February 2014, the Deputy Chief of China’s Civil Aviation Administration of China signed an MOU with
Cambodia’s State Secretariat of Civil Aviation to strengthen exchanges between their agencies.98
China has granted Cambodia millions of dollars in loans and aid. By 2012, China’s infrastructure loans and grants
to Cambodia added up to $2.7 billion.99 In 2013, China agreed to fund an interest-free loan of $33 million to
Cambodia for social and economic development projects.100 Last year, China sent military trucks and uniforms to
supply the Cambodian Army,101 and during a meeting between Cambodian Prime Minister Hun Sen and President
Xi in November, informally pledged $500 to $700 million of new aid disbursements.102
Laos
Like Cambodia, Laos is one of ASEAN’s smallest and poorest countries, with hopes of sustaining a high-growth,
industrializing trajectory. Its real GDP growth averaged 7.6 percent between 2003 and 2013, second only to
Cambodia. The industrial sector increased its share of producer GDP from 20 percent in 2003 to 32 percent in 2013.
Although Laos has only 6.8 million people, over 61 percent are of working age, making the country an attractive
destination for labor-intensive manufacturing. The Japanese electronics company Nikon and the Danish garment
company MASCOT are among foreign investors who opened new factories there in 2013.103 Tourism is also
becoming a growth driver, accounting for 16 percent of goods and services exports in 2013 according to the World
Bank.
Laos’ trade volumes are quite small. Its primary trading partners—China, Thailand, and Vietnam—are all countries
with which it shares a border, and 80 percent of its exports and 83 percent of its imports originate in the region (see
Table 34). With the exception of the 2009–2011 stretch, Laos has been running trade deficits with China for the
past decade (see Table 35).

U.S.-China Economic and Security Review Commission 37
Table 34: Laos Export and Import Partners, 2011
Source: UN Comtrade.
Table 35: China’s Goods Trade with Laos
(US$ millions)
2003 2004 2005 2006 2007 2008 2009 2010 2011 2012 2013
export 98 101 105 169 177 268 268 482 478 934 1,721
import 11 13 26 50 85 149 337 562 803 785 1,021
balance 87 88 80 119 92 119 -68 -80 -326 149 701
Source: China Ministry of Commerce, via CEIC database.
Laos’s primary global exports are natural resources—metals, minerals, and wood—which comprised 76 percent of
the country’s total exports in 2011 (see Figure 21). Natural resources occupy 87 percent of Laos’s exports to China
as well, though within this category, minerals account for an inordinate share (see Figure 22). As in the case of
Cambodia, Laos ships almost no textiles to China, even though this is clearly a sector in which it enjoys a
comparative advantage. As an import partner, China is a dominant provider of heavy manufactures: s machinery
and electrical products and transport equipment make up 37 percent of Laos’s imports from the world, but 66 percent
of its imports from China.
Figure 21: Breakdown of Laos’s Trade with the World, 2011
Exports Imports
Source: UN Comtrade.
Value
(US$ m)
Share
(%)
Value
(US$ m)
Share
(%)
1 China 788$ 33.5% 1 Thailand 2,710$ 66.1%
2 Thailand 667$ 28.4% 2 China 461$ 11.2%
3 Vietnam 429$ 18.3% 3 Vietnam 262$ 6.4%
4 Japan 96$ 4.1% 4 South Korea 154$ 3.8%
5 India 67$ 2.8% 5 Japan 77$ 1.9%
Other 303$ 12.9% Other 436$ 10.6%
Total 2,350$ 100% Total 4,100$ 100%
Exports Imports
metals29%
wood25%
minerals22%
textiles 9%
veg8%
other7%
minerals21%
transport.19%
mach and elec18%
metals9%
food8%
other25%

U.S.-China Economic and Security Review Commission 38
Figure 22: Breakdown of Laos’s Trade with China, 2011
Exports Imports
Source: UN Comtrade.
The stock of Chinese FDI in Laos has grown in the past decade from $9 million in 2003 to $2.8 billion in 2013 (see
Table 36). In 2003, Chinese investment contributed just under 1.5 percent of total FDI in Laos; by 2012, it
contributed 77 percent. China has been investing in major commercial, residential, and tourist ventures such as the
That Luang Lake development project, valued at $1.6 billion.104 Chinese companies are building a railroad between
Yunnan province in the southwest and Vientiane, the capital of Laos. The project, funded by a loan from China to
the Laotian government, is expected to cost $7.2 billion—equivalent to 75 percent of Laos’s GDP.105
Table 36: Stock of Chinese FDI in Laos
(US$ millions)
2003 2004 2005 2006 2007 2008 2009 2010 2011 2012 2013
9 15 33 96 302 305 536 846 1,276 1,928 2,771
Source: China Ministry of Commerce, via CEIC database.
China has made other goodwill gestures toward Laos. In 2013, China agreed to provide Laos $49 million in grant
aid, and $32.6 million in interest-free loans.106 In early July 2014, Laos and China agreed to upgrade the Boten-
Bohan cross-border area into an economic cooperation zone.107 A pressing concern for both countries is human and
drug trafficking in the Golden Triangle. Laos was party to a 2004 human trafficking MOU signed between China
and Burma.108
minerals55%
wood27%
metals10%
plastics 4%
veg3%
other1%
mach and elec47%
transport.19%
metals10%
misc10%
textiles3%
other11%

U.S.-China Economic and Security Review Commission 39
Note on Data This paper relies on two primary sources of data:
Data for countries’ top trading partners and the breakdown of their trade with the world and China (by
product and commodity type) comes from the World Integrated Trade Solution (WITS) database, which
integrates data from the World Bank and the United Nations. In most cases, 2013 was the last year when
comprehensive data was available for all countries.
Data on Chinese FDI and Chinese bilateral trade with each country comes from China Ministry of
Commerce.
Different accounting practices and lagged collection of data have resulted in some discrepancies between official
Chinese government statistics and data available from World Bank or its partners in the WITS database. Every
effort has been made to make note of such discrepancies in the paper. Where necessary, official data has been
supplemented with data from private sources, including research institutions and business consultancies.

U.S.-China Economic and Security Review Commission 40
Endnotes
1 Qi Li, “RCEP: The Opportunity and Countermeasures for China,” Yatai Jingji [Asia-Pacific Economy] 1 (2013): 14-15 [Staff translation]. 2 Office of the United States Trade Representative, "Trans-Pacific Partnership (TPP)." http://www.ustr.gov/tpp. 3 Association of Southeast Asian Nations, "Intra- and Extra-ASEAN Trade, 2013," December 2014.
http://www.asean.org/images/2015/January/external_trade_statistic/table18_asof04Dec14.pdf. 4 Association of Southeast Asian Nations, "Top Ten ASEAN Trade Partner Countries/Regions, 2013," December 2014.
http://www.asean.org/images/2015/January/external_trade_statistic/table20_asof04Dec14.pdf. 5 Ministry of Commerce of People’s Republic of China, “Brief Statistics on China Direct Investment Overseas in 2013,” January 17, 2014.
http://english.mofcom.gov.cn/article/statistic/foreigntradecooperation/201401/20140100464237.shtml. 6 Data from Cushman & Wakefield. 7 Association of Southeast Asian Nations, "Top Ten Country/Regional Sources of Visitors to ASEAN," January 31, 2014.
http://www.asean.org/images/resources/2014/Jan/StatisticUpdate28Jan/Tourism%20Update/Table%2030.pdf. 8 Raj M. Desai and James R. Vreeland, "What the New Bank of BRICS Is All About," Washington Post, July 17, 2014.
http://www.washingtonpost.com/blogs/monkey-cage/wp/2014/07/17/what-the-new-bank-of-brics-is-all-about/. 9 Jonathan Standing, "China Starts Work on $50 Bln Asia Infrastructure Bank," Reuters, March 5, 2014.
http://www.reuters.com/article/2014/03/07/china-bank-idUSL3N0M42NQ20140307. 10 Economist, "An Acronym with Capital," July 19, 2014. http://www.economist.com/news/finance-and-economics/21607851-setting-up-
rivals-imf-and-world-bank-easier-running-them-acronym. 11 Xinhua (English edition), “China Offers over $20 bln Loans for SE Asian Connectivity,” November 14, 2014. 12 Xinhua (English edition), “China Offers over $20 bln Loans for SE Asian Connectivity,” November 14, 2014. 13 John W. Boscariol, Simon V. Potter, Brenda C. Swick, Robert Glasgow, A Primer on the New China-Canada Bilateral Investment
Treaty (October 4, 2012). http://www.mccarthy.ca/article_detail.aspx?id=6023. 14 Tim McLaughlin and Nyan Lynn Aung, “ASEAN Unites to Condemn Rising South China Sea Tensions,” Myanmar Times, May 19,
2014. http://www.mmtimes.com/index.php/national-news/10406-asean-unites-to-condemn-rising-south-china-sea-tensions.html. 15 Prashanth Parameswaran, “China, Brunei: Ties That Bind," Asia Times, November 9, 2012.
http://www.atimes.com/atimes/China_Business/NK09Cb01.html. 16 Ian Storey, “Testing Brunei’s Resolve over China,” Straits Times, December 10, 2012.
http://www.iseas.edu.sg/documents/publication/is10dec12.pdf; Prashanth Parameswaran, “China, Brunei: Ties That Bind," Asia Times,
November 9, 2012. http://www.atimes.com/atimes/China_Business/NK09Cb01.html. 17 Data from World Bank. 18 Data from CIA World Factbook. 19 Data from CIA World Factbook. 20 Borneo Post Online, “Brunei, China Inked MoU in Halal Food Industry,” September 19, 2014.
http://www.theborneopost.com/2014/09/19/brunei-china-inked-mou-in-halal-food-industry/.
21 Xinhua (via Global Times), “China's Petrochemical Hengyi Industries, Brunei's Damai Holdings Enter New Joint Venture,” February 25,
2014. http://www.globaltimes.cn/content/844718.shtml. 22 Data from World Shipping Council. http://www.worldshipping.org/about-the-industry/global-trade/top-50-world-container-ports. 23 Singapore Government, “Overview of CSFTA – China – Singapore (CSFTA).”
http://www.fta.gov.sg/fta_csfta.asp?hl=27. 24 Data from CIA World Factbook. 25 Singapore Business Review, "Why China Is the Investment Destination of Choice for Singapore Companies," December 18, 2012.
http://sbr.com.sg/economy/news/why-china-investment-destination-choice-singapore-companies. 26 Singapore Government, “Overview of the Sino-Singapore Tianjin Eco-City Project.” http://www.iesingapore.gov.sg/Content-
Store/Industrial-Parks-and-Projects/Overview-of-the-Sino-Singapore-Tianjin-Eco-City-project. 27 Wendy Zeldin, "China; Singapore: Cooperation Agreements Signed and Double Taxation Agreement Amended," Law Library of
Congress Global Legal Monitor, September 16, 2009. http://www.loc.gov/lawweb/servlet/lloc_news?disp3_l205401564_text; Singapore
Institute of Landscape Architects, "Singapore and China Signed MOU to Strengthen Bilateral Relations, Develop Strategic Cooperation
and Promote Urban Greenery," October 28, 2012. http://www.sila.org.sg/website/news.php?id=7; OOSKAnews, "Hyflux Signs Two
MOUs with China's Yunnan Province," April 8, 2013. http://www.siww.com.sg/industry-news/hyflux-signs-two-mous-china
percent25E2 percent2580 percent2599s-yunnan-province; and Chang May Choon, "Singapore and Guangdong Ink 18 MOUs Worth
$4.7b,” Straits Times (Singapore), April 24, 2014. http://business.asiaone.com/news/singapore-and-guangdong-ink-18-mous-worth-47b. 28 Heritage Global Investment Tracker. http://www.heritage.org/research/projects/china-global-investment-tracker-interactive-map. 29 John Paul Egan, "Increase in Chinese Investment in Singaporean Real Estate," Invest In (China). http://www.investin.com.cn/invest-in-
increase-in-chinese-investment-in-singaporean-real-estate.html; Cushman & Wakefield, China’s Outbound Boom: The Rise of Chinese
Investment in Global Real Estate (October 2014), p. 6. http://www.cushmanwakefield.com/~/media/global-
reports/CHINASOUTBOUNDBOOM_EN2410.pdf. 30 Jonathan Burgos, “Singapore Exchange Sees End to Hiatus for China IPOs,” Bloomberg, September 22, 2014.
http://www.bloomberg.com/news/2014-09-21/singapore-exchange-sees-end-to-two-year-hiatus-for-china-ipos.html. 31 Lilian Karunungan, “China, Singapore Double Currency Swap Agreement to $48 Billion,” Bloomberg, March 8, 2013.
http://www.bloomberg.com/news/articles/2013-03-08/china-singapore-double-currency-swap-agreement-to-48-billion. 32 Data from CIA World Factbook. 33 CIA World Factbook, “Indonesia.” https://www.cia.gov/library/publications/the-world-factbook/geos/id.html.
U.S.-China Economic and Security Review Commission 41
34 Data from CIA World Factbook. 35 World Trade Organization, "WTO Indonesia.” http://www.wto.org/english/thewto_e/countries_e/indonesia_e.htm. 36 Jakarta Post, "Indonesia, China Sign MOU on Fishery Partnership," October 3, 2013.
http://www.thejakartapost.com/news/2013/10/03/indonesia-china-sign-mou-fishery-partnership.html; Kangxin Partners PC, "China and
Indonesia Sign MOU,” May 1, 2013. http://www.lexology.com/library/detail.aspx?g=50a3af96-f354-4b60-b8c8-e42c225d9fbb; and
Dorothy Kosich, "China Signs MOU with Indonesia to Diversify Energy Supply," Mineweb.com, October 30, 2006.
http://www.mineweb.com/mineweb/content/en/mineweb-energy?oid=2390&sn=Daily+news+detail. 37 Heritage Global Investment Tracker. http://www.heritage.org/research/projects/china-global-investment-tracker-interactive-map. 38 Heritage Global Investment Tracker. http://www.heritage.org/research/projects/china-global-investment-tracker-interactive-map. 39 Simon Montlake, “Bakrie’s Bumi Resources Swaps Chinese Debt for Equity,” Forbes October 10, 2013.
http://www.forbes.com/sites/simonmontlake/2013/10/10/bakries-bumi-resources-swaps-chinese-debt-for-equity/. 40 Janeman Latul, "China's CIC to Offer $4 Bln Loans for Indonesia Infrastructure," Reuters, April 26, 2011.
http://www.reuters.com/article/2011/04/28/indonesia-china-cic-idUSL3E7FS0CE20110428. 41 Reuters, "Indonesian Companies Secure Chinese Deals Worth $33 Bln on Xi Visit," October 3, 2013.
http://www.reuters.com/article/2013/10/03/indonesia-china-investment-idUSL4N0HT21720131003. 42 Data from World Bank. 43 Zhang Jianfeng, “China, Malaysia to Enhance Cooperation,” CCTV (English service), November 10, 2014.
http://english.cntv.cn/2014/11/10/ARTI1415601354418388.shtml. 44 Reuters, “China, Malaysia Extend Currency Swap Deal,” February 8, 2012.
http://www.reuters.com/article/2012/02/08/china-malaysia-swap-idUSB9E7M900S20120208. 45 Heritage Global Investment Tracker. http://www.heritage.org/research/projects/china-global-investment-tracker-interactive-map. 46 Siva Sithraputhran and Stuart Grudgings, "China to Invest More than $1.6 Billion in Malaysia Steel, Port," Reuters, February 5, 2013.
http://www.reuters.com/article/2013/02/05/malaysia-china-investment-idUSL4N0B55RE20130205. 47 Esther Fung, "Chinese Developer to Invest in Malaysia," Wall Street Journal, March 1, 2014.
http://online.wsj.com/news/articles/SB10001424052702304026804579413993002257128. 48 Business-in-Asia.com, "Malaysia Is China’s Biggest Trading Partner in Southeast Asia." http://www.business-in-
asia.com/malaysia/china_malaysia_investment.html. 49 Data from CIA World Factbook. 50 Data from World Bank. 51 FTA Department of Trade Negotiations of Thailand, “ASEAN-China Free Trade Agreement.”
http://www.thaifta.com/english/eng_ascn.html. 52 World Trade Organization, "Thailand and the WTO." http://www.wto.org/english/thewto_e/countries_e/thailand_e.htm. 53 World Trade Organization, "Thailand and the WTO." http://www.wto.org/english/thewto_e/countries_e/thailand_e.htm. 54 Heritage Global Investment Tracker. http://www.heritage.org/research/projects/china-global-investment-tracker-interactive-map. 55 Forbes, "China Mobile's Thailand Investment Likely a Long-Term Investment," June 11, 2014.
http://www.forbes.com/sites/greatspeculations/2014/06/11/china-mobiles-thailand-investment-likely-a-long-term-investment/. 56 Prasong Uthaisangchai, "Chinese Investment in Thailand," Bangkok Bank.
http://www.bangkokbank.com/download/China_%20Biz_Column64.pdf. 57 Business-in-Asia.com, "China and Thailand Trade." http://www.business-in-asia.com/thailand/china_thailand_investment.html. 58 Shen Hongfang, “The Economic Relations between China and Thailand under the Context of CAFTA: An Assessment,” Chinese Studies
2:1 (February 2013): 52-60. 59 “China, Thailand Sing MOU on Railway Cooperation,” China Daily USA, December 19, 2014. http://usa.chinadaily.com.cn/world/2014-
12/19/content_19129725.htm. 60 Permanent Court of Arbitration, “The Republic of the Philippines v. The People’s Republic of China,” http://www.pca-
cpa.org/showpage.asp?pag_id=1529. 61 Chun Han Wong, "China Rejects Philippine Proposal on South China Sea Disputes," Wall Street Journal, August 9, 2014.
http://online.wsj.com/articles/china-rejects-philippine-proposal-on-south-china-sea-disputes-1407574262; Philippine Embassy in China,
"List of Bilateral Agreements," September 1, 2011. http://beijingpe.dfa.gov.ph/index.php/list-of-bilateral-agreements. 62 Rommel C. Banlaoi, Security Aspects of Philippines-China Relations: Bilateral Issues and Concerns in the Age of Global Terrorism
(Manila, Philippines: Published & Distributed by Rex Book Store, 2007). 63 Anthony dela Cruz, "Chinese Investments in the Philippines,” China Business - Philippines, August 2012.
http://chinabusinessphilippines.com/index.php?option=com_content&view=article&id=111:chinese-investments-in-the-philippines-
&catid=39:investment-update&Itemid=63. 64 Philippine Embassy in China, "Multiple Footprints of Excellence: Philippine Industry in China.”
http://beijingpe.dfa.gov.ph/index.php/embassy-news/258-multiple-footprints-of-excellence-philippine-industry-in-china. 65 Data from CIA World Factbook. 66 Data from CIA World Factbook. 67 Dezan Shira & Associates - Asia Briefing, "New Economic Zones to Boost China-Vietnam Trade," November 28, 2013.
http://www.asiabriefing.com/news/2013/11/new-economic-zones-boost-china-vietnam-trade/; Voice of Vietnam, "MOU on Nuclear
Power Co-Operation between Vietnam and China Signed,” July 22, 2010. http://english.vov.vn/Society/MoU-on-nuclear-power-
cooperation-between-Vietnam-and-China-signed/223593.vov; Vietnam Union of Friendship Organizations-Nongovernmental
Organization (VUFO-NGO) Resource Centre - Vietnam, "Vietnam, China Sign MOU to Beef up Training Procurators Cooperation,"
March 8, 2009. http://www.ngocentre.org.vn/content/vietnam-china-sign-mou-beef-training-procurators-cooperation; and Vietnam

U.S.-China Economic and Security Review Commission 42
National University of Agriculture, "List of MOU with Asian Partners." http://www.vnua.edu.vn/eng/index.php/memo-of-
understandings/43-cooperation/mou/60-asian. 67 Vietnam National University of Agriculture, "List of MOU with Asian Partners." http://www.vnua.edu.vn/eng/index.php/memo-of-
understandings/43-cooperation/mou/60-asian. 68 World Trade Organization, "Viet Nam and the WTO." http://www.wto.org/english/thewto_e/countries_e/vietnam_e.htm. 69 Duy Linh, "Vietnam Little Dependent on China Loans - Finance Minister," Saigon Times, June 13, 2014.
http://english.thesaigontimes.vn/35004/Vietnam-little-dependent-on-China-loans---finance-minister.html. 70 Vietnamnet.com, "Chinese Investment in Vietnam Soars,” April 20, 2014. http://english.vietnamnet.vn/fms/business/100245/chinese-
investment-in-vietnam-soars.html. 71 Dezan Shira & Associates - Vietnam Briefing, "China and Hong Kong Increase Investment in Vietnam," June 16, 2014.
http://www.vietnam-briefing.com/news/china-hong-kong-increase-investment-vietnam.html/. 72 BBC News, "Myanmar Profile," May 16, 2014. http://www.bbc.com/news/world-asia-pacific-12990563. 73 World Bank, "Country and Lending Groups." http://data.worldbank.org/about/country-and-lending-groups#Low_income. 74 Data from CIA World Factbook. 75 Data from World Bank. 76 Jonathan Watts, “Decline in Burmese Timber Smuggling across Chinese Border, Figures Show,” The Guardian, October 22, 2009.
http://www.theguardian.com/environment/2009/oct/21/burmese-timber-smuggling-china. 77 Sophie Song, "Myanmar FDI: China Accounts for One Third of Foreign Investment in Myanmar with $14 Billion," International
Business Times, October 29, 2013. http://www.ibtimes.com/myanmar-fdi-china-accounts-one-third-foreign-investment-myanmar-14-
billion-1446282. 78 Sophie Song, "Myanmar FDI: China Accounts for One Third of Foreign Investment in Myanmar with $14 Billion," International
Business Times, October 29, 2013. http://www.ibtimes.com/myanmar-fdi-china-accounts-one-third-foreign-investment-myanmar-14-
billion-1446282. 79 Jacob Gronholt-Pedersen, "Chinese Investment in Myanmar Falls Sharply," Wall Street Journal, June 4, 2013.
http://online.wsj.com/news/articles/SB10001424127887324063304578525021254736996. 80 Jacob Gronholt-Pedersen, "Chinese Investment in Myanmar Falls Sharply," Wall Street Journal, June 4, 2013.
http://online.wsj.com/news/articles/SB10001424127887324063304578525021254736996. 81 The Nation (Thailand), "China Loans Burma 2.4 Billion Dollars for Gas Pipeline Project," December 12, 2010.
http://www.nationmultimedia.com/home/China-loans-Burma-2-4-billion-dollars-for-gas-pipe-30144255.html. 82 Nicholas Borroz, “Troubled Pipelines in Burma,” International Security Observer, April 2, 2014. http://securityobserver.org/troubled-
pipelines-in-burma/. 83 RenewableFuelsNow.org, "Hydropower Attracts Big Investment in Myanmar." http://www.renewablefuelsnow.org/hydro-
power/hydropower-attracts-big-investment-in-myanmar.html. 84 Xinhua (English edition), "Myanmar Ministry, Chinese Company Sign MOU on Clean Development Management Project,"
Mizzima.com, September 12, 2013. http://www.mizzima.com/mizzima-news/environment/item/9981-myanmar-ministry-chinese-
company-sign-mou-on-clean-development-management-project/9981-myanmar-ministry-chinese-company-sign-mou-on-clean-
development-management-project; Eleven Media Group (Myanmar), "MOU to Be Signed for Sending Myanmar Workers to China,"
July 7, 2014. http://www.elevenmyanmar.com/index.php?option=com_content&view=article&id=6679:mou-to-be-signed-for-sending-
myanmar-workers-to-china&catid=44:national&Itemid=384. 85 Khin Oo Tha, "Burma's Parliament Approves $100 Million Loan from China," Irrawaddy, August 23, 2013.
http://www.irrawaddy.org/farmers/burmas-parliament-approves-100-million-loan-from-china.html. 86 Adrian Wan, “China to Sign Trade Deals Worth US$8 Billion with Myanmar,” South China Morning Post, November 14, 2014.
http://www.scmp.com/news/china/article/1639883/china-sign-trade-deals-worth-us8-billion-myanmar. 87 United States Central Intelligence Agency, "Cambodia." https://www.cia.gov/library/publications/the-world-factbook/geos/cb.html. 88 World Bank, "Country and Lending Groups." http://data.worldbank.org/about/country-and-lending-groups#Low_income. 89 United Nations Development Program, “Table 1: Human Development Index and Its Components.” http://hdr.undp.org/en/content/table-
1-human-development-index-and-its-components. 90 United States Central Intelligence Agency, "Cambodia." https://www.cia.gov/library/publications/the-world-factbook/geos/cb.html. 91 United States Central Intelligence Agency, "Cambodia." https://www.cia.gov/library/publications/the-world-factbook/geos/cb.html. 92 Data from CIA World Factbook. 93 Steel Orbis, “Guangxi Nonferrous Metal Group Starts Work on Steel Project in Cambodia,” April 6, 2012.
http://www.steelorbis.com/steel-news/latest-news/guangxi-nonferrous-metalgroup-starts-work-on-steel-project-in-cambodia-
677053.htm. 94 May Kunmakara, "China to Invest $9.6b in Cambodia," Phnom Penh Post (Cambodia), January 1, 2013.
http://www.phnompenhpost.com/business/china-invest-96b-cambodia. 95 Carlyle A. Thayer, "The Tug of War Over Cambodia,” USNI News, February 19, 2013. http://news.usni.org/2013/02/19/the-tug-of-war-
over-cambodia. 96 Association of Southeast Asian Nations - China Free Trade Area, "China's Xi'an Signs MOU with Cambodia to Enhance Economic
Cooperation," November 24, 2010. http://www.asean-cn.org/Item/1404.aspx. 97 Kun Makara, "MOUs to Tighten Chinese Trade Ties," Phnom Penh Post (Cambodia), May 21, 2012.
http://www.phnompenhpost.com/business/mous-tighten-chinese-trade-ties. 98 Alan Wang, "China, Cambodia Sign MOU to Open Aviation Market," World Civil Aviation Resource Net, February 26, 2014.
http://www.wcarn.com/news/32/32821.html.

U.S.-China Economic and Security Review Commission 43
99 Heng Pheakdey, "Chinese Investment and Aid in Cambodia a Controversial Affair," East Asia Forum, July 16, 2013.
http://www.eastasiaforum.org/2013/07/16/chinese-investment-and-aid-in-cambodia-a-controversial-affair/. 100 Xinhua (English edition), "China Provides 33 Mln USD in Free-Interest Loan to Cambodia for Development Projects," Global Times
(China), November 14, 2013. http://www.globaltimes.cn/content/824919.shtml. 101 Xinhua (English edition), "China Provides Military Aid to Cambodia," China Daily, February 7, 2014.
http://www.chinadaily.com.cn/china/2014-02/07/content_17270494.htm. 102 Radio Free Asia, “China Pledges Multimillion-Dollar Development Aid to Cambodia,” November 10, 2014.
http://www.rfa.org/english/news/cambodia/chinese-development-aid-11102014171429.html. 103 Nikon.com, "To Reinforce Digital SLR Camera Manufacturing Organization: Establishment of a New Factory in Laos," March 21,
2013. http://www.nikon.com/news/2013/0321_01.htm. 104 Xin Zhou, "China Boosts Laos Presence with $1.6 Billion Project," Bloomberg, December 22, 2012.
http://www.bloomberg.com/news/2012-12-23/china-boosts-laos-presence-with-1-6-billion-project.html. 105 Adam Pasick, "China Just Became the Biggest Investor in Laos, and Laos’s Neighbors Are Worried," Quartz (New York), January 30,
2014. http://qz.com/172350/china-just-became-the-biggest-investor-in-laos-and-laoss-neighbors-are-worried/. 106 Bangkok Post, "China Gives Laos $81m in Aid, Loans," September 5, 2013. http://www.bangkokpost.com/most-recent/368157/china-
gives-laos-81-6-million-dollars-in-aid-loans percent2520 percent25E0 percent25B9 percent2581 percent25E0 percent25B8
percent25A5 percent25E0 percent25B8 percent25B0. 107 Somnet Inthapannha, "Laos-China Railroad Set for Launch," Radio Free Asia, October 21, 2010.
http://www.rfa.org/english/news/laos/railway-10202010150808.html; Somsack Pongkhao, "Laos, China Upgrade Boten-Bohan into
Economic Cooperation Zone," Vientiane Times (Laos), July 11, 2014.
http://www.vientianetimes.org.la/FreeContent/freeCont_Lao_china.htm; and Vientiane Times (Laos), "Laos, China Sign MOU to
Develop Organic Farms," Farmlandgrab.org, October 26, 2011. http://farmlandgrab.org/post/view/19530-laos-china-sign-mou-to-
develop-organic-farms. 108 United Nations Office on Drugs and Crime, "Greater Mekong Countries Pledge to Strengthen Cooperation to Fight Illicit Drugs Threat
in Southeast Asia," May 9, 2013. https://www.unodc.org/southeastasiaandpacific/en/myanmar/2013/05/mou-meeting/story.html.