China / Hong Kong Company Focus Trigiant Groupdoc.xueqiu.com/1414865e0477d3fe81830b5a.pdf · with...
26
In Singapore, this research report or research analyses may only be distributed to Institutional Investors, Expert Investors or Accredited Investors as defined in the Securities and Futures Act, Chapter 289 of Singapore. “Recipients of this report, received from DBS Vickers Research (Singapore) Pte Ltd (“DBSVR”), are to contact DBSVR at +65 6535 9688 in respect of any matters arising from or in connection with this report.” www.dbsvickers.com ed-TH / sa- DL BUY HK$3.12 HSI: 23,252 (Initiating coverage) Price Target: 12-Month HK$5.30 Reason for Report: Coverage initiation Potential Catalyst: 4G licence issuance in China DBSV vs Consensus: Our FY13 and FY14 earnings are higher than consensus Analyst Tsz Wang TAM CFA, +852 2971 1772 [email protected] Price Relative 0.00 0.50 1.00 1.50 2.00 2.50 3.00 3.50 Apr-12 Jul-12 Oct-12 Jan-13 Apr-13 Jul-13 HK$ 78 5078 10078 15078 20078 25078 30078 35078 Relative Index Trigiant Group (LHS) Relative HSI INDEX (RHS) Forecasts and Valuation FY Dec (RMB m) 2012A 2013F 2014F 2015F Turnover 2,231 2,781 3,463 3,779 EBITDA 392 482 602 662 Pre-tax Profit 303 409 524 578 Net Profit 252 340 435 479 Net Pft (Pre Ex.) 252 340 435 479 EPS (RMB) 0.25 0.34 0.44 0.48 EPS (HK$) 0.32 0.43 0.55 0.61 EPS Gth (%) (2.4) 34.7 28.1 10.2 Diluted EPS (HK$) 0.32 0.43 0.55 0.61 DPS (HK$) 0.10 0.14 0.17 0.18 BV Per Share (HK$) 1.27 1.58 2.06 2.50 PE (X) 9.8 7.2 5.7 5.1 P/Cash Flow (X) 60.5 24.4 14.1 11.5 P/Free CF (X) 110.2 30.5 26.1 14.9 EV/EBITDA (X) 7.2 6.0 4.8 4.4 Net Div Yield (%) 3.3 4.4 5.3 5.8 P/Book Value (X) 2.5 2.0 1.5 1.2 Net Debt/Equity (X) 0.4 0.3 0.3 0.2 ROAE (%) 31.2 30.2 30.3 26.6 Earnings Rev (%): New New New Consensus EPS (RMB) 0.33 0.42 0.52 Other Broker Recs: B: 2 S: 0 H: 0 ICB Industry: Industrials ICB Sector: Electronic & Electrical Equipment Principal Business: Trigiant is the largest manufacturer of RF coaxial cable in China Source of all data: Company, DBSV, HKEX The best 4G proxy • Largest RF coaxial cable supplier for telecom networks in China with 25%+ market share • China Mobile’s 180k TD-LTE base station construction is a key catalyst in FY13 • We expect 29% and 24% sales volume growth for Trigiant in the coming 2 years, faster than industry Capex increase • Undemanding valuation at 5.7x FY14 PE; initiate coverage with a BUY and TP of HK$5.30 Leading supplier of RF coaxial cable in China. Trigiant is the largest RF coaxial cable manufacturer for telecom networks in China with 25%+ market share. Product demand is driven by base station construction and indoor coverage. We forecast net profit to grow by 35% and 28% for FY13 and FY14 respectively. TD-LTE base station construction is a key catalyst. We expect Chinese government to issue TD-LTE 4G licences by the end of this year. China Mobile (CM) targets to build 180k TD-LTE (4G) base stations by the end of FY13. We estimate a total of 440k new base station additions (including 2G, 3G and 4G) in China in FY13 vs. around 338k last year (up 30%). This will be a key growth driver for Trigiant this year. Expect sales volume to grow faster than industry Capex increase. In our view, Trigiant is the best 4G proxy due to its c.95% revenue exposure to mobile Capex and early timing in the network investment cycle. Unlike some other telecom equipments which might only require incremental upgrade, RF coaxial cable cannot be shared for different technologies due to different frequencies. We estimate the sales volume to increase by 29% and 24% in the coming 2 years, higher than the industry Capex increase of 21% and 5%. Initiate BUY with TP of HK$5.30. The stock now trades at 7.2x FY13 and 5.7x FY14 PE, which represents a discount to other telecom infrastructure plays. It offers 4%+ forward dividend yield. We initiate coverage with a BUY recommendation and TP of HK$5.30, tagged to 10x FY14 PE, in-line with most telecom equipment stocks' historical average PE. We believe that Capex up cycle in the coming 2 years will support the re-rating. At A Glance Issued Capital (m shrs) 1,000 Mkt. Cap (HK$m/US$m) 3,119 / 402 Major Shareholders Trigiant Investments (%) 60.0 Free Float (%) 40.0 Avg. Daily Vol.(‘000) 6,200 DBS Group Research. Equity 17 September 2013 China / Hong Kong Company Focus Trigiant Group Bloomberg: 1300 HK Equity | Reuters: 1300.HK Refer to important disclosures at the end of this report
Transcript of China / Hong Kong Company Focus Trigiant Groupdoc.xueqiu.com/1414865e0477d3fe81830b5a.pdf · with...

In Singapore, this research report or research analyses may only be distributed to Institutional Investors, Expert Investors or Accredited Investors as defined in the Securities and Futures Act, Chapter 289 of Singapore.
“Recipients of this report, received from DBS Vickers Research (Singapore) Pte Ltd (“DBSVR”), are to contact DBSVR at +65 6535 9688 in respect of any matters arising from or in connection with this report.”
www.dbsvickers.com
ed-TH / sa- DL
BUY HK$3.12 HSI: 23,252 (Initiating coverage)
Price Target: 12-Month HK$5.30 Reason for Report: Coverage initiation Potential Catalyst: 4G licence issuance in China DBSV vs Consensus: Our FY13 and FY14 earnings are higher than consensus Analyst Tsz Wang TAM CFA, +852 2971 1772 [email protected]
Price Relative
0.00
0.50
1.00
1.50
2.00
2.50
3.00
3.50
Apr-12 Jul-12 Oct-12 Jan-13 Apr-13 Jul-13
HK$
78
5078
10078
15078
20078
25078
30078
35078
Relative Index
Trigiant Group (LHS) Relative HSI INDEX (RHS) Forecasts and Valuation
FY Dec (RMB m) 2012A 2013F 2014F 2015F Turnover 2,231 2,781 3,463 3,779 EBITDA 392 482 602 662 Pre-tax Profit 303 409 524 578 Net Profit 252 340 435 479 Net Pft (Pre Ex.) 252 340 435 479 EPS (RMB) 0.25 0.34 0.44 0.48 EPS (HK$) 0.32 0.43 0.55 0.61 EPS Gth (%) (2.4) 34.7 28.1 10.2 Diluted EPS (HK$) 0.32 0.43 0.55 0.61 DPS (HK$) 0.10 0.14 0.17 0.18 BV Per Share (HK$) 1.27 1.58 2.06 2.50 PE (X) 9.8 7.2 5.7 5.1 P/Cash Flow (X) 60.5 24.4 14.1 11.5 P/Free CF (X) 110.2 30.5 26.1 14.9 EV/EBITDA (X) 7.2 6.0 4.8 4.4 Net Div Yield (%) 3.3 4.4 5.3 5.8 P/Book Value (X) 2.5 2.0 1.5 1.2 Net Debt/Equity (X) 0.4 0.3 0.3 0.2 ROAE (%) 31.2 30.2 30.3 26.6
Earnings Rev (%): New New New Consensus EPS (RMB) 0.33 0.42 0.52 Other Broker Recs: B: 2 S: 0 H: 0
ICB Industry: Industrials ICB Sector: Electronic & Electrical Equipment Principal Business: Trigiant is the largest manufacturer of RF coaxial cable in China
Source of all data: Company, DBSV, HKEX
The best 4G proxy • Largest RF coaxial cable supplier for telecom networks in China
with 25%+ market share
• China Mobile’s 180k TD-LTE base station construction is a key catalyst in FY13
• We expect 29% and 24% sales volume growth for Trigiant in the coming 2 years, faster than industry Capex increase
• Undemanding valuation at 5.7x FY14 PE; initiate coverage with a BUY and TP of HK$5.30
Leading supplier of RF coaxial cable in China. Trigiant is the largest RF coaxial cable manufacturer for telecom networks in China with 25%+ market share. Product demand is driven by base station construction and indoor coverage. We forecast net profit to grow by 35% and 28% for FY13 and FY14 respectively.
TD-LTE base station construction is a key catalyst. We expect Chinese government to issue TD-LTE 4G licences by the end of this year. China Mobile (CM) targets to build 180k TD-LTE (4G) base stations by the end of FY13. We estimate a total of 440k new base station additions (including 2G, 3G and 4G) in China in FY13 vs. around 338k last year (up 30%). This will be a key growth driver for Trigiant this year.
Expect sales volume to grow faster than industry Capex increase. In our view, Trigiant is the best 4G proxy due to its c.95% revenue exposure to mobile Capex and early timing in the network investment cycle. Unlike some other telecom equipments which might only require incremental upgrade, RF coaxial cable cannot be shared for different technologies due to different frequencies. We estimate the sales volume to increase by 29% and 24% in the coming 2 years, higher than the industry Capex increase of 21% and 5%.
Initiate BUY with TP of HK$5.30. The stock now trades at 7.2x FY13 and 5.7x FY14 PE, which represents a discount to other telecom infrastructure plays. It offers 4%+ forward dividend yield. We initiate coverage with a BUY recommendation and TP of HK$5.30, tagged to 10x FY14 PE, in-line with most telecom equipment stocks' historical average PE. We believe that Capex up cycle in the coming 2 years will support the re-rating.
At A GlanceIssued Capital (m shrs) 1,000 Mkt. Cap (HK$m/US$m) 3,119 / 402Major Shareholders
Trigiant Investments (%) 60.0 Free Float (%) 40.0 Avg. Daily Vol.(‘000) 6,200
DBS Group Research. Equity 17 September 2013
China / Hong Kong Company Focus
Trigiant Group Bloomberg: 1300 HK Equity | Reuters: 1300.HK Refer to important disclosures at the end of this report

Company Focus
Trigiant Group
Page 2
Table of Contents
Investment summary 3
SWOT Analysis 4
Company profile 5
Industry overview on RF coaxial cable 7
Growth drivers 9
Financial analysis and forecast 11
Valuation and recommendation 14
Risks 15
FAQs 16
Appendix 17

Company Focus
Trigiant Group
Page 3
Investment summary
The largest RF coaxial cable manufacturer in China. Founded in 2007 and listed on the HKEx in 2012, Trigiant is the largest RF coaxial cable manufacturer in China with 25%+ market share. The 2nd to 4th players each command around 10-15% market share. Chairman Qian and his management team have been in the industry for 20+ years. Major customers are China Mobile (CM), China Unicom (CU) and China Telecom (CT).
Growth driven by base station construction and indoor coverage. Demand for RF coaxial cable is driven by base station construction and indoor coverage in China. On average, about 0.5km of RF coaxial cable is used for each 2G or 3G base station, and about 0.6km for each 4G base station. Such application accounts for c.40-50% of total demand. The other 50-60% are applied in indoor coverage uses, such as in subways, tunnels, underground passages and interiors of buildings.
CM’s 180k TD-LTE base station construction is a key catalyst. We believe the Chinese government will issue TD-LTE 4G licences to all three operators by the end of this year. CM targets to build 180k TD-LTE (4G) base stations by the end of FY13, which will be a key growth driver for Trigiant this year. We estimate a total of 440k new base station additions (including 2G, 3G and 4G) in China in FY13 vs. around 338k last year (up 30%). Together with the rising demand from replacement and indoor coverage, we estimate Trigiant's RF coaxial cable sales volume to increase by 29% and 24% in the coming 2 years. The company plans to expand annual production capacity from 200k km by end Jun 2013 to 300k km (up 50%) by end of FY14, to cater for the increasing product demand.
China Mobile's new contribution for flame retardant flexible cable. Trigiant started supplying flame retardant flexible cable to CU in FY11 and to CT in 2H12. This segment contributed 21% revenue in 1H13. The company penetrated this market by leveraging on its existing distribution network and relationship with telecom operators. We expect a stronger segmental performance in FY13 with full year contribution from CT, vs. only half year in FY12. CM has not opened any new tendering for 20+ months. Management believes new orders from CM will be a growth driver next year. We expect segmental revenue growth of c.40%p.a. for FY13 and FY14. This product is also applied in other sectors, such as utility, oil and gas as well as marine engineering, which offers long-term growth potential for Trigiant.
Pre-determined gross margin under current pricing mechansim. The selling price for RF coaxial cable (of a particular technical specification) is formulated based on a cost plus model with reference to copper price. Its gross profit margin is protected from raw material price fluctuations and is relatively stable. In this regard, profitabilty is more predictable, compared with other technology products whose margins may face pressure towards the end of product cycle.
Initiating coverage with a BUY recommendation. We forecast 35% and 28% net profit growth for FY13 and FY14, respectively. The stock now trades at 7.2x FY13 and 5.7x FY14 PE, which represents a discount to other telecom infrastructure stocks such as ZTE (763 HK), Comba (2342 HK) and CCS (552 HK). The stock offers 4%+ forward dividend yield. Given its strong growth potential, current valuation is undemanding. We initiate coverage with a BUY recommendation and TP of HK$5.30, tagged to 10x FY14 PE, in-line with most telecom equipment stocks' historical average PE. We believe that Capex up cycle in the coming 2 years will support the re-rating. Trigiant is the best 4G proxy, in our view; and therefore, the valuation should at least trade at par to Comba's and CCS's historical average of 10x+ forward PE.
The best 4G play. ZTE and Comba remained unprofitable in 1H13. CCS delivered flattish earnings in 1H13 due to back-end loaded Capex pattern this year. Under such backdrop, Trigiant's sales growth of 16% y-o-y in 1H13 is respectable, and we expect a stronger performance in 2H13. In terms of revenue mix, c.95% of revenue is related to domestic capex (vs. 23 / 82 / 36% for ZTE / Comba / CCS respectively, based on FY12 revenue). In terms of timing, RF coaxial cable is the first batch of equipment that is required for 4G base station construction. Therefore, Trigiant is the best 4G proxy, in our view. Unlike some other telecom equipments which might only require incremental upgrade, RF coaxial cable cannot be shared for different technologies due to different frequencies. Product demand will also extend into wireless enhancement phase in the next 2-3 years. We expect sales volume to growth faster than the industry Capex increase of 21% and 5% for the coming 2 years.
Risks and concerns. (1) Domestic RF coaxial cable demand may be weaker than expected if the government decides not to grant 4G licences this year. (2) Telecom market's investment cycle may peak after 2-3 years. (3) The equipment sector is characterised by long accounts receivable days, resulting in tight operating cash flow. (4) Some business contracts are secured due to the long established relationship with the telecom operators, which will be at risk if there is any change in the procurement mechanism.

Company Focus
Trigiant Group
Page 4
SWOT Analysis
Strengths Weakness
• Strong research and development with good product quality
• Leading supplier of RF coaxial cables for telecom network in China with 25%+ market share
• Experienced management team with well-established distribution network to telecom operators
• High working capital requirement due to long accounts receivable days
• Profitability fluctuation due to change in copper price. Gross margin is protected in the pricing mechanism, but not dollar margin
Opportunities Threats
• Strong demand for RF coaxial cables applied in the upcoming 4G base station construction (TD-LTE and FD-LTE) in China
• New contribution from China Mobile for flame retardant flexible cable
• Development of other telecom network products
• Expansion into overseas markets
• Uncertain timing of 4G licence issuance and pace of network rollout
• Slow mobile Capex after network infrastructure investment peaking off in longer term
Source: DBS Vickers
Company Focus
Trigiant Group
Page 5
Company profile
Company background
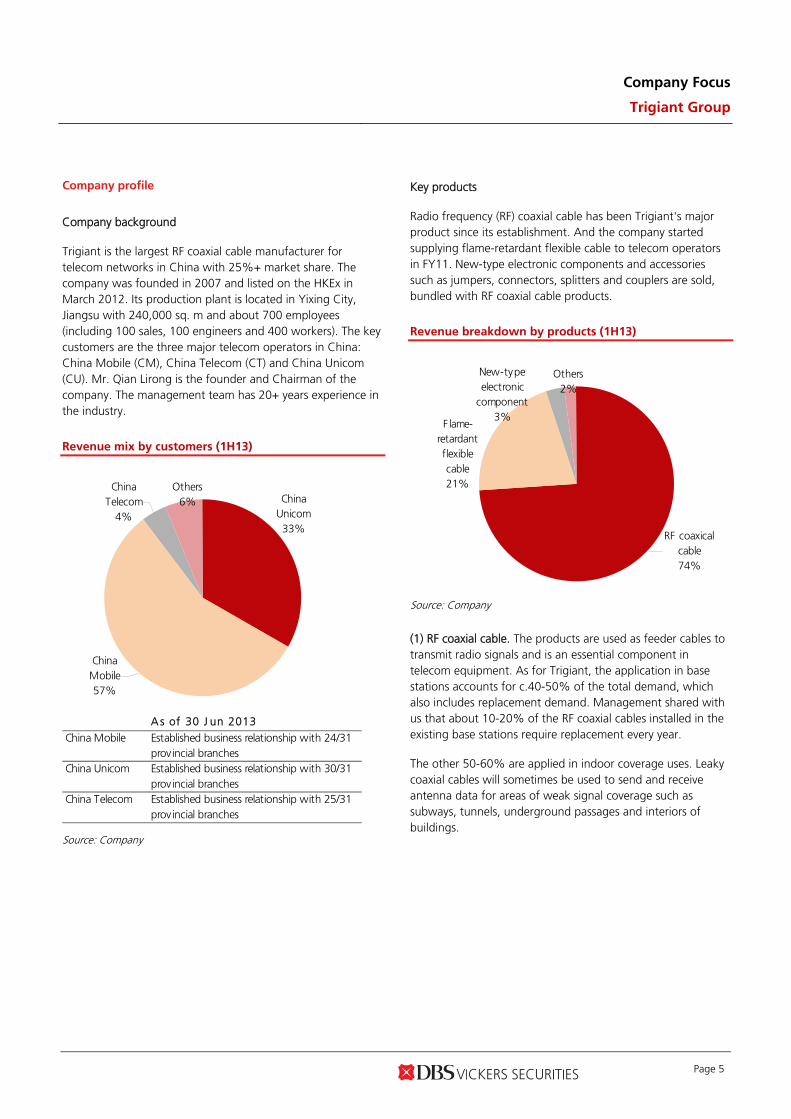
Trigiant is the largest RF coaxial cable manufacturer for telecom networks in China with 25%+ market share. The company was founded in 2007 and listed on the HKEx in March 2012. Its production plant is located in Yixing City, Jiangsu with 240,000 sq. m and about 700 employees (including 100 sales, 100 engineers and 400 workers). The key customers are the three major telecom operators in China: China Mobile (CM), China Telecom (CT) and China Unicom (CU). Mr. Qian Lirong is the founder and Chairman of the company. The management team has 20+ years experience in the industry.
Revenue mix by customers (1H13)
China Mobile57%
China Unicom33%
Others6%
China Telecom
4%
A s of 30 J un 2013
China Mobile Established business relationship with 24/31 prov incial branches
China Unicom Established business relationship with 30/31 prov incial branches
China Telecom Established business relationship with 25/31 prov incial branches
Source: Company
Key products
Radio frequency (RF) coaxial cable has been Trigiant's major product since its establishment. And the company started supplying flame-retardant flexible cable to telecom operators in FY11. New-type electronic components and accessories such as jumpers, connectors, splitters and couplers are sold, bundled with RF coaxial cable products.
Revenue breakdown by products (1H13)
New-type electronic
component3%
Others2%
RF coaxical cable74%
Flame-retardant flexible cable21%
Source: Company
(1) RF coaxial cable. The products are used as feeder cables to transmit radio signals and is an essential component in telecom equipment. As for Trigiant, the application in base stations accounts for c.40-50% of the total demand, which also includes replacement demand. Management shared with us that about 10-20% of the RF coaxial cables installed in the existing base stations require replacement every year.
The other 50-60% are applied in indoor coverage uses. Leaky coaxial cables will sometimes be used to send and receive antenna data for areas of weak signal coverage such as subways, tunnels, underground passages and interiors of buildings.

Company Focus
Trigiant Group
Page 6
Product applications
RF coaxial cable
Broadcast ing 2G, 3G, 4G
F lame retardant f lex ible cable
Source: Company
RF coaxial cable
Flame-retardant flexible cable
Product ion process
Copper conductor
Covering Foaming Corrugating Jacketing
ConductorOuter conductor
InsulatorJacket
Product ion process
Halogen free protection shield
InsulatorFlame retardant jacket
Conductor
Copper reshaping
Stranding Insulating Armor cabling
Jacketing
Source: Company Source: Company
(2) Flame-retardant flexible cable
Flame-retardant flexible cables are widely used as internal connection cables for power systems or mobile cable transmission and distribution systems, and are especially designed for systems requiring uninterrupted power supply such as communications switch centres, skyscrapers, elevator machine rooms, airports, tunnels, air defense, pipe laying, oil
exploration and automatic fire extinguishing systems. The working voltage is rated 600V-1000V, under a 90°C-125°C temperature. Trigiant currently supplies this product to CT and CU. Management is confident of securing a decent market share from CM when it starts the new bidding process. The market size is estimated at Rmb8-10bn for China's telecom applications.

Company Focus
Trigiant Group
Page 7
Competitive advantage
Product quality. Trigiant is a technology leader in RF coaxial cable. For insulator manufacturing, its foaming rate reached 84% (the higher the rate, the less the signal attenuation), higher than its competitors' average of below 80%.
Well-established relationship with telecom operators. Management team (including Chairman and CEO) has been in the industry for 20+ years. They have established good relationships with operators, and have good knowledge of customers' needs.
Production capacity. Trigiant now has the largest market share of c.25% for all three operators, far higher than the close competitors. The production scale allows it to have more efficient product delivery (due to short production lead time) as well as good after sales service (with nationwide supporting offices).
Industry overview on RF coaxial cable
Industry growth
Demand for RF coaxial cable is supported by Chinese telecom operators' Capex on mobile network infrastructure which we expect 210% increase to Rmb258bn in FY13. In particular, the demand is driven by base station construction and indoor coverage. On average, about 0.5km of RF coaxial cable is used for each 2G or 3G base station, and about 0.6km for each 4G base station. Management estimates that the RF coaxial cable market size is about Rmb8-10bn per year; and we believe that represents 3-5% of operators' mobile Capex.
Future growth will be driven by continuous 2G and 3G network expansion and new 4G investments. CM targets to build 180k TD-LTE (4G) base stations this year. We expect CM to add 50k GSM (2G) base stations p.a. in the coming few years (compared with 100k in FY12 and 160k in FY11). Moreover, CM will install 110k TD-SCDMA (3G) base stations in the near future. For smaller operators, we expect CU to add 80k WCDMA (3G) and 30k GSM (2G) base stations this year; CT will install 20k CDMA base stations p.a. in the coming 2 years. Total number of base stations in China will grow from 2.1m by FY12 to 2.54m by FY13.
We estimate a total of 440k new base station additions (including 2G, 3G and 4G) in China this year vs. around 338k in last year (up 30%). Note that RF coaxial cables cannot be shared with different technologies (ie, 2G, 3G and 4G) due to different transmission frequencies. Moreover, replacement demand which is equivalent to 10-20% of existing base stations per year will be driven by 21% and 17% increase in total numbers of base station for FY13 and FY14 respectively.
In view of the heavy spending on base stations in FY13, we expect operators to push some of the indoor coverage spending to FY14. We expect the product demand from indoor coverage to increase by 10% for FY13 and 20% for FY14. All in all, we forecast RF coaxial cable demand in China to grow by 24% to 528k km in FY13 and 12% to 591k km in FY14.
Mobile capex in China
0
50
100
150
200
250
300
350
FY09A FY10A FY11A FY12A FY13F FY14F FY15F
RMB m
21%
Source: Company, DBS Vickers
Number of telecom base stations in China
0
500
1,000
1,500
2,000
2,500
3,000
3,500
4,000
FY09A FY10A FY11A FY12A FY13F FY14F FY15F
Net additions
'000
338
440
Source: Company, DBS Vickers

Company Focus
Trigiant Group
Page 8
Demand for RF coaxial cables in China from base stations and indoor coverage
0
100
200
300
400
500
600
700
FY09A FY10A FY11A FY12A FY13F FY14F FY15F
New base station Replacement Indoor coverage
k km
24%
12%
Source: Company, DBS Vickers
Market competition
Trigiant is the largest RF coaxial cable manufacturer for telecom networks in China with 25%+ market share. The subsequent three players (including Hengxin (1085 HK), Jiangsu Zhongtian (600522 CH) and Zhuhai Hansen Technology) have a combined market share of c.40% (each commands around 10-15% market share). There are less than 30 players in China. Market share in each telecom operator is determined based on both pricing (c.50% weighting) and various other qualities (c.50% weighting) in their respective Central Procurement Programme (CPP). Management shared with us that they rank number 1 in the overall score and quality, but relatively lower score at pricing (ie, higher selling price than its competitors). This is also reflected by its gross margin being 5ppts higher than its major competitor Hengxin in FY12.
Entry barrier is high for new entrants, including high working capital needs (long AR) when servicing telecom operators. New players will normally take a few years to get qualified from operators before they can participate in any tender bidding. Market share and therefore revenue is possbily small at the beginning. Therefore, despite the relatively good profitabilty (net margin of c.11% for Trigiant and c.5.5% for Hengxin in FY12), total number of industry players remained limited.
Key financial comparison with a major competitor
Rmb m Trigiant Hengxin
Revenue 2,231 1,134
Net profit 252 62
Gross margin (%) 23.4% 18.4%
Net margin (%) 11.3% 5.5%
Based on FY12 annual results
Source: Companies, DBS Vickers
Business model in China
RF coaxial cables manufacturers sell their products to Chinese telecom operators through the Central Procurement Programme (CPP). For each telecom operator, CPP normally takes place every 12 months. Operators' head offices will gather estimates from their respective provincial officials. Selling prices and market share are determined under CPP.
Operators' provincial branches will place orders with the suppliers, according to the pre-determined market share in CPP. Note that provincial branches have the discretion to procure 10-20% additional cables when there is demand. For this portion, branches have flexibility in choosing suppliers. Trigiant normally gets higher market share from that portion.
Copper is the major raw material in the production of RF coaxial cables, accounting for c.75% of COGS. Pricing scheme at CPP is formulated according to copper price. Trigiant does not keep copper inventory, and will only purchase the raw material when it receives orders. Material delivery time can be as short as 1.5 days. Therefore, margins are protected by a "cost-plus" model with reference to copper price. Prices of other raw materials such as PVC are relatively stable.
Gross margin of Trigiant and Hengxin
0%
5%
10%
15%
20%
25%
30%
FY09A FY09A FY09A FY10A FY11A FY12A
Trigiant Hengxin
Source: Companies

Company Focus
Trigiant Group
Page 9
Growth drivers
4G base station construction. We expect the Chinese government to issue TD-LTE 4G licences by the end of FY13. Construction of a new mobile network creates new demand for RF coaxial cables. CM targets to build 180k TD-LTE (4G) base stations this year, expect total number of 4G base stations to reach 200k by the end of FY13 (from 20k by the end of FY12). This will be a key growth driver for the company this year. Management believes it had c.30% market share of the 20,000 TD-LTE base stations installed last year. If we assume 0.6km of cable per 4G base station, total demand would be 12,000km for the 20,000 base stations. Trigiant supplied 3,800km of RF coaxial cables for CM's TD-LTE network last year, and is confident of maintaining its market share in the upcoming 180k base station construction.
Government is also likely to issue FD-LTE licenses to CU and CT at later stage (probably 12 months after TD-LTE licence). Due to the technology assignment uncertainty, both operators have been conservative on their respectively 4G network construction plan. CU mentioned that they may spend an extra Rmb5-10bn per year (for around 16k-31k bts) on 4G network. But we see a potential upside if they step up the investment to compete with CM. We estimate a total of 440k new base station additions (including 2G, 3G and 4G) in China in FY13 vs. around 338k last year (up 30%). Together with rising demand from replacement and indoor coverage, we estimate Trigiant's RF coaxial cable sales volume to increase by 29% to 147k km for FY13 and by 24% to 182k km in FY14.
Continuous indoor coverage. Demand for higher network quality has resulted in the push for indoor coverage solutions, such as in subways and in-buildings. In particular, leaky cables (a type of RF coaxial cable) are used to radiate signals indoors. Growth drivers from this segment include continuous 3G subscriber growth in the next few years. New property and infrastructure developments will also add to demand for indoor coverage systems. This segment will provide a steady revenue stream to the industry. We only expect 10% demand growth coming from indoor coverage in FY13, in view of heavy spending on base station construction, but will pick up in FY14 and FY15 with 20% growth p.a. in wireless enhancement phase.
Mobile subscriber base in China
0
200
400
600
800
1,000
1,200
1,400
1,600
FY09A FY10A FY11A FY12A FY13F FY14F FY15F
3G subscriber base
m
Source: Companies, DBS Vickers
Targeting 1/3 market share. Management believes that product and service quality are the key for market share gain. Trigiant is targeting to capture 1/3 market share over the medium term, from its current 25% share. We mentioned before that the company secured 30% share for CM's 4G orders last year. Overall market share will increase further, along with more 4G-related revenue from CM.
Overseas market expansion. Trigiant currently has limited presence in overseas markets (c.3% of revenue). But management is devoting resources to venture into Russia, India and Brazil’s telecom markets. Trigiant won the sales contract from Russia's largest telecom operator in 2012, and is now participating in the tendering of 2nd largest operator. It also supplies products to ZTE and Huawei for overseas operators. This will be a longer-term growth driver.
New product contribution: Flame retardant flexible cable. Trigiant started supplying flame retardant flexible cable to CU in FY11 and to CT in 2H12. The company penetrated this market by leveraging on its existing distribution network and relationship with operators. We expect a strong performance in FY13 with full year contribution from China Telecom, vs. only half year in FY12. CM has not opened any new tendering for 20+ months. Management believes new orders from CM will be a growth driver next year. The total market size (for telecom segment) is estimated at Rmb8-10bn. Based on FY12 segmental revenue, Trigiant's market share was about 4%. We expect the share to go up to 10-15% in the next 3-5 years. This product is also applied in other sectors, such as utility, oil and gas, as well as marine engineering, which represents long-term growth potential for Trigiant.
Company Focus
Trigiant Group
Page 10
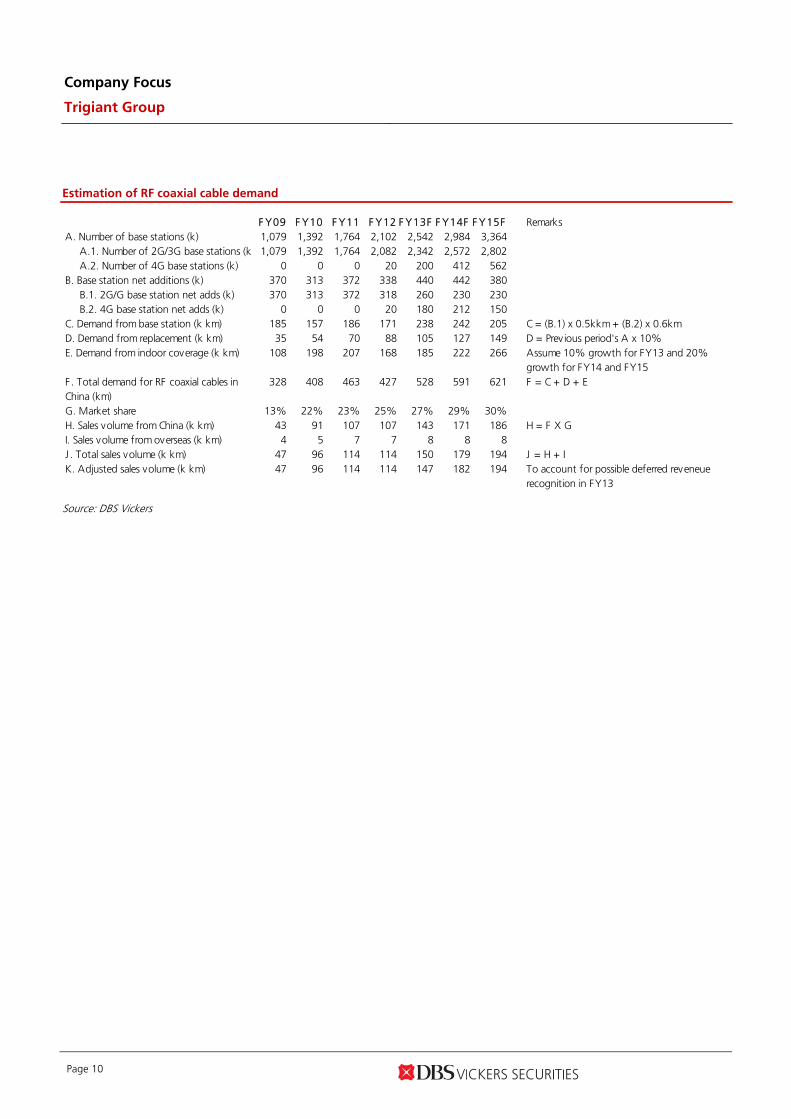
Estimation of RF coaxial cable demand
F Y09 F Y10 F Y11 F Y12 F Y13F F Y14F F Y15F RemarksA. Number of base stations (k) 1,079 1,392 1,764 2,102 2,542 2,984 3,364
A.1. Number of 2G/3G base stations (k 1,079 1,392 1,764 2,082 2,342 2,572 2,802A.2. Number of 4G base stations (k) 0 0 0 20 200 412 562
B. Base station net additions (k) 370 313 372 338 440 442 380B.1. 2G/G base station net adds (k) 370 313 372 318 260 230 230B.2. 4G base station net adds (k) 0 0 0 20 180 212 150
C. Demand from base station (k km) 185 157 186 171 238 242 205 C = (B.1) x 0.5kkm + (B.2) x 0.6kmD. Demand from replacement (k km) 35 54 70 88 105 127 149 D = Prev ious period's A x 10%E. Demand from indoor coverage (k km) 108 198 207 168 185 222 266 Assume 10% growth for FY13 and 20%
growth for FY14 and FY15F. Total demand for RF coaxial cables in China (km)
328 408 463 427 528 591 621 F = C + D + E
G. Market share 13% 22% 23% 25% 27% 29% 30%H. Sales volume from China (k km) 43 91 107 107 143 171 186 H = F X GI. Sales volume from overseas (k km) 4 5 7 7 8 8 8J . Total sales volume (k km) 47 96 114 114 150 179 194 J = H + IK. Adjusted sales volume (k km) 47 96 114 114 147 182 194 To account for possible deferred reveneue
recognition in FY13
Source: DBS Vickers

Company Focus
Trigiant Group
Page 11
Financial analysis and forecast
1H13 review. Revenue grew by 16% to Rmb1,266m in 1H13, with net profit increasing by 29% to Rmb165m. The stronger net profit growth was due to a reduction in finance cost to Rmb29m from Rmb41m in 1H12, after paying down some bank loans with cash on hand. Interim dividend of HK7 cents per share was proposed, representing 34% payout ratio (higher than guidance of 20%+).
Overall, gross margin fell by 0.8ppt to 23.5%. Gross margin for RF coaxial cable contracted by 1ppt to 24% due to decrease in product mix of higher-specification (higher margin) products. Gross margin for flame retardant flexible cable contracted by 3ppts to 21% due to more aggressive pricing to expand market share. EBIT increased by 19% to Rmb230m, which is partly attributable to the absence of IPO related expense this year (vs. Rmb13m in 1H12).
RF coaxial cable revenue grew by 12% (accounting for 74% of revenue), driven by 29% increase in sales volume to 63,100km. This is satisfactory, in our view, because mobile infrastructure spending in 1H13 was slugghish. Capex is back-end loaded this year as China Mobile just started 4G equipment bidding in July. ASP fell by 13% to Rmb14,840 per km, partly due to 5% copper price decline, but more due to change in product mix, with less contribution from high specification RF coaxial cables. Flame retardant flexible cable was the key driver. Segmental revenue rose 55% with new contribution from China Telecom. Sales volume increased from 2,000 km in 1H12 to 3,000 km in 1H13.
1H13 results highlight
Rmb m 1H12 1H13 YoY chgRevenue 1,094 1,266 15.7%Gross profit 265 297 11.8%
Gross margin 24.3% 23.4%Other gains and loses 6 7 15.0%Selling and distribution costs -38 -34 -9.1%Administrative expenses -20 -26 29.9%Research and development costs -7 -12 69.0%Other operating expenses -13 0 -100.0%Finance costs -41 -29 -30.5%
Profit before income tax 153 201 31.9%Net profit 127 165 29.3%EPS (Rmb) 0.1393 0.1646 18.2%
Source: Company
Revenue forecast. Trigiant registered 37% revenue CAGR from FY09-FY12, which is driven by industry growth, market share gain and new product launch. RF coaxial cable has been Trigiant's major product since establishment. Segmental
revenue grew by a CAGR of 41% for FY09-12. Industry demand (in terms of km) grew by a CAGR of 9%, and Trigiant registered a much faster growth of 34% through market share gain. We forecast RF coaxial cable sales volume growth of 29% to 147k km for FY13 and 24% to 182 k km for FY14. This is supported by annual capacity expansion from 200k km by end Jun 2013 to 300k km by end FY14. We expect segment revenue growth of 24% and 23% for the coming two years. New product flame retardant flexilbe cable started to have meaningful contribution in FY11. We expect segment revenue growth of c.40% p.a. for FY13 and FY14.
Revenue growth
0500
1,000
1,5002,0002,5003,000
3,5004,000
FY09A FY10A FY11A FY12A FY13F FY14F FY15F
OthersNew-type electronic componentF lame-retardant flexible cableRF coaxical cable
RMB m
Source: Company, DBS Vickers
Production capacity of RF coaxial cable
0
50
100
150
200
250
300
350
FY09A FY10A FY11A FY12A FY13F FY14F FY15F
k km
Source: Company, DBS Vickers
Company Focus
Trigiant Group
Page 12
Key assumptions
F Y09 F Y10 F Y11 F Y12 F Y13F F Y14F F Y15F 1H12 2H12 1H13 2H13FTotal Rev enue 865 1,411 1,823 2,231 2,781 3,463 3,779 1,094 1,137 1,266 1,515(1) RF coaxial cable revenue (Rmb m) 621 1,305 1,667 1,735 2,154 2,638 2,808 832 903 936 1,218
Volume sales (including overseas market) (k km) 47 96 114 114 147 182 194 49 65 63 84ASP (Rmb per km) 13,089 13,610 14,635 15,182 14,643 14,500 14,500 16,950 13,851 14,834 14,500Gross margin (%) 18.7 19.9 22.7 23.4 23.0 23.0 23.0 25.1 21.9 23.9 22.3
(2) Flame retardant flexible cable revenue (Rmb m) 0 0 38 318 450 630 756 172 146 267 183Gross margin (%) n.a. n.a. (5.8) 24.4 21.0 21.0 21.0 23.7 25.2 21.2 20.7
(3) New-type electronic components rev (Rmb m) 170 73 88 98 98 107 118 47 50 37 61(4) Others (Rmb m) 74 33 30 80 80 88 96 43 37 26 54
Source: DBS Vickers
Unit sales of RF coaxial cable
0
50
100
150
200
250
FY09A FY10A FY11A FY12A FY13F FY14F FY15F
k km
Source: Company, DBS Vickers
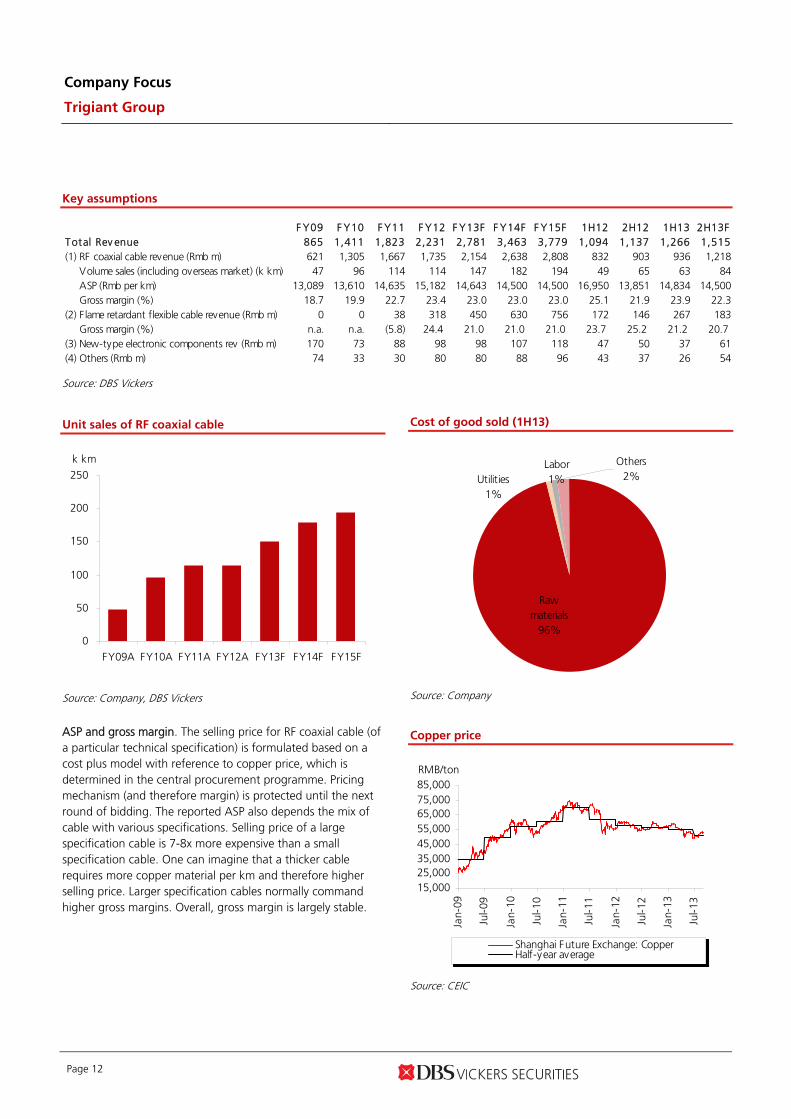
ASP and gross margin. The selling price for RF coaxial cable (of a particular technical specification) is formulated based on a cost plus model with reference to copper price, which is determined in the central procurement programme. Pricing mechanism (and therefore margin) is protected until the next round of bidding. The reported ASP also depends the mix of cable with various specifications. Selling price of a large specification cable is 7-8x more expensive than a small specification cable. One can imagine that a thicker cable requires more copper material per km and therefore higher selling price. Larger specification cables normally command higher gross margins. Overall, gross margin is largely stable.
Cost of good sold (1H13)
Raw materials
96%
Labor1%
Others2%Utilities
1%
Source: Company
Copper price
15,00025,00035,00045,00055,00065,00075,00085,000
Jan-
09
Jul-0
9
Jan-
10
Jul-1
0
Jan-
11
Jul-1
1
Jan-
12
Jul-1
2
Jan-
13
Jul-1
3
Shanghai Future Exchange: CopperHalf-year average
RMB/ton
Source: CEIC

Company Focus
Trigiant Group
Page 13
Operating expenses. Opex includng SG&A, R&D and others have been managed at c.6% of revenue in the past few years. The company stepped up R&D in FY12 for new product development after IPO. Going forward, selling expenses may also increase due to overseas market expansion.
Working capital. AR days was around 200. In our view, this is common for telecom equipment companies which sell products directly to telecom operators. Management revealed that the credit terms telecom operators require is 180+ days. Inventory level is quite low, as the company basically does not stock up on copper.
Bank loan. In 1H13, Trigiant had Rmb863m bank borrowings, and Rmb223m cash on hand. Most of the debts are short-term bank loans, so as the match the AR (usually less than 1 year), with average interest cost of 6-7% in the past. The gearing level is usually higher in the middle of the year due to more AR collection by year end. Net gearing was 36% by end of FY12 (also compared with 57% by end of Jun 2013), lowered from 69% by end of FY11 with IPO proceeds of around Rmb150m.
Cash flow. Operating cash flow in the past three years was tight, but remained positive. We do not expect significant improvement in the near-term with robust revenue growth. As for investing cash flow, management also indicated Rmb20m capex for FY13 and Rmb80m for FY14 for production capacity expansion.

Company Focus
Trigiant Group
Page 14
Valuation and recommendation
We forecast net profit growth of 35/28/10% for FY13/14/15 respectively. The company distributed interim DPS of HK0.07 per share in 1H13. We expect final DPS of HK0.07, which translates into 32% payout ratio for the full year. We assume 30% payouts for FY14 and FY15.
The stock now trades at 7.2x FY13 and 5.7x FY14 PE, which are at a discount to other telecom infrastructure stocks such
as ZTE, Comba and CCS. The stock offers 4%+ forward dividend yield. Given its strong growth potential, current valuation is undemanding. We initiate coverage with a BUY recommendation and TP of HK$5.30, tagged to 10x FY14 PE, in-line with most telecom equipment stocks' historical average PE. We believe that Capex up cycle in the coming 2 years will support the re-rating. Trigiant is the best 4G proxy, in our view; and therefore, the valuation should at least trade at par to Comba's and CCS's historical average of 10x+ forward PE.
PE band chart
PB band chart
0.5
1.0
1.5
2.0
2.5
3.0
3.5
Mar
-12
May
-12
Jul-1
2
Sep-
12
Nov
-12
Jan-
13
Mar
-13
May
-13
Jul-1
3
Sep-
13
Share Price (HK$)
2.6x
3.5x
4.5x
5.4x
6.3x
0.5
1.0
1.5
2.0
2.5
3.0
3.5M
ar-1
2
May
-12
Jul-1
2
Sep-
12
Nov
-12
Jan-
13
Mar
-13
May
-13
Share Price (HK$)
0.7x
0.9x
1.2x
1.4x
1.7x
Source: Thomson Reuters, DBS Vickers Source: Thomson Reuters, DBS Vickers
Peer valuations
T arget M k t PE PE Y ield P/Bk RO E RO ECurrenc y Pric e Pric e Rec om Cap F iscal 13F 14F 13F 13F 13F 14F 13F 14F
Company Name Code L oc al$ L oc al$ US$m Y r x x % x x x % %China F iber Optic* 3777 HK HKD 1.26 n.a. NR 198 Dec 3.9 3.5 2.6 0.7 1.6 1.3 19.0 17.9Centron Telcom 1155 HK HKD 0.9 n.a. NR 90 Dec n.a. n.a. n.a. n.a. n.a. n.a. n.a. n.a.China Comserv ice* 552 HK HKD 4.95 6.10 Buy 4,421 Dec 10.5 9.3 3.8 1.2 5.4 5.5 12.1 12.6Comba Telecom* 2342 HK HKD 2.59 2.50 Hold 510 Dec 27.8 10.2 0.9 1.0 12.1 6.8 3.7 9.7Mobi Dev elopment 947 HK HKD 1.05 n.a. NR 110 Dec 11.8 8.3 2.4 0.5 n.a. n.a. 4.1 5.1O-Net Comms.Group 877 HK HKD 1.6 n.a. NR 150 Dec 32.0 12.2 0.6 0.8 n.a. n.a. 2.6 6.8ZTE 'H'* 763 HK HKD 14.74 14.00 Hold 6,534 Dec 20.0 18.0 1.2 1.7 8.9 8.4 8.9 9.1Trigiant Group* 1300 HK HKD 3.12 5.30 Buy 402 Dec 7.2 5.7 4.4 2.0 6.0 4.8 30.2 30.3J iangsu Zhongtian 600522 CH CNY 10.19 n.a. NR 1,173 Dec 13.4 10.9 1.6 1.4 n.a. n.a. 10.8 11.8Hengxin Technology HENG SP SGD 0.162 n.a. NR 50 Dec n.a. n.a. n.a. n.a. n.a. n.a. n.a. n.a.
EV /EB IT DA
# FY13: FY14; FY14: FY15
Source: Thomson Reuters, *DBS Vickers
Company Focus
Trigiant Group
Page 15
Risks
(1) Domestic demand may be weaker than expected if the government decides not to grant TD-LTE 4G licences this year. The timing for FD-LTE licenses (probably to CT and CU) will also affect the next wave of investment. The actual spending is normally the weakest right before new licences as (i) there is no investment on the new networks and (ii) operators hold back investments on existing network upgrades.
(2) Telecom market's investment cycle may peak after 2-3 years. Growth may be unsustainable if the company fails to development new products or expand into overseas markets.
(3) The equipment sector is characterised by long account receivable days due to slow payment by telecom operators, resulting in tight operating cash flow. This may result in higher finance cost and will raise concerns on equity fund raising exercise.
(4) Some business contracts are secured due to the long established relationship with the telecom operators. This will be at risk if there is any change in the procurement mechanism.

Company Focus
Trigiant Group
Page 16
FAQs
Why did 1H13 results outperform other equipment stocks?
Mobile capex is back-end loaded this year. But management believes that the demand for RF coaxial cable was growing in 1H13. And at the same time, Trigiant further gained some market share. Other equipment companies may suffer from margin pressure on its existing products. As for RF coaxial cables, the ASP is formulated on a “cost plus” model based on copper price, and therefore the margin has been stable.
Gross margin decline in 1H13 due to competition?
The pricing mechanism pre-determines the selling price of RF coaxial cables (for various specifications) according to copper price change, and that is determined according to the latest Central Procurement results. Therefore, the market share and margin will be largely protected until the next tender bidding. Gross margin decline in 1H13 was more due to change in product mix, with less contribution from high specification (higher margin) products.
RF coaxial cable sales volumes of various specifications
75.0
31.3 37.7
33.1
12.622.9
6.2
5.22.5
0
20
40
60
80
100
120
140
FY12 1H12 1H13
Large specification (1-1/4" - 1-5/8")Mid specification (7/8")Small specification (1/4" - 1/2")
k km
+28.3%
Source: Company
Why can Trigiant supply RF coaxial cables to CM before new 4G equipment bidding?
RF coaxial cable is not regarded as new equipment, as far as 4G is concerned. RF cables for TD-LTE mainly involves change in specifications (such as frequencies). Manufacturers can continue to supply the product based on the previous CPP results. Having said that, management is hoping that CM will open tenders for flame retardant flexible cables. Trigiant has yet to gain such business from CM as the previous round of bidding was 20+ months ago (when Trigiant had not started production). They are confident to win orders from CM, as their products have already been qualified by CT and CU.
How does the company manage inventory risk in light of copper price volatility?
Trigiant does not keep copper inventory, and will only purchase the raw material when it receives orders from operators' provincial branches. Material delivery time can be as short as 1.5 days. The company does not hedge or speculate on copper.
CM mentioned that a 3G base station can be upgraded to 4G with additional Capex being 20-30% of a new base station. Does that rule apply to RF coaxial cables?
The construction cost of a new base station is around Rmb1m. Meanwhile, 3G or 4G upgrade on existing base stations may require Rmb200k-Rmb300k, as some of the equipment can be shared. However, RF coaxial cables cannot be shared for different technologies due to different frequencies. The new cable demand will have similar value as the existing cable (instead of 20-30% of existing value).
How did the company gain market share in the past few years?
Management team has been in the industry for 20+ years. Chairman, CEO and some other team members previously worked with a major competitor (Hengxin). And they have good expertise in technology development and distribution networks. Telecom operators did not view Trigiant as a “new” company when the company first started. It became a qualified supplier in a very short time. We estimate that Hengxin had 30%+ market share in FY09 based on RF coaxial cable unit shipments. But in FY12, Hengxin's revenue was about half of Trigiant's. We believe that Trigiant took away significant market share from Hengxin.

Company Focus
Trigiant Group
Page 17
Appendix
Management profile
Name T it le Prof ile Mr. Qian Lirong
(錢利榮 先生)Chairman and Executive Director
••
•
•
With over 20 years of experience in information and telecommunications industryPrincipally responsible for the overall strategic development, operation and overall management of the
Group Awarded for “Outstanding Worker in High and New Technology Industrialization” (高新技術產業化「先進工作者」) by the Ministry of Science and Technology of J iangsu Province (江蘇省科技廳 )Awarded for “Outstanding Technological Entrepreneur (Private Enterprise)” (中國優秀民營科技企業家) by the China Private Enterprise Technology Association (中國民營科技企業家協會)
Mr. J iang Wei (蔣唯 先生)
Executive Director and CEO
•••
With over 30 years of experience in information and telecommunications industry Responsible for sales and marketing activ ities of the Group
Earned a master degree of No.3 Industrial and Regional Culture and Economic Management from Shanghai Social Science Institute Arts Research Centre (上海社會科學院文學研究所第三產業暨區域文化經濟管理碩士)
Mr. Liu Xiang Rong (劉湘榮 先生)
Chief technology officer
•
••
Engaged in the R&D of optical fiber and electric cables for many years; led or participated in drafting industry standards for electric cables products.
Responsible for leading the R&D projects of the GroupCurrently the chairman of the Eighth Communications Cable Committee (通信線路委員會) of the China Institute of Communications and deputy editor in chief of Network Telecommunications (《網絡電信》) magazine
Mr. Lau Chi Hung (劉志雄 先生)
Company Secretary
••
•
With over 18 years of experience in corporate finance, accounting, and auditingWork as senior financial position for many Hong Kong listed companies and manager of assurance and
advisory department for one of the four leading international accounting firmCertified Public Accountant (Practicing) of the Hong Kong Institute of Certified Public Accountants, a fellow of the Association of Chartered Certified Accountants, an associate of the Association of Chartered Certified Accountants in England and Wales and an associate and certified tax adviser of the Taxation Institute of Hong Kong, and a member of the Association of Chartered Secretaries and Administrators and member of the Hong Kong Institute of Chartered Secretaries.
Mr. Leung Siu Kei (梁肇基 先生)
F inancial Controller
••
•
Worked as senior manager of Deloitte Touche Tohmatsu for over14 yearsResponsible for corporate finance, financial reporting and investor relations management affairs of the
GroupA fellow of the Hong Kong Institute of Certified Public Accountants and an associate of the Association of Chartered Certified Accountants
Mr. J iang Xinhong (蔣新洪 先生)
Deputy General Manager of J iangsu Trigiant
•••
With nearly 20 years of experience in the cable manufacturing industry Mainly responsible for production control and equipment purchasing management
Awarded the Economic People of PRC Information Industry of the Year (中國信息產業年度經濟人物) in 2011
Mr. Ding Weilin (丁偉林 先生)
Deputy General Manager of J iangsu Trigiant
•
••
With over 20 years of experiences in the cable manufacturing industry, led the drafting of 2 mobile communication related industry standards, and participated in setting of one communication related
national standard Responsible for product quality managements of J iangsu Trigiant
Granted the third-class award by China Communications Standards Association in December 2012 and named one of the 2012’s Top 10 Contributors in the PRC Communications Industry (中國通信產業2012年度十大貢獻人物) by China Communications Industry Association, China Electronic Information Industry Development Research Institute and China Communications Weekly
Mr. Dai Kang (代康 先生)
Deputy General Manager and Chief Engineer of J iangsu Trigiant
•
••
With over 20 years of experiences in the cable manufacturing industry, participated drafting 20 communications industry standards and 2 national standards
Responsible for research and development and technology enhancement of J iangsu TrigiantCurrently a member of Science and Technology Committee of China Electronics Components Association, v ice chairman of the expert team of Optical F iber and Electric Cable Sub-association of China Electronics Components Association, and member of Communications Cable Committee (通信線路委員會) of China Institute of Communications, awarded a special government grant from the State Council
Source: Company

Company Focus
Trigiant Group
Page 18
Shareholding structure
69.4% 7.5% 23.1% 0.025%
60%
39.975%
Abraholme(wholly owned by
Chairman Qian)
Run Sheng (wholly owned by
Chairman Qian)
Forerich and Headwell(owned by senior management and
employee)
Chairman Qian Public Shareholders
Trigiant Investments Limited
T rigiant Group L imited(1300.HK)
Source: Company
Company Focus
Trigiant Group
Page 19
Milestones
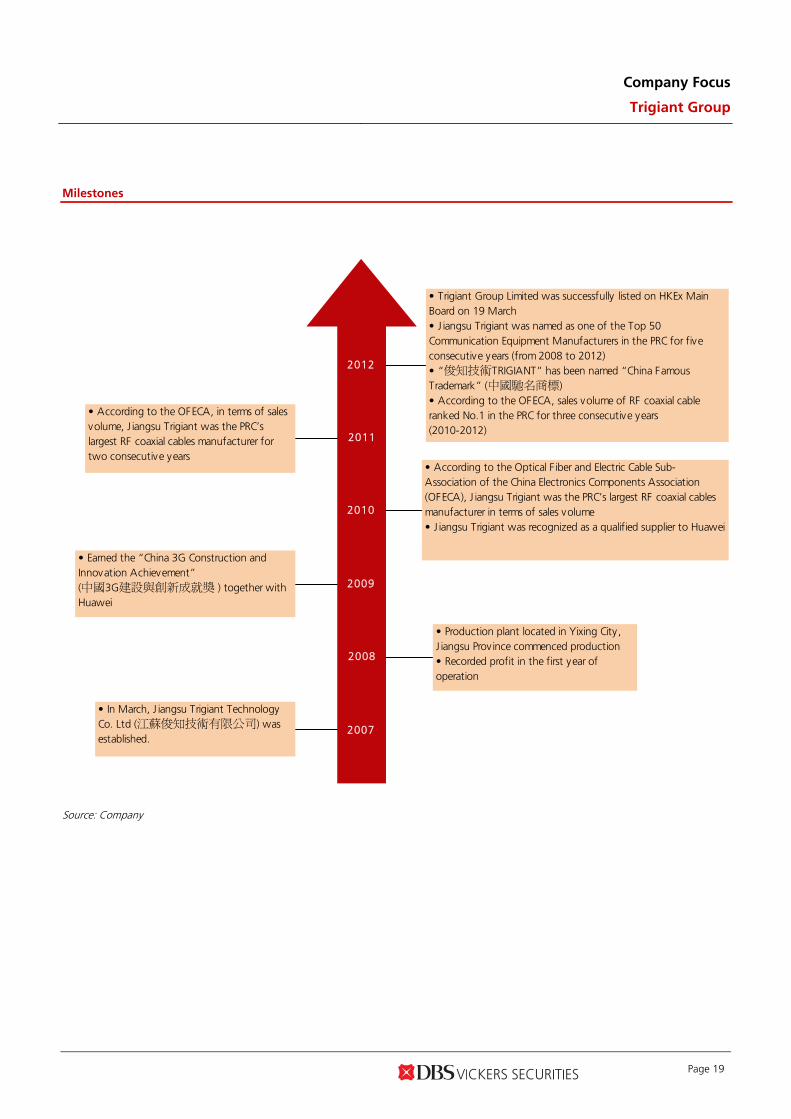
• In March, J iangsu Trigiant Technology Co. Ltd (江蘇俊知技術有限公司) was established.
• Production plant located in Yixing City , J iangsu Prov ince commenced production• Recorded profit in the first year of operation
• Earned the “China 3G Construction and Innovation Achievement” (中國3G建設與創新成就獎 ) together with Huawei
• According to the Optical F iber and Electric Cable Sub-Association of the China Electronics Components Association (OFECA), J iangsu Trigiant was the PRC’s largest RF coaxial cables manufacturer in terms of sales volume• J iangsu Trigiant was recognized as a qualified supplier to Huawei
• According to the OFECA, in terms of sales volume, J iangsu Trigiant was the PRC’s largest RF coaxial cables manufacturer for two consecutive years
• Trigiant Group Limited was successfully listed on HKEx Main Board on 19 March• J iangsu Trigiant was named as one of the Top 50 Communication Equipment Manufacturers in the PRC for five consecutive years (from 2008 to 2012)• “俊知技術TRIGIANT” has been named “China Famous Trademark” (中國馳名商標)• According to the OFECA, sales volume of RF coaxial cable ranked No.1 in the PRC for three consecutive years (2010-2012)
2007
2008
2009
2010
2011
2012
Source: Company

Company Focus
Trigiant Group
Page 20
Production facilities
Source: Company, DBS Vickers

Company Focus
Trigiant Group
Page 21
Key Assumptions Sensitivity Analysis
FY Dec 2010A 2011A 2012A 2013F 2014F 2015F
Volume sales of RF coaxial cable (k km)
95.9 113.9 114.3 147.1 182.0 193.7 2013
Gross margin (%) 20.5 21.8 23.4 22.5 22.5 22.5 Volume sales +/- 1m km Net Profit +/- 1%
Gross margin +/- 1% Net Profit +/- 7%
Segmental Breakdown (RMB m) FY Dec 2010A 2011A 2012A 2013F 2014F 2015F Revenues (RMB m) RF coaxical cables 1,305 1,667 1,735 2,154 2,638 2,808 Flame-retardant flexible cables
0 38 318 450 630 756 New-type electronic components
73 88 98 98 107 118 Others 33 30 80 80 88 96 Total 1,411 1,823 2,231 2,781 3,463 3,779
Income Statement (RMB m) Margins Trend
FY Dec 2010A 2011A 2012A 2013F 2014F 2015FRevenue 1,411 1,823 2,231 2,781 3,463 3,779 Cost of Goods Sold (1,121) (1,425) (1,709) (2,154) (2,683) (2,929) Gross Profit 290 397 522 627 780 850 Other Opng (Exp)/Inc (73) (98) (147) (164) (202) (218) Operating Profit 217 299 375 463 579 632 Other Non Opg (Exp)/Inc 0 0 0 0 0 0 Associates & JV Inc 0 0 0 0 0 0 Net Interest (Exp)/Inc (37) (52) (72) (54) (54) (54) Exceptional Gain/(Loss) 0 0 0 0 0 0 Pre-tax Profit 179 247 303 409 524 578 Tax (28) (40) (51) (70) (89) (98) Minority Interest 0 0 0 0 0 0 Preference Dividend 0 0 0 0 0 0
10.0%
11.0%
12.0%
13.0%
14.0%
15.0%
16.0%
17.0%
18.0%
2011A 2012A 2013F 2014F 2015F
Operating Margin % Net Income Margin %
Net Profit 151 207 252 340 435 479 Net Profit before Except. 151 207 252 340 435 479 EBITDA 231 316 392 482 602 662 Growth Revenue Gth (%) 63.1 29.2 22.4 24.7 24.5 9.1 EBITDA Gth (%) 90.5 36.5 24.2 22.9 24.9 10.0 Opg Profit Gth (%) 94.3 38.0 25.5 23.4 24.9 9.2 Net Profit Gth (%) 77.4 36.7 22.0 34.7 28.1 10.2 Margins & Ratio Gross Margins (%) 20.5 21.8 23.4 22.5 22.5 22.5 Opg Profit Margin (%) 15.3 16.4 16.8 16.7 16.7 16.7 Net Profit Margin (%) 10.7 11.3 11.3 12.2 12.6 12.7 ROAE (%) 108.8 49.9 31.2 30.2 30.3 26.6 ROA (%) 10.2 11.0 11.2 13.6 14.9 14.1
ROCE (%) 20.0 18.2 17.0 18.1 19.5 18.5
Div Payout Ratio (%) 0.0 0.0 32.2 32.2 30.0 30.0
Net Interest Cover (x) 5.8 5.7 5.2 8.6 10.7 11.6 Source: Company, DBS Vickers

Company Focus
Trigiant Group
Page 22
Interim Income Statement (RMB m) Margins Trend FY Dec 1H2011 2H2011 1H2012 2H2012 1H2013
Revenue 876 946 1,094 1,137 1,266 Cost of Goods Sold (688) (738) (829) (880) (969) Gross Profit 189 208 265 256 297 Other Oper. (Exp)/Inc (47) (51) (76) (71) (69) Operating Profit 142 157 190 185 228 Other Non Opg (Exp)/Inc 0 0 0 0 0
Associates & JV Inc 0 0 0 0 0
Net Interest (Exp)/Inc (21) (31) (37) (35) (27) Exceptional Gain/(Loss) 0 0 0 0 0 Pre-tax Profit 121 126 153 150 201 Tax (19) (21) (25) (25) (37) Minority Interest 0 0 0 0 0 Net Profit 102 105 127 125 165
0%
2%
4%
6%
8%
10%
12%
14%
16%
18%
20%
1H11
2H11
1H12
2H12
1H13
Operating Margin % Net Income Margin %
Net profit bef Except. 102 105 127 125 165 Growth Revenue Gth (%) N/A N/A 24.8 20.1 15.7 Opg Profit Gth (%) N/A N/A 33.7 18.1 20.3 Net Profit Gth (%) N/A N/A 25.3 18.8 29.3 Margins Gross Margins (%) 21.5 22.0 24.3 22.6 23.4 Opg Profit Margins (%) 16.2 16.6 17.3 16.3 18.0 Net Profit Margins (%) 11.6 11.1 11.6 11.0 13.0 Source: Company, DBS Vickers

Company Focus
Trigiant Group
Page 23
Balance Sheet (RMB m) Asset Breakdown
FY Dec 2010A 2011A 2012A 2013F 2014F 2015F
Net Fixed Assets 264 254 253 252 306 324 Invts in Associates & JVs 0 0 0 0 0 0 Other LT Assets 38 38 39 39 39 39 Cash & ST Invts 429 626 610 541 525 505 Inventory 60 112 145 189 236 283 Debtors 780 1,169 1,274 1,657 2,071 2,485 Other Current Assets 2 2 0 0 0 0
Total Assets 1,573 2,200 2,321 2,677 3,177 3,636 ST Debt 680 940 878 878 878 878
Creditors 297 491 312 405 506 608Other Current Liab 210 25 14 14 14 14LT Debt 150 110 90 90 90 90 Other LT Liabilities 21 21 23 42 62 71
Shareholder’s Equity 215 614 1,005 1,248 1,627 1,976 Minority Interests 0 0 0 0 0 0 Total Cap. & Liab. 1,573 2,200 2,321 2,677 3,177 3,636 Non-Cash Wkg. Capital 335 767 1,094 1,427 1,787 2,147 Net Cash/(Debt) (401) (424) (357) (427) (443) (463) Debtors Turn (avg days) 187.6 195.2 199.9 192.4 196.4 220.1 Creditors Turn (avg days) 84.1 102.2 86.6 61.3 62.5 70.1 Inventory Turn (avg days) 20.3 22.3 27.7 28.6 29.2 32.7 Asset Turnover (x) 1.0 1.0 1.0 1.1 1.2 1.1 Current Ratio (x) 1.1 1.3 1.7 1.8 2.0 2.2 Quick Ratio (x) 1.0 1.2 1.6 1.7 1.9 2.0 Net Debt/Equity (X) 1.9 0.7 0.4 0.3 0.3 0.2 Net Debt/Equity ex MI (X) 1.9 0.7 0.4 0.3 0.3 0.2 Capex to Debt (%) 4.3 0.8 1.9 2.1 8.3 5.2 Z-Score (X) NA NA NA NA NA NA Source: Company, DBS Vickers
Net Fixed Assets - 9.5%
Assocs'/JVs - 0.0%
Bank, Cash and Liquid
Assets -20.5%
Inventory -7.2%
Debtors - 62.8%

Company Focus
Trigiant Group
Page 24
Cash Flow Statement (RMB m) Capital Expenditure
FY Dec 2010A 2011A 2012A 2013F 2014F 2015F
Pre-Tax Profit 179 247 303 409 524 578 Dep. & Amort. 15 17 17 19 24 30 Tax Paid (16) (33) (41) (51) (70) (89) Assoc. & JV Inc/(loss) 0 0 0 0 0 0 (Pft)/ Loss on disposal of FAs 0 0 0 0 0 0 Chg in Wkg.Cap. (42) (225) (308) (332) (360) (360) Other Operating CF 31 47 70 56 56 56
Net Operating CF 167 52 41 101 174 215 Capital Exp.(net) (36) (8) (18) (20) (80) (50) Other Invts.(net) 0 0 0 0 0 0 Invts in Assoc. & JV (205) 0 0 0 0 0 Div from Assoc & JV 0 0 0 0 0 0 Other Investing CF 164 (157) 113 4 4 4 Net Investing CF (77) (166) 95 (16) (76) (46)
0
10
20
30
40
50
60
70
80
90
2011A 2012A 2013F 2014F 2015F
Capital Expenditure (-)
Div Paid 0 0 (41) (97) (56) (131) Chg in Gross Debt 160 220 (82) 0 0 0 Capital Issues 0 0 179 0 0 0 Other Financing CF (22) (63) (95) (58) (58) (58) Net Financing CF 138 158 (38) (155) (114) (189) Currency Adjustments 0 0 0 0 0 0 Chg in Cash 228 45 97 (70) (16) (20) Opg CFPS (RMB) 0.26 0.35 0.35 0.43 0.53 0.58 Free CFPS (RMB) 0.16 0.06 0.02 0.08 0.09 0.17 Source: Company, DBS Vickers
Company Focus
Trigiant Group
Page 25
DBSV recommendations are based an Absolute Total Return* Rating system, defined as follows:
STRONG BUY (>20% total return over the next 3 months, with identifiable share price catalysts within this time frame)
BUY (>15% total return over the next 12 months for small caps, >10% for large caps)
HOLD (-10% to +15% total return over the next 12 months for small caps, -10% to +10% for large caps)
FULLY VALUED (negative total return i.e. > -10% over the next 12 months)
SELL (negative total return of > -20% over the next 3 months, with identifiable catalysts within this time frame)
* Share price appreciation + dividends DBS Vickers Research is available on the following electronic platforms: DBS Vickers (www.dbsvresearch.com); Thomson (www.thomson.com/financial); Factset (www.factset.com); Reuters (www.rbr.reuters.com); Capital IQ (www.capitaliq.com) and Bloomberg (DBSR GO). For access, please contact your DBSV salesperson.
GENERAL DISCLOSURE/DISCLAIMER This report is prepared by DBS Vickers (Hong Kong) Limited (“DBSVHK”), a direct wholly-owned subsidiary of DBS Vickers Securities Holdings Pte Ltd ("DBSVH"). This report is intended for clients of DBSV Group only and no part of this document may be (i) copied, photocopied or duplicated in any form or by any means or (ii) redistributed without the prior written consent of DBSVHK. It is being distributed in the United States by DBSV US, which accepts responsibility for its contents. Any U.S. person receiving this report who wishes to effect transactions in any securities referred to herein should contact DBS Vickers Securities (USA) Inc (“DBSVUSA”) directly and not its affiliate. The research set out in this report is based on information obtained from sources believed to be reliable, but we (which collectively refers to DBSVHK and/or DBSVH) do not make any representation or warranty as to its accuracy, completeness or correctness. Opinions expressed are subject to change without notice. This document is prepared for general circulation. Any recommendation contained in this document does not have regard to the specific investment objectives, financial situation and the particular needs of any specific addressee. This document is for the information of addressees only and is not to be taken in substitution for the exercise of judgement by addressees, who should obtain separate independent legal or financial advice. DBSVHK accepts no liability whatsoever for any direct, indirect and/or consequential loss (including any claims for loss of profit) arising from any use of and/or reliance upon this document and/or further communication given in relation to this document. This document is not to be construed as an offer or a solicitation of an offer to buy or sell any securities. DBSVH is a wholly-owned subsidiary of DBS Bank Ltd. DBS Bank Ltd along with its affiliates and/or persons associated with any of them may from time to time have interests in the securities mentioned in this document. DBSVHK, DBS Bank Ltd and their associates, their directors, and/or employees may have positions in, and may effect transactions in securities mentioned herein and may also perform or seek to perform broking, investment banking and other banking services for these companies. Any valuations, opinions, estimates, forecasts, ratings or risk assessments herein constitutes a judgment as of the date of this report, and there can be no assurance that future results or events will be consistent with any such valuations, opinions, estimates, forecasts, ratings or risk assessments. The information in this document is subject to change without notice, its accuracy is not guaranteed, it may be incomplete or condensed and it may not contain all material information concerning the company (or companies) referred to in this report. The valuations, opinions, estimates, forecasts, ratings or risk assessments described in this report were based upon a number of estimates and assumptions and are inherently subject to significant uncertainties and contingencies. It can be expected that one or more of the estimates on which the valuations, opinions, estimates, forecasts, ratings or risk assessments were based will not materialize or will vary significantly from actual results. Therefore, the inclusion of the valuations, opinions, estimates, forecasts, ratings or risk assessments described herein IS NOT TO BE RELIED UPON as a representation and/or warranty by DBSVHK and/or DBSVH (and/or any persons associated with the aforesaid entities), that:
a. such valuations, opinions, estimates, forecasts, ratings or risk assessments or their underlying assumptions will be achieved, and
b. there is any assurance that future results or events will be consistent with any such valuations, opinions, estimates, forecasts, ratings or risk assessments stated therein.
Any assumptions made in this report that refers to commodities, are for the purposes of making forecasts for the company (or companies) mentioned herein. They are not to be construed as recommendations to trade in the physical commodity or in the futures contract relating to the commodity referred to in this report. DBS Vickers Securities (USA) Inc ("DBSVUSA"), a U.S.-registered broker-dealer, does not have its own investment banking or research department, nor has it participated in any investment banking transaction as a manager or co-manager in the past twelve months. Any US persons wishing to obtain further information, including any clarification on disclosures in this disclaimer, or to effect a transaction in any security discussed in this document should contact DBSVUSA exclusively.
ANALYST CERTIFICATION The research analyst primarily responsible for the content of this research report, in part or in whole, certifies that the views about the companies and their securities expressed in this report accurately reflect his/her personal views. The analyst also certifies that no part of his/her compensation was, is, or will be, directly, or indirectly, related to specific recommendations or views expressed in this report. As of the date the report is published, the analyst and his / her spouse and/or relatives and/or associate who are financially dependent on the analyst, do not hold interests in the securities recommended in this report (“interest” includes direct or indirect ownership of securities, directorships and trustee positions).

Company Focus
Trigiant Group
Page 26
COMPANY-SPECIFIC / REGULATORY DISCLOSURES 1. DBSVHK and its subsidiaries do not have a proprietary position in the securities recommended in this report as of the date the
report is published.
2. DBSVHK, DBSVUSA, DBS Bank Ltd and/or other affiliates may beneficially own a total of 1% or more of any class of common
equity securities of the subject companies mentioned in this document as of the latest available date of the updated information.
3. Compensation for investment banking services: DBSVHK, DBSVUSA, DBS Bank Ltd and/or other affiliates may have received compensation, within the past 12 months, and within the next 3 months may receive or intends to seek compensation for investment banking services from the subject companies mentioned in this document.
DBSVUSA does not have its own investment banking or research department, nor has it participated in any investment banking transaction as a manager or co-manager in the past twelve months. Any US persons wishing to obtain further information, including any clarification on disclosures in this disclaimer, or to effect a transaction in any security discussed in this document should contact DBSVUSA exclusively.
RESTRICTIONS ON DISTRIBUTION
General This report is not directed to, or intended for distribution to or use by, any person or entity who is a citizen or resident of or located in any locality, state, country or other jurisdiction where such distribution, publication, availability or use would be contrary to law or regulation.
Australia
This report is being distributed in Australia by DBSVR and DBSVS, which are exempted from the requirement to hold an Australian financial services licence under the Corporation Act 2001 [“CA] in respect of financial services provided to the recipients. DBSVR and DBSVS are regulated by the Monetary Authority of Singapore [“MAS”] under the laws of Singapore, which differ from Australian laws. Distribution of this report is intended only for “wholesale investors” within the meaning of the CA..
Hong Kong This report is being distributed in Hong Kong by DBS Vickers (Hong Kong) Limited which is licensed and regulated by the Hong Kong Securities and Futures Commission.
Singapore
This report is being distributed in Singapore by DBSVR, which holds a Financial Adviser’s licence and is regulated by the MAS. This report may additionally be distributed in Singapore by DBSVS (Company Regn. No. 198600294G), which is an Exempt Financial Adviser as defined under the Financial Advisers Act. Any research report produced by a foreign DBS Vickers entity, analyst or affiliate is distributed in Singapore only to “Institutional Investors”, “Expert Investors” or “Accredited Investors” as defined in the Securities and Futures Act, Chap. 289 of Singapore. Any distribution of research reports published by a foreign-related corporation of DBSVR/DBSVS to “Accredited Investors” is provided pursuant to the approval by MAS of research distribution arrangements under Paragraph 11 of the First Schedule to the FAA.
United Kingdom
This report is being distributed in the UK by DBS Vickers Securities (UK) Ltd, who is an authorised person in the meaning of the Financial Services and Markets Act and is regulated by The Financial Services Authority. Research distributed in the UK is intended only for institutional clients.
Dubai/ United Arab
Emirates
This report is being distributed in Dubai/United Arab Emirates by DBS Bank Ltd, Dubai (PO Box 506538, 3rd Floor, Building 3, Gate Precinct, DIFC, Dubai, United Arab Emirates) and is intended only for clients who meet the DFSA regulatory criteria to be a Professional Client. It should not be relied upon by or distributed to Retail Clients. DBS Bank Ltd, Dubai is regulated by the Dubai Financial Services Authority.
United States Neither this report nor any copy hereof may be taken or distributed into the United States or to any U.S. person except in compliance with any applicable U.S. laws and regulations.
Other jurisdictions
In any other jurisdictions, except if otherwise restricted by laws or regulations, this report is intended only for qualified, professional, institutional or sophisticated investors as defined in the laws and regulations of such jurisdictions.
DBS Vickers (Hong Kong) Limited
18th Floor Man Yee building, 68 Des Voeux Road Central, Central, Hong Kong
Tel: (852) 2820-4888, Fax: (852) 2868-1523