China Geology - xml-journal.cn
12
Distribution of gas hydrate reservoir in the first production test region of the Shenhu area, South China Sea Ru-wei Zhang * , Jing-an Lu, Pen-fei Wen, Zeng-gui Kuang, Bao-jin Zhang, Hua Xue, Yun-xia Xu, Xi Chen Guangzhou Marine Geological Survey, China Geological Survey, Guangzhou 510075, China ARTICLE INFO ABSTRACT Article history: Received 15 August 2018 Received in revised form 30 October 2018 Accepted 2 November 2018 Available online 3 December 2018 Keywords: Shenhu area Gas hydrate Production test Reservoir distribution In May and July of 2017, China Geological Survey (CGS), and Guangzhou Marine Geological Survey (GMGS) carried out a production test of gas hydrate in the Shenhu area of the South China Sea and acquired a breakthrough of two months continuous gas production and nearly 3.1 × 10 5 m 3 of production. The gas hydrate reservoir in the Shenhu area of China, is mainly composed of fine-grained clay silt with low permeability, and very difficult for exploitation, which is very different from those discovered in the USA, and Canada (both are conglomerate), Japan (generally coarse sand) and India (fracture-filled gas hydrate). Based on 3D seismic data preserved-amplitude processing and fine imaging, combined with logging-while-drilling (LWD) and core analysis data, this paper discusses the identification and reservoir characterization of gas hydrate orebodies in the Shenhu production test area. We also describe the distribution characteristics of the gas hydrate deposits and provided reliable data support for the optimization of the production well location. Through BSR feature recognition, seismic attribute analysis, model based seismic inversion and gas hydrate reservoir characterization, this paper describes two relatively independent gas hydrate orebodies in the Shenhu area, which are distributed in the north-south strip and tend to be thicker in the middle and thinner at the edge. The effective thickness of one orebody is bigger but the distribution area is relatively small. The model calculation results show that the distribution area of the gas hydrate orebody controlled by W18/W19 is about 11.24 km 2 , with an average thickness of 19 m and a maximum thickness of 39 m, and the distribution area of the gas hydrate orebody controlled by W11/W17 is about 6.42 km 2 , with an average thickness of 26 m and a maximum thickness of 90 m. ©2018 China Geology Editorial Office. 1. Introduction Natural gas hydrate (NGH) is a clathrate compound composed of natural gas and water under low-temperature and high-pressure conditions (Sloan ED, 1990), and referred to as “Fire Ice”, present a high density, wide distribution, huge size and concealed shallows. The amount of NGH resources is equivalent to two times the world's total reserves of coal, oil and natural gas. (Jin QH et al., 2006; Zhang HT et al., 2007). NGH is widespread in the high-latitude permafrost regions of China and the shallow sediments of the South China Sea (SCS) (Li W et al., 2013). The investigation of NGH in China started in 1999 in the Xisha trough of SCS. In March and June 2007, NGH samples were collected by the Guangzhou Marine Geological Survey (GMGS) in the Shenhu area of SCS. Subsequently, eleven spots for NGH mining were delineated with a predicted potential of 1.94 × 10 11 m 3 (Zhang HT et al., 2007). In the second half of 2013, GMGS drilled 13 drilling sites in the eastern Pearl River mouth basin of the northern slope, SCS. A large number of NGH samples of various types (massive, tumorous, stratiform, veined and dispersed) have been obtained again (Zhang GX et al., 2014; Sha ZB et al., 2015). In 2015, GMGS drilled in the Shenhu eastern area again. Two large-scale NGH orebodies were found. And a small amount of type II NGH was found (Zhang W et al., 2018; Guo YQ et al., 2017; Zhang W et al., 2017). In May and July of 2017, GMGS carried out a production test of NGH in the Shenhu area of SCS and acquired a breakthrough of two months continuous gas production and nearly 3.1 × 10 5 m 3 of production (Li JF et al., 2018; Ye JL et al., 2018). The seismic technique is the main method in use for detecting NGH. A bottom simulating reflector (BSR) on the seismic imaging section is an obvious sign of the existence of NGH and can be used for direct identification of NGH (Ma * Corresponding author: E-mail address: [email protected] (Ru-wei Zhang). doi:10.31035/cg2018049 2096-5192/© 2018 China Geology Editorial Office. China Geology 4 (2018) 493−504 China Geology Journal homepage: http://chinageology.cgs.cn
Transcript of China Geology - xml-journal.cn
Distribution of gas hydrate reservoir in the first production test region of the Shenhuarea, South China SeaRu-wei Zhang*, Jing-an Lu, Pen-fei Wen, Zeng-gui Kuang, Bao-jin Zhang, Hua Xue, Yun-xia Xu, Xi Chen Guangzhou Marine Geological Survey, China Geological Survey, Guangzhou 510075, China
A R T I C L E I N F O A B S T R A C T
Article history:Received 15 August 2018Received in revised form 30 October 2018Accepted 2 November 2018Available online 3 December 2018
Keywords:Shenhu areaGas hydrateProduction testReservoir distribution
In May and July of 2017, China Geological Survey (CGS), and Guangzhou Marine Geological Survey(GMGS) carried out a production test of gas hydrate in the Shenhu area of the South China Sea andacquired a breakthrough of two months continuous gas production and nearly 3.1 × 10⁵ m3 of production.The gas hydrate reservoir in the Shenhu area of China, is mainly composed of fine-grained clay silt withlow permeability, and very difficult for exploitation, which is very different from those discovered in theUSA, and Canada (both are conglomerate), Japan (generally coarse sand) and India (fracture-filled gashydrate). Based on 3D seismic data preserved-amplitude processing and fine imaging, combined withlogging-while-drilling (LWD) and core analysis data, this paper discusses the identification and reservoircharacterization of gas hydrate orebodies in the Shenhu production test area. We also describe thedistribution characteristics of the gas hydrate deposits and provided reliable data support for theoptimization of the production well location. Through BSR feature recognition, seismic attribute analysis,model based seismic inversion and gas hydrate reservoir characterization, this paper describes tworelatively independent gas hydrate orebodies in the Shenhu area, which are distributed in the north-southstrip and tend to be thicker in the middle and thinner at the edge. The effective thickness of one orebody isbigger but the distribution area is relatively small. The model calculation results show that the distributionarea of the gas hydrate orebody controlled by W18/W19 is about 11.24 km2, with an average thickness of19 m and a maximum thickness of 39 m, and the distribution area of the gas hydrate orebody controlled byW11/W17 is about 6.42 km2, with an average thickness of 26 m and a maximum thickness of 90 m.
©2018 China Geology Editorial Office.
1. Introduction
Natural gas hydrate (NGH) is a clathrate compoundcomposed of natural gas and water under low-temperature andhigh-pressure conditions (Sloan ED, 1990), and referred to as“Fire Ice”, present a high density, wide distribution, huge sizeand concealed shallows. The amount of NGH resources isequivalent to two times the world's total reserves of coal, oiland natural gas. (Jin QH et al., 2006; Zhang HT et al., 2007).NGH is widespread in the high-latitude permafrost regions ofChina and the shallow sediments of the South China Sea(SCS) (Li W et al., 2013). The investigation of NGH in Chinastarted in 1999 in the Xisha trough of SCS. In March and June2007, NGH samples were collected by the Guangzhou MarineGeological Survey (GMGS) in the Shenhu area of SCS.
Subsequently, eleven spots for NGH mining were delineatedwith a predicted potential of 1.94 × 10¹¹ m3 (Zhang HT et al.,2007). In the second half of 2013, GMGS drilled 13 drillingsites in the eastern Pearl River mouth basin of the northernslope, SCS. A large number of NGH samples of various types(massive, tumorous, stratiform, veined and dispersed) havebeen obtained again (Zhang GX et al., 2014; Sha ZB et al.,2015). In 2015, GMGS drilled in the Shenhu eastern areaagain. Two large-scale NGH orebodies were found. And asmall amount of type II NGH was found (Zhang W et al.,2018; Guo YQ et al., 2017; Zhang W et al., 2017). In Mayand July of 2017, GMGS carried out a production test ofNGH in the Shenhu area of SCS and acquired a breakthroughof two months continuous gas production and nearly 3.1 × 10⁵
m3 of production (Li JF et al., 2018; Ye JL et al., 2018).The seismic technique is the main method in use for
detecting NGH. A bottom simulating reflector (BSR) on theseismic imaging section is an obvious sign of the existence ofNGH and can be used for direct identification of NGH (Ma
* Corresponding author: E-mail address: [email protected] (Ru-wei Zhang).
doi:10.31035/cg20180492096-5192/© 2018 China Geology Editorial Office.
China Geology 4 (2018) 493−504
China Geology
Journal homepage: http://chinageology.cgs.cn

ZT et al., 2000; Auguy C et al., 2017). BSR can be identifiedon seismic profiles, mainly based on the following features:(1) simulated seafloor geomorphology; (2) a polarity contraryto the seafloor reflection; (3) generally crosscut with existingsedimentary strata (Dewangan P et al., 2014). BSR is alsoconsidered to be the base of the gas hydrate stability zone(GHSZ), because the isotherms are approximately parallel tothe seafloor, so the bottom of the stable zone is usuallyparallel to the seafloor (Song HB et al., 2003; Wang LF et al.,2017; Horozal S et al., 2017). The appearance of BSRindicates that there is a difference in impedance. The highimpedance above BSR is explained by NGH, while the lowimpedance below BSR is generally explained by free gas (MaZT et al., 2000; Yuan T et al., 1998).
With the amount of NGH increases, the velocities of P-wave and S-wave increase gradually (Sign S et al., 1993;Song HB et al., 2001). Therefore, NGH can be identified andestimated by its seismic velocity. Most of the seismicprediction methods of NGH originate from this basis(Carcione J and Tinivella U, 2000; Gei D and Carcione J,2003; Chand S et al., 2010). Ecker C et al. (2000) predictedand estimated the distribution and saturation of NGH in theBlack Ridge of North America by stack velocity analysis, andthe saturation is about 12%. Based on this method, Liang J etal. (2013) also studied the distribution and variation of theacoustic velocity and the seismic velocity of NGH sedimentsin the Shenhu area. Xu HN et al. (2014) used pseudo-wellconstrained inversion of post-stack data. The results show thatthere are still high-velocity sediments beneath the NGH atSH7 station in the Shenhu area. Based on the joint data of 3Dhigh-resolution seismic and ocean bottom seismographics(OBS), Zhang GX et al. (2014) determined the distribution ofNGH sediments in the Shenhu area by using the S-wave andP-wave velocity obtained from travel-time inversion. ZhangRW et al. (2015) analyzed the distribution of NGH sedimentsin the Shenhu area by the P-S wave velocity ratios from theprestack three-parameter simultaneous inversion.
Through the analysis of some research results in theShenhu area (Zhang W et al., 2017; Jin JP et al., 2017; GuoYQ et al., 2017; Su PB et al., 2017), the seismiccharacteristics of NGH are described in most literature, butthe description of the hydrate reservoir is still in thequalitative stage, and the distribution of the reservoirboundary and thickness is not fine enough to meet the needsof selection for a production test well. In this paper, with theconstraints of favorable reservoir characteristics (top andbottom depth, logging response etc.) for production tests,combined with core analysis data, and the fine distributionprediction of production tests NGH reservoir can be describedin detail by the model-based impedance inversion (Russell Band Hampson D, 1991; Zhang RW et al., 2012), whichprovides a basis for determining the production test welllocation.
2. Characteristics of the gas hydrate
2.1. Geological background
The production test area is located in the middle of the
continental slope of the southeastern Shenhu area, andnorthern SCS between Xisha Trough and Dongsha Islands (SuPB et al., 2014; Fu SY and Lu JA, 2010). The water depth isabout 800 m to 1600 m, and the test area is about 320 kmfrom Zhuhai city (Fig. 1a). Seamounts, hills, erosion ditches,downward slope ridges and submarine canyons are the maintypes of submarine topography (Fig. 1b). The topographicfeatures are generally characterized by four valleys and threeridges (Su PB et al., 2014; Wang JL et al., 2015; Liang J etal., 2013; Li W et al., 2013). The valley bottom topography isflat, and part of the bottom topography has obviousfluctuation. The valley slope is steeper, and the slump isstrong. The topography of the ridges is the most rugged andthe slump is strong. The far end of the valley is flat. Theoverall gradient is relatively smooth, with an average of 4.5°and a maximum gradient of about 38°. The steepest place islocated at the valley slope, and the slowest area is the bottomof the valley and the distal sedimentary area of the valley. Theeastern slope is obviously steeper than the west side. Therange of slope is less than 5° and is mainly distributed in thevalley bottom and the flat area of the ridge. The range of slopegreater than 5° is mainly distributed in the valley slope andthe undulating area of ridge.
The Shenhu production test area is in the seconddepression of the Pearl River Mouth Basin. Since the lateMiocene, the main structural activities are faulting, and faultsin this area are generally developed. The faults are mostdeveloped in the Pliocene, and can be divided into threegroups: NE, NW and NE trending, all of which are normalfaults. Quaternary reflective interface faults have an obviousinheritance from Pliocene faults, but the NE and NE trendingfaults are more prominent. This indicates that the NE trendingtectonic forces in the production test area have beenweakening since the Pliocene, mainly showing the moderntectonic processes such as collapse and slip (Kuang ZG et al.,2011; Zeng XM et al., 2013; Lei XM et al., 2009). Somefaults are still in activity and belong to active faults. Thesefaults play a major channel role for fluid migration in thebottom source rocks. In the later stage, a large number ofdiapir structures were formed in the middle of the depressiondue to compression. The submarine diapir and oil sourcefaults together become the main channels for fluid migration(Gong YH et al., 2009). Fig. 2 is the fracture, diapir structureand BSR reflection characteristics in the Shenhu productiontest area.
2.2. Characteristics of the production test deposit
According to the logging interpretation and the resultsfrom the core analysis of SHSC-4, the NGH reservoir isdistributed between 201−236 mbsf, and there is associatedfree gas below. The reservoir lithology is clayey silt, whereas,the mean effective porosity is 35%, the mean hydratesaturation is 34%, and the mean permeability is 2.9 mD. Thehigh content of clay minerals results in high bound waterconcentration of more than 65%, the mean median grain size
494 Zhang et al. / China Geology 4 (2018) 493−504

of the sediments is about 12 μm. The minerals are mainlyquartz-feldspathic (53%), carbonates (16%) and clay minerals(26%–30%), which are mainly montmorillonite and illite (LiJF et al., 2018).
3. Data and BSR
3.1. Seismic data
The acquisition of pseudo-3D seismic data from singlesource and single cable was completed by the “Fengdou Si”
vessel of GMGS from April to June 2008, which lasted 59days. 283 three-dimensional (3D) multi-channel seismic lineswith 50 m spacing were completed, totaling 4171.1 km andcovering an effective area of 159.75 km2. The number ofcables are 192, the spacing of cables is 12.5 m, the spacing ofguns is 25 m, the minimum offset is 125 m, the sampling rateis 1 ms, the recording length is 5 s, and the original panel sizeis 12.5 m × 50 m. The original seismic data contains strongbackground noise interference, but the frequency band iswider. The frequency bandwidth analysis with −20 dB showsthat the high frequency can reach 150 Hz and the main
Northwest
sub-sea basin
Qio
ngdo
ngna
n ba
sin
Pearl river m
outh basin
Don
gsha
HongKong
Haikou
CHINA
0 100 200 km
200 m
3000 m1000 m 10
00 m
PH
ILIP
PIN
ES
Taixi
nan
basin
Bijian
an bas
in
Xisha islands
Xisha trough basin
isla
nds
BasinHydroisobath Manila trench City
108°E 112°E 116°E 120°E
20°N
24°N
SHSC-4
Well
Central sea basin
Macao
Zhanjiang
Block
(a)
−850
−950
−1050
−1150
−1250
−1350
−1450
(b)Depth/m
Taipei
Fig. 1. Gas hydrate environments effect on survey areas, the production test location (a, modified from Li JF et al., 2018) and topography (b) in SCS.
Zhang et al. / China Geology 4 (2018) 493−504 495

frequency is about 70 Hz. Noise types mainly include: swellnoise, large-value interference, linear interference andmultiples.
Before the prediction of NGH reservoirs, pseudo-3Dseismic data have been processed by background noisesuppression, complex multiples attenuation, deconvolution,bin regularization, grid tomographic velocity modeling andprestack depth migration. Using 2–4 Hz low-cut filtering andabnormal amplitude attenuation (AAA) technology, thebackground noise can be suppressed better, and the effectivereflection signal can be highlighted with amplitudepreservation. Surface related multiple elimination (SRME),deconvolution, high precision Radon transform and frequencydivision attenuation diffraction multiples (Zhang RW et al.,2016) are combined to attenuate various complex multiplesand improve the signal-to-noise ratio. Based on the gridtomography and prestack depth migration technology, highprecision velocity model and seismic imaging effects areobtained.
3.2. Characteristics of BSR
BSR is a negative reflection coefficient, which reveals thatthe negative acoustic impedance reflectivity is generally dueto the presence of a small amount of NGH in the sedimentsand the presence of low-velocity free gas zones underlying thesediments, or the presence of irregularly distributed high-velocity hydrate sediments, and the underlying strata aresaturated sediments with background velocities. The velocitymodels represent two different NGH formations. The former
model predicts the existence of free gas under BSR, which isgenerally called the “free gas model”, while the latter modelpredicts the characteristics of NGH enrichment near BSR,which can be called the “hydrate wedge model” (Katzman Ret al., 1999; Song HB et al., 2003).
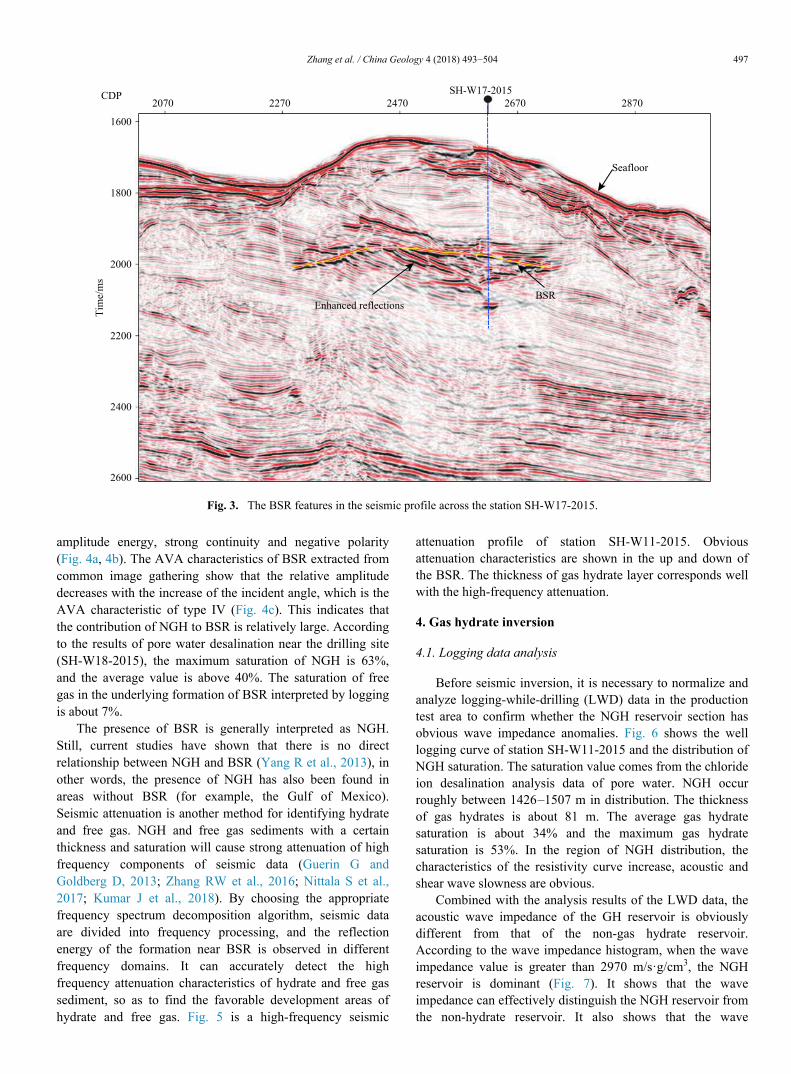
The NGH reservoir zone in the Shenhu area of SCS ischaracterized by strong BSR at the bottom, amplitude-enhanced reflector (gas accumulation area) below the BSR(Fig. 3). Faults develop at the bottom, which is favorable forgas migration and accumulation of gas hydrate stable regions.BSR is distributed around CDP # 2290−2730 and the BSR isabout 250 m from the seafloor. The amplitude is relativelycontinuous and strong, but the distribution range is relativelysmall. Below the BSR, there are strong energy reflectionamplitudes formed by free gas, and a fault and reflectionblurred area (gas migration channel) in the lower part,indicating that NGH in this area is the typical “free gasmodel”.
Also, the occurrence of NGH and free gas in this area canbe reflected by the AVA (amplitude varying with incidentangle) characteristics of BSR (Ecker C et al., 1998; ZhangRW et al., 2011; Ehsan MI et al., 2016). Fig. 4 shows theseismic migration stack section, common imaging gathers andAVA characteristics of BSR. The characteristics of BSR onthe seismic migration stack section are relatively clear andcontinuous and traceable, which is very similar to thetopography of the seafloor, and also have obviouscharacteristics of cut cross with existing sedimentary strata(Fig. 4a). BSR shows the characteristics of medium strong
1270 1470 1670 1870 2070 2270 2470 2670 2870CDP
1600
1800
2000
2200
2400
2600
2800
3000
3200
Time/ms
Seafloor
BSR
Fault
Diapir
Fig. 2. Diapir structure and faults in the seismic profile.
496 Zhang et al. / China Geology 4 (2018) 493−504
amplitude energy, strong continuity and negative polarity(Fig. 4a, 4b). The AVA characteristics of BSR extracted fromcommon image gathering show that the relative amplitudedecreases with the increase of the incident angle, which is theAVA characteristic of type IV (Fig. 4c). This indicates thatthe contribution of NGH to BSR is relatively large. Accordingto the results of pore water desalination near the drilling site(SH-W18-2015), the maximum saturation of NGH is 63%,and the average value is above 40%. The saturation of freegas in the underlying formation of BSR interpreted by loggingis about 7%.
The presence of BSR is generally interpreted as NGH.Still, current studies have shown that there is no directrelationship between NGH and BSR (Yang R et al., 2013), inother words, the presence of NGH has also been found inareas without BSR (for example, the Gulf of Mexico).Seismic attenuation is another method for identifying hydrateand free gas. NGH and free gas sediments with a certainthickness and saturation will cause strong attenuation of highfrequency components of seismic data (Guerin G andGoldberg D, 2013; Zhang RW et al., 2016; Nittala S et al.,2017; Kumar J et al., 2018). By choosing the appropriatefrequency spectrum decomposition algorithm, seismic dataare divided into frequency processing, and the reflectionenergy of the formation near BSR is observed in differentfrequency domains. It can accurately detect the highfrequency attenuation characteristics of hydrate and free gassediment, so as to find the favorable development areas ofhydrate and free gas. Fig. 5 is a high-frequency seismic
attenuation profile of station SH-W11-2015. Obviousattenuation characteristics are shown in the up and down ofthe BSR. The thickness of gas hydrate layer corresponds wellwith the high-frequency attenuation.
4. Gas hydrate inversion
4.1. Logging data analysis
Before seismic inversion, it is necessary to normalize andanalyze logging-while-drilling (LWD) data in the productiontest area to confirm whether the NGH reservoir section hasobvious wave impedance anomalies. Fig. 6 shows the welllogging curve of station SH-W11-2015 and the distribution ofNGH saturation. The saturation value comes from the chlorideion desalination analysis data of pore water. NGH occurroughly between 1426–1507 m in distribution. The thicknessof gas hydrates is about 81 m. The average gas hydratesaturation is about 34% and the maximum gas hydratesaturation is 53%. In the region of NGH distribution, thecharacteristics of the resistivity curve increase, acoustic andshear wave slowness are obvious.
Combined with the analysis results of the LWD data, theacoustic wave impedance of the GH reservoir is obviouslydifferent from that of the non-gas hydrate reservoir.According to the wave impedance histogram, when the waveimpedance value is greater than 2970 m/s·g/cm3, the NGHreservoir is dominant (Fig. 7). It shows that the waveimpedance can effectively distinguish the NGH reservoir fromthe non-hydrate reservoir. It also shows that the wave
2070 2270 2470 2670 2870
SH-W17-2015CDP
1600
1800
2000
2200
2400
2600
Tim
e/m
s
Seafloor
BSR
Enhanced reflections
Fig. 3. The BSR features in the seismic profile across the station SH-W17-2015.
Zhang et al. / China Geology 4 (2018) 493−504 497

impedance inversion is credible to predict the distribution ofNGH.
4.2. Method and results
Different methods can be used for the wave impedanceinversion of post-stack seismic data, such as band-limitedinversion, sparse spike inversion and model-based inversion,etc. (Riedel M and Shankar M, 2012). Band-limitedimpedance inversion uses the classical recursive inversionalgorithm, but ignores the influence of seismic wavelet,simply regards seismic trace as a group of reflectioncoefficients and adds low-frequency components fromlogging curves. The sparse spike inversion method takes thereflectivity as a minimum series of spikes until the matchingaccuracy of the seismic trace is sufficient, but its result is toosimple to model. Although it can well meet the seismic data,the result is usually a single geological law. The model-basedinversion uses a generalized linear inversion algorithm, which
tries to modify the initial model until the synthetic recordmatches the seismic trace within an acceptable range (RussellB and Hampson D, 1991). This method has certain knowledgeof geological conditions and can establish reliable models.
In this paper, the model-based inversion method is used.The initial model is derived from four LWD data (SH-W18-2015, SH-W19-2015, SH-W11-2015 and SH-W17-2015) andaccurate horizon interpretation information. The model-basedinversion needs to calibrate the target horizons with the initialRicker wavelet firstly. On the basis of the well-seismiccalibration, the seismic wavelet is extracted from the seismicdata and well curves, and the synthetic seismic records arereproduced with the wavelet, and the time-depth relationshipis constantly revised so that the synthetic seismic records andthe bypass seismic data can be reached.
According to the wave impedance inversion results of thestation SH-W17-2015 and SH-W11-2015 (Fig. 8 and Fig. 9),the vertical distribution of NGH coincides with the actual
2320 2400 2480 2560 2640 2720 2800 150 21501150
OffsetCDP
1300
1350
1400
1450
1500
1550
1600
Dep
th/m
1300
1350
1400
1450
1500
1550
1600
Dep
th/m
(a) (b)
0 5 10 15 3022.5 35 40
−100
0
25
50
75
−25
−50
−75
Angle/°
Rel
ativ
e A
MP
(c)
Fig. 4. Seismic migration stack section (a), common imaging gathering (b) and AVA characteristics of BSR (c) of Inline 96 (red solid line:actual amplitude change curve; blue dotted line: Shuey formula fitting curve; green dotted line: Aki & Richards formula fitting curve).
2100 2200 2300 2400 2500 2600 2700 2800CDP
1500
1600
1700
1800
1900
2000
2100
2200
2300
2400
Time/ms
SH-W11-2015
0
−5−4−3−2−1
dB
Fig. 5. Seismic high-frequency attenuation attribute profile of station SH-W11-2015.
498 Zhang et al. / China Geology 4 (2018) 493−504
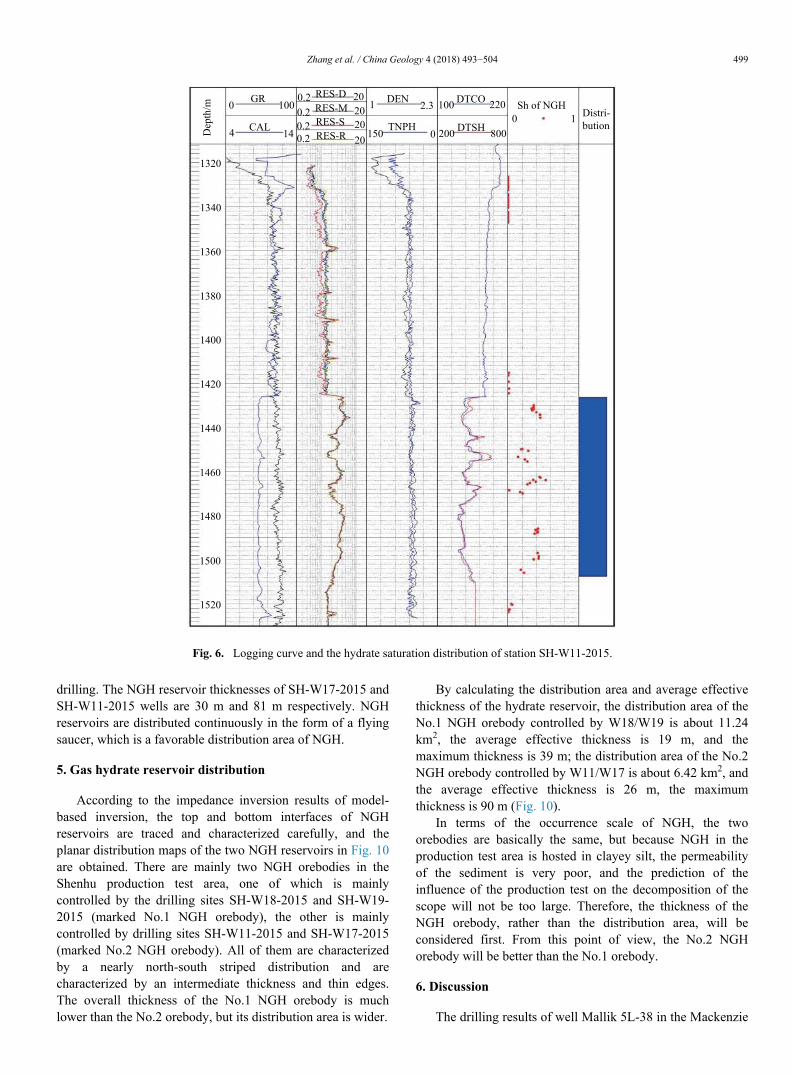
drilling. The NGH reservoir thicknesses of SH-W17-2015 andSH-W11-2015 wells are 30 m and 81 m respectively. NGHreservoirs are distributed continuously in the form of a flyingsaucer, which is a favorable distribution area of NGH.
5. Gas hydrate reservoir distribution
According to the impedance inversion results of model-based inversion, the top and bottom interfaces of NGHreservoirs are traced and characterized carefully, and theplanar distribution maps of the two NGH reservoirs in Fig. 10are obtained. There are mainly two NGH orebodies in theShenhu production test area, one of which is mainlycontrolled by the drilling sites SH-W18-2015 and SH-W19-2015 (marked No.1 NGH orebody), the other is mainlycontrolled by drilling sites SH-W11-2015 and SH-W17-2015(marked No.2 NGH orebody). All of them are characterizedby a nearly north-south striped distribution and arecharacterized by an intermediate thickness and thin edges.The overall thickness of the No.1 NGH orebody is muchlower than the No.2 orebody, but its distribution area is wider.
By calculating the distribution area and average effectivethickness of the hydrate reservoir, the distribution area of theNo.1 NGH orebody controlled by W18/W19 is about 11.24km2, the average effective thickness is 19 m, and themaximum thickness is 39 m; the distribution area of the No.2NGH orebody controlled by W11/W17 is about 6.42 km2, andthe average effective thickness is 26 m, the maximumthickness is 90 m (Fig. 10).
In terms of the occurrence scale of NGH, the twoorebodies are basically the same, but because NGH in theproduction test area is hosted in clayey silt, the permeabilityof the sediment is very poor, and the prediction of theinfluence of the production test on the decomposition of thescope will not be too large. Therefore, the thickness of theNGH orebody, rather than the distribution area, will beconsidered first. From this point of view, the No.2 NGHorebody will be better than the No.1 orebody.
6. Discussion
The drilling results of well Mallik 5L-38 in the Mackenzie
Dep
th/m
GR0 100
CAL4 14
1320
1340
1360
1380
1400
1420
1440
1460
1480
1500
1520
RES-D
RES-M
RES-S
RES-R
0.2
0.2
0.2
0.2
20
20
20
20
DEN
TNPH
1 2.3
150 0
DTCO
DTSH
100 220
200 800
Sh of NGH
0 1Distri-
bution
Fig. 6. Logging curve and the hydrate saturation distribution of station SH-W11-2015.
Zhang et al. / China Geology 4 (2018) 493−504 499

Delta of Canada (Collett TS et al., 2009; Dallimore SR andCollett TS, 2005; Zhang XH et al., 2014) show that thelithology of NGH reservoir is thickly-layered sandstoneinterbedded with conglomerate and siltstone layer. Thesaturation of NGH is from 50% to 90%, the porosity is about40%, and the permeability is from 100 mD to 1000 mD.
The lithology of the drilled samples on the north slope ofAlaska is mainly thick-layered sandstone. The porosity of thesediments is 40%, the absolute permeability is 1000 mD andthe hydrate saturation is about 70% (Anderson B et al., 2014;Schoderbek D and Boswell R, 2011; Zhang XH et al., 2014).
According to the first NGH production test in the NankaiTrough of Japan, the lithology of the NGH reservoir is theinterbedding of coarse sand and silt. The saturation of NGH isfrom 60% to 80%, the porosity is from 40% to 50%, and thepermeability is from 47 mD to 840 mD (Fujii T et al., 2015).
Well logs from the Green Canyon 955 H (GC955-H) in
the northern Gulf of Mexico (GOM) well indicate that thereare two types of gas hydrate reservoirs encountered in thiswell. One type is the fracture-filling gas hydrate in clay-bearing sediments with anisotropic physical properties (theaverage gas hydrate saturations of about 20%) and the other ispore-filling gas hydrate in sands with assumed isotropicphysical properties (the saturation reaches about 70%) (LeeMW and Collet TS, 2012).
NGH was discovered in the Krishna-Godavari (KG) Basinduring the India National Gas Hydrate Program (NGHP)Expedition 1 at Site NGHP-01-10 within a fractured clay-dominated sedimentary system. NGH saturations are greaterthan 50% (as high as 80%) of the pore space for the depthinterval between 25–160 m below the seafloor (Lee MW andCollet TS, 2009, Riedel M et al., 2010).
Boswell R (2009) proposed a “Gas Hydrates ResourcePyramid ” model, described qualitatively the positive
0.14
0.12
0.10
0.08
0.06
0.04
0.02
0.00
1700 1900 2100 2300 2500 2700 2900 3100 3300 3500 3700 3900 4100
Impedance/(m/s·g/cm3)
Hydrate reservoir
Non-hydrate reservoir2970
Fre
quen
cy d
ensi
ty
Fig. 7. Wave impedance histogram of hydrate bearing sediments and hydrate free sediments.
2475 2500 2525 2550 2575 2600 2625 2650
SH-W17-2015
CDP
1800
1900
2000
2100
Time/ms
4400
4200
4000
3800
3600
3400
3200
3000
2800
2400
2600
2200
Impedance/(m/s·g/cm3)
Fig. 8. Impedance inversion profile of inline in the station SH-W17-2015.
500 Zhang et al. / China Geology 4 (2018) 493−504

correlation between various types of NGH reservoir resourcepotential and the difficulty of exploitation, pointed out thedirection for the production of NGH. From the top to thebottom of this pyramid, the resource potential of all kinds ofreservoirs increases gradually, but the resource gradedecreases gradually, the reliability of resource predictiondecreases correspondingly, the difficulty of exploitationincreases correspondingly, and the recoverable efficiencydecreases gradually (Wu NY et al., 2017). For the pyramid, itis difficult to exploit NGH from low to high, which are
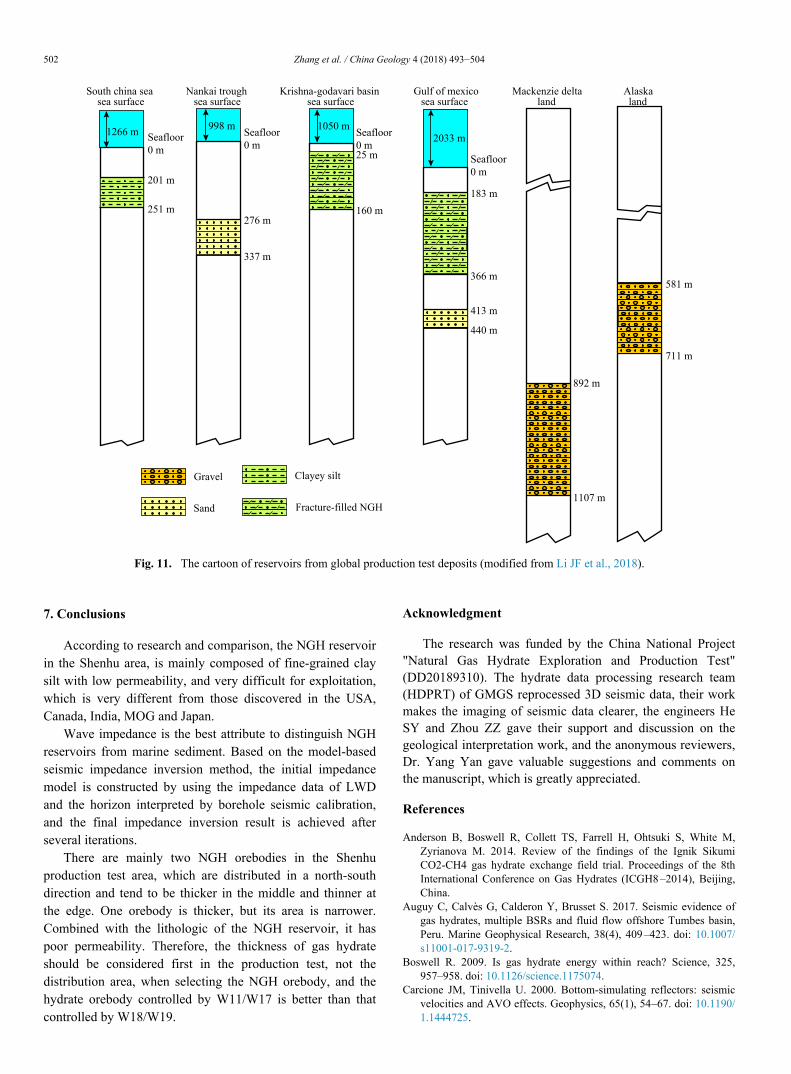
conglomerate reservoirs (Canada, Alaska), sandy reservoirs(Japan, MOG), permeable clay reservoirs (containingstructural, fracture-filled NGH) (India, MOG), cold seep-related massive reservoirs and non-permeable clay reservoirs(China). Because of the low saturation and permeability, theNGH reservoir in the Shenhu area of China, is very difficultfor exploitation, which is very different from those productiontest areas in the USA, Canada and Japan (Li JF et al., 2018)(Fig. 11).
2375 2400 2450 2475 2500 2525 2575 2600SH-W11-2015
CDP
1800
1900
2000
Time/ms
4400
4200
4000
3800
3600
3400
3200
3000
2800
2400
2600
2200
2425 2550 2625
Impedance/(m/s·g/cm3)
Fig. 9. Impedance inversion profile of inline in the station SH-W11-2015.
SH-W11-2015
SH-W17-2015
0 200 600
01530456075
SH-W18-2015
SH-W19-2015
0 250 750
32
081624
Depth/m
Depth/m
Fig. 10. The thickness distribution map of two gas hydrate deposits in the production test area of the Shenhu area.
Zhang et al. / China Geology 4 (2018) 493−504 501
7. Conclusions
According to research and comparison, the NGH reservoirin the Shenhu area, is mainly composed of fine-grained claysilt with low permeability, and very difficult for exploitation,which is very different from those discovered in the USA,Canada, India, MOG and Japan.
Wave impedance is the best attribute to distinguish NGHreservoirs from marine sediment. Based on the model-basedseismic impedance inversion method, the initial impedancemodel is constructed by using the impedance data of LWDand the horizon interpreted by borehole seismic calibration,and the final impedance inversion result is achieved afterseveral iterations.
There are mainly two NGH orebodies in the Shenhuproduction test area, which are distributed in a north-southdirection and tend to be thicker in the middle and thinner atthe edge. One orebody is thicker, but its area is narrower.Combined with the lithologic of the NGH reservoir, it haspoor permeability. Therefore, the thickness of gas hydrateshould be considered first in the production test, not thedistribution area, when selecting the NGH orebody, and thehydrate orebody controlled by W11/W17 is better than thatcontrolled by W18/W19.
Acknowledgment
The research was funded by the China National Project"Natural Gas Hydrate Exploration and Production Test"(DD20189310). The hydrate data processing research team(HDPRT) of GMGS reprocessed 3D seismic data, their workmakes the imaging of seismic data clearer, the engineers HeSY and Zhou ZZ gave their support and discussion on thegeological interpretation work, and the anonymous reviewers,Dr. Yang Yan gave valuable suggestions and comments onthe manuscript, which is greatly appreciated.
References
Anderson B, Boswell R, Collett TS, Farrell H, Ohtsuki S, White M,Zyrianova M. 2014. Review of the findings of the Ignik SikumiCO2-CH4 gas hydrate exchange field trial. Proceedings of the 8thInternational Conference on Gas Hydrates (ICGH8–2014), Beijing,China.
Auguy C, Calvès G, Calderon Y, Brusset S. 2017. Seismic evidence ofgas hydrates, multiple BSRs and fluid flow offshore Tumbes basin,Peru. Marine Geophysical Research, 38(4), 409–423. doi: 10.1007/s11001-017-9319-2.
Boswell R. 2009. Is gas hydrate energy within reach? Science, 325,957–958. doi: 10.1126/science.1175074.
Carcione JM, Tinivella U. 2000. Bottom-simulating reflectors: seismicvelocities and AVO effects. Geophysics, 65(1), 54–67. doi: 10.1190/1.1444725.
Nankai troughSouth china sea Mackenzie delta
1266 m
276 m
337 m
892 m
1107 m
201 m
251 m
581 m
711 m
Alaska
998 m
sea surfacesea surface land land
Seafloor
0 m
Gravel
Sand
Clayey silt
Seafloor
0 m
Krishna-godavari basin
25 m
160 m
1050 m
sea surface
Seafloor
0 m
Gulf of mexico
183 m
366 m
2033 m
sea surface
Seafloor
0 m
413 m
440 m
Fracture-filled NGH
Fig. 11. The cartoon of reservoirs from global production test deposits (modified from Li JF et al., 2018).
502 Zhang et al. / China Geology 4 (2018) 493−504
Chand S, Minshull TA, Gei D, Carcione JM. 2010. Elastic velocitymodels for gas‐ hydrate‐ bearing sediments - a comparison.Geophysical Journal of the Royal Astronomical Society, 159(2),573–590.
Collett TS, Johnson AH, Knapp CC, Boswell R. 2009. Natural gashydrates - Energy resource potential and associated geologic hazard.AAPG Memoir 89, 29(2), 858–869.
Dallimore SR, Collett TS. 2005. Scientific results from the Mallik.Scientific Results from the Mallik 2002 Gas Hydrate ProductionResearch Well Program, Mackenzie Delta, Northwest Territories.Canada. Bulletin of the Geological Survey of Canada, 585(CDROM), 957.
Dewangan P, Mandal R, Jaiswal P, Ramprasad T, Sriram G. 2014.Estimation of seismic attenuation of gas hydrate bearing sedimentsfrom multi-channel seismic data: A case study from Krishna-Godavari offshore basin. Marine & Petroleum Geology, 58,356–367.
Ecker C, Dvorkin J, Nur A. 1998. Sediments with gas hydrate: Internalstructure from seismic AVO. Geophysics, 63, 1659 –1669. doi:10.1190/1.1444462.
Ecker C, Dvorkin J, Nur A. 2000. Estimating the amount of gas hydrateand free gas from marine seismic data. Geophysics, 65, 565 –573.doi: 10.1190/1.1444752.
Ehsan MI, Ahmed N, Din ZU, Khalid P, Wei LX. 2016. An applicationof AVO derived attributes to analyze seismic anomalies of gashydrate bearing sediments in makran offshore, Pakistan. ActaGeodaetica Et Geophysica, 51(4), 1–13.
Fu SY, Lu JA. 2010. The characteristics and origin of gas hydrate in theShenhu area, South China Sea. Marine Geology Letters, 26(9), 6–10(in Chinese with English abstract).
Fujii T, Suzuki K, Takayama T, Tamaki M, Komatsu Y, Konno Y,Yoneda J, Yamamoto K, Nagao J. 2015. Geological setting andcharacterization of a methane hydrate reservoir distributed at the firstoffshore production test site on the Daini-Atsumi Knoll in the easternNankai Trough, Japan. Marine and Petroleum Geology, 66(2),310–322.
Gei D, Carcione JM. 2003. Acoustic properties of sediments saturatedwith gas hydrate, free gas and water. Geophysical Prospecting, 51(2),141–158. doi: 10.1046/j.1365-2478.2003.00359.x.
Gong YH, Yang SX, Wang HB, Liang JQ, Guo YQ, Wu SG, Liu GH.2009. Gas hydrate reservoir characteristics of the Shenhu area,northern slope of the South China Sea. Geoscience, 23(2), 210–216(in Chinese with English abstract).
Guerin G, Goldberg D. 2013. Modeling of acoustic wave dissipation ingas hydrate-bearing sediments. Geochemistry GeophysicsGeosystems, 6(7), 542–557.
Guo YQ, Yang SX, Liang JQ, Lu JA, Lin L, Kuang ZG. 2017.Characteristics of high gas hydrate distribution in the Shenhu area onthe northern slope of the South China Sea. Earth Science Frontiers,24(4), 24–31.
Horozal S, Bahk JJ, Urgeles R, Kim GY, Cukur D, Kim SP, Lee GH,Lee SH, Ryu BJ, Kim JH. 2017. Mapping gas hydrate and fluid flowindicators and modeling gas hydrate stability zone (GHSZ) in theulleung basin, east (Japan) sea: potential linkage between theoccurrence of mass failures and gas hydrate dissociation. Marine &Petroleum Geology, 80, 171–191.
Jin JP, Wang XJ, Chen RX, Guo YQ, Su PB, Liang JQ, Qin J. 2017.Distribution of gas hydrate in the Shenhu area: identified with welllog and seismic multi-attributes. Marine geology and Quaternarygeology, 37(5), 120–130 (in Chinese with English abstract).
Jin QH, Zhang GX, Yang MZ. 2006. Introduction to gas hydrateresource. Science Press, China, 2 –36 (in Chinese with Englishabstract).
Katzman R, Holbrook WS, Paull C K. 1994. Combined vertical-incidence and wide-angle seismic study of a gas hydrate zone, BlakeRidge. J. Geophys. Res., 99, 17975–17995. doi: 10.1029/94JB00662.
Kuang ZG, Guo YQ. 2011. The sedimentary facies and gas hydrateaccumulation models since Neogene of the Shenhu Sea area,
Northern South China Sea. Earth Science-J. China University ofGeosciences, 36(5), 915–920 (in Chinese with English abstract).
Kumar J, Sain K, Arun KP. 2018. Seismic attributes for characterizinggas hydrates: a study from the Mahanadi offshore, India. MarineGeophysical Research, 1, 1–14.
Lee MW, Collett TS. 2009. Gas hydrate saturations estimated fromfractured reservoir at Site NGHP-01-10, Krishna-Godavari Basin,India. J. Geophys. Res., 114, 1–13.
Lee MW, Collett TS. 2012. Pore- and fracture-filling gas hydratereservoirs in the Gulf of Mexico Gas Hydrate Joint Industry ProjectLeg II Green Canyon 955 H well. Marine and Petroleum Geology,34, 62–71. doi: 10.1016/j.marpetgeo.2011.08.002.
Lei XM, Zhang GX, Zeng Y. 2009. Geological factors of the formationand distribution of natural gas hydrate in the north of Shenhu area,South China Sea. Marine Geology Letters, 25(5), 1–5.
Li JF, Ye JL, Qin XW, Qiu HJ, Wu NY, Lu HL, Xie WW, Lu JA, PengF, Xu ZQ, Lu C, Kuang ZG, Wei JG, Liang QY, Lu HF, Kou BB.2018. The first offshore natural gas hydrate production test in SouthChina Sea. China Geology, 1, 5–16. doi: 10.31035/cg2018003.
Li W, Yu XH, Zeng XM, Wang JZ, Sang X. 2013. Study of Neoceneseismic and sedimentary faces in the hydrate survey area of theShenhu region on the north margin of South China Sea. MarineGeology Frontiers, 29(1), 17–26 (in Chinese with English abstract).
Liang J, Wang MJ, Lu JA, Liang JQ, Wang HB, Kuang ZG. 2013.Characteristics of sonic and seismic velocities of gas hydratesediments in the Shenhu area, northern South China Sea. Natural GasIndustry, 33(7), 29–35 (in Chinese with English abstract).
Ma ZT, Gen JH, Dong LG, Song HB. 2002. Study on the seismicidentification of marine gas hydrates. Marine Geology & QuaternaryGeology, 22(1), 1–8 (in Chinese with English abstract).
Nittala S, Sain K., Nara D. 2017. Seismic vis-a-vis sonic attenuation ingas hydrate bearing sediments of Krishna Godavari basin, easternmargin of India. Geophysical Journal International, 209, 1195–1203.doi: 10.1093/gji/ggx089.
Riedel M, Collett TS, Kumar P, Sathe AV, Cook A. 2010. Seismicimaging of a fractured gas hydrate system in the Krishna-GodavariBasin offshore India. Marine and Petroleum Geology, 27,1476–1493. doi: 10.1016/j.marpetgeo.2010.06.002.
Riedel M, Shankar M. 2012. Combining impedance inversion andseismic similarity for robust gas hydrate concentration assessments -A case study from the Krishna-Godavari basin. Marine andPetroleum Geology, 36, 35 –49. doi: 10.1016/j.marpetgeo.2012.06.006.
Russell B, Hampson D. 1991. Comparison of poststack inversionmethods. 61st Annual International Meeting, SEG, ExpandedAbstracts, 10, 876–878.
Schoderbek D, Boswell R. 2011. IgnIk Sikumi #1, Gas hydrate test well,successfully installed on the Alaska North slope. Fire in the Ice,Methane Hydrate Newsletter, 11(1), 1–5.
Sha ZB Liang JQ, Su PB, Zhang GX, Lu JA, Wang JL. 2015. Naturalgas hydrate accumulation elements and drilling results analysis in theeastern part of the Pearl River Mouth Basin. Earth Science Frontiers,22(6), 125–135 (in Chinese with English abstract).
Singh SC, Minshull TA, Spence GD. 1993. Velocity structure of a gashydrate reflector. Science, 260(5105), 204–207. doi: 10.1126/science.260.5105.204.
Sloan ED. 1990. Clathrate Hydrates of Natural Gases. New York: MarcelDekker, Inc.
Song HB, Hao TY, Song LX, Wu NY. 2001. Geophysical researches onmarine gas hydrates (I): physical properties. Progress in geophysics,16(2), 118–126 (in Chinese with English abstract).
Song HB, Zhang L, Jiang WW, Hao TY. 2003. Geophysical researcheson marine gas hydrates(Ⅲ): bottom simulating reflections. Progressin geophysics, 18(2), 182–187 (in Chinese with English abstract).
Su PB, Liang JQ, Sha ZB, Fu SY. 2014. Gas sources condition of gashydrate formation in the Shenhu deep water sea zone. Journal ofSouthwest Petroleum University: Science & Technology Edition,36(2), 1–8 (in Chinese with English abstract).
Zhang et al. / China Geology 4 (2018) 493−504 503
Su PB, Liang JQ, Zhang ZJ, Sha ZB. 2017. Analysis on the bright spotsand dim out of seismic section for diffusion-type hydrate in theShenhu area. Earth Science Frontiers, 4, 51 –56 (in Chinese withEnglish abstract).
Wang JL, Liang JQ, Zong X, Gong YH, Wan TH. 2015. Differentiateddistribution of methane hydrate in the Shenhu area of the northernSouth China Sea and controlling factors. Marine Geology Frontiers,31(1), 24–30 (in Chinese with English abstract).
Wang LF, Lu JA, Liang JQ Shang JJ, Wang JL. 2017. Research on fluidmigration rates derived from BSR at the hydrate drilling area off thenortheastern slope of the South China Sea. Earth Science Frontiers,24(4), 78–88 (in Chinese with English abstract).
Wu NY, Huang L, Hu GW, Li YL, Chen Q, Liu CL. 2017. Geologicalcontrolling factors and scientific challenges for offshore gas hydrateexploitation. Marine geology and Quaternary geology, 37(5), 1 –11(in Chinese with English abstract).
Xu HN, Zhang GX, Zheng XD, Wang MJ, Yang SX, Yang R, LiangBW. 2014. Integrated analysis of well logs and seismic data todeduce the possible distribution in depth of gas hydrate in the ShenhuArea, South China Sea. Chinese Journal of Geophysics, 57(10),3363–3372 (in Chinese with English abstract).
Yang R, Wu NY, B J, Su Z, Liang JQ, Sha ZB. 2013. Gas hydrateidentification in non-BSR region, northern South China Sea.Progress in Geophysics, 28(2), 1033–1040 (in Chinese with Englishabstract).
Ye JL, Qin XW, Qiu HJ, Liang QY, Dong YF, Wei JG, Lu HL, Lu JA,Shi YH, Zhong C, Xia Z. 2018. Preliminary results of environmentalmonitoring of the natural gas hydrate production test in the SouthChina Sea. China Geology, 1, 202–209. doi: 10.31035/cg2018029.
Yuan T, Nahar KS, Chand R, Hyndman RD, Spence GD, Chapman NR.1998. Marine gas hydrates: Seismic observations of bottom-simulating reflectors off the west coast of Canada and the east coastof India. Geohorizons, 3(1), 235–239.
Zeng XM, Yu XH, Wang JZ, Kuang ZG. 2013. Controlling factors ofnatural gas hydrate in the north of the Shenhu area, South China Sea.Marine Geology Frontiers, 29(10), 31–40 (in Chinese with Englishabstract).
Zhang GX, Liang JQ, Lu JA, Yang SX, Zhang M, Xu HN, Fu SY,Kuang ZG. 2014. Characteristics of natural gas hydrate reservoirs onthe northeastern slope of the South China Sea. Natural Gas Industry,
34(11), 1–10 (in Chinese with English abstract).Zhang GX, Xu HN, Liu XW, Zhang M, Wu ZL, Liang JQ, Wang HB,
Sha ZB. 2014. The acoustic velocity characteristics of sediment withgas hydrate revealed by integrated exploration of 3D seismic andOBS data in the Shenhu area. Chinese Journal of Geophysics, 57(4),1169–1176 (in Chinese with English abstract).
Zhang HT, Zhang HQ, Zhu YH. 2007. Research status and progress ofgas hydrate in China. Geology in China, 34(6), 953–961 (in Chinesewith English abstract).
Zhang RW, Zhang BJ, Huang HD, Xu HN. 2011. AVA characteristics ofgas hydrate bearing sediments. Oil Geophysical Prospecting, 46(4),634–639 (in Chinese with English abstract).
Zhang RW, Zhang BJ, Wei PF, Huang HD. 2012. Seismic correlationconstrained multi-channel velocity inversion. Progress inGeophysics, 27(1), 326–334 (in Chinese with English abstract).
Zhang RW, Li HQ, Zhang BJ, Huang HD, Wen PF. 2015. Detection ofgas hydrate sediments using prestack seismic AVA inversion.Applied Geophysics, 12(3), 453 –464. doi: 10.1007/s11770-015-0503-3.
Zhang RW, Li HQ, Wen PF, Zhang BJ. 2016. The velocity dispersionand attenuation of marine hydrate-bearing sediments. ChineseJournal of Geophysics, 59(9), 3417–3427 (in Chinese with Englishabstract).
Zhang RW, Zhang BJ, Huang HD, Wen PF. 2016. The method of marineresidual multiple attenuation. Computing Techniques forGeophysical and Geochemical Exploration, 38(5), 666 –671 (inChinese with English abstract).
Zhang W, Liang JQ, Lu JA, Wei JG, Su PB, Fang YX, Guo YQ, YangSX, Zhang GX. 2017. Accumulation features and mechanisms ofhigh saturation natural gas hydrate in the Shenhu Area, northernSouth China Sea. Petroleum Exploration and Development, 44(5),670–680 (in Chinese with English abstract).
Zhang W, Liang JQ, Su PB, Wei JG, Sha ZB, Lin L, Liang J, Huang W.2018. Migrating pathways of hydrocarbons and their controllingeffects associated with high saturation gas hydrate in the Shenhuarea, northern South China Sea. Geology in China, 45(1), 1–14 (inChinese with English abstract).
Zhang XH, Lu XB, Liu LL. 2014. Advances in natural gas hydraterecovery methods. Progress in Geophysics, 29(2), 858 –869 (inChinese with English abstract).
504 Zhang et al. / China Geology 4 (2018) 493−504