China Family Development Report( 2015)
18
98 China Pop. & Dev. Studies (2017) 1 (1) : 98 - 115 China Family Development Report( 2015) Hongyan LIU', Yaer ZHUANG, Ying LIANG, Weiming GUO, Zhili WANG, Hui WANG, Haidong WANG and Fei CAI Introduction The family is the most basic unit of society and its development provides important support and impetus to social advances. China has the largest population in the world and the greatest number of families, whose sizes, structures and types are becoming increasingly diverse and complex, keeping pace with ever-changing external circumstances. The Central Committee of the Communist Party of China and China' s State Council have always paid dose attention to family issues. In his address to the 2015 New Year' s gathering, Mr. Xi Jinping, General Secretary of CPC, stressed that we should, however big the changes that are taking place in our times and in our life patterns, value family development, family education and family tradition to nurture and carry forward core socialist values and traditional Chinese family virtues; promote family harmony and family affection to ensure the healthy growing up of the younger generation and proper care for the elderly. In this way, tens of millions of families , as basic units of society, can better serve national development, national advancement and social harmony. Mr. Xi's remarks not only shed much light on the direction for the development of family, but also encouraged and motivated us to do a better job in this regard. Starting from October 2014, NHFPC launched a nationwide family development longitudinal survey (the Survey) in China. The Survey, to be conducted every two years, is the fIrst of its kind led by the government. The Survey is designed to reflect the status of a11 kinds of families and family members, as they are connected to Family Planning Policy and when they undergo changes in such aspects of life as economics, societal position, health, social security and family planning. The Survey tracks changes in the forms, structures, relations and functions of any given family in the midst of its development in an effort to identify any possible causality and reveal the main issues embedded in the current family development process, so as to provide information support for scientific formulation of family development policies and effective implementation of public services. The Survey uses a stratifIed multistage PPS design and covers 31 provinces/ autonomous regions/ municipalities, targeting 32500 families from 1624 sampie 1 China Population and Development Research Center, Beijing China. Email: [email protected].
Transcript of China Family Development Report( 2015)

98 China Pop. & Dev. Studies (2017) 1 (1) : 98 - 115
China Family Development Report( 2015)
Hongyan LIU', Yaer ZHUANG, Ying LIANG, Weiming GUO, Zhili WANG, Hui WANG, Haidong WANG and Fei CAI
Introduction
The family is the most basic unit of society and its development provides important support and impetus to social advances. China has the largest population in the world and the greatest number of families, whose sizes, structures and types are becoming increasingly diverse and complex, keeping pace with ever-changing external circumstances.
The Central Committee of the Communist Party of China and China' s State Council have always paid dose attention to family issues. In his address to the 2015 New Year' s gathering, Mr. Xi Jinping, General Secretary of CPC, stressed that we should, however big the changes that are taking place in our times and in our life patterns, value family development, family education and family tradition to nurture and carry forward core socialist values and traditional Chinese family virtues; promote family harmony and family affection to ensure the healthy growing up of the younger generation and proper care for the elderly. In this way, tens of millions of families , as basic units of society, can better serve national development, national advancement and social harmony. Mr. Xi's remarks not only shed much light on the direction for the development of family, but also encouraged and motivated us to do a better job in this regard.
Starting from October 2014, NHFPC launched a nationwide family development longitudinal survey (the Survey) in China. The Survey, to be conducted every two years, is the fIrst of its kind led by the government. The Survey is designed to reflect the status of a11 kinds of families and family members, as they are connected to Family Planning Policy and when they undergo changes in such aspects of life as economics, societal position, health, social security and family planning. The Survey tracks changes in the forms, structures, relations and functions of any given family in the midst of its development in an effort to identify any possible causality and reveal the main issues embedded in the current family development process, so as to provide information support for scientific formulation of family development policies and effective implementation of public services.
The Survey uses a stratifIed multistage PPS design and covers 31 provinces/ autonomous regions/ municipalities, targeting 32500 families from 1624 sampie
1 China Population and Development Research Center, Beijing China. Email: [email protected].

China Pop. & Dev. Studies (2017) 1 Cl) : 98 -115 99
communities of 1560 town or urban districts, distributed among 233 prefecturelevel cities, and 321 county-level cities and districts. A total of 32494 families were actually interviewed. The Survey conducts face-to-face interviews, during which interviewers use the CAPI system on a laptop or PAD. A quality control mechanism is put in place to ensure that errors occurring in the process are within a controllable margin.
Compiled based on the main results from the first round of the Survey, the China Family Development Report 2015 is aimed to reflect the current circumstances of China' s family development process.
1 Family and Marriage
1. 1 Family structure and family type
A standard family household 1 is considered to have 2 or 3 members. Twoperson family households and 3-person family households make up 32. 4% and 29. 3 %, respectively, of all the families surveyed; 4-person and 5 -person families make up 15.4% and 9. 1 % , respectively; I-person make up 8.5% ; 6-person families make up 3.8%; and families with 7 or more persons make up 1. 4% (Figure 1).
15.4 32.4
.1 person
2 person
.3 persons
04 persons
. 5 pcrsons
6 persons
• 7 persons and above
Figure 1 Population distribution of family households ( % )
On average, a family household comprises 3. 02 persons, with that number being 3. 14 in rural areas and 2. 84 in urban areas. Family households with 2 to 3 persons have become the mainstream, ones with 4 to 6 persons take up a
A family household comprises people who are bound by kinship and [jve together. FamHy households included in the Survey in a given jurisdiction are part of the de jure population of the jurisdiction, including inbound mi grants , but excluding outbound migrants.
100 China Pop. & Dev. Studies (2017) 1 (1) : 98 - 115
smaller share, while family households comprising only 1 person are also part of the mix.
Two-generation family households are the mainstream. Two-generation family households make up 43.9% of all family households; one-generation households make up 37. 6 %; and three-generation households make up 17.5% .
Nearly 40% of family households have members who are elderly, i. e. seniors aged 60 or more. Family households with 1 senior make up 19.2% ; households with 2 seniors make up 18.0% ; households with 3 seniors make up 0.4% ; and households that are comprised of all seniors make up 14.9% of the households surveyed.
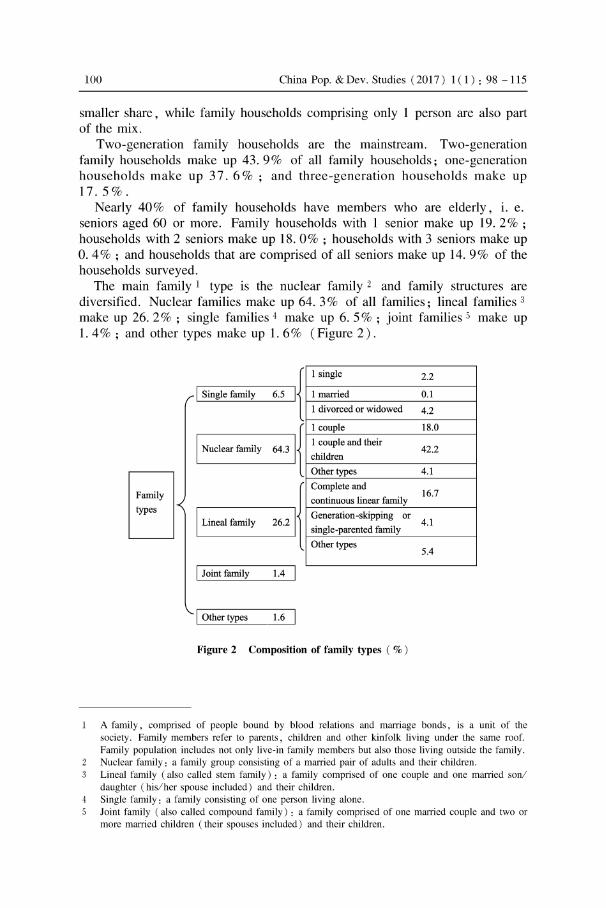
The main family 1 type is the nuclear family 2 and family structures are diversified. Nuclear families make up 64. 3 % of all families; lineal families 3
make up 26. 2 %; single families 4 make up 6. 5 % ; joint families 5 make up 1. 4 % ; and other types make up 1. 6 % (Figure 2) .
6.5 I{ I Single family
1 single 2.2
1 married 0.1
1 divorced or widowed 4.2
Mll{ I Nuc1ear family
El ~21{ types
I Lineal family
1 couple 18.0
1 couple and their 42.2
children
Othertypes 4.1
Complete and 16.7
continuous linear family
Generation -skipping or
single-parented family 4.1
Othertypes 5.4
I Joint family 1.4
I Other types
Figure 2 Composition of family types ( % )
A family, comprised of people bound by blood relations and marriage bonds, is a unit of the society. Family members refer to parents, children and other kinfolk living under the same roof. Family population inc1udes not only live-in family members but also those living outside the family. Nuc1ear family: a family group consisting of a married pair of adults and their children. Lineal family (also called stern family): a family comprised of one couple and one married sonl daughter (his/her spouse inc1uded) and their children. Single family: a family consisting of one person living alone. Joint family (also called compound family) : a family comprised of one married couple and two or more married children (their spouses inc1uded) and their children.

China Pop. & Dev. Studies (2017) 1 Cl) : 98 -115 101
1. 2 Marital status
The marriage rate remains stable in China. Among family members aged 15 years and over, 18.6% are single; 73.8% are married (first-time married and remarried); 5.7% are widowed; 1. 7% are divorced; and O. 2% are cohabiting.
In terms of age and sex, fe males younger than 34 years old are increasingly more likely to be married as they approach 34 with 90% aged 30 to 34 being married; while the proportion of married males increases more slowly, with 90% aged 40 to 44 being married (Figure 3) .
100
90
80
70
60
<ft. 50
40
30
20
10 /
..-
I I
I ,;
ale emale
I I
I I
I I ,
I I
I
I
".,;-'/
I
--_.---
O ~~~~ ____ ~ __ ~ __ -L __ ~~ __ ~ __ ~ __ ~ ____ L-__ ~ __ --'
15- 19 20- 24 25- 29 30- 34 35- 39 40-44 45-49 50- 54 55- 59 60-64 65+ (age)
Figure 3 Percentage of married males and females among population aged 15 and over
Rural areas have a higher percentage of single males. Single males are concentrated in rural areas and span across all age groups; single females are concentrated in urban areas. Some low income males in rural areas are often victims of "marriage ladder squeezing" 1 while others never find a suitable marriage partner and remain single involuntarily. More than 2 % of aged 50 and older males in rural areas are single and many of these men are very likely to remain single forever.
2 Family Economics
2. 1 Employment of family members
Eight in ten of the population aged 16 to 59 are employed. Among farnily
Maniage ladder squeezing refers to a situation where maniageable males , owing to inadequate marriageable females , tend to marry females much younger than they are , which gives rise to "old husband and young wife" couples; and, to a certain extent, urban males tend to marry rural females.

102 China Pop. & Dev. Studies (2017) 1 ( 1) : 98 -115
members aged 16 to 59, 81. 3% are employed; 3.6% are retired; 4.6% are in school; and 10. 5 % are unemployed. Fifty three percent of family members are employed in non-agricuitural sec tors and 28.3% are employed in agricuitural sectors. Overall, 15.9% of females are unemployed and 4.8 % of males are unemployed. Among seniors, 31. 9% engaged in paid labor in 2013 and, of those, 40.5% were male and 23. 8% female.
Figure 4 shows that a parabolic relationship exists between employees' work stress and their age. Among employees aged 18 to 59, 91. 0% work every week; and, of those, 35.4% feel stressed at work. Among working people feeling stress, 39.3% are male and 30.8% female, and 39. 1 % are in urban areas and 32. 9% in rural areas (Figure 4) .
• Extremel stressful • onsiderabl strcssful • Moderate
Mode tly tres fu l • tre -free
100
80
60 ';je
40
20
0
Figure 4 Work stress of employees across the age spectrum
2. 2 Family income
Wage income is the main source of family income in both urban and rural areas. Based on data from the same-kitchen population 1, wages/salary, production/operations and retirement pay I pension are the three main sources of family income; taken together these represent a 90% share of family income. The average annual family income is CNY 65814, with CNY 34858 or 53% of total family income coming from wagesl salary.
W agesl salary makes up 47. 9 % of total family income in rural areas, 9. 1 percentage points lower than its share of total family income in urban areas; the share of productionl operations in total family income in rural areas is 19. 3 percentage points higher than it is in urban areas; and retirement pay/pension
Same-kitchen population refers to household population. Compared with " family " , the tenn " household " refers to a concept with more emphasis on geographical space , which is aprerequisite for living together. Household population consists of family members living together (characterized by use of the same kitchen) under the same roof. The average size of all surveyed family households is 2. 72 persons.

China Pop. & Dev. Studies (2017) 1 Cl ) : 98 -115 103
only makes up 3. 7% of total family income in rural areas while being 15.6% in urban areas. Living allowances represent 0.6% of total family income in rural areas, twice as much as that in urban areas.
As shown by the Lorenz Curve (Figure 5), there's a wider disparity in family income in rural areas than in urban areas.
100
90
~ 80 ~ Rural areas ~ '" _ Urban areas E 70 0 u ---+- Nationwide <::
/' '- 60 0
- - -Meanline " a'o 50 /' Q
E " '" ~ 40 /' & " ..
.!: 30 /' E
" :; E 20 ./' :::l
" u 10 /'
" o 10 20 30 40 50 60
" /'
"
70 80 Cumulative Percentage of Household (%)
90
Figure 5 Lorenz curve of family income in urban and rural areas
2. 3 Family consumption
100
Expenses for food, medical care, and socializing and gifts are the three top family consumption categories. The three taken together cover 57. 0% of total family consumption, with food, cigarettes and wine being 38. 1 %, medical care 9. 6% and socializing and hospitality 9.3%. Production and operations, c1othing, daily supplies and services, education, and comrnunications and correspondence take up around 6% each, while housing is 3. 3% and travell. 3%.
Expenses for travel, housing, c1othing, and communications and correspondence take up a slightly smaller percentage of family consumption in rural areas than in urban areas, but expenses for medical care, production and operations, and socializing and hospitality make up a larger share of family consumption in rural areas than in urban areas.
3 Health and Medical Services
3. 1 HeaIthy behaviors and heaIth awareness
Obviously mental workers suffer much more severe work stress than physical workers and are more likely to fee I that work and Iife are in conflict. 52.2% of

104 China Pop. & Dev. Studies (2017) 1 (1) : 98 - 115
the population do not think there is a conflict between work and life, but 9. 0 % think there is a pronounced or severe conflict between the two. Of those holding this view, 11. 7 % are mental workers and 8. 1 % are physical workers. Responsible persons in government departments and party organizations are the group of people with the greatest work stress, followed by professionals and technical experts.
There are pronounced differences in the ways different groups, in terms of profession, age and sex, adopt healthy behaviors. People aged 18 to 59, on average, sleep 7 hours and 36 minutes every day, but those suffering serious work stress tend to sleep less. The average daily physical exercise time of people suffering serious work stress falls short of WHO recommendations. If represented on achart, the figures of exercise time for all age groups take the shape of a "U". The young and the elderly tend to have longer average daily PE hours than middle-aged people, only 40 % of whom, due to work stress, do exercises on a daily basis. Among the population aged 18 to 59, 28.5% smoke. The figure for males is 57.6% and the figure for females 1. 7%.
3. 2 State of health
Adults become more likely to be diagnosed with chronic diseases as they age. Cervical spondylosis, hypertension, and intervertebral disc-related diseases are the most common chronic adult diseases, and the likelihood of being afflicted with one of these diseases increases with age. It is worth noting that the proportion of the female population with such diseases is larger than the proportion of the male population that suffers from the diseases.
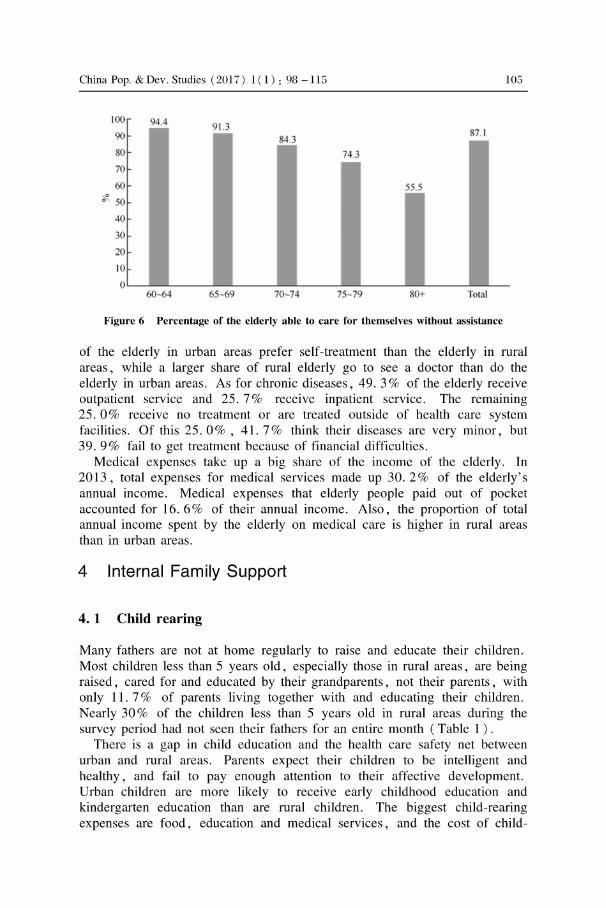
More than half of the elderly are diagnosed with chronic diseases, but their needs for nursing care are not being fully being met, with the supply of such services inadequate to meet demand. Among the elderly, 58. 1 % are diagnosed with chronic diseases, with hypertension and arthritis being the most common. The morbidity rate is higher among females than among males and higher in urban areas than in rural areas. The elderly diagnosed with disease are cared for mainly by their children, but a considerable number are left unattended. Among the elderly, 12.9% are at least partially dependent on the assistance of others in their daily lives. Of this group, 80. 1 % believe they need to be cared for by others (Figure 6 ). Currently, most care for the elderly provides them with assistance for cooking and personal hygiene. Relatively younger seniors have a considerable need for fitness facilities while relatively older seniors have an even greater need for aids like walking sticks and hearing aids.
3. 3 Medical and health services
The elderly generally visit general practitioners for minor medical problems or illnesses, but go to the hospital for the treatment of chronic medical problems. As for minor diseases, 53.5% see a doctor and 44. 0% resort to self-treatment with medicines. Concerning self-treatment, a higher percentage
China Pop. & Dev. Studies (2017) 1 Cl) : 98 -115
c
100
90
80
70
60 c 50
40
30
20 10
105
87.1 r--
74.3 r--
OL-__ ~ ____ ~ ______ -J __________ ~ ____________ J-__ __
60-64 65-69 70- 74 75- 79 80+ Total
Figure 6 Percentage of the elderly able to care for themselves without assistance
of the elderly in urban areas prefer self-treatment than the elderly in rural areas, while a larger share of rural elderly go to see a doctor than do the elderly in urban areas. As for chronic diseases, 49. 3 % of the elderly receive outpatient service and 25.7% receive inpatient service. The remaining 25. 0% receive no treatment or are treated outside of health care system facilities. Of this 25.0% , 41. 7% think their diseases are very minor, but 39.9% fail to get treatment because of financial difficulties.
Medical expenses take up a big share of the income of the elderly. In 2013, total expenses for medical services made up 30. 2 % of the elderly' s annual income. Medical expenses that elderly people paid out of pocket accounted for 16.6% of their annual income. Also, the proportion of total annual income spent by the elderlyon medical care is high er in rural areas than in urban areas.
4 Internal Family Support
4. 1 Child rearing
Many fathers are not at horne regularly to raise and educate their children. Most children less than 5 years old, especially those in rural areas, are being raised, cared for and educated by their grandparents, not their parents, with only 11. 7% of parents living together with and educating their children. Nearly 30% of the children less than 5 years old in rural areas during the survey period had not seen their fathers for an entire month (Table 1 ) .
There is a gap in child education and the health care safety net between urban and rural areas. Parents expect their children to be intelligent and healthy, and fail to pay enough attention to their affective development. Urban children are more likely to receive early childhood education and kindergarten education than are rural children. The biggest child-rearing expenses are food, education and medical services, and the cost of child-
106 China Pop. & Dev. Studies (2017) 1 (1) : 98 - 115
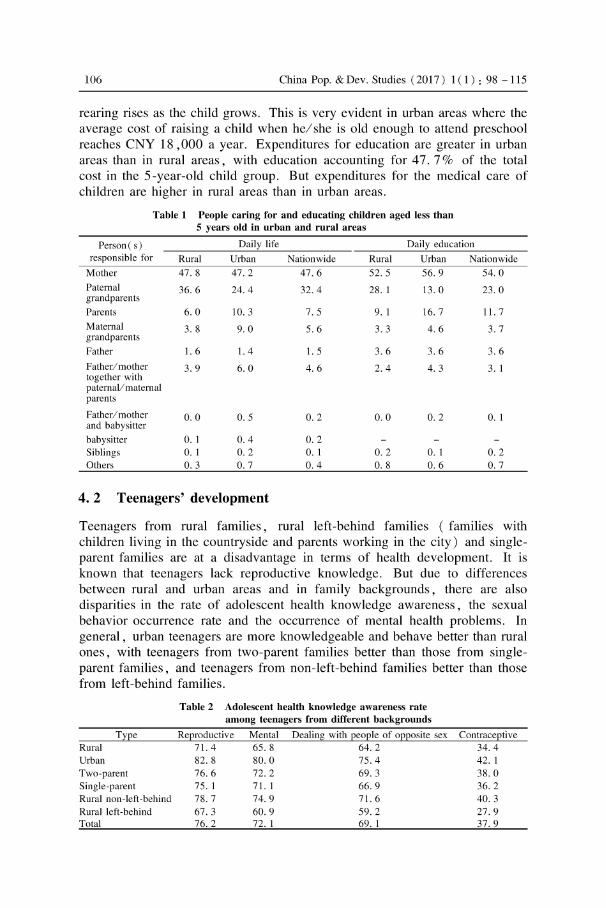
rearing rises as the child grows. This is very evident in urban areas where the average cost of raising a child when hel she is old enough to attend preschool reaches CNY 18 ,000 a year. Expenditures for education are greater in urban areas than in rural areas, with education accounting for 47. 7 % of the total cost in the 5-year-old child group. But expenditures for the medical care of children are higher in rural areas than in urban areas.
Table 1 People caring for and educating children aged less than 5 years old in urban and rural areas
Person ( s) Daily life Daily education responsible for Rural Urban Nationwide Rural Urban Nationwide
Mother 47. 8 47.2 47.6 52.5 56.9 54.0 Patemal 36.6 24.4 32.4 28. 1 13.0 23.0 grandparents Parents 6.0 10.3 7.5 9.1 16.7 11. 7 Matemal 3. 8 9.0 5.6 3.3 4.6 3. 7 grandparents Father 1.6 1.4 1.5 3.6 3.6 3.6 Father/ mother 3.9 6.0 4.6 2.4 4.3 3. 1 together with paternalI matemal parents
Father/ mother 0.0 O. 5 0.2 0.0 0.2 0.1 and babysitter babysitter O. 1 0.4 0.2 Siblings O. 1 0.2 0.1 0.2 0.1 0.2 Others O. 3 O. 7 0.4 0.8 0.6 O. 7
4.2 Teenagers' development
Teenagers from rural families, rural left-behind families (families with children living in the countryside and parents working in the city) and singleparent families are at a disadvantage in terms of health development. It is known that teenagers lack reproductive knowledge. But due to differences between rural and urban areas and in family backgrounds, there are also disparities in the rate of adolescent health knowledge awareness, the sexual behavior occurrence rate and the occurrence of mental health problems. In general, urban teenagers are more knowledgeable and behave better than rural ones, with teenagers from two-parent families better than those from singleparent families , and teenagers from non-Ieft-behind families better than those from left-behind families.
Table 2 Adolescent health knowledge awareness rate among teenagers from different backgrounds
Type Reproductive Mental Dealing with people of opposite sex Contraceptive Rural 71. 4 65. 8 64.2 34.4 Urban 82.8 80.0 75.4 42. 1 Two-parent 76.6 72.2 69.3 38.0 Single-parent 75. 1 71. 1 66.9 36.2 Rural non-left-behind 78.7 74.9 71. 6 40.3 Rural left -behind 67.3 60.9 59.2 27.9 Total 76.2 72.1 69. 1 37.9

China Pop. & Dev. Studies (201 7) 1 CI) : 98 - 115 107
4. 3 Elderly care
Financial difficulties are the most pressing problem faced by the elderly in rural areas. The average annual income of the elderly in rural areas is CNY 10609, only one third of that in urban areas. This low income results in weak purchasing power. Average annual spending by the rural elderly is CNY 8018 per person per year, less than half that of the urban elderly.
Social services provided for the elderly are inadequate. As they age, the elderly become increasingly reliant on their families , especially their children, for care. The elderly, in general, mainly need health care and medical services, and rural areas generally lack various other social services that the elderly need. In fact, overall elderly care services in both rural and urban areas are still far from adequate to meet the demand for services (Table 3 ) .
Table 3 The elderly needs for and receiving of community services in rural and urban areas
Needs Receiving Community services
Rural Urban Rural Urban House-call housework House-call nursing House-call treatment Health examinationl consultation Psychological consultation Traditional Chinese Medicine healthcare Emergency call bell Food delivery Accompaniment during treatment Assistance with daily shopping College for the elderly Daycare for the elderly Assistance with farm work Family / neighbor dispute resolution assistance
5 Families in Urbanization
5. 1 Migrant families
19.3 19.9 31. 1 43.8 15.3 26.0 17.3 13.0 22.0 16.8 8. 7
12.0 22.9 10. 1
13.1 2.4 4.4 10.4 2.0 1.4 14. 7 10. 1 2. 7 34.3 26.5 28.6 8.6 1. 1 0.6
17.7 3. 1 5.0 14.3 0.4 1. 1 7.5 0.5 0.5
10.7 5.6 2.2 7.7 4.0 1.5 8.0 0.2 2. 7 5.6 0.2 0.0
6.8 4.5 2.6 1.3
Migrant families have become an important family form in China. Migrant families represent 17. 2 % of all Chinese families , with 55. 8 % registered in rural areas and 27. 1 % in urban areas. The labor force group ranks the top in the migrating families, followed by the young children group. When migrating to an urban area, parents are likely to bring their children with them.
Currently most population migration involves the migration of families. Family households that migrate are, on average, composed 2. 59 persons, because 2-person and 3-person family households together make up more than

108 China Pop. & Dev. Studies (2017) 1 (1) : 98 - 115
60% of all family households. In 81. 7 % of 2-person households, couples (husbands and wives, or cohabiting partners) migrate together; in 84. 7 % of 3 -person households, both parents and their children migrate together.
Migrant families are relatively stable. 56. 8 % of migrant families have been living in a fixed location for 5 years or longer ; 15. 0 % for 3 or 4 years; 17. 1 % for 1 or 2 years; and 11. 1 % for less than 1 year. On average, families that have lived for less than one year in the same location are comprised of 2. 0 persons, while families that have lived for five years or more in the same location are, on average, comprised of 2. 7 persons; in the case of 63. 6% of this group of families , all family members have migrated.
Land represents an important link connecting migrant families to their rural origins. Of all migrant families originally from rural areas, 65. 8 % still own collectively-contracted land, 4. 1 % are land lessees and 9. 7% land leasers.
5.2 Left-behind families in rural areas
Rural left-behind children 1 make up 27. 9 % of the total child population in rural areas. The proportion of rural left-behind children in economically developed eastern regions is relatively lower, accounting for 22. 6%. In the central part of the country 33. 6 % of rural children have been left behind, and the proportion is 30. 5% in the west. Figure 7 shows the proportion of leftbehind children by age. After the first entry of 18. 3% for children younger than 1 year old (0 year group) , the percentage rises somewhat and then remains relatively stable from ages 1 to 15. There is then a significant increase of left-behind children aged 15 and older. This is attributable to current rules for the taking college entrance examination. Most candidates must complete their high school education and take the entrance exam in the place of their household registration. High school age children who hope to attend college must return to their hometowns and, as a result, the proportion of left-behind high school age children increases. Among left-behind children under 5 years of age in rural areas, 57. 7 % are cared for primarily by their grandparents.
Ruralleft-behind women 2 make up 6. 1 % of all the women in rural areas, with a large proportion engaged in physical labor. In general, the families of left-behind women are relatively sound financially; 44. 9 % of these families income exceeds expenditures, as compared to 41. 8 % of the families of women who have not been left behind. Moreover, 95.2% of left-behind women are engaged in physical labor. Left-behind women are less likely to have physical health examinations and more likely to be diagnosed with chronic diseases than non-Ieft-behind women.
1 Rural left-behind children refers to children with rural household registrations who have rernained in their rural hornes while one or both of their parents works in a city.
2 Ruralleft-behind wornen refers to wornen who are living alone or with family rnernbers in the rural locale where they have their rural household registrations while their husbands are working in a city.

China Pop. & Dev. Studies (2017) 1 Cl) : 98 -115 109
50
45
40
35
30
*' 25
20
15
10
5
0 0 I 2 3 4 5 6 7 8 9 10 11 12 13 14 15 16 17 (age)
Figure 7 Age distribution of rural left-behind children
Rural left-behind elderly 1 make up 23. 3 % of the total elderly population in rural areas, with a large proportion of them engaged in physical labor. More of the rural left-behind elderly are females than males and their average age is 67. 3. Among the rural left-behind elderly, 51. 8% are still engaged physical labor, higher than the percentage of non-Ieft-behind elderly still working (39. 2 % ). The percentage of rural left-behind elderly with at least one chronic disease stands at 52.4%, representing potentially high medical costs.
6 External Support for Family Development
6. 1 Community building for family development
Basic sanitation facilities in rural areas are in need of improvement and upgrading. As shown in the survey, in rural areas, 57.6% people drink tap water, 39.9% use coal gas/natural gas/liquefied gas and 10.4% use electricity. More than half the surveyed villages still use latrines, only 18.2% use flush toilets. But a large proportion of the roads in the countryside are paved. Of all the roads leading from country villages to town-level governments, 94.9% are asphalted or cemented. Even in the western part of the country, the proportion of paved roads is as high as 90%. Drainage pipeline system are in place in more than one third of the rural areas. Although 69.2% of all villages use centralized garbage incineration, there are substantial regional differences in this regard, with that proportion of villages being less than 50% in the west and more than 90% in the
Rural left-behind elderly refer to people aged 60 who have remained in the locale of their rural household registration and all of whose children (spouses included) have left the location of the household registration for longer than six months.
llO China Pop. & Dev. Studies (2017) 1 ( 1) : 98 -115
east. Procedures sort waste for recycling should be effectively implemented in
urban areas. Only 45. 6% of all neighborhoods have adopted and carry out such practices, while 54. 4 % have not.
6. 2 Subsistence allowances support for family development
The minimum subsistence allowances for urban and rural residents need to be raised. In 2013, the minimum subsistence allowances were, on average, CNY 424 per person per month for urban residents and CNY 207 per person per month for rural residents; the lowest subsistence allowance was CNY 50.
There are marked disparities in collective village-level welfare programs among villages. Since village-level welfare programs are focused on elderly care and medical services, nearly half of all villages give relevant subsidies to villagers. Of all the surveyed villages, 56.2% provide "New Rural Cooperati ve Medical Scheme" allowances, 49. 3 % provide housing allowances, 45.9% provide "New Rural Social Pension Insurance" allowances and 40. 7% provide collective elderly care or senior allowances.
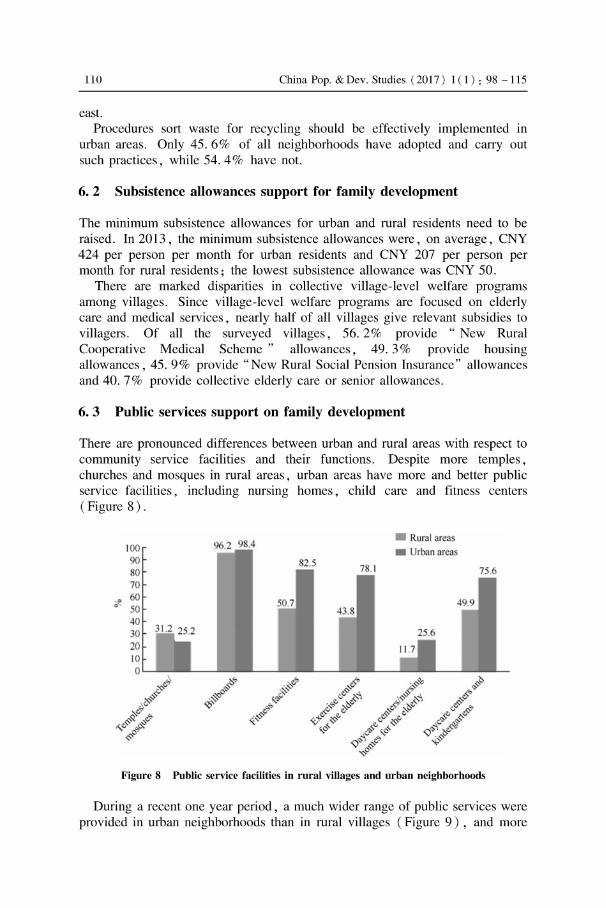
6. 3 Public services support on family development
There are pronounced differences between urban and rural areas with respect to community service facilities and their functions. Despite more temples, churches and mosques in rural areas, urban areas have more and better public service facilities, including nursing hornes, child care and fitness centers (Figure 8).
• Rural areas 100 • Urban areas 90 0
70
0 60 0
50 40 30 20 10 0
Figure 8 Public service facilities in rural villages and urban neighborhoods
During arecent one year period , a much wider range of public services were provided in urban neighborhoods than in rural villages (Figure 9) , and more
China Pop. & Dev. Studies (2017) 1 Cl ) : 98 -115 111
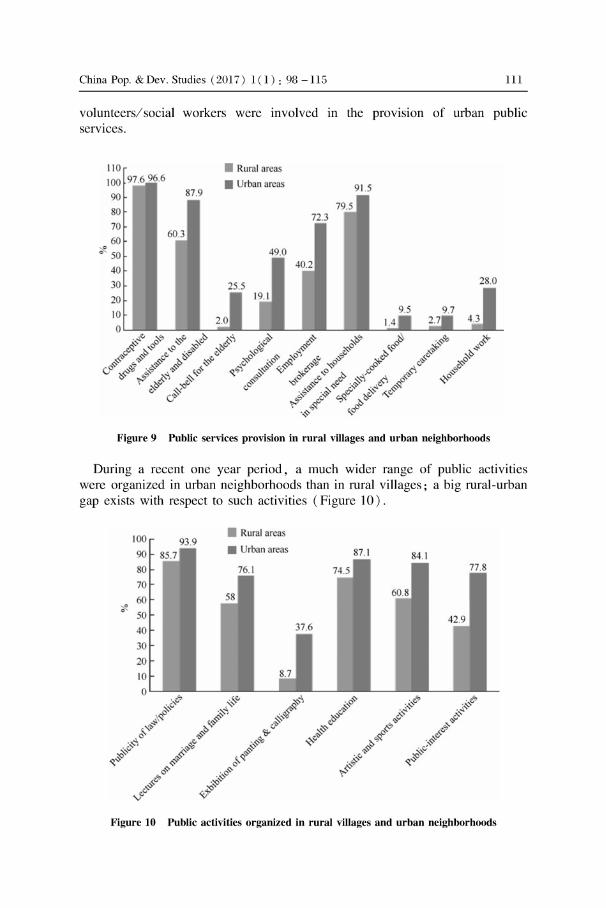
volunteersl social workers were involved in the provision of urban public services.
110 100 97.6 96.6
90
80 70 60
~ 50
87.9
60.3
Rural arca
• rban area
49.0
72.3
91.5
79.5
Figure 9 Public services provision in rural villages and urban neighborhoods
During arecent one year period , a much wider range of public activities were organized in urban neighborhoods than in rural villages; a big rural-urban gap exists with respect to such activities (Figure 10) .
100 • Rural areas
93.9 90 • rban area
80
70
60 ~
50
40
30
20
10
Figure 10 Public activities organized in rural villages and urban neighborhoods

112 China Pop. & Dev. Studies (2017) 1 (1) : 98 - 115
Community-level health services are in need of improvement and optimization in both urban and rural areas. There are Community Health Service Stations in 69. 6% of the surveyed neighborhoods, with slight regional variations between the east, central, west and northeast of the country. Despite a relatively complete, functioning system, only a small proportion of these service stations provide rehabilitation treatment. In addition, there is a shortage of in-horne medical care resources in urban areas. However, 72.8% neighborhoods have compiled Resident Health Documents and 56. 4 % of these have been saved to computers. In rural areas, on average, two doctors are working in every village, but there are still 8. 2 % of villages with no doctors in service.
7 Conclusion and Suggestions
7.1 Main conclusions
Family size is becoming smaller and family type becoming more diverse. 3-person farnilies and 2-generation farnilies have become mainstream farnily types, with nuc1ear families making up more than 60% of all types of families. At the same time, I-person farnilies, empty-nest farnilies, single-parent farnilies, cohabiting families, migrant farnilies and left-behind farnilies are appearing in greater numbers. The marriage status of Chinese is relatively stable, and an rural-urban difference is evident when it comes to the gender distribution of unmarried groups.
There are marked differences in consumption levels and consumption structures between urban and rural families. Although wage income is the major source of farnily income in both urban and rural areas, income disparities among rural farnilies are more pronounced than income disparities among urban farnilies. Expenses for food, medical care, and socializing and hospitality are the top three farnily consumption categories in both urban and rural areas. Expenses for travel, c10thing , housing, and communications and correspondence make up a slightly smaller percentage of farnily consumption in rural areas than in urban areas, but expenses for medical care, production and operations, and socializing and hospitality make up a larger share of farnily consumption in rural areas than in urban areas. Overall, medical expenses make up more than 30% of the expenses of the elderly, with the percentage for rural elderly being higher, indicating that medical expenses are a heavy burden on the rural elderly.
There is a great need for elderly care and for the integration of medical treatment with nursing care in both urban and rural areas. The social security system for urban elderly people is far better than that for rural elderly people. Elderly people not only need family members to assist in their care, they also need emotional support from their spouses. The need for elderly care services is concentrated on health and medical services; these are the core services needed by the elderly. Of these services, 90% deliver physical

China Pop. & Dev. Studies (201 7) 1 CI) : 98 - 115 113
health examinationsl consultations, at horne care, and Traditional Chinese Medicine health services. The elderly have greater needs with regards to social service. With less support from families and fewer social services available, the rural elderly receive weaker social services support than the urban elderly.
Only a small proportion of families have parents raising and educating their children together; and the role of fathers in child-rearing is inadequate. Of children under 5, 80 % are being raised and educated mainly by their mothers or by their grandparents, indicating that most fathers are playing too small a role in child-rearing. Only 7.5% families have both parents taking care of their children and only 11. 7 % have both parents involved in the education of their children. Growing up in single-parent families or left-behind families tends to have a major impact on the education, physical growth and mental development of young children and teenagers, as weIl as on the social support available to these young people.
Migrant families and left-behind families have become common. Family migration is the main pattern of population migration. In more than 80% of 2-person family households that migrate, couples (husbands and wives, or cohabiting partners) migrate together, and in more than 80% of 3-person family households that migrate , parents and their children migrate together. Left-behind families , which have come into being in tandem with migrating families, have also become an important family form. Despite relatively sound financial conditions, left-behind families are confronted with such problems as child rearing, lack of support for women and elderly care.
There are pronounced differences between urban and rural areas with respect to community service facilities and their functions. with basic sanitation facilities in rural areas being in need of improvement and optimization. More than 40% of the rural villages surveyed have no access to tap water; nearly half of them are still using firewood and coal as fuels; only 30% have drainage pipeline systems in place; more than 50% still use latrines. While there are notable regional differences when it comes to centralized garbage incineration in rural areas, urban areas need better implementation of procedures to sort waste for recycling. Urban areas have more and better public services and facilities than rural areas, including nursing hornes, child care facilities and fitness centers.
7. 2 Policy suggestions
Gradually put in place policies that are universally applicable and beneficial to families that are increasingly smaller and more diverse. Policies entitling fathers to leaves of absence when their spouses give birth need to be introduced to encourage fathers to take on more family responsibilities. Policies entitling adult employees who have elderly parents over 70 in need of care living in their hornes to paid leaves need to be adopted to strengthen the bond between adult children and their elderly parents. Policies entitling adult employees who have children younger than 5 to paid

114 China Pop. & Dev. Studies (2017) 1 (1) : 98 - 115
1eaves need to be put in place to enable parents, especially fathers, to play a greater ro1e in child rearing. Govemment subsidies should be given to grandparents, patemal or matemal , who are taking care of infants and children younger than 3 to encourage family members to strengthen intergenerational affection.
Promote health throughout the life cycle in every family. Differentiated policy support should be developed to promote the health of infants , teenagers, adults and the elderly in light of their own life cyc1e conditions. In order to strengthen awareness of the need for infants and pre-school children to have physical examinations , education programs on birth defects and infant and pre-school children growth and development should be conducted at the time coup1es register for marriage. In order to help teenagers develop a healthy life style, knowledge of health management concepts, disease prevention and control, as well as how to obtain emergency medical assistance should be inc1uded in the common-sense education programs for middle and primary school students. Policies should be introduced to make basic physical examinations free to help adults be more responsible for managing their own health, to help prevent geriatric diseases, and to prolong the lives of elderly.
Explore ways to establish a safety-net system for delivery of long-term nursing care. Studies should be conducted on the design of such a system, and efforts should be made to establish a coordinated mechanism, based on the family unit and combining social insurance and commercial insurance, to provide funding and direct resource allocation. Home-based elderly care mechanisms should be put in place and improved, and community-based elderly care services need to be strengthened. Community-Ievel health service systems in both urban and rural areas should be utilized fully, and human resources to provide nursing care should be cultivated, so as to make grassroots health care service organizations better able to provide daily care, chronic disease management, rehabilitation treatment, and health education and consultation to the elderly. In addition, efforts should be made to encourage health care facilities to set up family-based sick beds in a bid to provide long-term nursing services to fully or partially physically impaired semors.
Develop and strengthen policies that integrate medical treatment with nursing care. Policies that combine medical treatment and nursing care should be inc1uded in overall economic and social development planning to promote innovation in elderly care and the emergence of new types of businesses. Modem information technology should be employed to build a family-based platform and community-based intelligent terminals for elderly care that integrate all relevant resources to provide health consultation, date management, chronic disease prevention and control, emergency assistance and other life services. At the same time, medical and health resources and elderly care resources should be integrated to build a complete medical and nursing service system to encourage health facilities to set up beds dedicated to elderly nursing. Finally, efforts should be made to direct

China Pop. & Dev. Studies (201 7) 1 CI) : 98 - 115 115
the entry of medical and health resources into elderly nursing care institutions and community daycare centers that support elderly while family members work in a bid to provide in horne medical & nursing services for the elderly.
Improve policies on family development in the midst of the new urbanization process. Efforts should be made to promote equal access to basic public services both for local families and migrant families in any given city. A residence permit system should be set up to inc1ude migrant families in the local household management system. After remaining in a city and paying for local social security schemes for a certain period of time, migrant families should be entitled to basic public services and eligible to apply for local citizenship. A comprehensive service network dedicated to rural leftbehind families should be set up to promote local urbanization. Social resources should be fully employed to open daycare centers for left-behind children, support groups for left-behind women and service centers for leftbehind elderly, so as to provide better daily care, psychological consultation and labor support.
Enhance external support for family development. In general, community-Ievel basic public service facilities in both urban and rural areas are in need of improvement. But priorities should be given to upgrade facilities in rural areas, particularly systems for water supply, toilets, garbage treatment and sewage disposal. Efforts to optimize rural medical and health services, cultural and education pro grams and welfare services are also needed. Greater investments in public supplies and social security is needed to meet the needs arising from family development in rural areas. With an eye to family needs, efforts should be made to strengthen community support for family development. Community-Ievel services focused on enhancing the quality of life for both urban and rural residents should be designed to nurture and develop household services, medical care, employment brokers, educational training and elderly services, so that the elderly, children, the physically impaired , the poor, the underprivileged and their families can benefit the most.
(Received: 16 January 2017)