China Energy - Institute for International Economics
49
China Energy A Guide for the Perplexed Daniel H. Rosen Visiting Fellow, Peterson Institute for International Economics China Strategic Advisory Trevor Houser Visiting Fellow, Colin Powell Center for Policy Studies China Strategic Advisory May 2007 China Balance Sheet A Joint Project by the Center for Strategic and International Studies and the Peterson Institute for International Economics
Transcript of China Energy - Institute for International Economics
China Energy A Guide for the Perplexed
Daniel H. Rosen
Visiting Fellow, Peterson Institute for International Economics
China Strategic Advisory
Trevor Houser
Visiting Fellow, Colin Powell Center for Policy Studies
China Strategic Advisory
May 2007
China Balance Sheet A Joint Project by the Center for Strategic and International Studies
and the
Peterson Institute for International Economics

Daniel Rosen is a visiting fellow at the Peterson Institute for International Economics, where he was in residence from
1993 to 1998. This is his fifth Institute study on China-related subjects. Previous work included Behind the Open Door
(1998) on foreign investment in China, The New Economy and APEC (2002, with Catherine Mann) on information
technology and Asian productivity, Roots of Competitiveness (2004, with Scott Rozelle and Jikun Huang) on China’s
agricultural sector, and Prospects for a US-Taiwan Free Trade Agreement (2004, with Nick Lardy). His first work on the
intersection of China’s energy sector and environment was Powering China, written with Dan Esty in 1994–95 for the
Rockefeller Brothers Foundation. In addition to his Institute scholarship, he is principal of China Strategic Advisory, a
New York–based consultancy, and adjunct professor at Columbia University’s School of International and Public Affairs
since 2001.
Trevor Houser is a visiting fellow at the Colin Powell Center for Policy Studies at the City College of New York and
Director of China Strategic Advisory’s Energy Practice. His recent publications include Chávez-China Oil Deal May
Produce Unsuspected Winners, published by YaleGlobal in September 2006; The China Energy Specter: Perceptions
and Prospects, prepared for the Pudong Institute for the US Economy in May 2006; and Alternative Measures of Chi-
nese Economic Development, developed for the Aspen Institute Italia’s publication Aspenia in February 2006.
The authors would like to thank the following who served as advisors to this study:
Renato Amorim, Companhia Vale do Rio Doce (CVRD)
David Blumental, Vinson & Elkins LLP
Daniel Esty, Yale Center for Environmental Law and Policy
George Gilboy, Woodside Petroleum
Michael Laske, AVL China
Jeff Logan, World Resource Institute
Liang Shipu, Shenhua Group
David Pumphrey, US Department of Energy
Scott Roberts, Massachusetts Institute of Technology
Gavin Thompson, WoodMackenzie
Xu Xiaohui, General Electric China
K. F. Yan, Cambridge Energy Research Associates (CERA)
Zhang Jianyu, Environmental Defense China
Special thanks go to Peter C. Evans of CERA and Erica Downs of the Brookings Institution for their extensive help in
this endeavor.
This policy analysis is an abbreviated version of a book on China’s energy sector currently under preparation for the Pe-
terson Institute for International Economics.
© Peterson Institute for International Economics. All rights reserved.

3
Contents
INTRODUCTION 4
1 WHAT’S DRIVING DEMAND 6
The Evolution of Energy Demand in China 6
The Current Demand Picture 7
Industry-Led Demand 8
Consumption-Driven Demand 14
2 CHINA’S ENERGY SUPPLY SYSTEM 17
Formal Energy Policy Institutions 17 Informal Channels of Influence 19 Oil and Gas 19 Coal and Power 22
3 GLOBAL IMPACTS 28
World Energy Markets 28 Energy Security and Overseas Investment 30 The Environment 33 Goods Trade and Industrial Competitiveness 35
4 CONCLUSION AND POLICY RECOMMENDATIONS 37
Assessing the Domestic Response 37 Prioritizing the International Policy Response 40 Energy Security 40 Industrial Competitiveness 43 Climate Change 44
REFERENCES 47

4
Introduction
Henry Kissinger: Many visitors have come to this beautiful, and to us, mysterious land.
Premier Zhou Enlai: You will find it not mysterious. When you have become familiar with it, it will not be
as mysterious as before.
—July 9, 1971, Beijing (National Security Archives)
China’s energy profile provides a window into its economic soul. It tells us much about what China does, how fast it is
doing it, and how efficiently. Energy is also a finite global commodity, demand and supply for which affects us all both
in terms of the costs of running our nations, firms and households, and in terms of the environment that surrounds us.
So for financial analysts trying to gauge the effect of China’s rise on world prices, for policymaking realists formulating
responses to China’s emergence, and for economists and political scientists seeking to understand the workings of
China’s economy behind the veil of international cooperation departments in Beijing, a clear understanding of China’s
energy sector dynamics is important.
The urgency to acquire that understanding is clear: In 2001 China accounted for 10 percent of global energy de-
mand but met 96 percent of those needs with domestic energy supplies; today China’s share of global energy use has
swelled to over 15 percent and the country has been forced to rely on international markets for more of the oil, gas, and
coal it consumes.1 Between 1978 and 2000 the Chinese economy grew at 9 percent while energy demand grew at 4 per-
cent. After 2001, economic growth continued apace, but energy demand growth surged to 13 percent a year. It is this
fundamental shift in the energy profile of China’s economic growth that has created shortages at home, market volatility
abroad, and questions about the sustainability of China’s trajectory. China is now the world’s second-largest energy con-
sumer and is set to become the leading source of greenhouse gas emissions as early as the end of 2007.2
Despite its importance, China’s energy profile has been hard to make sense of for those whose jobs don’t entail
watching the sector full time. It is in flux, changing quickly in its constant effort to keep up with the rest of the econ-
omy. It is a fusion of plan and market forces, formal regulation and seat-of-the-pants fixes, central intentions, and local
interests. And while retail consultants can trawl through supermarkets in Shanghai counting cereal boxes to measure
trends, in energy many key metrics are obscured by national security considerations or habits of secrecy at state-owned
enterprises.
The purpose of this policy analysis is to make visible the internal dynamics of the Chinese energy situation, which
most observers glimpse only second hand as the impact of demand on world markets, the behavior of Chinese firms
abroad and the effect of Chinese emissions on the global environment. Our hope in doing so is to facilitate energy policy
cooperation between China and other countries, more rational conception of and reaction to China’s energy behavior by
markets and governments, and more effective prioritization of the energy reform agenda in China, the United States, and
elsewhere.
The analysis is divided into four sections:
What’s driving demand: An explanation of the internal dynamics fueling China’s energy needs. Our key point: It’s
not air conditioners and automobiles that are driving China’s current energy demand but rather heavy industry, and
the mix of what China makes for itself and what it buys abroad. Consumption-led demand is China’s future energy
challenge.
1 See BP (2006), the China Statistical Yearbook from the National Bureau of Statistics, and China Customs Statistics from the General Customs Ad-
ministration. The latter two as well as all other Chinese statistics used in this analysis (unless otherwise indicated) have been collected via CEIC Data
Company Ltd., a commercial statistical database provided by ISI Emerging Markets. Henceforth, all figures accessed in this manner will be referenced
as CEIC data followed by the source publication or government agency. 2 The International Energy Agency (IEA 2007b) sees China surpassing the United States in 2009. Most recent estimates by the US Carbon Dioxide
Information Analysis Center move that date up to 2007.

5
China’s energy supply system: An explanation of the policies, institutions, and markets China relies on to
meet its demand. Our key point: China’s energy system is increasingly unsuited to manage demand in a secure
manner, and for the medium-term Beijing and other countries will need to work-around that system with sec-
ond-best solutions.
Global impacts: An accounting of the external implications of China’s energy choices in light of the systematic
analysis of demand and supply dynamics. Our key point: While the roots of China’s energy profile are a domes-
tic matter, the shoots and leaves affect the vital interests of others, and we all have a legitimate basis to be “nosy
neighbors” when it comes to China’s energy needs.
Conclusions and the policy agenda: By starting from a holistic understanding of China's demand and supply
fundamentals, both policymakers and civil society groups can play an even more positive role on the China en-
ergy agenda. Our key point: China’s energy challenge is rooted in systemic conditions that go beyond the en-
ergy sector per se, and therefore energy policy alone will not provide the answers. Coordinating energy analysis
with the broader policy agenda on macro and external imbalances is essential. Yet while structural adjustment is
necessary to address root causes, given the conflicting pressures China's leaders face the international commu-
nity must be realistic in working to mitigate negative impacts, building international energy re-
gimes that include China, and exploring policy options not dependent on Beijing's readiness to proceed in an
optimal manner.
China is the focus of this analysis. However, the reader should understand that despite the enormity of the
China energy challenge, the United States is still a bigger consumer of energy despite having less than one-quarter
the population. US culpability does not obviate the need for critical analysis of China—the biggest contributor to
the planet’s energy profile at the margin. The lessons learned in thinking about China may soon have to be applied
to India as well. While this report is written about China for US and other Western analysts and policymakers, and
not about the US energy footprint, the US and Chinese economies are of course profoundly related in terms of the
distribution of production and shared interest as energy consumers. Much of the energy China consumes is used to
make products sold to the rest of the world, thus replacing energy demand in other countries. As such, the basis for
reforming China’s energy sector may well include equally profound changes in the United States and elsewhere.

6
1 What’s Driving Demand
THE EVOLUTION OF ENERGY DEMAND IN CHINA
On the eve of the reform in late 1970s China had an en-
ergy demand profile impaired by years of central planning
and ideological failures. Rather than choosing a develop-
ment strategy in line with its natural endowments (rich in
labor, poor in capital and technology) as Japan, Hong
Kong, Taiwan, and others had done, Communist Party
leaders ignored their comparative advantage and dragged
China—kicking, screaming, and sometimes starving—in
pursuit of Soviet-style industrialization. In fits and starts
over 30 years, the country’s economic resources were di-
rected out of agriculture and into energy-intensive indus-
tries like steel and cement. Between 1949 and 1978, in-
dustry’s share of economic output grew from 18 to 44
percent and the amount of energy required to produce
each unit of economic output tripled (figure 1).3 Running
counter to what China’s resource base could support, this
command and control approach created tremendous inef-
ficiency and hence, ironically, the potential for catch-up
growth later.
In 1978 leaders began to unleash that potential.
Faced with the prospect of another wave of famine as an
agricultural sector with fewer people and resources failed
to keep up with the government’s industrial vision, Bei-
jing let farmers “catch their breath” by relaxing produc-
tion targets, raising prices and increasing the autonomy of
farming collectives. The results were dramatic. With mar-
ket incentives farmers increased output. The early 1980s
saw rural residents with more time on their hands, cash in
their pockets and freedom to choose how to use it. Much
of the new-found wealth was invested into township and
village enterprises (TVEs) targeted at the sector where
China would most naturally be productive: labor-
intensive light manufacturing. These TVEs became an
engine of economic growth and the opening salvo in a
sectoral shift away from energy-intensive industry that
shaped China’s energy footprint for the next 20 years.4
3 CEIC data from the China Statistical Yearbook. 4 For more on energy dynamics in China’s reform period, see Kenneth
Lieberthal and Michel Oksenberg, Policy Making in China : Leaders,
Structures, and Processes (Princeton, N.J.: Princeton University Press,
1988). On the launch of reforms in general, see Barry Naughton, Grow-
ing out of the Plan : Chinese Economic Reform, 1978-1993 (New York,
NY: Cambridge University Press, 1995), Susan L. Shirk, The Political
In addition, the reform period brought changes
within heavy industry that further improved the energy
intensity of Chinese growth. Economic incentives—the
right to aspire to and keep profits—were introduced
where there had previously been only planned mandates.
Awareness of bottom-line profits improved the focus on
top-line expenses, including energy. And as enterprises
were becoming more aware of the impact of energy costs
on profitability, their energy bills were growing as the
result of partial liberalization of oil, gas and coal prices.
The introduction of limited competition for both cus-
tomers and capital, not just from other state-owned en-
terprises (SOEs) but from a growing private sector, made
energy cost management all the more important. Domes-
tic market competition was augmented by integration
with competitive global markets. Falling trade barriers
brought pressure on SOEs from energy-efficient foreign
Logic of Economic Reform in China, California Series on Social Choice
and Political Economy ; 24 (Berkeley: University of California Press,
1993), Barry Naughton, The Chinese Economy : Transitions and
Growth (Cambridge, Mass.: MIT Press, 2007), Kenneth Lieberthal and
David M. Lampton, Bureaucracy, Politics, and Decision Making in
Post-Mao China, Studies on China ; (Berkeley: University of California
Press, 1992), Nicholas R. Lardy, Integrating China into the Global
Economy (Washington, D.C.: Brookings Institution Press, 2002),
Nicholas R. Lardy, China's Unfinished Economic Revolution (Wash-
ington, DC: Brookings Institution, 1998), Kenneth Lieberthal, Govern-
ing China : From Revolution through Reform, 2nd ed. (New York: W.
W. Norton, 2004).
Figure 1: Energy Intensity of the Chinese Economy (1952-2006)

7
companies, but also allowed them to acquire the energy
efficient technology their competitors enjoyed. Rapid
economic growth enabled China to integrate this tech-
nology quickly, significantly improving the efficiency of
the country’s capital stock. 5
By 2000, Chinese economic activity required two-
thirds less energy per unit of output than in 1978 (see
again figure 1). Energy intensity improvement on this
scale was unprecedented for a large developing country,
and meant that China in the year 2001 was 10 percent
rather than 25 percent of global energy demand.
THE CURRENT DEMAND PICTURE
Starting the new millennium in 2001, China’s leaders
expected that the pattern of energy intensity improvement
achieved over the previous 25 years would continue. Re-
form was largely an accepted reality, and was assumed to
presage further energy efficiency. Centrally orchestrated
conglomerate-building ambitions had been scaled back
with the Asian financial crisis, which tarnished the na-
tional champion model. The decision to join the World
Trade Organization (WTO) had been made, locking in
greater market contestability inside China and the impor-
tance of comparative advantage. Most energy forecasters
at home and abroad assumed that the structural adjust-
ment away from energy-intensive heavy industry toward
lighter industry would stick. Further, the economy’s GDP
was expected to grow at a rate of 7 to 8 percent—fast but
not furious (Zhou and Levine 2003). Both the Chinese
government and the International Energy Agency (IEA)
predicted 3 to 4 percent growth in energy demand be-
tween 2000 and 2010 (figure 2).
Both missed the mark by a mile. The economy grew
much quicker than anticipated, but the real surprise was a
change in the energy intensity of economic growth. En-
ergy demand elasticity (the ratio of energy demand
growth to GDP growth) increased from less than 0.5 be-
5 Analysis of what contributed to China’s reduction in energy intensity
can be found in Karen Fisher-Vanden et al., "Technology Development
and Energy Productivity in China," Energy Economics 28, no. 5-6
(2006), Fuqiang Yang et al., "A Review of China's Energy Policy,"
(Lawrence Berkeley National Laboratory, 1995), Jin-Li Hu and Shih-
Chuan Wang, "Total-Factor Energy Efficiency of Regions in China,"
Energy Policy 34, no. 17 (2006)., Lynn Price et al., "Industrial Energy
Efficiency Policy in China," in ACEEE Summer Study on Energy Effi-
ciency in Industry (2001), Karen Fisher-Vanden et al., "What Is Driving
China’s Decline in Energy Intensity?*," Resource and Energy Econom-
ics (2004), Richard F. Garbaccio, "Price Reform and Structural Change
in the Chinese Economy: Policy Simulations Using a CGE Model,"
China Economic Review 6, no. 1 (1994).
tween 1978 and 2000 to 1.5 between 2001 and 2006.6
Energy consumption grew four times faster than pre-
dicted to over 15 percent of global demand in 2006
(nearly twice as large in absolute terms as forecast in most
2002 estimates). Yet on a per capita basis, China’s energy
demand remains relatively low (figure 3).
This upside surprise not only shocked domestic and
international energy markets (discussed in greater depth
later on) but also has prompted a fundamental reassess-
ment of China’s, and thus the world’s, energy future. The
IEA has raised their China 2030 forecast by 1.2 billion
tons of oil equivalent (a 63 percent upward revision)—
more than India’s total projected demand for that year
(IEA, World Energy Outlook 2006) (figure 4). Under
this scenario, China will account for 20 percent of global
energy demand, more than Europe and Japan combined,
and easily surpass the United States as the world’s largest
energy consumer.
6 CEIC data from the China Statistical Yearbook.
Figure 2: Energy Demand (mtoe)
Figure 3: Per Capita Energy Demand (toe, 2005)

8
What caused China’s two decade history of energy
intensity improvements to change course? Many China
watchers assume that the recent evolution of China’s en-
ergy profile reflects growth in consumption and transport,
for instance air conditioning and personal cars. This is not
correct. Consumption-led energy demand will be the
major driver in the future and is already significant in
absolute terms, but the main source of today’s growth is
energy-intensive heavy industry.
Industrial energy efficiency has continued to improve
over the past six years: Every new steel mill is more effi-
cient than the last (figure 5); but the structural shift away
from heavy industry toward light industry has reversed,
and a new steel plant—no matter how much more effi-
cient than its peers—uses substantially more energy than
a garment factory (figure 6).
Though these “twin culprits” are important, one is
primary and the other secondary in understanding the
present picture. We profile these demand drivers below,
explore the factors behind them, and look at how they
will shape China’s energy footprint going forward.
INDUSTRY-LED DEMAND
Industry accounts for over 70 percent of final energy con-
sumption in China today, while the residential, commer-
cial and transportation sectors account for 10, 2, and 7
percent, respectively.7 This is high by either developed or
developing country standards (figure 7). In part it reflects
the role of industry in the Chinese development model
(figure 8), as opposed to India which has taken a more
services-heavy approach. Yet industry as a share of China’s
GDP reached its current high of 48 percent two other
times, in the late 1970s and the early 1990s, when in-
vestment booms also created a surge in industrial activity
(Lardy 2006). Is it the case then that energy-intensity
booms arise whenever there is an investment boom in
China?
From an energy standpoint, the current investment
cycle is different: China is now making for itself, rather
than importing from abroad, more of the energy-intensive
basic products (such as steel and aluminum) used to con-
struct the roads and buildings investment pays for. China
now accounts for 48 percent of global cement production,
49 percent of global flat glass production, 35 percent of
global steel production, and 28 percent of global alumi-
7 CEIC data from the China Energy Statistical Yearbook. This figure, as
those used throughout this analysis, excludes consumption of biomass
fuels like wood and crop waste. The use of such fuels is difficult to quan-
tify and unlikely to increase much in absolute terms as China develops.
Figure 4: Energy Demand Forecasts (mtoe)
Figure 5: Energy Intensity by Industry
Figure 6: Industry Output as a Share of GDP

9
num production (figure 9).8 Some of this has been a mi-
gration of energy-intensive industry from other parts of
the world, not only to meet Chinese demand but for ex-
port to other markets. The energy effects of investment
cycles are changing (in fact worsening), underscoring an
important insight: booming investment and booming
investment into energy-intensive heavy industry are in-
creasingly the same thing. The implication of this is that
energy problems cannot be fixed with energy policy re-
form alone, but require financial system and other re-
forms more broadly. In his companion paper on “Rebal-
ancing Economic Growth,” for the China Balance Sheet
series, our colleague Nicholas Lardy discusses the chal-
lenges of rationalizing financial intermediation in China.9
In the section immediately below, we consider the role of
finance—among other factors—in promoting energy-
intensive industry growth.
Why is a country that grew rich for 25 years utilizing
comparatively abundant resources (labor) shifting back
toward industries that rely on scarce and strained re-
sources (energy, raw materials, capital, and technology)
and that create relatively few jobs? Is it the result of coor-
dinated industrial policy by Beijing or simply firms seek-
ing to maximize profits? Has comparative advantage
shifted from labor-intensive to energy- and capital-
intensive manufacturing? Based on a review of the litera-
ture, analysis of the macroeconomic and industry data
available and primary research interviewing Chinese and
foreign business leaders, industry analysts, government
officials, academics and activists, we can postulate a num-
ber of things.
In general, the changing composition of China’s in-
dustrial structure is less the result of concerted national
aspirations (as it was under Mao Zedong) as competition
among provinces, counties and cities to grow GDP, the
capital stock, tax revenue and corporate profits. The rules
of competition are set not just by Beijing, but also by
local interests, including individual state-owned heavy
industrial enterprises. And regardless of who sets the rules,
8 Michael Taylor, "Energy Efficiency and Co2 Reduction Opportunities
in the Global Cement Industry" (paper presented at the IEA-WBCSD
Cement Industry Workshop, IEA, Paris, 4 September 2006).
Pilkington, "Flat Glass Industry - Summary,"
http://www.pilkington.com/about+pilkington/flat+glass+industry/defaul
t.htm.; International Iron and Steel Institute, www.worldsteel.org; Abare
Economics, www.abareconomics.com. CEIC data from the China Sta-
tistical Yearbook. 9 Nicholas R. Lardy, "China: Rebalancing Economic Growth," (Wash-
ington: Peterson Institute for International Economics, 2007). This
adds to Lardy’s seminal work, China’s Unfinished Economic Revolution
(1998), which dealt in detail with problems in financial intermediation.
the reality of how they are implemented is almost entirely
a local matter. 10
10 Barry Naughton’s recent textbook The Chinese Economy (2007, 347)
argues: “The development of a market economy in China has shaped the
economy in complex and sometimes apparently contradictory directions
that are far different from what a central planner would ever have envis-
aged.” Andy Wedeman’s From Mao to Market catalogues many of the
intraprovincial trade wars that still go on but through industrial policy
tactics rather than outright roadblocks. Scott Kennedy’s recent work
demonstrates the extent to which firms and their industry associations
now drive industrial policy, rather than industrial policy disciplining
them (Scott Kennedy, The Business of Lobbying in China (Cambridge,
Mass.: Harvard University Press, 2005).
Figure 8: GDP by Sector (2005)
Figure 7: Energy Demand by Sector (2005)

10
Within this context of competition, economic incen-
tives explain much of the industrial buildout. On the
profit side, after tax earnings in energy-hungry industries
have been good (thanks to huge depreciation on new in-
vestments, absence of dividend payment to the govern-
ment for SOEs, transfer payments, and other factors). 11
Ranging from 4 to 7 percent in steel, glass, chemicals and
cement in recent years, heavy industry profits have risen
from near-zero in the late 1990s to a level comparable to
their light industry counterparts.12 With China modern-
izing over 170 cities of more than 1 million people, cer-
tainly there is a large domestic market for basic materials,
and supply was squeezed by breakneck growth since
2001. But with overcapacity arising almost as soon as the
first profits, the ability to sell surplus production into
international markets has been critical to maintaining
margins.
Contributing to strong profit is the fact that impor-
tant costs associated with energy intensive industry are
low in China. Land—a key input—is often deeply dis-
counted and brokered by local governments. Costly in-
12 CEIC data from the China Statistical Yearbook. For opposing views
on how good profits really are in recent years, see Louis Kuijs, William
Mako, and Chunlin Zhang, "SOE Dividends: How Much and to
Whom?," in World Bank Policy Note (Washington: World Bank,
2005), Weijan Shan, "The World Bank's China Delusions," Far East
Economic Review (2006), Weijian Shan, "China's Low-Profit Growth
Model," Far Eastern Economic Review 169, no. 9 (2006), Bert Hofman
and Louis Kuijs, "Profits Drive China's Boom," Far Eastern Economic
Review 169, no. 8 (2006), Jonathan Anderson, "The Furor over China's
Companies," in Asian Focus (Hong Kong: UBS, 2006). and David
Dollar and Shang-Jin Wei, "Das (Wasted) Kapital: Firm Ownership and
Investment Efficiency in China," in IMF Working Paper (International
Monetary Fund, 2007)., which, though pointing to the superiority of
private management over SOEs in China, reports very solid profits
almost across the board.
vestments to protect public goods including air and water
are often not enforced. Construction time is short and
labor costs very low. These conditions generally apply to
all industry; however they are particularly valuable in the
energy-intensive segment where fixed investment costs are
large.
Distortions in the financial system take the sting out
of the fact that heavy industry is usually capital intensive.
Not only are margins high, but SOEs have not had to
distribute them to their shareholders (the State!), leaving
them with plenty to reinvest. When it comes to borrow-
ing, banks can lend at a nominal 6 to 7 percent to state
firms (often lower under a variety of development promo-
tion schemes) because they pay depositors only 2.8 per-
cent for one-year deposits.13 Importantly, the risk of fore-
closure if investments turn out to be stupid—a potent
incentive to be careful about comparative advantage else-
where—barely applies for state firms in China.
Energy
Energy prices in China, once highly subsidized, have
largely converged with world prices over the past 30 years.
Yet an accurate assessment of what any specific firm pays
for coal, gas, oil or electricity can be difficult due to local
idiosyncrasies in pricing, dual supply channels for many
legacy SOEs, arrears (both permissioned and not) and
other factors. Chinese prices for raw energy commodities
including coal and natural gas can be significantly cheaper
than in the Organization for Economic Cooperation and
Development (OECD), particularly in interior provinces
close to resource deposits. For coal, this results not from
subsidization but rather low extraction costs in areas iso-
lated from international markets. As transportation bot-
tlenecks ease, coke prices will continue to converge up-
wards with world prices. Natural gas prices, on the other
hand, have been tightly controlled by Beijing which, fac-
ing pressure from the Middle East in attracting and main-
taining gas-intensive industries like petrochemicals, has
attempted to keep industrial gas prices competitive with
those in other developing countries. But as this approach
has failed to induce the development or importation of
sufficient quantities of natural gas to meet burgeoning
demand, domestic prices have increased.
For electricity, the form in which Chinese industry
receives more and more of its energy, prices appear high
13 As of March 2007, household deposits were reported at $2.04 trillion
and enterprise deposits at $1.46 trillion. Rates reflect March 2007
hikes.
Figure 9: China’s Share of Global Production (2006)

11
compared with both other developing and developed
countries (figure 10). Based on our conversations with
Chinese business leaders and industry analysts, however,
it is likely that many industrial enterprises do not bear the
full cost implied by national average figures from the Sta-
tistical Bureau. The National Development and Reform
Commission (NDRC) sets electricity tariffs province-by-
province based on the recommendations of local pricing
bureaus that answer to local officials. While NDRC
would like to see a rationalization in energy pricing to
reduce overall energy consumption, it is hindered by local
social and economic development concerns. Energy-
intensive firms in China typically consume more energy
per ton of output than their peers in the OECD (on aver-
age, 20 to 40 percent more, according to some estimates
[He 2006 and Wan 2006]), and are thus sensitive to elec-
tricity price increases (as well as gas and coke prices). Re-
cent efforts by NDRC to raise prices for the most energy
hungry industries have been met with provincial resis-
tance,14 and even when the price increases stick, non-
payment can be a significant issue.15
Environment
Energy in China is at or near international price levels,
but this is based on excluding associated environmental
costs.16 Over 80 percent of the country’s electricity is gen-
14 "China Halts Preferential Electricity Pricing of 14 Provinces," Asia
Pulse, 17 April 2007. 15 We thank Scott Roberts of MIT for this point. 16 In 2004 and 2005 transport fuel prices—gasoline and diesel—were an
exception to this. These have, for the time being, converged with inter-
national prices, and in any case were a minor component of industrial
energy costs.
erated from coal. Less than 15 percent of these coal power
plants have flu gas desulphurization (FGD) systems (used
to remove SO2 from emission streams) installed and even
fewer have them running.17 Operating an FGD system
requires a 4 to 8 percent reduction in production effi-
ciency and therefore contributes marginally to a higher
electricity price. If all the power plants in China installed
and operated FGD systems, average electricity tariffs
could rise by as much as 15 to 20 percent.18 Industries
that burn coal directly (such as steel and cement) are sub-
ject to sulfur taxes, but these are generally too low to re-
duce pollution. Other air pollutants, such as nitrogen
dioxide and mercury are largely unregulated. And regu-
lated or not, enforcement generally falls to the provincial
and local governments, which must balance environ-
mental concerns against economic growth priorities. In
the absence of a stronger environmental regulator, like the
Environmental Protection Agency (EPA), that balance is
skewed toward near-term economic growth as industry
warns of a loss of competitiveness to the province next
door (and therefore jobs and tax revenue) if environ-
mental enforcement is ratcheted up.
Land and Construction
In China, land is not privately owned in perpetuity, but
owned and allocated by the government on the people’s
behalf. While private land ownership does not exist, long-
term leases do (generally 50 years) and are bought and
sold between both individuals and enterprises. In more
developed urban real-estate markets like Beijing and
Shanghai, there is little difference between these land-
leases and an ownership deed. They are priced at market
terms and transferred between holders with little interfer-
ence from the state. Outside the urban commercial and
residential real estate markets, however, land transfers are
largely government domain. Local officials can appropri-
ate farm land to create industrial parks. While they are
required to compensate farmers, the amount paid is typi-
cally determined by the agricultural, not the industrial,
use value. The effect is that in order to attract new indus-
trial investment, local officials have the ability to price
land well under what a firm would pay elsewhere in the
world. Industrial users will in the future pay taxes to these
governments, farmers will not. While land use prices are
17 Estimates for the amount of power generation capacity with FGD
installed range from 60GW to 90GW out of a total base of 622GW. 18 Calculated based on the share of total power generation coming from
coal, the amount of FGD already installed and running, and the current
tariff increase allowed for power plants that run FGD systems.
Figure 10: Electricity Prices for Industry (USD per kilowatt-hour, 2005)

12
rising in coastal areas, new swaths of farmland are being
offered for industrial use in China’s interior and heavily
discounted to lure investment.
In extensive interviews with directors of energy inten-
sive firms expanding operations in China, the land cost
advantage was emphasized. So too was the lower cost and
time required for construction. Localities often contribute
generously to groundwork—grading, infrastructure build
out, and clustering related segments of the value chain.
Relocating existing residents, carrying out environmental
impact assessments, and other steps are accelerated in
China to a degree not found elsewhere. Labor costs in
construction are dramatically lower in China than in to
the OECD world. An aluminum smelter that would take
3-4 years to build in the United States at high labor and
ground preparation cost can be constructed in China in
under a year and much lower daily cost.19
Capital and Consolidation
China’s financial system does not exist in order to bank-
roll over-deployment of the nation’s wealth into energy-
intensive industry, either statutorily or in terms of the
aspirations of central leaders. In fact senior leaders are
exerting themselves to reduce the energy intensity of the
economy. Nonetheless, the outcome has been just that:
too much capital going to build out energy guzzling ca-
pacity. This is often rational from a financial perspective
because the costs associated with operating such industries
are low, because excess capacity can be exported without
fear of normal exchange rate effects, and because borrow-
ers are mostly state-owned firms and hence loan officers at
state owned banks bare little career risk in making loans
to them. Further, foreign industrial firms are willing to
join in many projects, contributing promising technology
and back-linkages to developed markets.
Industry seeking investment finds a sympathetic au-
dience at the local and provincial level even while central
authorities are leaning against approvals in sectors where
they see—with the advantage of a national perspective—
overcapacity. Beijing, through the NDRC and other enti-
ties, has formally tried to curb lending to steel, aluminum,
cement, and other industries in recent years. They have
tried to prevent lending to new firms in the automobile
sector, force consolidation by financial takeover in steel,
coal and other sectors, and raise borrowing costs for en-
ergy-intensive industries in general. But in most cases,
19 Based on conversations with both US and Chinese aluminum indus-
try analysts, January and February 2007.
financing of additional capacity has continued, while little
of the unauthorized capacity is ever shut down.
Since 1998, profit margins on an earnings before tax
(EBT) basis20 have recovered from less than 1 percent to
between 4 and 7 percent for China’s energy hungry in-
dustries (table 1). In fact, last year, profits margins in
metals, glass, chemicals and cement exceeded those in
textiles, apparel, furniture and electronics. The aluminum
industry has seen a particularly dramatic increase in prof-
itability with EBT margins increasing from 5 to 14 per-
cent in the past four years. Recent survey work by David
Dollar and Shang-jin Wei, which calculates return on
investment in 12,400 firms across the country, supports
the trends seen in sector-wide official profit data. Since
2002, iron and steel profits have surpassed those in most
light industries (Dollar and Wei 2007).
Table 1: Industrial Profit Margins (on an EBT basis) (percent)
Industry 2006 2002 1998
Heavy IndustryIron & Steel 5.2 4.6 0.8 Nonferrous Metals 6.8 3.2 –0.8 Cement & Glass 5.3 3.7 –0.4 Paper & Pulp 5.2 5.0 1.8 Basic Chemicals 5.6 4.0 1.0
Light Industry Textiles & Apparel 3.9 3.1 0.2 Furniture Manufacturing 4.4 4.0 3.7 Computers & Telecom 3.3 4.8 4.3 Electronic Machinery 4.7 5.0 2.6
Source: CEIC. Calculated as pretax earnings divided by total sales revenue.
Some debate whether China’s firms are truly profit-
able. Gross corporate earnings, return on equity, net mar-
gins, and gross margins give significantly different an-
swers. Shan Weijian of TPG Newbridge, an investment
firm, has argued that the value of debt-to-equity swaps
and bank recapitalization has exceeded the entire pre-tax
profits of the industrial sector since 1999—suggesting
zero profitability but for lax bank financing on a gargan-
tuan scale. This suggest that the direction China is headed
is wrong, but does not contradict the instinct to pile into
these industries at the microeconomic level. For explain-
ing the gold rush into heavy industry the debate about
which margin best reflects performance may matter less
than the reality that cash flows are huge and growing
20 Calculated as earnings before tax divided by total sales revenue.

13
dramatically, putting industry in a position to exert even
more power and influence.
A corollary is that if banks are told not to lend or
must charge prohibitively higher rates, many of China’s
biggest SOEs have sufficient retained earnings that they
can pay their own way. And there is little alternative to
reinvesting: enterprise deposits in the banking system—
like household deposits—receive minimal interest. Again
there is debate about whether these retained funds reflect
massive depreciation allowances rather than profit, and
again it does not matter for our purposes here. Likewise,
the argument that such funds should be distributed to
shareholders, which means the government itself, is com-
pelling, and may come to pass soon helping to soak up
liquidity and fund social expenditures, but it is not pres-
ently the case and anyway would likely not be retroac-
tive.21
Rising profit impedes Beijing’s effort to rationalize
resource allocation. The National Development and Re-
form Commission has sought for several years to consoli-
date the steel industry, not only to reduce energy con-
sumption but also to create national champion steel com-
panies that can compete with firms in Japan, South Ko-
rea, Europe and the United States in higher value-added
products. Yet the number of steel enterprises doubled
between 2002 and 2006 as firms saw profit opportunities
and piled in. The largest three of China’s 7000 steel com-
panies, while world-scale, accounted for only 14 percent
of the country’s total production in 2005. Compare this
with Japan, South Korea and the United States, where the
top three companies each control well over half of the
market (table 2). China’s steel industry is Balkanized,
with each province promoting its own local champion.
Attempts by Beijing to encourage consolidation in the
industry meet resistance from provincial and local officials
loath to see their firms absorbed by companies from next
door.
Similar phenomenon exists in other energy-intensive
industries. At the end of 2006, China had 381 aluminum
companies, 3,388 paper and pulp companies, 2,982 glass
companies, 5,210 cement companies and 20,083 chemi-
cals companies (table 3). And despite government at-
tempts to force consolidation, these industries have in-
stead seen further fragmentation as rising profits and pro-
vincial encouragement prompt more players to enter the
market.
21 SOE dividend payments to the government is a hot topic at present,
and likely to transpire, in some form, in the coming years. See Barry
Naughton, "SASAC Rising," China Leadership Monitor, no. 14 (2005).
This pile-on would have created profit-eroding over-
capacity were it not for the export safety valve. China’s
metals companies in particular have been able to clear
their inventories and remain profitable by selling to over-
seas markets, accounting for a big chunk of China’s $177
billion trade surplus in 2006. In 2002 China’s steel im-
ports exceeded exports by 450 percent. In 2006 exports
exceeded imports by 230 percent, making China not only
the world’s largest steel producer, but also the largest ex-
porter. Today the iron and steel industry in China is re-
sponsible for 16 percent of total energy consumption,
compared with only 10 percent for all the households in
the country combined (figure 11).
Table 2: Global Steel Industry, Market Share and Industry Concentration (2006)
Country Production Share Top 3 Firms* crude, million s of
tons percent of global percent of na-
tional China 422 34.6 14.1 Europe** 198 16.3 44.7 Japan 116 9.5 69.3 United States 99 8.1 59.7 Russia 71 5.8 55.1 South Korea 48 4.0 85.8 World 1,219 100.0
Source: CEIC, IISI, and company annual reports. *Share of domestic produc-tion from the three largest companies in 2005. ** refers to EU25.
Table 3: Industry Concentration (number of firms in China)
Industry 2006 2004 2002*
Iron & Steel 6,959 4,947 3,551 Nonferrous Metals 2,798 1,766 1,332 Cement Production 5,210 5,042 4,656 Glass & Glass Products 2,982 2,205 1,739 Paper & Pulp 3,388 3,009 2,606 Chemical Materials 20,083 15,172 12,481
Source: Beijing Kang Kai Information & Consulting from ISI Emerging Markets. *2002 number is from a February 2003 survey.

14
Aluminum production, in which China now also
runs a trade surplus, consumes more energy than the
commercial sector, and production of chemicals, in which
China still runs a trade deficit, but a shrinking one, con-
sumes more energy than the transportation sector. Taken
together, China’s heavy industry today consumes 54 per-
cent of the country’s energy, up from 39 percent only five
years ago.
The bottom line: Capital allocation is a methadone
drip keeping an energy intensive market structure going
when it should be allowed to go through painful with-
drawal. The consequences of making ill-considered in-
vestments in energy intensive sectors must be permitted
to bite.
CONSUMPTION-DRIVEN DEMAND
While an investment led shift in China’s industrial struc-
ture is causing a surge in energy demand, Chinese house-
holds are reaching income levels at which energy-intensive
consumer goods, like air conditioners and automobiles,
are within reach. Historically, when countries reach
$5,000 per capita GDP, the commercial and transporta-
tion sectors start to surpass industry as energy demand
drivers. China’s per capita GDP today is $2,000, up from
about $200 in 1978. But in more affluent coastal prov-
inces, per capita GDP has surpassed the $5000 mark
(figure 12). Shanghai and Beijing, with a combined popu-
lation of over 33 million, are at the same per capita level
as South Korea in 1990. And Tianjin, Zhejiang, Jiangsu
and Guangdong, with a population of 225 million, are
not far behind.22
This emerging middle class is more likely to work in
an office than in a factory and, easily able to satisfy their
22 CEIC data from the China Statistical Yearbook.
food and shelter needs, have money left over to spend on
a consumer goods and services. If making the steel and
glass to build office buildings and shopping malls is
China’s current energy challenge, lighting heating and
cooling those malls and offices is China’s future energy
challenge. Today, the commercial sector accounts for less
than 3 percent of total energy demand in the country.
That share is set to expand as a function of rising incomes
and a growing service sector. While nationally services
only account for 40 percent of economic activity, in
places like Beijing, Guangdong and Shanghai, their share
is much higher and thus commercial demand is already
shaping those cities’ energy needs (figure 13).
Similarly, the cement and asphalt for highways driv-
ing today’s investment-led energy demand is paving the
way for tomorrow’s consumption-led energy demand.
The number of passenger vehicles on the roads has dou-
bled since 2002 to more than 25 million, with over 5 mil-
lion new cars sold in 2006 alone.23
23 CEIC data from the Ministry of Communications. These figures refer
to passenger vehicles only.
Figure 11: Share of Total Energy Demand, Iron & Steel Industry vs. Household Sector
Figure 13: Service Sector as a Share of GDP, Select Provinces/Municipalities and China as a Whole
Figure 12: Per Capita GDP by Province (real 2005 USD)

15
While the vehicle fleet in China is still less than 20 per-
cent as large as the United States, the gap is narrowing.24
Based on experience elsewhere, car sales in China are set
to grow faster than GDP until income levels reach about
$20,000 per capita. Global projections from the Institute
for Transportation Studies at the University of Leeds
show China’s total vehicle fleet (including trucks) grow-
ing 10 fold over the next 25 years from 37 million to
more than 370 million cars and trucks (figure 14) (Dar-
gay, Gately, and Sommer 2006).
It is certain that as China gets richer, a greater share
of the country’s energy demand will come directly from
consumers in the form of heating, cooling, lighting and
transportation (as opposed to indirectly via infrastructure
construction). As Lardy (2007) discusses, a range of op-
tions may be used to accelerate the growth of consump-
tion as a weight in China’s economy and growth. We take
the view that
1) at best a swing back to consumption will be more
gradual than the shift into heavy industry has been,
due to China’s political economy and the vested in-
terests now tied up with the status quo;
2) the sunk costs and long life cycles of energy intensive
capital investments will incline local authorities to
run them as long as possible to recover costs, for the
sake of the financial system; and
24 US vehicle statistics are from the US Department of Transportation’s
Bureau of Transportation Statistics, available at www.bts.gov.
3) shifting government-directed resources away from
energy-intensive industry (like pipelines and ports)
and toward social service investments that support
consumption (healthcare, education) will not neces-
sarily reduce the absolute value of energy-intensive
investment. Trigger-happy global investors have ear-
marked hundreds of billions of dollars for China ex-
posure, and given further reforms to China’s finan-
cial markets already anticipated (for instance munici-
pal bond markets)¸there is ample private capital both
in China and outside with an appetite for further in-
vestment in infrastructure and industry.
For a considerable period therefore we foresee con-
sumption growth as additive to investment, rather than
substituting for it. The rebalancing of China’s growth
more toward consumption-led growth is entirely desirable
from an economic standpoint, but is no panacea for the
country’s current energy headaches. Increased consump-
tion will bring challenges of its own, and the scope of
those challenges is quickly getting locked-in by invest-
ment decisions made today.
Each year, over 10 million people are reclassified
from rural to urban, most of them moving physically to
new places and homes. Building out the commercial and
residential real estate to accommodate them (as well as the
needs of existing urban residents looking to upgrade their
quality of life) amount to a full 23 percent—$270 billion
Figure 14: Vehicle Penetration as an Income Function, including China and India Projections to 2030

16
in 2006—of China’s fixed investment.25 The urban plan-
ning and building code surrounding this construction
determines how much leeway China will have to alter its
energy profile in the future. And with several more dec-
ades to go before China reaches the urbanization level of
Latin America, this secular driver is here to stay awhile.
To date energy efficiency concerns in building China’s
cities have ranked below cost and timeframe considera-
tions. In addition, the economic distortions underlying
domestic steel, aluminum, glass and cement production
shield construction companies from the full energy cost
(including environmental externalities) of the materials
they select. And as residential electricity tariffs are highly
subsidized (see figure 15) there is little incentive on the
part of consumers to demand the construction of more
energy efficient apartment blocks.
After real estate, the second largest destination for
fixed-asset investment is in transportation infrastructure,
totaling roughly $140 billion in 2006.26 And as with real
estate, how this money gets spent is shaping the energy
profile of China’s transportation sector in the years ahead.
At present more than half of this investment goes into
building highways and less than 20 percent into railways,
thus laying the groundwork for explosive automobile
growth outlined above.
Efforts to develop mass-transit alternatives are ham-
pered on several fronts, not least by the political economy
of the auto industry. Despite Beijing’s desire to see the
emergence of a select group of national champion auto
companies, the industry remains highly fragmented. At
present there are 33 companies, scattered among 21 prov-
25 CEIC data from the China Statistical Yearbook. 26 CEIC data from the China Statistical Yearbook.
inces, manufacturing passenger vehicles. 27 In the cut-
throat competition between these firms, provincial offi-
cials are under pressure to ensure that their local cham-
pion has a big enough local market to make it competitive
against the company next door.28
As automobiles will inevitably be a major part of how
China moves people in the years ahead, reducing the en-
ergy intensity of automotive transport is essential. Nota-
ble improvements have already been made, such as engine
displacement taxes and fuel efficiency standards. And in
the medium term, some see China as having potential to
leapfrog traditional vehicle technology and be earlier
movers on alternative like hybrids or hydrogen fuel cells.
While the fact that China’s auto sector is still in its in-
fancy provides more flexibility in how the future vehicle
fleet is built out, we don’t see the necessary economic and
policy foundations in place, at present, to make such a
leap. To date domestic firms have sought to replicate ex-
isting vehicle designs rather than create new ones. Weak
intellectual property rights undermine the likelihood that
foreign innovators will drive costs down through localiza-
tion in China to the degree needed to make their next
generation vehicles “cheap” to the Chinese. On top of
this, price controls for gasoline and diesel (discussed on
more depth in the following section) have reduced de-
mand for alternatively fueled cars on the part of consum-
ers. In an effort to inoculate consumers against the infla-
tionary effects of rising oil prices, Beijing also removes the
incentive to either drive less or switch to a more fuel-
efficient car.
27 "A Profile of China's Automotive Industry " Xinhua News Agency 3
March 2007. 28 For an excellent example of barriers to cross-province auto consolida-
tion, see Keith Bradsher, "Too Many Chinese Cars, Too Few Chinese
Buyers. So Far," The New York Times, 18 November 2006.
Figure 15: Electricity Prices for Households (USD per kilowatt-hour, 2005)

17
2 China’s Energy Supply System
From 1978 to 2001, China’s economy was able to grow
eight-fold without putting significant strain on the coun-
try’s energy resources. Institutional reform and price lib-
eralization during this period encouraged more efficient
use of coal, oil and natural gas. Demand for these fuels
grew at an average annual rate of 4 percent while the
economy grew at 9 percent.29 As a result, until the mid-
1990s China was not only able to produce enough energy
to fuel its own development, but had enough for export.
Since then the coincidence of an investment-led shift
back into heavy industry and the nascent take-off in con-
sumer-driven demand has taken its toll on the country’s
energy supply system. Demand for coal, on which China
relies for 67 percent of its energy needs (figure 16) has
grown 12 percent annually since 2001. Oil demand has
grown by 9 percent and natural gas by 15 percent over
the same period (figure 17). This change in the energy
intensity of Chinese economic growth surprised Beijing as
well as the rest of the world. Neither government regula-
tors nor market participants were prepared deal with such
a demand surge. Over the past five years domestic energy
shortages, increased import dependence, price volatility
and deteriorating environmental quality have raised the
profile of China’s energy policy both at home and abroad.
To date, energy sector reforms have lagged those in
the rest of the economy. The coal, power, oil and gas in-
dustries remain torn between plan and the market. Com-
petition has been introduced into some parts of the en-
ergy value chain (such as coal extraction and power gen-
eration) but state-owned monopolies/oligopolies remain
dominant in others (power distribution and most of the
oil and gas sectors). Upstream prices have mostly been
liberalized, but downstream prices remain largely con-
trolled. A small number of bureaucrats try to plan supply
while markets are determining more and more of the de-
mand. The result is a market structure and pricing system
that favors supply expansion rather than demand man-
agement, and a regulatory framework that attempts to
control that expansion through ham-fisted administrative
measures rather than market-oriented price signals.
In this section we provide a brief overview of China’s
oil, gas, coal and electric power industries and how the
existing policy system is inadequate for addressing China’s
29 CEIC from China StatisticalYearbook
surging demand and the energy insecurity and environ-
mental degradation that come with it.
FORMAL ENERGY POLICY INSTITUTIONS
Under the planned economy, energy policy in China did
not exist separate from industrial policy. The State Plan-
ning Commission (SPC) in Beijing determined how
much energy would be needed to achieve industrial objec-
tives set out in five-year plans and allocated investment
and set procurement prices accordingly.30 It then fell to
the State Economic Commission to insure that the indus-
trial ministries in charge of coal, oil, gas, and electricity
30 Structures changed over the prereform period; this depiction applied
on the eve of reform in the late 1970s. The definitive study of the bu-
reaucratic dynamics of the period is Lieberthal and Oksenberg, Policy
Making in China : Leaders, Structures, and Processes.
Figure 17: Annual Energy Demand Growth by Fuel
Figure 16: China’s Energy Supply by Fuel (2005)
18
production met their targets. By the early 1980s, it was
clear that this command-and-control approach was failing
to meet the country’s needs. To improve the efficiency of
energy production and allocation, Beijing began a series
of reforms, first in oil and gas and then in coal and power,
to convert government energy ministries into state-owned
enterprises (Yang et al. 1995). Prices were partially liberal-
ized, incentives were gradually introduced and competi-
tion was allowed in certain areas. By the end of 2002, all
energy production and delivery in the country was being
carried out by companies rather than bureaucrats, and
these firms were making investment decisions based
largely on market, rather than political, considerations.
While taking the Ministries of Coal, Petroleum, and
Electric Power and turning them into state-owned enter-
prises did much to improve the efficiency of energy sup-
ply, it also created an energy policy vacuum in Beijing.
Most of the industry expertise that was once housed in-
side the industrial ministries is now a part of the nation’s
energy companies. In its place are a handful of bureaus
and committees with a great deal of authority on paper
(and increasing professionalized) but insufficient tools
and resources to make effective policy. Erica Downs de-
scribes the result as “ineffective institutions and powerful
firms”, meaning that “energy projects and agendas are
often driven by the corporate interests of China’s energy
firms rather than by the national interests of the Chinese
state” (Downs 2006).
Today most of the formal government mechanisms
for shaping energy outcomes in China reside within the
powerful NDRC, the successor to the State Planning
Commission. Most importantly the NDRC’s Energy
Bureau is required to approve energy projects of any
meaningful size, its Price Bureau has control over what
firms can charge for gasoline, diesel, natural gas and elec-
tricity, and its Industry Bureau sets industry policy affect-
ing the country’s energy-intensive firms. The NDRC also
has a Bureau of Resource Conservation and Environ-
mental Protection which is charged with achieving the
State Council’s ambitious (and unlikely) energy efficiency
targets.31 Other government agencies with a lesser role
include the Ministry of Land and Resources which man-
ages resource extraction licensing, the Ministry of Com-
merce which oversees energy import and export licenses,
the Ministry of Finance which is tasked with collecting
taxes, fees and levies and the State Environment Protec-
tion Agency (SEPA) China’s environmental watchdog.
31 Other officers at NDRC have some role in energy as well. A brief
description of the NDRC’s administrative structure can be found at
http://en.ndrc.gov.cn.
The Rail Ministry is critical to moving coal and chemicals
around the country.
What China does not have (since 1993) is a Ministry
of Energy to help formulate and implement a cohesive
energy policy. Attempts have been made to create one in
the past, but have failed in the face of opposition from
other ministries and state energy companies (Andrews-
Speed 2004). In 2005, the State Council created an En-
ergy Leading Group composed of vice ministers and min-
isters, along with the State Energy Office, which is in-
tended to serve as a sort of secretariat to the Leading
Group and is led by the NDRC’s Ma Kai. With the Lead-
ing Group meeting only twice a year (as far as we know
from public announcements) to establish guiding princi-
ples for the energy sector and the Energy Office at risk of
becoming beholden to industry interests, it is unlikely
that either will have a significant impact on the govern-
ance of the energy sector.32
As a whole, the energy policymaking apparatus has
too few people at the national level33 and the wrong set of
tools to deal with the energy challenges of a large, diverse
economy. The Energy Bureau is staffed with fewer than
100 people, many of whom come directly from indus-
try.34 The State Energy Office has even fewer (between 30
and 40) and focuses on fairly academic matters.35 Com-
pare this with the United States, where 110,000 people
are employed at the Department of Energy (though many
perform R&D functions done in other institutions in
China). Over 600 of DOE’s staff are dedicated to statisti-
cal collection, analysis and forecasting alone as part of the
Energy Information Agency.36 The result is an energy
regulator forced to rely on the regulated for policy rec-
ommendations (the research staff at the State Grid Cor-
32 A great discussion of these institutions can be found in Downs
(2006); we supplemented published sources with a number of industry
interviews. 33 Staffing at provincial-level Development and Reform Commissions
add significantly to the nationwide energy bureaucracy headcount,
though their priorities are not always aligned with Beijing’s. 34 The most recent publicly announced staffing figure for the energy
bureau was from Su Yu, "Hang Shi Nengyuan Zhanlue: Nengyuanban
Maitou Jixing 150 Tian [Forging an Energy
Strategy: The State Energy Office Quietly Works Hard for 150 Days],"
Diyi caijing ribao [First Financial and Economic Daily], 31 October
2005. which put the number at 57. Conversations with officials in Bei-
jing suggest that the staff level has since increased to around 100. 35 Interviews with industry leaders and academics who have advised or
participated in Energy Bureau and State Energy Office activities, Bei-
jing, 2007. 36 U.S. Department of Energy, Performance and Accountability Report
Highlights: Fiscal Year 2006 (Washington: U.S. Department of Energy,
2006). EIA figures are from www.eia.doe.gov. Both DOE and EIA
numbers include both federal employees and contract employees.

19
poration, for example, is larger than that of the Energy
Bureau). And the basket of tools at NDRC’s disposal
(administrative and price controls) are less and less suited
for dealing with today’s Chinese economy.
INFORMAL CHANNELS OF INFLUENCE
In addition to the limited formal mechanisms of energy
policymaking, the government influences developments
in the energy sector through informal channels. While it
is true that China has powerful energy firms, firm behav-
ior can be affected by state influence. In addition to pri-
vatized, listed arms, most of China’s leading energy com-
panies have centrally owned group level holding compa-
nies nominally held by the State-owned Assets Supervi-
sion and Administration Commission (SASAC), repre-
senting “the people” who are majority shareholders in
these large, state-owned energy enterprises (Naughton
2005). While SASAC has thus far been a relatively passive
“owner”, it has the potential to exert a great deal of influ-
ence over these firms, particularly if SOEs are required to
start paying dividends to the state (which they currently
do not do).37
More importantly, the senior-most executive leader-
ship of these firms is determined by the Ministry of Per-
sonnel (MOP), which has the power of appointment and
dismissal. The MOP is fully aligned with the interests and
politics of the Communist Party, and lies at the core of
party power and discipline. As energy companies are too
strategic to staff cavalierly, and as there are few career
energy bureaucrats with both knowledge of the sector and
the proper party credentials, MOP tends to select industry
professionals for these leadership positions. Yet most of
these professionals also view their posts as stepping stones
to future careers in the real pinnacle of power in China:
government officialdom. As a result, industry leaders
must balance policy objectives and party politics with
pure profit and loss calculations in making firm-level de-
cisions.
While the power to appoint and dismiss provides
MOP and the party with the ability to shape industry,
making industry leadership a political position (the
chairmen of some of the largest energy companies hold a
vice minister–level rank) the system provides industry
with a seat at the table in shaping policy.
37 For discussion of China’s dividend policy for state-owned enterprises,
see Kuijs, Mako, and Zhang, "SOE Dividends: How Much and to
Whom?.", Shan, "The World Bank's China Delusions.".
OIL AND GAS
Oil currently meets 21 percent of Chinese energy needs,
up from 17 percent in 1990 (absolute growth of nearly 5
million barrels per day from 2.3 in 1990 to 7.2 in
2006).38 In oil, as in coal, gas and power, industry is the
largest consumer in absolute terms, compared with the
United States, where transportation accounts for two-
thirds of total oil demand (EIA 2006). Yet with the num-
ber of motor vehicles on the roads doubling over the past
five years, transportation is the most important factor at
the margin, accounting for 42 percent of the growth in oil
consumption since 1995 (figure 18). In recent years,
automobiles have been joined by petrochemical produc-
tion and oil-fired power generation in driving petroleum
demand.
Natural gas plays a much smaller role than oil, ac-
counting for only 3 percent of all energy consumed. Yet
demand is growing, driven by the country’s fast-growing
chemicals industry and an urbanization-led need for clean
household heating and cooking fuel (see again figure 17).
In 2005, production of raw chemicals accounted for 32
percent of all gas demand, followed by the residential
sector at 17 percent.39 Despite hopes of a take-off in gas-
fired power generation (see the section on Coal and
Power below), the few natural gas turbines in the country
were responsible for a meager 4 percent of demand,
slightly more than the transportation sector at 3 percent.
Supply
As the fourth largest petroleum producing country out-
side of the Middle East (after the United States, Russia,
38 CEIC data from the China Statistical Yearbook. 39 CEIC from the China Statistical Yearbook.
Figure 18: Composition of Oil Demand by Sector

20
and Mexico) (BP 2006), China has a well-developed oil
and gas supply industry (figure 19). A net oil exporter
until 1993, China was a major supplier of crude oil to the
rest of East Asia during much of its history. In fact, in the
late 1970s industrial planners in Beijing hoped that dou-
bling production would allow them to finance their
dreams of industrialization and modernization with oil
riches. Failure to find the new oil fields required for this
vision helped precipitate economic reform. While domes-
tic production has increased modestly with the develop-
ment of some offshore and western fields, China’s rela-
tively meager proven reserves suggest that annual oil out-
put is near peaking at the current 3.7 million barrels per
day. 40
Gas production is still increasing, but not fast
enough to satisfy demand growth. Industry forecasts sug-
gest that China will need around 200bcm of natural gas
per year by 2020, a four-fold increase from current lev-
els.41 While there have been encouraging new discoveries
offshore, in Sichuan Province, and in the Erdos Basin,
China will need to import significant amounts of gas.
China’s first shipment of liquefied natural gas (LNG)
arrived at a receiving terminal in Guangdong Province in
summer 2006 from Australia’s Northwest Shelf project,
in which the China National Offshore Oil Corporation
(CNOOC) has a stake. CNOOC has signed two addi-
tional LNG supply agreements, one with BP’s Tangguh
project in Indonesia and the other with Malaysia’s Petro-
nas (to supply terminals in Fujian and Shanghai respec-
40 International Energy Agency, Medium-Term Oil Market Report:
Update, 2007. 41 Erica S. Downs, "China," in Energy Security Series, ed. Brookings
Institution (Washington, DC: Brookings Institution, 2006). table on
comparative natural gas demand forecasts).
tively).42 Given the price and availability of additional
contracts in Asia, China will not be able to meet its me-
dium-term gas needs through LNG alone. A number of
potential pipelines from Russia and Central Asia are un-
der discussion, but both the economics and politics of
these projects are challenging.43
Market Structure
Domestic upstream production is controlled by three
companies, all of which were at one time parts of gov-
ernment ministries. The largest, in terms of production, is
the China National Petroleum Corporation (CNPC),
which was formed as a ministry-level SOE in 1988 out of
the upstream assets of the Ministry of Petroleum Indus-
try. CNPC is the world’s fifth largest oil producing com-
pany, ahead of Exxon, BP, Chevron, and Shell (table 4).
The China Petroleum and Chemical Corporation
(Sinopec), formed in 1983 out of the downstream assets
of the Ministry of Petroleum Industry and Ministry of
Chemical Industry, has a much smaller upstream portfo-
lio (ranking 30th globally in oil production) but is domi-
nant in the refining sector. In terms of revenue, but not
profits or production, Sinopec is larger than CNPC.
CNOOC is the smallest of the three by all measures and
was established in 1982 to develop China’s offshore re-
sources in cooperation with international oil companies
(IOCs).44 CNOOC, which unlike its sisters does not have
ministry rank, is almost exclusively an upstream company
with the exception of a refining and petrochemicals joint
venture with Shell (table 5). A fourth state-owned oil
company, Sinochem, has a limited presence upstream
(mostly overseas) but a noteworthy trading, refining, and
chemicals portfolio. Other smaller independent firms play
a significant role in logistics, transport, storage, and refin-
ing.
Competition
While each of these companies was originally given a dis-
crete market segment, competition among them has
42 "China Seals LNG Supply Contract for Shanghai Terminal," Gas
Matters, 4 December 2006. 43 Based on conversations with oil and gas industry officials in China. A
good synopsis of the pipeline projects currently under consideration can
be found in "China's Foreign Plans Have a Long Way to Go," Interna-
tional Gas Report, 26 February 2007. 44 For an excellent discussion of institutional change in the energy sector,
see Lieberthal and Oksenberg, Policy Making in China : Leaders, Struc-
tures, and Processes, Yang et al., "A Review of China's Energy Policy."
Figure 19: Annual Oil Production and Proven Reserves for Top Six Producers (2005)
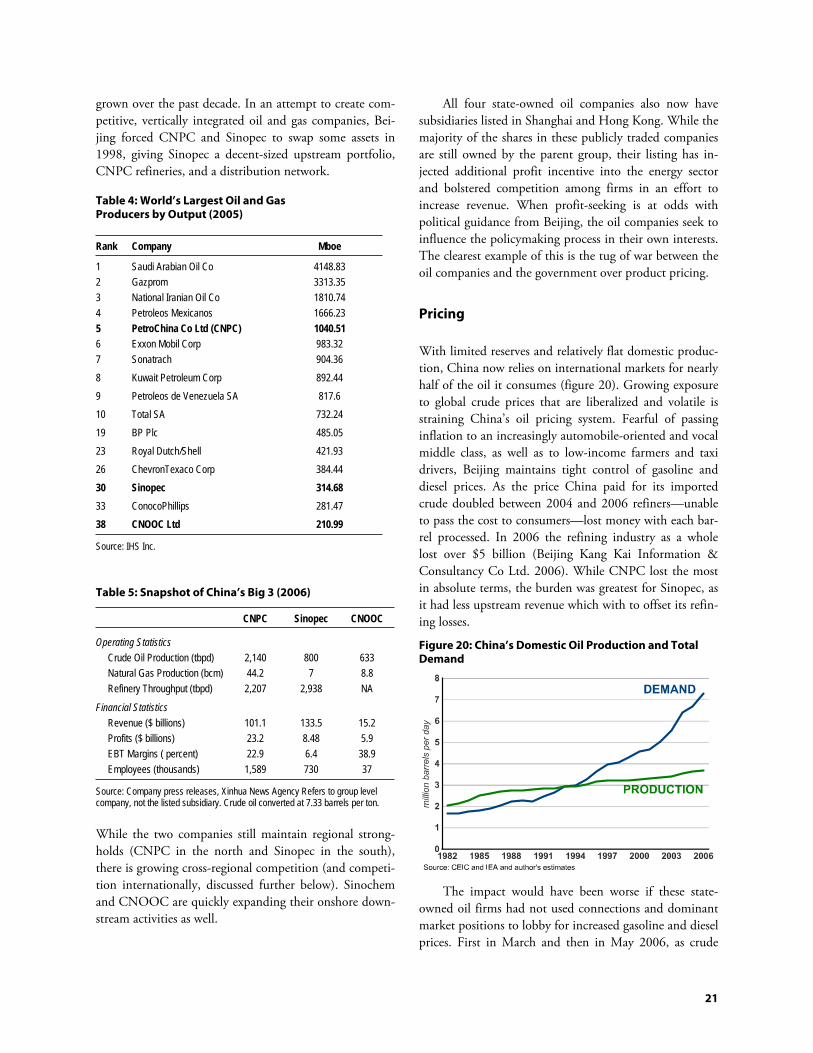
21
grown over the past decade. In an attempt to create com-
petitive, vertically integrated oil and gas companies, Bei-
jing forced CNPC and Sinopec to swap some assets in
1998, giving Sinopec a decent-sized upstream portfolio,
CNPC refineries, and a distribution network. Table 4: World’s Largest Oil and Gas Producers by Output (2005)
Rank Company Mboe
1 Saudi Arabian Oil Co 4148.83 2 Gazprom 3313.35 3 National Iranian Oil Co 1810.74 4 Petroleos Mexicanos 1666.23 5 PetroChina Co Ltd (CNPC) 1040.51 6 Exxon Mobil Corp 983.32 7 Sonatrach 904.36 8 Kuwait Petroleum Corp 892.44 9 Petroleos de Venezuela SA 817.6 10 Total SA 732.24 19 BP Plc 485.05 23 Royal Dutch/Shell 421.93 26 ChevronTexaco Corp 384.44 30 Sinopec 314.68 33 ConocoPhillips 281.47 38 CNOOC Ltd 210.99
Source: IHS Inc.
Table 5: Snapshot of China’s Big 3 (2006)
CNPC Sinopec CNOOC
Operating Statistics Crude Oil Production (tbpd) 2,140 800 633 Natural Gas Production (bcm) 44.2 7 8.8 Refinery Throughput (tbpd) 2,207 2,938 NA
Financial Statistics Revenue ($ billions) 101.1 133.5 15.2 Profits ($ billions) 23.2 8.48 5.9 EBT Margins ( percent) 22.9 6.4 38.9 Employees (thousands) 1,589 730 37
Source: Company press releases, Xinhua News Agency Refers to group level company, not the listed subsidiary. Crude oil converted at 7.33 barrels per ton.
While the two companies still maintain regional strong-
holds (CNPC in the north and Sinopec in the south),
there is growing cross-regional competition (and competi-
tion internationally, discussed further below). Sinochem
and CNOOC are quickly expanding their onshore down-
stream activities as well.
All four state-owned oil companies also now have
subsidiaries listed in Shanghai and Hong Kong. While the
majority of the shares in these publicly traded companies
are still owned by the parent group, their listing has in-
jected additional profit incentive into the energy sector
and bolstered competition among firms in an effort to
increase revenue. When profit-seeking is at odds with
political guidance from Beijing, the oil companies seek to
influence the policymaking process in their own interests.
The clearest example of this is the tug of war between the
oil companies and the government over product pricing.
Pricing
With limited reserves and relatively flat domestic produc-
tion, China now relies on international markets for nearly
half of the oil it consumes (figure 20). Growing exposure
to global crude prices that are liberalized and volatile is
straining China’s oil pricing system. Fearful of passing
inflation to an increasingly automobile-oriented and vocal
middle class, as well as to low-income farmers and taxi
drivers, Beijing maintains tight control of gasoline and
diesel prices. As the price China paid for its imported
crude doubled between 2004 and 2006 refiners—unable
to pass the cost to consumers—lost money with each bar-
rel processed. In 2006 the refining industry as a whole
lost over $5 billion (Beijing Kang Kai Information &
Consultancy Co Ltd. 2006). While CNPC lost the most
in absolute terms, the burden was greatest for Sinopec, as
it had less upstream revenue which with to offset its refin-
ing losses.
The impact would have been worse if these state-
owned oil firms had not used connections and dominant
market positions to lobby for increased gasoline and diesel
prices. First in March and then in May 2006, as crude
Figure 20: China’s Domestic Oil Production and Total Demand

22
costs swelled, CNPC and Sinopec cut back on loss-
making refining, creating spot shortages in some high-
demand areas like Guangdong and Zhejiang Provinces. As
stories of long lines at gas stations and farmers unable to
get enough diesel to work their land filled the press,
NDRC acquiesced and raised prices 3 to 5 percent in
March and another 10 to 11 percent in May (figure 21).
While downstream profits have suffered from high crude
price, upstream profits have grown dramatically. Beijing
responded in spring 2006 by enacting a windfall tax on all
domestic oil production above a certain price and used
some of that revenue to compensate farmers and cab driv-
ers for their more expensive diesel and gasoline bills. By
the end of 2006, however, crude costs had fallen enough
to put the country’s refiners back in the black and a third
expected price increase was averted. In fact, in early Janu-
ary 2007, Beijing slightly lowered the price of gasoline
and diesel. The government is likely to continue adjusting
prices as needed to balance the interests of the companies
with the interests of consumers and is unlikely to fully
liberalize prices in the near term.
For natural gas, prices are set by Beijing but vary by
province and sector. In most provinces, residential users
pay the highest price, followed by chemical producers,
power generators, and fertilizer manufacturers. Prices for
the chemical industry are subsidized to make the industry
competitive with the Middle East—the alternative place
to put new chemical industrial facilities. Prices for power
generation are kept low to promote some substitution of
this clean fuel for coal, but the market is not clearing
(demand is not being met). And gas prices for fertilizer
are subsidized out of concern for the country’s farmers.
In a tight gas market, the price structure creates an
incentive for CNPC and Sinopec to supply residential
customers at the expense of industry, particularly if that
industry is a chemical park operated by the competition.
Several of these parks, built by one of the Chinese oil
majors in partnership with large foreign chemical compa-
nies, have had difficulty ensuring reliable supply at the
government-stipulated price. The foreign companies have
been forced to lobby provincial and national officials to
keep the gas turned on. Many are also looking at develop-
ing coal-derived alternatives to natural gas as a more de-
pendable feedstock.
Expanding Overseas
With limited opportunities to increase upstream produc-
tion domestically and thin or negative margins on down-
stream activities because of price controls, Chinese oil
companies have sought to boost reserve holdings, produc-
tion, revenue, and clout by expanding overseas. This de-
velopment has garnered substantial attention in both
business and policy circles abroad. The political dialogue
that has surrounded this domestically has been well-
covered by others (Downs 2004, 2006; Lieberthal and
Herberg 200) and the implications for international mar-
kets and global energy security is covered in the next sec-
tion. For the purposes of our discussion here, the point
we wish to emphasize is that the domestic resource en-
dowment and industry structure create a market incentive
for Chinese oil companies to expand their upstream port-
folios overseas.
In fact, in recent years it is more likely that the com-
panies, rather than government officials, are the real force
behind any “going out” policy. CNPC, Sinopec, and
CNOOC have used political clout to get supportive high-
level state visits, access to subsidized capital, or develop-
ment assistance money designated for infrastructure pro-
jects. This sometimes contradicts Beijing’s desire to sink
additional investment into mature, less profitable fields at
home in order to prop up declining domestic produc-
tion.45 Chinese oil companies argue that increasing their
overseas business bolsters China’s energy security for the
same self-interested reasons US corn growers to champion
the cause of energy independence through ethanol.
COAL AND POWER
While China’s oil and gas sector gets the most attention
internationally, the coal and power sectors have the big-
45 Based on conversations with Chinese petroleum industry officials.
Figure 21: Gasoline and Diesel Prices in the United States and China (2004–07)

23
gest impact on the country’s energy security, economic
vitality, and environmental sustainability. While down
from a post-reform high of 76 percent in 1990, coal still
meets over two-thirds of China’s energy needs. In 2006
that translated into 2.4 billion tons of coal demand,
nearly twice the amount consumed just six years ago.
China is easily the world’s largest coal market, double the
size of the United States. Over 75 percent of the demand
growth in recent years has come from the power sector, as
electricity demand boomed and alternative fuel sources
for generating that electricity (hydro, natural gas, wind,
and nuclear) failed to keep pace (figure 22).
Of the 50 percent of coal not consumed by the
power sector, the majority is sold directly to industry for
use in boilers, coking ovens and on-site (“inside the
fence”) power generation. Household coal consumption,
which accounted for 20 percent of total demand in 1985,
has dropped to 4 percent as China’s residents move into
homes equipped with gas and electricity for cooking and
heating.
Driven by the electrification of both household and
enterprise energy use, the Chinese economy has created as
much new demand for power since 2000 as the total de-
mand for power in France, Germany and the UK com-
bined.46 In 2006 alone China added over 100GW of new
capacity, equivalent to the entire installed base of Africa.
Like the coal used to generate it, the lion’s share of
the country’s electricity is consumed by industry, with 10
percent going to iron and steel production alone (figure
23). Households account for 11 percent of demand,
down slightly from a high of 12.5 percent in 2001. The
commercial sector, which uses between 15 and 20 percent
46 CEIC data from the China Statistical Yearbook; BP plc., Statistical
Review of World Energy 2006.
of the electricity in OECD countries, accounts for only 3
percent of Chinese demand.
Supply
China relies on coal because it has this resource greatest
abundance. Compared with only 1 percent of the world’s
proven oil and gas reserves, nearly 13 percent of all the
known mineable coal still in the ground is in China.47
Through most of its history, tapping these reserves has
allowed China to remain energy independent. But energy
independence does not mean energy security. Having coal
in the ground is one thing. Being able to mine it, move it,
and burn it quickly, cleanly, and in large enough quanti-
ties to clear the market is another. The latter requires effi-
cient industry structures, good data, responsive pricing
signals, and effective regulation.
China’s coal and power sector falls short on all
counts. When double-digit electricity demand growth
broke out starting in 2002, the result was coal shortages,
power outages, spikes in oil demand, and a rapid deterio-
ration in the quality of the country’s air. This has created
a sense of energy insecurity of domestic origin that, for
most Chinese, is more immediate and more important
than concerns over growing dependence on imported oil.
47 Ibid.
Figure 23: Electricity Demand by Sector (share of total)
Figure 22: Coal Demand by Sector (share of total)

24
Market Structure
Unlike oil and gas, the coal industry in China is highly
fragmented. Production shortages in the late 1970s and
early 1980s forced Beijing to allow local private and col-
lectively owned mines to enter what had been a state-
dominated industry. As these small mines were free to sell
all their output at market rates while the state-owned
mines were forced to sell at the plan-specified price, the
small mines’ share of national production climbed dra-
matically during the 1980s and 1990s (Andrews-Speed
2004; Yang et al. 1995). Today the top three state-owned
coal companies, while world-scale, account for less than
15 percent all domestic production. Shenhua Coal, the
biggest of the three, is now the world’s largest coal com-
pany yet accounts for less than 9 percent of the domestic
market (figure 24). The power generation industry is
more consolidated than coal extraction, but less so than
oil and gas. Like other parts of the energy sector, electric-
ity production and transmission was controlled by a gov-
ernment agency before the reform period. The same en-
ergy shortages that forced Beijing to loosen its grip on
coal production in the 1980s prompted reforms in the
power sector. Local and provincial governments, and even
private and foreign companies, were given the right to
invest in power generation (but not transmission). In
another wave of reforms in 1997, the Ministry of Power
and Industry was converted into the State Power Corpo-
ration of China (SPCC), which in turn was dissolved in
2002. SPCC’s generation assets (46 percent of the na-
tional total) were divided among five power producers, all
SOEs (see figure 24). The distribution assets (90 percent
of the national total) were split between two companies,
the State Grid Corporation (SGC) in the north and the
China Southern Power Grid (CSG) in the south (IEA
2006). These distributors are massive enterprises, the first
and tenth largest utilities in the world, with $110 billion
of revenue together in 2005.48
Today the five power producers spun off from the
SPCC plus two state-owned nuclear power companies
generate nearly half of the country’s electricity. With the
exception of a few large coal companies like Shenhua that
have power assets and the Three Gorges Project Corpora-
tion, the remainder is generated by provincial, local and
privately owned companies. While some competition has
developed in power generation, transmission remains
controlled by the SGC and CSG duopoly. All five state-
owned independent power projects, and several of the
large coal companies, have publicly traded subsidiaries. As
in the oil and gas industry, a large portion of the shares
are held by the parent company. Neither of the grid com-
panies have listed arms, though CSG is considering an
initial public offering in the near future.49
Pricing and Profits
Since the 1980s China has gradually liberalized coal pric-
ing. As with many other goods a two-tiered price system
was created, one set by NDRC for plan-allocated quotas
48 Fortune Magazine’s Global Fortune 500 available at
http://money.cnn.com (accessed 19 March 2007) 49 "Shanghai Sharemarket Expected to Double IPO Value in 2007, May
Beat HK," AFX Asia, 4 January 2007.
Figure 24: The Electricity Value Chain (2006 revenue / EBT profit margin) (figures in italics are estimates)
Exports Industry
1200 mn tons
1000mn tons 68mn tons 32mn tons
Imports Other
145mn tons 53bn kwh
Nuclear
3bn kwh
Wind
INDUSTRY
RESIDENTIAL324bn kwh
90bn kwh COMMERCIAL
OTHER319bn kwh
Exports
12bn kwh 4bn kwh
Imports
China National - 101 mn tons
Datong Coal - 62 mn tons
Others - 2014 mn tonsHuadian - 200 bn kwh
CPI - 168 bn kwh
Others - 1694 bn kwh > CRP > CNNC > Guangdong Nuclear > Three Gorges Dam > Shenhua Group > Datong Coal > Yankuang Coal > Provincial Power Companies
Huaneng - 282 bn kwh
Guodian - 226 bn kwh
Datang - 260 bn kwh
2834bn kwh
State Grid Corporation1710 bn kwh
China Southern Power Grid397 bn kwh
Other Transmission and Local Consumption - 727 bn kwh
378bn kwh
Hydro
2092bn kwh
COAL MINING ($89 bn / 9.6%) GENERATION ($98bn / 11.8%) TRANSMISSION ($163 bn / 4%)
Shenhua Group - 203 mn tons

25
and the other set by the market for all demand outside the
plan. Over the past 20 years, the plan price has rational-
ized and the amount of coal produced outside the plan
has grown. At the beginning of 2007, the two-tier system
was completely abolished and all coal, both contract and
spot, must now be negotiated at market rates (although it
remains to be seen how much “legacy behavior” will re-
main).50
Electricity prices, however, remain tightly controlled
by NDRC’s Price Bureau. Unlike more developed elec-
tricity markets, China has no separately determined
transmission tariffs. NDRC determines both the price at
which the generators can sell power to the grid and what
the grid can charge different categories of users. NDRC
sets these price schedules province by province in consul-
tation with local price bureaus and attempts to strike a
balance between the interests of various parties affected by
the regime. Provincial officials lobby for end-user pricing
low enough to keep their industries viable and citizens
happy. The power generators lobby for an on-grid tariff
high enough to cover their fuel costs and ensure that the
sector is profitable enough to make the necessary invest-
ments. In the middle are the grid companies, stressing to
NDRC that enough margin needs to shake out between
the two prices to finance a $130 billion buildout of the
nation’s transmission network between 2006 and 2010.51
It’s difficult to pinpoint exactly how rents are allo-
cated across the electricity value chain by the current sys-
tem because of the complexity and opacity of end-use
pricing and transmission costs. The demand surge over
the past three years shrank coal inventories and doubled
spot prices. In response NDRC enacted a price pass-
through mechanism whereby electricity tariffs could be
raised by 75 percent of coal price increases. Yet according
to available data, electricity prices have only risen by 20
percent on average since the beginning of 2004 (figure
25). This put stress on power generation profits, which,
for the industry as a whole, fell from 11.7 percent in 2003
to 9.6 percent in 2004 (Beijing Kang Kai Information &
Consultancy Co Ltd. 2007b). Industrywide, coal mining
profits rose from 5.7 to 8.4 percent (Beijing Kang Kai
Information & Consultancy Co Ltd. 2007a). As coal
prices flattened out during the second half of 2005, power
generation profits recovered to 11.8 percent by the end of
2006. Looking at specific publicly traded companies (for
50 Based on interviews with several power generation companies in 2007.
See also "Beijing Scraps Coal Round," Power in Asia, 18 January 2007. 51 Based on interviews with grid company officials in January and Feb-
ruary 2007.
which the profit data is more reliable), the trend is even
more pronounced (table 6).
Table 6: Net Profit Margins for China’s Publicly Traded Coal and Power Companies (percent)
Company 2006 2005 2004 2003 2002 2001
Coal Mining
Shenhua 31.6 29.9 22.6 10.8 7.5 — Yanzhou 25.0 29.8 20.0 19.2 19.9 China Coal 11.1 10.1 1.0 — —
PowerGeneration
Huaneng 15.6 12.2 17.7 23.2 21.2 21.9 Huadian 9.0 8.0 10.4 12.9 15.3 19.6 CPI 13.3 15.2 19.2 20.8 — — CRP 28.1 48.2 68.9 120 — —
Datang 14.4 13.1 16.9 18.2 17.5 22.0
Source: Thomson Financial.
How much money the grid companies really make is
less clear. Looking just at the gap between the published
national average on-grid price and end-user prices, and
the grid appears to be in a position to make huge profits.
Yet the reported transmission industrywide data show
meager 2006 profits of 4 percent, up from 1.6 percent in
2004. While the quality of this data is spotty (the grid is a
state-owned monopoly with an incentive to underesti-
mate profit), interviews with both company officials and
industry analysts suggests that the grid is able to collect
less from end-users (either because of reduced rates or
nonpayment) than the published rate tables would sug-
gest.
Figure 25: Coal and Electricity Price Growth (index of nationwide averages, Jan 2002 = 100)

26
Market Regulation
What is clear is that the current electricity market struc-
ture and pricing regime aren’t working for the country as
a whole. In the absence of market price signals, NDRC
attempts to accurately forecast demand, approve new
supply accordingly, and tweak prices so that everyone has
enough money to build the needed capacity. So far the
record for this approach has been less than glowing. For
China’s power sector, the reform period has been marked
by volatile capacity swings between surplus and shortage
(figure 26). The past four years have been particularly
painful. NDRC, seeing a glut of power in the market,
issued a three-year moratorium on new power construc-
tion in 1999 (IEA 2006; Andrews-Speed 2006). When
demand took off in 2002, supply fell short, and blackouts
were endemic. Desperate for new power, local official
drove the construction of 140GW of new capacity with-
out NDRC approval. Industry stocked up on diesel and
fuel oil to run private generators, contributing to a 16
percent spike in oil demand in 2004.52 And while supply
and demand have since come back into balance thanks to
a doubling of installed power generating capacity since
2002, the factors that created the shortage haven’t
changed. NDRC is already fretting about a coming sup-
ply glut based on their conservative economic growth
forecasts, and is reining in power plant construction.
Yet the current pricing system is not compatible with
serious demand-side management. NDRC has started to
raise electricity rates for more energy-intensive users, but
the largely state-owned heavy industry sector lobbies local
and provincial officials to ensure that the price hikes are
gradual enough to keep their businesses viable. The en-
ergy companies would like to make more money, but not
if it means raising prices to demand destroying levels.
With strong corporate interests on both the supply and
demand sides pushing for capacity expansion, it’s left to
comparatively weak economic bureaucrats and environ-
mental regulators to advocate demand management. This
means that despite the government intention to see con-
sumption brought under control, the stage is set for an-
other upside demand surprise, and all the coal shortages
and power blackouts that go with it, in a few years’ time.
52 Based on interviews with industry officials in China during January
and February 2007.
Environmental Control
The political economy of the power market and the pol-
icy tools used to manage it also hinder efforts to address
environmental consequences. Pulverized subcritical coal-
fired power technology currently accounts for 80 percent
of all power generation (China has only recently intro-
duced more efficient supercritical technology). The re-
mainder is mostly hydropower, with nuclear, natural gas
and renewables constituting less than 2 percent each
(figure 27).53 The dominance of coal in meeting the
country’s electricity needs is taking its toll on the nation’s
air quality. Annual sulfur dioxide (SO2) emissions, the
principal cause of acid rain, have grown by 30 percent
since 2000. According to environmental regulators, SO2
caused over $60 billion in direct economic damage in
2005.54 Harder to quantify are the welfare loss in respira-
tory problems, premature mortality, and the declining
quality of the physical environment.
Concerned with the social and political risks associ-
ated with environmental deterioration, Beijing has taken
steps to reduce power-sector air pollution. An SO2 pollu-
tion levy was enacted in the late 1970s (Jiang and
McKibbin 2002) but was either too cheap, too narrow, or
too weakly enforced to discourage power plants from pol-
luting. While SEPA, China’s environmental watchdog,
periodically threatens to close plants that don’t comply
53 CEIC data from the China Statistical Yearbook; the China Electricity
Council (www.cec.org.cn). 54 "500b-Yuan Loss from Sulfur Cloud," South China Morning Post, 4
August 2006, "SEPA Lifts Ban on Two Power Firms after They Fulfill
Ruling " Industry Updates, 19 March 2007.
Figure 26: Annual Growth in Power Generation, Capacity and GDP

27
with existing regulations, its enforcement power is limited
(though growing).55 Recently the sulfur levy was increased
but, more importantly, was coupled with a market-based
incentive: If plants installed FGD systems, NDRC would
allow them to add the cost of installation and operation to
the price they can charge the grid companies for power.
The results so far have been fairly encouraging. More
than half the FGD capacity in existence was built in 2006
under this system. It is still too early to tell whether regu-
lators will be successful in ensuring that power plants
operate these FGD systems now that they have them in-
stalled. Also Chinese FGD systems tend to operate at
lower removal efficiency than those used in the OECD
(70 to 80 percent compared with 98 to 99 percent in
Japan).56 And while this approach to SO2 control is gain-
ing traction, no such regime exists for coal-fired power’s
other air pollutants, including nitrogen dioxide, particu-
late matter, mercury, and CO2.57
The move from coal to cleaner alternatives faces sev-
eral challenges. New hydropower projects encounter po-
litical resistance (from displacing people—over 23 million
already) and declining water resources.58 Nuclear power
plants have long construction lead times (even in China,
since the usual corners cannot be cut in nuclear) and still
involve lengthy negotiations with foreign firms. Under
current electricity pricing schedules, natural gas is not a
competitive fuel source for power generation in most of
the country59 in the absence of more severe pollution pen-
alties or increased demand from residential and commer-
cial consumers.60
55 For more background on environmental governance in China, see,
among others, Elizabeth Economy, The River Runs Black : The Envi-
ronmental Challenge to China's Future (Ithaca: Cornell University
Press, 2004). 56 We thank Peter Evans for this point. See his seminal work on Japa-
nese green aid to China (mostly in the form of FGD systems) can be
found in Peter C. Evans, "Japan's Green Aid Plan: The Limits of State-
Led Technology Transfer," Asian Survey 39, no. 6 (1999). 57 Based on conversations with environmental regulators, NGOs and
power companies. 58 "China Feb Reservoir Volumes Fall 3.5 Pct Yr/Yr," Reuters News, 1
February 2007. The displaced persons statistic is from Premier Wen
Jiabao’s March 2007 Work Report to the National People’s Congress. 59 Natural gas–fired power is economic in some coastal provinces where
the cost of delivered coal is high and there is more peak demand. 60 A power grid that serves a large number of residential and commercial
users, such as in affluent coastal provinces, needs to dispatch additional
electricity during peak demand hours. If a higher tariff is charged during
these periods (called “time-of-use” pricing), than natural gas-fired
power, which is easier to turn on and off than coal-fired power, can be
competitive even at a higher price per unit of energy content. Yet even
when the economics work out, gas availability remains a challenge as
industrial users who have no alternative to natural gas are often given
supply priority.
Wind power is becoming cost-competitive in certain
areas, particularly with the passage of a renewable energy
law in 2005, and China has become one of the world’s
largest markets for wind turbines, adding 1,000MW of
capacity in 2006.61 Yet at under 1 percent of total in-
stalled power generation capacity, wind has a long way to
go before it can make a significant dent in China’s overall
power demand. The situation isn’t helped by the boom
and bust cycle of capacity construction in China. During
a period of shortage, Chinese firms reach for technology
that will get the most power on the grid in the shortest
time frame. This almost always means pulverized coal.
61 We thank Scott Roberts of MIT for this point.
Figure 27: Power Generation by Fuel Type (2005)

3 Global Impacts
China’s energy markets and policies, as they exist today,
are failing to reliably supply the country’s explosive de-
mand growth or adequately address its environmental
consequences. And the same market distortions and pol-
icy shortcomings that create supply shortages, price vola-
tility, and air pollution inside China impact energy mar-
kets and environmental quality outside China. Blackouts
resulting from poor planning and management in the
domestic power sector send ripples through international
oil markets. Retail price controls, coupled with a growing
sense of energy insecurity at home, have prompted Chi-
nese oil companies to search for investment opportunities
abroad. The skewed capital, land, and environmental
costs that have caused given China such a large global
market share in heavy industry has also made the country
a leading source of sulfur pollution regionally and green-
house emissions globally. If these costs right themselves in
the years ahead, some heavy industry will no longer be
viable in China and global metals and chemicals markets
could be shaken up once again as excess Chinese capacity
is subtracted.
WORLD ENERGY MARKETS
The most visible impact of China’s growing energy de-
mand outside its borders is in upstream energy commod-
ity markets. Going from one of Asia’s largest energy sup-
pliers to one of the world’s largest energy importers in
little more than a decade, China is a major force at the
margin in global oil, gas, and coal trade flows. In addition
to the sheer magnitude of China’s buying on these mar-
kets, the volatility of demand, a paucity of good data, and
the nature in which Chinese energy companies buy and
invest have made policymakers and business leaders in
other parts of the world anxious.
Oil and Gas Markets
With domestic extraction flattening out, China relies on
international oil markets for a growing share of the crude
oil it consumes. And every year China needs more and
more oil. In 1993, when imports exceeded exports for the
first time, China was the world’s fifth largest oil con-
sumer, accounting for 4.5 percent of total global demand
(BP 2006). Today China accounts for 8.7 percent of
global demand and has surpassed Japan as the world’s
second largest oil consumer after the United States.
China’s impact on international oil trade is even greater
than its share of global demand in absolute terms sug-
gests: At the margin, over a third of global demand
growth over the past five years came from China (figure
28).
This explosion in Chinese demand surprised interna-
tional markets as much as it surprised Beijing. In an al-
ready tight market it was the surprise more than the de-
mand itself that helped push up oil prices. At the turn of
the century, both Chinese planners and foreign observers
assumed that oil demand would continue to grow half as
fast as GDP, as it had done for the previous two decades.
They were wrong on two counts: The economy grew
more quickly than expected and the oil intensity of eco-
nomic growth increased unexpectedly. This surprise was a
result of investment-led more than consumption-led de-
mand. While auto sales have outpaced most estimates, the
real shock came from the unexpected surge in heavy in-
dustry. Industrial demand pushed China’s oil needs be-
yond what was anticipated both directly (in the consump-
tion of naphtha and other feedstocks) and indirectly (in
fuel used for back-up generators).
Month-to-month and year-to-year volatility in de-
mand further increase China’s impact on oil markets. In
2004 blackouts created a spike in the amount of diesel
and fuel oil industry purchased for back-up power genera-
tion, pushing up apparent oil demand growth62 to 16
62 As Chinese companies don’t release inventory data, apparent demand
here refers to refinery throughput plus net import of refined products.
Figure 28: Global Oil Demand Growth by Country or Region

29
percent, from 11 percent the year before.63 In 2005 de-
mand growth fell to 3 percent due to new coal-fired
power capacity coming online and a drawdown in corpo-
rate inventories of oil as firms tried to wait out what they
thought were temporary price hikes. Crude prices went
from $42 to $70 per barrel that year (partially in response
to Chinese demand in 2004) but domestic retail gasoline
and diesel prices only increased 15 percent.64 As refining
operations lost money, oil companies cut back purchases
and drew down inventories. Because Chinese companies
do not publish inventory data, outside observers including
the International Energy Agency (IEA) assumed that a
decline in apparent demand was the result of weak under-
lying demand, and that 2004 was an anomaly.
Markets were therefore surprised again in the begin-
ning of 2006 when crude imports skyrocketed as Chinese
oil companies took advantage of a dip in the market to
replenish depleted inventories. Once oil prices rebounded,
the oil companies again choked back refinery throughput
to minimize losses and put pressure on the government to
raise the downstream prices they could charge. When the
retail price increases arrived (once in March and once in
May), Chinese firms cranked up refinery production and
drew down inventories. This cat and mouse game be-
tween the oil companies and the government over prices,
coupled with the fact that China buys most of its oil im-
ports on the spot market, creates a great deal of month-to-
month volatility (figure 31). The pricing system has also
created a booming independent refinery business, where
smaller-scale firms further cloud the demand picture by
processing fuel oil or stolen domestic crude to clear the
market when the Chinese oil majors refuse to import and
refine at a loss. These factors makes forecasting Chinese
oil demand an even more challenging endeavor (figure
29).
While its impact has been felt most in oil markets,
China could become a significant factor in the natural gas
trade in the years ahead. At present China only imports 3
billion cubic meters (bcm) of gas per year in the form of
LNG—less than consumed in the United States every
other day. Another 6 bcm has been contracted and will
start arriving in 2009.65 Though domestic pricing for
LNG has been a major hurdle to ramping up supply this
far because China has refused to match market prices, the
63 International Energy Agency, "Oil Market Report," 13 February
2007. 64 Crude prices are forward-month WTI contacts as traded on the NY-
MEX. Domestic retail gasoline and diesel price data is from the National
Development and Reform Commission Price Monitoring Center. 65 Refers to the Fujian and Shanghai LNG receiving terminals. See
section 2 of this analysis for more detail.
price that the Shanghai LNG terminal reportedly will pay
for gas indicates that more affluent coastal provinces
might be ready to compete for contracts at market rates.
An alternative means of importing gas is by pipeline
from Russia or Central Asia. The possibility of doing so
has been on the agenda during most meetings between
Chinese leaders and their gas-rich neighbors. For Russia,
raising the prospect of China as an alternative gas market
is useful in negotiations with Europe. For Kazakhstan,
Turkmenistan, and Uzbekistan, China represents an al-
ternative to piping their gas through Russia. Yet while
economics on China’s more affluent coast are starting to
make LNG look attractive, prices in the country’s interior
make the cost of the pipelines currently under discussion
difficult to accept.
Coal Supply and Power Generation
Even for coal, China is looking to international markets
to meet domestic demand. With 13 percent of the world’s
proven reserves, China was the world’s second largest coal
exporter until 2003.66 Since then, China has nearly halved
the amount of coal it sells overseas as strong domestic
demand has outpaced production. In fact, in January
2007, China became a net coal importer as coastal prov-
inces turned to Indonesian and Australian coal, which is
comparable to domestic production in price once trans-
portation is included. Chinese coal companies are also
actively seeking to set up mining operations in Mongolia
and elsewhere to ship coal back home. The volatility of
China’s coal trade impacts global seaborne coal prices and
66 United Nations Commodity Trade Statistics Department, "UN Com-
trade Database," (2007).
Figure 29: China Oil Demand Growth Forecasts vs. Reality
30
makes it difficult for other coal-producing countries to
decide whether to make large investments to expand mine
capacity.67
When domestic production falls short or transporta-
tion bottlenecks emerge, China’s coal markets affect the
world via electricity shortages that roil fuel oil demand
and disrupt light manufacturing value chains (as discussed
above). But Chinese firms are also looking to import
mine-mouth power from Russia and Mongolia to alleviate
shortages in some Northern grids, creating a potential
power export opportunity for niche players.
China is also poised to become a major exporter of
coal-fired power technology. The IEA, in its recent World
Energy Outlook, estimates that the world will add
4,890GW of generation capacity over the next 25 years.68
Much of this will be in the developing world where cost is
an overarching concern. And Chinese equipment provid-
ers, who have large economies of scale domestically as the
result of the explosion in electricity demand, are situated
to offer pulverized coal-fired technology at a substantial
discount to cleaner technology from US, European, or
Japanese firms.69 Thus the market economics that have
made it difficult to improve the environmental profile of
power generation in China may make it difficult to do so
in the rest of the developing world.70
ENERGY SECURITY AND OVERSEAS INVESTMENT
The domestic price controls that create volatility in the
way Chinese oil companies buy crude from the interna-
tional market also create an incentive for them to invest
overseas. And a growing sense of energy insecurity at
home caused by supply shortages and price volatility cre-
ates political support for that impulse (see discussion in
previous section). What type of impact this investment
has on international energy security has been a topic of
great debate, particularly in the wake of CNOOC Ltd.’s
aborted bid to acquire California-based Unocal in 2005
and the growing international attention paid to CNPC’s
investment in Sudan.
67 We thank Scott Roberts of MIT for this point. 68 International Energy Agency, World Energy Outlook 2006 (Paris:
Organization for Economic Co-operation and Development). 69 "Chinese Power Equipment Makers Target Asia to Compensate for
Domestic Slowdown " Global Power Report, 22 February 2007. 70 We thank Peter Evans at Cambridge Energy Research Associates for
this point.
Much has been written on this topic already.71 Our
contribution, based on interviews with both Chinese and
foreign petroleum industry officials, addresses three eco-
nomic questions central to Chinese oil company activities
overseas: where they invest, how they invest, and where
they sell the oil. We do this through the lens of the do-
mestic economic and political foundation established
above.
Where They Invest
Table 7 shows the geographic distribution of upstream
investments by Chinese national oil companies (NOCs),
and which of these investments are currently producing
oil. Given economically comparable projects, China’s
firms make decisions about where to spend their money
based on three considerations: technical capabilities and
(to a lesser extent) the compatibility of the oil in the
ground with the refineries back home; the presence of
competition from IOCs; and an assessment of political
risk.
Crude oil comes in different types and must be
matched with appropriate refineries. China’s large domes-
tic oilfields, like Daqing and Shengli, produce a crude
that is relatively low in sulfur (sweet), and in Daqing’s
case relatively high in API gravity (light).72 The refinery
capacity built to support these fields is geared toward this
type of oil. This is one reason why China imports far less
Persian Gulf oil (which is high in sulfur) than its
neighbors in East Asia (figure 30). Instead, China buys
more of the lighter sweeter crudes that come from Asia
and West Africa. The same considerations shaping crude
oil buying influence the direct investment decisions of
China’s oil companies abroad, assuming they intend to
sell the oil to refineries back home.
For some of the first overseas investments by Chinese
firms, these were the primary considerations. Since then,
71 See especially WoodMackinzie, "The Impact of Asian NOCs on the
Upstream M & A Market," (2006), Peter C. Evans and Erica S.
Downs, "Untangling China's Quest for Oil through State-Backed Fi-
nancial Deals," in Policy Brief #154 (Washington: The Brookings Insti-
tution, 2006). Erica S. Downs, "The Chinese Energy Security Debate*,"
The China Quarterly 177 (2004).; Xiaojie Xu, "Chinese NOC's Over-
seas Strategies: Background, Comparison and Remarks," (James A.
Baker II Institute for Public Policy, Rice University, 2007), Kenneth
Lieberthal and Mikkal Herberg, "China’s Search for Energy Security:
Implications for U.S. Policy," NBR Analysis 17, no. 1 (2006).; and
Steven W. Lewis, "Chinese NOCs and World Energy Markets: CNPC,
Sinopec and CNOOC," in The Changing Role of National Oil Com-
panies in International Energy Markets (James A. Baker II Institute for
Public Policy, Rice University: 2007). 72 API stands for American Petroleum Institute.

31
China’s ability to refine its equity production at home has
become gradually less important (indeed most of it is not
shipped back home, as discussed below). Today, Chinese
oil companies are more constrained in their selection of
blocks on which to bid by their upstream technical ability
rather than their refinery stock. Chinese firms are quite
adept at exploration and development in geological for-
mations abroad similar to those found in China. Some of
these (such as complex faulted block reservoirs and certain
heavy oil deposits) are relatively challenging and thus pro
of these (such as complex faulted block reservoirs and
certain heavy oil deposits) are relatively challenging and
thus provide the Chinese majors with an advantage in
bidding projects.73
Table 7: Global Presence of Chinese Oil Companies (2006)
CNPC Sinopec CNOOC
AfricaCountries invested in 8 6 4 Producing oil in 3 2 0 Total equity production (tbpd) 180 9 0
Middle East Countries invested in 3 4 0 Producing oil in 3 1 0 Total equity production (tbpd) 30 1 0
Former Soviet Union
Countries invested in 3 3 0 Producing oil in 3 1 0 Total equity production (tbpd) 250 40 0
East and Southeast Asia
Countries invested in 4 2 4 Producing oil in 3 0 2 Total equity production (tbpd) 30 0 35
North and South America
Countries invested in 4 3 1 Producing oil in 4 2 0 Total equity production (tbpd) 70 40 0
Source: Author’s estimates based on conversations with oil company officials and market analysts. Excludes China.
Yet in other areas, such as deep offshore, Chinese
NOCs are at a significant disadvantage vis-à-vis the IOCs.
Much of the unexplored oil and gas acreage remaining
worldwide not already controlled by the NOC of an oil-
rich country is of a type for which Chinese companies are
less suited (and thus less competitive in head-to-head bids
73 We thank K. F. Yan at Cambridge Energy Research Associates for this
point.
with IOCs), Chinese firms often seek sites such as Sudan,
Iran, or Syria, where the IOCs are either prohibited from
investing or hesitant to do so out of fear of host-country
political risk or damaging negative publicity.
Chinese NOCs are less worried about public percep-
tions associated with such investments, though both
CNPC and Sinopec have chosen to keep their most sensi-
tive operations under the auspices of their parent group
companies, rather than their publicly traded subsidiaries.
And in terms of political risk, Chinese firms appear less
concerned than their Western IOC peers that a host
country will one day decide to nationalize their assets. In
part this is because Chinese firms are new to the game
and have yet to endure such an ordeal. They also face
lower investment hurdles overall (see below) and can thus
accept a higher risk premium. At the same time, there are
indications that some in China responsible for foreign
affairs are less agnostic about the damage to China’s new,
hard-won “soft power” that could come from a narrow
“you give us the oil, we give you the money” attitude that
is great for vested authoritarian elites but not necessarily
great for average citizens in developing nations desperate
for reform.
Chinese investment in countries that Western firms
avoid may create political, strategic, or human rights chal-
lenges, but it does not threaten international energy secu-
rity per se. This is an important distinction to make. In
fact, it could be argued that such investment actually en-
hances energy security by bringing oil to market that
would not have been developed otherwise.
How They Invest
Both business leaders and policymakers have raised con-
cerns about how Chinese oil companies make their in-
Figure 30: Oil Imports by Region of Origin (2006)

32
vestment once they have chosen where to place their bets.
Are they competing on a level playing field with the
IOCs? Where does their financing come from? What po-
litical support are they able to draw upon to secure a deal?
On the question of cost and source of financing, the
answer varies by company. Well-known is the case of
CNOOC’s attempted acquisition for Unocal in 2005,
where the smallest of the three Chinese oil majors was
able to secure $7 billion in cheap state financing as part of
its $18.5 billion bid (Evans and Downs 2006). Yet this
example is not representative of most overseas investments
by Chinese firms. In order to make an offer that was more
than half the entire market capitalization of the company,
and more than double its annual revenue, CNOOC had
proposed to borrow heavily from the state-owned banks.
This is certainly not the case for CNPC, whose 2006
profits alone totaled $24 billion.74 And as CNPC is not
required to pay dividends to the state, the only alternative
for investing that money is in mature and expensive do-
mestic production or in bank deposits that yield a nomi-
nal 3 percent. With less of an opportunity cost, CNPC is
able to accept a lower investment hurdle than a BP or a
Chevron, whose shareholders would rather take their
money and reinvest it elsewhere if the company can’t de-
liver double-digit returns.
With only $9 billion in profits in 2006 and a great
deal of downstream investment to be made, Sinopec lies
somewhere between CNOOC and CNPC in its ability to
bank-roll overseas deals out of its own pocket. And even
when these firms do have to take out a loan, there is no
shortage of banks eager to offer capital for oil exploration
and production, as it has been the most profitable sector
of the economy in recent years.75
More nebulous is the role that government-supplied
tied aid plays in helping Chinese firms secure deals in
developing countries. The most famous example is the $2
billion soft loan extended by China’s Export-Import Bank
to Angola for infrastructure projects in 2004, which in-
ternational observers claim prompted the Angolan gov-
ernment to award an oil concession to Sinopec at the In-
dian Oil and Natural Gas Commission’s expense (Evans
and Downs 2006). This “good-will gesture” was followed
up in the summer of 2006 with another $2 billion infra-
structure loan announced during Premier Wen Jiabao’s
visit to Angola as part of a seven-nation African tour.76 It
74 Winnie Lee, "CNPC Earned $23.85 Billion Profit in 2006, up
5.7%," Platts Oilgram News, 24 January 2007. 75 CEIC data from the China Statistical Yearbook. 76 Benoit Faucon, "China Makes Headway in Angola with Multiple
Trade Ties," Dow Jones International News, 30 November 2006,
is hard to quantify exactly how important these loans, and
the high-level political delegations that arrive to announce
them, are in the investment success of Chinese oil com-
panies now or in the future. Much has been written about
the attractiveness of Chinese capital that comes with no
governance strings attached for African leaders. But many
are discovering that some of the promised investment
never materializes and when it does comes with few jobs
for their citizens. The loans to Angola, for example, re-
quire 70 percent of the construction work to be done by
Chinese companies (which generally bring with them
their Chinese employees). In addition, a bilateral trade
agreement usually comes part and parcel with the finan-
cial assistance, thus opening poor African nations to Chi-
nese manufacturing exports.
Most of the largest IOCs have, of course, also bene-
fited from similar support at one point or another in the
past, and (perhaps ironically, given some griping) even in
some of the same countries Chinese firms are investing in
today. What is more important is that their home gov-
ernments (e.g., the United States) have made great efforts
to discipline and reduce these noncommercial interven-
tions. One reason is profit-oriented: When all buyers add
inducements beyond market rates in a negotiation, then
they are all worse off; stopping such self-defeating cost-
escalation requires that individual countries are restrained
from “beggaring their neighbors.”77 Another motive is
developmental: Overinflation of the natural resource ex-
port sector clearly can retard socioeconomic development,
creating both humanitarian problems and political risk
problems that can become flashpoints for conflict. Efforts
to prevent unhealthy investment competition on the buy
side are discussed in the policy conclusions section.
Where They Sell the Oil
Concerns about China’s overseas oil investments are fed
by the idea that China’s NOCs are locking up resources
through equity deals78 and thus taking oil off the market
and out of reach for other buyers. Underlying these con-
"China’s Exim Bank Grants Angola US $2bln Credit," China Knowl-
edge Press, 23 June 2006. 77 For an excellent discussion, see Peter C. Evans, "International Regula-
tion of Official Trade Finance: Competition and Collusion in Export
Credits and Foreign Aid" (Massachusetts Institute of Technology,
2005). 78 Equity deals refer to standard industry production sharing agreements
where the foreign oil company is given the right to sell a specified share
of the oil it produces. Nothing about the equity deals that Chinese firms
have signed is fundamentally different from those signed by their IOC
peers.

33
cerns are two assumptions: first that Chinese firms sell the
oil they extract overseas only to consumers at home, and
second that doing so somehow reduces the amount of oil
available to everyone else. Both are wrong.
CNPC, China’s largest upstream oil company, pro-
duced 2.7 million barrels of oil per day during 2006. Of
this only 564,000 barrels per day (21 percent) was pro-
duced abroad.79 Nearly half of this equity output was
from Kazakhstan, following CNPC’s acquisition of the
Canadian company PetroKazakhstan in 2005. Sinopec
registered less than 90,000 bpd of international oil pro-
duction in 2006, mostly in Russia and Latin America and
CNOOC less than 35,000 bpd, almost exclusively in
Indonesia.80 All told, overseas equity production by Chi-
nese firms totaled roughly 675,000 bpd in 2006. If all of
this oil returned to China, it would have only satisfied 19
percent of total imports last year.
Yet according to our calculations based on customs
data, industry intelligence, and news reports, these com-
panies did not ship most of their overseas-pumped oil
home, but instead sold it on the open market to the high-
est bidder. The newly constructed oil pipeline from Ka-
zakhstan to China brought in only 50,000 bpd of the
260,000 CNPC produced. None of the production in
Canada, Syria, Venezuela,81 and Azerbaijan showed up on
China’s shores, and only a fraction of the production
from Ecuador, Algeria, and Colombia did. The percent-
age of oil CNPC produced in Sudan in 2006 that was
sent back to China declined, as did the total amount in
volume terms. As shown in figure 31, CNPC chose to sell
more of it to Japan, probably because the offered price
was higher. And despite CNOOC’s strong presence there,
Chinese imports from Indonesia fell by 48 percent.
This is a critical point. No one is concerned that
when Shell signs an equity agreement somewhere in the
world that the Netherlands is taking oil off the market
and making everyone else less energy secure. That’s be-
cause we assume that Shell will sell its production to who-
ever is willing to pay the highest price. To date, Chinese
oil companies appear to be doing the same and thus pri-
oritizing profits over political considerations. And even if
79 Winnie Lee, "CNPC Earned $23.85 Billion Profit in 2006, up
5.7%." 80 Lin Mo, "2006 Is a Reform Year for Sinopec," Xinhua China Oil, Gas
& Petrochemicals, 25 January 2007. Lin Mo, "CNOOC: 2006's Ordi-
nary Performance, but with Eye-Catching Prospects " Xinhua China
Oil, Gas & Petrochemicals, 19 March 2007. Also derived from conver-
sations with WoodMackinzie and PFC Energy. 81 Though customs statistics show crude imports from Venezuela of
84,000 bpd in 2006, industry sources confirm that due to a total lack of
appropriate refining capacity, all of this oil was traded out in favor of
more suitable crudes.
every barrel were shipped back home, that would mean
less China needed to buy from Saudi Aramco or Kuwait
Oil, and thus more available for the United States to pur-
chase. Back in Beijing, some people are beginning to real-
ize this and doubt whether equity production by China’s
NOCs, as small as it is, does anything to increase the
country’s energy security. If not, why endure the damage
to China’s image created by investment in Sudan if all it
does is line the coffers of the oil companies and raise the
average price of oil? (Downs 2006).
THE ENVIRONMENT
The inability of China’s energy policy to address the envi-
ronmental affects of its energy markets has caused a dra-
matic deterioration in the quality of the country’s air and
water. Some of this pollution stays inside China’s borders
and some doesn’t. The impact of the share that doesn’t is
growing rapidly, and addressing it has become a critical
component of any regional and global environmental
initiatives. Consensus has gelled that energy policy cannot
leave aside these environmental impacts to the extent it
did so in the past.
Regional
For China’s neighbors, the problem is visible, whether
blowing in the wind or floating down the river. China is
easily the region’s and the world’s largest source of SO2
emissions, primarily from burning coal for power genera-
tion. This sulfur, along with particulate matter emitted
from the same plants, blows across China’s borders to
other East Asian countries where it causes many of the
same problems as inside China: acid rain, reduced visibil-
Figure 31: Sudan’s Oil Exports by Destination

34
ity, and respiratory problems. It’s a growing source of
political tension with Korea and Japan, which endured
their own environmental crises and are not eager to relive
them. In Hong Kong, which claims 80 percent of the SO2
in its air comes from neighboring Guangdong province,
officials worry about loosing financial center competitive-
ness as service firms and the expatriates they employ seek
greener pastures.
Sulfur from Chinese power plants travels as far as the
West Coast of the United States and Canada. In Califor-
nia, Oregon, and Washington, Chinese sulfur has reached
between 10 and 15 percent of EPA’s allowable levels in
the mountains, enough to be concerned about but not
enough to cause acid rain yet.82 And those same power
plants are the world’s leading source of androgenic emis-
sions of mercury, which shows up in the fish sold at US
restaurants and grocery stores.
China’s potential impact on transnational waterways,
as well as air quality, was brought home when a CNPC
petrochemical plant exploded in the north of the country
in November 2005, sending a 100-ton benzene slick
down the Songhua river through populated areas of
China and into Russia. Neither CNPC nor the govern-
ment acknowledged the accident until 10 days after the
spill had occurred, giving the Russians little time to pre-
pare for its impact. And in the south, ambitious hydro-
power development plans, which have already resulted in
the dislocation of 23 million people inside China,
threaten to change the lives of millions more who live
downstream on the Nu (Salween) and Lancong (Mekong)
rivers in Vietnam, Laos, Thailand, Cambodia, and
Burma, not to mention further impact on the Yangtze in
China.83
Global
The most global environmental impact of China’s energy
use, and possibly the most significant in absolute terms,
comes from carbon dioxide (CO2). Currently number
two, China will surpass the United States as the world’s
largest CO2 emitter (figure 32) by the end of 2007.84 But
in China, as opposed to the United States, the problem
82 Keith Bradsher and David Barboza, “Pollution from Chinese Coal
Cast a Global Shadow,” New York Times, June 11, 2006. 83 "Full Text: Report on the Work of the Government," Xinhua's China
Economic Information Service, 17 March 2007. See also Andrew C.
Mertha, "Water Warriors: Political Pluralization in China’s Hydropower
Policy," (Washington University in St. Louis, 2007). and Milton Os-
borne, River at Risk: The Mekong and the Water Politics of China and
Southeast Asia (Lowy Institute for International Policy, 2004). 84 US Carbon Dioxide Information Analysis Center, 2007.
comes almost entirely from industry. Only 6 percent of
carbon emissions come from automobiles, compared with
over 30 percent in the United States. Eighty-two percent
of the carbon emitted comes from coal (compared with
37 percent in the United States), half of which is burned
in power plants and half of which is burned by in cement
kilns, steel mills, and other industrial applications.
Between now and 2030, the IEA predicts that China
will account for 40 percent of the growth in global annual
CO2 emissions, and yet in 2030 China’s per capita emis-
sions will still be less than Europe’s and Japan’s and only a
third as much as those of the United States (figure 33). As
such, convincing China to agree to the same type of man-
datory limits that the rich countries are bound to under
the Kyoto Protocol will be extremely challenging.
Figure 33: Current and Projected Per Capita CO2 Emissions (metric tons)
Figure 32: Projected Annual CO2 Emissions (million metric tons)

35
GOODS TRADE AND INDUSTRIAL COMPETITIVENESS
Energy is a cost of production. The amount of energy
that goes into manufacturing and delivering a good to
market varies greatly from a little (most light manufactur-
ing, such as apparel) to a lot (aluminum). Transportation
can represent a significant share of this cost, as inputs now
move halfway across the world to be transformed and
then are shipped all the way back for final consumption.
The abnormalities in costs and capital flows that have
promoted energy intensive industry in China have altered
the global distribution of production in these sectors. In
some cases this means that foreign producers or even for-
eign plants have migrated to China.85 In most cases, it
means import substitution that ramps up so quickly and
with so little mind for new capacity in the province next
door that it spills over into the export market. In either
case, it means displacement for production elsewhere even
when the non-Chinese operation is far more energy effi-
cient.
Current Migration
China’s share of global output in energy intensive manu-
facturing has soared in recent years. In 1996, the United
States and China each accounted for 13 percent of global
crude steel production. Ten years later China’s share has
grown to 35 percent while the US share has shrunk to 8
percent (figure 34). In absolute terms, Chinese produc-
tion has grown four-fold while US production has stayed
flat. Similar trends have occurred in aluminum (figure
35), glass, and chemicals. The bulk of this new output is
to service domestic demand, but a significant and growing
share spills into export markets, affecting producers
abroad (figure 36).
In 1994, China imported 21 percent of the steel
products it consumed. In 2006, China not only met its
own steel needs, but ran a trade surplus of 24 million
tons. In aluminum the turnaround has been even more
dramatic. Relying on foreign providers for more than 25
percent of aluminum demand as recently as 2000, China
now exports more than twice as much as it imports. In
dollar terms, the metals trade deficit had averaged $7 bil-
lion per year between 2000 and 2003; in 2004–06 it
amounted to $1 billion, $8 billion, and $34 billion of
85 See the steel plant anecdote in James Kynge’s excellent China Shakes
the World, chronicling the movement of an entire Ruhr Valley steel
plant to Shanghai.
surplus respectively—accounting for 30 percent of the
change in China’s goods trade balance those years.86
The other energy intensive sector that “migrated”
production to China in this way is chemicals. On the
whole, China still runs a trade deficit in chemicals, but
rapid import substitution is closing the gap. Between
2002 and 2006, exports grew by 48 percent per year while
imports grew by 31 percent. And in certain chemicals,
such as ethylene and many of its downstreams, China
now runs a trade surplus. Most of the new chemicals ca-
pacity currently planned will either be built in China or
the Middle East (KPMG 2006).
86 CEIC data from China Customs Statistics, General Customs Admini-
stration.
Figure 35: Share of Global Primary Aluminum Production
Figure 34: Share of Global Crude Steel Production

36
Future Shock
We are concerned that the migration of global capacity to
China could swing back the other way, bringing the same
volatility characteristic of China’s energy sector to global
energy-intensive product markets. Because China’s finan-
cial and energy systems have encouraged such a build-out
of heavy industry, we now depend on the continued sta-
ble functioning of that market to maintain supply
through myriad global value chains. China’s political risk
is not negligible, and will get more pronounced as the
energy system is strained further. Even without outright
system failure, systemic volatility is raising the transac-
tions costs for industrial goods.
Another scenario for supply shock occurs if abnormal
costs are successfully addressed by Beijing, changing basic
factor costs contributing to industrial investment as de-
scribed at the beginning of this report. In fact, reform in
the cost and distribution of land rights is already afoot,
the inefficient allocation of capital is a topic of intense
discussion, and industry may be required to foot the bill
for its environmental impact sooner than expected to
avert a catastrophe already brewing in poisoned rivers,
lakes, air, and soil. Rising costs for these factors cannot be
offset by cost-cutting on raw materials (terms of trade for
which will likely go up, not down), labor (already rising
on a steep slope), technology (which has been unnaturally
“cheap” in the sense that intellectual property rights of
others were not enforced, creating an effective subsidy
that is coming to an end), or energy itself.87
Such a radical structural shock to China’s economy is
not happening today, and is not looming in the next year.
87 There are too many dynamic variables to map out seriously in this
policy analysis, such as the inflationary results of this scenario; this dis-
cussion is notional.
It is likely however, and liable to commence in the me-
dium term rather than the long term. And with China
accounting for between one-quarter and one-half of
global production in so many energy-intensive goods,
even a change at the margin will have a significant impact
on global markets for these products.
It is clear to us that the international impacts of
China’s energy policy choices are considerable that they
demand a rigorous multilateral policy response coopera-
tive to the maximum extent possible, but the template for
such cooperation is not evident. In the next section we
turn to the policy recommendations.
Figure 36: Net Exports as a Share of Total Chinese Production

37
4 Conclusion and Policy Recommendations
We draw four principal conclusions from our study of China’s energy situation.
1. The main energy challenge for China today is the shifting industrial structure of its economy, not factory ineffi-
ciency, new air-conditioners or more automobiles. These issues are systemic in nature and thus only China can
effectively correct them.
2. Given conflicting pressures on the country’s leaders, we do not expect China to adequately fix the root causes of
its structural over-allocation into energy-intensive industry in the next decade, unless something changes. By
coordinating the energy and environment imperative with existing calls to rebalance external and macroeco-
nomic distortions, it may be possible to break through these conflicts sooner than would otherwise occur.
3. Structural adjustment is necessary but not sufficient to address China's energy issues. The international com-
munity can and should take steps with Beijing today to mitigate important negative impacts of China’s energy
footprint on global energy security and climate change.
4. Regardless of how successful Beijing or others are in altering the country’s energy trajectory, in 20 years China
will likely be the world’s largest energy consumer and polluter. Energy regimes built when the OECD was the
only game in town must be expanded to reflect the fact that non-OECD economies will consume most of the
world’s energy in the decades ahead. If the global institutions charged with brokering international energy and
environmental solutions are to be effective, or even relevant, they will need to adjust to this reality.
A point of context should be kept in mind when contemplating these recommendations: China is an 800-pound
gorilla on the world energy stage that cannot be ignored; but there is a 1,600-pound gorilla in this room too—the
United States. Instead of treating that fact defensively, US policymakers might see it as an opportunity. The changes
needed on China’s behalf seem impossibly ambitious as unilateral adjustments, especially since China feels entitled to
follow an industrial path that many OECD nations have trod. Even if progressive Chinese leaders recognize a self-
enlightened interest in unilateral reform, there exists a natural tendency to focus more on a rival getting off easier than
they should than one’s own best interest. The necessity for the United States to improve the sustainability of its own
energy profile may be by far the most powerful lever it has for impelling change elsewhere: The opportunity for a grand
bargain in energy and environment exists to give policymakers in both China and the United States political cover for
painful choices.
ASSESSING THE DOMESTIC RESPONSE
China’s energy challenges are not lost on the country’s
leaders, who are acutely aware of the welfare loss they
create (see box 1). In fact, Beijing has lofty ambitions to
reduce the energy intensity of growth in the years ahead.
As part of the current 11th Five-Year Plan (FYP) the gov-
ernment has set a target of reducing energy intensity by
20 percent and air pollution by 10 percent by 2010.
Each province has been asked to do its part to help
the country meet this goal, and Beijing has warned that
failure to do so will affect the career prospects of provin-
cial officials, regardless of how they score on other metrics
(like GDP growth and foreign investment).88 To improve
the odds of success, NDRC, understanding that industrial
energy use is at the core of the problem, compiled a list of
the 1,008 top energy-consuming firms collectively ac-
counting for one-third of total energy demand and in-
structed them to develop efficiency plans in cooperation
with local officials.89
Many foreign governments and nongovernmental
organizations (NGOs) are helping China improve indus-
trial energy efficiency. The US Department of Energy co-
88 Mure Dickie and Richard McGregor, "Jiangsu Sets the Pace on How
to Assess Officials," The Financial Times, 15 March 2007. 89 "China Enterprise Energy Conservation & Efficiency Forum 2006,"
Xinhua China Oil, Gas & Petrochemicals, 13 October 2006. and con-
versations with EF China. Local governments have signed or are devel-
oping similar plans with an additional 100,000 smaller firms.

38
chairs an Energy Efficiency Steering Committee with
NDRC that focuses on reducing the amount of power
used in electric motor systems (which account for half of
all electricity demand).90 The government-funded Law-
rence Berkeley National Laboratory (LBL) has worked
with Chinese partners for over a decade to promote en-
ergy efficiency.91 NGOs including the California-based
Energy Foundation and the New York–based Natural
Resources Defense Council (NRDC) have successful in-
dustrial energy efficiency programs ongoing in China as
well.92 European and Japanese organizations have also
done extensive work.
Heavy industry in China is still, on average, 20 to 40
percent more energy intensive than it is in the OECD,
which means that the potential for significant gains exists
(Wan 2006). And in fact, the efficiency of the country’s
heavy industry has steadily improved over the past five
years and is likely to continue on this path for the next
five. This is an important achievement, as the industrial
stock getting built now will exist for decades to come. But
even in the best scenario, improving the efficiency with
which heavy industry consumes energy will not be
enough for Beijing to reach its 20 percent target, as shown
in figure 37.
90 US Department of Energy, Fact Sheet: U.S. Department of Energy
Cooperation with the People’s Republic of China. www.pi.energy.gov
(accessed March 13, 2007). 91 More on LBL’s work in China can be found at http://china.lbl.gov. 92 More on the Energy Foundation and NRDC’s China work can be
found at www.efchina.org and www.nrdc.org/air/energy/china, respec-
tively.
In his annual address to the National People’s Con-
gress in March 2007, Premier Wen Jiabao acknowledged
that China had failed to meet its energy intensity goals for
the first year of the 11th FYP.93 For it to still make the
target, Chinese energy demand growth would have to
slow from the 13 percent per year average between 2002
and 2006 to 3 percent per year between 2007 and 2010.
Based on calculations done by LBL in the summer of
2006, even the most herculean energy efficiency measure,
absent some structural change, will only get the country
85 percent of the way there.
Even if China is somehow able to reach its 20 per-
cent target, it would still surpass Europe in overall energy
consumption by 2010, and many of the challenges associ-
ated with the country’s energy footprint would persist.
After all, energy intensity is just a ratio of the amount of
energy used per unit of economic output in dollar (or
93 "Full Text: Report on the Work of the Government."
Figure 37: China’s Ability to Change Course (energy demand in mtoe)
Box 1: Who Pays the Tab? Welfare Loss in China*
Land: Land is regularly taken from farmers at low compensation to make way for industry, hydropower and other projects.
Public Health: Seventy percent of energy demand comes from industry and two thirds of that demand is met with coal. Coal burning emissions from boilers and power generation cause acid rain, respiratory problems, premature mortality and decreased visibility.
Employment: Light industry was China’s employment engine during most of the reform period. A shift toward heavy industry means fewer new jobs. In 2007 Chinese officials expect there to be 24 million job seekers but predict the economy will only add 9 million new positions.**
Saving Rates: About $370 billion a year in short term loans goes to the industrial sector (probably an equivalent or greater amount of medium and long-term lending, though “industrial sector” is not broken out in those figures). This bank lending, despite obvious overcapacity, is only possible because China’s households save $2 trillion at banks at interest rates barely if at all greater than inflation. The foregone capital gain, and risk borne by house-holds, is enormous.
Energy Security: Volatile energy demand causes blackouts that affect households as well as businesses, and diesel and gasoline shortages for both farmers and car owners. _______ * A rigorous econometric measure of welfare as a function of the indus-trial system is obviously beyond the scope of this brief; this discussion is notional only.
** Tom Miller, “Booming Economy Creates 12m Urban Jobs.” South ‘China Morning Post, March 13, 2007.

39
renminbi) terms. Given a constant structural mix, energy
intensity declines naturally with economic growth even
while absolute energy consumption continues to increase
(see box 2). Between 2001 and 2005 energy intensity
declined by 9 percent in India (and 8 percent in the
United States) without a specific government mandate,
while it increased by 7 percent in China despite a gov-
ernment mandate.94
Beyond Energy Efficiency
Addressing the demand volatility, supply shortages, in-
vestment practices, and environmental deterioration of
recent years means correcting some of the distortions that
foster heavy industry in the first place. This means mov-
ing away from the administrative approvals and price
controls that stand in for energy policy in favor of a better
regulatory toolkit and market signals (discussed in greater
depth earlier in this report). In short
a) improving the efficiency of capital allocation in a way
that reflects full costs and removes the ingrained bias
toward heavy industry lending;
b) continuing reform of energy prices in conjunction
with improved data collection and price transpar-
ency; and
c) incorporating environmental costs in a way that in-
centivizes cleaner behavior, rather than relying on
administrative controls alone.
Efforts to improve the capital system, energy pricing
and environmental enforcement have certainly been made
in recent years, but with mixed results. Beijing is begin-
ning to raise electricity prices for more energy-intensive
industries and is tuning the tariff and tax codes to reduce
incentives to export energy-intensive products. And
SEPA, China’s environmental watchdog, is gradually ex-
erting more influence on the policymaking process. Most
encouraging is the progress made in using economic in-
centives to reduce SO2 emissions (as discussed in a previ-
ous section). While absolute SO2 emissions increased in
2006, the majority of new power plants built had sulfur
scrubbers installed. Environmental Defense’s Beijing of-
fice has done impressive work in this area and is engaging
with provincial officials for experiments in sulfur trading.
But on the whole, progress is slow. The same vested
interests responsible for the current economic trajectory
94 Calculated from the BP (2006) and Economist Intelligence Unit
(EIU) GDP figures.
frustrate efforts to change course. State-owned heavy in-
dustry and its provincial allies oppose policies that reduce
their competitiveness vis-à-vis neighboring provinces or
countries, even when those policies would create welfare
gains for China as a whole.95 This means that SOE gov-
ernance reforms and reform of government and party
promotion criteria may have to come first before and sig-
nificant change is seen.
Beijing often resorts to second-best solutions that
may exacerbate energy problems. When successful, central
attempts to constrain industrial capacity through approv-
als can provide rents to the firms already in place. Caps
on new lending to energy-intensive industries risk block-
ing investment that would improve the energy efficiency
of the existing stock. Even the energy intensity programs
within the 11th FYP may incentivize an expansion of
steel, aluminum and cement production in the years
ahead (box 2). So, should Beijing be blocking new capac-
ity or not? The answer is that if it hopes to significantly
alter the country’s energy future Beijing must deal with
the sources of boom and bust driving so much of the pre-
sent misallocation and scarcity rents (nontransparent
macro and accounting data, nonmarket set capital costs,
state-guided lending, and the like) and stop trying to steer
an airplane by adding a little weight to one wing or the
other once it is already in the air.
95 NDRC’s efforts to raise electricity prices for energy-intensive users
face serious compliance problems. See "China Tells Provinces to up
Guzzlers' Power Tariffs," Reuters News, 16 April 2007.
Box 2: Energy Intensity Demystified
Energy intensity is simply the measure of how much energy is consumed in a country (or industry) for each dollar of economic output. As such, it can either be reduced by cutting the amount of energy consumed or raising the value of the output. The easiest way to achieve the former is by raising the cost of energy (or the associated environmental externalities), and thus provide firms with an incentive to consume less. Yet as doing so would reduce the competitiveness of existing state-owned heavy industry firms, efforts by Beijing on this front are often frustrated by provincial opposition.
A more politically expedient way to improve energy intensity, and the one Beijing has chosen to embrace, is to raise the value (and thus the price tag) of the industrial goods that energy is being used to create. By assigning energy intensity targets to each province (who in turn delegate them to local energy-hungry enterprises) without addressing the cost of power, land, capital or environmental compliance, the cheapest way for industry to reach their goals is to extend their cost advantage into higher value steel, aluminum, glass or chemical products, thus raising total revenue faster than energy consumption.

40
As the income and influence of Chinese households
grows, the pressure on local officials to deal with pollu-
tion, low portfolio savings returns to households, and
higher-income job creation will grow as well. But progress
on these fronts is likely to be measured in decades, and
pressure in foreign capitals to address issues of energy
security, climate change and the China’s global trade sur-
plus is growing by the day. Fortunately, some of the steps
the international community can take in response to
China’s emergence may help Beijing alter the country’s
energy trajectory.
PRIORITIZING THE INTERNATIONAL POLICY RESPONSE
In the United States and around the world unease over
energy security and the environment add to existing anxi-
ety about China’s rise (see box 3). In Washington, con-
cern over these issues has reached a high point with the
stymied Chinese bid for Unocal, Chinese oil investment
in Sudan, Iran, and Venezuela, and China’s contribution
to climate change all making headlines and spawning
congressional hearings. Opinions are being shaped and
legislation crafted regarding how the United States should
respond to China’s energy footprint and what the future
looks like for the world’s two largest energy consumers
and environmental polluters. Our hope with this policy
analysis is to clarify the issues on the table and help avert
policy responses that are either unhelpfully combative or
substantively ineffective.
We divide our discussion into three of the topics
foremost on policymakers’ minds and in which China
plays a large role: energy security, industrial competitive-
ness, and climate change. As we said at the outset, this is a
report about China for the United States, and thus our
recommendations will largely concern what the United
States should (and should not) do regarding a growing,
more energy-hungry China. Yet US success or failure in
dealing with the implications of China’s energy use hinges
on US ability to deal with its own. The issues facing the
two countries are far too large to be addressed in isolation.
And China’s inability to significantly alter its medium-
term energy footprint should not be used as an excuse for
inaction in addressing the world’s long-term energy fu-
ture.
ENERGY SECURITY
Definitions of energy security vary widely. For the pur-
poses of our discussion, we will define it simply as the
ability to secure adequate and consistent supplies of en-
ergy to fuel an economy at a price that doesn’t bring it to
its knees. We cover here both the ways in which China
does and does not affect global energy security (box 4).
Overseas Investment
As stated in the previous section, concerns about the over-
seas activities of China’s energy firms fall into three cate-
gories: Such firms harm the energy security of others by
taking oil off markets; they harm the economic interests
of IOCs by competing unfairly; and they hurt strategic
interests by disrupting existing political and economic
dynamics.
The first contention we reject out of hand. Despite
all the rhetoric about Chinese oil companies locking up
resources through equity agreements, total international
production by Chinese firms accounts for less than 2 per-
cent of the global oil trade.96 It will be nearly impossible
for these companies to satisfy China’s import needs, let
alone gain a big enough position in the market to
threaten US oil security. As China is now the world’s
second-largest oil consumer, we should expect the profile
of Chinese oil companies on the international stage to
increase. And we should welcome and encourage the
emergence of Chinese firms that abide by international
norms for competition and investment.
96 BP plc., Statistical Review of World Energy 2006. and authors’ esti-
mates.
Box 3: Beggaring the Neighbors, Welfare Loss Abroad
Energy Markets: The shortages created by investment cycles and price controls within China pass through to international mar-kets in the form of price volatility.
Overseas Investment: The close relationship between the gov-ernment and the energy companies that shapes policy inside the country raise issues of unfair and potentially destabilizing invest-ment competition when these firms venture abroad.
Environment: Surging energy consumption in a system that does not price in externalities creates environmental challenges outside China’s borders: emissions of sulfur dioxide and particulate matter regionally and carbon dioxide globally; as well as pressure to “race to the bottom” in terms of process and production methods (PPMs).
Product Markets: China’s economic conditions shocked global markets by rapidly attracting heavy and light industry. Righting the distortions in this economy could cause an equally large shock if industry must once again relocate in the face of urgent Chinese reforms.

41
The second point warrants more concern, that Chi-
nese oil companies operate in a way OECD countries
have spent decades working to prohibit. This is less an
energy security concern per se than an industry competi-
tiveness concern, but we address it here. State-related
bank lending subsidies and government transfers at home
lower the commercial criteria that China’s NOCs must
apply in operating overseas. Preferential market structure
conditions (monopoly, oligopoly, or oligopsony) benefit
national energy firms. Forgiveness of financial liabilities to
government, such as taxes, fees, royalties, or dividends (in
the case of state ownership of shareholding enterprises—a
major consideration for the NOCs) apply in the energy
sector, as in others.
While many of these circumstances certainly exist
and accrue to the financial benefit of firms in the energy
sector in China, none are unique to the energy sector, or
unique to China. Others are suspected to take place but
have proven difficult to demonstrate to the standard likely
to prove actionable under the limited international agree-
ments governing subsidies. The WTO Agreement on
Subsidies and Countervailing Measures (ASCM) is the
principle discipline on subsidies in general, and applies to
China’s energy companies (state owned and otherwise).
Flatly prohibited subsidies are limited to those with cer-
tain trade effects: export subsidies and import substitution
subsidies. These do not appear relevant to support
China’s energy companies, as generally they are not ex-
porting.97 Actionable domestic subsidies are those that,
while not aimed at trade results directly, could distort
trade by indirectly altering the economic viability of firms
that then engage in trade. Nonactionable domestic subsi-
dies are also noted as a classification in the ASCM. More-
over, even if a WTO party felt ready to bring a domestic
subsidies case, the regime cannot be used to confront the
overseas investment behavior of China’s NOCs, which is
where their behavior is most challenging to IOCs.
The instances of subsidized lending and alleged tied
aid that have helped Chinese firms invest abroad are not
covered by the WTO. A specialized agreement overseen
by the OECD known as the Export Credit Arrangement
disciplines the subsidization of overseas credits to spur
exports, including the tying of aid to export goals. But if
China subsidizes an NOC’s purchase of an oil block in a
developing country, it is not exporting so much as fueling
its imports. Further, China is not a member of the
OECD and has not expressed an interest in joining this
97 We say generally because there is a limited export of thermal and
coking coal, and limited export by wire of (mostly hydro) electricity in
the southwest.
agreement that we are aware of. In sum, there really is no
regime to discipline aggressive deal-making in energy, let
alone a regime that China has made commitments to join
or comply with. Though not very satisfying in the short
term, the best option appears to be the one that the
United States is already taking: to educate Beijing on the
long-term merits of closing ranks to discipline overseas
investment supports, and get them to join expanded ar-
rangements voluntarily, for their own good. The invita-
tion has been made, but high-level efforts have been con-
centrated on Beijing’s currency policies rather than get-
ting China to join the OECD investment commitments;
these priorities may need to be reconsidered.
While the implications of China’s overseas energy
investment on security and human rights concerns are
largely outside the scope of this paper, we would offer the
following to the discussion. First, there are indications
that some in Beijing are critical of a blank check for
China’s resource-extracting firms overseas, particularly if
they are unlikely to provide real energy security. Their
case is strengthened as China’s “soft power” continues to
be diminished by lending political support and Security
Council cover to the business activities of CNPC and
Sinopec’s business activities in Sudan. 98 This view is
98 Recent kidnappings of Chinese nationals working on projects in
Africa also bring this point home. See, for example, "Foreign Ministry
Spokesman Liu Jianchao's Regular Press Conference on March 20, 2007
" Ministry of Foreign Affairs of the People's Republic of China
http://www.fmprc.gov.cn/eng/xwfw/s2510/t305261.htm..
Box 4: Energy Security
Overseas Investment encourage China to join the OECD’s Export Credit Arrange-ment
welcome Chinese oil companies that behave in accordance with those agreements into international markets
stress to Chinese officials the cost in “soft-power” of invest-ments in places like Sudan.
Global Energy Markets encourage Chinese companies to release inventory data
cooperate with China on respective SPR fill schedules
Technical Cooperation “green buildings” and energy conscious urban planning
expand R&D in hydrogen vehicles and begin it in cellulosic ethanol
power-sector reform in urban markets
International Institutions either expand the IEA to include China (and other large de-veloping countries) or create something else in its place.

42
aligned with calls for China to be a “responsible stake-
holder” and should be encouraged.
Second, China’s firms invest in places where IOCs
fear to tread, not only because of the lack of competition,
but also due to the absence of alternatives. The acreage
available to IOCs in safe, developed areas is shrinking. To
grow an upstream business there are only two options:
explore somewhere more risky or expand through mergers
and acquisitions. Following CNOOC’s aborted bid to
acquire Unocal, China’s firms see heavier risk in bidding
for US and European energy firms than in drilling for oil
in Sudan or Iran. In order to coordinate efforts to impose
regime pressure on states of concern, the United States
and the European Union will need to temper their eager-
ness to intervene politically to block foreign investments
at home. Reform of the US Committee on Foreign In-
vestment in the United States (CFIUS) process now be-
fore Congress does not appear designed to achieve that.
Global Energy Markets
While China’s overseas investments do not pose a risk to
global energy security, the nature of China’s demand cre-
ates a great deal of uncertainty in energy markets, particu-
larly for oil. In the near term there is little the United
States or the international community can do to reduce
China’s demand volatility: It is caused by the country’s
cyclical investment torrent. There are, however, steps
China could take right now that would greatly reduce the
extent to which this volatility affects international prices.
The first would be requiring CNPC, Sinopec, and
CNOOC to publish their corporate inventory data,
which is common practice in IEA member-countries.
Being able to track inventory changes month-to-month
would help international markets forecast how much oil
China will need in the future, thus avoiding spikes in
crude prices associated with upside surprises in Chinese
demand. China is already cooperating with the IEA and
providing some data to the Joint Oil Data Initiative,
though not about corporate inventory levels.99
The second would be to make public the schedule for
filling China’s strategic petroleum reserve (SPR), cur-
rently under construction. Fill rates so far have been ex-
tremely modest and should have no impact on prices.100
Yet the opacity surrounding the SPR fuels market specu-
lation and creates price fluctuations based on rumor
99 For more information, see www.jodidata.org. 100 In 2006, we estimate that between 50,000 and 60,000 bpd was
added to China’s SPR, less than 1 percent of China’s total oil demand
that year.
alone. While it is not common practice to publish SPR fill
schedules (even among the OECD) doing so would bene-
fit China as it would reduce price volatility in the crudes
on which China relies. Washington should join Beijing in
this effort, as a confidence-building measure, regarding
the expansion of the US SPR proposed by President Bush
in his 2007 State of the Union address. Such cooperation
could be facilitated by the IEA, which is currently work-
ing with China on the construction of its SPR tanks.
Finally, China relies on the spot market for the vast
majority of the crude oil it imports, and stands to gain by
improving transparency in its oil purchasing and remov-
ing some uncertainty from the markets. This is also im-
portant for the United States and should be stressed as
such in bilateral meetings with China.
Technical Cooperation
Outside of near-term oil market cooperation, there is a
significant amount of bilateral technical cooperation that
would help both China and the United States improve
their long-term energy outlooks. Several successful pro-
grams already exist in industrial energy efficiency. And
while industrial demand is certainty China’s present en-
ergy challenge, looking forward the international com-
munity will likely get more bang for its buck by focusing
on the consumption-led future. Foreign cooperation will
have little impact on the systemic causes of China’s struc-
tural shift between industries; within industries incentives
to improve energy efficiency already exist and the tech-
nology is largely available on a commercial basis.
Yet the steel mills, cement kilns, and glass factories
that are driving current demand are feeding an infrastruc-
ture boom that is quickly locking in China’s energy and
environmental future. Steps taken to improve the energy
impact of what’s being built now will pay off in spades
down the road. International cooperation can play an
important role in this area, particularly in the following:
a) BBuildings: While the concept of “green buildings” is
starting to take off in China, there is a great deal of
work to do in improving building code and bringing
energy consciousness into urban planning.
b) TTransportation: Though the United States has little
influence over the way China builds its transporta-
tion system, the two countries share an interest in re-
ducing the energy profile of their vehicle fleets. Co-
operation currently exists between the two countries
in hydrogen R&D and should be extended to cellu-
losic ethanol (Huang et al. 2007). Both the United

43
States and China have aggressively pursued ethanol as
a petroleum substitute and both now face rising food
prices as a result.
c) UUrban Power Markets: Electricity reform is a criti-
cal issue for China’s energy future. While at its core
it is a political process that the outside world will
have little ability to shape, there exist opportunities
for international cooperation in urban power mar-
kets, where a desire for cleaner and more reliable en-
ergy is driving experiments with time-of-use pricing
and green dispatch.
All of these areas of technical cooperation may well
be most successful if undertaken on a city-to-city or state-
to-province basis. Several examples of this already exist.101
The energy priorities of the more affluent coastal prov-
inces, where much of this consumption-led demand is
taking place, are not necessarily the same as the country as
a whole.102 And at the end of the day it is the city or prov-
ince that is going to have a greater role in determining the
success or failure of any program.
International Institutions
Regardless of how successful the collaborative efforts are
in improving the country’s energy outlook, China will be
a major player in the world’s energy future. Under its
current reference scenario based on conservative growth
projections the IEA sees China as the world’s largest en-
ergy consumer in 2030, accounting for 20 percent of
global demand (figure 38). Even if China takes fairly ag-
gressive steps to conserve energy, it will likely still con-
sume more energy than Europe and Japan combined. A
growing share of this energy will come in the form of oil,
and China is likely to account for more than one-quarter
of the additional global oil demand over the next 25
years. And as domestic production is flattening out, each
marginal barrel will have to come from overseas.
Yet at existing multilateral institutions set up to ad-
dress energy, China is missing from the table. The IEA
only counts OECD countries as members, though some
non-OECD countries, including China, hold observer
101 See specifically Environmental Defense’s SO2 programs and NRDC’s
energy efficiency work in Jiangsu Province at
www.nrdc.org/air/energy/china. 102 For an excellent discussion on energy and environmental governance
as an income function, see Eric Gregory Zusman, "The Limits to Access:
An Institutional Explanation for Why Air Pollution Regulations Vary in
East Asia’s Rapidly Industrializing States" (University of California
2007).
status. This collective of energy-consuming countries was
established as a counterweight to the energy-producing
Organization of Petroleum-Exporting Countries (OPEC).
But while OPEC’s share of global oil production is set to
grow, the OECD’s share of oil consumption is quickly
declining, from 60 percent today to 47 percent by 2030.
To stay relevant the IEA must either adapt to the growing
weight of the developing world, China in particular, or
give way to a new institution that does not determine
membership by income level.
INDUSTRIAL COMPETITIVENESS
The discussion of subsidies above applied to their rela-
tionship to energy company investments and behavior
overseas, and found little basis to challenge Chinese be-
havior multilaterally (WTO) or plurilaterally (the ar-
rangements in the OECD). However subsidies that spur
China’s exports of goods could be a different story. One
of the demonstrable abnormalities of China’s current
economic model is that it has become a large net exporter
of energy intensive goods—notably steel—which, given
the energy risk premiums pervasive in China, naturally
raises the question of whether there exist energy subsidies
per se to heavy industry manufacturers in China, and if so
what should be done about them (box 5).
In early 2007 the United States requested consulta-
tions with China over prohibited export subsidies. Several
other major parties joined the consultations. China is
already in the process of changing many of the policies
identified by the United States, and so it will be relatively
easy for the United States to declare victory. A case alleg-
ing actionable domestic subsidies has not been pursued
yet, though a number of US industries, steel foremost, are
Figure 38: Energy Demand Forecasts (mtoe)

44
keen to see such a case brought.103 In the evidence pub-
licly available to date, little or no evidence of improper
energy subsidies per se has been provided. In our primary
research for this study, we found little clear evidence of
direct energy cost subsidies either.
Specific cases of favorable energy-cost terms for ex-
porting companies in China will likely be identified in the
near term. However, the pervasive revealed comparative
advantage of heavy industry manufactured goods from
China is generally rooted in distortions other than energy
inputs, and a challenge to China’s exports of these goods
will likely attack subsidization through the domestic fi-
nancing system more generally rather than subsidized
physical inputs, including energy more discretely. That
will be a challenging case to win.
To be more visionary still, the energy intensity of the
process and production methods employed in an econ-
omy may in the future require expansion of existing re-
gimes, or new regimes. The concept of a carbon tax im-
posed by nations disciplining carbon emissions on im-
ports from countries free-riding on those efforts, which
was anathema to free trade thinkers a decade ago, is no
longer seen as radical. While auditing the carbon content
of a DVD player on the shelf at Wal-Mart all the way
back through the production value chain is a daunting
notion, such an approach, if addressed in a multilateral
context, would have the benefit of harnessing market in-
centives, rather than elusive political will, to reduce en-
ergy consumption and CO2 emissions.
103 As we go to press, a unilateral countervailing duty (CVD) case is
being pressed on China by the United States, aimed at coated paper. It
computes—tenuously, in our opinion—financial subsidies, by compar-
ing the cost of capital in China to 37 other countries. This may mark
the turning point in willingness to address financial subsidies.
CLIMATE CHANGE
Regardless of whether China passes the United States as
the world’s largest emitter of CO2 in 2007 or 2010, it is
clear that there can be no solution to climate change that
does not include China. Both aggressive bilateral technical
cooperation and serious multilateral regime building
needs to begin at once. Building 2GW of coal-fired power
per week, China is quickly locking in its carbon future.
And with the Kyoto Protocol expiring in 2012, the
groundwork must be laid now for what comes next.
Technical Cooperation
The United States and China are both rich in coal and
look to it for a majority of their electricity needs. China is
building its power generation base for the first time and
the United States is preparing to replace a generation of
aging stock. In both countries, the CO2 is vented into the
air from all the existing coal-fired plants and will be from
all the plants currently on the drawing board.104 Carbon
capture and sequestration (CCS), the only feasible means
of large-scale carbon mitigation at these plants, is a viable
technology that still needs significant amounts of R&D
before it can be widely commercialized. A recent study by
MIT (2007) on “The Future of Coal” outlines the need
for several integrated projects to demonstrate the feasibil-
ity of CCS in a variety of countries and geological set-
tings. We believe this should be a priority area of coopera-
tion between the United States and China (box 6). The
two countries are already working together on the Fu-
tureGen project in the United States. Below we suggest
two potential locations for such work in Asia that would
meet other US policy goals in the process:
1) SShengli Oil Field: In China’s Shandong Province,
Shengli is a mature Sinopec oil field that produces
around 500,000 barrels per day. Output from many
of the wells is declining and Sinopec has been per-
forming some enhanced oil recovery (EOR) using gas
and steam. A power plant or refinery in the area
(which is rich in both coal and refineries) equipped
to capture carbon could sell it to the Shengli field for
EOR and thus reduce the overall cost of the demon-
stration project. Doing so would also help boost
104 There are a couple small exceptions to the in the United States in-
cluding the government-funded FutureGen project which plans to
capture and sequester its CO2 stream.
Box 5: Industrial Competitiveness
Energy and Capital Subsidies China is already in the process of changing explicit export incentives.
The pervasive nature of China’s heavy industry prowess and the difficulty in identifying systematic energy or capital sub-sidies mean trade cases on these fronts will be difficult.
Environmental Subsidies Attempts to unilaterally levy tariffs on Chinese imports on environmental grounds would also face a questionable fu-ture at the WTO.
Establishing a multilateral framework (with China as a par-ticipant) to address the carbon content of internationally traded goods would stand a better chance of success.

45
China’s domestic oil production, reducing the
amount it needs to import from abroad.
2) MMongolia: China’s neighbor to the north is rich in
coal and looking for ways to develop its mineral re-
sources that keep as much of the economic value-
chain inside the country as possible. Sandwiched be-
tween Russia and China with no seaport, Mongolia is
weary of becoming a resource-supplying appendage
of either and looks to the United States as an impor-
tant “third neighbor.” Demonstrating a clean coal
power plant with carbon capture and sequestration in
Mongolia with US and Chinese involvement would
give Mongolians an opportunity to sell electricity to
China instead of just raw coal (and hence create more
jobs and economic activity inside the country) and
provide the United States and China with an avenue
for cooperation outside their borders (and hence re-
moved from some of the political considerations).
Projects such as these could be undertaken independ-
ently or as part of the Asia-Pacific Partnership. Moving
quickly to demonstrate the viability of CCS will help to
ensure it is an available mitigation option under a future
international climate regime.
In addition to coal-fired power generation and CCS,
nuclear energy is another area ripe for collaboration.
China plans to build more than 30GW of nuclear power
over the next 15 years and the United States will have to
make decisions about whether to extend or replace its
aging reactor stock. Fortunately, one of the longest-
standing and most successful areas of US-China energy
cooperation is in nuclear technology and safety. This on-
going work is well worth expanding.
International Regimes
While technical cooperation is important, particularly in
the near term, it is no substitute for a multilateral frame-
work to address climate change in which both the United
States and China take part. While the vast majority of the
CO2 added to the atmosphere over the last century came
from the West (and the United States in particular) the
lion’s share of the CO2 emitted over the next century will
come from the East (China in particular) (figure 39). In
the current IEA reference case, growth in annual CO2
emissions in China alone between now and 2030 will
more than double that in the OECD. Total emissions
from the developing world that year will equal global an-
nual emissions today, meaning that even if the rich world
went entirely carbon-free over the next two decades, it
wouldn’t be enough to get back to 1990 levels.
As stated in the beginning of this section, the envi-
ronmental challenge raised by the developing countries
should not be used as an excuse for inaction by the devel-
oped countries responsible for the bulk of the carbon in
the atmosphere already. Our purpose here is rather to
demonstrate that while reducing emissions in the OECD
is critical, it is far from sufficient.
Under the Kyoto Protocol, rich countries were given
the opportunity to offset some of their own emissions by
investing in emissions-reducing projects in the developing
world (known as the Clean Development Mechanism, or
CDM). This was never intended as a long-term solution
to emissions from the developing world but served as an
intermediate step until developing countries were able to
accept binding targets. The protocol expires in 2012, and
in shaping what comes next we need to look beyond the
CDM approach to the developing world.
Ultimately, to have any hope of stabilizing global
CO2 levels, the world will need to deal with both US con-
sumers and Chinese industry. While political will is
emerging in both countries to address their impact on the
world’s climate, the ability to implement policy varies
Box 6: Climate Change
Technical Cooperation CCS demonstration projects in China or Mongolia.
expanded cooperation on nuclear energy.
International Regimes existing approach to multilateral framework must be revised to reflect the reality of the developing world.
a combination of comprehensive emissions caps for the developed world and sector-level agreements for the devel-oping world holds the promise of getting China and India on board and alleviating competitiveness concerns in the US and Europe.
Figure 39: CO2 Concentrations by Country, 1950–2000 and 2001–30

46
greatly between the two. The current politics of energy in
China makes it highly unlikely that Beijing will be able to
significantly alter its carbon future alone, and Beijing will
see absolutely no reason to take this challenge on if Amer-
ica hasn’t done so first. Therefore US leadership is re-
quired, both to address its own environmental footprint,
and to help change the economics of doing so elsewhere
in the world.
Yet many in the United States are concerned about
the impact on global industry allocation if they agree to
targets from which the developing world is exempt; they
argue that it won’t do much good to cap emissions on US
industry if that industry then picks up and moves to
China. These are the same objections that were voiced
about the Kyoto Protocol except that China is now much
larger and US anxiety over global competitiveness is more
pronounced.
There are ways to get beyond these roadblocks that
address both the political challenges in the United States
and the capacity challenges in China. In the United States
the main culprit is consumer energy demand, in the form
of either gasoline in cars or electricity for homes and of-
fices. In China, however, as we have shown throughout
this policy analysis, 70 percent of energy demand comes
from the industrial sector, much of which makes the
goods consumed by households in the United States.
Given this, we see no reason why global climate talks
need to come to a stalemate because the United States
and China aren’t willing to agree to the same types of
targets during the same time frame. There has been a
great amount of focus recently on the concept of sectoral
emission reductions agreements in the most energy-
intensive industries, like steel, aluminum, chemicals, and
automobiles.105 While China (or India) might not be will-
ing or able to agree to comprehensive emissions reduction
targets, sectoral agreements may be an easier sell. And as
industry is the leading source of greenhouse gases in large
developing countries, such an approach would address a
significant portion of their emissions. It would also give
Beijing the cover and the leverage to discipline and con-
solidate these industries, which they have been attempting
to do for several years.
With the prospect of steel mills and aluminum
smelters in China and India being held to the same stan-
dard as those in Pennsylvania and Ohio, sectoral agree-
105 As Michael Laske of AVL China points out, most domestic Chinese
auto companies are looking to export in the years ahead. As such, sec-
toral agreements governing the automotive industry would likely have
an impact on the behavior of these firms if access to foreign markets was
on the line.
ments could mitigate enough of the competitiveness con-
cerns in Washington to get the United States to agree to
the kind of economy-wide reduction targets that are
needed to move global talks forward. The developing
world would also be included in the emerging global re-
gime in a manner that would pave the way for the adop-
tion of comprehensive targets as the commercial and
transportation sectors play a larger role in shaping the
energy profile in these countries.
There are certainly drawbacks to sectoral agreements,
many of which are detailed in a forthcoming study on the
topic by the World Resources Institute (Baumert and
Bradley 2007). Regardless of which approach, or combi-
nation of approaches, makes the most sense in multilat-
eral negotiations, China will not make real moves on cli-
mate change in the absence of US leadership.

47
References
Anderson, Jonathan. 2006. The Furor over China's Companies. Asian Focus. Hong Kong: UBS.
Andrews-Speed, C. P. 2006. Energy Policy and Regulation in the People's Republic of China. International Energy and
Resources Law and Policy Series 19. The Hague: Kluwer Law International.
Baumert, Kevin A., and Rob Bradley. 2007. International Sectoral Cooperation on Climate Change: Issues and Options.
World Resources Institute.
Beijing Kang Kai Information & Consultancy Co Ltd. 2007a. Coal Mining and Washing Industry Monthly Indicators.
Manufacturing Industry Time Series Statistics. ISI Emerging Markets.
Beijing Kang Kai Information & Consultancy Co Ltd. 2007b.Electric Power Generation Industry Monthly Indicators.
Manufacturing Industry Time Series Statistics. ISI Emerging Markets.
Beijing Kang Kai Information & Consultancy Co Ltd. 2006. Refined Petroleum Products Industry Monthly Indicators.
Manufacturing Industry Time Series Statistics. ISI Emerging Markets.
BP plc. 2006. Statistical Review of World Energy 2006. Available at www.bp.com.
Dargay, Joyce, Dermot Gately, and Martin Sommer. 2006. Vehicle Ownership and Income Growth, Worldwide: 1960–
2030. Leeds: Institute for Transport Studies, University of Leeds.
Dollar, David, and Shang-Jin Wei. 2007. Das (Wasted) Kapital: Firm Ownership and Investment Efficiency in China.
IMF Working Paper. Washington: International Monetary Fund.
Downs, Erica S. 2006. China. Energy Security Series 67. Washington: Brookings Institution.
Downs, Erica S. 2004. The Chinese Energy Security Debate. The China Quarterly 177: 21–41.
Economy, Elizabeth. 2004. The River Runs Black: The Environmental Challenge to China's Future. Ithaca: Cornell
University Press.
EIA (Energy Information Administration). 2006. Annual Energy Outlook 2006. Washington: US Department of En-
ergy.
Evans, Peter C. 2005. International Regulation of Official Trade Finance: Competition and Collusion in Export Credits
and Foreign Aid. Cambridge, MA: Massachusetts Institute of Technology.
Evans, Peter C. 1999. Japan's Green Aid Plan: The Limits of State-Led Technology Transfer. Asian Survey 39, no. 6:
19.
Evans, Peter C., and Erica S. Downs. 2006. Untangling China's Quest for Oil through State-Backed Financial Deals.
Brookings Institution Policy Brief 154. Washington: Brookings Institution.
Fisher-Vanden, Karen, Gary H. Jefferson, Liu Hongmei, and Tao Quan. 2003. What Is Driving China’s Decline in
Energy Intensity? Dartmouth College, Brandeis University, and the National Bureau of Statistics. Photocopy.
Fisher-Vanden, Karen, Gary H. Jefferson, Ma Jingkui, and Xu Jianyi. 2006. Technology Development and Energy Pro-
ductivity in China. Energy Economics 28, no. 5-6: 690–705.
Garbaccio, Richard F. 1994. Price Reform and Structural Change in the Chinese Economy: Policy Simulations Using a
CGE Model. China Economic Review 6, no. 1: 34.
He, Jiankun. 2006. Achieving the 2010 20-Percent Energy Intensity Target through Industrial Technology Advance-
ment. Paper presented at the Senior Policy Advisory Council Meeting & Forum on Implementing China’s 2010
20-Percent Energy Intensity Reduction Target, Hainan, China, November.
Hofman, Bert, and Louis Kuijs. 2006. Profits Drive China's Boom. Far Eastern Economic Review 169, no. 8: 39.
Hu, Jin-Li, and Shih-Chuan Wang. 2006. Total-Factor Energy Efficiency of Regions in China. Energy Policy 34, no.
17: 3206–17.

48
Huang, Jikun, Huanguang Qiu, Michiel Keyzer, and Erika Meng. 2007. Potential Impacts of Bioethanol Development
in China. Center for Chinese Agricultural Policy, Chinese Academy of Sciences.
IEA (International Energy Agency). 2006. China's Power Sector Reforms: Where to Next? Paris: Organization for Eco-
nomic Cooperation and Development.
Jiang, Tingsong, and Warwick J. McKibbin. 2002. Assessment of China's Pollution Levy System: An Equilibrium Pollu-
tion Approach. Environment and Development Economics 7, no. 1: 30.
Kennedy, Scott. 2005. The Business of Lobbying in China. Cambridge, MA: Harvard University Press.
KPMG. 2006. Chemicals in China: The Next Decade. Hong Kong.
Kuijs, Louis, William Mako, and Chunlin Zhang. 2005. SOE Dividends: How Much and to Whom? World Bank Pol-
icy Note. Washington: World Bank.
Lardy, Nicholas R. 2007. China: Rebalancing Economic Growth. Paper for the China Balance Sheet series Washington:
Peterson Institute for International Economics and Center for Strategic and International Studies.
Lardy, Nicholas R. 2006. China: Toward a Consumption Driven Growth Path. Policy Briefs in International Economics
06-6. Washington: Peterson Institute for International Economics.
Lardy, Nicholas R. 2002. Integrating China into the Global Economy. Washington: Brookings Institution Press.
Lardy, Nicholas R. 1998. China's Unfinished Economic Revolution. Washington: Brookings Institution.
Lewis, Steven W. 2007. Chinese NOCs and World Energy Markets: CNPC, Sinopec and CNOOC. In The Changing
Role of National Oil Companies in International Energy Markets. James A. Baker II Institute for Public Policy,
Rice University.
Lieberthal, Kenneth. 2004. Governing China: From Revolution through Reform, 2d ed. New York: W. W. Norton.
Lieberthal, Kenneth, and Mikkal Herberg. 2006. China’s Search for Energy Security: Implications for U.S. Policy. NBR
Analysis 17, no. 1: 52.
Lieberthal, Kenneth, and David M. Lampton. 1992. Bureaucracy, Politics, and Decision Making in Post-Mao China.
Studies on China. Berkeley: University of California Press.
Lieberthal, Kenneth, and Michel Oksenberg. 1988. Policy Making in China : Leaders, Structures, and Processes. Prince-
ton, NJ: Princeton University Press.
Mertha, Andrew C. 2007. Water Warriors: Political Pluralization in China’s Hydropower Policy. St. Louis: Washington
University.
MIT (Massachusetts Institute of Technology). 2007. The Future of Coal. Cambridge, MA.
Naughton, Barry. 2007. The Chinese Economy: Transitions and Growth. Cambridge, MA: MIT Press.
Naughton, Barry. 1995. Growing out of the Plan: Chinese Economic Reform, 1978–1993. New York, NY: Cambridge
University Press.
Naughton, Barry. 2005. SASAC Rising. China Leadership Monitor, no. 14.
Osborne, Milton. 2004. River at Risk: The Mekong and the Water Politics of China and Southeast Asia. Lowy Institute
for International Policy.
Price, Lynn, Ernst Worrell, Jonathan Sinton, and Jiang Yun. 2001. Industrial Energy Efficiency Policy in China.
ACEEE Summer Study on Energy Efficiency in Industry.
Shan, Weijian. 2006a. China's Low-Profit Growth Model. Far Eastern Economic Review 169, no. 9: 23.
Shan, Weijan. 2006b. The World Bank's China Delusions. Far Eastern Economic Review 169, no. 7: 29–32.
Shirk, Susan L. 1993. The Political Logic of Economic Reform in China. California Series on Social Choice and Political
Economy 24. Berkeley, CA: University of California Press.
Taylor, Michael. 2006. Energy Efficiency and CO2 Reduction Opportunities in the Global Cement Industry. Paper pre-
sented at the IEA-WBCSD Cement Industry Workshop, IEA, Paris, September 4.
US Department of Energy. 2006. Performance and Accountability Report Highlights: Fiscal Year 2006. Washington.

49
Wan, Yanjia. 2006. China’s Energy Efficiency Policy in Industry. Paper presented at the “Working Together to Respond
to Climate Change,” Annex I Expert Group Seminar in Conjunction with the OECD Global Forum on Sustain-
able Development, Paris, March 27–28.
WoodMackinzie. 2006. The Impact of Asian NOCs on the Upstream M&A Market. Corporate Insights commercial
series (May).
Xu, Xiaojie. 2007. Chinese NOC's Overseas Strategies: Background, Comparison and Remarks. In The Changing Role
of National Oil Companies in International Energy Markets. Houston, TX: James A. Baker II Institute for Public
Policy, Rice University.
Yang, Fuqiang, Ning Duan, Zhijie Huan, Mark D. Levine, Nathan C. Martin, Jonathan E. Sinton, Dadi Zhou, Fengqi
Zhou, and Chengzhang Zhu. 1995. A Review of China's Energy Policy. Berkeley, CA: Lawrence Berkeley Na-
tional Laboratory.
Zhou, Dadi, and Mark D. Levine. 2003. China's Sustainable Energy Future: Scenarios of Energy and Carbon Emissions.
Berkeley, CA: Energy Research Institute and Lawrence Berkeley National Laboratory.
Zusman, Eric Gregory. 2007. The Limits to Access: An Institutional Explanation for Why Air Pollution Regulations
Vary in East Asia’s Rapidly Industrializing States. Los Angeles, CA: University of California.