China cement industry primer boc international (2011)
66
-
Upload
book24h -
Category
Economy & Finance
-
view
34 -
download
2
Transcript of China cement industry primer boc international (2011)


China Cement Sector Industrials – Basic Materials Michelle Leung 25 May 2011
This document may not be distributed in or into the PRC.
Table of Contents
CHINA CEMENT SECTOR.................................................. 1
INVESTMENT SUMMARY ................................................... 2
CEMENT IS STILL CHEAP ................................................. 3
STRONG DEMAND PULL................................................. 10
MORE CAPS ON SUPPLY SIDE ....................................... 16
PROVINCIAL ANALYSIS .................................................. 23
PEER COMPARISONS..................................................... 26
COMPANY UPDATE
ANHUI CONCH (914 HK) ....................................................... 29
CHINA NATIONAL BUILDING MATERIAL (3323 HK)................... 45
LISTED COMPANIES IN THIS REPORT .............................. 61

BOCI research is available electronically on Bloomberg (BOCR <go>), thomsonreuters.com and www.bociresearch.com.
Industrials – Basic Materials | Sector Update 25 May 2011
OVERWEIGHT Company Stock
code TP Rating
Anhui Conch 914 HK HK$40.70 BUY CNBM 3323 HK HK$17.30 BUY Shanshui Cement 691 HK HK$11.90 BUY CR Cement 1313 HK HK$7.23 BUY West China Cement 2233 HK HK$3.25 HOLD
Where are we Different? Our detailed estimation of cement demand from
social housing and analysis that it should more than offset the commodity housing slowdown
Our above-consensus EPS estimates for Conch Key Highlights of this Report
Estimated cement demand from social housing
Fig. 20
Analysis of % achievement needed from social housing to offset commodity housing slowdown
Fig. 21
Scorecard for province preferences Fig. 41 Scorecard for cement company
preferences Fig. 53
Key Catalysts/Events Analyst marketing in Hong Kong 26-27 May Anhui Conch's Sales Exposure by Segment in 2010
Infrastructure40%
Property33%
Rural areas27%
Source: Company data CNBM’s sales exposure by Segment in 2010 China United South Cement Infrastructure 40% 20% Urban development 45% 70% Real estate 15% 10% Source: Company data, BOCI Research estimates
China Cement Sector Cementing Growth over the Twelfth Five-Year Period We have seen share price corrections of over 10% across the board since the rapid run in 4Q10. Some investors wonder if the heat on the cement stocks has been overdone and if the positives have been priced in. We reiterate our bullish view on the cement sector. With only a 0.7% CAGR over the last decade, we think China’s cement prices are still cheap. With the potential easing of oversupply by 2013, we see strong support for cement prices going forward. That said, we consider eastern and southern China our most favoured regions, given their strong fundamentals and less growth slowdown in new construction project starts in 1Q11. In our Hong Kong-listed cement universe, we choose Anhui Conch as the top pick and least prefer West China Cement (WCC).
Cement Prices Still Very Cheap Dogged by overcapacity, the national average cement price has stagnated over
the past decade (0.7% CAGR and up only 9% during 2000-10), compared with a more than 260% increase in the coal price during the same period.
Although eastern China outperformed last year in terms of cement price hikes, substantial upside still exists given that over the past 13 years, the cement price in the region has underperformed the national average with a 4.6% YoY decline (vs. a 4% rise in the national average).
Social Housing Impact > Commodity Housing We believe cement demand will be boosted by 3-7% per year during 2011-13,
assuming an 80% achievement rate of the government’s unit construction target in our base case.
According to our scenario analysis, if the social housing achievement rate is above 70% this year, it could offset a 30% fall in GFA starts for commodity housing.
Anhui Conch should be the largest beneficiary under social housing construction.
Demand Pull from Rapid Urbanisation Rapid urbanisation in China is expected to sustain a high level of construction
activities, especially for water conservancy and infrastructure upgrades in the 12th 5-year Plan (5YP) period. China National Building Material (CNBM) should benefit the most given its largest exposure to rural areas among all listed names.
More Caps on Supply Side The Ministry of Industry and Information Technology (MIIT) has accelerated the
plan to eliminate obsolete capacity, especially in provinces such as Hebei, Shanxi, Liaoning and Zhejiang. This bodes well for CNBM and Shanshui Cement.
Top Buy Anhui Conch is our top pick in the sector (target price: HK$40.70). As the
second largest cement producer in China and one of the most cost-efficient, we believe Conch should trade at a premium to peers. Moreover, we believe it is one of the biggest beneficiaries of social housing construction. Despite its large size, we expect the company’s net profit to register a 46% CAGR in 2010-13 and anticipate it will become one of the fastest-growing companies in the cement universe. Trading at only 11x 2011 P/E, we think now is a good time to BUY.
BOCI Research Limited China: Industrials – Basic Materials
Michelle Leung (852) 3988 6431 [email protected]

China Cement Sector Industrials – Basic Materials Michelle Leung 25 May 2011
This document may not be distributed in or into the PRC. 2
INVESTMENT SUMMARY We have seen share price corrections of over 10% across the board since the rapid run in 4Q10. Some investors wonder if the heat on the cement stocks has been overdone and if the positives have been priced in. We reiterate our bullish view and believe that the recent correction has been more a result of market sentiment than of fundamentals. The national cement prices have continued the upswing that began in 1Q11, up 19% YoY as of 20 May. Having said that, the growth slowdown for new project starts has made us wary of a possible slowdown in cement demand growth later in 2012, so we must be more selective in terms of cement companies’ exposure by province. In this regard, eastern China is still the safest, in our view.
Our positive view is based on our belief that:
1) Cement is still cheap;
2) Industry consolidation should continue, thus providing greater pricing power for companies with larger market shares;
3) Cement demand stemming from social housing should be able to offset the slowdown in the property market. Moreover, urbanisation should remain the major growth driver for cement demand.
4) The central government will not resume approvals of new production lines, thus restricting supply growth for at least the next 2-3 years.
We think the cement sector has become attractive once again after the recent share price correction. Our ranking of cement companies is: Anhui Conch, China National Building Material, Shanshui Cement, China Resources Cement and West China Cement. We reiterate our OVERWEIGHT rating for the sector.

China Cement Sector Industrials – Basic Materials Michelle Leung 25 May 2011
This document may not be distributed in or into the PRC. 3
CEMENT IS STILL CHEAP We remain positive on the cement sector despite many investors posing the same question after the recent cement price run: “Is the current high price sustainable?” Our answer is YES, and we see it as STILL low. Dogged by overcapacity, the national average cement price has stagnated over the past decade (0.7% CAGR and 9% growth during 2000-10) compared with a more than 260% coal price increase in the same period. Cement deserves more upside going forward given the continuously improving demand and supply balance.
Eastern China was the top performing region in China last year in terms of cement price hikes (up 60% to RMB513/tonne), compared with the national average of 18% growth to RMB431/tonne. Having said that, there should still be substantial upside given that over the past 13 years, the cement price in eastern China has underperformed the national average with a 4.6% YoY decline (vs. a 4% rise in the national average).
Figure 1. Historical National Cement Price Trend
300
350
400
450
1997
1998
1999
2000
2001
2002
2003
2004
2005
2006
2007
2008
2009
2010
YTD
(Rmb/tonne)
+0% CAGR within 1997-2010
+39% from trough in 2007
Source: Digital Cement, BOCI Research
Figure 2. Historical Cement Price Trend in Eastern China
250
300
350
400
450
500
1997
1998
1999
2000
2001
2002
2003
2004
2005
2006
2007
2008
2009
2010
YTD
(Rmb/tonne)
Source: Digital Cement, BOCI Research
Eastern China cement price: 2% CAGR in 1997-2010 and up 23% from 1997 to May 2011
China Cement Sector Industrials – Basic Materials Michelle Leung 25 May 2011
This document may not be distributed in or into the PRC. 4
Figure 3. Historical Cement Price Trend in Southern China
280
320
360
400
440
480
1997
1998
1999
2000
2001
2002
2003
2004
2005
2006
2007
2008
2009
2010
YTD
(Rmb/tonne)
Source: Digital Cement, BOCI Research
Figure 4. Historical Cement Price Trend in Northern China
250
300
350
400
450
1997
1998
1999
2000
2001
2002
2003
2004
2005
2006
2007
2008
2009
2010
YTD
(Rmb/tonne)
Source: Digital Cement, BOCI Research
Figure 5. Historical Cement Price Trend in NE China
280
300
320
340
360
380
400
420
1997
1998
1999
2000
2001
2002
2003
2004
2005
2006
2007
2008
2009
2010
YTD
(Rmb/tonne)
Source: Digital Cement, BOCI Research
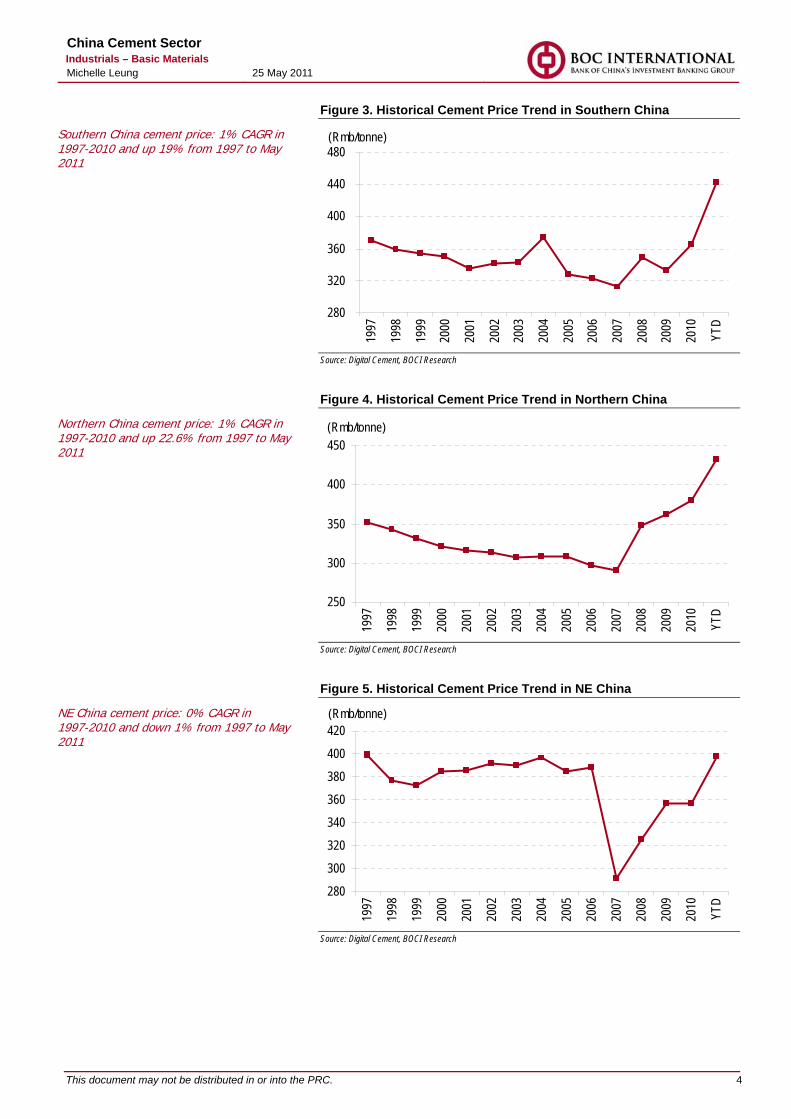
Southern China cement price: 1% CAGR in 1997-2010 and up 19% from 1997 to May 2011
Northern China cement price: 1% CAGR in 1997-2010 and up 22.6% from 1997 to May 2011
NE China cement price: 0% CAGR in 1997-2010 and down 1% from 1997 to May 2011

China Cement Sector Industrials – Basic Materials Michelle Leung 25 May 2011
This document may not be distributed in or into the PRC. 5
Figure 6. Historical Cement Price Trend in SW China
320
340
360
380
400
420
440
460
1997
1998
1999
2000
2001
2002
2003
2004
2005
2006
2007
2008
2009
2010
YTD
(Rmb/tonne)
Source: Digital Cement, BOCI Research
Figure 7. Historical Cement Price Trend in NW China
280300320340360380400420440460
1997
1998
1999
2000
2001
2002
2003
2004
2005
2006
2007
2008
2009
2010
YTD
(Rmb/tonne)
Source: Digital Cement, BOCI Research
Figure 8. Historical Cement Price Trend Comparison
250
300
350
400
450
500
1997
1998
1999
2000
2001
2002
2003
2004
2005
2006
2007
2008
2009
2010
YTD
(Rmb/tonne)
N China NE China E ChinaS China SW China NW China
Source: Digital Cement, BOCI Research
SW China cement price: 1% CAGR in 1997-2010 and up 10% from 1997 to May 2011
NW China cement price: 1% CAGR in 1997-2010 and up 21% from 1997 to May 2011

China Cement Sector Industrials – Basic Materials Michelle Leung 25 May 2011
This document may not be distributed in or into the PRC. 6
Successful Demonstration: Effective Capacity Elimination Leads to Cement Price Hikes As a result of the stringent capacity expansion controls and massive consolidation in eastern China over the past few years, the growth in cement capacity in the region was much slower that that in the north and southwest. The percentage of total national capacity located in the east dropped from the peak in 2006 (41.1%) to around 34% in 2010. However, new project investment (which has implications for cement demand) in the east was the highest in the country, accounting for 27.1% of the total last year.
Figure 9. W-shaped Growth Cycle for Cement Production in China
12.93
7.71
18.14
4.66
12.22 12.16
02468
101214161820
81-85 86-90 91-95 96-00 01-05 06-10 11-15
% Implying a sharp decline in production growth in 2011-15E
E
Source: Digital Cement, BOCI Research
Figure 10. BOCI Forecasts of Cement Demand and Supply Balance
New dry process
Total capacity
YoY growth (%)
Total output
YoY growth (%)
Total demand
YoY growth (%)
2002 17% 914 8 725 9 709 15 2003 24% 1,100 20 862 19 810 14 2004 34% 1,249 14 970 13 932 15 2005 42% 1,346 8 1,060 9 998 7 2006 48% 1,410 5 1,240 17 1,173 18 2007 54% 1,464 4 1,360 10 1,320 13 2008 62% 1,589 4 1,388 2 1,357 3 2009 70% 1,806 14 1,629 17 1,597 18 2010 77% 1,958 8 1,868 15 1,848 16 2011E 85% 2,237 14 2,126 10 2,033 10 2012E 90% 2,437 9 2,327 10 2,195 8 2013E 96% 2,287 (6) 2,287 (2) 2,327 6 Source: BOCI Research estimates

China Cement Sector Industrials – Basic Materials Michelle Leung 25 May 2011
This document may not be distributed in or into the PRC. 7
Figure 11. Capacity Growth in Eastern China
0100
200300400
500600
2001
2002
2003
2004
2005
2006
2007
2008
2009
2010
m tonnes
Zhejiang Shanghai Shandong Hubei Jiangsu
+11.2% CAGR within 2001-10
Source: Digital Cement, BOCI Research
Figure 12. Capacity Growth in Central China
050
100150200250300350
2001 2002 2003 2004 2005 2006 2007 2008 2009 2010
m tonnes
Anhui Jiangxi Hunan Fujian
+15.6% CAGR wihtin 2001-10
Source: Digital cement, BOCI Research
Figure 13. Capacity Growth in Southern China
0
50
100
150
200
2001 2002 2003 2004 2005 2006 2007 2008 2009 2010
m tonnes
Guangdong Guangxi
+10.2% CAGR wihtin 2001-10
Source: Digital cement, BOCI Research
Eastern China had the most effective capacity expansion controls among all regions, with capacity growing at a CAGR of only 6% over the past 5 years (SW China: 21%)

China Cement Sector Industrials – Basic Materials Michelle Leung 25 May 2011
This document may not be distributed in or into the PRC. 8
Figure 14. Capacity Growth in Western China
050
100150200
250300
2001 2002 2003 2004 2005 2006 2007 2008 2009 2010
m tonnes
Gansu Chongqing Sichuan Ningxia Xinjiang
+16.3% CAGR wihtin 2001-10
Source: Digital Cement, BOCI Research
Figure 15. Capacity Growth in Northern China
020406080
100120140
2001 2002 2003 2004 2005 2006 2007 2008 2009 2010
m tonnes
Liaoning Jilin Heilongjiang
+12.9% CAGR within 2001-10
Source: Digital Cement, BOCI Research
Figure 16. Eastern China Capacity Growth Contracted in 2003-10
0% 5% 10% 15% 20% 25% 30% 35% 40%
Northern China
NE China
Eastern China
Southern China
SW China
NW China
Central China
FY10 FY09 FY03
Output growth expanding continuously in SW China
Output growth contracting continuously in E China
Source: Digital Cement, BOCI Research
Cement capacity in SW China expanded at a 22% CAGR in 2005-10 and at a 16.3% CAGR during in 2001-10, making it the fastest-growing region in the country

China Cement Sector Industrials – Basic Materials Michelle Leung 25 May 2011
This document may not be distributed in or into the PRC. 9
Figure 17. Average Cement Production per Enterprise
0
50
100
150
200
250
N Ch
inaBe
ijing
Tianji
nHe
bei
Shan
xiInn
erNE
Chin
aLia
oning Jili
nHe
ilong
jian
E Ch
inaSh
angh
ai Jia
ngsu
Zheji
ang
Anhu
iFu
jian
Jiang
xiSh
ando
ngS
China
Hena
nHu
bei
Huna
nGu
angd
ong
Guan
gxi
Haina
nSW
Chin
aCh
ongq
ingSic
huan
Guizh
ouYu
nan
NW C
hina
Shaa
nxi
Gans
uQi
ngha
iNi
ngxia
Xinjia
ng
Bars in red are provinces with production per enterprise lower than the national average, thus implying high industry fragmentation Source: Digital Cement, BOCI Research
High average cement production per enterprise indicates high market share concentration in the region. Cement producers in such regions should enjoy relatively strong power to negotiate prices

China Cement Sector Industrials – Basic Materials Michelle Leung 25 May 2011
This document may not be distributed in or into the PRC. 10
STRONG DEMAND PULL 1. Social Housing Given the government’s extensive investment in social housing (10m units to be constructed in 2011-12 and 36m units during the entire 12th 5-year Plan period) as well as its goal to increase the penetration rate of social housing to 20%, we believe cement demand will be boosted by 3-7% per year during 2011-13, assuming an 80% achievement rate in our base case. We also consider a bearish scenario with an achievement rate of only 50%, which would spur cement demand by only 2-4% per year during the period. With reference to last year and the central government’s mounting determination to increase social housing supply in China, we believe an 80% achievement rate is highly possible. This year, the government has budgeted around RMB1.3trn for related projects, representing 5% of China’s total fixed asset investment (FAI) in 2010. The government’s Document of Objective Responsibility stipulates that construction of all targeted affordable housing units must commence before 31 October 2011, which will provide a marked boost to cement demand in the following months.
Figure 18. Total Investment Plan for Social Housing (2009-11E) 2009 2010 2011E 12th 5YP Investment amount (RMB bn) 384 816 1,300 5,000 YoY growth 20% 113% 59% N/A Construction starts (m units) 3 5.8 10 36 Source: MOHURD, BOCI Research
Figure 19. Social Housing Market Volume Trend
132
396
786
1,320 1,320
0
200
400
600
800
1,000
1,200
1,400
2008 2009 2010 2011E 2012E
RMB bn
Note: Assuming 60sqm per unit and a GFA construction cost of RMB2,200/sqm Source: State Council, MOHURD, BOCI Research

China Cement Sector Industrials – Basic Materials Michelle Leung 25 May 2011
This document may not be distributed in or into the PRC. 11
Figure 20. Potential Cement Demand Derived from Social Housing
No. of units (m) GFA (sqm)
per unit Cement consumption
per GFA (kg/sqm) Total cement consumption (m tonnes) (a) (b) (c) =(a)*(b)*( c)/1000 2010E 2011E 2012E 2013E 2010E 2011E 2012E 2013E Public housing 3 6 6 3 60 220 40 79 79 42 Shantytown housing 2.8 4 4 2 80 220 49 70 70 38 Total 5.8 10 10 5.3 89 150 150 80 YoY growth 68% 0% -47% % of total cement consumption 4.8% 7.4% 6.8% 3.4% % of additional cement demand from the previous year 5.6% 8.1% 7.4% 3.6% Assuming an 80% achievement rate 71 120 120 64 % of additional cement demand from the previous year 4.5% 6.5% 5.9% 2.9% Assuming a 50% achievement rate 44 75 75 40 % of additional cement demand from the previous year 2.8% 4.0% 3.7% 1.8% Source: NDRC, BOCI Research estimates
Can Social Housing Projects Offset the Slowdown in Commodity Housing? Very Likely As shown below, we believe that if the social housing achievement rate is above 70% this year and 50% next year, it could offset a 30% fall in GFA starts for commodity housing each year. Having said that, the property sector refuses to slow despite the central government’s austerity measures. During 1Q11, commodity housing GFA starts grew 23% YoY, while property sales in terms of GFA rose 6.4% YoY in 4M11.
Figure 21.Scenario Analysis of Cement Demand Impact from Social Housing and Commodity Housing
Commodity
housing (m sqm) GFA/ unit
(sqm) unit
(m units)
Cement demand from commodity housing (m
tonnes)
Total cement consumption in
China (m tonnes) Commodity property floor space newly started in 2010 1,637 100 16 360 1,977
% of total cement consumption in 2010 18%
Assuming slowdown in 2011 by: Cement demand
change (m tonnes) 10% 1,473 100 14.7 324.13 (36.01) 30% 1,146 100 11.5 252.10 (108.04) Assuming, after 30% drop in 2011, further slowdown in 2012 by: 10% 1,031 100 10.3 226.89 (25.21) 30% 802 100 8.0 176.47 (75.63) Cement demand from social housing in 2011-13E Achievement rate 30% 50% 70% 80% 100% 2011E 45 75 105 120 150 2012E 45 75 105 120 150 2013E 24 40 56 64 80 *Hit hard by the financial crisis, the commodity housing newly started GFA was 920m sqm during 2H09- 1H10. Thus, we think the chance for newly started GFA to drop to 802m sqm by 2012 is mild. Source: CREIS, BOCI Research

China Cement Sector Industrials – Basic Materials Michelle Leung 25 May 2011
This document may not be distributed in or into the PRC. 12
Figure 22. Newly Started GFA for Commodity Housing (2006-1Q11)
-200400600800
1,0001,2001,4001,6001,800
2M06
5M06
8M06
11M0
63M
076M
079M
0712
M07
4M08
7M08
10M0
82M
095M
098M
0911
M09
3M10
6M10
9M10
12M1
0 -40%
-20%
0%
20%
40%
60%
80%
m sqm YoY growth
Source: CREIS, BOCI Research
Who will Benefit the Most from Social Housing? In terms of regions, we see more aggressive targets in the north, NE, NW and SW. In terms of provinces, Heilongjiang (north), Chongqing (SW), Shaanxi (NW), Inner Mongolia (north) and Hunan (central) are ranked the top 5 in terms of social housing construction targets.
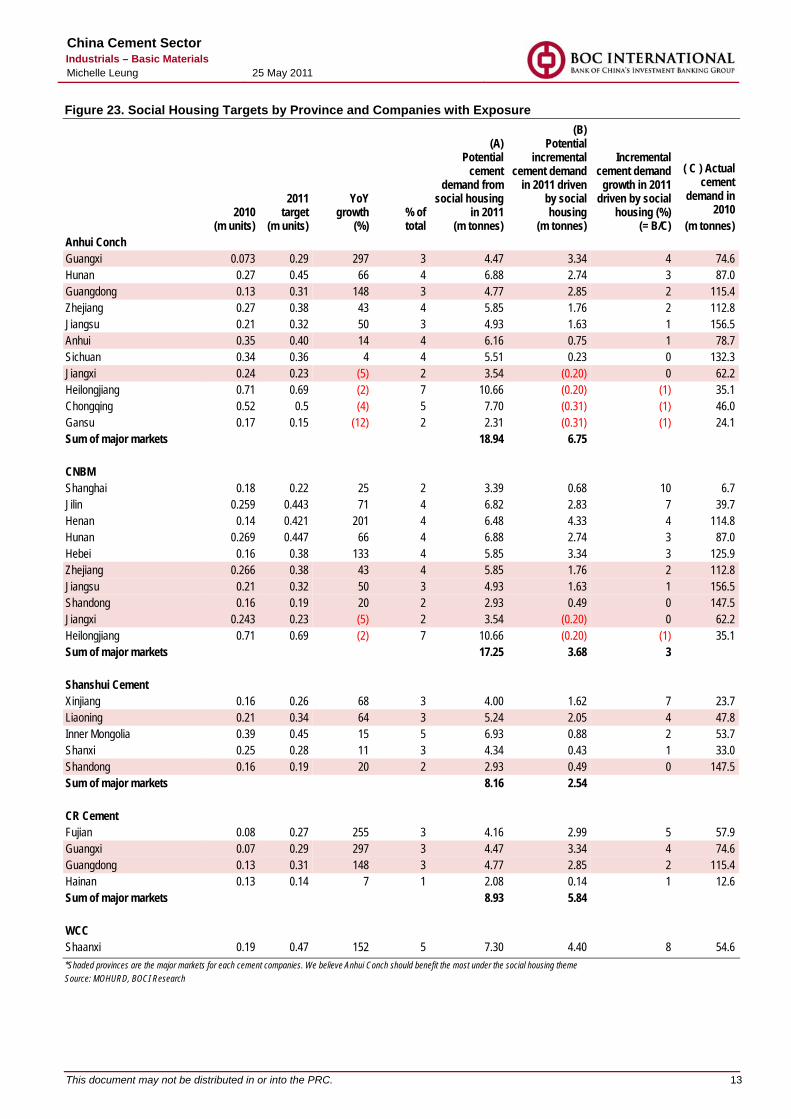
As shown in the figure below, we calculate each province’s incremental cement demand growth in 2011 driven by social housing. We multiply the incremental social housing unit target in 2011 by 70sqm and 220kg cement/sqm, an assumption consistent with that in Figure 21. Also, we identify the largest beneficiary of social housing construction by comparing each company’s total cement demand (Column A) within its major markets. Moreover, by considering each company’s exposure to real estate, we have found that Anhui Conch, with its 33% exposure, should be the biggest beneficiaries under the massive social housing construction plan. Going forward, Shanshui Cement’s expansion plan in Xinjiang should raise its exposure to the social housing market in the future. While West China Cement has no exposure to the real estate market, it should enjoy little from social housing.
Anhui Conch should be the biggest beneficiary under the social housing theme.
China Cement Sector Industrials – Basic Materials Michelle Leung 25 May 2011
This document may not be distributed in or into the PRC. 13
Figure 23. Social Housing Targets by Province and Companies with Exposure
2010
(m units)
2011 target
(m units)
YoY growth
(%) % of total
(A) Potential
cement demand from
social housing in 2011
(m tonnes)
(B) Potential
incremental cement demand
in 2011 driven by social housing
(m tonnes)
Incremental cement demand
growth in 2011 driven by social
housing (%) (= B/C)
( C ) Actual cement
demand in 2010
(m tonnes) Anhui Conch Guangxi 0.073 0.29 297 3 4.47 3.34 4 74.6 Hunan 0.27 0.45 66 4 6.88 2.74 3 87.0 Guangdong 0.13 0.31 148 3 4.77 2.85 2 115.4 Zhejiang 0.27 0.38 43 4 5.85 1.76 2 112.8 Jiangsu 0.21 0.32 50 3 4.93 1.63 1 156.5 Anhui 0.35 0.40 14 4 6.16 0.75 1 78.7 Sichuan 0.34 0.36 4 4 5.51 0.23 0 132.3 Jiangxi 0.24 0.23 (5) 2 3.54 (0.20) 0 62.2 Heilongjiang 0.71 0.69 (2) 7 10.66 (0.20) (1) 35.1 Chongqing 0.52 0.5 (4) 5 7.70 (0.31) (1) 46.0 Gansu 0.17 0.15 (12) 2 2.31 (0.31) (1) 24.1 Sum of major markets 18.94 6.75 CNBM Shanghai 0.18 0.22 25 2 3.39 0.68 10 6.7 Jilin 0.259 0.443 71 4 6.82 2.83 7 39.7 Henan 0.14 0.421 201 4 6.48 4.33 4 114.8 Hunan 0.269 0.447 66 4 6.88 2.74 3 87.0 Hebei 0.16 0.38 133 4 5.85 3.34 3 125.9 Zhejiang 0.266 0.38 43 4 5.85 1.76 2 112.8 Jiangsu 0.21 0.32 50 3 4.93 1.63 1 156.5 Shandong 0.16 0.19 20 2 2.93 0.49 0 147.5 Jiangxi 0.243 0.23 (5) 2 3.54 (0.20) 0 62.2 Heilongjiang 0.71 0.69 (2) 7 10.66 (0.20) (1) 35.1 Sum of major markets 17.25 3.68 3 Shanshui Cement Xinjiang 0.16 0.26 68 3 4.00 1.62 7 23.7 Liaoning 0.21 0.34 64 3 5.24 2.05 4 47.8 Inner Mongolia 0.39 0.45 15 5 6.93 0.88 2 53.7 Shanxi 0.25 0.28 11 3 4.34 0.43 1 33.0 Shandong 0.16 0.19 20 2 2.93 0.49 0 147.5 Sum of major markets 8.16 2.54 CR Cement Fujian 0.08 0.27 255 3 4.16 2.99 5 57.9 Guangxi 0.07 0.29 297 3 4.47 3.34 4 74.6 Guangdong 0.13 0.31 148 3 4.77 2.85 2 115.4 Hainan 0.13 0.14 7 1 2.08 0.14 1 12.6 Sum of major markets 8.93 5.84 WCC Shaanxi 0.19 0.47 152 5 7.30 4.40 8 54.6 *Shaded provinces are the major markets for each cement companies. We believe Anhui Conch should benefit the most under the social housing theme Source: MOHURD, BOCI Research

China Cement Sector Industrials – Basic Materials Michelle Leung 25 May 2011
This document may not be distributed in or into the PRC. 14
Figure 24. Quarterly Total Newly Started GFA and YoY Growth (3Q04-4Q10)
0500
1,0001,5002,0002,5003,0003,5004,000
3Q04
4Q04
1Q05
2Q05
3Q05
4Q05
1Q06
2Q06
3Q06
4Q06
1Q07
2Q07
3Q07
4Q07
1Q08
2Q08
3Q08
4Q08
1Q09
2Q09
3Q09
4Q09
1Q10
2Q10
3Q10
4Q10
-20%
0%
20%
40%
60%
80%
Cumulative GFA newly started (LHS) YoY growth (RHS)
(m sqm)
Source: WIND database, BOCI Research
2. Rapid Urbanisation Urbanisation has been very important in stimulating overall cement demand. We estimate that urbanisation has driven up annual GDP by 0.7% on average over the past 10 years. During the 12th 5YP period, accelerated urbanisation should continue to drive cement demand via water conservancy projects and infrastructure upgrades. We have cross-checked the construction activities with the demand for building machinery, and found that the sales volume of wheel loaders was up by 45% and that of excavators by 58% YoY during 1Q11. Among related companies, we believe CNBM should benefit the most from urbanisation as it has large exposure in rural areas.
Figure 25. Huge Potential for China’s Urbanisation
82% 82% 80% 77% 74%67%
43%
90%
0%10%20%30%40%50%60%70%80%90%
100%
UK US SouthKorea
Canada France Germany Japan China
Source: WIND database, BOCI Research

China Cement Sector Industrials – Basic Materials Michelle Leung 25 May 2011
This document may not be distributed in or into the PRC. 15
Figure 26. China’s Latest Regional Development Plans Time of proposal Names Region Jan-08 Development Plan for Guangxi Beibuwan Economic Zone Guangxi Mar-08 Overall Plan of Coordinated Reform in Tianjin Binhai New Area Tianjin Dec-08 Outline of the Plan for the Reform and Development of the Pearl
River Guangdong
Jan-09 State Council Opinions on Promoting Urban and Rural Reform and Development in Chongqing
Chongqing
Mar-09 Building Shanghai as International Shipping Center and Financial Center
Shanghai
May-09 State Council Opinions on Supporting Fujian Province in Building the West Coast Economic Zone on the Taiwan Strait
Fujian
Jun-09 Development Plan of Coastal Area in Jiangsu Jiangsu Jul-09 Liaoning Coastal Economic Zone Development Plan Liaoning Aug-09 Outline and Development Plans of Tumen River Region Jilin Sept-09 Outline of Plan to Boost Development of Central China Central region Dec-09 Efficient Ecological Economic Zone Development Plan for Yellow
River Delta Shandong
Dec-09 Poyang Lake Ecological Economic Zone Plan Jiangxi Dec-09 Circular Economy of Gansu Province Master Plan Gansu,
Shanxi Dec-09 Council for the Promotion of International Tourism on Hainan
Island Hainan
Jan-10 Demonstration Zone Plan for the City-cluster along the Yangtze River in Anhui
Anhui
Jan-10 Chongqing “Two Rivers” New Area Chongqing Source: Xinhua News Agency, BOCI Research

China Cement Sector Industrials – Basic Materials Michelle Leung 25 May 2011
This document may not be distributed in or into the PRC. 16
MORE CAPS ON SUPPLY SIDE Accelerating Outdated Capacity Elimination and Energy-saving Target Energy saving has always been on top of the Chinese government’s agenda. MIIT has recently revised up its obsolete cement capacity elimination target from 100m tonnes to 133.6m tonnes, 46% higher than in 2010. Provinces like Hebei, Shanxi, Liaoning and Zhejiang will be the key provinces.
Also, outdated capacity elimination will continue. Shandong, Guangdong, Hunan and Shanxi should be the provinces with more rapid capacity elimination. Guangdong’s government is planning to remove all outdated capacity by end-2012. The Shanxi government also announced a plan to eliminate 13.2m tonnes of outdated capacity in 2011, representing 20% of the total existing capacity. Considering the cement companies’ capacity allocation, we believe CNBM and Shanshui Cement should be the biggest beneficiaries.
We believe the MIIT’s capacity elimination targets are achievable taking reference of the track record. During 2010, Sichuan, Guangdong, Hunan, Shanxi and Shandong were the top 5 provinces with most capacity elimination, accounting for 20-28% of their respective cement capacity in 2010. According to the government’s schedule, we believe all outdated capacity should be eliminated by end-2013. As such, the oversupply in China could possibly turn into a shortage.
Large Cement Companies to Benefit Most from Power Rationing We think power rationing is positive to large-sized cement companies as: (i) they enjoy higher pricing power on lower supply, and (ii) power rationing would have minimal impact on their production schedules given that most large-sized cement companies utilise residual heat generation facilities, which in general provide 20-25% self-sufficiency for cement production. Overall, we believe large companies in central and eastern China should benefit the most as cement production in these regions could be severely affected, especially during the upcoming summer months. Hunan will be particularly affected, boding well for Anhui Conch.
Moreover, by the end of the 12th 5YP period, MIIT aims to lower (i) the coal consumption per tonne to less than 93kg, (ii) emission of particulate matters (PM) by 50% from 2009, and (iii) emission of nitrogen oxide and carbon dioxide by 25% from 2009. Again, we believe these measures will benefit big players as well to enhance the whole sector’s profitability. In 2009, RMB1bn out of the RMB40bn net profit made by the cement industry resulted from the installation of residual heat generation.
Shandong, Guangdong, Hunan and Shanxi set to be the key provinces for cement capacity elimination, boding well for CNBM and Shanshui Cement

China Cement Sector Industrials – Basic Materials Michelle Leung 25 May 2011
This document may not be distributed in or into the PRC. 17
Figure 27. New Dry Processing Capacity Growth Trend (2001-10)
-
20
40
60
80
100
2001 2002 2003 2004 2005 2006 2007 2008 2009 2010
m tonnes
-2004006008001,0001,2001,400
m tonnes
Shanxi (LHS) Zhejiang (LHS) Anhui (LHS)Shandong (LHS) Guangdong (LHS) Guangxi (LHS)Shaanxi (LHS) Xinjiang (LHS) National (RHS)
Source: Digital Cement, BOCI Research
Figure 28. New Dry Processing Capacity Ratio in China
0%10%20%30%40%50%60%70%80%90%
2001 2002 2003 2004 2005 2006 2007 2008 2009 2010
Source: Digital Cement, BOCI Research
Figure 29. Market Share Concentration Rates in China
20
30
40
50
60
70
2000 2001 2002 2003 2004 2005 2006 2007 2008 2009 2010
%
Top 10 Top 20
Source: Digital Cement, BOCI Research As of 2010, the top 20 cement enterprises’ concentration ratios in north, NE, east and south China were all over 50%, while those for the NW and SW were lower at 38% and 30%, respectively.

China Cement Sector Industrials – Basic Materials Michelle Leung 25 May 2011
This document may not be distributed in or into the PRC. 18
Worries over Slowdown in Railway Construction By the end of the 12th 5YP period, the Chinese government targets growth of at least 40% for the transportation network, and high-speed railways, highways and ports will be the major focuses. According to the NDRC, by 2015, the total length of highways should reach 100,800km, representing a 45.9% increase from the current level. The total port capacity should reach 7.8bn tonnes by 2015, representing 41.8% expansion. The total length of railways should increase from 91,000km to 120,000km, representing 32% growth, and high-speed railways should reach 45,000km in length. The total length of railways in western China should reach 50,000km.
Officials have already denied rumours that the Ministry of Railways would trim its railway construction budget this year from RMB700bn to RMB400bn. Moreover, the projects under construction would not be called to a stop. During 2010, the total investment in railways amounted to RMB709bn, with more than 30,000km under construction. In 2011, the total length of high-speed railways is expected to increase from 8,358km to 13,000km.
While we think the budget this year will not be cut, the investment in railway construction could slow after next year if the Ministry of Railways’ loss-making situation persists (MOR reported a RMB3.76bn loss in 1Q11). As such, Western China would be affected the most considering the aggressive railway development, thus threatening WCC and Sinoma the most, in our view.
Slowdown in New Project Starts in a Few Regions While we believe demand will stay strong in the near term, we also notice a decline in new project starts by 32-40% YoY during 1Q11 in several regions like SW China, NE China and northern China. We believe the negative YoY growth of FAI in new project starts for 1Q11 could be an early warning for the future fixed asset investments. This has negative implications on cement prices in the longer term. Yet, we will need a more long-term trend to confirm its validity. Meanwhile, another indicator for construction, the YoY growth in total new project starts in China, has also been falling this year since April last year as shown in the figure below.
Figure 30. China’s Number of Project Starts (by month) and Increase in Project Starts Compared to the Same Period Last Year
0
10,000
20,000
30,000
40,000
50,000
60,000
02/04
06/04
10/04
03/05
07/05
11/05
04/06
08/06
12/06
05/07
09/07
02/08
06/08
10/08
03/09
07/09
11/09
04/10
08/10
12/10
(40,000)(20,000)020,00040,00060,00080,000100,000
No. of project starts (LHS) Increase in project starts (RHS)
Source: WIND database, BOCI Research
Concentration ratio remained high throughout the past decade, and we see more room for improvement in SW China (30%)
Western China would be affected most considering the aggressive railway development, which threatens WCC and Sinoma the most in our view.
Be cautious on the slowdown in new project investment growth, which has negative implications on cement prices later next year
Negative YoY growth in number of new project starts compared with April 2010, the first drop since 2003
China Cement Sector Industrials – Basic Materials Michelle Leung 25 May 2011
This document may not be distributed in or into the PRC. 19
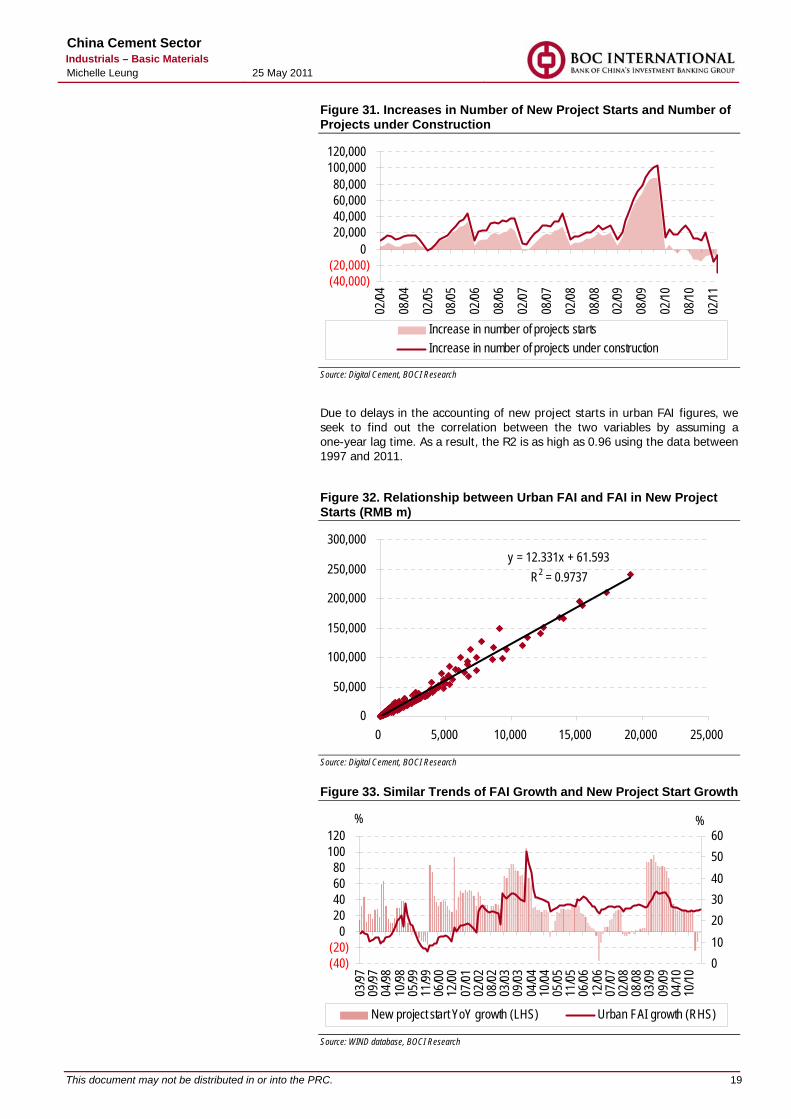
Figure 31. Increases in Number of New Project Starts and Number of Projects under Construction
(40,000)(20,000)
020,00040,00060,00080,000
100,000120,000
02/04
08/04
02/05
08/05
02/06
08/06
02/07
08/07
02/08
08/08
02/09
08/09
02/10
08/10
02/11
Increase in number of projects starts Increase in number of projects under construction
Source: Digital Cement, BOCI Research
Due to delays in the accounting of new project starts in urban FAI figures, we seek to find out the correlation between the two variables by assuming a one-year lag time. As a result, the R2 is as high as 0.96 using the data between 1997 and 2011.
Figure 32. Relationship between Urban FAI and FAI in New Project Starts (RMB m)
y = 12.331x + 61.593R2 = 0.9737
0
50,000
100,000
150,000
200,000
250,000
300,000
0 5,000 10,000 15,000 20,000 25,000
Source: Digital Cement, BOCI Research Figure 33. Similar Trends of FAI Growth and New Project Start Growth
(40)(20)
020406080
100120
03/97
09/97
04/98
10/98
05/99
11/99
06/00
12/00
07/01
02/02
08/02
03/03
09/03
04/04
10/04
05/05
11/05
06/06
12/06
07/07
02/08
08/08
03/09
09/09
04/10
10/10
%
0102030405060
%
New project start YoY growth (LHS) Urban FAI growth (RHS)
Source: WIND database, BOCI Research

China Cement Sector Industrials – Basic Materials Michelle Leung 25 May 2011
This document may not be distributed in or into the PRC. 20
Strong Momentum Remains in Eastern China In terms of new project starts, regions like eastern China still registered robust YoY growth of 44%. Specific provinces with positive growth were Gansu, Jilin, Anhui, Fujian, Shanxi and Shandong. If the number of new project starts is the leading indicator for future FAI growth and thus future cement demand, Anhui Conch and CNBM should be the safer investments given their exposure, while the weakest links would be Sichuan and Inner Mongolia. On the other hand, provinces that recorded more than 40% YoY decline in new project growth were Ningxia, Beijing, Inner Mongolia, Sichuan, Guizhou, Liaoning and Henan, where Sinoma has the largest exposure among peers. Although both Shanshui and Conch have exposure in these provinces as well, the latter’s exposure is relatively small compared to its exposure in the provinces recording high project start growth, namely Anhui and Shandong.
Figure 34. New Project Start Growth in 1Q11 by Province
-100%-80%-60%-40%-20%
0%20%40%60%80%
100%120%
N Ch
inaBe
ijing
Tianji
nHe
bei
Shan
xiInn
er M
ongo
liaNE
Chin
aLia
oning Jil
inHe
ilong
jiang
E Ch
inaSh
angh
aiJia
ngsu
Zheji
ang
Anhu
iFu
jian
Jiang
xiSh
ando
ngS
China
Hena
nHu
bei
Huna
nGu
angd
ong
Guan
gxi
Haina
nSW
Chin
aCh
ongq
ingSi
chua
nGu
izhou
Yuna
nTib
etNW
Chin
aSh
aanx
iGa
nsu
Qing
hai
Ning
xiaXi
njian
g
Source: Digital Cement, BOCI Research
Figure 35. Anhui’s FAI Growth and New Project Start Investment Growth
0%20%40%60%80%
100%120%140%
2M09
3M09
4M09
5M09
6M09
7M09
8M09
9M09
10M0
911
M09
12M0
92M
103M
104M
105M
106M
107M
108M
109M
1010
M10
11M1
012
M10
2M11
3M11
20%22%24%26%28%30%32%34%36%38%
New project start investment (LHS) FAI growth (RHS)
Source: Digital Cement, BOCI Research
Anhui accounts for over 55% of Anhui Conch’s total capacity

China Cement Sector Industrials – Basic Materials Michelle Leung 25 May 2011
This document may not be distributed in or into the PRC. 21
Figure 36. Zhejiang’s FAI Growth and New Project Start Investment Growth
-50%
0%
50%
100%
150%
200%
2M09
3M09
4M09
5M09
6M09
7M09
8M09
9M09
10M0
911
M09
12M0
92M
103M
104M
105M
106M
107M
108M
109M
1010
M10
11M1
012
M10
2M11
3M11
0%5%10%15%20%25%30%35%
New project start investment (LHS) FAI growth (RHS)
Source: Digital Cement, BOCI Research
Figure 37. Shandong’s FAI Growth and New Project Start Investment Growth
0 %
20 %
40 %
60 %
80 %
100 %
2M09
3M09
4M09
5M09
6M09
7M09
8M09
9M09
10M0
911
M09
12M0
92M
103M
104M
105M
106M
107M
108M
109M
1010
M10
11M1
012
M10
2M11
3M11
16%17%18%19%20%21%22%23%24%
New project start investment (LHS) FAI growth (RHS)
Source: Digital Cement, BOCI Research
Figure 38. Guangxi’s FAI Growth and New Project Start Investment Growth
-50%
0%
50%
100%
150%
2M09
3M09
4M09
5M09
6M09
7M09
8M09
9M09
10M0
911
M09
12M0
92M
103M
104M
105M
106M
107M
108M
109M
1010
M10
11M1
012
M10
2M11
3M11
20%25%30%35%40%45%50%55%60%
New project start investment (LHS) FAI growth (RHS)
Source: Digital Cement, BOCI Research
Zhejiang is the largest sales market to CNBM, accounting for 27% of its total capacity
Shandong accounts for more than 70% of Shanshui Cement’s total capacity and 14% of CNBM’s total capacity
Guangxi accounts for over 50% of CR cement’s total capacity and 12% of Anhui Conch’s total capacity

China Cement Sector Industrials – Basic Materials Michelle Leung 25 May 2011
This document may not be distributed in or into the PRC. 22
Figure 39. Shaanxi’s FAI Growth and New Project Start Investment Growth
-80%-60%-40%-20%
0%20%40%60%80%
2M10
3M10
4M10
5M10
6M10
7M10
8M10
9M10
10M1
0
11M1
0
12M1
0
2M11
3M11
27%28%29%30%31%32%33%34%
New project start investment (LHS) FAI growth (RHS)
Source: Digital Cement, BOCI Research
Figure 40. Summary of Positives and Negatives for Cement Sector Positives Negatives 1) Power shortage/rationing - we think it will be
more severe during summer, boding well for cement prices
Slowdown in new project starts could threaten cement demand
2) Rapid urbanisation Easing impact from the RMB4trn stimulus package
3) Demand from social housing (Budget: RMB1.3trn)
Worries over the government’s funding for infrastructure projects
4) Demand from water projects (Budget: RMB400bn/year for 10 years, doubling the budget in 11th 5YP)
National property sales (GFA) contracted by 10% YoY in April 2011 and saw 6.4% YoY growth in 4M11, a significant slowdown compared to 4M10’s 32.8% YoY growth
5) Demand from high-speed railways (Budget: RMB700bn/year and RMB3.5trn throughout 12th 5YP)
6) Demand from highways (Total budget over RMB10trn over 12th 5YP, compared to RMB7.7trn in 11th 5YP)
7) Housing FAI remained high at 34.1% in 1Q11 Source: BOCI Research
Shaanxi accounts for 100% of West China Cement’s capacity

China Cement Sector Industrials – Basic Materials Michelle Leung 25 May 2011
This document may not be distributed in or into the PRC. 23
PROVINCIAL ANALYSIS Our Favourite Regions for Cement Exposure We have created a matrix putting all our demand/ supply analyses in one table to select our favourite regions based on six criteria, categorised by (i) potential in consolidation and (ii) improving demand and supply dynamics. In conclusion, we favour eastern and southern China most. Please see the figure below for our ranking of each province.
The six criteria are:
1) % of new dry process lower than the national average of 75%
2) Clinker capacity per capita of more than 1,000kg
3) Average production per enterprise lower than the national average
4) Higher urban FAI growth than the national average
5) Higher housing FAI growth than the national average
6) Higher-than-average new project start growth

China Cement Sector Industrials – Basic Materials Michelle Leung 25 May 2011
This document may not be distributed in or into the PRC. 24
Figure 41. Matrix for Preferred Province Selection
National
Average production/ enterprise
Clinker capacity
per capita
1Q11 Cement FAI growth
(%)
1Q11 urban FAI growth
(%)
1Q11 housing FAI growth
(%)
1Q11 New project growth
(%)
Beneficiaries from social
housing
Beneficiaries from
waterway
Beneficiaries from
transportation network
N China 89 (30.8) 6.0 29.5 (31.5) Beijing 128 441 NA 11.9 14.0 (59.3) X X Tianjin 117 296 23.7 29.0 25.4 (15.2) X Hebei 103 1,093 (28.6) 26.7 59.4 (27.1) Shanxi 43 1,116 (22.4) 25.1 31.7 21.0 X X Inner Mongolia 54 1,717 (49.9) 20.5 53.2 (56.9) X NE China 75 (16.7) 11.8 29.4 (37.1) Liaoning 43 1,076 (21.2) 30.3 29.7 (48.1) X Jilin 134 762 72.1 31.4 28.1 66.2 X Heilongjiang 48 316 (44.9) 18.8 23.4 (26.1) X E China 136 7.1 16.9 34.1 119.3 Shanghai 192 74 NA (7.4) 11.3 2.7 X X Jiangsu 138 986 27.7 23.1 33.9 (0.7) X Zhejiang 136 1,388 (22.9) 26.6 34.3 20.6 Anhui 137 1,676 29.5 34.3 49.7 52.6 X X Fujian 124 1,135 40.3 32.9 52.7 38.3 Jiangxi 116 1,125 4.3 33.4 20.2 (31.4) Shandong 111 1,361 (35.5) 21.2 37.2 23.4 X S China 133 (35.6) 16.2 32.2 (23.7) Henan 128 930 (60.3) 27.9 35.7 (45.6) X Hubei 147 1,048 (47.6) 33.2 43.7 (32.7) X Hunan 70 1,138 (26.8) 31.5 34.6 (22.2) Guangdong 109 1,138 (62.8) 13.6 28.5 (3.2) X Guangxi 101 1,277 39.0 32.0 21.4 (23.8) Hainan 243 1,117 (98.7) 34.0 35.6 (35.6) X SW China 103 (30.6) 21.3 44.5 (39.7) Chongqing 119 1,649 2.2 20.0 43.4 (31.8) X Sichuan 131 1,389 (44.1) 24.3 36.0 (53.5) Guizhou 63 927 (40.9) 48.9 99.3 (53.3) X Yunnan 100 959 64.6 20.5 39.9 (8.3) X Tibet NA 840 NA 57.9 48.7 25.6 X NW China 65 (19.4) 19.6 31.8 2.4 Shaanxi 100 1,162 (27.5) 28.2 26.9 (20.2) X Gansu 64 815 (38.9) 41.6 43.3 97.4 X Qinghai 81 1,026 273.7 40.6 28.0 (18.6) X Ningxia 37 2,379 22.0 41.3 29.1 (77.7) X Xinjiang 46 1,292 (40.5) 15.4 79.4 (26.6) X National average 105 1,105 (23.5) 25.0 34.1 (12.1) * Shaded in pink - favoured provinces * Least favoured provinces - Shanghai, Ningxia, Inner Mongolia, Qinghai, Yunnan Source: Digital Cement, BOCI Research
Figure 42. Regional Scores
Average production/
enterprise
1Q11 cement FAI
growth 1Q11 urban FAI growth
1Q11 housing FAI
growth
1Q11 new project growth
Total score
N China 4 2 6 5 4 21 NE China 5 5 5 6 5 26 E China 1 6 3 2 1 13 S China 2 1 4 3 3 13 SW China 3 3 1 1 6 14 NW China 6 4 2 4 2 18 Source: Digital Cement, BOCI Research

China Cement Sector Industrials – Basic Materials Michelle Leung 25 May 2011
This document may not be distributed in or into the PRC. 25
Figure 43. Seasonality by Province (% of full-year demand) (%) National North NE Eastern Southern SW NW Jan 5.57 3.64 2.62 5.99 6.46 7.07 3.06 Feb 4.92 42.5 3.04 5.18 5.52 5.92 3.13 Mar 7.5 7.54 6.03 7.84 7.31 8.24 6.8 Apr 8.7 8.84 8.7 8.91 8.11 8.64 9.3 May 9.18 9.52 10.86 9.32 8.61 8.13 10.67 Jun 9.39 10.65 12.2 9.03 8.61 8.75 11.02 Jul 8.65 9.93 10.86 8.35 8.05 7.87 10.21 Aug 8.9 9.65 11.1 8.53 8.61 7.97 10.52 Sep 9.24 9.99 11.7 8.86 8.92 8.33 10.56 Oct 9.32 9.78 10.35 9.15 9.32 8.75 9.5 Nov 9.4 9.02 6.9 9.46 10 9.7 8.67 Dec 9.23 7.18 5.64 9.39 10.5 10.64 6.57 *Shaded in orange ‐ peak seasons; shaded in grey ‐ low seasons Source: Digital Cement, BOCI Research
Cement demand has been relatively stable throughout the year in eastern China without significant seasonal fluctuations. Approaching 2Q, more rapid ramp-up in demand should be found in NE and NW China.
Based on our matrix selection, eastern China and southern China, which both have the lowest scores in the figure above, are our most preferred regions, while NE China is our least favoured.
Figure 44. Cement Companies’ Coverage by Province
Shanshui Cement
Anhui Conch CNBM
China Resources Cement Sinoma
West China Cement
Stock code 691.HK 914.HK 3323.HK 1313.HK 1893.HK 2233.HK Eastern China Zhejiang 2.0 56.0 Jiangsu 4.8 24.0 7.0 Shanxi 1 (10m by 2011E) 2.6 Shanghai 4.0 Fujian 3.0 Shandong 48.1 28.0 Henan 13.6 N China Beijing Hebei 14.0 Liaoning 12.2 1.8 Inner Mongolia 5.2 7.0 4.1 Central China Anhui 72.7 2.0 4.0 Hunan 9.7 22.0 5.0 Jiangxi 10.6 24.0 1.0 Southern China Guangdong 13.2 13.4 7.0 Guangxi 15.7 25.4 Hainan 4.0 NW China Hubei Xinjiang 3m by 2012e 15.4 Gansu 1.6 15.2 Qinghai 1.0 Jilin 5.6 Shaanxi 2.0 2.0 12.5 Ningxia 8.8 SW China Sichuan 8.7 Heilongjiang 5.6 Chongqing 2.0 Total 66.5 150 200.6 48.4 70.5 12.5 Exposure in our favoured provinces 72% 59% 50% 42% 37% 0% *Favoured province Source: Company data, BOCI Research

China Cement Sector Industrials – Basic Materials Michelle Leung 25 May 2011
This document may not be distributed in or into the PRC. 26
PEER COMPARISONS In the figures below, we rank the cement companies using our 2010-13E CAGR in sales volume, tonnage gross profit and net profit. We rank each dynamic from 1 to 5 and the company with lowest score is the most preferred.
Figure 45. Sales Volume Forecasts Sales volume 2009 2010 2011E 2012E 2103E CAGR Ranking Anhui Conch 118 137 170 212 235 20% 3 CNBM 113 153 202 238 257 19% 4 Shanshui Cement 38 49 60 66 74 15% 5 China Resources Cement 19 33 50 64 69 28% 1 West China Cement 5 10 14 16 18 22% 2 Source: Company data, BOCI Research
Figure 46. Cement Capacity Forecasts Cement capacity 2009 2010 2011E 2012E 2103E CAGR Ranking Anhui Conch 110 150 177 210 235 16% 3 CNBM 160 204 236 266 286 12% 5 Shanshui Cement 48 67 82 90 100 14% 4 China Resources Cement 29 48 62 78 84 21% 2 West China Cement 8.5 12.5 17 18 24 24% 1 Source: Company data, BOCI Research
Figure 47. Gross Profit per Tonne
Gross profit per tonne 2007 2008 2009 2010E 2011E 2012E 2013E CAGR
(2010-13E) Ranking Anhui Conch 66 58 60 80 116 121 128 17% 3 CNBM 29 35 35 56 110 116 125 31% 1 Shanshui Cement 36 52 47 51 94 95 100 25% 2 China Resources Cement 70 62 79 106 114 122 129 7% 4 West China Cement 73 88 127 118 112 115 122 1% 5 Source: Company data, BOCI Research
Figure 48. Gross Profit per Tonne Trend
0
50
100
150
2006 2007 2008 2009 2010 2011E
(RMB/tonne)
Anhui Conch CNBMShanshui Cement China Resources CementWest China Cement
Source: Company data, BOCI Research

China Cement Sector Industrials – Basic Materials Michelle Leung 25 May 2011
This document may not be distributed in or into the PRC. 27
Figure 49. Net Profit Growth Forecasts Net profit growth 2010 2011 2012 2013 CAGR Ranking Anhui Conch 6,163 12,570 16,209 19,124 46% 2 CNBM 3,742 6,349 8,229 9,405 36% 4 Shanshui Cement 979 2,707 2,976 3,531 53% 1 China Resources Cement 2,041 3,697 4,983 5,719 41% 3 West China Cement 998 1,128 1,302 1,607 17% 5 Source: Company data, BOCI Research
Figure 50. Comparison of Companies’ Downstream Exposure Downstream exposure Real estate Infrastructure Rural area Distributors Ready mix Anhui Conch 33% 40% 27% CNBM 15% 40% 45% Shanshui Cement 33% 20% 18% 28% China Resources Cement 20% 50% 30% West China Cement 0% 44% 10% 39% 7% Whole sector 30% 40% 30% Source: Company data, BOCI Research
Figure 51. Market Share Comparisons (based on 2010 cement capacities) Eastern China Central China Southern China
0.0%
5.0%
10.0%
15.0%Anhui Conch
CNBM
Shanshui Cement
China ResourcesCement
West ChinaCement
Asia Cement
0.0%
5.0%
10.0%
15.0%Anhui Conch
CNBM
ShanshuiCement
China ResourcesCement
West ChinaCement
Asia Cement
0.0%
10.0%
20.0%
30.0%Anhui Conch
ChinaResources
Cement
CNBMShanshuiCement
Asia Cement
SW and NW China Northern China
0.0%0.5%1.0%1.5%2.0%Anhui Conch
CNBM
ShanshuiCement
China ResourcesCement
West ChinaCement
Asia Cement
0.0%1.0%2.0%3.0%4.0%Anhui Conch
CNBM
Shanshui Cement
China ResourcesCement
West ChinaCement
Asia Cement
Source: Company data, BOCI Research

China Cement Sector Industrials – Basic Materials Michelle Leung 25 May 2011
This document may not be distributed in or into the PRC. 28
Figure 52. Valuation Comparison
Company Stock code Ccy Price Mkt cap P/E (x)
P/B (x)
ROE (%)
EV/EBITDA (x)
2010 2011E 2012E 2010 2011E 2012E 2010 2010 2011E 2012E Anhui Conch 914 HK HK$ 31.30 152,249.00 15.0 11.0 8.6 4.0 3.1 2.5 17.8 15.1 7.7 5.8 BBMG Corp 2009 HK HK$ 10.56 63,017.28 12.5 8.9 7.0 1.9 1.7 1.4 15.8 13.9 8.2 6.8 CNBM 3323 HK HK$ 14.58 78,718.00 15.7 10.4 8.0 3.4 2.6 2.1 20.9 13.3 7.9 6.5 CR Cement 1313 HK HK$ 7.12 46,417.10 22.7 12.5 9.5 3.3 2.6 2.1 14.5 17.8 10.3 7.7 China National Material 1893 HK HK$ 6.94 24,785.96 17.0 12.4 10.8 2.2 1.8 1.5 14.1 6.2 5.3 4.3 Shanshui Cement 691 HK HK$ 7.83 22,048.89 17.4 9.4 9.5 3.1 2.5 2.1 17.9 10.2 6.3 5.2 West China Cement 2233 HK HK$ 3.11 13,257.93 10.4 9.7 8.6 3.2 2.4 1.9 37.3 9.4 6.2 5.1 Asia Cement (China) 743 HK HK$ 5.64 8,777.25 16.9 7.2 6.2 1.0 0.9 0.8 6.1 9.7 5.9 5.2 HK listed peers 17.0 10.9 9.4 3.2 2.5 2.0 18.0 11.8 7.4 6.3 Source: Bloomberg, BOCI Research
Figure 53. Scorecard for Cement Companies
Anhui Conch CNBM Shanshui
Cement CRC West China
Cement Sales volume growth 3 4 5 1 2 GP/tonne 3 1 2 4 5 Net profit growth 2 4 1 3 5 Market share 1 2 4 3 5 Valuation 3 2 1 5 4 Total score 12 13 13 16 21 *Lowest score is most preferred Source: BOCI Research
According to our scorecard, we rank Anhui Conch our top pick given its outstanding performance in every aspect. We see buying opportunities emerging again after the recent share price correction.
While Shanshui Cement and CNBM score the same, we think CNBM is more a long term buy given its attractive valuation and leading position in China. We also like its large exposure in Eastern China. For Shanshui Cement, trading at the lowest valuation among cement plays, we think the street has been underestimated its strong earnings growth. However, some discount should be imposed given its low liquidity.
Figure 54. Our Ranking of Cement Stocks Company 1 Anhui Conch 2 CNBM 3 Shanshui Cement 4 China Resources Cement 5 West China Cement Source: BOCI Research

BOCI research is available electronically on Bloomberg (BOCR <go>), thomsonreuters.com and www.bociresearch.com.
Initiating Coverage 25 May 2011
30% �side BUY Target Price: HK$40.7030.03 914 HK Price: HK$ 31.30 TP Basis: EV/tonne, P/E, EV/EBITDA Sector Rating: OVERWEIGHT
Where are we Different? � Our 2010-13 earnings estimates are 10-14% above consensus as we think ASP has been underestimated.
� We compare Conch’s cost trends with peers, and believe Conch will sustain its cost advantage
Key Highlights of this Report � Comparisons showing the company’s efficient cost control.
Figures 8-9
� Cement demand driven by social housing in Conch’s major markets.
Figure 10
� Earnings sensitivity to coal, cement prices and sales volume.
Figure 20
Key BOCI Event Analyst marketing in Hong Kong 26-27 May
Trading Summary H - Anhui Conch (914 HK)
12
17
22
27
32
37
42
81
108
134
161
188
214
241Price Close Relative to HSCEI (RHS)
Source: Bloomberg.
10
20
30
40
May
-10 Ju
l-10
Sep
-10 Nov
-10 Ja
n-11 Mar
-11
May
-11
Vol
th
YTD 1M 3M 12M Absolute (%) 28.8 -13.9 34.5 99.8 Relative to HSCEI (%) 28.9 -6.7 29.3 87
Shares outstanding 5,300
Free float (%) 0.0
Market cap. (HK$ m) 152,249
Daily turnover (3M avg.) 12.50
Net debt / Equity (%) 18.6
Major shareholder (%)
Anhui Conch Holdings Co Ltd 36.2
BOCI Research Limited China: Industrials
Michelle Leung (852) 3988 6431 [email protected]
Investment Summary
12-09 12-10 12-11E 12-12E 12-13E
Total turnover (RMB m) 24,998 34,508 53,879 71,859 84,430
Revenue growth 3.2% 38.0% 56.1% 33.4% 17.5%
Net profit (RMB m) 3,506 6,163 12,570 16,209 19,124
Fully diluted EPS (RMB) 2.03 1.74 2.37 3.06 3.61
FD P/E (x) 12.87 14.99 11.03 8.55 7.25
FDEPS growth 22.9% (14.2%) 36.0% 29.0% 18.0%
Previous EPS (RMB) NA NA NA NA NA
Consensus EPS (RMB) 2.16 2.68 3.22
EPS vs Consensus 9.6% 13.9% 12.2%
Recurrent CPS (RMB) 3.98 1.13 3.22 3.71 4.36
P/CF (x) 6.57 23.06 8.11 7.04 6.00
EV/EBITDA (x) 8.51 15.08 7.68 5.84 4.76
Dividend/share (RMB) 0.350 0.233 0.474 0.612 0.722
Dividend yield 1.34% 0.89% 1.81% 2.34% 2.76%
ROE 13.3% 19.6% 31.8% 30.1% 27.0% Source: Company data, Bloomberg data, BOCI Research estimates. Closing prices are as of 18 April 2011.
Anhui Conch Attractive risk/reward with Anhui exposure We initiate coverage on Anhui Conch’s H shares with a BUY rating and a target price of HK$40.70. As the second largest cement producer in China and one of the country’s most cost-efficient producers, we believe Conch should trade at a premium to peers. Moreover, we see the company as one of the biggest beneficiaries of social housing construction projects going forward. Despite its large size, we expect its net profit to register a 46% CAGR in 2010-13 and believe it will become one of the fastest growing companies in the cement universe. Trading at only 11x 2011 P/E vs. its mid-cycle P/E of 15.6x, we think now is a good time to BUY.
46% Earnings CAGR in 2010-13E, 10-14% above Consens us � Conch should continue to surprise the market with robust earnings growth after
1Q11. While our 2011-13 earnings estimates are 10-14% higher than consensus, we think this is reasonable given that 1Q11 already accounted for 18% of our full-year forecast and that the first quarters accounted for 9-17% of full-year earnings in 2007-10.
Attractive Risk Reward � Despite its large size, we expect strong earnings growth going forward. We like
the company’s dominant position in Anhui, which has consistently delivered robust FAI, housing FAI and newly started project growth.
� Conch should benefit greatly from social housing developments.
� Given its efficient cost management, its high margin is more likely to remain secure even if cement prices correct.
Attractive Valuation � Trading at only 11x 2011 P/E and about US$ 100 EV/tonne, Conch’s valuation is at
the low end of its historical range.
Valuation Methodology � To value Anhui Conch, we use a blended methodology of EV/tonne, EV/EBITDA
and P/E. Using the industry average with a 10% premium, we value Conch based on EV/tonne of US$110, 2012 P/E of 10.3x and 2012 EV/EBITDA of 6.9x. Taking the average, we derive our target price of HK$40.70 (representing 14.3x 2011 P/E), which is in line with its mid-cycle P/E valuation.

Anhui Conch Price: HK$31.30 BUY Target Price: HK$40.70 Michelle Leung 25 May 2011
This document may not be distributed in or into the PRC. 30
VALUATION While our estimates for Conch’s 2011-13 earnings are 10-14% above consensus, we think our numbers are reasonable as 1Q11 earnings only imply 18% of our full-year estimate, versus the 9-17% of full-year earnings in 2007-10. Anhui Conch is our top pick in the sector given its high market share in its existing markets, solid cost control and quality management. While we expect the company’s rapid growth to persist, we think its risk-return profile is the most attractive among peers. We like the company’s dominant position in Anhui, which is among our most favoured provinces in terms of consistently high FAI growth, housing FAI growth and newly started project growth. Moreover, we think Conch will be one of the biggest beneficiaries of social housing projects given its sales market layout and high exposure to real estate (33% in 2010). In view of its strong financials and proven execution ability, we believe the company should deliver promising earnings growth. Given our belief that the street has underestimated its earnings, upgrades may be imminent, which would provide a further share price catalyst. Trading at only 11x 2011 P/E and around US$100 EV/tonne, we now see a good buying opportunity.
To value Anhui Conch, we employ a blended methodology of EV/tonne, EV/EBITDA and P/E. Using the industry average with a 10% premium, we value Conch based on EV/tonne of US$110, 2012 EV/EBITDA of 6.9x and 2012 P/E of 10.3x. Taking the average, we derive our target price of HK$40.70 (representing 14.3x 2011 P/E), which is still in line with Conch’s mid-cycle P/E. We initiate coverage with a BUY rating.
Figure 1. Valuation Table
HK peer average Discount Target multiple Segmental value
(HK$ m) EV/tonne (US$/tonne) 100 Bull case 20% 120 184,200 Base case 10% 110 167,672 Bear case 0% 100 151,144 2012 EV/EBITDA 6.3 Bull case 20% 7.56 206,827 Base case 10% 6.93 188,413 Bear case -10% 5.67 151,586 2012 P/E 9.4 Bull case 30% 12.22 231,942 Base case 10% 10.34 196,258 Bear case -20% 7.52 142,733 Target price Bull case 45.9 Base case 40.7 Bear case 32.8 Source: Company data, BOCI Research

Anhui Conch Price: HK$31.30 BUY Target Price: HK$40.70 Michelle Leung 25 May 2011
This document may not be distributed in or into the PRC. 31
SWOT ANALYSIS Figure 2. SWOT Analysis
Strengths Weaknesses The second largest cement producer
in China after CNBM. Leading position should make the
company one of the major beneficiaries under the industry consolidation theme
Dominant position in Anhui Strong financials with low leverage
and abundant cash flow Quality management
Approximately 25% exposure in property market
Energy cost accounts for almost 70% of total cost, higher than the industry average of 65%
Opportunities Threats Cement price growth potential in SE
China New development in SW China
should benefit the company under the Western China Development Plan
Adverse impact from property market should be mitigated by the aggressive social housing construction plan in Anhui
Any slowdown in government spending or any tightening policies could aversely affect cement demand
Big threat from high coal prices and power costs
Loss of market share to other aggressive cement producers
Source: BOCI Research estimates
Figure 3. Capacity by Region
2010 2011E
Central China30%
E China38%
Exports6%
W China5%
S China21%
S China20%
W China12%
Exports9% E China
31%
Central China28%
Source: Company data, BOCI Research

Anhui Conch Price: HK$31.30 BUY Target Price: HK$40.70 Michelle Leung 25 May 2011
This document may not be distributed in or into the PRC. 32
Figure 4. Sales Exposure by Segment
2009 2010
Rural areas33%
Property22%
Infrastructure45% Infrastructure
40%
Property33%
Rural areas27%
Source: Company data, BOCI Research
Figure 5. Conch’s Market Share in China is Expanding
2%
3%
4%
5%
6%
7%
8%
9%
2005 2006 2007 2008 2009 2010 2011E 2012E 2013E
Source: Company data, BOCI Research
Promising Earnings CAGR of 46% According to company guidance, Conch’s 2011 clinker and cement capacity should grow by 24.5% YoY (+31.8m tonnes) and 17.9% YoY (+26.9m tonnes) to 162m tonnes and 177m tonnes, respectively. We think this is achievable given the company’s strong track record in capacity expansion (around 20% CAGR) during 2005-10. We assume the its cement capacity utilisation will remain at around 80% in 2011, implying sales volume of 170m tonnes and growth of 24% YoY. During 2011-13, the company should continue to gain market share by adding 20-30m tonnes of capacity each year.
In terms of geographical exposure, sales in the western China region grew at the fastest rate in 2010 (up 293% YoY to 7.45m tonnes), while that in central China, southern China and the eastern China rose by 21%, 7% and 6%, to 41.7m tonnes, 28.7m tonnes and 51.2m tonnes, respectively.
Conch’s ASP rose sharply in 4Q10 (up 32% QoQ and 49%YoY) to RMB314/tonne, the historical peak. Although the low season in 1Q11 resulted in an 11% QoQ decline in ASP, we expect it to pick up by 13% QoQ to RMB316/tonne in 2Q11. We expect full-year ASP of RMB317/tonne, representing 28% YoY growth. By April, ASP had already hit RMB310/tonne, RMB30 higher than in 1Q11. Gross profit per tonne also increased to RMB140, RMB16 higher than in 1Q11.

Anhui Conch Price: HK$31.30 BUY Target Price: HK$40.70 Michelle Leung 25 May 2011
This document may not be distributed in or into the PRC. 33
Figure 6. Conch’s Capacity Expansion and YoY Growth
020406080
100120140160180200220240
2006 2007 2008 2009 2010 2011E 2012E 2013E
m tonnes
0%5%10%15%20%25%30%35%40%
Cement capacity (LHS) Clinker capacity (LHS)Cement YoY (RHS) Clinker YoY (RHS)
Source: Company data, BOCI Research estimates
Consistently Low-cost Cement Producer Anhui Conch has long been the lowest unit-cost cement producer among its peers with costs only increasing at a 2.6% CAGR during 2005-10. Coal has always been the largest component, accounting for approximately 47% of total costs in 2010 (power: 20%). The efficient cost control stems from the steep reduction in coal consumption for cement production, which fell from over 130kg/tonne in 2007 to only around 108kg/tonne last year. As such, despite the coal price increase of 9.1% CAGR in 2007-10, its total unit cost only rose by 4.7% CAGR in the period. Looking forward, we believe the consumption per tonne should continue to decline.
In addition to the bulk purchase discount on raw materials and coal, the increase in residual heat installed capacity has effectively lowered the overall production cost as well. This company will continue to increase its residual heat installed capacity by adding approximately 166MW in 2011, a 4.6% increase over last year.
Figure 7. Comparisons of Conch’s Sales Market Coal Prices vs. National Average
0
200
400
600
800
1,000
1,200
Zhejiang Jiangsu Hunan Anhui Guangzhou Sichuan Xinjiang
Rmb/tonne
Coal price by province National average coal price
Source: Sxcoal.com, BOCI Research

Anhui Conch Price: HK$31.30 BUY Target Price: HK$40.70 Michelle Leung 25 May 2011
This document may not be distributed in or into the PRC. 34
Figure 8. Conch has consistently been one of the Lowest-cost Cement Producers in our Coverage Universe
0
50
100
150
200
250
300
2007 2008 2009 2010 2011E 2012E 2013E
Rmb/tonne
Conch CNBM Shanshui CR Cement WCC
Source: Company data, BOCI Research estimates
Figure 9. Comparison of Cement Production Cost CAGRs for 2007-10
0%
2%
4%
6%
8%
10%
12%
Conch CNBM Shanshui CR Cement WCC
Source: Company data, BOCI Research estimates
Favorable Exposure in Anhui Province Conch has considerable exposure in the property sector (33% of total sales in 2010 compared with only 22% in 2009), which we believe is a result of benefiting from the robust demands from social housing. Meanwhile, commodity housing construction remained robust as reflected by the high housing FAI growth of 34% in 1Q11. Within this, Anhui, Guangxi, Guangdong and Jiangxi (contributing roughly 78% of Conch’s total sales volume in 2010) recorded housing FAI growth of 20-50% YoY in 1Q11. Anhui alone reported 49.7% YoY growth in housing FAI growth during the quarter.
While investors worry whether its large property exposure will mean higher risk should the market slump, our view is that social housing construction is likely to offset the slowdown in commodity housing projects. As calculated in Figure 21 of our sector report, we believe that if the social housing achievement rate exceeds 70% this year and 50% next year, it could offset a 30% fall in commodity housing GFA starts each year.
Anhui Conch Price: HK$31.30 BUY Target Price: HK$40.70 Michelle Leung 25 May 2011
This document may not be distributed in or into the PRC. 35
Figure 10. Cement Demand Derived from Social Housing in Conch’s Major Markets
2010
(m units) 2011 target
(m units)
YoY growth
(%) % of total
(A) Potential cement
demands driven by
social housing (mt)
(B) Potential Cement demand Incremental in
2011 (mt)
Incremental cement demand growth in 2011
driven by social housing (= B/C) (%)
Actual cement demand in 2010
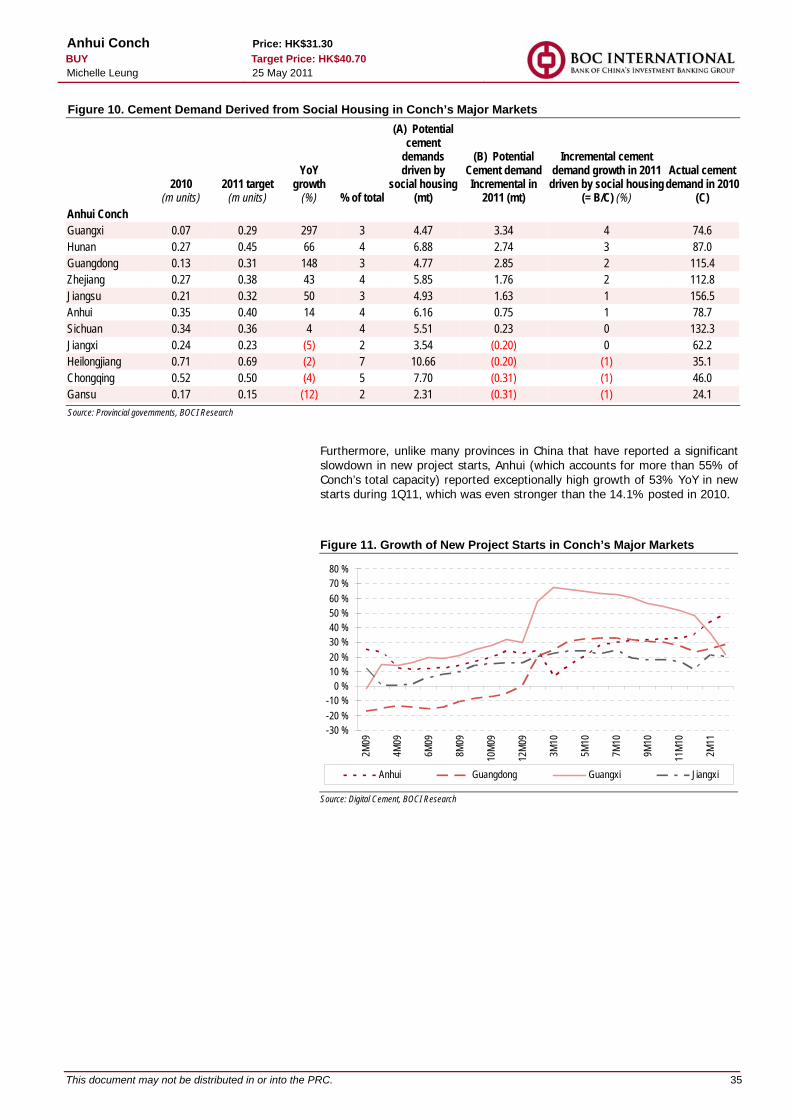
(C) Anhui Conch Guangxi 0.07 0.29 297 3 4.47 3.34 4 74.6 Hunan 0.27 0.45 66 4 6.88 2.74 3 87.0 Guangdong 0.13 0.31 148 3 4.77 2.85 2 115.4 Zhejiang 0.27 0.38 43 4 5.85 1.76 2 112.8 Jiangsu 0.21 0.32 50 3 4.93 1.63 1 156.5 Anhui 0.35 0.40 14 4 6.16 0.75 1 78.7 Sichuan 0.34 0.36 4 4 5.51 0.23 0 132.3 Jiangxi 0.24 0.23 (5) 2 3.54 (0.20) 0 62.2 Heilongjiang 0.71 0.69 (2) 7 10.66 (0.20) (1) 35.1 Chongqing 0.52 0.50 (4) 5 7.70 (0.31) (1) 46.0 Gansu 0.17 0.15 (12) 2 2.31 (0.31) (1) 24.1 Source: Provincial governments, BOCI Research
Furthermore, unlike many provinces in China that have reported a significant slowdown in new project starts, Anhui (which accounts for more than 55% of Conch’s total capacity) reported exceptionally high growth of 53% YoY in new starts during 1Q11, which was even stronger than the 14.1% posted in 2010.
Figure 11. Growth of New Project Starts in Conch’s Major Markets
-30 %-20 %-10 %
0 %10 %20 %30 %40 %50 %60 %70 %80 %
2M09
4M09
6M09
8M09
10M0
9
12M0
9
3M10
5M10
7M10
9M10
11M1
0
2M11
Anhui Guangdong Guangxi Jiangxi
Source: Digital Cement, BOCI Research

Anhui Conch Price: HK$31.30 BUY Target Price: HK$40.70 Michelle Leung 25 May 2011
This document may not be distributed in or into the PRC. 36
Figure 12. Growth of New Project Starts in Conch’s Major Markets
-60 %-40 %-20 %
0 %20 %40 %60 %80 %
100 %120 %140 %
12M0
9
2M10
3M10
4M10
5M10
6M10
7M10
8M10
9M10
10M1
0
11M1
0
12M1
0
2M11
3M11
Anhui Guangdong Guangxi
Source: Digital Cement, BOCI Research
Figure 13. FAI Growth in Conch’s Major Markets
0 %
10 %
20 %
30 %
40 %
50 %
60 %
2M09
4M09
6M09
8M09
10M0
9
12M0
9
3M10
5M10
7M10
9M10
11M1
0
2M11
Anhui Guangdong Guangxi Jiangxi
Source: Digital Cement, BOCI Research

Anhui Conch Price: HK$31.30 BUY Target Price: HK$40.70 Michelle Leung 25 May 2011
This document may not be distributed in or into the PRC. 37
FINANCIALS Revenue There is a distinct seasonal pattern in Conch’s sales volume (as shown in the figure below) leading to a clear uptrend throughout the year. Having said that, the first quarter is always the slow season for the cement sector, usually accounting for a mere 17-20% of full-year revenue. Conch’s 1Q11 revenue accounted for 17% of our full-year estimate.
Figure 14. Conch’s Sales Volume by Quarter
05
10152025303540
1Q 2Q 3Q 4Q
(m tonnes)
2008 2009 2010
Source: Company data, BOCI Research
Cost Breakdown Coal has always been Conch’s largest cost component, consistently making up more than 40% of total cost per tonne. Thanks to the higher efficiency, coal consumption per tonne has been lowered from 130kg/tonne in 2007 to only around 108kg/tonne, and by end-2015, we believe coal consumption could be lowered to 92kg if the government’s target is followed.
Figure 15. Breakdown of Conch’s Production Cost in 2010
Coal47%
Power20%
Raw materials14%
Labour2%
Manufacturing cost2%
Depreciation15%
Source: Company data, BOCI Research

Anhui Conch Price: HK$31.30 BUY Target Price: HK$40.70 Michelle Leung 25 May 2011
This document may not be distributed in or into the PRC. 38
Figure 16. Conch’s Production Cost per Tonne
0
50
100
150
200
250
1Q 2Q 3Q 4Q
RMB/tonne
2008 2009 2010 2011
Source: Company data, BOCI Research
Figure 17. Conch’s Gross Profit per Tonne and ASP Comparison
60 80131 137 146
209248
317 339 359
050
100150200250300350400
2009 2010 2011E 2012E 2013E
RMB/tonne
0
10
20
30
40
50
60
70
GP/tonne ASP GP/t YoY
Source: Company data, BOCI Research
Figure 18. Conch’s Free Cash Flow Turning Positive
(8,000)(6,000)(4,000)(2,000)
02,0004,0006,0008,000
10,00012,000
2008 2009 2010 2011E 2012E 2013E
RMB m
Free cash flow to firm Free cash flow to equity
Source: Company data, BOCI Research

Anhui Conch Price: HK$31.30 BUY Target Price: HK$40.70 Michelle Leung 25 May 2011
This document may not be distributed in or into the PRC. 39
Figure 19. Conch’s Improvement in ROE due to Higher Profitability
0.10
0.15
0.20
0.25
0.30
0.35
2008 2009 2010 2011E 2012E
(% )
Source: Company data, BOCI Research
Low Gearing As of March 2011, Conch had RMB3.07bn in cash, with total loans up slightly by 2% in 1Q11 to RMB13.27bn. Net gearing dropped from 28.8% in 4Q10 to 26.4% in 1Q11, very low compared with peers. The relatively low gearing should last even after the recent approval of the RMB9.5bn bond issuance. Looking forward, we estimate yearly capex of around RMB12-13bn, which should be totally covered by its operating cash inflow amounting to RMB17bn-23bn over the next three years, according to our estimates.

Anhui Conch Price: HK$31.30 BUY Target Price: HK$40.70 Michelle Leung 25 May 2011
This document may not be distributed in or into the PRC. 40
KEY RISKS Property slump. While the property sector accounts for more than 33% of the company’s total sales, any delay in social housing projects or significant slowdown in commodity housing demand could lead to undesirable impacts on earnings. Having said that, we believe its sales exposure can be rather flexible depending on downstream demand.
Resumption of new production line approvals. Any change in the policy (effective since September 2009) that stipulates no new cement production lines to be built could easily trigger oversupply once again. However, we do not believe the government will allow new lines to be built in the near term, at least until all outdated capacity is eliminated and the market concentration rate rises. We believe policies should remain favourable to large players.
Price caps. Since cement prices have been rising substantially since 4Q10, some provinces like Fujian and Hainan imposed price caps last year. However, we do not expect a nationwide rollout as we believe cement prices are still low in general. We reckon that the regions with higher risk of potential price caps are Xinjiang and Tibet as the P.O. 42.5 cement prices in both places have reached RMB600/tonne.

Anhui Conch Price: HK$31.30 BUY Target Price: HK$40.70 Michelle Leung 25 May 2011
This document may not be distributed in or into the PRC. 41
SENSITIVITY ANALYSIS Based on our sensitivity analysis, ASP appears to be the most earnings-sensitive variable, followed by coal prices and sales volume. Every 10% increase in ASP would result in a net profit boost of approximately 29%, while every 10% increase in the coal price would lead to a 9% decline in earnings, assuming no other changes.
Figure 20. 2011 EPS Sensitivity Analysis EPS impact 10% increase in coal price -9% 10% increase in cement ASP +29% 10% increase in sales volume +10% Source: BOCI Research estimates

Anhui Conch Price: HK$31.30 BUY Target Price: HK$40.70 Michelle Leung 25 May 2011
This document may not be distributed in or into the PRC. 42
COMPANY BACKGROUND Anhui Conch, a state-owned enterprise, is the second largest cement producer in China after CNBM in terms of production capacity. As of 2010, the company had a capacity of 150m tpa, equivalent to a market share of approximately 7.7% in China. Conch was listed on the Hong Kong Stock Exchange in September 1997 and the Shanghai Stock Exchange in February 2002 (600585 CH). Its parent company, Anhui Conch Group, has a 35.7% stake in the company. The company’s business scope covers the manufacture and sales of cement and clinker under the brand name Conch.
Conch’s markets fall in a “T” shape, with Anhui at the intersection. Western China (Sichuan, Chongqing and Gansu), central China (Anhui, Jiangxi and Hunan) and eastern China (Jiangsu, Zhejiang, Fujian and Shanghai) form the top while southern China (Guangdong and Guangxi) form the bottom. While maintaining its leading position in its existing markets, the company has been consolidating its presence in new markets through mergers and acquisitions.
Figure 21. Company Shareholding Structure
State-owned Assets Supervision and Administration Commission of Anhui Province
Anhui Province Investment Group Limited
Anhui Conch Holdings Company Limited
Anhui Conch Cement Company Limited
100%
51%
35.7%
State-owned Assets Supervision and Administration Commission of Anhui Province
Anhui Province Investment Group Limited
Anhui Conch Holdings Company Limited
Anhui Conch Cement Company Limited
100%
51%
35.7%
Source: Company data, BOCI Research
Figure 22. Conch still Trading at Low End of P/E Range
0
10
20
30
40
50
60
01/00
07/00
01/01
07/01
01/02
07/02
01/03
07/03
01/04
07/04
01/05
07/05
01/06
07/06
01/07
07/07
01/08
07/08
01/09
07/09
01/10
07/10
01/11
P/E Average Avg + 1 SD Avg -1 SD
(x)
Source: Bloomberg, BOCI Research

This document may not be distributed in or into the PRC. 43
Income Statement (RMB m)12-09 12-10 12-11E 12-12E 12-13E
Total turnover 24,998 34,508 55,248 72,997 85,767 Cost of sales (17,971) (23,566) (32,701) (44,210) (51,991) Total operating costs (2,431) (2,841) (5,298) (7,219) (8,482) Operating EBITDA 6,201 10,066 19,680 24,503 28,729 Deprec. and amort. (1,605) (1,966) (2,431) (2,935) (3,435) Operating EBIT 4,596 8,101 17,249 21,568 25,294 Net interest income (451) (514) (521) (587) (606) Exchange gains - - - - - Other recurring income 331 502 773 876 1,029 Associates' profit (1) 27 30 36 43 Exceptional income 34 - - - - Pre-tax profit 4,508 8,115 17,531 21,893 25,761 Taxation (882) (1,770) (4,350) (5,432) (6,392) Minority interests (121) (182) (378) (472) (555) Preferred dividends - - - - - Net profit 3,506 6,163 12,804 15,990 18,814 Recurring net profit 3,479 6,163 12,804 15,990 18,814 Per Share Values (RMB)
12-09 12-10 12-11E 12-12E 12-13EEarnings per share 1.98 1.16 2.37 3.06 3.61 Dividend/share 0.35 0.23 0.47 0.61 0.72 Book value per share 16.0 6.5 8.4 11.9 14.8 Tangible BVPS 15.7 6.4 8.4 11.9 14.8 Net cash/(debt) per share (3.4) (2.2) (1.6) (0.8) 0.4 Balance Sheet (RMB m)
12-09 12-10 12-11E 12-12E 12-13ETotal cash and equivalents 3,627 2,736 7,160 11,183 17,942 Accounts receivable 3,030 6,404 10,252 13,546 15,915 Inventories 2,172 2,493 3,992 5,274 6,196 Other current assets 1,679 1,867 2,778 3,563 4,128 Total current assets 10,509 13,500 24,181 33,566 44,182 Net fixed assets 31,526 39,119 48,358 63,543 72,732 Total investments 2,825 4,778 4,082 5,226 5,478 Intangible assets 493 798 227 220 214 Other assets 1,651 2,071 2,071 2,071 2,071 Total long-term assets 36,495 46,765 54,737 71,059 80,495 Total assets 47,004 60,264 78,918 104,625 124,677 Trade creditor 4,275 4,002 10,252 13,546 15,915 Short-term debt 4,183 3,172 4,706 4,706 4,706 Other current liabilities 3,616 5,904 6,800 10,343 12,207 Total current liabilities 12,074 13,077 21,758 28,594 32,828 Total long-term debt 5,394 10,971 10,938 10,938 10,938 Other liabilities 411 476 476 476 476 Shareholders' equity 28,287 34,486 44,729 63,127 78,388 Minority interests 536 620 998 1,470 2,025 Total liabilities & equity 47,004 60,264 78,918 104,625 124,677 Growth
12-09 12-10 12-11E 12-12E 12-13ERevenue growth 3.2% 38.0% 60.1% 32.1% 17.5%Operating EBITDA growth 21.1% 62.3% 95.5% 24.5% 17.3%Operating EBIT growth 23.7% 76.3% 112.9% 25.0% 17.3%Pretax profit growth 37.9% 80.0% 116.0% 24.9% 17.7%Net profit growth 34.5% 75.8% 107.7% 24.9% 17.7% Source: Company data, Bloomberg data, BOCI Research estimates
Underpinned by 20% sales volume CAGR and 13% ASP CAGR
Anhui Conch Price: HK$31.30 BUY Target Price: HK$40.70 Michelle Leung 25 May 2011

This document may not be distributed in or into the PRC. 44
Cash-flow Statement (RMB m)12-09 12-10 12-11E 12-12E 12-13E
Pre-tax profit 4,508 8,115 17,211 22,194 26,185 Depreciation 1,605 1,966 2,431 2,935 3,435 Goodwill & other amort. - - - - - Net interest 451 514 521 587 606 Change in working capital 1,703 (1,867) 1,083 1,293 120 Tax paid (882) (1,770) (4,270) (5,507) (6,497) Other operating cash flow (358) (920) 141 (1,790) (714) Operating cash flow 7,029 6,010 17,087 19,676 23,092 Capex (8,000) (9,300) (12,000) (13,000) (13,000) Cash flow from disposals 160 202 248 307 370 Acquisition of subsidiaries - - - - - Others 27 (1,244) 0 0 (0) Cash flow from investing (7,813) (10,341) (11,752) (12,693) (12,630) Shares repurchased - - - - - Debt issuedProceeds from issue of shares - - - - - Interest received - - - - - Dividends paid (618) (1,233) (2,514) (3,242) (3,825) Interest paid - - - - - Other cash flow from funding (1,776) 4,680 1,601 282 - Cash flow from financing (2,395) 3,447 (913) (2,960) (3,825) Total cash generated (3,178) (884) 4,423 4,023 6,637 Free cash flow to firm (784) (4,331) 5,335 6,983 10,462 Free cash flow to equity (784) (4,331) 5,335 6,983 10,462 Key Ratios
12-09 12-10 12-11E 12-12E 12-13EProfitabilityEBITDA margin 24.8% 29.2% 36.2% 34.7% 34.7%EBIT margin 18.4% 23.5% 31.7% 30.7% 30.7%Pre-tax margin 18.0% 23.5% 31.9% 30.9% 31.0%Net profit margin 14.0% 17.9% 23.3% 22.6% 22.7%LiquidityCurrent ratio 0.9 1.0 1.1 1.2 1.4 Interest coverage ratio 10.2 15.8 32.7 37.5 42.7 Net debt to equity 21% 32% 19% 7% Net cashQuick ratio 0.7 0.8 0.9 1.0 1.2 ValuationP/E (x) 13.2 22.5 11.0 8.6 7.2 Core P/E (x) 13.3 22.5 11.0 8.6 7.2 P/B (x) 1.6 4.0 3.1 2.2 1.8 P/CF (x) 6.6 23.1 8.1 7.0 6.0 EV/EBITDA (x) 8.5 15.1 7.7 5.8 4.8 Activity ratiosInventory days 44.1 38.6 44.9 44.5 44.4 Accounts receivables days 44.2 67.7 67.7 67.9 67.7 Accounts payables days 86.8 62.0 115.3 114.2 114.0 ReturnsDividend payout ratio 17.6% 20.0% 20.0% 20.0% 20.0%ROE 13.3% 19.6% 31.8% 30.1% 27.0%ROAA 7.8% 11.5% 18.1% 17.7% 16.7%ROACE 12.4% 18.5% 30.9% 31.2% 29.3% Source: Company data, Bloomberg data, BOCI Research estimates
Expect margin to stay high over the next few years
Anhui Conch Price: HK$31.30 BUY Target Price: HK$40.70 Michelle Leung 25 May 2011

BOCI research is available electronically on Bloomberg (BOCR <go>), thomsonreuters.com and www.bociresearch.com.
Initiating Coverage 25 May 2011
19% side BUY Target Price: HK$17.30 3323 HK Price: HK$ 14.58 TP Basis: Sum of parts Sector Rating: OVERWEIGHT
Where are we Different? Our EPS estimates are 3.5% below and 2% higher
in 2011/12 Key Highlights of this Report
CNBM’s latest operational data in April 2011
P. 5
CNBM’s latest market share in each province
Fig 12
Earnings sensitivity to coal, cement prices, sales volume and interest rate
Fig 10
Trading Summary
H - China National Building Material (3323 HK)
5
7
9
11
13
15
17
19
80
109
137
166
194
223
251
280Price Close Relative to HSCEI (RHS)
Source: Bloomberg.
20406080
100120
May
-10 Ju
l-10
Sep
-10 Nov
-10 Ja
n- 11 Mar
-11 May
-11
Vol
th
YTD 1M 3M 12M Absolute (%) 63.6 -5.9 58 141.4 Relative to HSCEI (%) 63.7 1.3 52.8 128.6
Shares outstanding 5,399 Free float (%) 59.0% Market cap. (HK$ m) 78,718 Daily turnover (3M avg.) 35.80 Net debt / Equity (%) 132.3 Major shareholder (%) CNBM Group 48.8 CNBM’s Key End Consumers by Segment China United South Cement Infrastructure 40% 20% Urban development 45% 70% Real estate 15% 10% Source: Company data, BOCI Research estimates
China National Building Material Repeating its eastern China consolidation in the north China National Building Material’s (CNBM) sales momentum remains strong with elevated profitability throughout 4M11. Going forward, the company’s growth in the cement business should be sustained by its aggressive expansion targets. We believe CNBM can repeat its eastern China success story in northern China going forward. After more than a 15% share price correction over the past month, we believe attractive valuation has emerged. We initiate coverage with a BUY call on the stock.
Long-term BUY on Consolidation in N. China CNBM targets to expand aggressively in northern China. We expect North
Cement’s capacity to expand at a 32% CAGR in 2010-13 to 30m tonnes, much faster than South Cement’s 16% CAGR and China United’s zero growth.
We think the company can repeat its successful eastern China consolidation in the north. However, we see it taking at least 1-2 years.
Mixed Growth in Non-cement Segment The non-cement segment contributed 27% of the company’s revenue in 2010.
While we see more potential in the lightweight building material and engineering service segments, we remain cautious on CNBM’s aggressive expansion of rotor blade production amid the oversupply.
Key Risks to Rating Lower earnings visibility than other pure cement plays. High gearing of 182% and thus earnings erosion could be significant under a
rising interest rate environment.
Valuation The stock is trading at an attractive valuation. We set our target price at HK$17.30,
based on a sum-of-parts methodology. We value each cement business unit by the target EV/tonne and other non-cement segments by target P/E multiples as shown in Figure 1. We initiate coverage on CNBM with a BUY call.
BOCI Research Limited China: Industrials
Michelle Leung (852) 3988 6431 [email protected]
Investment Summary 12-09 12-10 12-11E 12-12E 12-13E
Total turnover (RMB m) 33,297 51,988 80,810 99,779 111,199Revenue growth 26.3% 56.1% 55.4% 23.5% 11.4%Net profit (RMB m) 3,663 3,068 6,349 8,229 9,405Fully diluted EPS (RMB) 1.56 0.78 1.18 1.52 1.74FD P/E (x) 7.82 15.69 10.39 8.02 7.02FDEPS growth 28.1% (50.2%) 51.0% 29.6% 14.3%Previous EPS (RMB) NA NA NA NA NA Consensus EPS (RMB) 1.22 1.49 1.82EPS vs Consensus (3.46%) 2.02% (4.29%)Recurrent CPS (RMB) 1.70 1.11 1.72 2.97 3.09P/CF (x) 7.20 11.04 7.09 4.11 3.96EV/EBITDA (x) 8.84 13.30 7.89 6.51 5.76Dividend/share (RMB) 0.109 0.085 0.175 0.227 0.260Dividend yield 0.89% 0.69% 1.43% 1.86% 2.12%ROE 33.7% 19.2% 27.5% 26.8% 24.6% Source: Company data, Bloomberg data, BOCI Research estimates. Closing prices are as of 24 May 2011.

CNBM Price: HK$14.58 BUY Target Price: HK$17.30 Michelle Leung 25 May 2011
This document may not be distributed in or into the PRC. 46
VALUATION AND RECOMMENDATION Worries over an economic slowdown have triggered some profit-taking on CNBM, whose share price came down by 15% within a month. The company is trading at only 10x 2011 P/E, compared to its mid-cycle valuation of 12x. We think its valuation has become attractive again.
As per our discussion with management, the company’s sales momentum and profitability remain strong. Looking ahead, its cement business growth should be sustained by its ambitious expansion targets (raising the market share from 30-50% to 50-70%). Given its huge success in consolidating eastern China, we have a strong conviction toward CNBM’s planned consolidation in northern China. Given that a period of 1-2 years is required for consolidation, we think CNBM is more a long-term buy.
Despite its attractive valuation, CNBM is not our top pick of the sector as we see the weaknesses of (i) lower earnings visibility than other pure cement plays, as we remain especially cautious on the rotor blade business, and (ii) high gearing and thus significant earnings erosion under a rising interest rate environment.
We set our target price at HK$17.30, based on a sum-of-parts valuation methodology. We value the cement business of each business unit by the target EV/tonne and other non-cement segments by target P/E multiples as shown in Figure 1. We initiate coverage on CNBM with a BUY call.
Figure 1. CNBM’s Sum-of-parts (SOP) Valuation
Cement US$/tonne Segmental value
(RMB m) HK$/share Bear case with 20% discount from base case 38,390 8.4 China United 64 South Cement 88 North Cement 48 Base case 60,951 13.4 China United 80 South Cement 110 North Cement 60 Bull case with 20% premium from base case 83,512 18.3 China United 96 South Cement 132 North Cement 72 LWBM 2012E EV/EBITDA multiple (x) BNBM Bear case 6x 6,790 1.5 1,213 Base case 7x 8,488 1.9 Bull case 8x 10,185 2.2 Glass fibre and FRP products 2012E Bear case 5x 1,215 0.3 253 Base case 6x 1,519 0.3 Bull case 12x 3,038 0.7 Engineering services 2012E Bear case 6x 6,458 1.4 1,009 Base case 8x 8,073 1.8 Bull case 10x 9,687 2.1 Target price Bear case 11.6 Base case 17.3 Bull case 23.3 Source: Company data, BOCI Research estimates

CNBM Price: HK$14.58 BUY Target Price: HK$17.30 Michelle Leung 25 May 2011
This document may not be distributed in or into the PRC. 47
SWOT ANALYSIS Figure 2. SWOT Analysis
Strengths Weaknesses Has taken the crown from Anhui
Conch to become the largest cement producer in China with massive exposure in SE China and dominating position in Jiangsu, Zhejiang, etc
Successful consolidator with proven track record via M&A
Diversification in income stream from non-cement businesses
High gearing of 182% as of 2010 Tight finances to support large-scale
acquisitions Facing oversupply in the rotor blade
industry
Opportunities Threats Growth potential in engineering
business Cement price growth potential in SE
China Consolidation in northern China could
help to improve the overall pricing power in that region in the long term
Any slowdown in government spending or any tightening policy could adversely affect cement demand
Lack of acquisition targets could result in delays of expansion
Earnings erosion under a rising interest rate environment
Source: Company data, BOCI Research

CNBM Price: HK$14.58 BUY Target Price: HK$17.30 Michelle Leung 25 May 2011
This document may not be distributed in or into the PRC. 48
REPEATING EASTERN CHINA SUCCESS IN THE NORTH? WAIT AND SEE After the successful consolidation in eastern China, CNBM is planning to repeat the same story in northern China. With a 13m tonne capacity under the business unit “North Cement” by end-2010, representing a 63% YoY increase, its long-term goal is to reach 50m tonnes with major expansion in Jilin, Liaoning and Heilongjiang. We expect North Cement’s capacity to grow at a 32% CAGR within 2010-13E to 30m tonnes, much faster than South Cement’s 16% CAGR and China United’s zero growth.
We see upside on cement prices in northern China upon consolidation by 2013-14 as large players like CNBM and Shanshui Cement have emerged. Indeed, Shanshui has already become one of the top 3 players in Liaoning, and Jilin Yatai Group has secured its leading position in Jilin via mergers and acquisitions. While CNBM’s market share in Liaoning and Heilongjiang is still minimal, that in Jilin is more meaningful at 25%. With higher industry concentration in northern China, cement profitability per tonne is likely to improve. Having said that, cement prices in northern China have started to recover in April after the 1Q low season. North Cement’s cement ASP rose by 3.5% MoM to RMB270/tonne in April. Gross profit per tonne rose from 1Q11’s RMB23 to RMB50 in April.
China’s cement demand should be boosted under Central Document No.1, which says the government will spend RMB4trn on the construction of water resources facilities over the next decade. Within this, the Heilongjiang government will spend at least RMB15bn on 352 water projects in 2011, more than 10 times higher than the average annual investment of RMB1.2bn throughout the 11th 5-year Plan (5YP) period.
After making little effort in the eastern China consolidation over the past few years, its existing market share within that region is as high as 30-60%. Going forward, the company aims to raise its market share of every existing market to 50-70%.
Figure 3. CNBM’s Market Share by Province Province Market share E China Zhejiang 55% N. Jiangsu 62% Shandong 28% Central China Hunan 30% Jiangxi 34% S China Henan 11% N China Jilin 25% Inner Mongolia 13% Heilongjiang Minimal Liaoning Minimal Source: Company data, BOCI Research estimates

CNBM Price: HK$14.58 BUY Target Price: HK$17.30 Michelle Leung 25 May 2011
This document may not be distributed in or into the PRC. 49
Earnings to Grow at 36% CAGR within 2011-13E Thanks to significant improvement in eastern China’s cement demand and supply dynamics, we expect CNBM’s overall cement ASP to grow 34% YoY in 2011 to RMB334/tonne, making it a year of record earnings growth. Within this, China United’s cement ASP should grow by 30% YoY to RMB311, South Cement’s grow by 38% YoY to RMB347, and North Cement’s fall by 3% YoY to RMB272. On the other hand, we also assume the average unit production cost to increase by 15% per year in 2011-13E under company guidance.
We estimate CNBM’s capacity to grow at a 12% CAGR within 2010-13E to 286m tonnes, compared to the company’s 12th 5YP target of 300m tonnes. During 2010-13E, the major capacity growth should be achieved by South Cement and North Cement with CAGRs of 16% and 32%, respectively, according to our estimates. No significant capacity expansion would be contributed by China United.
Figure 4. CNBM’s Capacity Growth (2009-13E)
52 70 74 74 74
100117 142 162 182813
2030
30
0
50
100
150
200
250
300
2009 2010 2011E 2012E 2013E
(m tonnes)
China United South Cement (80%) North Cement (45% )
Source: Company data, BOCI Research estimates
All in all, we project the gross profit per tonne for China United to rise 66% YoY to RMB90 and that for South Cement to expand 1% YoY to RMB118. However, the gross profit per tonne for North Cement is expected to decline by 14% YoY to RMB47/tonne before a gradual recovery in 2012-13E.
Good April Operational Data CNBM’s cement ASP and GP/tonne climbed in April to a record high. Even North Cement, the worst performing business unit in CNBM, saw its ASP improving continuously from January’s RMB218/tonne to RMB278/tonne, with the gross profit per tonne jumping from RMB23 to RMB50. CNBM’s total sales volume in April rose 21% YoY to 16.97m tonnes, while 4M11 sales volume was up 8.2%YoY to 44.98m tonnes, which was in line and accounted for 22% of our full-year target. All in all, our calculated revenue in 4M11 was RMB14.1bn, 22% of our full-year forecast for the cement business only.

CNBM Price: HK$14.58 BUY Target Price: HK$17.30 Michelle Leung 25 May 2011
This document may not be distributed in or into the PRC. 50
Figure 5. Monthly ASP Trend by Business Unit
China United
294295296297298299300301
Jan Feb Mar Apr
Rmb/tonne
0%10%20%30%40%50%60%70%
2011 (LHS) YoY growth (RHS)
South Cement
280290300310320330340350360
Jan Feb Mar Apr
Rmb/tonne
0%10%20%30%40%50%60%70%
2011 (LHS) YoY growth (RHS)
North Cement
0
50
100
150
200
250
300
Jan Feb Mar Apr
Rmb/tonne
-8%-6%-4%-2%0%2%4%6%8%
2011 (LHS) YoY growth (RHS)
Source: Company data, BOCI Research estimates

CNBM Price: HK$14.58 BUY Target Price: HK$17.30 Michelle Leung 25 May 2011
This document may not be distributed in or into the PRC. 51
Figure 6. CNBM’s Total Sales Volume Trend (2009-13E)
0
50
100
150
200
250
300
2006 2007 2008 2009 2010 2011E 2012E 2013E
(m tonnes)
0
50
100
150
200
250
Sales volume of cement and clinker (LHS) YoY growth (RHS)
(% )
Source: Company data, BOCI Research estimates
Pricing Power Offsets Rising Costs On the cost front, coal makes up more than 30% of total COGS while power accounts for another 30%. The company indicated that every RMB100/tonne increase in coal price translates into a RMB11/tonne increase in cement production cost. According to the company, the average coal prices paid by China United, South Cement and North Cement in 1Q11 were RMB695/tonne, RMB780/tonne and RMB573/tonne, respectively, representing increases of RMB5/tonne, RMB30/tonne and RMB23/tonne YoY, which translate into only RMB1-3.3/tonne increases in cement production cost. For the full year of 2011, we expect coal price to rise by RMB68/tonne (vs. company estimate of RMB50/tonne) for China United, RMB100/tonne (same as company estimate of RMB100/tonne) for North Cement and RMB53/tonne for South Cement, which will translate into RMB7.5/ RMB11/ RMB5.8 increases in production cost per tonne. These are only minimal compared to its stunning ASP hike (+RMB86/tonne on average). Indeed, we expect the company to increase its ASP in Jiangsu (c. 12% of its total capacity) soon, following the power rationing implemented since 20 May.

CNBM Price: HK$14.58 BUY Target Price: HK$17.30 Michelle Leung 25 May 2011
This document may not be distributed in or into the PRC. 52
MIXED GROWTH IN NON-CEMENT SEGMENTS While we believe CNBM’s cement segment will deliver stable growth over the next few years (+34% CAGR within 2010-13E), we have mixed views on the company’s non-cement business, which accounts for 27% of revenue in 2010. Among the non-cement segments, we see more potential in the lightweight building materials segment given the company’s aggressive expansion plan (+20.5% CAGR within 2010-13E to 1,750m sqm). While 1Q11 sales volume was up 51% YoY to 153m sqm and revenue rose 39% YoY, we expect the segment’s full-year revenue to increase 21% YoY to RMB5.3bn. 1Q accounts for 19% of our full-year estimate.
Rapid Growth in Engineering Services Segment On the other hand, we project a 28% CAGR in revenue from the engineering services segment during 2010-13E, given the accelerating research and development efforts in high-end technology, which has transformed the business from conventional glass and concrete construction materials to solar power and photoelectric display industry. Thus, this enhances the value of the newly-signed contracts tremendously. However, due to the competition in the industry, we project a steady gross margin at 20% for 2011- 13E. As of 2010, the company has a RMB7.2bn backlog, representing a 1.4x backlog/revenue ratio. Another RMB15.3bn of contracts are under negotiation, 63% of which are international projects.
Figure 7. Revenue and Gross Margin Trend of Engineering Services Segment
01,0002,0003,0004,0005,0006,0007,0008,0009,000
2006 2007 2008 2009 2010 2011E 2012E 2013E
Rmb m
0%
5%
10%
15%
20%
25%
30%
Revenue (LHS) Gross margin (RHS)
Source: Company data, BOCI Research estimates
Glass Fibre Business in Blue Glass fibres are used in making oil & gas pipelines, roofing systems, wind blades and some electronic equipment manufacturing. Given the heavy oversupply in the global market over the past few years, we expect the margin to remain low. As a result, we anticipate the revenue contribution of the glass fibre business will drop from 6% in 2010 to 2% in 2011.
While we remain cautious on CNBM’s ambitious expansion of rotor blade production (company guidance: +30% CAGR within 2010-13) due to serious oversupply and 1Q11 sales (-58% YoY to 399 units), we assume the sales volume to drop 57% YoY in 2011 to 2,850 units. Having said that, we believe ASP should command a higher growth rate (+18% YoY to RMB420,750/unit) considering the improvement in product mix. During 1Q11, the average ASP was RMB430,000. All in all, we remain conservative on the glass fibre business and expect a significant fall in earnings contribution this year.
Glass fibre business includes fibre glass, reinforced plastic and rotor blades

CNBM Price: HK$14.58 BUY Target Price: HK$17.30 Michelle Leung 25 May 2011
This document may not be distributed in or into the PRC. 53
FINANCIALS Revenue While the cement segment generated around 73% of total revenue in 2010, we expect the share to increase to 81% in 2011. During 2010-13E, we expect cement revenue to grow at a 34% CAGR, while the most lacklustre glass fibre segment should decline at a 16% CAGR during the period, reflecting our concerns on the overcapacity in rotor blade supply.
Figure 8. CNBM’s Revenue Trend and Forecasts
0
20,000
40,000
60,000
80,000
100,000
120,000
2005 2006 2007 2008 2009 2010 2011E 2012E 2013E
Lightweight building materials Cement and clinker Engineering servicesGlass fibre and FRP products Others
2005-13E CAGR +48%,2010-13E CAGR +29%
Source: Company data, BOCI Research estimates
Figure 9. CNBM’s Gross Profit per Tonne Trend and Forecasts Gross profit per tonne (RMB) 2009 2010 2011E 2012E 2013E China United 43.6 54.4 90.4 98.3 103.6 YoY growth (%) (9.3) 24.7 66.1 8.8 5.4 South Cement 29.2 56.7 124.6 130.2 137.4 YoY growth (%) 9.7 94.3 119.6 4.5 5.5 North Cement NA 55.2 47.2 56.6 77.1 YoY growth (%) NA NA (14.4) 19.8 36.2 Overall 34.7 55.8 110.4 116.3 124.9 YoY growth (%) 98.1 5.3 7.4 Source: Company data, BOCI Research estimates
High Gearing CNBM is famous for its heavy leverage, which was as high as 182% as of 2010. Along with the ambitious expansion plan, we expect the company to spend around RMB16bn on capex this year and another RMB12bn and RMB9bn in 2012-13, respectively. Moreover, net gearing should stay high without A-share issuance. We estimate the company to generate RMB6bn operating cash flow in 2011, followed by RMB9.3bn in 2012 and RMB16bn in 2013. The company has more than RMB23bn banking facilities for now. Indeed, it conducted a placement of an aggregate of 238.95m H shares in September 2010, with net proceeds of HK$3.428bn, and enlarged the share capital by approximately 8.8% to around 2,699.5m shares. As such, net gearing was effectively lowered from 248% in 1H10 to 184% by end-2010. We expect the net gearing to decline to 130% by end-2011 due to the enlarged equity base. Should the A-share placement come through, the net gearing ratio would drop further. Having said that, even without A-share issuance as we now assume in our model, we still expect net gearing to improve to below 80% by 2013E.
CNBM Price: HK$14.58 BUY Target Price: HK$17.30 Michelle Leung 25 May 2011
This document may not be distributed in or into the PRC. 54
Financial Costs Account for 30% of Operating Profit While we see potential earnings erosion under a rising interest rate environment, its SOE background should ease investors’ worries on bankruptcy. Moreover, the earnings impact from higher financial expenses should be minimal, compared to the gains from cement price hike. However, risk could be high if earnings growth could not be realised as expected. In 2010, net financial costs accounted for almost 30% of operating profit. According to our sensitivity analysis, every 25bp increase in interest rate would erode CNBM’s 2011 earnings by 1.4%.

CNBM Price: HK$14.58 BUY Target Price: HK$17.30 Michelle Leung 25 May 2011
This document may not be distributed in or into the PRC. 55
MAIN RISKS Government’s Tightening Policies Under the rising interest rate environment, fixed asset investment (FAI) could shrink as a result of higher financing cost, which could hamper the demand for cement as well as rotor blades from the highly-geared wind farms. While FAI growth declined from 30.5% to 24.5% last year, the BOCI projections are 21.5% for 2011 and 20% for 2012.
Price Cap Risk With reference to the price caps imposed in Fujian and Hainan last year, it could also happen in regions with high cement prices, namely Shanghai, Anhui, Jiangxi, Zhejiang and Jiangsu. However, we believe a nationwide price cap is unlikely. Moreover, the price cap implemented in Fujian only lasted for a few months.
High gearing
CNBM”s net gearing was high at 182% as of 2010. Every 25bp increase in interest rate would erode 2011 earnings by 1.4%.

CNBM Price: HK$14.58 BUY Target Price: HK$17.30 Michelle Leung 25 May 2011
This document may not be distributed in or into the PRC. 56
SENSITIVITY ANALYSIS Based on our earnings sensitivity analysis, coal price appears to be the most earnings-sensitive variable, followed by sales volume and cement ASP. Every 10% increase in coal price would result in approximately 9.5% net profit erosion, while every 10% increase in sales volume and cement ASP would lead to 8.3% and 8.2% increase in earnings, assuming no other changes.
Figure 10. 2011 EPS Sensitivity Analysis EPS impact For every 10% increase in coal price -9.5% For every 10% increase in cement ASP +8.2% For every 10% increase in sales volume +8.3% For every 25bp increase in interest rate -1.4% Source: BOCI Research estimates

CNBM Price: HK$14.58 BUY Target Price: HK$17.30 Michelle Leung 25 May 2011
This document may not be distributed in or into the PRC. 57
COMPANY BACKGROUND CNBM was listed on the Hong Kong Stock Exchange in March 2006, sponsored by Morgan Stanley. Its parent, CNBM Group, which holds around 56% of the listed company, is a 100% subsidiary of the State-owned Assets Supervision and Administration Commission (SASAC). The company has been adopting an ambitious M&A strategy for expansion in the past few years. We think South Cement has been a great success as over 145 cement companies were consolidated within 3 years in Southeast China.
Figure 11. CNBM’s Key End Consumers by Segment China United South Cement Infrastructure 40% 20% Urban development 45% 70% Real estate 15% 10% Source: Company data, BOCI Research estimates
Figure 12. CNBM’s Sales Exposure by Province China United Capacity (m tonnes) % of the unit % of total Shandong 28 40% 14% Henan 13.6 19% 7% Hebei 1.4 2% 1% Jiangsu (North) 13 19% 7% Inner Mongolia 8 11% 4% Sichuan 4 6% 2% Anhui 2 3% 1% Subtotal 70 100% 35% South Cement Zhejiang 56 48% 28% Hunan 22 19% 11% Jiangsu (South) 11 9% 6% Jiangxi 24 21% 12% Shanghai 4 3% 2% Subtotal 117 100% 59% North Cement Jilin 5.6 43% 3% Heilongjiang 5.6 43% 3% Liaoning 1.8 14% 1% Subtotal 13 100% 7% CNBM's total 200 Source: Company data, BOCI Research

CNBM Price: HK$14.58 BUY Target Price: HK$17.30 Michelle Leung 25 May 2011
This document may not be distributed in or into the PRC. 58
Figure 13. CNBM Still Trading at Low End of P/E Range
0
10
20
30
40
50
60
03/06
06/06
09/06
12/06
03/07
06/07
09/07
12/07
03/08
06/08
09/08
12/08
03/09
06/09
09/09
12/09
03/10
06/10
09/10
12/10
03/11
P/E Average Avg + 1 SD Avg -1 SD
(x)
Source: Company data, BOCI Research

CNBM Price: HK$14.58 BUY Target Price: HK$17.30 Michelle Leung 25 May 2011
This document may not be distributed in or into the PRC. 59
Income Statement (RMB m)12-09 12-10 12-11E 12-12E 12-13E
Total turnover 33,297 51,988 80,810 99,779 111,199 Cost of sales (26,798) (40,779) (53,029) (66,190) (73,174) Total operating costs 60 (3,025) (13,026) (15,106) (17,362) Operating EBITDA 8,018 10,210 17,438 21,571 24,049 Deprec. and amort. (1,458) (2,026) (2,683) (3,088) (3,385) Operating EBIT 6,560 8,184 14,755 18,484 20,663 Net interest income (1,516) (2,579) (3,322) (3,422) (3,206) Exchange gains - - - - - Other recurring incomeAssociates' profit 9 198 218 240 264 Exceptional income - - - - - Pre-tax profit 5,053 5,803 11,651 15,301 17,721 Taxation (664) (1,361) (2,714) (3,718) (4,483) Minority interests (725) (1,374) (2,588) (3,355) (3,834) Preferred dividends - - - - - Net profit 3,663 3,068 6,349 8,229 9,405 Recurring net profit 3,663 3,068 6,349 8,229 9,405 Per Share Values (RMB)
12-09 12-10 12-11E 12-12E 12-13EEarnings per share 1.48 0.57 1.18 1.52 1.74 Dividend/share 0.11 0.08 0.18 0.23 0.26 Book value per share 5.2 3.5 5.0 6.3 7.8 Tangible BVPS (0.1) 0.3 2.0 3.3 4.8 Net cash/(debt) per share (14.7) (9.3) (9.5) (9.7) (9.1) Balance Sheet (RMB m)
12-09 12-10 12-11E 12-12E 12-13ETotal cash and equivalents 4,815 9,240 1,541 1,301 2,572 Accounts receivable 10,009 17,111 25,291 31,228 34,802 Inventories 4,742 7,210 11,207 13,837 15,421 Other current assets 1,287 2,258 2,258 3,258 3,258 Total current assets 20,854 35,818 40,297 49,624 56,053 Net fixed assets 36,589 51,722 64,076 71,782 76,009 Total investments 3,162 3,438 3,656 3,895 4,159 Intangible assets 13,189 17,478 16,434 16,272 16,061 Other assets 3,215 2,944 2,944 2,944 2,944 Total long-term assets 56,155 75,581 87,109 94,893 99,172 Total assets 77,009 111,399 127,406 144,516 155,225 Trade creditor 15,532 19,270 26,114 32,571 34,346 Short-term debt 22,202 28,764 28,764 28,764 28,764 Other current liabilities 587 1,434 2,691 3,739 4,583 Total current liabilities 38,320 49,468 57,569 65,074 67,693 Total long-term debt 19,073 30,930 24,187 24,966 22,826 Other liabilities 938 1,084 4,234 2,270 662 Shareholders' equity 12,895 19,046 27,148 34,151 42,154 Minority interests 4,621 8,736 11,701 15,055 18,890 Total liabilities & equity 77,009 111,399 127,406 144,516 155,225 Growth
12-09 12-10 12-11E 12-12E 12-13ERevenue growth 26.3% 56.1% 55.4% 23.5% 11.4%Operating EBITDA growth 36.0% 27.3% 70.8% 23.7% 11.5%Operating EBIT growth 43.8% 24.8% 80.3% 25.3% 11.8%Pretax profit growth 50.9% 14.8% 100.8% 31.3% 15.8%Net profit growth 36.0% (16.2%) 106.9% 29.6% 14.3% Source: Company data, Bloomberg data, BOCI Research estimates
Underpinned by 19% CAGR in cement sales volume and 14% CAGR in cement ASP during 2010-13E

CNBM Price: HK$14.58 BUY Target Price: HK$17.30 Michelle Leung 25 May 2011
This document may not be distributed in or into the PRC. 60
Cash-flow Statement (RMB m)12-09 12-10 12-11E 12-12E 12-13E
Pre-tax profit 5,053 5,803 11,651 15,301 17,721 Depreciation 1,458 2,026 2,683 3,088 3,385 Goodwill & other amort. - - - - - Net interest 1,516 2,579 3,322 3,422 3,206 Change in working capital (781) (3,392) (5,316) (1,659) (2,539) Tax paid (1,187) (1,361) (2,714) (3,718) (4,483) Other operating cash flow (1,929) 520 (95) (137) (365) Operating cash flow 4,210 5,977 9,313 16,057 16,662 Capex (5,893) (9,720) (7,000) (6,000) (3,000) Cash flow from disposals 1,779 - 307 385 444 Acquisition of subsidiaries (1,118) (1,280) (9,100) (6,200) (6,200) Others (8,650) (6,148) - - - Cash flow from investing (13,882) (17,148) (15,793) (11,815) (8,756) Shares repurchased - - - - Debt issued 13,239 13,558 2,811 779 (2,140) Proceeds from issue of shares - 3,429 - - - Interest received - - - - - Dividends paid (174) (502) (710) (920) (1,051) Interest paid (1,516) (2,579) (3,322) (3,422) (3,206) Other cash flow from funding (1,759) 1,393 1,267 (978) (1,919) Cash flow from financing 9,790 15,299 47 (4,541) (8,316) Total cash generated 118 4,128 (6,433) (298) (411) Free cash flow to firm (9,672) (11,170) (6,480) 4,242 7,905 Free cash flow to equity 2,051 (192) (6,991) 1,599 2,559 Key Ratios
12-09 12-10 12-11E 12-12E 12-13EProfitabilityEBITDA margin 24.1% 19.6% 21.6% 21.6% 21.6%EBIT margin 19.7% 15.7% 18.3% 18.5% 18.6%Pre-tax margin 15.2% 11.2% 14.4% 15.3% 15.9%Net profit margin 11.0% 5.9% 7.9% 8.2% 8.5%LiquidityCurrent ratio 0.5 0.7 0.7 0.8 0.8 Interest coverage ratio 4.3 3.2 4.4 5.4 6.4 Net debt to equity 208% 182% 132% 107% 80%Quick ratio 0.4 0.6 0.5 0.5 0.6 ValuationP/E (x) 8.3 21.5 10.4 8.0 7.0 Core P/E (x) 8.3 21.5 10.4 8.0 7.0 P/B (x) 2.4 3.5 2.4 1.9 1.6 P/CF (x) 7.2 11.0 7.1 4.1 4.0 EV/EBITDA (x) 8.8 13.3 7.9 6.5 5.8 Activity ratiosInventory days 64.6 64.5 77.1 76.5 76.9 Accounts receivables days 109.7 120.1 114.2 114.5 114.2 Accounts payables days 211.5 172.5 179.7 180.1 171.3 ReturnsDividend payout ratio 4.7% 16.4% 14.9% 14.9% 14.9%ROE 33.7% 19.2% 27.5% 26.8% 24.6%ROAA 5.4% 3.3% 5.3% 6.1% 6.3%ROACE 13.6% 11.2% 16.5% 19.0% 19.2% Source: Company data, Bloomberg data, BOCI Research estimates
Expecting ROE to rise to around 25% in the next few years, higher than 19% in 2010
Rising interest coverage ratio, which, however, is very low compared to Anhui Conch’s ratio of over 30x

China Cement Sector Industrials – Basic Materials Michelle Leung 25 May 2011
This document may not be distributed in or into the PRC. 61
LISTED COMPANIES IN THIS REPORT Anhui Conch (914.HK/HK$31.3, BUY)
Asia Cement (China) (743.HK/HK$5.64, NR)
BBMG Corporation (2009.HK/HK$10.56, BUY)
China National Building Material (3323.HK/HK$14.58, BUY)
China National Materials Co Ltd (1893.HK/HK$6.94, BUY)
China Resources Cement (1313.HK/HK$7.12, BUY)
Shanshui Cement (691.HK/HK$7.83, BUY)
West China Cement (2233.HK/HK$3.11, HOLD)
Prices as of 24 May 2011 All figures subject to rounding
China Cement Sector Industrials – Basic Materials Michelle Leung 25 May 2011
This document may not be distributed in or into the PRC. 62
DISCLOSURE The views expressed in this report accurately reflect the personal views of the analysts. Each analyst declares that neither he/she nor his/her associate serves as an officer of nor has any financial interests in relation to the listed corporation reviewed by the analyst. None of the listed corporations reviewed or any third party has provided or agreed to provide any compensation or other benefits in connection with this report to any of the analysts, BOCI Research Limited and BOCI Group. Member companies of BOCI Group confirm that they, whether individually or as a group (i) do not own 1% or more financial interests in any of the listed corporations reviewed; (ii) are not involved in any market-making activities for any of the listed corporations reviewed; or (iii) do not have any individuals employed by or associated with any member companies of BOCI Group serving as an officer of any of the listed corporations reviewed. Certain member companies of BOCI Group has/have had investment banking relationships with BBMG Corporation within the preceding 12 months.
This disclosure statement is made pursuant to paragraph 16 of the “Code of Conduct for Persons Licensed by or Registered with the Securities and Futures Commission” and is updated as of 23 May 2011. Waiver has been obtained by BOC International Holdings Limited from the Securities and Futures Commission of Hong Kong to disclose any interest the Bank of China Group may have in this research report.

This report is prepared and issued by BOCI Research Limited for distribution to professional, accredited and institutional investor customers. This report is being furnished to you on a confidential basis solely for your information and may not be reproduced or redistributed or passed on directly or indirectly, to any other person or published, in whole or in part, for any purpose. In particular, neither this report nor any copy hereof may be distributed to the press or other media. This report is not directed to, or intended for distribution to or use by, any person or entity who is a citizen or resident of or located in any locality, state, country or other jurisdiction where such distribution, publication, availability or use would be contrary to law or regulation or which would subject BOCI Research Limited, BOC International Holdings Limited and any of their respective subsidiaries and affiliates (collectively, “BOCI Group”) to any registration or licensing requirement within such jurisdictions. All trademarks, service marks and logos used in this report are trademarks or service marks or registered trademarks or service marks of one or more members of the BOCI Group. The information, tools and material presented in this report are provided to you for information purposes only and shall not be used or considered as an offer or the solicitation of an offer to sell or to buy or subscribe for securities or other financial instruments. BOCI Research Limited has not taken any steps to ensure that the securities referred to in this report are suitable for any particular investor. The contents of this report do not constitute investment advice to any person and BOCI Group will not treat recipients as its customers by virtue of their receiving the report. You should seek the advice from your independent financial advisor prior to making any investment decision. Although information and opinions presented in this report have been obtained or derived from sources believed by BOCI Research Limited to be reliable, neither the author or any member of the BOCI Group or their respective directors, officers, employees or agents has independently verified the information contained in this report nor will any member of BOCI Group have any liability whatsoever (in negligene or otherwise) for any loss howsoever arising from any use of this report or its contents or otherwise arising from any use of this report. Accordingly, no representation or warranty, expressed or implied, is made as to the fairness, accuracy or completeness of such information and opinions. This report is not to be relied upon in substitution for the exercise of independent judgment. Members of the BOCI Group may have issued other reports that are inconsistent with, and reached different conclusions or opinions from, that presented in this report. Each report reflects the different assumptions, analytical methods and views of the analysts who prepared them. For the avoidance of doubt, views expressed in this report do not necessarily represent those of all members of the BOCI Group. This report may provide the addresses of, or contain hyperlinks to, various websites. To the extent that this report refers to material outside BOCI Group’s own website, BOCI Group has not reviewed the linked sites and takes no responsibility for the content contained therein. Such addresses or hyperlinks (including addresses or hyperlinks to BOCI Group’s own website material) is provided solely for your convenience and information, and the content of the linked sites does not in any way form part of this report. Accessing such websites is at your own risk. One or more members of the BOCI Group may, to the extent permitted by law, participate in financing transactions with the issuers of the securities referred to in this report, perform services for or solicit business from such issuer(s), and/or have a position or effect transactions in the securities or other financial instruments of such issuers. One or more members of the BOCI Group may, to the extent permitted by law, act upon or use the information or opinions presented herein, or the research or analysis on which they are based, before the material is published. One or more members of the BOCI Group and the analyst(s) preparing this report (each an “analyst” and collectively the “analysts”) may have relationships with, financial interests in or business relationships with any or all of the companies mentioned in this report (each a “listed corporation” and collectively the “listed corporations”). See “Disclosure”. This report does not constitute or form part of any offer for sale or invitation, or solicitation or an offer, to subscribe for or purchase any securities and neither this report nor anything contained herein shall form the basis of or are to be relied on in connection with any contract or commitment whatsoever. Information, opinions and estimates are provided on an “as is” basis without warranty of any kind, and may be changed at any time without prior notice. Any opinions or estimates contained in this report are based on a number of assumptions which may not prove valid and may be changed without notice. Nothing in this report constitutes investment, legal, accounting or tax advice nor a representation that any investment or strategy is suitable or appropriate to your individual circumstances. Nothing in this report constitutes a personal recommendation to you. Past performance should not be taken as an indication or guarantee of future performance, and no representation or warranty, expressed or implied, is made regarding future performance. Information, opinions and estimates contained in this report reflect a judgement at its original date of publication by the member of the BOCI Group which prepared the report, and are subject to change. The price, value of and income from any of the securities or financial instruments mentioned in this report can fall as well as rise. Some investments may not be readily realisable, and it may be difficult to sell or realise those investments. Similarly, it may prove difficult for you to obtain reliable information about the value, or risks, to which such an investment is exposed. The investments and services contained or referred to in this report may not be suitable for you. As noted above, it is recommended that you consult an independent investment advisor before making any investment decision, including the purchase or sale of any security covered in this report. The distribution of this report in some jurisdictions may be restricted by law, and persons into whose possession this report comes should inform themselves about, and observe, any such restrictions. The information contained in the report is confidential and is intended solely for the use by its authorised recipient. This report is distributed in Hong Kong by BOCI Research Limited and BOCI Securities Limited; in Singapore by BOC International (Singapore) Pte Ltd; in the United States by BOC International (USA), Inc.; and may be in the United Kingdom by Bank of China International (UK) Limited. In the United Kingdom, this report is not a prospectus and has not been approved under section 21 of the Financial Services and Markets Act 2000 (the “FSMA”). This report may only be passed on to persons in or outside the United Kingdom in accordance with the Financial Services and Markets Act 2000 (Financial Promotions) Order 2005, specifically, Eligible Counterparties and Professional Clients (to include Elective Professional Clients). The transmission of this research report to any other persons must not contravene the FSMA and other applicable UK securities laws and regulations. All applicable provisions of the FSMA must be complied with respect to the securities referred to in this report in, from, or otherwise involving the United Kingdom. This report and any information, material and contents herein are intended for general circulation only and do not take into account the specific investment objectives, financial situation or particular needs or any particular person. The investment(s) mentioned in this report may not be suitable for all investors, and a person receiving or reading this report should seek advice from a financial advisor regarding the suitability of such investment(s), taking into account the specific investment objectives, financial situation or particular needs of that person, before making a commitment to purchase any of such investment(s). The suitablity of any particular investment or strategy whether opined on, described in or referred to in this report or otherwise will depend on a person’s individual circumstances and objectives and should be confirmed by such person with his advisers independently before adoption or implementation thereof (either as is or is varied). Without prejudice to any of the foregoing disclaimers, to the extent that the reader is an accredited or expert investor as defined in Regulation 2 of the Financial Advisers Regulations (“FAR”) of the Financial Advisers Act (Cap. 110) of Singapore (“FAA”), BOC International (Singapore) Pte Ltd is in any event exempted (i) by Regulation 34 of the FAR from the requirement to have a reasonable basis for making any recommendation as mandated under Section 27 of the FAA, and (ii) by Regulation 35 of the FAR from the requirements in Section 36 of the FAA mandating disclosure of any interests in securities mentioned in this report, or in their acquisition or disposal, that it or its associated or connected persons may have. The receipient of the analysis or report should contact BOCI in Singapore if they have any queries as to the report/analysis. Any securities referred to in this report have not been registered with, recommended by or approved by any U.S. federal or state, or any non-U.S., securities commission or regulatory authority, nor has any such authority or commission passed upon the accuracy or adequacy of this report. Any securities referred to in this report have not been and are not expected to be registered under the Securities Act of 1933, as amended, or any state of other securities laws or the laws of any non-U.S. jurisdiction. BOCI Group does not make any representation as to the availability of Rule 144A or any other exemption under the Securities Act for the sale, resale, pledge or transfer of any securities referred to in the report. To the extent that the recipient of this report is a “Major U.S. Institutional Investor” within the meaning of Rule 15a-6 under the United States Securities Exchange Act of 1934, as amended, any decision to buy or sell a security covered in this report or in any other report issued by a member of the BOC Group, should be directed exclusively to BOC International (USA), Inc. Copyright 2011 BOCI Research Limited, BOC International Holdings Limited and its subsidiaries and affiliates. All rights reserved.
20/F, Bank of China Tower 1 Garden Road Hong Kong Tel: (852) 2867 6333 Fax: (852) 2147 9513 Toll free numbers to Hong Kong: China North: 10800 8521065 China South: 10800 1521065 Singapore: 800 852 3392 BOCI Securities Limited 20/F, Bank of China Tower 1 Garden Road Hong Kong Tel: (852) 2867 6333 Fax: (852) 2147 9513 BOC International (UK) Limited 90 Cannon Street London EC4N 6HA United Kingdom Tel: (4420) 7022 8888 Fax: (4420) 7022 8877 BOC International (USA) Inc. Room 202, 1270 Avenue of the Americas New York, NY, 10020, USA Tel: (1) 212 259 0888 Fax: (1) 212 259 0889 BOC International (Singapore) Pte. Ltd. Reg. No. 199303046Z 4 Battery Road 4/F Bank of China Building Singapore 049908 Tel: (65) 6412 8856 / 6412 8630 Fax: (65) 6534 3996 / 6532 3371 BOC International (China) Ltd 39/F Bank of China Tower 200 Yincheng Zhong Road Shanghai Pudong District 200121 China Tel: (8621) 6860 4866 Fax: (8621) 5888 3554 BOC International Holdings Ltd Representative Office 15/F, Tower 2 Yingtai Business Center No.28 Finance Street, Xicheng District Beijing 100032, China Tel: (8610) 6622 9000 Fax: (8610) 6657 8950