Characterization of the novel negative checkpoint ...
146
Characterization of the novel negative checkpoint regulator V-domain immunoglobulin-containing suppressor of T-cell activation (VISTA) on Antigen Presenting Cells Von der Fakultät für Medizin und Gesundheitswissenschaften der Carl von Ossietzky Universität Oldenburg zur Erlangung des Grades und Titels eines Doctor rerum naturalium (Dr. rer. nat.) angenommene Dissertation von Lena Dübbel geboren am 24.04.1992 in Oldenburg(Oldb)
Transcript of Characterization of the novel negative checkpoint ...

Characterization of the novel negative checkpoint regulator
V-domain immunoglobulin-containing suppressor of T-cell
activation (VISTA) on Antigen Presenting Cells
Von der Fakultät für Medizin und Gesundheitswissenschaften
der Carl von Ossietzky Universität Oldenburg
zur Erlangung des Grades und Titels eines
Doctor rerum naturalium (Dr. rer. nat.)
angenommene Dissertation
von
Lena Dübbel
geboren am 24.04.1992 in Oldenburg(Oldb)

Betreuender Gutachter: Prof. Dr. Karl-Wilhelm Koch
Zweitgutachter: Prof. Dr. Edwin Bremer
Tag der Disputation: 02.03.2020

Table of Content
ABBREVIATIONS ....................................................................................................... I
LIST OF FIGURES .................................................................................................... V
LIST OF TABLES .................................................................................................... IX
SUMMARY ................................................................................................................ X
ZUSAMMENFASSUNG .......................................................................................... XII
1 INTRODUCTION ............................................................................................ 1
1.1 Immune system .............................................................................................. 1
1.2 Anti-tumor immune responses and immunotherapy........................................ 2
1.2.1 Non-specific immunotherapies ................................................................ 4
1.2.2 Cancer vaccines ...................................................................................... 4
1.2.3 Oncolytic virus therapy ............................................................................ 5
1.2.4 T-cell therapy ........................................................................................... 6
1.2.5 Monoclonal antibodies and tumor-agnostic therapies .............................. 6
1.3 Negative checkpoint regulators and immune checkpoint therapy ................... 7
1.3.1 PD-1 and PD-L1 ...................................................................................... 8
1.3.2 CTLA-4 .................................................................................................. 10
1.3.3 V-domain Ig Suppressor of T-cell Activation (VISTA) ............................ 12
2 OBJECTIVES ............................................................................................... 19
3 MATERIALS AND METHODS ..................................................................... 21
3.1 Materials ....................................................................................................... 21
3.1.1 Devices .................................................................................................. 21
3.1.2 Chemicals .............................................................................................. 23
3.1.3 Consumables ......................................................................................... 25
3.1.4 Antibodies .............................................................................................. 27
3.1.5 Bacteria strains ...................................................................................... 28
3.1.6 Celllines ................................................................................................. 29
3.1.7 Primer .................................................................................................... 29
3.2 Methods ........................................................................................................ 30
3.2.1 Isolation of murine bone marrow cells and differentiation into bone marrow
derived macrophages (BMDMs) ............................................................ 30
3.2.2 Cell counting via Neubauer improved-counting chamber ...................... 30
3.2.3 Isolation of human peripheral blood mononuclear cells (PBMCs), CD14+
enrichment and differentiation into monocyte derived macrophages ..... 30
3.2.4 Differentiation of the different macrophage subtypes ............................ 31
3.2.5 Immunohistochemistry (IHC) protocol of primary murine cells and human
celllines .................................................................................................. 32
3.2.6 Immunohistochemistry (IHC) protocol of primary human cells ............... 32
3.2.7 FACS staining protocol .......................................................................... 32
3.2.8 Cloning .................................................................................................. 33

3.2.9 Protein expression and harvesting ........................................................ 33
3.2.10 Purification of the extracellular IgV domain of VISTA ............................ 34
3.2.11 Purification of the intracellular domain of VISTA .................................... 35
3.2.12 Size exclusion chromatography (SEC) .................................................. 36
3.2.13 Transfection of VISTA-GFP overexpressing celllines ............................ 36
3.2.14 Enzyme-linked Immunosorbent Assay (ELISA) ..................................... 37
3.2.15 Polyacrylamide gel electrophoresis ....................................................... 38
3.2.16 Western Blot .......................................................................................... 39
3.2.17 Polymerase Chain Reaction (PCR) ....................................................... 40
3.2.18 Real-time quantitative reverse transcription PCR (qPCR) ..................... 41
3.2.19 Phagocytosis assay ............................................................................... 41
3.2.20 Nucleus extract preparation ................................................................... 42
3.2.21 Co-Immunoprecipitation/GFP pull-out (Van den Boom 2016)................ 43
3.2.22 Cell fractionation and vesicle isolation ................................................... 43
3.2.23 Exosome isolation ................................................................................. 44
3.2.24 Particle analysis with Python ................................................................. 44
3.2.25 Colocalization study ............................................................................... 46
3.2.26 Statistics ................................................................................................ 46
4 RESULTS ..................................................................................................... 47
4.1 VISTA distribution in cell fractions and cell types .......................................... 47
4.1.1 VISTA protein purification and characterization ..................................... 47
4.1.2 VISTA expression in different cell types ................................................ 51
4.1.3 VISTA expression in cellular fractions ................................................... 54
4.2 Effect of stimulation....................................................................................... 65
4.2.1 Immunogenic stimulation ....................................................................... 65
4.2.2 Effect of inhibitors .................................................................................. 74
4.2.3 Stimulation by cell density ..................................................................... 78
4.1 Consequences of VISTA overexpression on APCs ...................................... 80
4.1.1 Morphology studies of Vista-overexpressing celllines ........................... 80
4.1.2 Adhesion assays of Vista-overexpressing celllines ............................... 82
4.1.3 Phagocytosis assays with VISTA overexpressing macrophages engulfing
tumor cells ............................................................................................. 84
4.1.4 Phagocytosis assays of primary macrophages engulfing VISTA
overexpressing tumor cells .................................................................... 88
4.1.5 Possible interaction partner ................................................................... 91
5 DISCUSSION ............................................................................................... 98
5.1 VISTA distribution in cell fractions and cell types .......................................... 98
5.1.1 VISTA protein purification and characterization ..................................... 98
5.1.2 VISTA expression in different cell types ................................................ 99
5.1.3 VISTA expression in cellular fractions ................................................... 99
5.2 Effect of stimulation..................................................................................... 101
5.3 Consequences of VISTA overexpression on APCs .................................... 104
5.4 Future perspectives .................................................................................... 107

6 REFERENCES ........................................................................................... 109
7 APPENDIX ................................................................................................. 119
7.1 Material and methods ................................................................................. 119
7.2 Results ........................................................................................................ 120
LIST OF PUBLICATIONS ...................................................................................... 126
DANKSAGUNG ..................................................................................................... 127
ERKLÄRUNG ......................................................................................................... 128
Abbreviations i
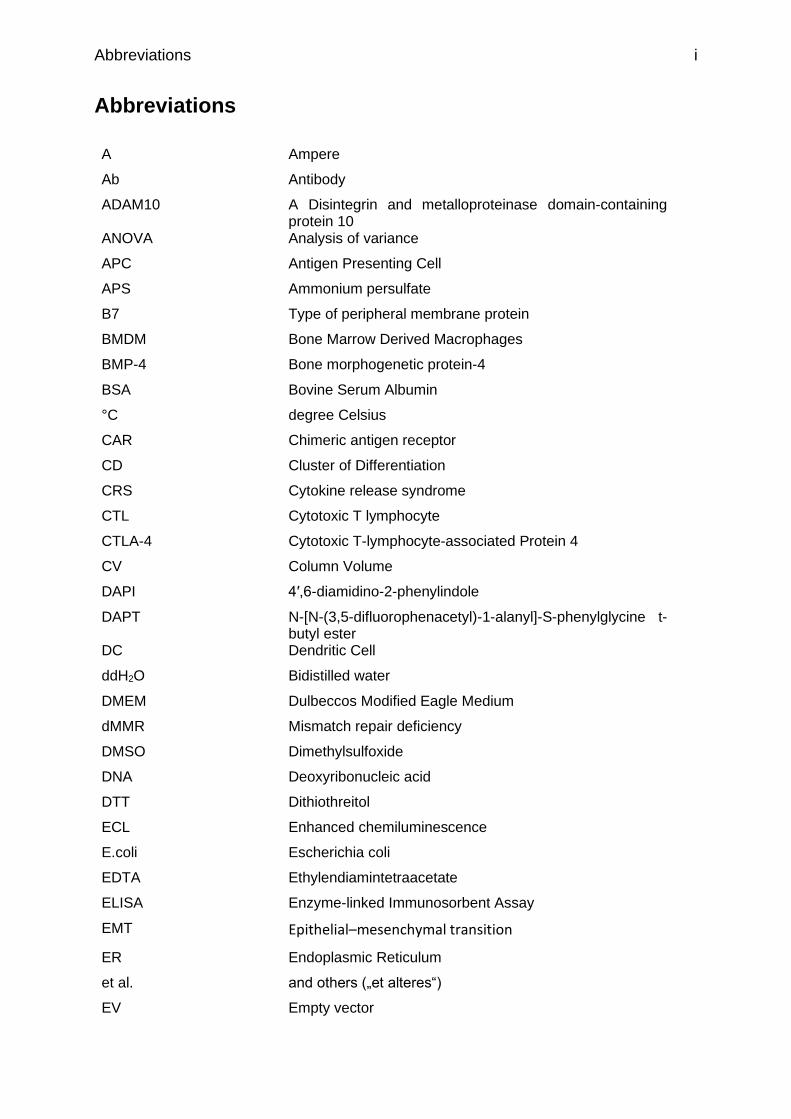
Abbreviations
A Ampere
Ab Antibody
ADAM10 A Disintegrin and metalloproteinase domain-containing protein 10
ANOVA Analysis of variance
APC Antigen Presenting Cell
APS Ammonium persulfate
B7 Type of peripheral membrane protein
BMDM Bone Marrow Derived Macrophages
BMP-4 Bone morphogenetic protein-4
BSA
°C
Bovine Serum Albumin
degree Celsius
CAR Chimeric antigen receptor
CD Cluster of Differentiation
CRS Cytokine release syndrome
CTL Cytotoxic T lymphocyte
CTLA-4 Cytotoxic T-lymphocyte-associated Protein 4
CV Column Volume
DAPI 4′,6-diamidino-2-phenylindole
DAPT N-[N-(3,5-difluorophenacetyl)-1-alanyl]-S-phenylglycine t-butyl ester
DC
ddH2O
Dendritic Cell
Bidistilled water
DMEM Dulbeccos Modified Eagle Medium
dMMR Mismatch repair deficiency
DMSO Dimethylsulfoxide
DNA Deoxyribonucleic acid
DTT Dithiothreitol
ECL Enhanced chemiluminescence
E.coli Escherichia coli
EDTA Ethylendiamintetraacetate
ELISA Enzyme-linked Immunosorbent Assay
EMT Epithelial–mesenchymal transition
ER Endoplasmic Reticulum
et al. and others („et alteres“)
EV Empty vector

Abbreviations ii
FACS Fluorescence Activated Cell Sorter
FCR Fc receptor
FCS Fetal Calf Serum
FDA Food and Drug Administration
FITC
g
Fluorescein isothiocyanate
gram
GC Gastric cancer
GFP Green fluorescent protein
GI-effect Gastrointestinal effect
GM-CSF Granulocyte-Macrophage Colony-Stimulating Factor
GST Glutathione S-transferase
h hour
HBV Hepatitis B virus
HCC Hepatocellular carcinoma
HEPES 4-(2-hydroxyethyl)-1-piperazineethanesulfonic acid
HIF Hypoxia-inducible factor
His Histidine
HLA Human leukocyte antigen gene complexes
HPV Human papillomavirus
Id2 Inhibitor of DNA binding 2
IFN Interferon
IgSF11 Immunoglobulin superfamily member 11
IgV Variable immunoglobulin domain
IHC Immunohistochemistry
IL Interleukin
IMAC Immobilized metal affinity chromatography
IPTG Isopropyl-β-D-thiogalactopyranoside
kDa Kilodalton
k/o knockout
l Liter
LAG-3 Lymphocyte-Activation Gene-3
LB medium Lysogeny broth medium
LPS Lipopolysaccharide
m/M mass/Molar
MACS Magnetic Activated Cell Sorter
M-CSF Macrophage Colony-Stimulating Factor
MDSC Myeloid-derived suppressor cells
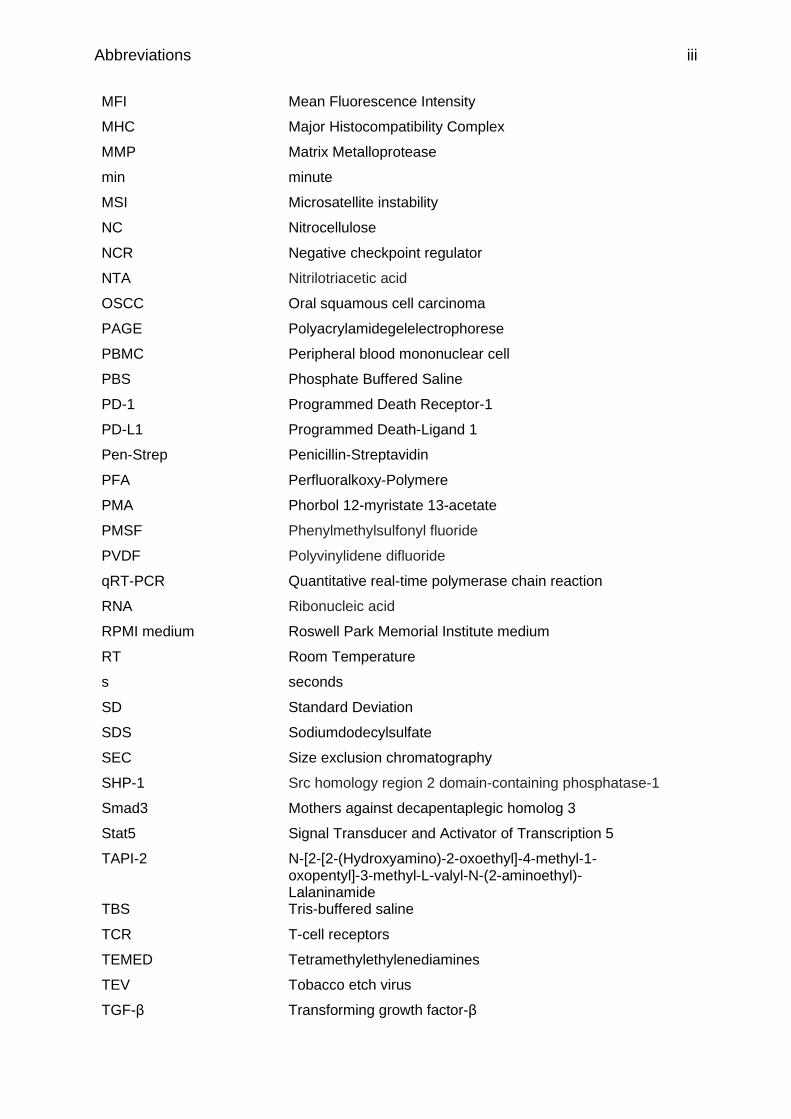
Abbreviations iii
MFI Mean Fluorescence Intensity
MHC Major Histocompatibility Complex
MMP Matrix Metalloprotease
min minute
MSI Microsatellite instability
NC Nitrocellulose
NCR Negative checkpoint regulator
NTA Nitrilotriacetic acid
OSCC Oral squamous cell carcinoma
PAGE Polyacrylamidegelelectrophorese
PBMC Peripheral blood mononuclear cell
PBS Phosphate Buffered Saline
PD-1 Programmed Death Receptor-1
PD-L1 Programmed Death-Ligand 1
Pen-Strep Penicillin-Streptavidin
PFA Perfluoralkoxy-Polymere
PMA Phorbol 12-myristate 13-acetate
PMSF Phenylmethylsulfonyl fluoride
PVDF Polyvinylidene difluoride
qRT-PCR Quantitative real-time polymerase chain reaction
RNA Ribonucleic acid
RPMI medium Roswell Park Memorial Institute medium
RT Room Temperature
s seconds
SD Standard Deviation
SDS Sodiumdodecylsulfate
SEC Size exclusion chromatography
SHP-1 Src homology region 2 domain-containing phosphatase-1
Smad3 Mothers against decapentaplegic homolog 3
Stat5 Signal Transducer and Activator of Transcription 5
TAPI-2 N-[2-[2-(Hydroxyamino)-2-oxoethyl]-4-methyl-1-oxopentyl]-3-methyl-L-valyl-N-(2-aminoethyl)-Lalaninamide
TBS Tris-buffered saline
TCR T-cell receptors
TEMED Tetramethylethylenediamines
TEV Tobacco etch virus
TGF-β Transforming growth factor-β

Abbreviations iv
TIL Tumor Infiltrating Lymphocytes
TMB 3,3′,5,5′-Tetramethylbenzidine
TME Tumor Microenvironment
TNF Tumor necrose factor
Tregs Regulatory T-cells
V Volt
VISTA V-domain Ig Suppressor of T-cell activation
VSIG-3 V-set and immunoglobulin domain containing 3
W Watt
w/o With and without
wt Wildtype
w/w Weight per weight
*g gravity
List of figures and tables v
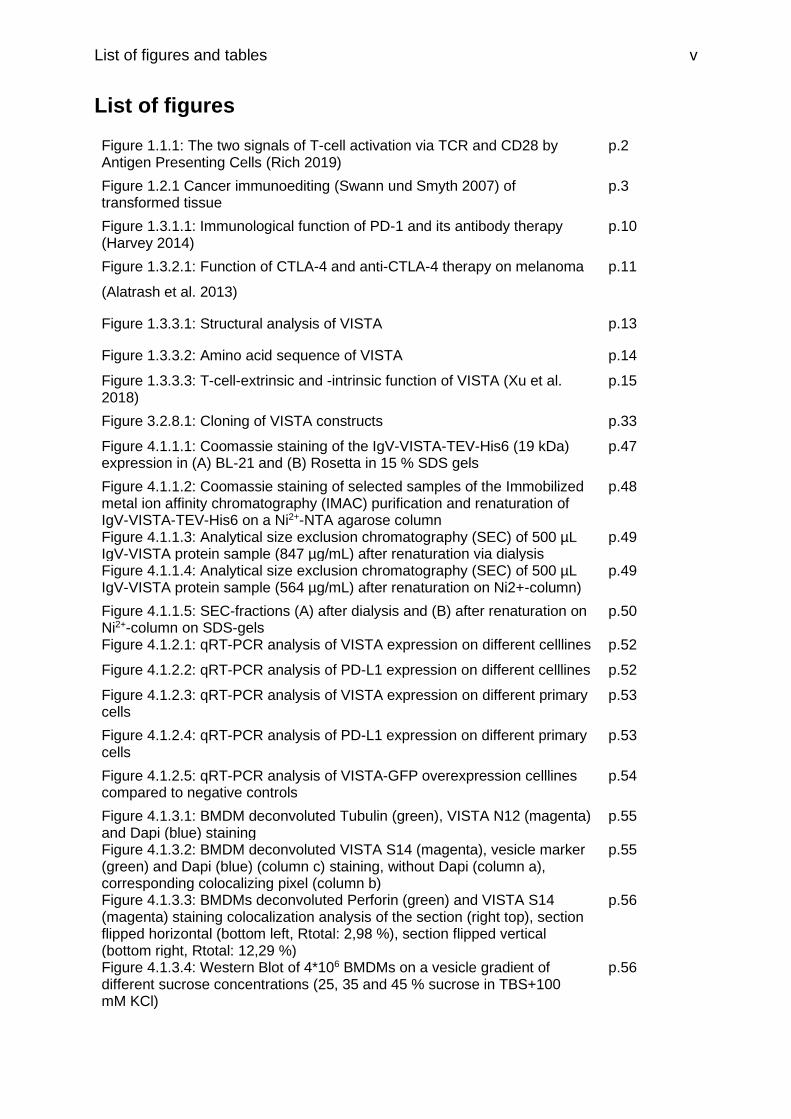
List of figures
Figure 1.1.1: The two signals of T-cell activation via TCR and CD28 by Antigen Presenting Cells (Rich 2019)
p.2
Figure 1.2.1 Cancer immunoediting (Swann und Smyth 2007) of transformed tissue
p.3
Figure 1.3.1.1: Immunological function of PD-1 and its antibody therapy (Harvey 2014)
p.10
Figure 1.3.2.1: Function of CTLA-4 and anti-CTLA-4 therapy on melanoma
(Alatrash et al. 2013)
p.11
Figure 1.3.3.1: Structural analysis of VISTA p.13
Figure 1.3.3.2: Amino acid sequence of VISTA p.14
Figure 1.3.3.3: T-cell-extrinsic and -intrinsic function of VISTA (Xu et al. 2018)
p.15
Figure 3.2.8.1: Cloning of VISTA constructs p.33
Figure 4.1.1.1: Coomassie staining of the IgV-VISTA-TEV-His6 (19 kDa) expression in (A) BL-21 and (B) Rosetta in 15 % SDS gels
p.47
Figure 4.1.1.2: Coomassie staining of selected samples of the Immobilized metal ion affinity chromatography (IMAC) purification and renaturation of IgV-VISTA-TEV-His6 on a Ni2+-NTA agarose column
p.48
Figure 4.1.1.3: Analytical size exclusion chromatography (SEC) of 500 µL IgV-VISTA protein sample (847 µg/mL) after renaturation via dialysis
p.49
Figure 4.1.1.4: Analytical size exclusion chromatography (SEC) of 500 µL IgV-VISTA protein sample (564 µg/mL) after renaturation on Ni2+-column)
p.49
Figure 4.1.1.5: SEC-fractions (A) after dialysis and (B) after renaturation on Ni2+-column on SDS-gels
p.50
Figure 4.1.2.1: qRT-PCR analysis of VISTA expression on different celllines p.52
Figure 4.1.2.2: qRT-PCR analysis of PD-L1 expression on different celllines p.52
Figure 4.1.2.3: qRT-PCR analysis of VISTA expression on different primary cells
p.53
Figure 4.1.2.4: qRT-PCR analysis of PD-L1 expression on different primary cells
p.53
Figure 4.1.2.5: qRT-PCR analysis of VISTA-GFP overexpression celllines compared to negative controls
p.54
Figure 4.1.3.1: BMDM deconvoluted Tubulin (green), VISTA N12 (magenta) and Dapi (blue) staining
p.55
Figure 4.1.3.2: BMDM deconvoluted VISTA S14 (magenta), vesicle marker (green) and Dapi (blue) (column c) staining, without Dapi (column a), corresponding colocalizing pixel (column b)
p.55
Figure 4.1.3.3: BMDMs deconvoluted Perforin (green) and VISTA S14 (magenta) staining colocalization analysis of the section (right top), section flipped horizontal (bottom left, Rtotal: 2,98 %), section flipped vertical (bottom right, Rtotal: 12,29 %)
p.56
Figure 4.1.3.4: Western Blot of 4*106 BMDMs on a vesicle gradient of different sucrose concentrations (25, 35 and 45 % sucrose in TBS+100 mM KCl)
p.56
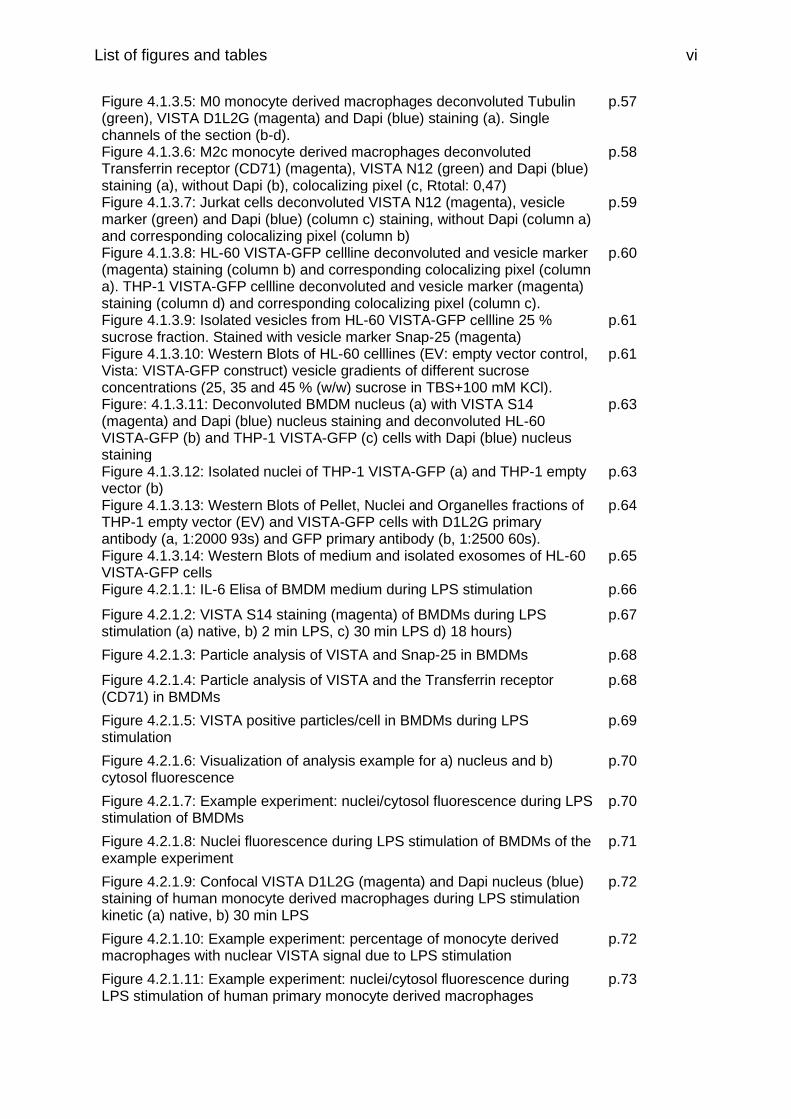
List of figures and tables vi
Figure 4.1.3.5: M0 monocyte derived macrophages deconvoluted Tubulin (green), VISTA D1L2G (magenta) and Dapi (blue) staining (a). Single channels of the section (b-d).
p.57
Figure 4.1.3.6: M2c monocyte derived macrophages deconvoluted Transferrin receptor (CD71) (magenta), VISTA N12 (green) and Dapi (blue) staining (a), without Dapi (b), colocalizing pixel (c, Rtotal: 0,47)
p.58
Figure 4.1.3.7: Jurkat cells deconvoluted VISTA N12 (magenta), vesicle marker (green) and Dapi (blue) (column c) staining, without Dapi (column a) and corresponding colocalizing pixel (column b)
p.59
Figure 4.1.3.8: HL-60 VISTA-GFP cellline deconvoluted and vesicle marker (magenta) staining (column b) and corresponding colocalizing pixel (column a). THP-1 VISTA-GFP cellline deconvoluted and vesicle marker (magenta) staining (column d) and corresponding colocalizing pixel (column c).
p.60
Figure 4.1.3.9: Isolated vesicles from HL-60 VISTA-GFP cellline 25 % sucrose fraction. Stained with vesicle marker Snap-25 (magenta)
p.61
Figure 4.1.3.10: Western Blots of HL-60 celllines (EV: empty vector control, Vista: VISTA-GFP construct) vesicle gradients of different sucrose concentrations (25, 35 and 45 % (w/w) sucrose in TBS+100 mM KCl).
p.61
Figure: 4.1.3.11: Deconvoluted BMDM nucleus (a) with VISTA S14 (magenta) and Dapi (blue) nucleus staining and deconvoluted HL-60 VISTA-GFP (b) and THP-1 VISTA-GFP (c) cells with Dapi (blue) nucleus staining
p.63
Figure 4.1.3.12: Isolated nuclei of THP-1 VISTA-GFP (a) and THP-1 empty vector (b)
p.63
Figure 4.1.3.13: Western Blots of Pellet, Nuclei and Organelles fractions of THP-1 empty vector (EV) and VISTA-GFP cells with D1L2G primary antibody (a, 1:2000 93s) and GFP primary antibody (b, 1:2500 60s).
p.64
Figure 4.1.3.14: Western Blots of medium and isolated exosomes of HL-60 VISTA-GFP cells
p.65
Figure 4.2.1.1: IL-6 Elisa of BMDM medium during LPS stimulation p.66
Figure 4.2.1.2: VISTA S14 staining (magenta) of BMDMs during LPS stimulation (a) native, b) 2 min LPS, c) 30 min LPS d) 18 hours)
p.67
Figure 4.2.1.3: Particle analysis of VISTA and Snap-25 in BMDMs p.68
Figure 4.2.1.4: Particle analysis of VISTA and the Transferrin receptor (CD71) in BMDMs
p.68
Figure 4.2.1.5: VISTA positive particles/cell in BMDMs during LPS stimulation
p.69
Figure 4.2.1.6: Visualization of analysis example for a) nucleus and b) cytosol fluorescence
p.70
Figure 4.2.1.7: Example experiment: nuclei/cytosol fluorescence during LPS stimulation of BMDMs
p.70
Figure 4.2.1.8: Nuclei fluorescence during LPS stimulation of BMDMs of the example experiment
p.71
Figure 4.2.1.9: Confocal VISTA D1L2G (magenta) and Dapi nucleus (blue) staining of human monocyte derived macrophages during LPS stimulation kinetic (a) native, b) 30 min LPS
p.72
Figure 4.2.1.10: Example experiment: percentage of monocyte derived macrophages with nuclear VISTA signal due to LPS stimulation
p.72
Figure 4.2.1.11: Example experiment: nuclei/cytosol fluorescence during LPS stimulation of human primary monocyte derived macrophages
p.73

List of figures and tables vii
Figure 4.2.1.12: qRT-PCR of VISTA in LPS stimulated human monocyte derived macrophages
p.74
Figure 4.2.2.1: Confocal staining of VISTA D1L2G in human monocyte derived macrophages a) native, b) 30 min LPS, c) 24 h DAPT + 30 min LPS d) 48 h TAPI-2 + 30 min LPS
p.76
Figure 4.2.2.2: Example experiment: percentage of human monocyte derived macrophages with nuclear VISTA w/o inhibitors and LPS stimulus
p.77
Figure 4.2.2.3: qRT-PCR of VISTA in primary monocyte derived macrophages (prim. MO) w/o DAPT and LPS stimulation
p.77
Figure 4.2.3.1: IL-6 Elisa of BMDM during LPS stimulation, seeded in different densities (Inset),
p.78
Figure 4.2.3.2: Normalized IL-6 concentration for different BMDM densities (Inset) during LPS stimulation
p.79
Figure 4.2.3.3: Nuclei/cytosol fluorescence of BMDM during LPS stimulation, seeded in different densities
p.80
Figure 4.3.1.1: Morphology of THP-1 wt (a), THP-1 VISTA-GFP (b), HL-60 EV (c) and HL-60 VISTA-GFP celllines after 3 days with 1 µM PMA
p.81
Figure 4.3.1.2: Morphology of THP-1 wt (a), THP-1 VISTA-GFP (b), HL-60 EV (c) and HL-60 VISTA-GFP celllines after 3 days of a culture with 1 µM PMA in 4x times higher cell density
p.81
Figure 4.3.2.1: Adhesion of suspension cells a) THP-1 wt, b) THP-1 VISTA-GFP, c) HL-60 EV and d) HL-60 VISTA-GFP after 4 days
p.82
Figure 4.3.2.2: Example experiment: adhesion of suspension celllines p.83
Figure 4.3.2.3: Example experiment: adhesion of suspension celllines with supernatant of VISTA-GFP cells
p.83
Figure: 4.3.3.1: Example experiment: phagocytosis of SudHL4 by HL-60 celllines (M0 macrophages) in addition with 1 µg/mL Rituximabs
p.84
Figure 4.3.3.2: Pictures of phagocytosis of SudHL10 (red) by different macrophage types of HL-60 cells
p.85
Figure 4.3.3.3: Example experiment: phagocytosis of SudHL10 for four hours by different macrophage types of HL-60 and THP-1 celllines
p.85
Figure 4.3.3.4: Example experiment: number of engulfed tumor cells after 4 h phagocytosis of SudHL10 by M2c macrophages of HL-60 and THP-1 celllines
p.86
Figure 4.3.3.5: Summary of phagocytosis of SudHL10 by different macrophage types of HL-60 and THP-1 celllines
p.87
Figure 4.3.3.6: Summary of phagocytosis of SudHL10 by different of HL-60 and THP-1 celllines
p.88
Figure 4.3.4.1: Primary M2c monocyte derived macrophages (red) phagocyting HL-60 EV (green, a) and HL-60 VISTA (green, b)
p.88
Figure 4.3.4.2: Example experiment: 300 min phagocytosis of non-radiated tumor celllines by monocyte derived macrophages, cellline grouped
p.89
Figure 4.3.4.3: Example experiment: 300 min phagocytosis of non-radiated tumor celllines by monocyte derived macrophages, macrophage type grouped
p.90

List of figures and tables viii
Figure 4.3.4.4: Example experiment: 120 min phagocytosis of radiated tumor celllines by monocyte derived macrophages, macrophage type grouped
p.91
Figure 4.3.4.5: Example experiment: 120 min phagocytosis of radiated tumor celllines by monocyte derived macrophages, tumor cellline grouped
p.91
Figure 4.3.5.1: qRT-PCR of PD-L1 on M0 macrophage-like differentiated celllines w/o VISTA overexpression
p.92
Figure 4.3.5.2: qRT-PCR of Adam10 and Smad3 on M0 macrophage-like differentiated celllines w/o VISTA overexpression
p.93
Figure 4.3.5.3: qRT-PCR of Id2 on M0 macrophage-like differentiated celllines w/o VISTA overexpression
p.93
Figure 4.3.5.4: Flow cytometry analysis of CD14 surface expression on differentiated M0 macrophage-like celllines w/o VISTA overexpression
p.95
Figure 4.3.5.5: Flow cytometry analysis of CD80 and CD86 surface expression on differentiated M0 macrophage-like celllines w/o VISTA overexpression
p.96
Figure 4.3.5.6: Flow cytometry analysis of CD163 surface expression on differentiated M0 macrophage-like celllines w/o VISTA overexpression
p.96
Figure 4.3.5.7: Flow cytometry analysis of MHC-I and MHC-II surface expression on differentiated M0 macrophage-like celllines w/o VISTA overexpression
p.97
Figure 5.2.1: Model of intracellular trafficking and translocation of VISTA p.102
Figure 5.3.1: Overview about all published interaction partners, dependencies and signaling pathways so far
p.106
Figure 7.1.1: Vector card of pETM-11 p.119
Figure 7.1.2: Vector card of pETGST1a p.119
Figure 7.2.1: Analytical SEC of standard proteins p.120
Figure 7.2.2: Raw chromatograms of standard proteins p.120
Figure 7.2.3: Raw SEC chromatogram of VISTA IgV after dialysis without baseline correction
p.121
Figure 7.2.4: Raw SEC chromatogram of VISTA IgV after renaturation of Ni2+-column without baseline correction
p.121
Figure 7.2.5: BMDM differentiation control, day 1 undifferentiated (a) and differentiated day 7 (b)
p.121
Figure 7.2.6: Adsorption control of intracellular VISTA on VISTA antibody S14
p.122
Figure 7.2.7: secondary antibody controls of Jurkat cells, bone marrow derived macrophages and monocyte derived macrophages with anti-mouse, anti-rabbit and anti-goat antibodies
p.122
Figure 7.2.8: Isolated exosomes of HL-60 VISTA-GFP cells (a) and HL-60 EV cells (b)
p.123
Figure 7.2.9: Isolated exosomes of THP-1 VISTA-GFP cells (a) and THP-1 EV cells (b)
p.123
Figure 7.2.10: Gating strategy for HL-60 EV and HL-60 VISTA-GFP cells p.123
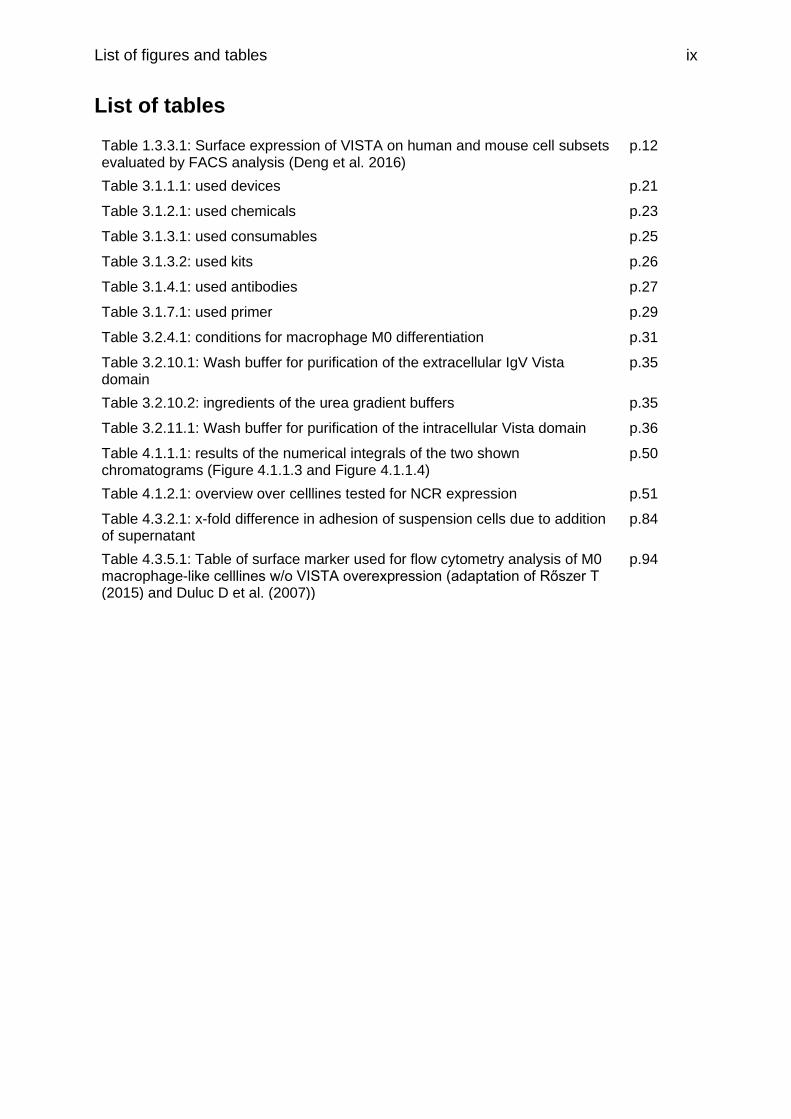
List of figures and tables ix
List of tables
Table 1.3.3.1: Surface expression of VISTA on human and mouse cell subsets evaluated by FACS analysis (Deng et al. 2016)
p.12
Table 3.1.1.1: used devices p.21
Table 3.1.2.1: used chemicals p.23
Table 3.1.3.1: used consumables p.25
Table 3.1.3.2: used kits p.26
Table 3.1.4.1: used antibodies p.27
Table 3.1.7.1: used primer p.29
Table 3.2.4.1: conditions for macrophage M0 differentiation p.31
Table 3.2.10.1: Wash buffer for purification of the extracellular IgV Vista domain
p.35
Table 3.2.10.2: ingredients of the urea gradient buffers p.35
Table 3.2.11.1: Wash buffer for purification of the intracellular Vista domain p.36
Table 4.1.1.1: results of the numerical integrals of the two shown chromatograms (Figure 4.1.1.3 and Figure 4.1.1.4)
p.50
Table 4.1.2.1: overview over celllines tested for NCR expression p.51
Table 4.3.2.1: x-fold difference in adhesion of suspension cells due to addition of supernatant
p.84
Table 4.3.5.1: Table of surface marker used for flow cytometry analysis of M0 macrophage-like celllines w/o VISTA overexpression (adaptation of Rőszer T (2015) and Duluc D et al. (2007))
p.94

Summary x
Summary
Negative checkpoint regulators are targets in immunotherapy directed against the
immunosuppressive environment of tumor cells. A novel promising target for
checkpoint therapy is V-domain immunoglobulin (Ig)-containing suppressor of T-cell
activation (VISTA). VISTA is expressed on the surface of T-lymphocytes, Antigen
Presenting Cells (APCs) and cells of tumor tissue. I characterized the role of VISTA on
APCs and investigated its intracellular distribution. In addition, I investigated the effect
of immunogenic stimulation on the intracellular distribution and the functional effects of
VISTA overexpression on APCs.
As professional APCs, I analyzed the expression and localization of VISTA in murine
bone marrow derived macrophages (BMDMs) and human monocyte derived
macrophages, using immunohistochemistry. Furthermore, I compared my results with
the expression of VISTA in the human T-cellline Jurkat and confirmed them by
transfecting the myeloid celllines HL-60 and THP-1 with a VISTA-GFP fusion protein,
allowing tracking of VISTA localization. I isolated different cell fractions and organelles
of different cell types and analyzed them for the presence of the VISTA. VISTA
colocalized in all tested primary cells and celllines with several vesicle markers along
microtubule fibers. Furthermore, I found VISTA expression in the nuclei and secreted
exosomes in all tested cells.
Immunogenic LPS activation led to a release of VISTA vesicles to the cell surface in
the particle analysis and increased the nuclear VISTA expression in IHC staining for a
specific duration. In similarity to VISTA, the model NCR CTLA-4 is stored in vesicles
to enable a fast and dynamic adaptation of the surface expression in reaction to
immunogenic stimuli. VISTA shows a high homology to the model checkpoint regulator
ligand PD-L1, which is expressed in the nucleus as well with an anti-apoptotic function.
I conclude that storage of VISTA in vesicles in antigen presenting cells and T-cells
allows a fast reaction on immunogenic stimuli. VISTA secretion in exosomes could
have a messenger function for cell-cell communication and the nuclear VISTA implies
an unknown transcriptional role with an optional positive feedback mechanism or
antiapoptotic function.
The overexpression of VISTA-GFP in the myeloid celllines HL-60 and THP-1 led to
increased adhesion and differentiation of the cells towards macrophages. Both
celllines can be differentiated into macrophage-like cells which showed an increased
phagocytosis activity with VISTA overexpression. Furthermore, the phagocytosis of
human monocyte derived macrophages was increased when engulfing VISTA
overexpressing tumor celllines.
Despite the increased phagocytosis, VISTA is an immunoinhibitory regulator. This is
possible via decreased antigen presentation due to VISTA. VISTA overexpression led
to a decrease of MHC-II expression. In addition, our collaboration partner discovered
via pull out that VISTA and MHC-II are interaction partner. This is an interesting new
immunoregulatory axis and target for immunotherapy. The binding of MHC-II as an
immunoinhibitory strategy is already known by the immune regulator LAG-3 and could
be a promising approach to overcome PD-1 therapy resistance.

Summary xi
VISTA has a complex function and expression pattern on APCs and is able to affect
adhesion, differentiation, phagocytosis and the immune function of APCs.
Our results provided new and complementing properties of VISTA and expanded its
interaction network. With further investigation of the interaction partners and signaling
pathways of VISTA, an efficient and safe VISTA therapy might be possible. Especially
a combinational therapy of VISTA with PD-1 or PD-L1 could be able to solve some of
the occurring resistance and response rate issues.
Zusammenfassung xii
Zusammenfassung
Negative Kontrollpunkt Regulatoren (NCR) sind Ziele der Immuntherapie, die sich
gegen die immunsuppressive Umgebung von Tumorzellen richtet. Ein neuer
vielversprechender Angriffspunkt dieser Kontrollpunkt-Therapie ist V-domain
immunoglobulin (Ig)-containing suppressor of T-cell activation (VISTA). VISTA ist auf
der Oberfläche von T-Lymphozyten, Antigenpräsentierenden Zellen (APCs) und
Tumorgewebe exprimiert. Ich habe die Rolle von VISTA auf APCs und seine
intrazelluläre Verteilung charakterisiert und untersucht. Dabei habe ich den Effekt
immunogener Stimulation auf die intrazelluläre VISTA Verteilung und die funktionalen
Auswirkungen für APCs mit VISTA Überexpression, untersucht.
Dazu habe ich in professionellen APCs per Immunohistochemie (IHC) die Expression
und Lokalisation von VISTA in murinen Makrophagen aus Knochenmark (BMDMs) und
humanen Makrophagen aus Monozyten analysiert. Meine Ergebnisse habe ich mit der
VISTA Expression in der humanen T-Zelllinie Jurkat verglichen und durch die
Transfektion der myeloiden Zelllinien HL-60 und THP-1 mit einem VISTA-GFP
fluoreszierenden Fusionsprotein, das die Verfolgung der VISTA Lokalisation
ermöglicht, bestätigt. Ich habe diverse Zellfraktionen und Organellen verschiedener
Zelltypen isoliert und auf die Präsenz von VISTA hin untersucht. VISTA kolokalisierte
in allen getesteten primären Zellen, sowie Zelllinien entlang von Mikrotubulin Fibern
mit mehreren Vesikelmarkern. Außerdem habe ich für alle getesteten Zellen, VISTA
Expression im Zellkern und in sekretierten Exosomen gefunden.
Die immunogene Aktivierung mit LPS führte laut unserer Partikelanalyse zu einer
Freisetzung der VISTA Vesikel an die Zelloberfläche und erhöhte die nukleare VISTA
Expression für eine gewisse Dauer in IHC Färbungen. Wie VISTA, wird auch der
Modell NCR CTLA-4 in Vesikeln gelagert, die eine schnelle und dynamische
Anpassung der Oberflächenexpression an immunogene Stimuli erlauben. VISTA zeigt
eine hohe Homologie zu dem Modell Kontrollpunkt Regulator Liganden PD-L1, der
auch im Kern exprimiert wird, mit anti-apoptotischer Funktion. Ich komme daher zu
dem Schluss, dass das Lagern von VISTA in Vesikeln in Antigenpräsentierenden
Zellen und T-Zellen eine schnelle Reaktion auf immunogene Stimuli ermöglicht. Die
VISTA Sekretion in Exosomen könnte eine Botenstoff Funktion für die Zell-Zell-
Kommunikation ermöglichen und die nukleare Expression von VISTA impliziert eine
bisher unbekannte transkriptionale Rolle von VISTA mit optionalem positiven
Rückkopplungsmechanismus oder anti-apoptotischer Funktion.
Die Überexpression von VISTA-GFP in den myeloiden Zelllinien HL-60 und THP-1
führte zu erhöhter Adhäsion und Makrophagen Differenzierung der Zellen. Beide
Zelllinien können in Makrophagen-ähnliche Zellen differenziert werden, die nach
VISTA Überexpression eine erhöhte Phagozytose Aktivität zeigten. Auch die
Phagozytose von humanen Makrophagen aus Monozyten war erhöht, wenn sie
Tumorzelllinien mit VISTA Überexpression phagozytierten.
Trotz der erhöhten Phagozytose, ist VISTA ein immuninhibierender Regulator. Das ist
möglich indem VISTA die Antigen Präsentation senkt. Überexpression von VISTA
führte zu einer geringeren MHC-II Expression. Außerdem haben unsere
Kooperationspartner durch einen Pull-out Assay herausgefunden, dass VISTA und

Zusammenfassung xiii
MHC-II Interaktionspartner sind. Dies stellt eine neue interessante
immunregulatorische Achse dar, die als Ziel der Immuntherapie dienen könnte. Die
Strategie MHC-II als immuninhibitorische Strategie zu binden, ist bereits von dem
Immunregulator LAG-3 bekannt und könnte einen vielversprechenden Ansatz
darstellen, um zukünftig die Resistenz gegen PD-1 Therapie zu überwinden.
VISTA hat eine komplexe Funktion und Expressionsmuster auf APCs und ist damit in
der Lage die Adhäsion, Differenzierung, Phagozytose und Immunfunktion von APCs
zu beeinflussen.
Unsere Ergebnisse zeigten neue und ergänzende Eigenschaften von VISTA und
haben das bisher bekannte Interaktionsnetzwerk von VISTA erweitert. MIt weiteren
Untersuchungen der Interaktionspartner und Signalwege von VISTA, könnte zukünftig
eine effiziente und sichere VISTA Therapie möglich sein. Insbesondere die
kombinierte Therapie von VISTA und PD-1 oder PD-L1 könnte in der Lage sein, die
bestehenden Schwierigkeiten von Therapie Resistenz und geringen Ansprechraten zu
lösen.
Introduction 1
1 Introduction
1.1 Immune system
Our body uses two defense systems against infections and pathogens: the innate and
the adaptive immune system.
The innate immune system reacts rapidly to structures which are common on many
pathogens. It recognizes structure elements like specific glycolipids or nucleic acid
formations, which are highly conserved between many pathogens but absent in
humans. The innate immune system is maintained by phagocytes like macrophages,
dendritic cells and neutrophils, but also by mast cell, basophils, eosinophils and natural
killer cells. These immune cells phagocyte and kill the pathogens, which they identified
by the conserved structure elements.
But the repertoire of this fast innate system is limited and not able to adapt to new
structures on pathogens. So, a more organized system with the ability of adaption and
evolution is needed in addition.
The adaptive immune system reacts on pathogen specific peptides and proteins called
antigens. It can build 108 different antibodies and more than 1012 T-cell receptors
(TCRs) which represent different surfaces. It is slower than the innate system but has
the ability of evolutionary adaptations and a memory function of experienced
pathogens.
The adaptive immune system can be distributed in humoral and the cellular immunity.
In the humoral immunity, soluble proteins, called antibodies or immunoglobulins, bind
foreign antigen molecules, marking pathogens on the surface for destruction. These
antibodies are produced by B-cells.
In the cellular immune response cytotoxic T-lymphocytes kill infected cells. Intracellular
infections are not visible on the cell surface, so vertebrates developed a mechanism to
mark the cell surface with molecules from the cell and from the foreign content. Some
of the internal proteins are degraded to peptides and bind to major histocompatibility
complex-I or -II (MHC-I/-II) as antigens. T-cells check the complexes with their T-cell
Receptors (TCRs) to find and kill infected cells.
In addition, Antigen Presenting Cells (APCs) like dendritic cells of the innate immune
system, phagocyte pathogens and present their proteins as antigens to naive T-cells
in the lymphatic system on MHC-II complexes. That leads to an efficient combination
of the innate and the adaptive immune system against pathogens.
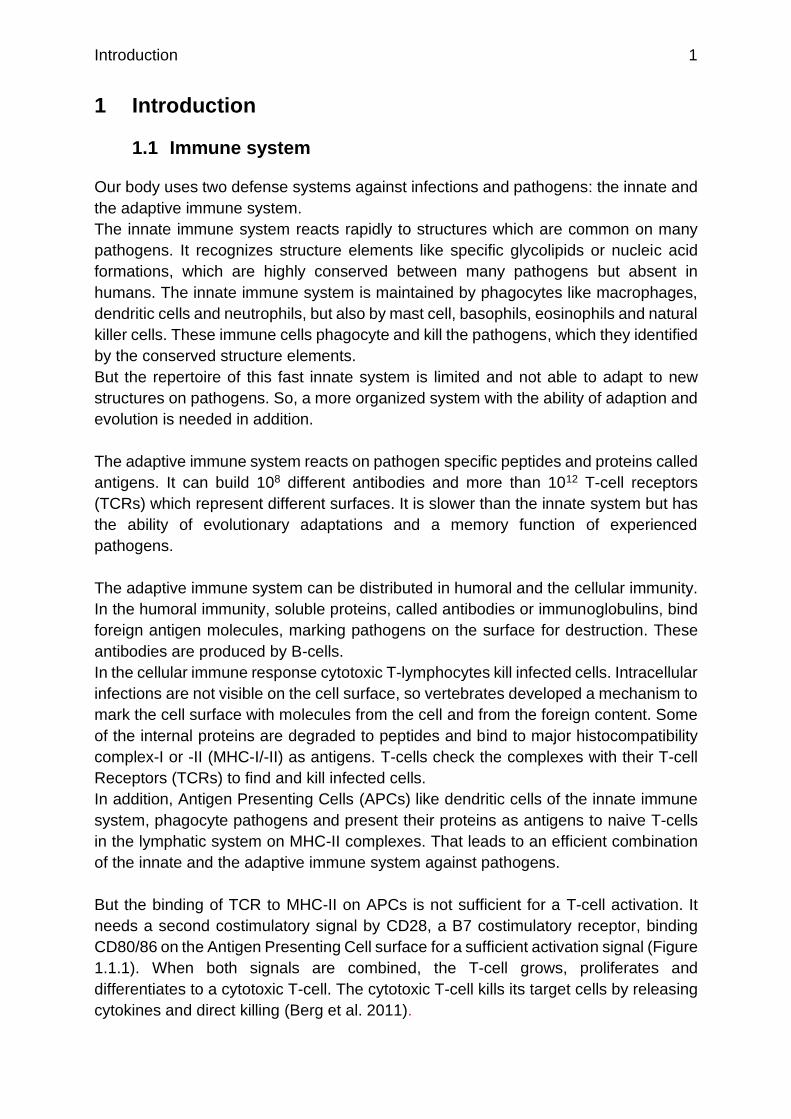
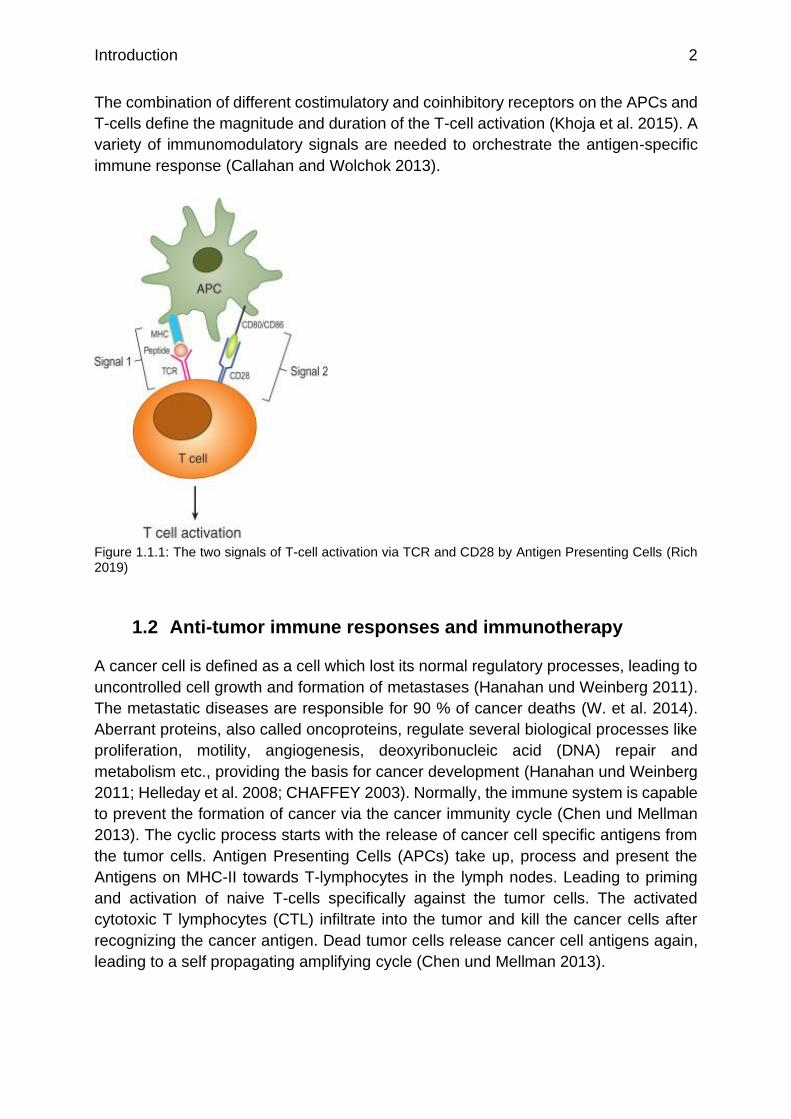
But the binding of TCR to MHC-II on APCs is not sufficient for a T-cell activation. It
needs a second costimulatory signal by CD28, a B7 costimulatory receptor, binding
CD80/86 on the Antigen Presenting Cell surface for a sufficient activation signal (Figure
1.1.1). When both signals are combined, the T-cell grows, proliferates and
differentiates to a cytotoxic T-cell. The cytotoxic T-cell kills its target cells by releasing
cytokines and direct killing (Berg et al. 2011).
Introduction 2
The combination of different costimulatory and coinhibitory receptors on the APCs and
T-cells define the magnitude and duration of the T-cell activation (Khoja et al. 2015). A
variety of immunomodulatory signals are needed to orchestrate the antigen-specific
immune response (Callahan and Wolchok 2013).
Figure 1.1.1: The two signals of T-cell activation via TCR and CD28 by Antigen Presenting Cells (Rich 2019)
1.2 Anti-tumor immune responses and immunotherapy
A cancer cell is defined as a cell which lost its normal regulatory processes, leading to
uncontrolled cell growth and formation of metastases (Hanahan und Weinberg 2011).
The metastatic diseases are responsible for 90 % of cancer deaths (W. et al. 2014).
Aberrant proteins, also called oncoproteins, regulate several biological processes like
proliferation, motility, angiogenesis, deoxyribonucleic acid (DNA) repair and
metabolism etc., providing the basis for cancer development (Hanahan und Weinberg
2011; Helleday et al. 2008; CHAFFEY 2003). Normally, the immune system is capable
to prevent the formation of cancer via the cancer immunity cycle (Chen und Mellman
2013). The cyclic process starts with the release of cancer cell specific antigens from
the tumor cells. Antigen Presenting Cells (APCs) take up, process and present the
Antigens on MHC-II towards T-lymphocytes in the lymph nodes. Leading to priming
and activation of naive T-cells specifically against the tumor cells. The activated
cytotoxic T lymphocytes (CTL) infiltrate into the tumor and kill the cancer cells after
recognizing the cancer antigen. Dead tumor cells release cancer cell antigens again,
leading to a self propagating amplifying cycle (Chen und Mellman 2013).

Introduction 3
Therefore, every cancer which was able to develop and grow established a strategy to
evade this immune surveillance (Figure 1.2.1). For that, Schreiber and colleagues
described the three phases of “cancer immunoediting”:
1. The elimination phase by which innate and adaptive immune response is
triggered to specific tumor-associated antigens;
2. The equilibrium phase by which a balance between immune-mediated
destruction and persistence of rare mutated malignant cell clones is created,
and
3. Immunologic escape by which the malignant cancer clones are able to evade
the adaptive immune system and continue growing
(Schreiber et al. 2011)
Figure 1.2.1 Cancer immunoediting (Swann und Smyth 2007) of transformed tissue. Distributed in the three phases elimination, equilibrium and escape leading to progressing cancer cells resistant to immune destruction.
This deregulated immune response in cancer, allows tumor cells to escape from the
immune surveillance. But tumors can also use other mechanisms to evade the immune
surveillance, like loss or alteration of specific neoantigens, promotion of an immune-
tolerant microenvironment by manipulation of cytokines and upregulation of immune
checkpoint molecules (van Limbergen et al. 2017; Blank et al. 2016).
Introduction 4
The immunotherapy was developed to prevent the tumor cells avoiding the immune
destruction and hiding from the immune surveillance. For that, immunotherapy
stimulates and boosts the patient’s immune system to improve or restore the immune
system function so it will kill the cancer cells independently. One of the main
advantages of boosting the immune system compared to classical cancer therapy with
e.g. chemotherapy is that the immune system will also recognize and destroy all distant
metastases, when triggered against cancer cells specifically. In addition, the immune
system can prevent a relapse of cancer because of the memory function of the
adaptive immune system.
There are several types of immunotherapy, including:
- Non-specific immunotherapies
- Cancer vaccines
- Oncolytic virus therapy
- T-cell therapy
- Monoclonal antibodies and tumor-agnostic therapies
1.2.1 Non-specific immunotherapies
In comparison to other immunotherapies the non-specific immunotherapy activates the
immune system generally but not via responses against an antigen or a set of antigens.
These therapies involve both the innate and adaptive immune system and are often
given together with other cancer treatments like chemotherapy or radiation. These
therapies include:
- cytokines like interleukins and interferons
- immunostimulatory agents like the Bacille Calmette-Guérin germ
- enzyme inhibitors
They can reverse the immune suppression, act directly on anti-tumor cells, activate the
innate immunity or activate T-cells without specific antigen (Monjazeb et al. 2012).
Interleukin 2 for example helps the immune system to produce faster and more T-cells
and is used to treat kidney cancer and skin cancer.
All non-specific immunotherapies can lead to flu-like symptoms, weight gain, heart
problems and other side effects. In addition, the impact is limited because of the non-
specific function.
1.2.2 Cancer vaccines
A cancer vaccine exposes the immune system to a cancer specific antigen. It either
treats existing cancer, known as therapeutic cancer vaccines, or prevents development
of cancer.
Some tumors caused by viruses, like liver cancer and carcinoma of the uterine cervix,
can be prevented by HBV or HPV vaccines (Chang et al. 1997; Wheeler 2007).
Introduction 5
For the therapeutic cancer vaccine proteins from cancer cells are separated to
immunize patients as antigens and stimulate the immune system against these cancer
cells (Giarelli 2007).
Another approach is to vaccinate patients via oncolytic viruses, as described in 1.2.3.
The therapeutic vaccination against established tumors shows disappointing
effectiveness. Suboptimal vaccine design and an immunosuppressive tumor
microenvironment are discussed as possible reasons. It is difficult to find an antigen
which is evaluated as foreign for the immune system and is expressed on the majority
of the heterogenous tumor cells. To enhance cancer vaccines, the antigen choice
needs to be improved and combinational treatments that reverse immunosuppressive
mechanisms, like PD-1 blockade (chapter 1.3.1) are suggested (Yang 2015).
1.2.3 Oncolytic virus therapy
The oncolytic virus therapy uses genetically modified viruses which can replicate in
cancer cells, but not in healthy cells, leading to the lysis of tumor cells. Lysis of the
cancer cell releases cancer cell antigens, which triggers the patient’s immune system
into the immunosuppressive environment of tumors. As a result, the immune system
will target all the cancer cells with the same antigens. Involving the innate and adaptive
immune system, this therapy leads to a long-lasting immunological memory which
avoids relapse and metastatic spread (Marelli et al. 2018). The FDA approved the first
oncolytic virus therapy, called T-VEC, against melanoma. There are several more
constructs in different virus types in development but with unsatisfactory results so far.
The main issue of oncolytic viruses is that they are recognized by the immune system
as pathogens and could be cleared without a sufficient anti-tumor effect due to anti-
viral immunity. Therefore, it is important to design oncolytic viruses that replicate and
spread quickly within tumors before viral clearance.
In addition, it is difficult for oncolytic viruses to infect large tumors due to the physical
barriers or the poor tumor vascularization.
Oncolytic viruses are mostly administered intravenous which leads to several
obstacles and side effects. The main obstacle of this therapy is the clearance of the
virus via the host immune system before it has an impact on the target tissue. Oncolytic
viruses can also hyper activate the immune system leading to fever, fatigue, nausea
and flu-like symptoms. In elderly patients they can cause a chronic infection due to the
weaker immune system leading to side effects and a resistance to the therapy.
To use this therapy more widely in the future, it is important to find a balance between
the anti-viral response and the anti-tumor response. For that purpose, safer but more
powerful viruses are needed. Therefore oncolytic viruses are tested in combination
with classical treatments or other immunotherapies (Marelli et al. 2018).
Introduction 6
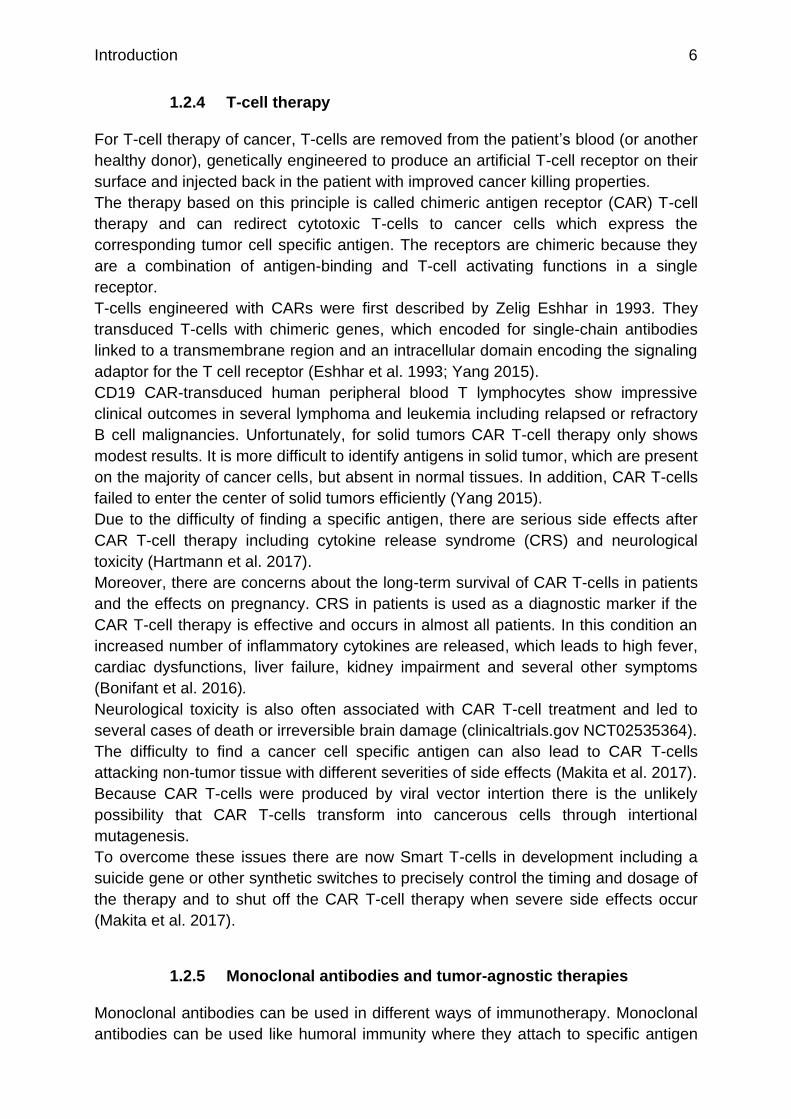
1.2.4 T-cell therapy
For T-cell therapy of cancer, T-cells are removed from the patient’s blood (or another
healthy donor), genetically engineered to produce an artificial T-cell receptor on their
surface and injected back in the patient with improved cancer killing properties.
The therapy based on this principle is called chimeric antigen receptor (CAR) T-cell
therapy and can redirect cytotoxic T-cells to cancer cells which express the
corresponding tumor cell specific antigen. The receptors are chimeric because they
are a combination of antigen-binding and T-cell activating functions in a single
receptor.
T-cells engineered with CARs were first described by Zelig Eshhar in 1993. They
transduced T-cells with chimeric genes, which encoded for single-chain antibodies
linked to a transmembrane region and an intracellular domain encoding the signaling
adaptor for the T cell receptor (Eshhar et al. 1993; Yang 2015).
CD19 CAR-transduced human peripheral blood T lymphocytes show impressive
clinical outcomes in several lymphoma and leukemia including relapsed or refractory
B cell malignancies. Unfortunately, for solid tumors CAR T-cell therapy only shows
modest results. It is more difficult to identify antigens in solid tumor, which are present
on the majority of cancer cells, but absent in normal tissues. In addition, CAR T-cells
failed to enter the center of solid tumors efficiently (Yang 2015).
Due to the difficulty of finding a specific antigen, there are serious side effects after
CAR T-cell therapy including cytokine release syndrome (CRS) and neurological
toxicity (Hartmann et al. 2017).
Moreover, there are concerns about the long-term survival of CAR T-cells in patients
and the effects on pregnancy. CRS in patients is used as a diagnostic marker if the
CAR T-cell therapy is effective and occurs in almost all patients. In this condition an
increased number of inflammatory cytokines are released, which leads to high fever,
cardiac dysfunctions, liver failure, kidney impairment and several other symptoms
(Bonifant et al. 2016).
Neurological toxicity is also often associated with CAR T-cell treatment and led to
several cases of death or irreversible brain damage (clinicaltrials.gov NCT02535364).
The difficulty to find a cancer cell specific antigen can also lead to CAR T-cells
attacking non-tumor tissue with different severities of side effects (Makita et al. 2017).
Because CAR T-cells were produced by viral vector intertion there is the unlikely
possibility that CAR T-cells transform into cancerous cells through intertional
mutagenesis.
To overcome these issues there are now Smart T-cells in development including a
suicide gene or other synthetic switches to precisely control the timing and dosage of
the therapy and to shut off the CAR T-cell therapy when severe side effects occur
(Makita et al. 2017).
1.2.5 Monoclonal antibodies and tumor-agnostic therapies
Monoclonal antibodies can be used in different ways of immunotherapy. Monoclonal
antibodies can be used like humoral immunity where they attach to specific antigen

Introduction 7
proteins on cancer cells and flag the cells for destruction. Other antibodies work by
releasing the brakes on the immune system via blocking negative checkpoint
regulators, called immune checkpoint therapy which will be introduced further in
chapter 1.2. The checkpoints are activated by ligand-receptor interaction and the
antibodies are designed to block the interaction between ligands on tumor and their
checkpoint receptors on immune cells (Alatrash et al. 2013).
Most immune checkpoint inhibitors are approved for specific cancers, but some are
used to treat tumors with a specific genetic change anywhere in the body, so called
tumor-agnostic treatments. For example, there are antibodies approved against
metastatic or unresectable tumors with a high microsatellite instability or DNA
mismatch repair deficiency. These tumors develop often many mutations and are more
easy to be identified by the immune system (Khoja et al. 2015; Sundar et al. 2015).
To increase the response rate there are many combinations of different antibodies
against negative checkpoint regulators in clinical trials.
Like all immunotherapies the monoclonal antibody therapy can lead to several side
effects. All of them are immune-related adverse events like flu-like symptoms, allergic
reactions, hepatic toxicity, colitis or autoimmune toxicity. Death cases were observed
because of the toxicity of immune-related adverse effects, but in contrast to other
oncology treatments, the toxicities do not appear to be cumulative over time (Alatrash
et al. 2013; Agarwala 2015).
The biggest issue of the checkpoint therapy so far, is the unprecise prediction which
patients will benefit from it. There are currently many studies looking for biomarkers,
but beside the ligand expression level of negative checkpoint regulators no biomarkers
are identified so far and the ligand expression is not sufficient to predict the therapeutic
outcome (Agarwala 2015).
Immune checkpoint therapy and CAR T-cells are the most successful
immunotherapies so far and highlight a breakthrough for cancer immunotherapy.
However, immunotherapy only works on a subset of cancers, it is struggling especially
in treatment of solid tumors, and only a minor subset of patients are responding to
immunotherapy (Yang 2015).
After this general introduction about possible immune therapies I will focus on the
checkpoint therapy and their targets for this thesis.
1.3 Negative checkpoint regulators and immune checkpoint
therapy
Negative checkpoint regulators (NCRs) are molecules that decrease T-cell activation
and cell-mediated immune response within a safe range for the host. Many of the
NCRs are part of the CD28-B7 protein family. NCRs are the most important brake for
tendering the TCR signaling against overreactions of the immune system. Deletion or
blocking of NCRs can lead to strong autoimmune reactions or chronic infections.

Introduction 8
Negative checkpoint regulators can act as receptors and ligands. In this system the
term “receptor” refers to the surface protein on cytotoxic T-lymphocytes (CTLs) while
the term “ligand” describes the surface protein on all other cell types that interact with
the CTLs. But many NCR receptors and ligands have multiple binding partner and
interact bidirectional. This complex signaling must be considered in immunotherapy
against negative checkpoints regulators (Lines et al. 2014b).
Prototypical NCRs are CTLA-4 and PD-1 which are now introduced further.
1.3.1 PD-1 and PD-L1
Programmed Death receptor-1 (PD-1) was discovered in 1992 and is a member of the
CD28-B7 superfamily. This NCR is expressed on T-cells, B-cells, monocytes, natural
killer T-cells and Antigen Presenting Cells (APCs) like Dendritic Cells (DCs), with the
highest immunoinhibitory relevance as a receptor on B- and T-cells (Ishida et al. 1992;
Nishimura et al. 1999; Nishimura et al. 2001). It binds its ligands PD-L1 and PD-L2 on
Antigen Presenting Cells. PD-1 is a critical NCR, which has an immunoregulatory role,
tenders inflammation and maintains the peripheral tolerance. Upon immune activation
PD-1 is upregulated on T-cells and B cells (Agata et al. 1996). PD-1 expression is
upregulated by common γ-chain cytokines and VEGF (Kinter et al. 2008; Voron et al.
2015).
PD-1 modulates the antigen-specific immune response against infection and cancer
(Freeman et al. 2000; Iwai et al. 2002; Iwai et al. 2005). The binding of PD-1 with its
ligands (Figure 1.3.1.1 b) leads to a decreased cytokine production, cytotoxicity and
antibody formation. Therefore, PD-1 inhibits autoimmunity and anti-tumor or anti-
infection immunity (Okazaki et al. 2013).
PD-1 suppresses the T-cell function via forming microclusters which associate to the
phosphatase SHP-1. The phosphatase dephosphorylates the TCR leading to a
suppressed immune reaction (Yokosuka et al. 2012).
Ligands of PD-1
One of the PD-1 ligands, Programmed Death-Ligand 2 (PD-L2) can be induced on
dendritic cells (DCs), monocytes and macrophages whereas Programmed Death-
Ligand 1 (PD-L1) is expressed broadly and constitutively on immune cells in the whole
body and has a greater importance for immune therapy. PD-L1 is a surface
glycoprotein which is also called B7-H1 or CD274 (Satelli et al. 2016). Its expression
on T-cells, macrophages and tumor cells is inducible by common γ-chain cytokines (IL-
2, IL-4, IL-7, IL-15, IFNγ and GM-CSF) and can be increased by type I or II interferons
(Yamazaki et al. 2002; Keir et al. 2008; Kinter et al. 2008).
The production of IFNγ by tumor infiltrating lymphocytes (TILs) induces the PD-L1
expression, therefore suppresses the TIL activation and leads to T-cell exhaustion or
anergy. A high PD-L1 expression can be induced by TIL infiltration.
Tumors which evaded the immune control also show high PD-L1 expression. In
addition, PD-L1 is upregulated by HIF-α in the hypoxic tumor microenvironment (TME)

Introduction 9
(Noman et al. 2014). In this case, PD-L1 expression can be used as a biomarker for
immune evasion.
Especially PD-L1 in the periphery is important to prevent autoimmune reactions or
bystander effects. Therefore, the binding of PD-1 to PD-L1, which tenders the cytotoxic
T-cell function, implicates T-cell exhaustion and immune evasion by tumors (Figure
1.3.1.1 b) is most effective in the periphery (Taube et al. 2012; Xu et al. 2018). PD-L1
expression correlates with invasiveness, metastasis and a poor prognosis.
Role of nuclear PD-L1
Beside its expression on the cell surface of immune cells, PD-L1 also shows nuclear
expression in some cells. PD-L1 is a membrane protein and therefore its nuclear
expression is unexpected. It does not contain any classical nucleus import motif, but
shows interaction with nuclear import/export proteins in its interactome (Escors et al.
2018).
In addition to its function of T-cell inhibition, an anti-apoptotic role with molecules in the
nucleolus is discussed for nuclear PD-L1. Surface expression is down- and nuclear
PD-L1 expression is upregulated due to chemotherapy with Doxorubicin which is one
of the most effective Anthracyclines and induces immunogenic apoptosis in tumor cells
(Ghebeh et al. 2010). Nuclear PD-L1 was also found in strongly apoptosis resistant
circulating tumor cells (Ghebeh et al. 2010; Satelli et al. 2016). Based on nuclear PD-
L1 in circulating tumor cells, it was also observed, that nuclear expression of PD-L1 is
induced by the lack of cell-cell contact (Satelli et al. 2016). The PI3K/Akt pathway
seems to be involved in nuclear upregulation of PD-L1 displayed by increased
phosphorylated Akt in the nucleus with nuclear PD-L1 expression.
The nucleus expression seems to enhance the apoptotic resistance which is displayed
by chemotherapy resistance and is correlated with a bad prognosis if found in tumor
cells (Ghebeh et al. 2010; Satelli et al. 2016; Granier et al. 2017).
Antibody therapy
There are several antibodies against the PD-1/PD-L1 NCR axis developed and in
clinical trials, because tumor cells upregulate PD-L1 to inhibit cytotoxic T-cell function
and evade the immune system. PD-1/PD-L1 antibodies prevent tumor cells from
binding and “turning off” T-cells (Figure 1.3.1.1 c) (Rojas and Casablanca 2019). The
expression of PD-L1 on tumor cells and PD-1 on TILs is associated with clinical
responses towards antibody-mediated therapy (Nishino et al. 2017). In general, the
blocking of PD-1 reverses the exhausted CD8+ T-cells and leads to a specific anti-
tumor immune reaction (Kondo et al. 2016).
The monoclonal anti-PD-1 antibody Pembrolizumab shows effectiveness in several
advanced tumors, especially when they have a mismatch repair deficiency (dMMR) or
microsatellite instability (MSI). Pembrolizumab is approved by FDA for women with
dMMR or MSI endometrial cancer (Rojas und Casablanca 2019).
In addition, the anti-PD-1 Nivolumab or anti-PD-1+anti-PD-L1 antibody Lambrolizuman
are effective against advanced melanoma, non-small-cell lung cancer, prostate cancer,
renal cell cancer and colorectal cancer. Patients showing high PD-L1 expression seem
Introduction 10
to respond with a higher probability (Topalian et al. 2012; Rojas and Casablanca 2019;
Sundar et al. 2015).
Also, anti-PD-L1 antibodies are in clinical trials. One example would be the monoclonal
anti-PD-L1 antibody Avelumab in advanced or recurrent endometrial cancer (Rojas
and Casablanca 2019).
But there are several side effects and adverse events in patients receiving an anti-PD-
1 and/or anti-PD-L1 therapy. General effects are fatigue (16-24 %) and infusion-related
reactions (25 %). Additional effects are skin and mucosal manifestations, GI-effect like
diarrhea or colitis, hepatotoxicity, pneumonitis and thyroid dysfunction (3,8 – 13,2 %).
Whereas Pembrolizumab leads to augmented dermatological complications,
Nivolumab causes more often the potentially serious adverse effect of pneumonitis (3
%). The probability for a pneumonitis is small but it can be potentially fatal, so the early
identification is crucial (Rojas und Casablanca 2019; Topalian et al. 2012).
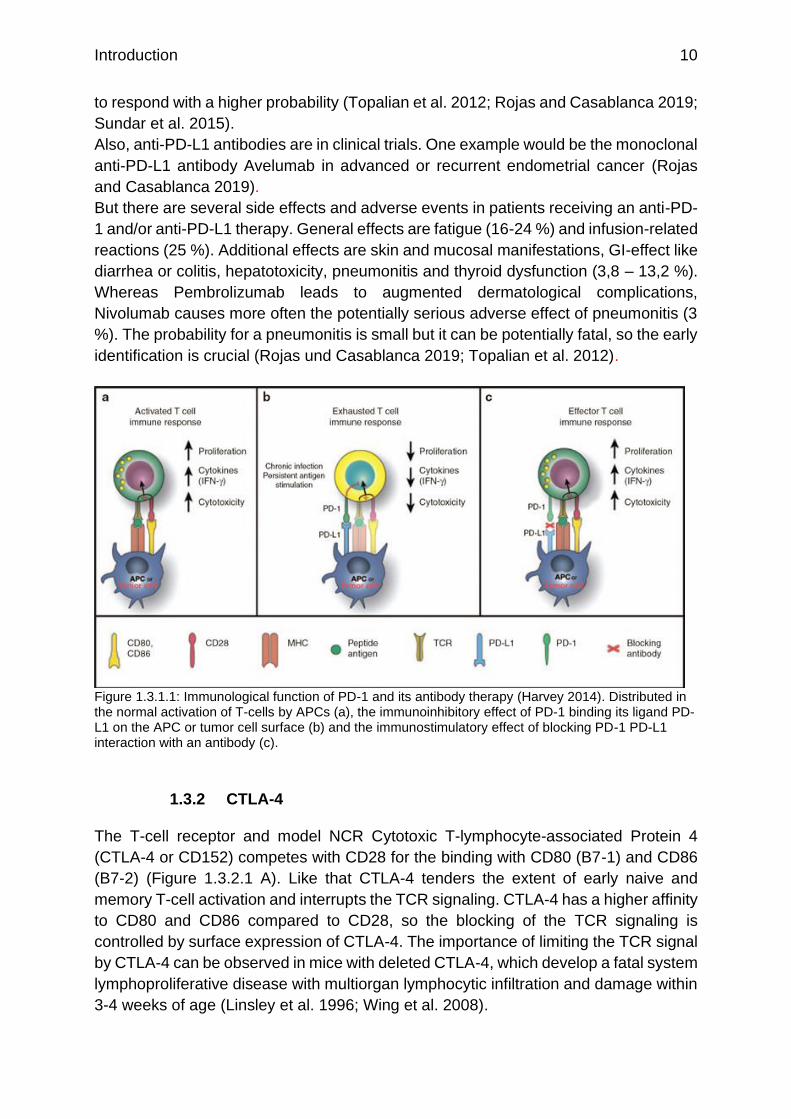
Figure 1.3.1.1: Immunological function of PD-1 and its antibody therapy (Harvey 2014). Distributed in the normal activation of T-cells by APCs (a), the immunoinhibitory effect of PD-1 binding its ligand PD-L1 on the APC or tumor cell surface (b) and the immunostimulatory effect of blocking PD-1 PD-L1 interaction with an antibody (c).
1.3.2 CTLA-4
The T-cell receptor and model NCR Cytotoxic T-lymphocyte-associated Protein 4
(CTLA-4 or CD152) competes with CD28 for the binding with CD80 (B7-1) and CD86
(B7-2) (Figure 1.3.2.1 A). Like that CTLA-4 tenders the extent of early naive and
memory T-cell activation and interrupts the TCR signaling. CTLA-4 has a higher affinity
to CD80 and CD86 compared to CD28, so the blocking of the TCR signaling is
controlled by surface expression of CTLA-4. The importance of limiting the TCR signal
by CTLA-4 can be observed in mice with deleted CTLA-4, which develop a fatal system
lymphoproliferative disease with multiorgan lymphocytic infiltration and damage within
3-4 weeks of age (Linsley et al. 1996; Wing et al. 2008).
Introduction 11
CTLA-4 functions on the cell surface but is mainly stored in intracellular endocytic and
secretory vesicles. Activation of T-cells induces an increased mRNA expression of
CTLA-4 and a release from intracellular storages which leads to a focused surface
expression of CTLA-4 towards the sites of TCR activation (Linsley et al. 1996).
Antibody therapy
Ipilimumab was the first human monoclonal anti-CTLA-4 antibody and started a new
era of cancer immunotherapy. It was approved by FDA in 2011 against metastatic
melanoma (Figure 1.3.2.1 B) and increased the 1- and 2-year survival from 25 % and
14 % in the controls to 46 % and 24 % (Yang 2015; Alatrash et al. 2013; Ribas 2007;
Cameron et al. 2011; Tarhini et al. 2010). It promotes antitumor response by T-cell
activation and tumor infiltration. It has been shown to be active in melanoma, prostate
cancer and is being studied in gynecologic cancer in combination with nivolumab
currently (Rojas and Casablanca 2019). Another antibody developed against CTLA-4
for advanced melanoma patients is Tremelimumab (Kirkwood et al. 2010).
The blocking of CTLA-4 releases the brakes on antitumor T-cell responses and ablates
regulatory T-cells (Tregs) within the tumor microenvironment (TME). Therefore, its
main therapeutic mechanism is the blockade of Tregs (Kondo et al. 2016; Tarhini et al.
2010).
But the therapeutic use of anti-CTLA-4 antibodies Ipilimumab and Tremelimumab also
showed unexpected toxicities like tissue-specific inflammation in a unique distribution
of sites (Figure 1.3.2.1 B). The most commonly affected tissues are the skin (rash,
puritus, vitiligo), bowel (diarrhea, colitis), liver (hepatitis, elevated liver enzymes) the
pituitary and other endocrine glands (hypophysitis, hypothyroidism, thyroiditis, adrenal
insufficiency) (Hodi et al. 2010).
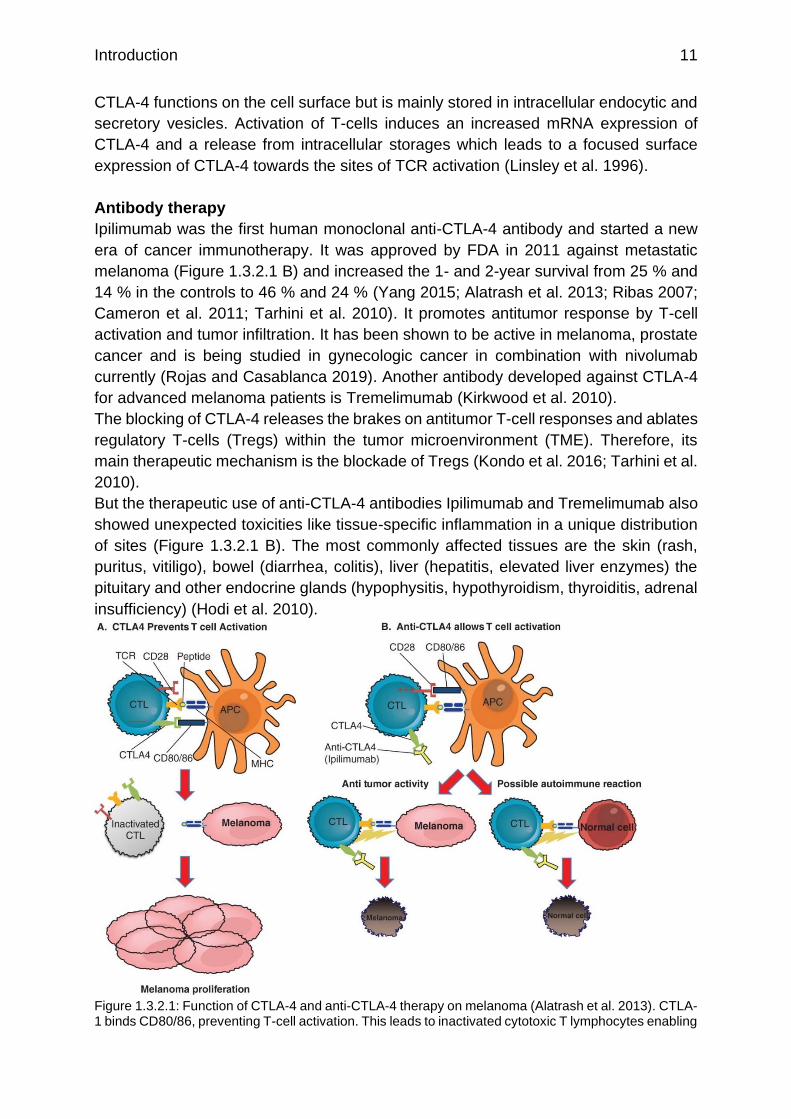
Figure 1.3.2.1: Function of CTLA-4 and anti-CTLA-4 therapy on melanoma (Alatrash et al. 2013). CTLA-1 binds CD80/86, preventing T-cell activation. This leads to inactivated cytotoxic T lymphocytes enabling

Introduction 12
melanoma proliferation (A). Blocking of CTLA-4 via antibody enables cytotoxic T lymphocyte activation leading to anti-tumor activity but also possible autoimmune reactions against normal cells (B).
1.3.3 V-domain Ig Suppressor of T-cell Activation (VISTA)
Protein structure and expression on immune cells
V-domain Ig Suppressor of T-cell Activation (VISTA, based on early investigations also
known with the following abbreviations: GI24, Dies-1, DD1α, PD-1H, B7-H5, C10orf54,
PP2135, SISP1; gene:Vsir) is a newly discovered negative checkpoint regulator (NCR)
of 37 kDa. This thesis will focus on the characterization of VISTA as the main objective.
VISTA is a B7 family protein with one IgV domain and the closest evolutionary relation
to PD-L1. It is expressed constitutively in the hematopoietic compartment with
expression on naïve and stimulated CD4+ and CD8+ T-cells, Foxp3+ regulatory T-cells
with the highest expression on tumor infiltrating lymphocytes (TILs). As a unique
feature, VISTA is not only expressed as a receptor on T-cells, but also as a coinhibitory
ligand on Antigen Presenting Cells (APCs) like macrophages, dendritic cells,
neutrophils or monocytes with a higher expression compared to T-cells (Table 1.3.3.1).
This expression pattern is similar for murine and human cells and the human and
murine proteins show more than 80 % similarity (Flies et al. 2011; Kondo et al. 2016;
Deng et al. 2016; Xu et al. 2018; Lines et al. 2014a).
Table 1.3.3.1: Surface expression of VISTA on human and mouse cell subsets evaluated by FACS analysis (Deng et al. 2016)
Cell Type Surface VISTA expression
Human Mouse
CD4+ naïve T-cells + ++ CD4+ Foxp3+ Treg + ++ CD4+ memory T-cells + ++ CD8+ T-cells + + B cells - - NK cells - - Peritoneal macrophages N/D +++ Monocytes +++ +++ Neutrophils +++ +++ Dendritic cells +++ +++
There are hints that VISTA could be expressed in intracellular compartments and
VISTA seem to be endocytosed rapidly from the surface, but the amount of VISTA on
the surface of myeloid cells remains stable (Deng et al. 2016; Liu et al. 2018).
The extracellular domain of VISTA has a high homology to PD-L1 (Figure 1.3.3.1 A2)
(Lines et al. 2014b; Baksh und Weber 2015). The properties of the IgV domain of
VISTA are highly conserved among the B7 family, (Deng et al. 2016) but VISTA seems
to be a distant B7 member, because it shows four additional cysteines and the insertion
of a loop in the IgV domain, which is absent in all other Ig-superfamily members (Figure
1.3.3.1 and Figure 1.3.3.2) (Xu et al. 2018).

Introduction 13
The extracellular domain of VISTA can be shedded at its juxtamembrane site. VISTA
promotes the activation of the matrix metalloproteinase-2 (MMP-2) via increasing the
expression of membrane type (MT)-1 MMP. Increased level of (MT)-1 MMP
concomitant leads to the shedding of the extracellular VISTA domain and a higher
invasive ability of tumor cells. Therefore, VISTA can contribute to tumor-invasive
growth by regulation of surface MT-1 MMP (Sakr et al. 2010).
VISTA has a long highly conserved cytoplasmic tail which could enable a bidirectional
signaling, similar to PD-L1, with receptor and ligand function (Lines et al. 2014a; Deng
et al. 2016). The cytoplasmic tail does not contain any classical signal motifs but a
potential binding site of a protein kinase c and proline residues, which could act as a
docking station for adaptor proteins. In addition, the cytoplasmic domain contains
several potential serine-, threonine- and tyrosine-phosphorylation sites (Figure
1.3.3.2). The cytoplasmic tail is crucial for VISTA signaling within the cell (Deng et al.
2016; Xu et al. 2018).
Figure 1.3.3.1: Structural analysis of VISTA (A1) A comparative protein structure model of mouse VISTA using PD-L1 as the template (Protein Data Bank accession no. 3BIS). The five cysteine residues in the Ig-V domain are illustrated as orange sticks. Based on this model, the VISTA Ig-V domain has the canonical disulfide bond between the B and F strands, as well as three additional cysteines, some of which can potentially form inter- and intramolecular disulfide bonds. An additional invariant cysteine is present in the stalk region following the G strand (not depicted). The β strands (A–G) are marked as green and blue. The C’’-D loop is marked by an arrow (Wang et al. 2011).
A2) Structure of the extracellular domain of human VISTA (red) aligns with the IgV domain of human PD-L1 (gray), B) unique helix in VISTA in place of beta strand in PD-L1, C) Unique C-C0 loop in VISTA that extends from the beta-sandwich core, D) Disulfide bonds in VISTA (red spheres, yellow residues), including two unique disulfides (red spheres) in addition to conserved disulfide bond (C22, C114) between strands B and F (gray spheres) (Mehta et al. 2019)
Introduction 14
10 20 30 40 50
MGVPTALEAG SWRWGSLLFA LFLAASLGPV AAFKVATPYS LYVCPEGQNV
60 70 80 90 100
TLTCRLLGPV DKGHDVTFYK TWYRSSRGEV QTCSERRPIR NLTFQDLHLH
110 120 130 140 150
HGGHQAANTS HDLAQRHGLE SASDHHGNFS ITMRNLTLLD SGLYCCLVVE
160 170 180 190 200
IRHHHSEHRV HGAMELQVQT GKDAPSNCVV YPSSSQDSEN ITAAALATGA
210 220 230 240 250
CIVGILCLPL ILLLVYKQRQ AASNRRAQEL VRMDSNIQGI ENPGFEASPP
260 270 280 290 300
AQGIPEAKVR HPLSYVAQRQ PSESGRHLLS EPSTPLSPPG PGDVFFPSLD
310
PVPDSPNFEV I
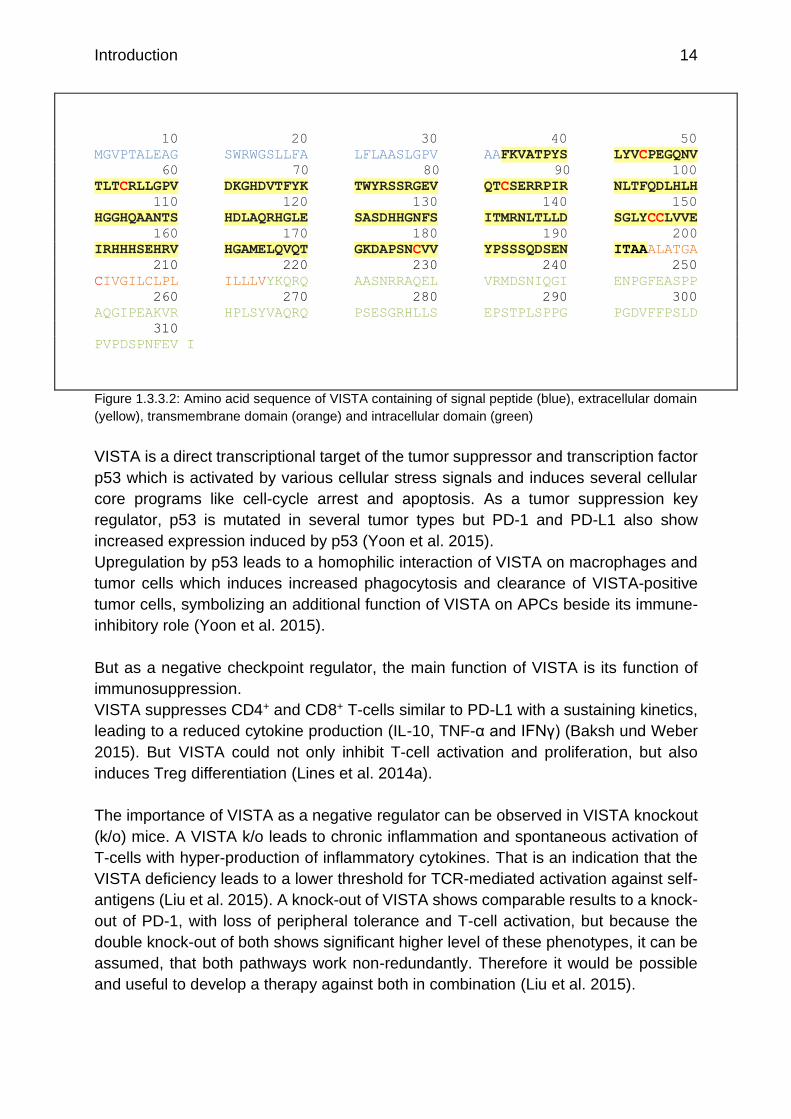
Figure 1.3.3.2: Amino acid sequence of VISTA containing of signal peptide (blue), extracellular domain
(yellow), transmembrane domain (orange) and intracellular domain (green)
VISTA is a direct transcriptional target of the tumor suppressor and transcription factor
p53 which is activated by various cellular stress signals and induces several cellular
core programs like cell-cycle arrest and apoptosis. As a tumor suppression key
regulator, p53 is mutated in several tumor types but PD-1 and PD-L1 also show
increased expression induced by p53 (Yoon et al. 2015).
Upregulation by p53 leads to a homophilic interaction of VISTA on macrophages and
tumor cells which induces increased phagocytosis and clearance of VISTA-positive
tumor cells, symbolizing an additional function of VISTA on APCs beside its immune-
inhibitory role (Yoon et al. 2015).
But as a negative checkpoint regulator, the main function of VISTA is its function of
immunosuppression.
VISTA suppresses CD4+ and CD8+ T-cells similar to PD-L1 with a sustaining kinetics,
leading to a reduced cytokine production (IL-10, TNF-α and IFNγ) (Baksh und Weber
2015). But VISTA could not only inhibit T-cell activation and proliferation, but also
induces Treg differentiation (Lines et al. 2014a).
The importance of VISTA as a negative regulator can be observed in VISTA knockout
(k/o) mice. A VISTA k/o leads to chronic inflammation and spontaneous activation of
T-cells with hyper-production of inflammatory cytokines. That is an indication that the
VISTA deficiency leads to a lower threshold for TCR-mediated activation against self-
antigens (Liu et al. 2015). A knock-out of VISTA shows comparable results to a knock-
out of PD-1, with loss of peripheral tolerance and T-cell activation, but because the
double knock-out of both shows significant higher level of these phenotypes, it can be
assumed, that both pathways work non-redundantly. Therefore it would be possible
and useful to develop a therapy against both in combination (Liu et al. 2015).

Introduction 15
VISTA deficiency on myeloid cells promotes their activation by upregulation of co-
stimulatory molecules (CD80, CD40 and MHCII) and the production of cytokines
(Ceeraz et al. 2017). The binding of VISTA to dendritic cells is sufficient to
downregulate their activation, via the IL-23/IL-17-mediated inflammatory axis (Li et al.
2017).
With its expression on T-cells as well as APCs, the NCR VISTA can regulate the
adaptive as well as the innate immune responses, qualifying VISTA as an interesting
new target for checkpoint immune therapy (ElTanbouly et al. 2019). But the expression
of VISTA on APCs and T-cells assumes different functions for VISTA which should be
explained further. For that I distinguished between the “ligand function” or “extrinsic T-
cell function” of VISTA and the “receptor function” or “intrinsic T-cell function” (Figure
1.3.3.3) (Xu et al. 2018).
Figure 1.3.3.3: T-cell-extrinsic and -intrinsic function of VISTA (Xu et al. 2018). The extrinsic T-cell ligand function of VISTA is conveyed between the VISTA ligand on the Antigen Presenting Cell (APC) surface, binding the VISTA receptor on T-cells inhibiting proliferation and cytokine production of T-cells (a). For the intrinsic T-cell function VISTA ligand on the T-cell surface binds the VISTA receptor on T-cells inhibiting proliferation and cytokine production of the T-cells (b).
Extrinsic T-cell function/ Ligand function
VISTA, expressed on APCs, can engage an inhibitory receptor to suppress T-cell
activation. In this setting VISTA is defined as a ligand with an extrinsic T-cell function
(Figure 1.3.3.3 a) (Xu et al. 2018).
Endogenous VISTA on APCs has a synergistic inhibitory function as a ligand of CD4+
as well as CD8+ T-cells and acts independently of the PD-1 receptor on T-cells. That
suggests that the VISTA ligand binds an unknown co-inhibitory T-cell receptor. The
binding of the ligand VISTA by T-cells, suppresses the T-cell activation, -proliferation
and -cytokineproduction of naïve and memory T-cells. In addition, the VISTA ligand

Introduction 16
promotes the conversion towards Foxp3+ adaptive Tregs. For these effects on T-cells,
the soluble VISTA ectodomain is also sufficient, symbolizing the ligand function of
VISTA (Lines et al. 2014b; Kondo et al. 2016; Torphy et al. 2017; Wang et al. 2011;
Lines et al. 2014a).
VISTA can bind itself in a homophilic interaction leading to suppression of T-cells. It is
still unresolved if this inhibitory effect of the VISTA ligand is caused only by binding the
VISTA receptor on T-cells. There is the possibility of another unknown inhibitory
receptor on T-cells additionally (Liu et al. 2015; Yoon et al. 2015).
This co-inhibitory ligand function was also demonstrated in vivo, where VISTA
expression on tumor cells overcame the vaccine-induced immunity of T-cells and led
to tumor outgrowth (Wang et al. 2011).
Taking together, these results display the extrinsic T-cell function of VISTA, when
expressed on APCs or tumor cells (Torphy et al. 2017; Xu et al. 2018).
Intrinsic T-cell function/ Receptor function
Endogenous VISTA shows inhibitory effects, not only as a ligand on APCs, but also as
a co-inhibitory receptor on T-cells (Figure 1.3.3.3 b) (Lines et al. 2014b; Kondo et al.
2016). The VISTA receptor is expressed on CD4+ T-cells, CD8+ T-cells and Foxp3+
Tregs. Its intrinsic inhibitory role was displayed by VISTA deficient CD4+ T-cells and
APCs. VISTA deletion on both cell types resulted in a much stronger proliferation of T-
cells than on one cell type (Flies et al. 2014).
In addition, VISTA expression on T-cells is sufficient and required to inhibit allogeneic
T-cell response in graft-versus host disease (Flies et al. 2011; Flies et al. 2014; Flies
et al. 2015). T-cells express both, VISTA receptor and VISTA ligand which promote
the peripheral differentiation of adaptive Tregs (Le Mercier et al. 2014; Lines et al.
2014a).
The binding of the VISTA-receptor impairs the phosphorylation of proximal signal and
downstream molecules (Akt and Erk1/2) which disturbs the early TCR signaling. To
activate the VISTA receptor on T-cells the soluble VISTA-Ig is sufficient (Liu et al.
2015).
Beside its homotypic interaction of the ectodomain (Prodeus et al. 2017; Yoon et al.
2015), there is one ligand of the VISTA receptor identified. V-set and immunoglobulin
domain containing 3 (VSIG-3 or IgSF11) is an adhesion molecule that is responsible
for homophilic, calcium-independent adhesion, with a high expression in the brain and
testicles. In addition, VSIG-3 is upregulated in intestinal gastric cancer, colorectal
cancer and hepatocellular carcinoma, displaying a new promising pathway for
immunotherapy (Yang et al. 2017; Wang et al. 2019).
Sometimes it is difficult to distinguish between intrinsic, extrinsic, receptor and ligand
function of VISTA. But it is certain that VISTA is a complex inhibitory protein with
several functions on T-cells and Antigen Presenting Cells, which can tender the innate
and adaptive immune response.

Introduction 17
Antibody checkpoint therapy
Why consider VISTA for negative checkpoint therapy?
A VISTA blockade can be used as a broad-spectrum therapy against solid tumor in
mouse models with better results than PD-1 (Lines et al. 2014a). The VISTA antibody
enhances CD4+and CD8+ T-cell mediated anti-tumor immunity in multiple tumor
models (Le Mercier et al. 2014; Dankort et al. 2009). The efficiency of VISTA blocking
is based on targeting multiple immune cell types. First, it enhances the infiltration,
proliferation and effector function of CD4+ and CD8+ T-cells. Second, VISTA-blocking
impairs the suppressive function of Foxp3+ Tregs and minimizes the induction of
adaptive Tregs from tumor-specific naïve CD4+ T-cells. In addition, the VISTA-antibody
activates tumor-associated myeloid DCs by upregulating CD80 and MHC-II, leading to
enhanced production of cytokines (IL-12 and TNF-α). VISTA-antibody also reduces
tumor-infiltrating myeloid-derived suppressor cells (MDSCs) (Le Mercier et al. 2014;
Wang et al. 2018).
The VISTA antibody impairs tumor proliferation in mice, especially in combination with
tumor vaccines. VISTA blockade still showed high anti-tumor efficiency even without
measurable VISTA expression and despite high PD-L1 expression (Lines et al. 2014b).
The blockade of VISTA and PD-1 operate with identical functionality on T-cells. Both
approaches reverse exhausted CD8+ T-cells in functional cytotoxic T-cells, but work
non-redundantly (Liu et al. 2015, 2015; Kondo et al. 2016). Therefore, it would be
possible and useful to develop a therapy in combination.
VISTA would open a therapeutic route for patients who don’t respond to a PD-1 therapy
or developed a resistance to PD-1 therapy. Possible resistance mechanisms are T-cell
exhaustion, caspase-8 and β-catenin overexpression, PD-1/PD-L1 gene-amplification,
MHC-I/-II mutations and downregulation of HLA-associated Antigen presentation. A
combinatorial therapy with VISTA has the potential to overcome some of these
resistance mechanisms (Dempke et al. 2017; Kakavand et al. 2017). Especially a
combinatorial therapy with CTLA-4 (Kondo et al. 2016), PD-1 or its ligand PD-L1 could
increase the response rate and prevent resistance.
In addition, it was discovered quite recently that VISTA is not only expressed on
immune cells, but also on tumor cells. The VISTA expression on tumor cells partly
correlates with the PD-1 and/or CTLA-4 expression, which punctuates the importance
of a combinatorial therapy with VISTA (Wu et al. 2017; Wang et al. 2018; Mulati et al.
2019; Böger et al. 2017). VISTA positive tumors like OSCC (Wu et al. 2017), GC
(Böger et al. 2017), ovaria and other gynecologic carcinoma (Mulati et al. 2019),
melanoma (Mulati et al. 2019; Edwards et al. 2019), leukemia (Wang et al. 2018), HCC
(Shrestha et al. 2018), prostate cancer (Gao et al. 2017) and pancreas cancer (Blando
et al. 2019) would be ideal targets for a VISTA or combinatorial NCR therapy. Also
esophageal adenocarcinoma (Loeser et al. 2019), pleural mesotheliomas (Muller et al.
2019) and renal cell carcinoma (Hong et al. 2019) are discussed as promising targets
for anti-VISTA therapy.
These first insights provided a strong evidence for application of anti-VISTA antibodies
in a clinical trial (clinicaltrials.gov, NCT02671955) on patients (Deng et al. 2016).

Introduction 18
Of course, a VISTA-antibody therapy could also cause toxicities in patients. In mice,
T-cell-mediated autoimmune encephalomyelitis accured. Also cytokine-release
syndrome, other autoimmune reactions and hyper-immune stimulation should be
considered (Dempke et al. 2017; Granier et al. 2017; Marin-Acevedo et al. 2018).
In summary, several immune checkpoints are identified, and their antibodies are in
different stages of pre-clinical and clinical development with promising results.
Although the NCR antibody therapy has been a great breakthrough in cancer therapy,
the immune-associated toxicity, the resistance to NCR treatment and the limited
clinical benefit to a small subset of patients are the main challenges of this therapy. To
improve the response rate, combinational therapy of multiple checkpoints or
combination with anti-tumor vaccines should be pursued further. When considering
VISTA for NCR therapy the newly discovered axis of VISTA-VSIG-3 should be
investigated (Marin-Acevedo et al. 2018; Wang et al. 2019).
Objectives 19
2 Objectives
Negative checkpoint regulators are well-studied targets for immunotherapy of tumors.
But the checkpoint therapy against the two model NCRs PD-1 and CTLA-4 does not
reach sufficient response rates in solid tumors. Therefore, there is still a need of new
targets to reach higher response rates and to overcome therapy resistance. V-domain
Ig suppressor of T-cell activation (VISTA) is a promising newly discovered negative
checkpoint to overcome these issues. Due to its broad expression on different immune
cells, tumor cells and tumor-infiltrating lymphocytes and its similar, but non-redundant
functionality to PD-1. But to utilize VISTA for NCR therapy, a basic characterization of
the protein is necessary. The literature so far focused on the classical NCR role and
expression of VISTA on T-cells and in the tumor tissue. The expression of VISTA is
even higher on APCs, but the function and behavior on this part of the immune system
is barely investigated.
Therefore, the focus of this thesis will be the characterization of VISTA on APCs. For
that, primary murine and human APCs, as well as monocytic celllines with and without
VISTA overexpression are used. To classify my results, the characterization was done
in comparison to the Jurkat T-cellline.
The thesis is divided into three parts.
1) The first part concentrates on the expression pattern of VISTA within different
cells and cellular fractions. For that, the amount of VISTA expression was
measured via qRT-PCR and IHC staining in different primary cells, celllines and
tissue. For PD-L1 and CTLA-4 it is known that they are not exclusively
expressed on the membrane but also in the nucleus or in vesicles. To
investigate if VISTA is expressed exclusively on the cell surface or in other
cellular fractions as well, different cellular fractions were isolated. In these
fractions the VISTA expression was analyzed via IHC staining and Western Blot
analysis. The results were discussed in comparison to the model NCRs PD-
1/PD-L1 and CTLA-4.
2) The second part investigates the effects on the VISTA expression of part one
after stimulation. For that, lipopolysaccharide (LPS) was used as an
immunogenic stimulus. The expression pattern in different primary cells and
celllines was again analyzed via qRT-PCR and IHC staining. In addition, primary
murine BMDMs were seeded in different densities as a stimulus, and VISTA
expression was analyzed via IHC staining.
3) The third part investigates the effects of VISTA overexpression on the
immunological function of APCs. For that, the myeloid celllines HL-60 and THP-
1 were transfected as VISTA-GFP cells and compared to the empty vector (EV)
GFP control cells. We analyzed the effect of VISTA overexpression on the
morphology and adhesion of the myeloid celllines w/o VISTA overexpression.
Furthermore, we differentiated the myeloid celllines into macrophages to
analyze the phagocytosis of VISTA overexpressing macrophages. We also
performed phagocytosis assays the other way around, where primary
macrophages engulfed the myeloid celllines w/o VISTA overexpression. In the
last part our collaboration partner searched for possible interaction partners of

Objectives 20
VISTA by GFP pull-out and mass spectrometry analysis. In addition, we
checked some candidates for interaction in the qRT-PCR and FACS analysis
with the myeloid celllines w/o VISTA overexpression.
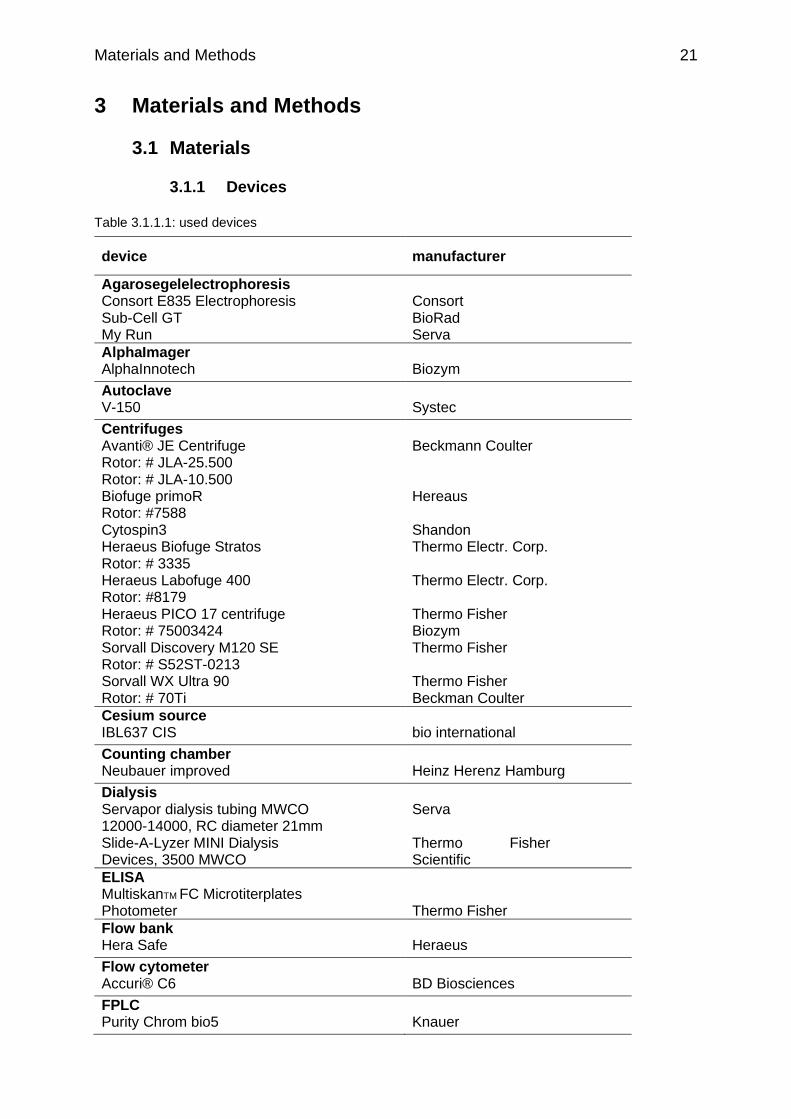
Materials and Methods 21
3 Materials and Methods
3.1 Materials
3.1.1 Devices
Table 3.1.1.1: used devices
device manufacturer
Agarosegelelectrophoresis Consort E835 Electrophoresis Sub-Cell GT My Run
Consort BioRad Serva
AlphaImager AlphaInnotech
Biozym
Autoclave V-150
Systec
Centrifuges Avanti® JE Centrifuge Rotor: # JLA-25.500 Rotor: # JLA-10.500 Biofuge primoR Rotor: #7588 Cytospin3 Heraeus Biofuge Stratos Rotor: # 3335 Heraeus Labofuge 400 Rotor: #8179 Heraeus PICO 17 centrifuge Rotor: # 75003424 Sorvall Discovery M120 SE Rotor: # S52ST-0213 Sorvall WX Ultra 90 Rotor: # 70Ti
Beckmann Coulter Hereaus Shandon Thermo Electr. Corp. Thermo Electr. Corp. Thermo Fisher Biozym Thermo Fisher Thermo Fisher Beckman Coulter
Cesium source IBL637 CIS
bio international
Counting chamber Neubauer improved
Heinz Herenz Hamburg
Dialysis Servapor dialysis tubing MWCO 12000-14000, RC diameter 21mm Slide-A-Lyzer MINI Dialysis Devices, 3500 MWCO
Serva Thermo Fisher Scientific
ELISA MultiskanTM FC Microtiterplates Photometer
Thermo Fisher
Flow bank Hera Safe
Heraeus
Flow cytometer Accuri® C6
BD Biosciences
FPLC Purity Chrom bio5
Knauer
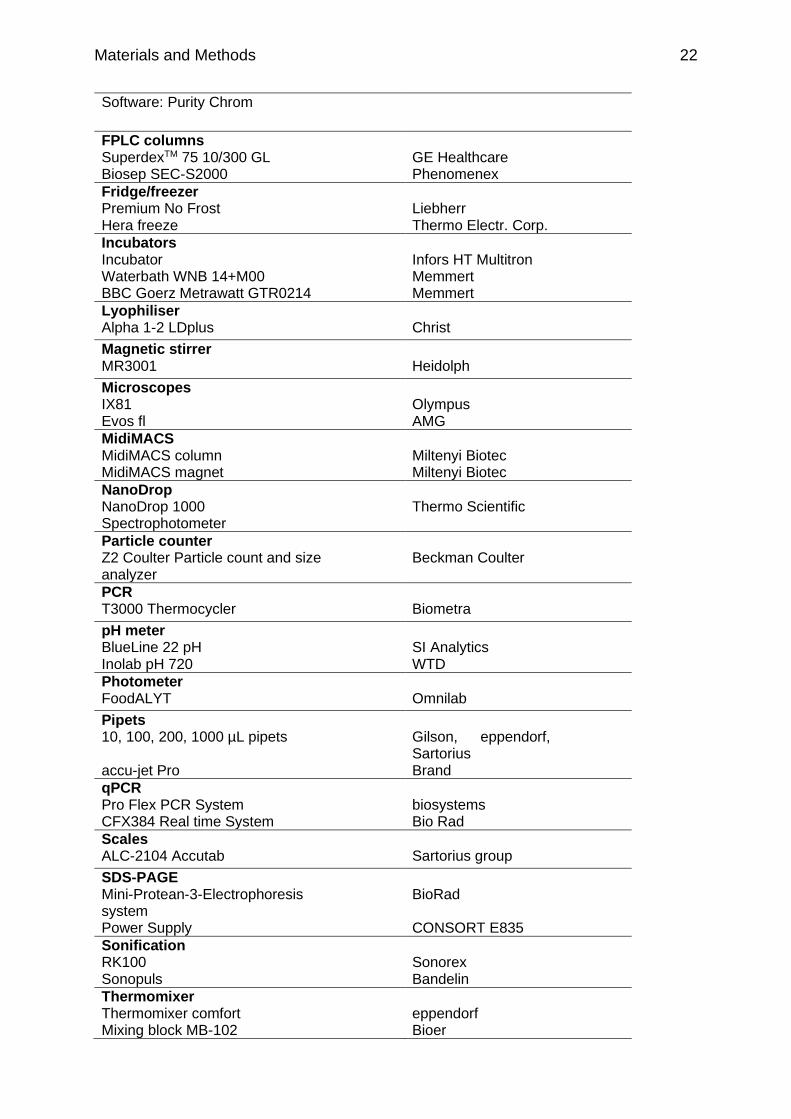
Materials and Methods 22
Software: Purity Chrom
FPLC columns SuperdexTM 75 10/300 GL Biosep SEC-S2000
GE Healthcare Phenomenex
Fridge/freezer Premium No Frost Hera freeze
Liebherr Thermo Electr. Corp.
Incubators Incubator Waterbath WNB 14+M00 BBC Goerz Metrawatt GTR0214
Infors HT Multitron Memmert Memmert
Lyophiliser Alpha 1-2 LDplus
Christ
Magnetic stirrer MR3001
Heidolph
Microscopes IX81 Evos fl
Olympus AMG
MidiMACS MidiMACS column MidiMACS magnet
Miltenyi Biotec Miltenyi Biotec
NanoDrop NanoDrop 1000 Spectrophotometer
Thermo Scientific
Particle counter Z2 Coulter Particle count and size analyzer
Beckman Coulter
PCR T3000 Thermocycler
Biometra
pH meter BlueLine 22 pH Inolab pH 720
SI Analytics WTD
Photometer FoodALYT
Omnilab
Pipets 10, 100, 200, 1000 µL pipets accu-jet Pro
Gilson, eppendorf, Sartorius Brand
qPCR Pro Flex PCR System CFX384 Real time System
biosystems Bio Rad
Scales ALC-2104 Accutab
Sartorius group
SDS-PAGE Mini-Protean-3-Electrophoresis system Power Supply
BioRad CONSORT E835
Sonification RK100 Sonopuls
Sonorex Bandelin
Thermomixer Thermomixer comfort Mixing block MB-102
eppendorf Bioer

Materials and Methods 23
Vortexer Vortex-Genie 2 Reax top
Scientific Industries Heidolph
Water bath Laktotherm 1 WNB22
Jürgens Memmert
Western blot Trans-Blot SD, Semi-Dry Transfer cell ECL Chemocam Imager Power Supply
BioRad Intas CONSORT E835
3.1.2 Chemicals
Table 3.1.2.1: used chemicals
chemical manufacturer
Acetic acid VWR
Acrylamide (40%) VWR
Agarose Serva
Alkaline Phosphatase, Calf Intestine
New England Biolabs
Ammonium hydrogen carbonate Roth
Ammonium persulfate (APS) Merck
Ammonium sulfate Roth
Ampicillin Roth
ANS Sigma
Bovine serum albumin (BSA) OmniLife Science
Bradford reagent: Bio-Rad Protein Assay Dye Reagent concentrate
BioRad
Bromophenol blue Sigma
Calcium chloride Roth
CD3/CD28 human T-Activator DynabeadsTM
gibco® by Thermo Fisher
CD14 beads hum Microbeads Miltenyi Biotech
Cell proliferation dye eFluorTM 670 invitrogen
CFSE Cell TraceTM invitrogen
Coomassie Brilliant Blue R-250 Serva
Crystalviolet Sigma-Aldrich
DAPI
DAPI Fluoromount-G® Southern Biotech
DAPT
DMEM high glucose GlutaMAX medium
gibco® by Thermo Fisher
DNase Serva
Donkey serum BioRad
DTT Roth
EDTA Roth

Materials and Methods 24
EGTA Roth
Ethanol (denatured) chemical storage
Ethanol absolute VWR
Fetal bovine serum (FBS) Gold PAA
FCR Blockin Reagent hum Miltenyi Biotech
Fluoromount-G® Southern Biotech
Gel Loading Dye, Purple (6x) New England BioLabs
Glutathione sepharose GE Healthcare
Glycerine Roth
Glycerol Roth
Glycine Roth
Granulocyte-Macrophage Colony-Stimulating Factor (GM-CSF)
ImmunoTools
Granulocyte-Macrophage Colony-Stimulating Factor (GM-CSF) from mouse, recombinant
Sigma
Guanidine hydrochloride Roth
H2O2 Sigma
H2SO4 Roth
HEPES Roth
Hydrochloric acid VWR
Interferon γ (IFNγ) ImmunoTools
IL-4 recombinant human protein ImmunoTools
IL-6 recombinant murine protein Invitrogen
IL-10 recombinant human protein ImmunoTools
Imidazole Acros Organics
IncuCyte CytoLight Rapid Red Reagent
Essen BioScience
IPTG Roth
Iso-butanol Merck
Isopropyl-β-D-thiogalactopyranoside (IPTG)
Roth
Kanamycin OmniLifeScience
KpnI-HF New England Biolabs
LB medium (Lennox) Roth
Lipopolysaccharid (LPS) Solution 500x
Invitrogen
LymphoprepTM 00217 Serumwerk Bernburg AG
Lysozyme Sigma
Magnesium chloride Roth
Macrophage Colony-Stimulating Factor (M-CSF)
ImmunoTools
Methanol VWR
mPIC Sigma
NHS Sigma
Ni(II)Cl Scharlau
NcoI-HF New England Biolabs
Paraformaldehyde (PFA) Riedel
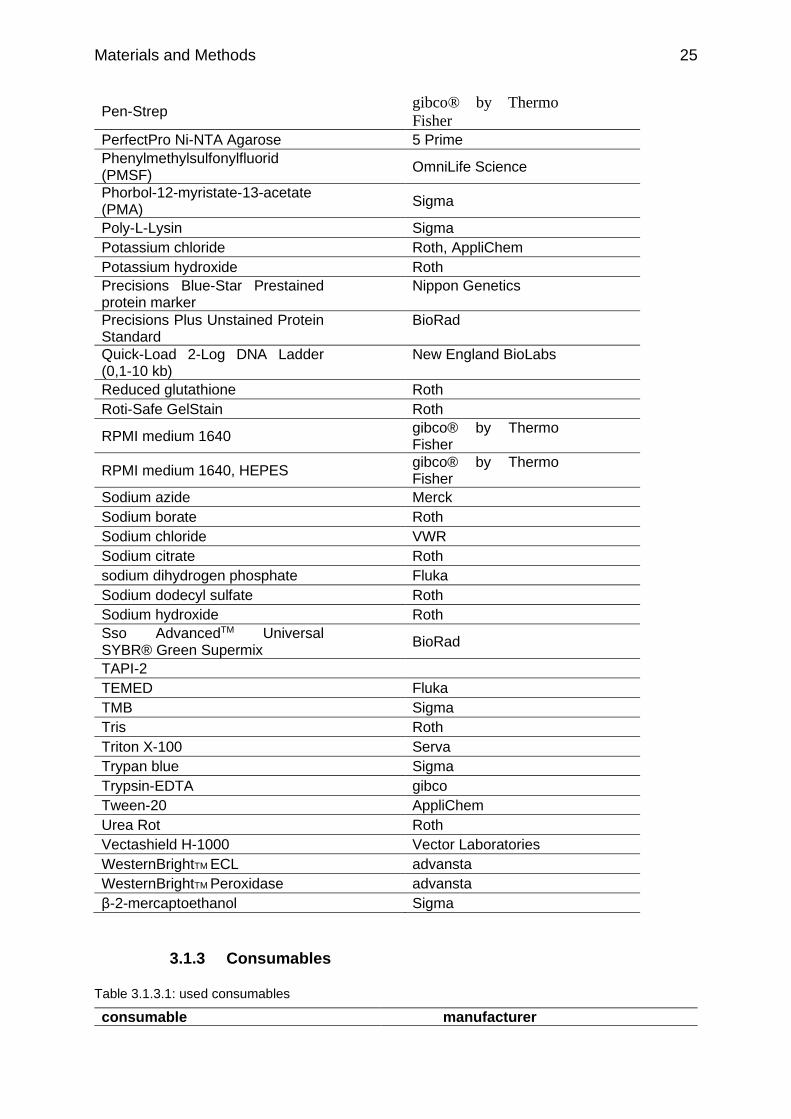
Materials and Methods 25
Pen-Strep gibco® by Thermo
Fisher
PerfectPro Ni-NTA Agarose 5 Prime
Phenylmethylsulfonylfluorid (PMSF)
OmniLife Science
Phorbol-12-myristate-13-acetate (PMA)
Sigma
Poly-L-Lysin Sigma
Potassium chloride Roth, AppliChem
Potassium hydroxide Roth
Precisions Blue-Star Prestained protein marker
Nippon Genetics
Precisions Plus Unstained Protein Standard
BioRad
Quick-Load 2-Log DNA Ladder (0,1-10 kb)
New England BioLabs
Reduced glutathione Roth
Roti-Safe GelStain Roth
RPMI medium 1640 gibco® by Thermo Fisher
RPMI medium 1640, HEPES gibco® by Thermo Fisher
Sodium azide Merck
Sodium borate Roth
Sodium chloride VWR
Sodium citrate Roth
sodium dihydrogen phosphate Fluka
Sodium dodecyl sulfate Roth
Sodium hydroxide Roth
Sso AdvancedTM Universal SYBR® Green Supermix
BioRad
TAPI-2
TEMED Fluka
TMB Sigma
Tris Roth
Triton X-100 Serva
Trypan blue Sigma
Trypsin-EDTA gibco
Tween-20 AppliChem
Urea Rot Roth
Vectashield H-1000 Vector Laboratories
WesternBrightTM ECL advansta
WesternBrightTM Peroxidase advansta
β-2-mercaptoethanol Sigma
3.1.3 Consumables
Table 3.1.3.1: used consumables
consumable manufacturer

Materials and Methods 26
96-well plate Thermo Fisher
Amicon® Ultra-0.5 mL Centrifugal Filters Merck
Amicon® Ultra-4 Centrifugal Filter Units Merck
AnatopTM 19 filter Whatman
Cell culture plates 6.5 mm Transwell® with 0.4, 3.0 and 5.0 µm Pore Polycarbonate Membrane Insert, Sterile 6 well and 24 well plates Tissue Culture flask 25 Tissue Culture dish
Corning TPP TPP TPP
Cuvettes Q-Vettes Halbmikro Roth
Falcon tubes FACS tubes: Falcon® Round-bottom polystyrene tubes, 5 mL Falcon tubes 15 mL/50 mL
StemcellTM Technologies Falcon tubes 15 mL/50 mL
Gloves semper guard vinyl
Semperit Technologie Produkte
Hard shell® PCR plates 384 well thin-wall BioRad
Microscope slides Menzel Gläser Objektträger mit Mattrand 20 mm Microscope slides cut color frosted white
Menzel/ Thermo Scientific VWR
Needles 100 Sterican® several sizes
Braun
Parafilm M American can company
Petri dish greiner bio-one
Pipet tips Sarstedt
Polystyrene cuvette Ratiolab®
Reaction tubes 300 µL, 1,5 mL, 2 mL Sarstedt
Rotilab®syringe filter Carl Roth
Sephadex G-25 DNA-Grade NAP5 column
GE Healthcare
Slide-A-Lyzer® Mini Dialysis Units 3,500 MWCO
Pierce
Syringes Omnifix Plastipak Norm-ject®
Braun Becton Dickinson Henke Sass Wolf
Ultrifuge tubes 1,5 mL (357448) Beckman
Visking dialysis tube (MWCO 12,000-14,000)
Serva
Western Blot Filter papers Roth
Western Blot Nitrocellulose membrane Roth
ZebaTMSpin Desalting column (MWCO 7,000)
Thermo Fisher
Kits were executed following the instructions exactly.
Table 3.1.3.2: used kits
kit manufacturer
FastGene Gel/PCR Extraction Kit
Nippon Genetics

Materials and Methods 27
FastGene Plasmid Mini Kit Nippon Genetic
Fix-Perm FaP-2000 KIT MabTag GmbH
iScriptTM cDNA Synthesis Kit BioRad
Quick CIP Kit New England Biolabs
Rapid DNA Ligation Kit Sigma-Aldrich
RNeasy® Plus Mini Kit Qiagen
3.1.4 Antibodies
Table 3.1.4.1: used antibodies
antigen anti-species host clone label manufacturer
anti mouse IgG1
mouse 21275516 APC ImmunoTools
anti-goat α-gt donkey A11055 AF488 Invitrogen
anti-goat α-gt donkey A21447 AF647 Invitrogen
anti-goat IgG (H+L)
α-gt donkey A-11058 AF-594 Thermo Fisher
anti-goat IgG (H+L)
α-gt donkey A-11057 AF-568 Thermo Fisher
anti-goat α-gt rabbit HRP Jackson Immuno Research
anti-goat donkey HRP Dianova
anti-mouse α -mo goat A21235 AF647 Invitrogen
anti-mouse α -mo goat A11001 AF488 Invitrogen
anti-mouse IgG
mouse 275428 PE ImmunoTools
anti-mouse IgG (H+L)
α-mo/hum donkey A-21202 AF-488 Thermo Fisher
anti-mouse IgG (H+L)
α-mo/hum donkey A10037 AF-568 Invitrogen
anti-mouse goat HRP Jackson ImmunoResearch
anti-rabbit IgG goat A11008 AF-488 Invitrogen
anti-rabbit IgG α-rb donkey R37119 AF-594 Thermo Fisher
anti-rabbit goat HRP Dianova
anti-rat IgG (H+L)
α-rat donkey A-21208 AF-488 Thermo Fisher
CD9 α-hum mouse HI9a ImmunoTools
CD11b α-hum ICRF44 AF594 Biolegend
CD11b α-hum ICRF44 APC Biolegend
CD11b α-hum/mo/rat mouse C67F154 Thermo Fisher
CD11b α-hum/mo rat M1/70 Thermo Fisher
CD11c α-hum 3.9 APC-eFluor780
eBioscience
CD11c α-hum mouse 118/A5 Thermo Fisher
CD14 α-hum HCD14 APC Biolegend
CD163 α-hum eBioGHI/61 APC eBioscience
CD172b Sirpβ α-hum B4B6 PE Biolegend
CD4 α-hum/mo mouse 4B12 Thermo Fisher
CD4 α-hum/mo/ rat mouse N1UG0 Thermo Fisher

Materials and Methods 28
CD49d α-hum PE BD PharmingenTM
CD49e α-hum mouse PE BD PharmingenTM
CD49f α-hum/mo GOH3 PE Biolegend
CD63 α-hum mouse MEM-259 ImmunoTools
CD71 (Transferrin receptor)
α-hum mouse 3B8 2A1 Santa Cruz
CD71 (Transferrin receptor)
α-hum/ mo rabbit Thermo Fisher
CD81 α-hum mouse M38 ImmunoTools
CD86 α-hum 21480866 APC ImmunoTools
CD8a α-hum/mo/ rat mouse C8/144B Thermo Fisher
F(ab’)2 fragment
α-rb goat A11072 AF594 Invitrogen
Foxp3 α-hum/mo mouse 236A/E7 Thermo Fisher
GFP α-hum/mo mouse JL-8 Clontech
GST mouse B14 Santa Cruz
His-Tag α-E.coli/yeast/mammalian/insect
mouse 34610 Qiagen
HLA-ABC α-hum mab-p28 PE ImmunoTools
HLA-DR α-hum PE BD PharmingenTM
IL-6 α-mo rat MP5-20F3 invitrogen
IL-6 α-mo rat MP5-32C11 Biotin invitrogen
Perforin α-hum/mo/rat mouse F-1 Santa Cruz
Perforin α-hum/mo/ rat rabbit abcam
Rituximab α-hum mouse Truxima®
SNAP 25 α-hum/mo/ rat mouse MERZ/Sigma
Tubulin α α-hum/mo mouse T 9026 Sigma
Vista α-hum FAB71261G
AF488 R&D Systems
Vista α-hum rabbit D1L2G™XP®
Cell Signaling
VISTA (GI24) α-hum/mo/rat goat S14 Santa Cruz
VISTA (GI24) α-hum/mo/rat goat N-12 Santa Cruz
3.1.5 Bacteria strains
XL1-Blue bacteria:
recA1 end A1 gyrA96 thi-1 hsdR17 (rK- mK+) supE44 relA1 lac [F’ proAB, lacIqZDM15 Tn10 (Tetr)] (Stratagene)
BL21-codonPlus-(DE3)-RP:
E. coli B F- ompT hsdS (rB-mB-) dcm+ Tetr gal λ(DE3) endA endA HTe [argU proL Camr] (Stratagene)
Rosetta-(DE3)-pLysS:
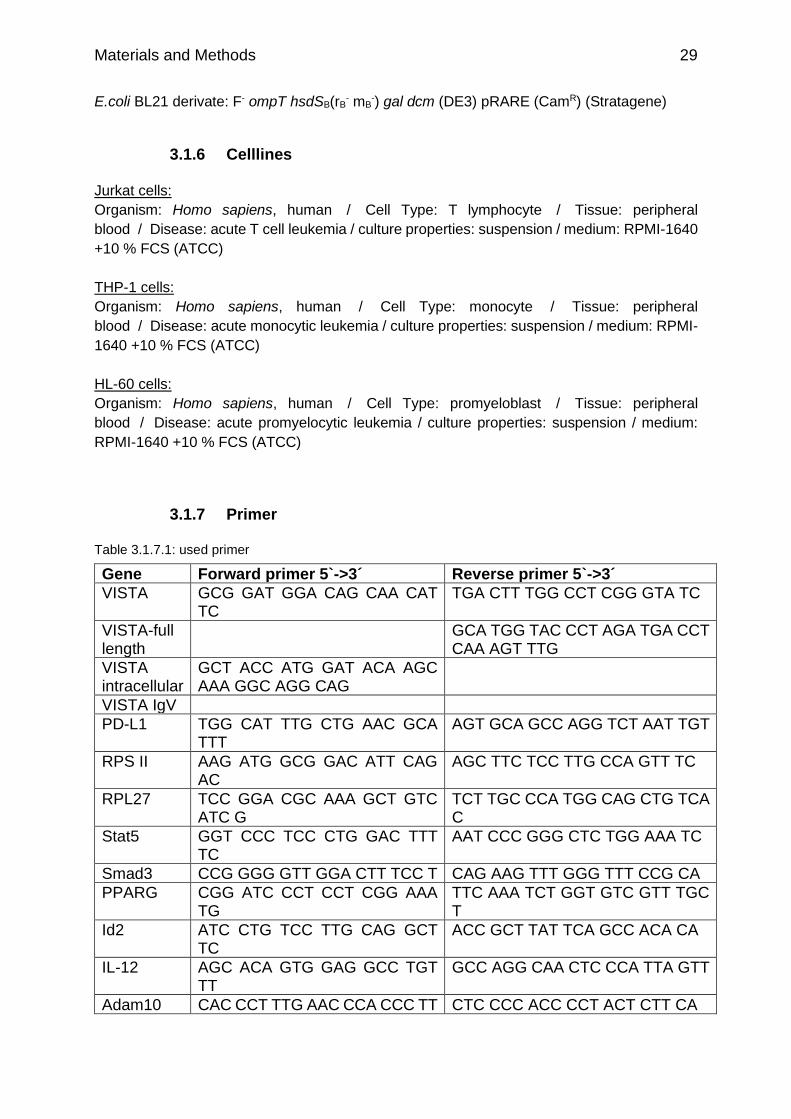
Materials and Methods 29
E.coli BL21 derivate: F- ompT hsdSB(rB- mB
-) gal dcm (DE3) pRARE (CamR) (Stratagene)
3.1.6 Celllines
Jurkat cells:
Organism: Homo sapiens, human / Cell Type: T lymphocyte / Tissue: peripheral
blood / Disease: acute T cell leukemia / culture properties: suspension / medium: RPMI-1640
+10 % FCS (ATCC)
THP-1 cells:
Organism: Homo sapiens, human / Cell Type: monocyte / Tissue: peripheral
blood / Disease: acute monocytic leukemia / culture properties: suspension / medium: RPMI-
1640 +10 % FCS (ATCC)
HL-60 cells:
Organism: Homo sapiens, human / Cell Type: promyeloblast / Tissue: peripheral
blood / Disease: acute promyelocytic leukemia / culture properties: suspension / medium:
RPMI-1640 +10 % FCS (ATCC)
3.1.7 Primer
Table 3.1.7.1: used primer
Gene Forward primer 5`->3´ Reverse primer 5`->3´
VISTA GCG GAT GGA CAG CAA CAT TC
TGA CTT TGG CCT CGG GTA TC
VISTA-full length
GCA TGG TAC CCT AGA TGA CCT CAA AGT TTG
VISTA intracellular
GCT ACC ATG GAT ACA AGC AAA GGC AGG CAG
VISTA IgV
PD-L1 TGG CAT TTG CTG AAC GCA TTT
AGT GCA GCC AGG TCT AAT TGT
RPS II AAG ATG GCG GAC ATT CAG AC
AGC TTC TCC TTG CCA GTT TC
RPL27 TCC GGA CGC AAA GCT GTC ATC G
TCT TGC CCA TGG CAG CTG TCA C
Stat5 GGT CCC TCC CTG GAC TTT TC
AAT CCC GGG CTC TGG AAA TC
Smad3 CCG GGG GTT GGA CTT TCC T CAG AAG TTT GGG TTT CCG CA
PPARG CGG ATC CCT CCT CGG AAA TG
TTC AAA TCT GGT GTC GTT TGC T
Id2 ATC CTG TCC TTG CAG GCT TC
ACC GCT TAT TCA GCC ACA CA
IL-12 AGC ACA GTG GAG GCC TGT TT
GCC AGG CAA CTC CCA TTA GTT
Adam10 CAC CCT TTG AAC CCA CCC TT CTC CCC ACC CCT ACT CTT CA
Materials and Methods 30
3.2 Methods
3.2.1 Isolation of murine bone marrow cells and differentiation into
bone marrow derived macrophages (BMDMs)
Macrophage medium:
• DMEM high glucose GlutaMAX media (4,5 g/L glucose)
• 10 % FCS
• 1 % Pen-Strep
• 20 ng/mL GM-CSF
The murine hind leg bones needed to be extracted intact and without organic materials
like muscle or tendons. The bone ends were cut under the clean bench and the bone
marrow was rinsed with a syringe in a sterile petri dish filled with sterile PBS. The bone
marrow cells were collected with PBS in a 50 mL Falcon tube which was centrifuged
for 5 min at 500 xg and RT to purify the bone marrow cells. Afterwards the cells were
counted with a Neubauer improved-Zählkammer and seeded with a concentration of
1*106 cells/mL in a petri dish with the corresponding amount of Macrophage medium.
On day two, the same amount of Macrophage medium was added gently to the dish.
On day four, half of the whole medium was removed carefully and replaced by the
same amount of fresh medium.
By day six-seven the cells were fully differentiated into a mixture of Antigen Presenting
Cells (APCs) with mainly macrophages, so called bone marrow derived macrophages
(BMDMs), and are about 80 % confluent.
All procedures were in accordance with the ethical standards as laid down in the 1964
Declaration of Helsinki and its later amendments.
All applicable inter-/national and institutional guidelines for the care and use of
laboratory animals were followed.
3.2.2 Cell counting via Neubauer improved-counting chamber
The Neubauer improved-counting chamber was used with a coverslip as described in
the protocol (https://www.emsdiasum.com/microscopy/technical/datasheet/68052-
14.aspx). The cells were stained with 1:10 trypan blue and all cells that weren’t stained
and appeared bright and reflecting were counted.
3.2.3 Isolation of human peripheral blood mononuclear cells
(PBMCs), CD14+ enrichment and differentiation into monocyte
derived macrophages
Isolation of peripheral blood mononuclear cells (PBMCs)
The donor blood was collected in tubes with ~10mL blood per tube. Per tube 10 mL
PBS was added in a 50 mL Falcon tube and mixed gently. 8 mL of the blood/PBS
solution was overlaid on 4 mL Lymphoprep in a 15 mL Falcon tube and centrifuged at
RT for 25 min at 400 xg without brakes. The interphases of one or two tubes were

Materials and Methods 31
collected in a 50 mL Falcon and filled up with PBS. The tube was centrifuged at RT for
5 min at 800 xg and the supernatant was removed. The pellet contained the peripheral
blood mononuclear cells (PBMCs) and was resuspended in 2,5 mL media (RPMI+10
% FCS)/blood tube. The PBMCs were pooled in a 15 mL Falcon and the percentage
of PBMCs in the population was analyzed via flow cytometry.
CD14+ enrichment via Magnetic Cell Separation (MACS) of Miltenyi Biotech
The CD14+ enrichment from PBMCs was done via a positive selection. The PBMCs
were centrifuged at RT for 5 min at 500 xg, resuspended in 10 mL PBS and centrifuged
again with the same conditions. The supernatant was removed, the cells were
resuspended in PBS and magnetic CD14+ Microbeads: 20 µL Microbeads + 80 µL
PBS/1 Mio PBMCs. The mixture was incubated for 15-45 min at 4 °C. 8 mL PBS was
added after the incubation and the solution was centrifuged at RT for 5 min at 500 xg.
The pellet was resuspended in 500 µL PBS and the cells were isolated with MidiMACS
separation of Miltenyi Biotech.
The MidiMACS column was fixed on the MidiMACS magnet and calibrated with 500-
1000 µL PBS. The cell-bead solution was added on the column and the flow through
was collected in a FACS tube. The column was washed three times with 500-1000 µL
of PBS and the flow through was collected in a FACS tube. For elution the MidiMACS
column was removed from the MidiMACS magnet and the CD14+ cells were collected
with a syringe with 1 mL PBS in a FACS tube. 1 mL medium (RPMI+10 % FCS) was
added and the cells were counted via flow cytometry. The cells were seeded in 1*106
cells/mL and differentiated to M0 macrophages.
This method was carried out at the UMCG in The Netherlands in accordance with the
applicable rules concerning the review of Research Ethics Committees and informed
consent.
3.2.4 Differentiation of the different macrophage subtypes
For this thesis several cells were differentiated into different macrophage types. All
cells were first differentiated to M0 macrophages under the following conditions:
Table 3.2.4.1: conditions for macrophage M0 differentiation
cell type stimulus medium duration
BMDMs 20 ng/mL GM-CSF DMEM GlutaMAX+10 % FCS+ 1% Pen-Strep
6-7 days
Monocyte derived macrophages
50 ng/mL GM-CSF and M-CSF
RPMI-1640 + 10 % FCS 6-7 days
HL-60 1 µM PMA RPMI-1640 + 10 % FCS 2-3 days
THP-1 1 µM PMA RPMI-1640 + 10 % FCS 2-3 days
M0 macrophages can be further differentiated into M1, M2a or M2c macrophages via
further incubation for 24 h with the following cytokines:
M1: 100 ng/mL LPS + 50 ng/mL IFNγ
M2a: 50 ng/mL IL-4
M2c: 50 ng/mL IL-10
Materials and Methods 32
3.2.5 Immunohistochemistry (IHC) protocol of primary murine cells
and human celllines
The murine cells were fixed with 2 % PFA in TBS for 10 min. Afterwards the PFA
solution was removed and the cells incubated in TBS+0,3 % Triton X-100 for 20 min.
The cells were washed two times for 5 min in TBS+0,3 % Triton X-100 and then
blocked with 10 % donkey serum in TBS for 1 h at RT. After two washing steps for 5
min in TBS+0,3 % Triton X-100 the primary antibody, which was diluted 1:200 in TBS,
was incubated in a moist environment for 1-2 h at RT or over night at 4 °C. After primary
antibody incubation the cells were washed three times for 5 minutes in TBS+0,3 %
Triton X-100. The secondary antibody was diluted 1:500 in TBS and incubated in a
dark and moist environment on the cells for 1-2 h at RT or over night at 4 °C. The
washing was performed three times for 5 min in TBS+0,3 % Triton X-100 and two times
in TBS. Finally, the cells were embedded in DAPI or DAPI free medium depending on
the necessity of a nuclei staining and analyzed via fluorescent microscopy.
3.2.6 Immunohistochemistry (IHC) protocol of primary human cells
The human cells were fixed with 4 % PFA in PBS for 10 min. Afterwards the PFA
solution was removed and the cells incubated in PBS+0,05 % Tween20 for 10 min.
The cells were washed two times for 5 min in PBS+0,05 % Tween20 and then blocked
with 10 % horse serum in PBS+0,05 % Tween20 for 1 h at RT. After two washing steps
for 5 min in PBS+0,05 % Tween20 the Fc-blocker was added with 200 µg/mL PBS.
The primary antibody, which was diluted 1:200 in Fc-PBS-blocking solution, was
incubated in a moist environment for 1-2 h at RT or overnight at 4 °C. After primary
antibody incubation the cells were washed three times for 5 minutes in PBS+0,05 %
Tween20. The secondary antibody was diluted 1:200 in PBS+0,05 % Tween20 and
incubated in a dark and moist environment on the cells for 1-2 h at RT or over night at
4 °C. The washing was performed three times for 5 min in PBS+0,05 % Tween20. For
the nuclei staining the DAPI solution was diluted 1:2000 and added on the cells for 2
min. Three washing steps followed for 5 min in PBS+0,05 % Tween20 and two more
washing steps with PBS. Finally, the cells were embedded in Vector Shield and
analyzed via fluorescent microscopy.
3.2.7 FACS staining protocol
Per FACS sample at least 10 000 cells were used. Adherent cells were washed with
PBS and trypsinated for several minutes at 37 °C to detach the cells. Afterwards the
cells were harvested, centrifuged at 400 xg for 5 min and resuspended in 200 µL PBS.
Suspension cells were directly centrifuged and resuspended in PBS.
The fluorescent-labelled antibodies for FACS staining and FCR-blocking reagent were
diluted 1:200 in the cell suspension and incubated for 45 min at 4 °C.

Materials and Methods 33
Afterwards the cells were washed twice with 1 mL PBS via centrifugation for 5 min at
400 xg. For measurement the cells were resuspended in 200 µL PBS.
3.2.8 Cloning
Cloned constructs:
- petM-11-His-TEV-VISTA IgV (kanamycin resistant) (Figure 3.2.8.1 a)
- petM-11-His-TEV-VISTA intra (kanamycin resistant) (Figure 3.2.8.1 a)
- petGST1a-His-TEV-VISTA IgV (kanamycin resistant) (Figure 3.2.8.1 b)
- petGST1a-His-TEV-VISTA intra (kanamycin resistant) (Figure 3.2.8.1 b)
Figure 3.2.8.1: Cloning of VISTA constructs
The vector cards are attached in the appendix (Figure 7.1.1 and Figure 7.1.2).
The exons of the VISTA domains were optimized for E.coli expression and ordered.
General procedure:
1. The insert was amplified by PCR and digested for 1-2 h at 37 °C with NcoI-HF and KpnI-HF. The insert was purified from a 1,5 % agarose gel via FastGene Gel/PCR Extraction Kit by Nippon Genetics
2. The vector was digested with NcoI-HF and KpnI-HF, purified and 1 h dephosphorylated with the Quick CIP Kit from NEB at 37 °C. The phosphatase was deactivated at 80 °C for 2 min
3. Ligation of insert and vector was performed over night at 4 °C with the Rapid DNA Ligation Kit by Sigma-Aldrich
4. Transformation of the ligated construct by heat-shock in XL-1 blue cells 5. Plasmid DNA of some colonies was purified with FastGene Plasmid Mini Kit
by Nippon Genetics and digested with NcoI-HF and KpnI-HF. Positive clones which showed an insert band on 1,5 % agarose gel were sequenced at GATC Biotech.
3.2.9 Protein expression and harvesting
The extracellular (IgV-VISTA) and the intracellular (intra-VISTA) domain of VISTA were
heterologously expressed in BL21 or Rosetta E. coli bacteria cells. Both protein
domains were expressed as fusion proteins. For the IgV-VISTA construct the pETM-
11 Vector was transformed into BL21 or Rosetta E. coli bacteria cells, leading to a
fusion protein of IgV-VISTA with a His-tag (six histidine at the C-terminus) for
purification. The intra-VISTA construct needed a solubility tag for successful
expression. For that the protein was cloned into the GST-vector leading to the fusion

Materials and Methods 34
protein intra-VISTA with His-tag and GST-tag. The plasmids were transformed into
BL21 or Rosetta E. coli bacteria and plated on a LB Agar plate containing
corresponding antibiotic (30 µg/mL kanamycin) overnight. One colony of the agar plate
was used for a preculture of 5 mL autoclaved LB medium (Lennox) with corresponding
antibiotic. The preculture was incubated overnight at 37 °C in a rotating incubator and
transferred in a prewarmed 500 mL LB media flask with corresponding antibiotic and
incubated at 37 °C and 180 rpm. When the OD600 was between 0,6-0,8 1 mM isopropyl-
β-D-thiogalactopyranoside (IPTG) was added and the protein expression was
performed for 3-4 h. The bacteria suspension was centrifuged at 4 °C for 10 min at
6000 xg. The supernatant was discarded, the pellet was resuspended in 5 mL of PBS
and collected in a 15 mL Falcon. The Falcon was centrifuged at 4 °C for 10 min at 10
000 xg and the supernatant was discarded. The pellet was frozen in liquid nitrogen and
stored at -20 °C.
3.2.10 Purification of the extracellular IgV domain of VISTA
The IgV VISTA domain was purified via immobilized metal affinity chromatography
(IMAC). The His-tag of the VISTA proteins can bind to Ni2+. Therefore, the IMAC
columns were filled with NTA-agarose (Ni2+-NTA agarose ThermoFisher).
Before purification, the harvested cells needed to be lysed. For that, the cells were
resuspended in 10 mL lysis buffer and sonified for 5 min ultrasonic sonifier. The
suspension was centrifuged at 4 °C for 10 min at 50 000 g and the supernatant was
discarded. The pellet was resuspended in equilibration buffer, shortly vortexed and
sonified again for 10 s. Afterwards the solution was centrifuged again at 4 °C for 10
min at 50 000 xg. The supernatant was loaded twice on an equilibrated Ni2+-NTA
agarose column.
Equilibration of the column was done with 10 column volume (CV) bi-dest and 10 CV
of equilibration buffer.
For washing the different washing buffers 1-3 were added in sequence with 10 CV
each on the column. To fold back the denatured IgV-VISTA protein on the column a
Urea-gradient was used. 10 CV of each Urea buffer was used, and the gradient was
performed from 8 M Urea to 0 M of Urea in descending order. The folded protein was
eluted with 5 CV of Elution buffer.
The column was regenerated with 10 CV column-washing-buffer and 2x10 CV of bi-
dest water afterwards, 10 CV EDTA and 2x10 CV of bi-dest water afterwards and 5
CV of NiCl-solution with 2x10 CV of bi-dest water afterwards. The column was stored
filled with 20 % absolute Ethanol at 4 °C.
lysis buffer (10 mL): equilibration buffer: elution buffer
25 mM Tris, pH 8 (in 8 M Urea) 25 mM Tris, pH 8
10 mM Imidazol, pH 8 25 mM Tris, pH 8 400 mM Imidazol
150 mM NaCl, pH 8 10 mM Imidazol, pH 8 150 mM NaCl, pH 8
10 µL mPIC protease inhibitor 150 mM NaCl, pH 8
10 µL DNase 10 mM β-2-Mercaptoethanol
Tip of a spatula of Lysozyme
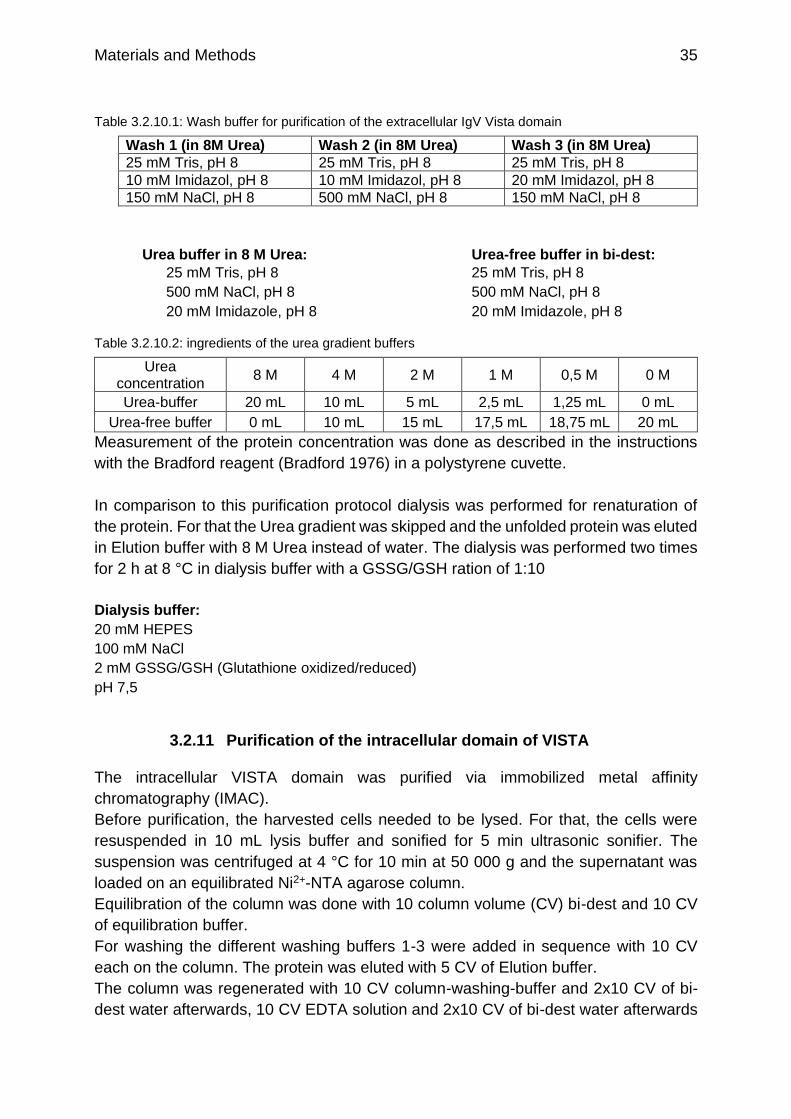
Materials and Methods 35
Table 3.2.10.1: Wash buffer for purification of the extracellular IgV Vista domain
Wash 1 (in 8M Urea) Wash 2 (in 8M Urea) Wash 3 (in 8M Urea)
25 mM Tris, pH 8 25 mM Tris, pH 8 25 mM Tris, pH 8
10 mM Imidazol, pH 8 10 mM Imidazol, pH 8 20 mM Imidazol, pH 8
150 mM NaCl, pH 8 500 mM NaCl, pH 8 150 mM NaCl, pH 8
Urea buffer in 8 M Urea: Urea-free buffer in bi-dest:
25 mM Tris, pH 8 25 mM Tris, pH 8
500 mM NaCl, pH 8 500 mM NaCl, pH 8
20 mM Imidazole, pH 8 20 mM Imidazole, pH 8
Table 3.2.10.2: ingredients of the urea gradient buffers
Urea concentration
8 M 4 M 2 M 1 M 0,5 M 0 M
Urea-buffer 20 mL 10 mL 5 mL 2,5 mL 1,25 mL 0 mL
Urea-free buffer 0 mL 10 mL 15 mL 17,5 mL 18,75 mL 20 mL
Measurement of the protein concentration was done as described in the instructions
with the Bradford reagent (Bradford 1976) in a polystyrene cuvette.
In comparison to this purification protocol dialysis was performed for renaturation of
the protein. For that the Urea gradient was skipped and the unfolded protein was eluted
in Elution buffer with 8 M Urea instead of water. The dialysis was performed two times
for 2 h at 8 °C in dialysis buffer with a GSSG/GSH ration of 1:10
Dialysis buffer:
20 mM HEPES
100 mM NaCl
2 mM GSSG/GSH (Glutathione oxidized/reduced)
pH 7,5
3.2.11 Purification of the intracellular domain of VISTA
The intracellular VISTA domain was purified via immobilized metal affinity
chromatography (IMAC).
Before purification, the harvested cells needed to be lysed. For that, the cells were
resuspended in 10 mL lysis buffer and sonified for 5 min ultrasonic sonifier. The
suspension was centrifuged at 4 °C for 10 min at 50 000 g and the supernatant was
loaded on an equilibrated Ni2+-NTA agarose column.
Equilibration of the column was done with 10 column volume (CV) bi-dest and 10 CV
of equilibration buffer.
For washing the different washing buffers 1-3 were added in sequence with 10 CV
each on the column. The protein was eluted with 5 CV of Elution buffer.
The column was regenerated with 10 CV column-washing-buffer and 2x10 CV of bi-
dest water afterwards, 10 CV EDTA solution and 2x10 CV of bi-dest water afterwards
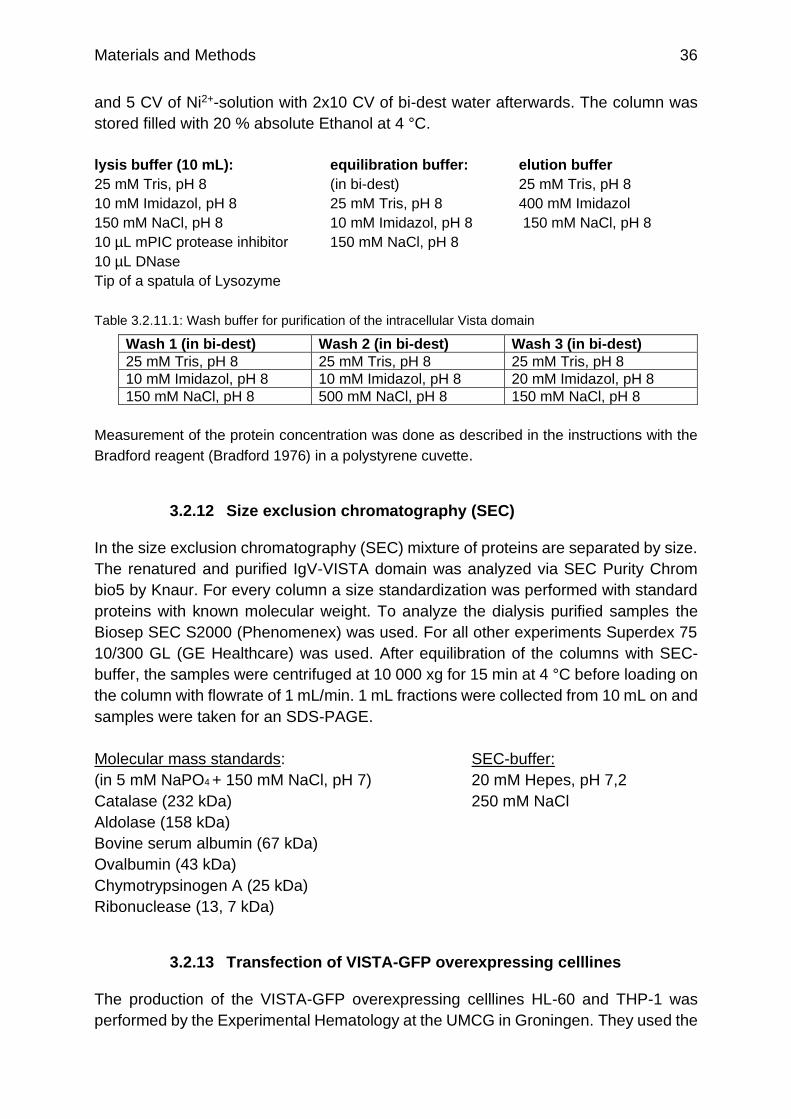
Materials and Methods 36
and 5 CV of Ni2+-solution with 2x10 CV of bi-dest water afterwards. The column was
stored filled with 20 % absolute Ethanol at 4 °C.
lysis buffer (10 mL): equilibration buffer: elution buffer
25 mM Tris, pH 8 (in bi-dest) 25 mM Tris, pH 8
10 mM Imidazol, pH 8 25 mM Tris, pH 8 400 mM Imidazol
150 mM NaCl, pH 8 10 mM Imidazol, pH 8 150 mM NaCl, pH 8
10 µL mPIC protease inhibitor 150 mM NaCl, pH 8
10 µL DNase
Tip of a spatula of Lysozyme
Table 3.2.11.1: Wash buffer for purification of the intracellular Vista domain
Wash 1 (in bi-dest) Wash 2 (in bi-dest) Wash 3 (in bi-dest)
25 mM Tris, pH 8 25 mM Tris, pH 8 25 mM Tris, pH 8
10 mM Imidazol, pH 8 10 mM Imidazol, pH 8 20 mM Imidazol, pH 8
150 mM NaCl, pH 8 500 mM NaCl, pH 8 150 mM NaCl, pH 8
Measurement of the protein concentration was done as described in the instructions with the
Bradford reagent (Bradford 1976) in a polystyrene cuvette.
3.2.12 Size exclusion chromatography (SEC)
In the size exclusion chromatography (SEC) mixture of proteins are separated by size.
The renatured and purified IgV-VISTA domain was analyzed via SEC Purity Chrom
bio5 by Knaur. For every column a size standardization was performed with standard
proteins with known molecular weight. To analyze the dialysis purified samples the
Biosep SEC S2000 (Phenomenex) was used. For all other experiments Superdex 75
10/300 GL (GE Healthcare) was used. After equilibration of the columns with SEC-
buffer, the samples were centrifuged at 10 000 xg for 15 min at 4 °C before loading on
the column with flowrate of 1 mL/min. 1 mL fractions were collected from 10 mL on and
samples were taken for an SDS-PAGE.
Molecular mass standards: SEC-buffer:
(in 5 mM NaPO4 + 150 mM NaCl, pH 7) 20 mM Hepes, pH 7,2
Catalase (232 kDa) 250 mM NaCl
Aldolase (158 kDa)
Bovine serum albumin (67 kDa)
Ovalbumin (43 kDa)
Chymotrypsinogen A (25 kDa)
Ribonuclease (13, 7 kDa)
3.2.13 Transfection of VISTA-GFP overexpressing celllines
The production of the VISTA-GFP overexpressing celllines HL-60 and THP-1 was
performed by the Experimental Hematology at the UMCG in Groningen. They used the
Materials and Methods 37
following lentivirus generation protocol to produce the 2e generation lentivirus. In
addition the used the envelope pCMV-VSV-G (https://www.addgene.org/8454/) and
packaging plasmid psPAX2 (https://www.addgene.org/12260/).
Lentivirus generation protocol
Day 1
- Coat T75 flasks with 5 ml 0.1% gelatine for 1-2 hours at RT.
- Aspirate off the gelatine and plate between 2 x 10⁶ 293T cells in 15 ml DMEM
+ 10% FCS and Pen-Strep into a gelatine coated T75. Incubate overnight at
37°C, 5% CO2.
Day 2
Change media to 5 ml DMEM+ 10% FCS and Pen-Strep 2-6 hours before transfection.
Transfect with Eugene:
Tube 1:
DMEM (-FCS and Pen-Strep) 100µl
Packaging construct (pCMV ∆8.91) 3µg
Glycoprotein envelope plasmid (VSV-G) 0.7µg
Vector construct 3µg
Tube 2:
- - DMEM (-FCS and Pen-Strep) 400µl
- Fugene 6 21µl
Add tube 1 to tube 2, flick gently to mix and allow complex formation for 20 minutes at
RT.
Add mixture drop-wise to 293T cells, swirl gently and incubate overnight at 37°C, 5%
CO2.
Day 3
- Change medium on 293T cells to 6 ml HPGM and incubate overnight at 37°C,
5% CO2.
Day 4
Harvest 6 ml virus from the T75 into a 10 cm plate (very gently since a lot of the cells
will detach)
Pass over two 0.45µm filters (one filter for each 3 ml virus)
Freeze virus supernatant at -80°C in 500 µl aliquots.
The transfection efficiency was after several passages still at more than 70 %
(controlled by flow cytometry).
3.2.14 Enzyme-linked Immunosorbent Assay (ELISA)
Detection of murine IL-6 via Sandwich-ELISA:

Materials and Methods 38
Primary antibody against the antigen was diluted 1:500 in PBS and bound to the
microtiter plate with 50 µL/well for 2 h at RT or at 4 °C overnight. The microtiter plate
was washed two times with PBS-T (PBS+0,05 % Tween 20) and dried via tapping it
on a tissue cloth. The blocking was performed with 1 % bovine serum albumin (BSA)
in PBS for 30 min at RT with three PBS-T washing steps afterwards. The samples and
cytokine standard were added for 4 h at RT or at 4 °C overnight. IL-6 standard was
performed with 12 dilution steps from 60 ng/mL on, each with 1:3 dilution in medium.
Afterwards the microtiter plate was washed three times with PBS-T. The antibody-
bound antigen was recognized by the secondary biotin-labelled antibody which was
diluted 1:1000 in medium and was added with 100 µL/well for 1 h at RT. Washing was
done three times with PBS-T. Streptavidin-conjugated horse radish peroxidase was
diluted 1:1000 in PBS and added on the microtiter plate for 30 min at RT with 100
µL/well. The microtiter plate was washed six times with PBS-T and dried via tapping
the microtiter plate on a tissue cloth strongly. 50 µL of Tetramethylbenzidine (TMB)
solution was incubated for 5-10 min in the dark for the enzymatic color-reaction. The
reaction was stopped with 50 µL of 2 M H2SO4 and the amount of IL-6 was quantified
at OD450.
TMB solution: 1 pill of TMB was dissolved in 10 mL of buffer Na2HPO4 11,9 g/L Na-Citrate 7,29 g/L 5 µL of 30 % H2O2
3.2.15 Polyacrylamide gel electrophoresis
The sodium dodecyl sulfate polyacrylamide gel electrophoresis (SDS-PAGE), modified
by Laemmli (Laemmli 1970), was used for all experiments to separate a protein
composite in single proteins due to their molecular mass at 200 V, 299 mA and 15 W.
For this discontinuous gel electrophoresis, two different gels were used, the stacking
gel and the running gel, in the Mini-Protean-3-Electrophoresis system (BioRad). In the
stacking gel the samples were concentrated and focused which leads to a better
distinction and separation of the protein bands in the running gel. For running gel an
Acrylamide-Bis concentration between 10-15 % was used, depending on the sample
size. The running gel was overlaid by iso-butanol to prevent drying and a rough surface
of the running gel. The iso-butanol was discarded after polymerization of the running
gel and the stacking gel (5 % Acryl-Bis) was added with a comb into it. The samples
were mixed with Laemmli sample buffer and the Electrophoresis was running with SDS
Electrophoresis buffer.
SDS Electrophoresis buffer (10x): Laemmli sample buffer (2x):
30 g/L Tris 126 mM Tris/HCl, pH 6,8
144 g/L Glycine 20 % Glycerol
10 g/L SDS 4 % SDS
0,02 % Bromphenolblue

Materials and Methods 39
running gel receipt (12 %): stacking gel receipt (5 %):
1725 µL H2O 610 µL H2O
1000 µL Tris/HCl 1,5 M, pH 8,8 250 µL Tris/HCl 0,5 M, pH 6,8
1200 µL Acrylamide-Bis solution 40% 125 µL Acrylamide-Bis solution 40%
2,5 µL TEMED 1,2 µL TEMED
21,5 µL Ammonium persulfate (APS) 12 µL APS
To increase the accessibility for vesicle and pellet samples in the gel, Urea-gels were
used for cell fractionation samples.
Urea-running gel receipt (10 %): Urea-stacking gel receipt (5 %):
1725 µL 8 M Urea 610 µL 8 M Urea
1000 µL Tris/HCl 1,5 M, pH 8,8 250 µL Tris/HCl 0,5 M, pH 6,8
1200 µL Acrylamide-Bis solution 40% 125 µL Acrylamide-Bis solution 40%
2,5 µL TEMED 1,2 µL TEMED
21,5 µL Ammonium persulfate (APS) 12 µL APS
3.2.16 Western Blot
The Western Blot was performed with protein samples which were separated by SDS-
PAGE before. The proteins were transferred to an equilibrated nitrocellulose (NC) by
semi-dry blotting with 10 V, 15 W, 299 mA for 30 min or via Turbo Blot from BioRad.
Equilibration of the NC membrane, the SDS gel and filter papers was performed via
three steps of 5 min incubation in Towbin buffer (Towbin et al. 1979). All blocking, and
antibody steps were performed in Roti-block instead of skim milk to prevent cross
reaction of goat antibodies against the bovine milk. For reproducibility Roti-block was
used for all antibodies.
After one washing step for 5 min in TBS the membrane was blocked in Roti-blocking
solution (10x concentrate diluted in TBS-T) in TBS-T for 1 h at RT. The membrane was
washed one time for 5 min in TBS-T and the primary antibody was diluted 1:1000 –
1:5000 in Roti-blocking solution before adding on the membrane for 1 h at RT or at 4
°C overnight. The primary antibody was removed via three washing steps in TBS-T.
The secondary peroxidase-coupled antibody was used in 1:10 000- 1:20 000 dilution
in Roti-blocking solution for 1 h at RT. The membrane was washed three times with
TBS-T and two times with TBS. To detect the signal, the membrane was incubated for
5 min in enhanced chemiluminescence (ECL) substrate solution (1:1 Western
BrightTM ECL and Western BrightTM Peroxide (advansta)). The luminescence was
detected via Intas Chemocam Imager or BioRad Gel Doc XR+ System.
Towbin-buffer: TBS: TBS-T: 25 mM Tris 20 mM Tris/HCl, pH 7.4 0.05% Tween-20
192 mM glycine 154 mM NaCl in TBS
20% methanol p.a.

Materials and Methods 40
3.2.17 Polymerase Chain Reaction (PCR)
The Polymerase Chain Reaction (PCR) was developed by Mullis (Bartlett und Stirling
2003) and is used to amplify DNA segments of interest. The amplification is
exponentially and generates high copy number of DNA. The PCR consists of five
important thermal steps:
1. Initialization: heating of the chamber to 94-96 °C to heat-activate the
thermostable DNA polymerase
2. Denaturation: heating of the chamber to 94-98 °C to cause melting of the two
DNA sample strands in single-stranded DNA
3. Annealing: temperature is lowered to 50-65 °C to anneal the two primers to each
of the single-stranded DNA templates
4. Extension/elongation: Adapt temperature to activity optimum for the
thermostable DNA polymerase to synthesize a new DNA strand out of the
dNTPs
Step 2-4 need to be repeated for multiple cycles to amplify the DNA
5. Final elongation: This step is performed at 70-74 °C to elongate all remaining
single DNA strands
For amplification of inserts for cloning, a PCR with a 25 µL or 50 µL batch with KOD
polymerase was used. The KOD polymerase shows 3’->5’ exonuclease-dependent
proofreading activity resulting in a lower mutation frequency which is beneficial for
cloning (Nishioka et al. 2001).
25 µL sample batch receipt:
2,5 µL 10x buffer
1,5 µL MgCl2
2,5 µL dNTPs
0,5 µL per primer
0,5 µL KOD polymerase
16,5 µL DNase-free water
0,5 µL DNA
PCR program:
Lid: preheat 99 °C
Step 1: 94 °C 2 min
Step 2: 94 °C 20 s
Step 3: 57 °C 10 s
Step 4: 70 °C 30 s
Repeat Step 2-4 25 x
Step 5: 70 °C 10 min
Step 6: keep at 8 °C
For colony PCR bacterial material was added with a pipet tip instead of pure DNA
Materials and Methods 41
3.2.18 Real-time quantitative reverse transcription PCR (qPCR)
For the qRT-PCR, RNA was isolated from about 2 Million cells with the RNeasy® Plus
Mini Kit from Qiagen. After measuring the RNA concentration via NanoDrop, 1000 ng
of RNA where converted into cDNA with the iScriptTM cDNA Synthesis Kit from BioRad.
The cDNA was used for the qRT-PCR formulation (Ponchel et al. 2003):
- 5 µL Sybr Green/ sample
- 0,1 µL Primer Mix of forward and reverse primer/ sample, 25 µM per Primer
- 5 µL cDNA sample in RNase-free H20
Step 1: 95 °C for 3 min
Step 2: 95 °C for 5 s
Step 3: 58 °C for 15 s
Repeat Step 2-3 39 x
Step 4: 95 °C 10 s
Step 5: 65 °C 3 s
The quantification was calculated via reference genes (RPSII and RPL27) via the ∆CT
Method (Livak und Schmittgen 2001).
3.2.19 Phagocytosis assay
For the phagocytosis assay, it was measured how many macrophages engulfed tumor
cells in a defined period of time. The phagocytosis assay was analyzed via microscope.
The phagocytosis assays were performed with 10 000 macrophages/ well in a 96 well
plate or with 40 000 macrophages/well in a 24 well plate and macrophage:tumor cell
ratio of 1:1-1:5 over 2-4 h.
Phagocytosis of HL-60 and THP-1 macrophages:
Both celllines were used as green-fluorescent GFP-mutants, so the tumor cells needed
to be stained in red. As tumor cells the B-cell lymphoma celllines SudHL4 or SudHL10
were used, because these are known celllines which are recognized and engulfed
easily and with a high percentage. SudHL10 and SudHL4 were engulfed via HL-60 and
THP-1 macrophages.
The tumor cells were stained with 1 µM IncuCyte® CytoLight Rapid reagent for 20 min
in PBS at 37 °C. The staining was washed two times with 1 mL medium via
centrifugation for 5 min at 450 xg. To activate and increase the phagocytosis, the tumor
cells were mixed with 1 µg/mL Rituximab antibody. The medium of the macrophages
was removed and the tumor cells were added in 100 µL/well for a 96 well plate and
300 µL/well in a 24 well plate. After phagocytosis for 2-4 h the tumor cells were
removed and washed away carefully with PBS. Microscope analysis was performed
directly.
Materials and Methods 42
Phagocytosis of monocyte derived macrophages:
The phagocytosis of monocyte derived macrophages was also analyzed by
microscope. Undifferentiated HL-60 and THP-1 cells were used as tumor cells and
stained with 5 µM CFSE for 5 min at 37 °C in PBS. The staining was washed with two
washing steps in 1 mL medium and centrifugation for 5 min at 450 xg. Afterwards the
tumor cells were radiated in the cesium source with 6 Gy. After a recovery of the cells
for 60-120 min at 37 °C the tumor cells were added on the medium-free macrophages.
After an incubation time for 2-4 h the tumor cells were removed and carefully washed
away. The macrophages were stained with a CD11b AF-594 antibody for 20 min 1:200
in medium while the presence of 1:200 FCR-blocking reagent. The antibody was
removed via washing twice with fresh medium and the phagocytosis was analyzed via
microscope.
3.2.20 Nucleus extract preparation
For a following mass spectrometer analysis four T165 flasks were used and one T75
flask for a Western Blot analysis.
The following protocol describes the buffer amounts for four T165 flasks.
The cells were centrifuged for 5 min at 1200 rpm at 4 °C in a 50 mL Falcon tube.
Supernatant was discarded and the pellet was washed once in cold PBS with the same
centrifugation step. The pellet was resuspended in 3 mL buffer A and transferred to
two 2 mL Eppendorf tubes. The tubes were incubated on ice for 10 min before 75 µL
10 % NP-40 (Igepal end concentration 0,5 %) were added per tube. The tubes were
vortexed for 10 s and centrifuged for 1 min at 14 000 rpm at 4 °C to pellet the cell
nuclei.
The pellets were resuspended in 700 µL HS buffer each with filter tips and incubated
on ice for 20 min with 10 second vortex steps every 5 minutes.
The extracted nuclei were centrifuged for 15 min at 14 000 rpm at 4 °C and transferred
to a new pre-chilled 15 mL Falcon tube.
Buffer A: HS buffer:
10 mM HEPES/KOH pH 7.9 20 mM HEPES/KOH pH 7.9
1,5 mM MgCl2 1,5 mM MgCl2
10 mM KCl 420 mM NaCl
1 mM DTT (added freshly) 0.2 mM EDTA
1 x CLAP (added freshly) 25% Glycerol
0,1 mM PMSF (added freshly) 1 mM DTT (added freshly)
1 x CLAP (added freshly)
0,1 mM PMSF (added freshly)
Materials and Methods 43
3.2.21 Co-Immunoprecipitation/GFP pull-out (Van den Boom 2016)
The co-immunoprecipitation of VISTA was performed via adding the VISTA antibody
which was afterwards precipitated by Protein G beads. For the GFP pull-out GFP
beads were used and added to the samples.
Two volumes of dilution buffer and three volumes of wash buffer were added to the
samples (either cell extracts or nucleus extracts). For VISTA Co-IP 10 µL of antibody
per 5 mL cell suspension were incubated with the samples rotating over night at 4 °C.
50 µL of GFP-trap MA beads (GFP pull-out) or protein G beads (Co-
Immunoprecipitation) were equilibrated via adding 2 mL wash buffer, shortly spinned
down and washed again before resuspension in 50 µL of wash buffer/sample.
The beads were added to the samples and incubated rotating for 2 h at 4 °C. The
samples were transferred to a pre-lubricated 1,5 mL Eppendorf tube in a magnetic
rack. The beads were washed three times with 200 µL wash buffer via resuspending
the beads removed from the magnetic rack and then incubate the resuspended beads
for 1 min in the magnetic rack before the supernatant is removed carefully.
Afterwards the beads were resuspended in 100 µL wash buffer and transferred into a
new 1,5 mL Eppendorf tube.
For elution the supernatant is removed, and the beads were resuspended 20 µL elution
buffer and 10 µL 2x SDS samples buffer and heated at 100 °C for 10 min. The
supernatant can be used for a Western Blot, Coomassie or mass spectrometer
analysis.
Dilution buffer: Wash buffer (in TBS): Elution buffer:
25 mM Tris/Cl pH 7.5 0,3% NP-40/Igepal 50 mM Glycine
0,45% NP-40 1 x CLAP (added freshly) pH 2,8
1 x CLAP (added fresh) 0,1 mM PMSF (added freshly)
0,1 mM PMSF (added fresh)
3.2.22 Cell fractionation and vesicle isolation
The cell fractionation was performed with one dense T25 flask of Jurkat cells, THP-1
Vista-GFP cells or HL-60 Vista-GFP cells. For BMDMs 2-4 dense 10 mL petri dishes
were used, which corresponds to 20-40*106 cells.
The frozen cell pellet was resuspended in 100 µL TBS+100 mM KCl with 1 µL PMSF.
The cells were lysed mechanical with a syringe and a needle (22Gx1 ¼ 0,7x30 Nr. 12).
The cell suspension was centrifuged for 10 min at 500 xg. The pellet was used as the
“cell pellet” sample and resuspended in 100 µL 1x Laemmli sample buffer.
The supernatant was centrifuged for 10 min at 1000 xg to isolate the nuclei. The Nuclei
pellet was washed once in 100 µL TBS+100 mM KCl with the same centrifugation step.
Two µL of the nuclei suspension were fixed on a microscope slide for IHC staining
(3.2.6). The pellet was resuspended in 50 µL 1x Laemmli sample buffer as “nuclei”
sample.
Materials and Methods 44
The supernatant was centrifuged for 10 min at 3000 xg. This pellet was used as the
“organelles” sample. The supernatant was used as the “cytosol” sample or added on
top of a sucrose gradient for vesicle isolation.
The optimized sucrose gradient (Walker et al. 2016) for vesicle isolation was identified
as 500 µL 45 % sucrose+ 500 µL 35 % sucrose+ 500 µL 25 % sucrose with a
centrifugation for 3-4 h at 41 000 xg (S52ST rotor). The sucrose was always diluted in
TBS+100 mM KCl.
All sucrose fractions were harvested with a syringe in 1,5 mL Beckman Ultrifuge tubes
and centrifuged for 1 h at 100 000 xg (S45A rotor). Two µL of the vesicle suspension
were fixed on a microscope slide for IHC staining (3.2.6). The pellets were
resuspended in 25 µL 1x Laemmli sample buffer as “vesicle” samples.
Early endosomes are primarily at the border between 35 % and 45 % sucrose whereas
late endosomes and lysosomes accumulate at the border between 25-35 %.
3.2.23 Exosome isolation
For exosome isolation, cells of one dense T75 flask were cultured for three days in 15
mL of FCS-free medium. The medium was centrifuged for 10 min at 400 xg to remove
the cells. The supernatant was centrifuged for 15 min at 2000 xg to remove the debris
and nuclei. The supernatant was centrifuged for 30 min at 10 000 xg to remove all
other organelles. This supernatant was added on 1 mL of 30 % sucrose in TBS+100
mM KCl and centrifuged for 2 h at 100 000 xg. The supernatant was used as “medium”
sample. The pellet was resuspended in 500 µL TBS+100 mM KCl and centrifuged in
1,5 mL Beckman Ultrifuge tubes for 1 h at 100 000 xg (S45A rotor). Two µL of the
exosome suspension were fixed on a microscope slide for IHC staining (3.2.6). The
exosome pellet was resuspended in 25 µL 1x Laemmli sample buffer.
This protocol was adapted from the “classical” way of (Patel et al. 2019).
3.2.24 Particle analysis with Python
To analyze the vesicles within the cells on microscope pictures a particle analysis was
performed in Fiji (https://fiji.sc/; RRID:SCR_002285; Schindelin et al. 2012). For that,
the background corrected single color channels were converted into binary pictures
and the vesicles separated via watershed. Afterwards the threshold was adjusted for
best resolution of vesicles. In the particle analysis a size between 0-1,5 µm2 with 0,5-
1,0 circularity was chosen. The coordinates of all particles were analyzed by Python
(Python Software Foundation. Python Language Reference, version 2.7.13, Available
at https://www.python.org/; (G. van Rossum 1995)) for colocalization. The
colocalization plugins by Fiji would only give you a mean of colocalizing areas but can’t
count how many particles colocalize in the different channels. For that the following
Python methods was written:
import csv
from collections import OrderedDict
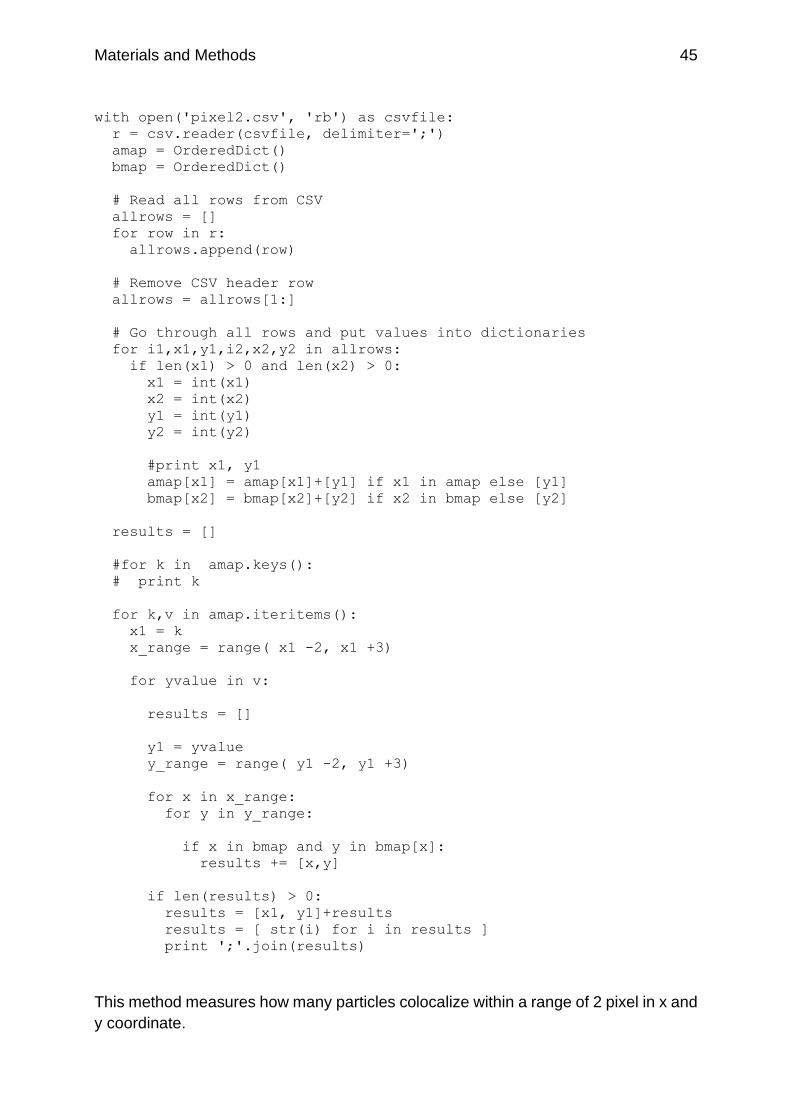
Materials and Methods 45
with open('pixel2.csv', 'rb') as csvfile:
r = csv.reader(csvfile, delimiter=';')
amap = OrderedDict()
bmap = OrderedDict()
# Read all rows from CSV
allrows = []
for row in r:
allrows.append(row)
# Remove CSV header row
allrows = allrows[1:]
# Go through all rows and put values into dictionaries
for i1,x1,y1,i2,x2,y2 in allrows:
if len(x1) > 0 and len(x2) > 0:
x1 = int(x1)
x2 = int(x2)
y1 = int(y1)
y2 = int(y2)
#print x1, y1
amap[x1] = amap[x1]+[y1] if x1 in amap else [y1]
bmap[x2] = bmap[x2]+[y2] if x2 in bmap else [y2]
results = []
#for k in amap.keys():
# print k
for k,v in amap.iteritems():
x1 = k
x_range = range( x1 -2, x1 +3)
for yvalue in v:
results = []
y1 = yvalue
y_range = range( y1 -2, y1 +3)
for x in x_range:
for y in y_range:
if x in bmap and y in bmap[x]:
results += [x,y]
if len(results) > 0:
results = [x1, y1]+results
results = [ str(i) for i in results ]
print ';'.join(results)
This method measures how many particles colocalize within a range of 2 pixel in x and
y coordinate.

Materials and Methods 46
3.2.25 Colocalization study
The colocalization studies were performed by the ImageJ (1.52i) Colocalization
Threshold method (Colocalisation_Analysis-3.0.4.jar). Briefly, a square of one color
channel in the colocalizing area was flipped horizontal and vertical and the Pearson
correlation coefficient Rtotal was calculated in comparison to the original picture.
3.2.26 Statistics
The results of this thesis were analyzed and evaluated by an analysis of variance
(ANOVA). Depending on the sample size and number of conditions one factorial or two
factorial ANOVA analysis was used. The null hypothesis of one factorial analysis is:
H0: µ1=µ2=...=µk
To check if the means of the sample groups are similar.
The alternative hypothesis is:
H1: µi≠µj
Samples groups with means that differ significantly on an alpha-level of 0,05 are
marked with stars (*). For that the p-value of comparing samples was calculated and
labelled with one to four stars from p-value <0,05 - <0,0001. The multiple comparisons
of a two factorial ANOVA were evaluated by Sidak, of a one factorial ANOVA by Tukey.
Confidence interval for both was 95 %.
In addition, the standard deviation of the samples is shown in black error bars.
Results of percental values could not be analyzed via ANOVA or comparable tests
because of the lacking normal distribution. For other statistical tests the sample size
was not sufficient, therefore we decided that a statistical analysis of my percental
results is not possible in this setting.

Results 47
4 Results
The results of this thesis can be distributed into three parts. In the first part 4.1 the
general expression pattern of VISTA was summarized. For that a general
characterization of the protein via SEC (4.1.1) was performed to check the hypothesis,
if the extracellular domain of VISTA can build dimers. Afterwards we investigated the
VISTA expression in different primary cells and celllines (4.1.2). The expression of
VISTA in different cellular fractions like vesicles, nuclei and exosomes was
summarized in 4.1.3. In the second part 4.2 the effects on the VISTA expression after
a stimulus were summarized. We used LPS as an immunogenic stimulus (4.2.1), the
inhibitors DAPT and TAPI-2 (4.2.2) and cell density (4.2.3) as stress stimuli. In the third
part 4.3 the consequences of VISTA overexpression on APCs were investigated. For
that we used myeloid VISTA-GFP overexpressing celllines. We observed effects on
the morphology on the celllines (4.3.1), measured the varied adhesion (4.3.2) and
phagocytosis (4.3.3 + 4.3.4). In addition, we checked some candidates of possible
interaction partners (4.3.5). The differentiation control for murine BMDMs and the IHC
antibody controls are attached in the appendix (Figure 7.2.5, Figure 7.2.6 and 7.2.7).
4.1 VISTA distribution in cell fractions and cell types
4.1.1 VISTA protein purification and characterization
After establishing a purification protocol for the insoluble recombinant IgV VISTA
domain, the characterization was realized (laboratory supervision of B.Sc. thesis of
Tanja Seifert). The results were summarized in (Tanja Seifert 2017).
The extracellular IgV-VISTA domain was expressed as petM11-His-TEV-IgV VISTA
plasmid in two different E.coli strains BL21 and Rosetta. The amount of expression
was checked with SDS-PAGE (Laemmli 1970). Samples of two flasks were taken every
hour (Figure 4.1.1.1).
Figure 4.1.1.1: Coomassie staining of the IgV-VISTA-TEV-His6 (19 kDa) expression in (A) BL-21 and (B) Rosetta in 15 % SDS gels. Samples were taken before induction (t0), after one (t1), two (t2) and three (t3) hours of expression
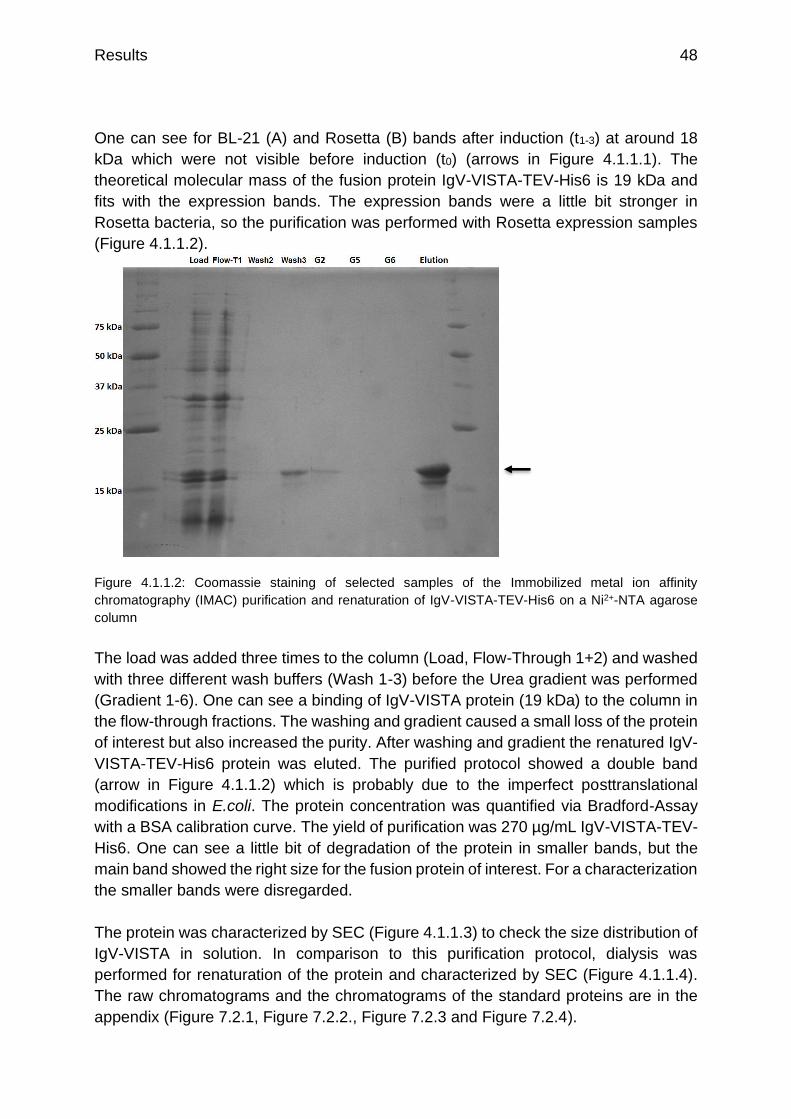
Results 48
One can see for BL-21 (A) and Rosetta (B) bands after induction (t1-3) at around 18
kDa which were not visible before induction (t0) (arrows in Figure 4.1.1.1). The
theoretical molecular mass of the fusion protein IgV-VISTA-TEV-His6 is 19 kDa and
fits with the expression bands. The expression bands were a little bit stronger in
Rosetta bacteria, so the purification was performed with Rosetta expression samples
(Figure 4.1.1.2).
Figure 4.1.1.2: Coomassie staining of selected samples of the Immobilized metal ion affinity
chromatography (IMAC) purification and renaturation of IgV-VISTA-TEV-His6 on a Ni2+-NTA agarose
column
The load was added three times to the column (Load, Flow-Through 1+2) and washed
with three different wash buffers (Wash 1-3) before the Urea gradient was performed
(Gradient 1-6). One can see a binding of IgV-VISTA protein (19 kDa) to the column in
the flow-through fractions. The washing and gradient caused a small loss of the protein
of interest but also increased the purity. After washing and gradient the renatured IgV-
VISTA-TEV-His6 protein was eluted. The purified protocol showed a double band
(arrow in Figure 4.1.1.2) which is probably due to the imperfect posttranslational
modifications in E.coli. The protein concentration was quantified via Bradford-Assay
with a BSA calibration curve. The yield of purification was 270 µg/mL IgV-VISTA-TEV-
His6. One can see a little bit of degradation of the protein in smaller bands, but the
main band showed the right size for the fusion protein of interest. For a characterization
the smaller bands were disregarded.
The protein was characterized by SEC (Figure 4.1.1.3) to check the size distribution of
IgV-VISTA in solution. In comparison to this purification protocol, dialysis was
performed for renaturation of the protein and characterized by SEC (Figure 4.1.1.4).
The raw chromatograms and the chromatograms of the standard proteins are in the
appendix (Figure 7.2.1, Figure 7.2.2., Figure 7.2.3 and Figure 7.2.4).
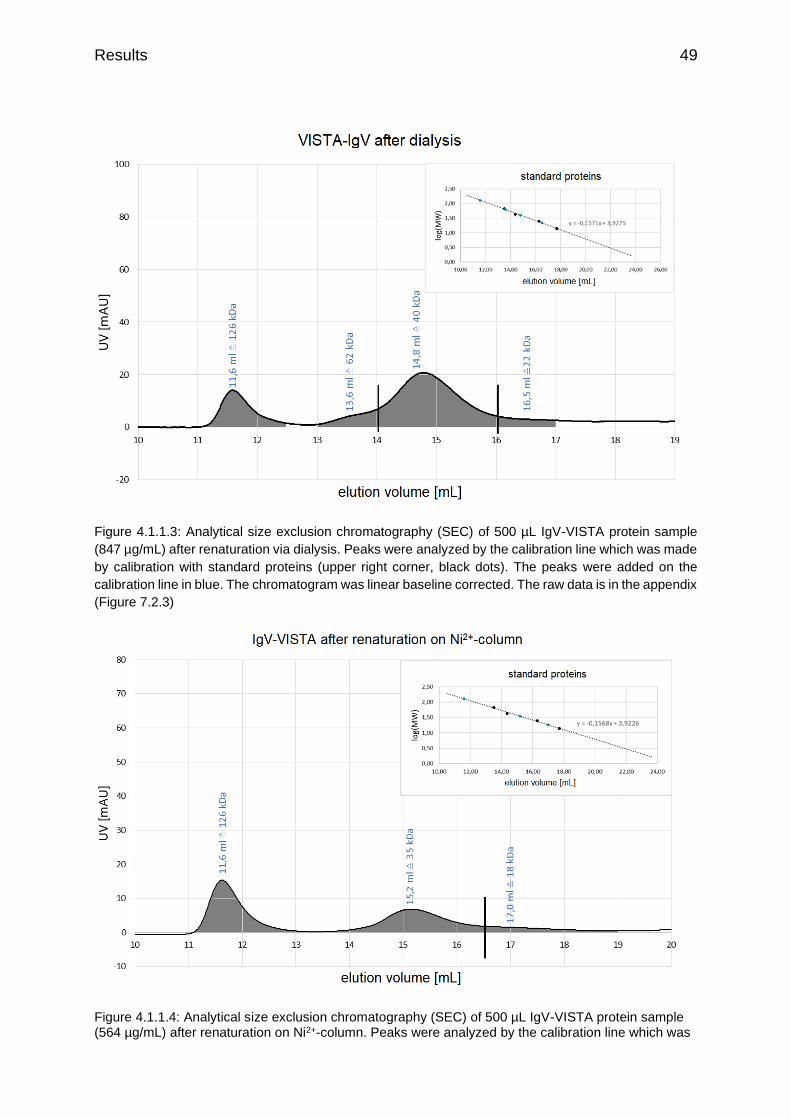
Results 49
Figure 4.1.1.3: Analytical size exclusion chromatography (SEC) of 500 µL IgV-VISTA protein sample
(847 µg/mL) after renaturation via dialysis. Peaks were analyzed by the calibration line which was made
by calibration with standard proteins (upper right corner, black dots). The peaks were added on the
calibration line in blue. The chromatogram was linear baseline corrected. The raw data is in the appendix
(Figure 7.2.3)
Figure 4.1.1.4: Analytical size exclusion chromatography (SEC) of 500 µL IgV-VISTA protein sample (564 µg/mL) after renaturation on Ni2+-column. Peaks were analyzed by the calibration line which was
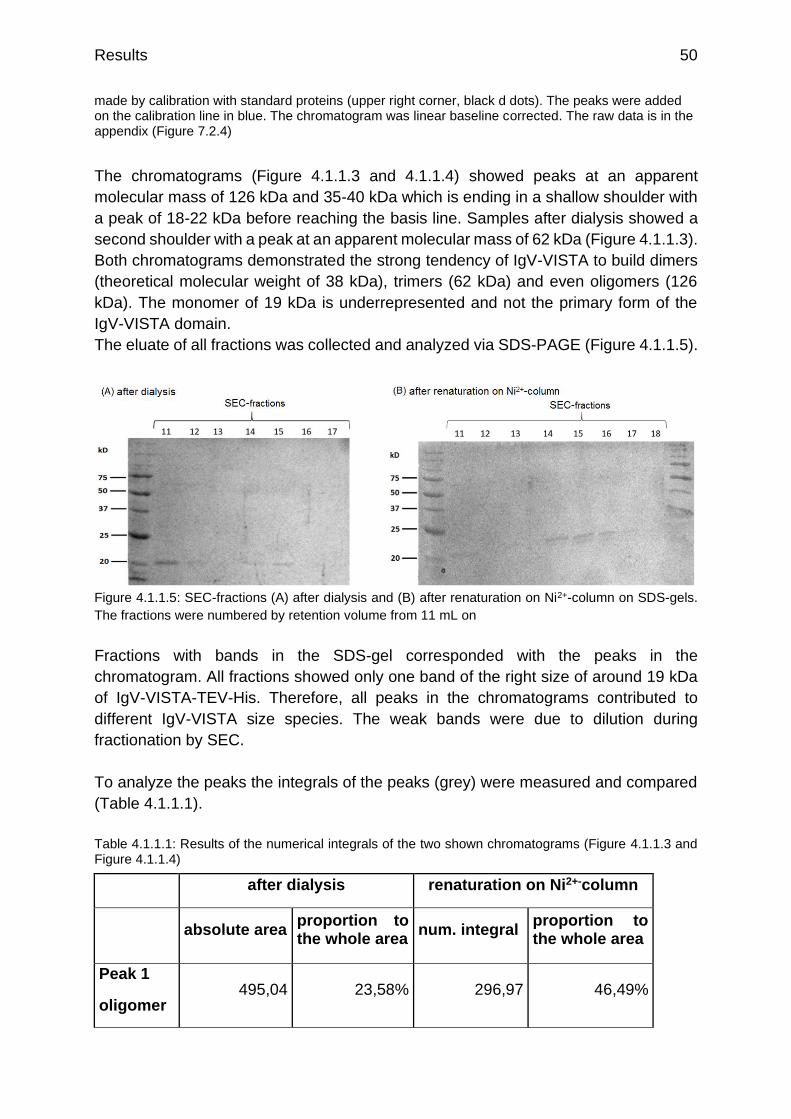
Results 50
made by calibration with standard proteins (upper right corner, black d dots). The peaks were added on the calibration line in blue. The chromatogram was linear baseline corrected. The raw data is in the appendix (Figure 7.2.4)
The chromatograms (Figure 4.1.1.3 and 4.1.1.4) showed peaks at an apparent
molecular mass of 126 kDa and 35-40 kDa which is ending in a shallow shoulder with
a peak of 18-22 kDa before reaching the basis line. Samples after dialysis showed a
second shoulder with a peak at an apparent molecular mass of 62 kDa (Figure 4.1.1.3).
Both chromatograms demonstrated the strong tendency of IgV-VISTA to build dimers
(theoretical molecular weight of 38 kDa), trimers (62 kDa) and even oligomers (126
kDa). The monomer of 19 kDa is underrepresented and not the primary form of the
IgV-VISTA domain.
The eluate of all fractions was collected and analyzed via SDS-PAGE (Figure 4.1.1.5).
Figure 4.1.1.5: SEC-fractions (A) after dialysis and (B) after renaturation on Ni2+-column on SDS-gels.
The fractions were numbered by retention volume from 11 mL on
Fractions with bands in the SDS-gel corresponded with the peaks in the
chromatogram. All fractions showed only one band of the right size of around 19 kDa
of IgV-VISTA-TEV-His. Therefore, all peaks in the chromatograms contributed to
different IgV-VISTA size species. The weak bands were due to dilution during
fractionation by SEC.
To analyze the peaks the integrals of the peaks (grey) were measured and compared
(Table 4.1.1.1).
Table 4.1.1.1: Results of the numerical integrals of the two shown chromatograms (Figure 4.1.1.3 and Figure 4.1.1.4)
after dialysis renaturation on Ni2+-column
absolute area proportion to the whole area
num. integral proportion to the whole area
Peak 1
oligomer 495,04 23,58% 296,97 46,49%
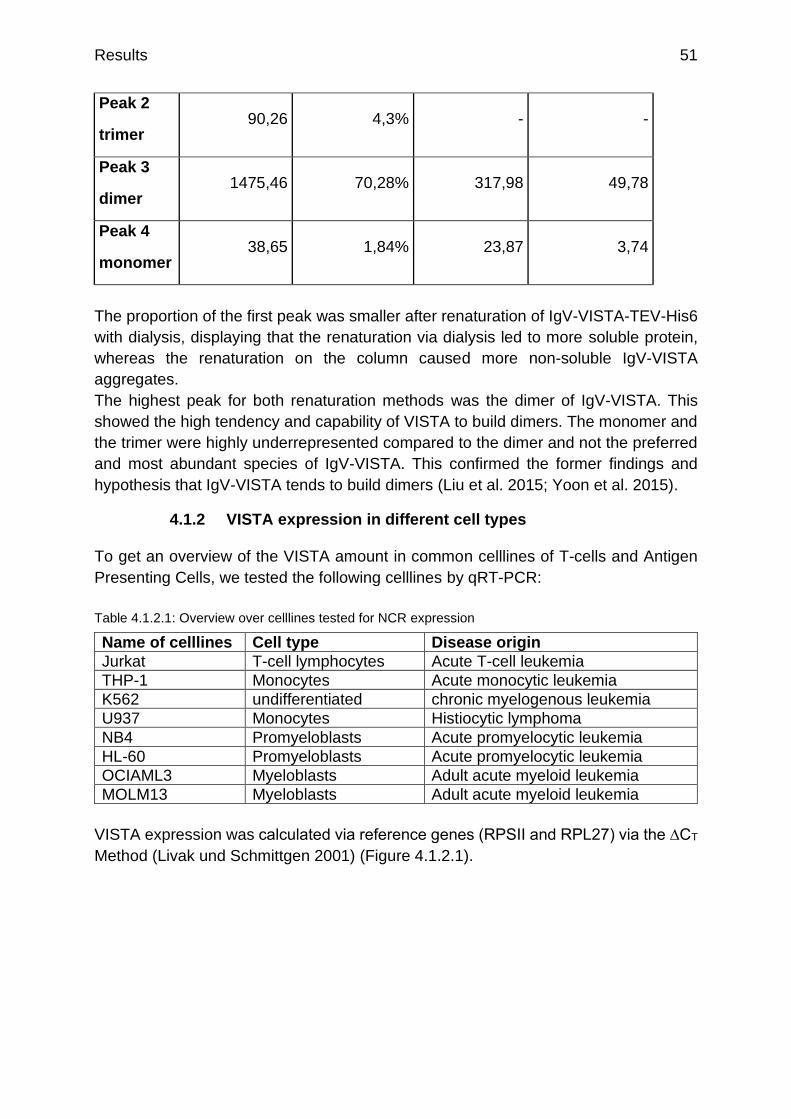
Results 51
Peak 2
trimer 90,26 4,3% - -
Peak 3
dimer 1475,46 70,28% 317,98 49,78
Peak 4
monomer 38,65 1,84% 23,87 3,74
The proportion of the first peak was smaller after renaturation of IgV-VISTA-TEV-His6
with dialysis, displaying that the renaturation via dialysis led to more soluble protein,
whereas the renaturation on the column caused more non-soluble IgV-VISTA
aggregates.
The highest peak for both renaturation methods was the dimer of IgV-VISTA. This
showed the high tendency and capability of VISTA to build dimers. The monomer and
the trimer were highly underrepresented compared to the dimer and not the preferred
and most abundant species of IgV-VISTA. This confirmed the former findings and
hypothesis that IgV-VISTA tends to build dimers (Liu et al. 2015; Yoon et al. 2015).
4.1.2 VISTA expression in different cell types
To get an overview of the VISTA amount in common celllines of T-cells and Antigen
Presenting Cells, we tested the following celllines by qRT-PCR:
Table 4.1.2.1: Overview over celllines tested for NCR expression
Name of celllines Cell type Disease origin
Jurkat T-cell lymphocytes Acute T-cell leukemia
THP-1 Monocytes Acute monocytic leukemia
K562 undifferentiated chronic myelogenous leukemia
U937 Monocytes Histiocytic lymphoma
NB4 Promyeloblasts Acute promyelocytic leukemia
HL-60 Promyeloblasts Acute promyelocytic leukemia
OCIAML3 Myeloblasts Adult acute myeloid leukemia
MOLM13 Myeloblasts Adult acute myeloid leukemia
VISTA expression was calculated via reference genes (RPSII and RPL27) via the ∆CT
Method (Livak und Schmittgen 2001) (Figure 4.1.2.1).

Results 52
Figure 4.1.2.1: qRT-PCR analysis of VISTA expression on different celllines, n=1 in triplicates
One could observe a difference regarding the amounts of VISTA between the two
reference genes. Nevertheless, both showed the same trend and pattern. The celllines
with the highest VISTA expression were OCIAML3, U937 and THP-1. Especially the
undifferentiated celllines K562, HL-60 and NB4 showed a weak VISTA expression.
Overall, the expression of VISTA was stronger in Antigen Presenting Cells than in T-
cells (Jurkat), like expected. All celllines were developed from tumor cells and did not
show high expression of VISTA, especially in comparison to primary cells (Figure
4.1.2.3). But in comparison to PD-L1 (Figure 4.1.2.2) which was mainly expressed on
Antigen Presenting Cells and upregulated on some tumor cells, the VISTA expression
was more prominent. PD-L1 showed 100x less expression than VISTA on the celllines
tested. The celllines with the highest PD-L1 expression were NB4, THP-1 and U937.
Figure 4.1.2.2: qRT-PCR analysis of PD-L1 expression on different celllines, n=1 in triplicates
The VISTA expression was much higher on primary cells (Figure 4.1.2.3) than on
celllines. On primary cells the expected higher VISTA expression on macrophages
compared to T-cells was also more pronounced. But depending on the peripheral blood
donor the amounts of VISTA expression differed. PD-L1 (Figure 4.1.2.4) showed the
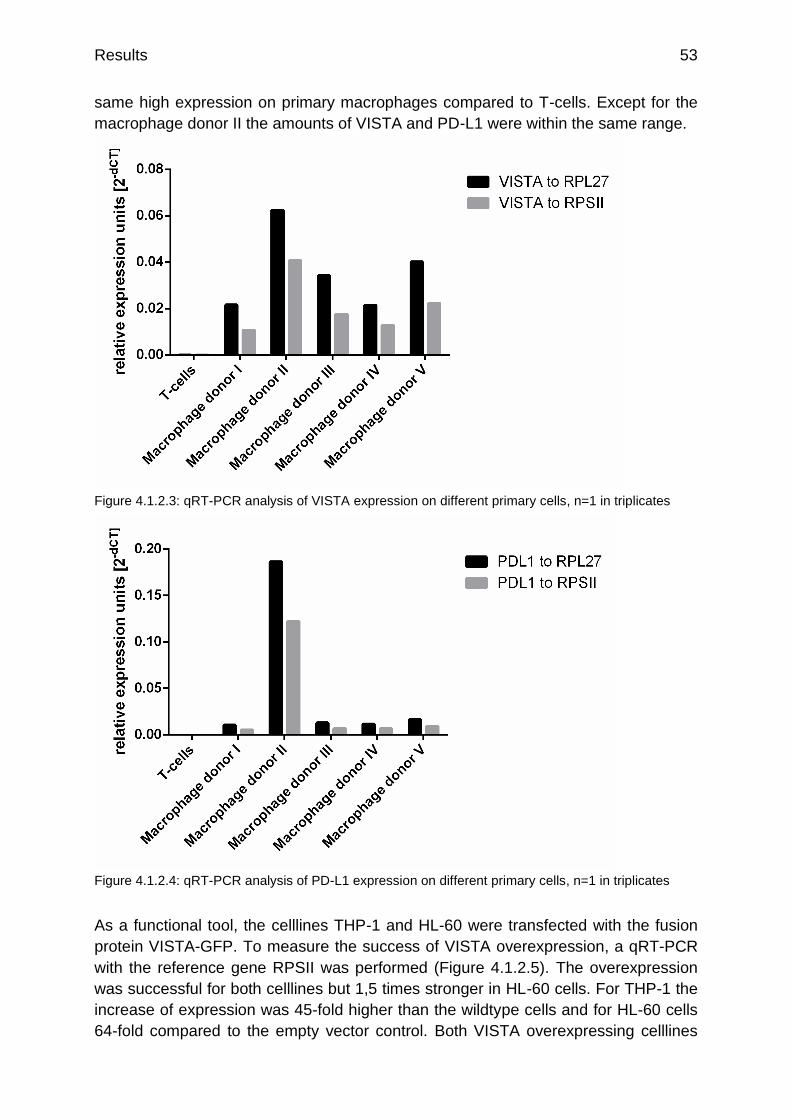
Results 53
same high expression on primary macrophages compared to T-cells. Except for the
macrophage donor II the amounts of VISTA and PD-L1 were within the same range.
Figure 4.1.2.3: qRT-PCR analysis of VISTA expression on different primary cells, n=1 in triplicates
Figure 4.1.2.4: qRT-PCR analysis of PD-L1 expression on different primary cells, n=1 in triplicates
As a functional tool, the celllines THP-1 and HL-60 were transfected with the fusion
protein VISTA-GFP. To measure the success of VISTA overexpression, a qRT-PCR
with the reference gene RPSII was performed (Figure 4.1.2.5). The overexpression
was successful for both celllines but 1,5 times stronger in HL-60 cells. For THP-1 the
increase of expression was 45-fold higher than the wildtype cells and for HL-60 cells
64-fold compared to the empty vector control. Both VISTA overexpressing celllines

Results 54
showed a higher or comparable VISTA expression to primary macrophages (Figure
4.1.2.3).
Figure 4.1.2.5: qRT-PCR analysis of VISTA-GFP overexpression celllines compared to negative controls, RPSII as reference gene, n=1 in triplicates
4.1.3 VISTA expression in cellular fractions
VISTA in vesicles in murine BMDMs
VISTA staining of primary murine BMDMs showed a dot-like vesicular pattern, which
we observed with all anti-VISTA antibodies. These dots aligned on tubulin fibers
confirming the assumption that VISTA is stored in vesicles (Figure 4.1.3.1). We
confirmed presence of VISTA on the cell surface of APCs in agreement with VISTA
being a membrane protein. However, VISTA did not show a strong staining of BMDM
plasma membranes. This could be due to a concentrated staining of dots representing
vesicles and a more scattered staining of VISTA on the cell surface leading to images
of lower fluorescence intensity. To confirm that the dot-like staining pattern of VISTA
is due to expression in vesicles, a colocalization analysis of deconvoluted confocal
pictures with three different vesicle markers were performed (Figure 4.1.3.2). The
transferrin receptor CD71 is an established marker for endocytic vesicles whereas
perforin stains secretory granules. Perforin and the transferrin receptor CD71 were
chosen as marker proteins, because another NCR, the model CTLA-4 colocalizes with
both markers (Linsley et al. 1996). As a third marker we employed Snap-25, which
stains vesicles in the neuronal cells, but also in monocytic cells like THP-1 cells and B-
cells (Uhlen et al. 2017; Gonelle-Gispert et al. 2000). Staining of all three vesicle
markers and of anti-VISTA antibodies resulted in a colocalization pattern that is best
seen in column b of Figure 4.1.3.2. The most intense labelling of vesicles was observed
with anti-perforin antibodies as perforin is highly expressed in macrophage vesicles. In
order to distinguish apparent colocalization due to superimposed overlaying images
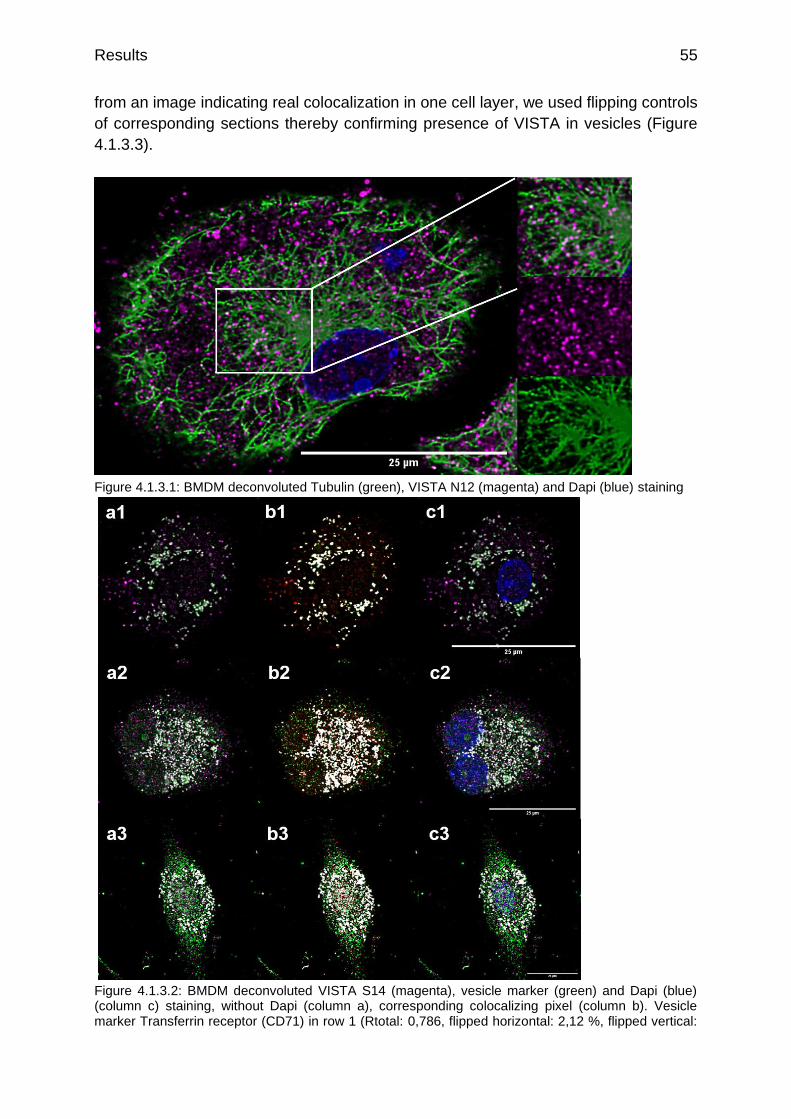
Results 55
from an image indicating real colocalization in one cell layer, we used flipping controls
of corresponding sections thereby confirming presence of VISTA in vesicles (Figure
4.1.3.3).
Figure 4.1.3.1: BMDM deconvoluted Tubulin (green), VISTA N12 (magenta) and Dapi (blue) staining
Figure 4.1.3.2: BMDM deconvoluted VISTA S14 (magenta), vesicle marker (green) and Dapi (blue) (column c) staining, without Dapi (column a), corresponding colocalizing pixel (column b). Vesicle marker Transferrin receptor (CD71) in row 1 (Rtotal: 0,786, flipped horizontal: 2,12 %, flipped vertical:

Results 56
1,55 %), vesicle marker Perforin in row 2 (Rtotal: 0,779, flipped horizontal: 2,98 %, flipped vertical: 12,29 %) and vesicle marker Snap-25 in row 3 (Rtotal: 0,379, flipped horizontal: 0,001 %, flipped vertical: no correlation found).
Figure 4.1.3.3: BMDMs deconvoluted Perforin (green) and VISTA S14 (magenta) staining colocalization analysis of the section (right top), section flipped horizontal (bottom left, Rtotal: 2,98 %), section flipped vertical (bottom right, Rtotal: 12,29 %)
In addition, we isolated BMDM derived vesicles on a sucrose gradient and tested the
presence of VISTA in different fractions. Vista was detected in a fraction containing 25
% (w/w) sucrose as an expected molecular mass of 37 kDa (Figure 4.1.3.4). VISTA
appears with a double band in the Western Blot due to the glycosylation.
Figure 4.1.3.4: Western Blot of 4*106 BMDMs on a vesicle gradient of different sucrose concentrations (25, 35 and 45 % sucrose in TBS+100 mM KCl). D1L2G primary VISTA antibody 1:2000 for 120s

Results 57
Vesicular VISTA in human monocyte derived macrophages
We next asked whether a similar cellular distribution of VISTA is present in human
APCs using human primary monocyte derived macrophages. The VISTA staining of
monocyte derived macrophages also showed a vesicular dot-like pattern (Figure
4.1.3.5) and was observed in M0 macrophages subtype but also for M1, M2a, and M2c
monocyte derived macrophages (not shown). These dots also aligned on tubulin fibers
and staining of VISTA was much stronger than staining of the cell surface, which
supports our hypothesis of VISTA expression in vesicles. We proved VISTA staining
in vesicles using the same three vesicle markers as for murine BMDMs, the transferrin
receptor (Figure 4.1.3.6), perforin and Snap-25 (not shown). Staining of these markers
was positive in primary monocyte derived macrophages in all macrophage subtypes
M0, M1, M2a (not shown) and M2c (Figure 4.1.3.6).
Figure 4.1.3.5: M0 monocyte derived macrophages deconvoluted Tubulin (green), VISTA D1L2G (magenta) and Dapi (blue) staining (a). Single channels of the section (b-d).

Results 58
Figure 4.1.3.6: M2c monocyte derived macrophages deconvoluted Transferrin receptor (CD71) (magenta), VISTA N12 (green) and Dapi (blue) staining (a), without Dapi (b), colocalizing pixel (c, Rtotal: 0,47)
Vesicular VISTA in T-cells
We further investigated whether VISTA is expressed in vesicles in T-cells as well.
VISTA staining of Jurkat cells also showed a dot-like vesicular pattern, which we
observed with all anti-VISTA antibodies. The Jurkat T-cellline was used for the
colocalization analysis of VISTA with the same three vesicle markers that were used
before. Figure 4.1.3.7 revealed that all three marker proteins colocalized with VISTA.
We also isolated vesicles from Jurkat cells and confirmed presence of VISTA in these
fractions by probing fractions via Western blotting (not shown).
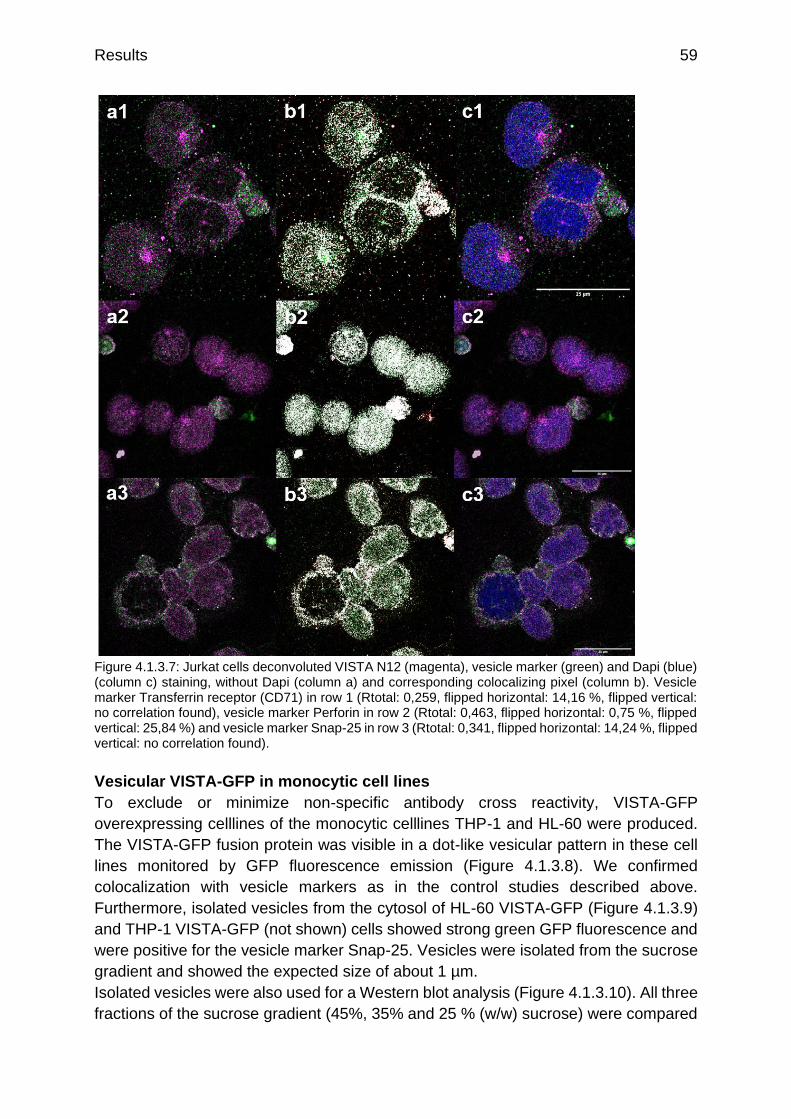
Results 59
Figure 4.1.3.7: Jurkat cells deconvoluted VISTA N12 (magenta), vesicle marker (green) and Dapi (blue) (column c) staining, without Dapi (column a) and corresponding colocalizing pixel (column b). Vesicle marker Transferrin receptor (CD71) in row 1 (Rtotal: 0,259, flipped horizontal: 14,16 %, flipped vertical: no correlation found), vesicle marker Perforin in row 2 (Rtotal: 0,463, flipped horizontal: 0,75 %, flipped vertical: 25,84 %) and vesicle marker Snap-25 in row 3 (Rtotal: 0,341, flipped horizontal: 14,24 %, flipped vertical: no correlation found).
Vesicular VISTA-GFP in monocytic cell lines
To exclude or minimize non-specific antibody cross reactivity, VISTA-GFP
overexpressing celllines of the monocytic celllines THP-1 and HL-60 were produced.
The VISTA-GFP fusion protein was visible in a dot-like vesicular pattern in these cell
lines monitored by GFP fluorescence emission (Figure 4.1.3.8). We confirmed
colocalization with vesicle markers as in the control studies described above.
Furthermore, isolated vesicles from the cytosol of HL-60 VISTA-GFP (Figure 4.1.3.9)
and THP-1 VISTA-GFP (not shown) cells showed strong green GFP fluorescence and
were positive for the vesicle marker Snap-25. Vesicles were isolated from the sucrose
gradient and showed the expected size of about 1 µm.
Isolated vesicles were also used for a Western blot analysis (Figure 4.1.3.10). All three
fractions of the sucrose gradient (45%, 35% and 25 % (w/w) sucrose) were compared
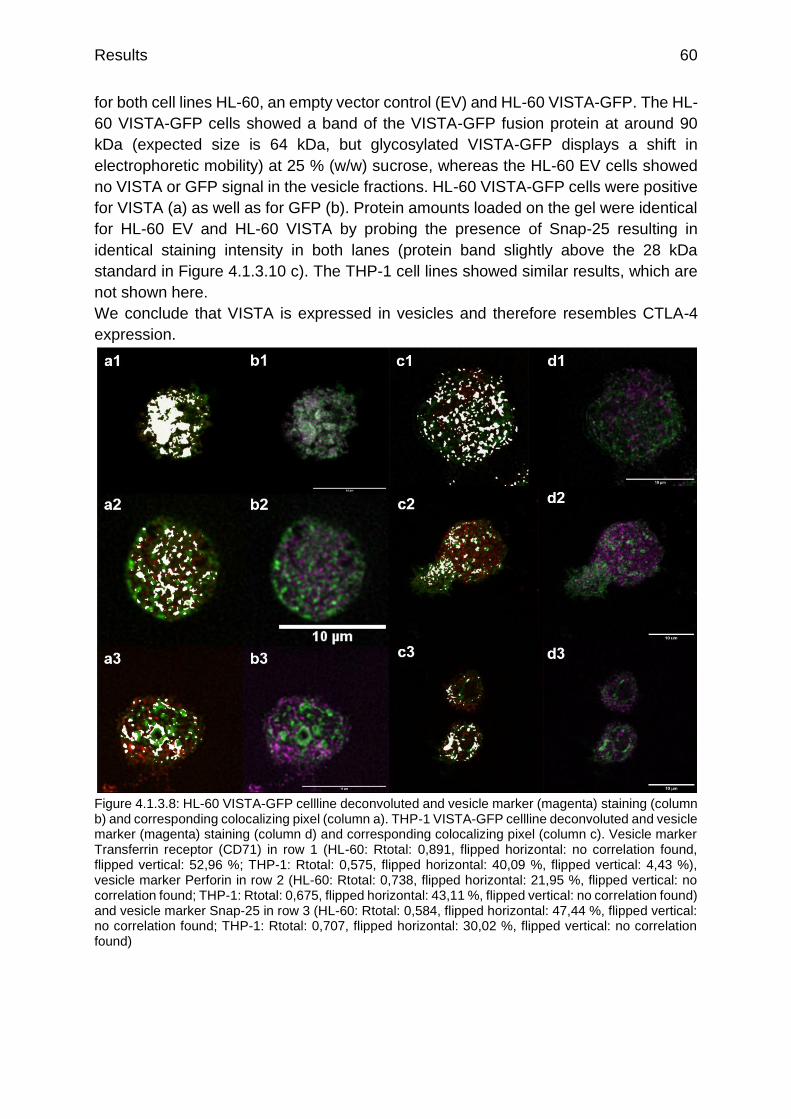
Results 60
for both cell lines HL-60, an empty vector control (EV) and HL-60 VISTA-GFP. The HL-
60 VISTA-GFP cells showed a band of the VISTA-GFP fusion protein at around 90
kDa (expected size is 64 kDa, but glycosylated VISTA-GFP displays a shift in
electrophoretic mobility) at 25 % (w/w) sucrose, whereas the HL-60 EV cells showed
no VISTA or GFP signal in the vesicle fractions. HL-60 VISTA-GFP cells were positive
for VISTA (a) as well as for GFP (b). Protein amounts loaded on the gel were identical
for HL-60 EV and HL-60 VISTA by probing the presence of Snap-25 resulting in
identical staining intensity in both lanes (protein band slightly above the 28 kDa
standard in Figure 4.1.3.10 c). The THP-1 cell lines showed similar results, which are
not shown here.
We conclude that VISTA is expressed in vesicles and therefore resembles CTLA-4
expression.
Figure 4.1.3.8: HL-60 VISTA-GFP cellline deconvoluted and vesicle marker (magenta) staining (column b) and corresponding colocalizing pixel (column a). THP-1 VISTA-GFP cellline deconvoluted and vesicle marker (magenta) staining (column d) and corresponding colocalizing pixel (column c). Vesicle marker Transferrin receptor (CD71) in row 1 (HL-60: Rtotal: 0,891, flipped horizontal: no correlation found, flipped vertical: 52,96 %; THP-1: Rtotal: 0,575, flipped horizontal: 40,09 %, flipped vertical: 4,43 %), vesicle marker Perforin in row 2 (HL-60: Rtotal: 0,738, flipped horizontal: 21,95 %, flipped vertical: no correlation found; THP-1: Rtotal: 0,675, flipped horizontal: 43,11 %, flipped vertical: no correlation found) and vesicle marker Snap-25 in row 3 (HL-60: Rtotal: 0,584, flipped horizontal: 47,44 %, flipped vertical: no correlation found; THP-1: Rtotal: 0,707, flipped horizontal: 30,02 %, flipped vertical: no correlation found)

Results 61
Figure 4.1.3.9: Isolated vesicles from HL-60 VISTA-GFP cellline 25 % sucrose fraction. Stained with vesicle marker Snap-25 (magenta)
Figure 4.1.3.10: Western Blots of HL-60 celllines (EV: empty vector control, Vista: VISTA-GFP construct) vesicle gradients of different sucrose concentrations (25, 35 and 45 % (w/w) sucrose in TBS+100 mM KCl). VISTA D1L2G primary antibody (a, 1:2000 for 93 s), GFP primary antibody (b, 1:2500 for 60 s) and Smap-25 primary antibody (c, 1:2000 for 126,7 s)
Results 62
VISTA in nuclei
While investigating the VISTA expression in different cell fractions, the staining of
VISTA in the nucleus became obvious. VISTA staining appeared in a ring around the
nucleus probably bound to nucleus pores but was also visible inside the nucleus
(Figure 4.1.3.11 a). This staining pattern was observed with all three VISTA antibodies
(not all shown) (Clones N12, S14 and D1L2G) in deconvoluted confocal pictures of
murine BMDMs (Figure 4.1.3.11 a) and in the Jurkat cell line (not shown). When we
tested nucleus expression of VISTA by Western Blot analysis using Jurkat cells, the
nucleus fraction showed less VISTA signal compared to the pellet and organelles
fraction, but a visible band at around 37 kDa (not shown). The results were further
confirmed by localizing VISTA-GFP in the nucleus of HL-60 VISTA-GFP (Figure
4.1.3.11 b) and THP-1 VISTA-GFP (Figure 4.1.3.11 c) cells.
Isolated nuclei of THP-1 VISTA-GFP cells show a strong green fluorescence whereas
the isolated nuclei of THP-1 EV did not show any green fluorescent signal (Figure
4.1.3.12). The corresponding blots of the pellet, nuclei and organelles fractions showed
a strong band at 90 kDa for VISTA-GFP (see also above) in the THP-1 VISTA-GFP
cell line. This band was positive for VISTA (Figure 4.1.3.13 a) as well as for GFP
(Figure 4.1.3.13 b). The THP-1 EV cell line did only show a weak GFP signal in the
organelles fraction (Figure 4.1.3.13 b) but no VISTA signal (Figure 4.1.3.13 a). We
concentrated the nuclei and organelles fraction (two times more than the pellet fraction)
to increase the signal. However, the pellet fraction did not enter the gel completely
leading to an intense signal at the top of the gel. Thus, VISTA presence seemed more
abundant in the pellet fraction and weaker in the nuclei fraction.
The nucleus expression of VISTA seemed surprising, since the amino acid sequence
of VISTA does not contain any typical nucleus import motif. However, the same
property and nucleus expression is known for PD-L1 (Ghebeh et al. 2010) which is
closely related to VISTA (Deng et al. 2016; Lines et al. 2014a; Wang et al. 2014; Baksh
und Weber 2015; Lines et al. 2014b). The nucleus expression of VISTA was also
observed by (Thul et al. 2017) with the VISTA antibody by Sigma-Aldrich (Atlas
Antibodies Cat#HPA007968, RRID:AB_1845518) which also supports our results. Further
investigations should also concentrate on possible interaction partners like
transcription factors of VISTA in the nucleus.
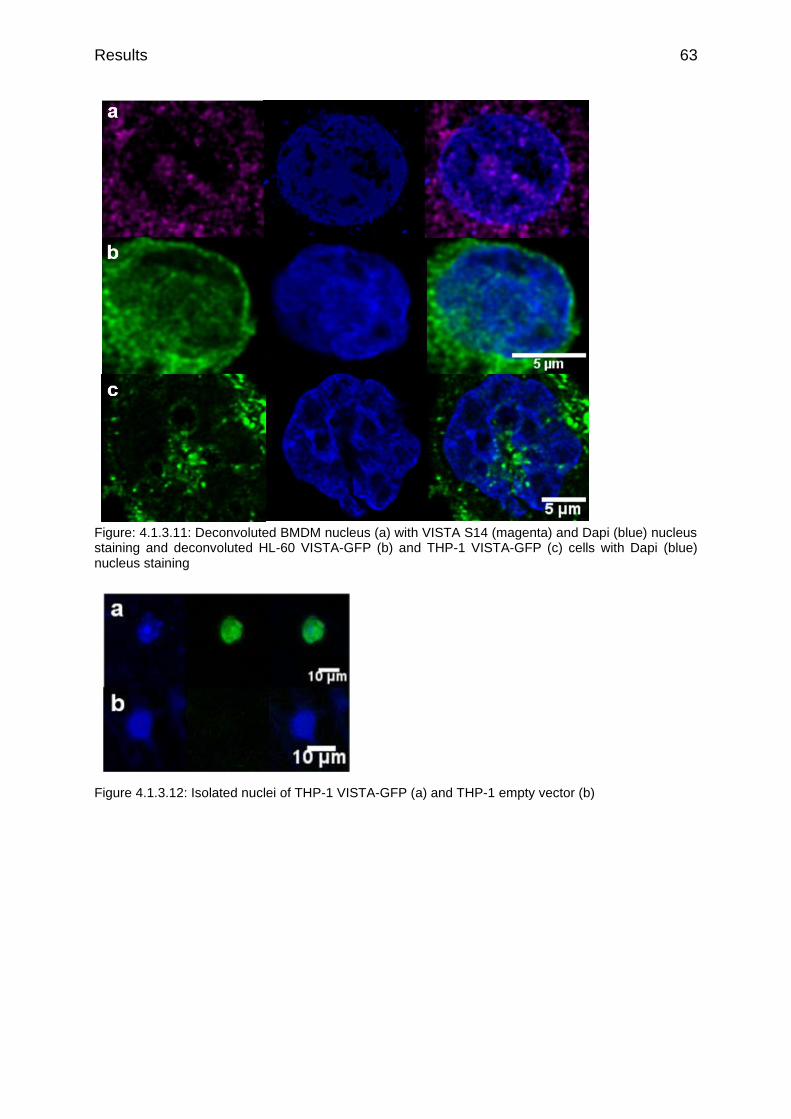
Results 63
Figure: 4.1.3.11: Deconvoluted BMDM nucleus (a) with VISTA S14 (magenta) and Dapi (blue) nucleus staining and deconvoluted HL-60 VISTA-GFP (b) and THP-1 VISTA-GFP (c) cells with Dapi (blue) nucleus staining
Figure 4.1.3.12: Isolated nuclei of THP-1 VISTA-GFP (a) and THP-1 empty vector (b)
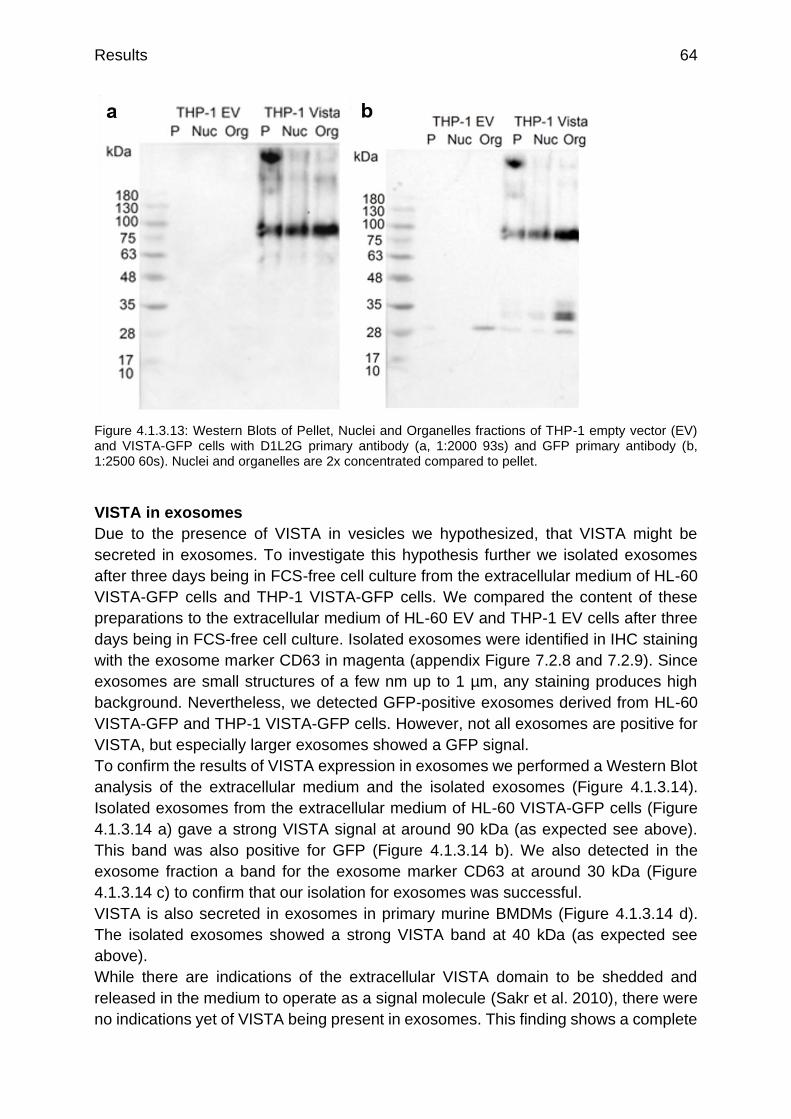
Results 64
Figure 4.1.3.13: Western Blots of Pellet, Nuclei and Organelles fractions of THP-1 empty vector (EV) and VISTA-GFP cells with D1L2G primary antibody (a, 1:2000 93s) and GFP primary antibody (b, 1:2500 60s). Nuclei and organelles are 2x concentrated compared to pellet.
VISTA in exosomes
Due to the presence of VISTA in vesicles we hypothesized, that VISTA might be
secreted in exosomes. To investigate this hypothesis further we isolated exosomes
after three days being in FCS-free cell culture from the extracellular medium of HL-60
VISTA-GFP cells and THP-1 VISTA-GFP cells. We compared the content of these
preparations to the extracellular medium of HL-60 EV and THP-1 EV cells after three
days being in FCS-free cell culture. Isolated exosomes were identified in IHC staining
with the exosome marker CD63 in magenta (appendix Figure 7.2.8 and 7.2.9). Since
exosomes are small structures of a few nm up to 1 µm, any staining produces high
background. Nevertheless, we detected GFP-positive exosomes derived from HL-60
VISTA-GFP and THP-1 VISTA-GFP cells. However, not all exosomes are positive for
VISTA, but especially larger exosomes showed a GFP signal.
To confirm the results of VISTA expression in exosomes we performed a Western Blot
analysis of the extracellular medium and the isolated exosomes (Figure 4.1.3.14).
Isolated exosomes from the extracellular medium of HL-60 VISTA-GFP cells (Figure
4.1.3.14 a) gave a strong VISTA signal at around 90 kDa (as expected see above).
This band was also positive for GFP (Figure 4.1.3.14 b). We also detected in the
exosome fraction a band for the exosome marker CD63 at around 30 kDa (Figure
4.1.3.14 c) to confirm that our isolation for exosomes was successful.
VISTA is also secreted in exosomes in primary murine BMDMs (Figure 4.1.3.14 d).
The isolated exosomes showed a strong VISTA band at 40 kDa (as expected see
above).
While there are indications of the extracellular VISTA domain to be shedded and
released in the medium to operate as a signal molecule (Sakr et al. 2010), there were
no indications yet of VISTA being present in exosomes. This finding shows a complete
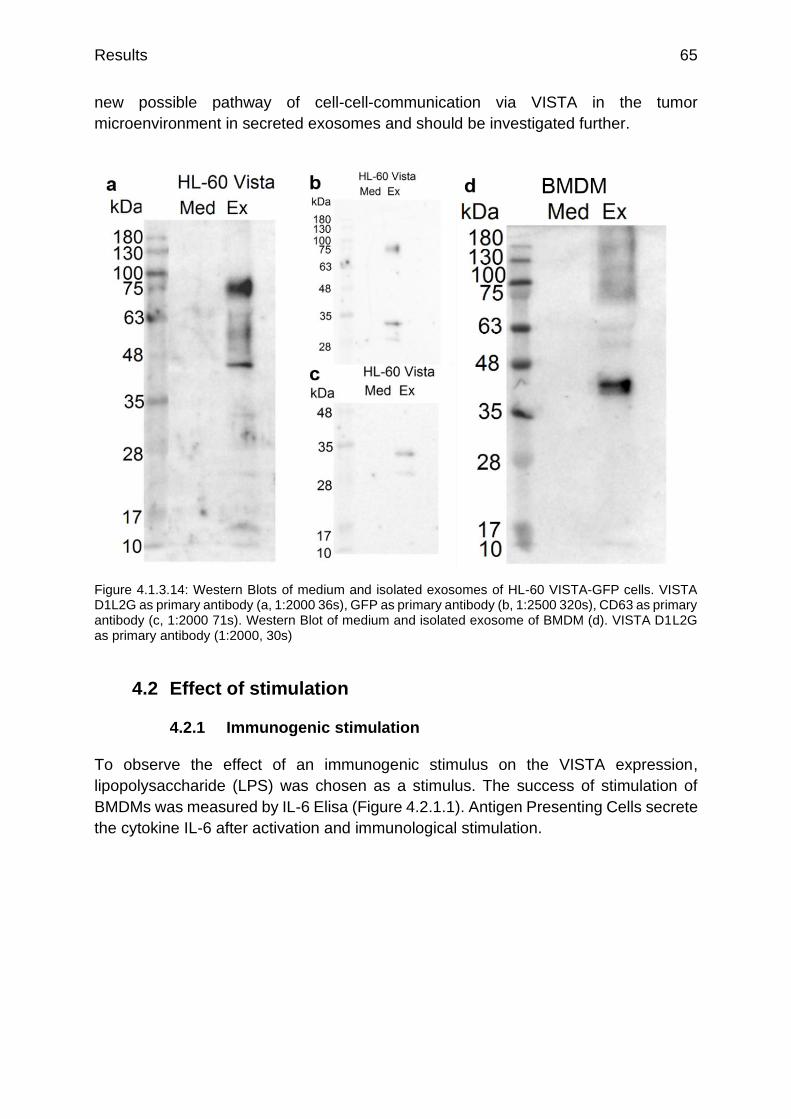
Results 65
new possible pathway of cell-cell-communication via VISTA in the tumor
microenvironment in secreted exosomes and should be investigated further.
Figure 4.1.3.14: Western Blots of medium and isolated exosomes of HL-60 VISTA-GFP cells. VISTA D1L2G as primary antibody (a, 1:2000 36s), GFP as primary antibody (b, 1:2500 320s), CD63 as primary antibody (c, 1:2000 71s). Western Blot of medium and isolated exosome of BMDM (d). VISTA D1L2G as primary antibody (1:2000, 30s)
4.2 Effect of stimulation
4.2.1 Immunogenic stimulation
To observe the effect of an immunogenic stimulus on the VISTA expression,
lipopolysaccharide (LPS) was chosen as a stimulus. The success of stimulation of
BMDMs was measured by IL-6 Elisa (Figure 4.2.1.1). Antigen Presenting Cells secrete
the cytokine IL-6 after activation and immunological stimulation.

Results 66
Figure 4.2.1.1: IL-6 Elisa of BMDM medium during LPS stimulation, concentration average of three fluorescent determinations
After stimulation with LPS (5 µg/mL), BMDMs did not secrete any additional IL-6 within
the first 30 min. There was a basal activity and IL-6 concentration of about 4,4 pg/mL
in the medium. After two hours of LPS stimulation, BMDMs already secreted nearly
twice as much IL-6 in the medium. BMDMs were fully activated after around 8 hours
which is displayed by the maximum of IL-6 concentration with 8,1 pg/mL after 8 hours.
A sustaining stimulation over 18 hours did not led to higher IL-6 concentrations. After
18 hours the IL-6 concentration was decreased to 5,4 pg/mL which was higher than
naive status but also not at the maximum anymore.
The LPS stimulation led to the expected activation curve and IL-6 secretion of BMDMs.
Therefore, the LPS stimulation was assumed as successful and sufficient for further
stimulation kinetics.
Unstimulated BMDMs (Figure 4.2.1.2 a) showed a strong and dot-like VISTA staining
pattern with nearly no VISTA in the nucleus. After stimulation of a few minutes with
LPS (b) the staining got weaker and more diffuse (b). This was probably due to the
release of VISTA vesicles to the cell surface. Stainings on the cell surface were less
concentrated compared to vesicle staining and appeared weaker and more diffuse.
Stimulation of around 30 min (c) led to a focused VISTA staining of the nucleus (bright
areas within the cell body). This pattern was gone after a few hours of LPS stimulation
(d) and became a strong vesicular staining in the whole body. The VISTA fluorescence
was often stronger after 18 h LPS stimulation, compared to the native state.
This staining pattern appeared consistently but depending on the cells with a shifted
kinetic. For example, nucleus staining sometimes appeared stronger after 2 h than
after 30 min already.
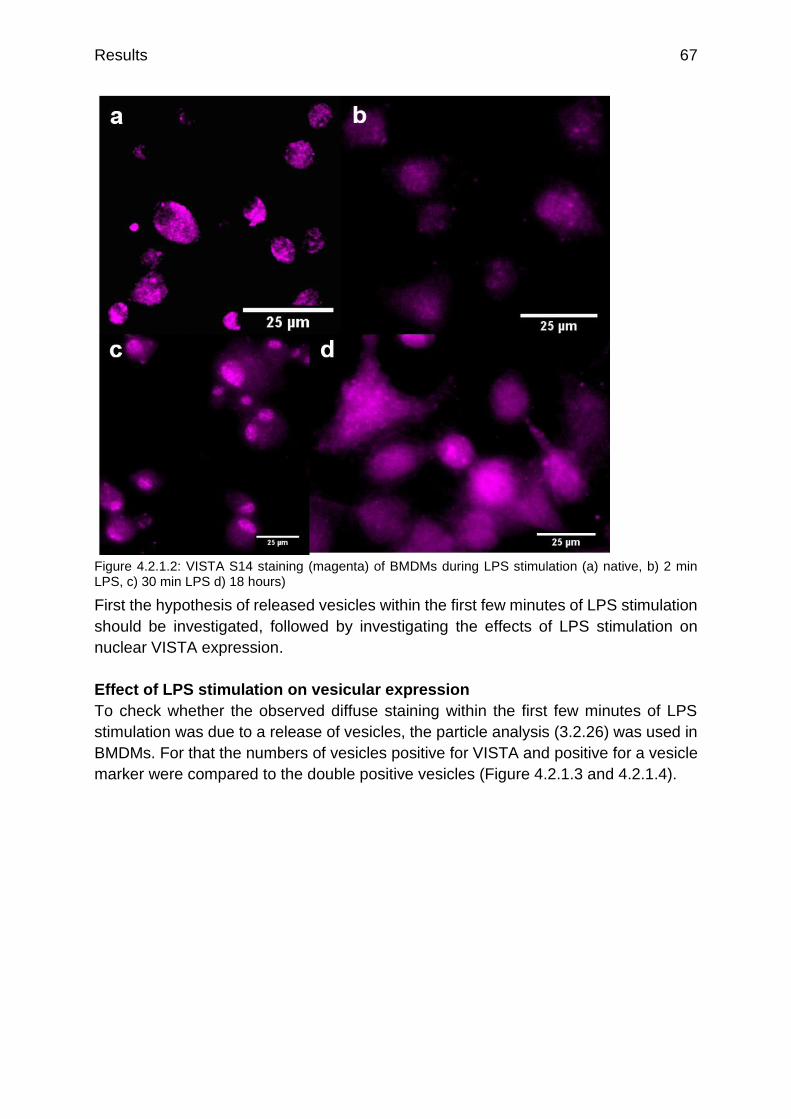
Results 67
Figure 4.2.1.2: VISTA S14 staining (magenta) of BMDMs during LPS stimulation (a) native, b) 2 min LPS, c) 30 min LPS d) 18 hours)
First the hypothesis of released vesicles within the first few minutes of LPS stimulation
should be investigated, followed by investigating the effects of LPS stimulation on
nuclear VISTA expression.
Effect of LPS stimulation on vesicular expression
To check whether the observed diffuse staining within the first few minutes of LPS
stimulation was due to a release of vesicles, the particle analysis (3.2.26) was used in
BMDMs. For that the numbers of vesicles positive for VISTA and positive for a vesicle
marker were compared to the double positive vesicles (Figure 4.2.1.3 and 4.2.1.4).
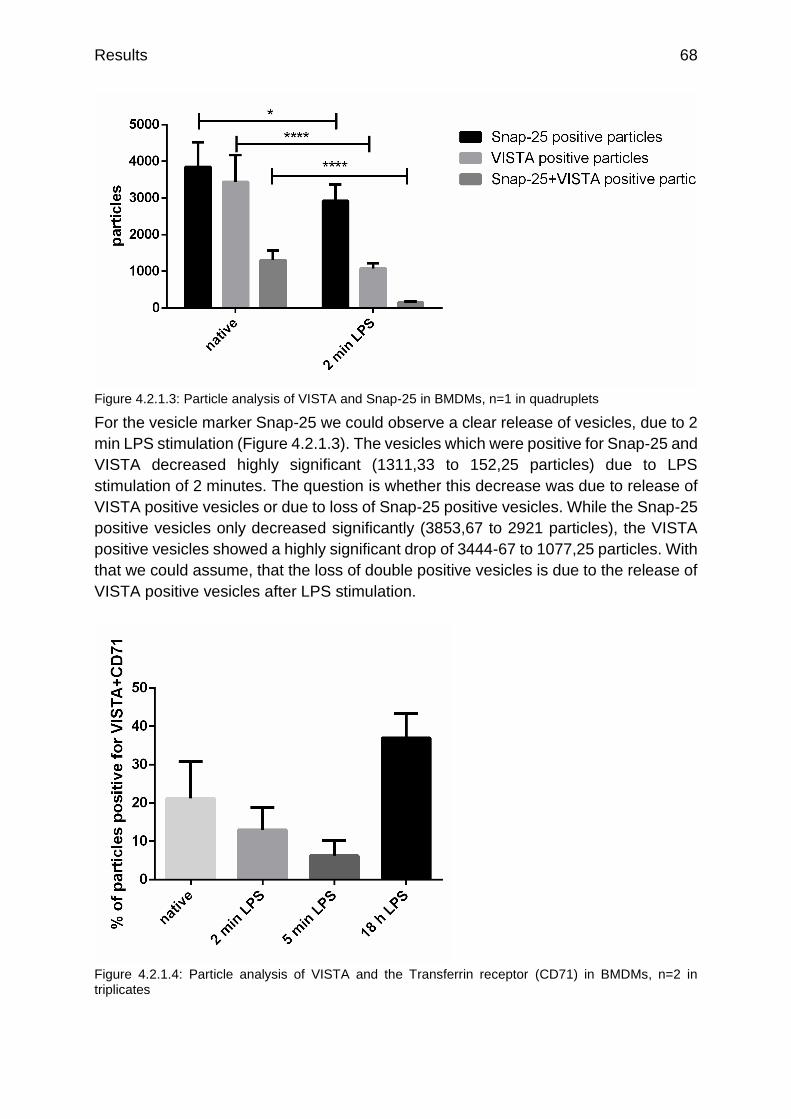
Results 68
Figure 4.2.1.3: Particle analysis of VISTA and Snap-25 in BMDMs, n=1 in quadruplets
For the vesicle marker Snap-25 we could observe a clear release of vesicles, due to 2
min LPS stimulation (Figure 4.2.1.3). The vesicles which were positive for Snap-25 and
VISTA decreased highly significant (1311,33 to 152,25 particles) due to LPS
stimulation of 2 minutes. The question is whether this decrease was due to release of
VISTA positive vesicles or due to loss of Snap-25 positive vesicles. While the Snap-25
positive vesicles only decreased significantly (3853,67 to 2921 particles), the VISTA
positive vesicles showed a highly significant drop of 3444-67 to 1077,25 particles. With
that we could assume, that the loss of double positive vesicles is due to the release of
VISTA positive vesicles after LPS stimulation.
Figure 4.2.1.4: Particle analysis of VISTA and the Transferrin receptor (CD71) in BMDMs, n=2 in triplicates
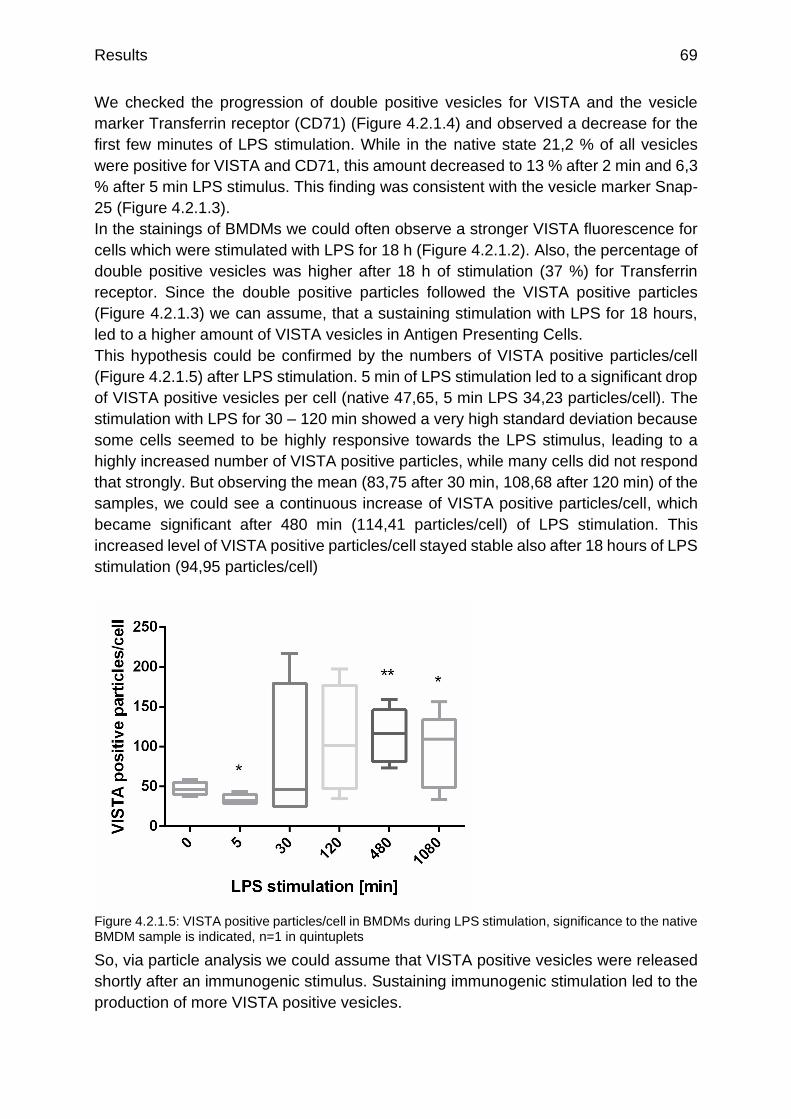
Results 69
We checked the progression of double positive vesicles for VISTA and the vesicle
marker Transferrin receptor (CD71) (Figure 4.2.1.4) and observed a decrease for the
first few minutes of LPS stimulation. While in the native state 21,2 % of all vesicles
were positive for VISTA and CD71, this amount decreased to 13 % after 2 min and 6,3
% after 5 min LPS stimulus. This finding was consistent with the vesicle marker Snap-
25 (Figure 4.2.1.3).
In the stainings of BMDMs we could often observe a stronger VISTA fluorescence for
cells which were stimulated with LPS for 18 h (Figure 4.2.1.2). Also, the percentage of
double positive vesicles was higher after 18 h of stimulation (37 %) for Transferrin
receptor. Since the double positive particles followed the VISTA positive particles
(Figure 4.2.1.3) we can assume, that a sustaining stimulation with LPS for 18 hours,
led to a higher amount of VISTA vesicles in Antigen Presenting Cells.
This hypothesis could be confirmed by the numbers of VISTA positive particles/cell
(Figure 4.2.1.5) after LPS stimulation. 5 min of LPS stimulation led to a significant drop
of VISTA positive vesicles per cell (native 47,65, 5 min LPS 34,23 particles/cell). The
stimulation with LPS for 30 – 120 min showed a very high standard deviation because
some cells seemed to be highly responsive towards the LPS stimulus, leading to a
highly increased number of VISTA positive particles, while many cells did not respond
that strongly. But observing the mean (83,75 after 30 min, 108,68 after 120 min) of the
samples, we could see a continuous increase of VISTA positive particles/cell, which
became significant after 480 min (114,41 particles/cell) of LPS stimulation. This
increased level of VISTA positive particles/cell stayed stable also after 18 hours of LPS
stimulation (94,95 particles/cell)
Figure 4.2.1.5: VISTA positive particles/cell in BMDMs during LPS stimulation, significance to the native BMDM sample is indicated, n=1 in quintuplets
So, via particle analysis we could assume that VISTA positive vesicles were released
shortly after an immunogenic stimulus. Sustaining immunogenic stimulation led to the
production of more VISTA positive vesicles.
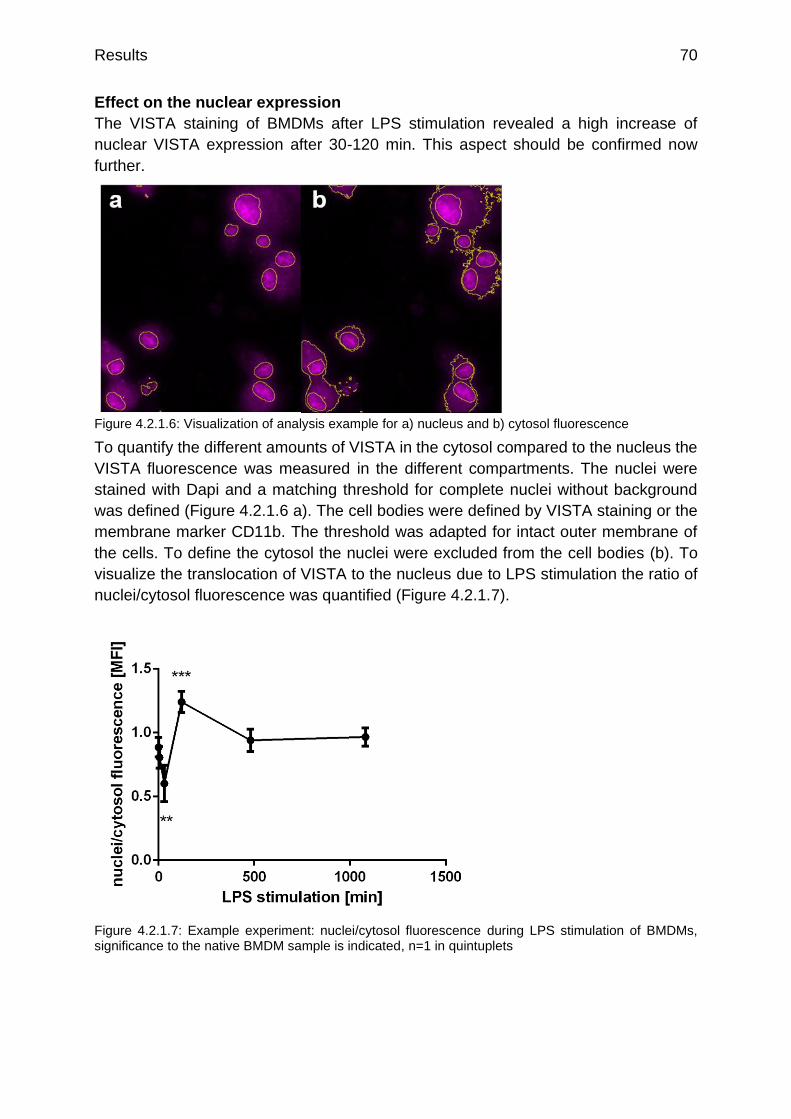
Results 70
Effect on the nuclear expression
The VISTA staining of BMDMs after LPS stimulation revealed a high increase of
nuclear VISTA expression after 30-120 min. This aspect should be confirmed now
further.
Figure 4.2.1.6: Visualization of analysis example for a) nucleus and b) cytosol fluorescence
To quantify the different amounts of VISTA in the cytosol compared to the nucleus the
VISTA fluorescence was measured in the different compartments. The nuclei were
stained with Dapi and a matching threshold for complete nuclei without background
was defined (Figure 4.2.1.6 a). The cell bodies were defined by VISTA staining or the
membrane marker CD11b. The threshold was adapted for intact outer membrane of
the cells. To define the cytosol the nuclei were excluded from the cell bodies (b). To
visualize the translocation of VISTA to the nucleus due to LPS stimulation the ratio of
nuclei/cytosol fluorescence was quantified (Figure 4.2.1.7).
Figure 4.2.1.7: Example experiment: nuclei/cytosol fluorescence during LPS stimulation of BMDMs, significance to the native BMDM sample is indicated, n=1 in quintuplets
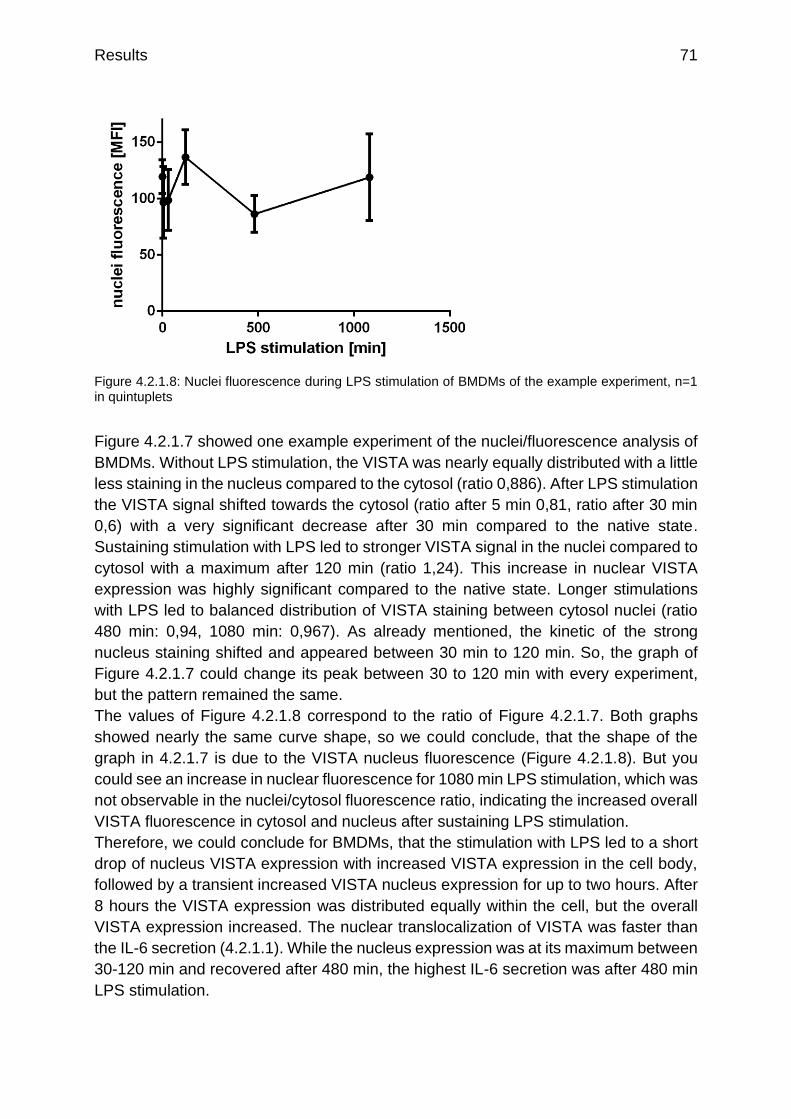
Results 71
Figure 4.2.1.8: Nuclei fluorescence during LPS stimulation of BMDMs of the example experiment, n=1 in quintuplets
Figure 4.2.1.7 showed one example experiment of the nuclei/fluorescence analysis of
BMDMs. Without LPS stimulation, the VISTA was nearly equally distributed with a little
less staining in the nucleus compared to the cytosol (ratio 0,886). After LPS stimulation
the VISTA signal shifted towards the cytosol (ratio after 5 min 0,81, ratio after 30 min
0,6) with a very significant decrease after 30 min compared to the native state.
Sustaining stimulation with LPS led to stronger VISTA signal in the nuclei compared to
cytosol with a maximum after 120 min (ratio 1,24). This increase in nuclear VISTA
expression was highly significant compared to the native state. Longer stimulations
with LPS led to balanced distribution of VISTA staining between cytosol nuclei (ratio
480 min: 0,94, 1080 min: 0,967). As already mentioned, the kinetic of the strong
nucleus staining shifted and appeared between 30 min to 120 min. So, the graph of
Figure 4.2.1.7 could change its peak between 30 to 120 min with every experiment,
but the pattern remained the same.
The values of Figure 4.2.1.8 correspond to the ratio of Figure 4.2.1.7. Both graphs
showed nearly the same curve shape, so we could conclude, that the shape of the
graph in 4.2.1.7 is due to the VISTA nucleus fluorescence (Figure 4.2.1.8). But you
could see an increase in nuclear fluorescence for 1080 min LPS stimulation, which was
not observable in the nuclei/cytosol fluorescence ratio, indicating the increased overall
VISTA fluorescence in cytosol and nucleus after sustaining LPS stimulation.
Therefore, we could conclude for BMDMs, that the stimulation with LPS led to a short
drop of nucleus VISTA expression with increased VISTA expression in the cell body,
followed by a transient increased VISTA nucleus expression for up to two hours. After
8 hours the VISTA expression was distributed equally within the cell, but the overall
VISTA expression increased. The nuclear translocalization of VISTA was faster than
the IL-6 secretion (4.2.1.1). While the nucleus expression was at its maximum between
30-120 min and recovered after 480 min, the highest IL-6 secretion was after 480 min
LPS stimulation.

Results 72
Figure 4.2.1.9: Confocal VISTA D1L2G (magenta) and Dapi nucleus (blue) staining of human monocyte derived macrophages during LPS stimulation kinetic (a) native, b) 30 min LPS
We could observe the same staining pattern in primary human monocyte derived
macrophages (Figure 4.2.1.9) like in BMDMs (Figure 4.2.1.2). Native monocyte
derived macrophages did not show VISTA expression in the nucleus, whereas 30 min
LPS stimulation led to a VISTA signal, colocalizing with the nucleus marker Dapi.
Figure 4.2.1.10: Example experiment: percentage of monocyte derived macrophages with nuclear VISTA signal due to LPS stimulation, n=1 in quadruplets
Native human monocyte derived macrophages did barely show any VISTA expression
in the nucleus (Figure 4.2.1.10, 1,5 %). Stimulation with LPS led to an increase of cells
with nuclear VISTA with a maximum after 30 min (18,8 %) stimulation. The sustaining

Results 73
LPS stimulation for 2-8 hours led to a drop of nuclear VISTA (480 min 7,7 %) which
increased again after long-term stimulation for 18 h (14,5 %).
Figure 4.2.1.11: Example experiment: nuclei/cytosol fluorescence during LPS stimulation of human primary monocyte derived macrophages, significance to the native monocyte derived macrophage sample is indicated, n=1 in quadruplets
Human primary monocyte derived macrophages showed overall a quite low
percentage of nuclear VISTA positive cells (Figure 4.2.1.10) leading to nuclei/cytosol
fluorescence with a high standard deviation (Figure 4.2.1.11). Nevertheless, the
percentage of cells with VISTA signal in the nucleus exactly fitted the nuclei/cytosol
fluorescence pattern. Compared to BMDMs, monocyte derived macrophages did not
show a significant decrease in nuclear VISTA expression for a few minutes, but only a
significant increase in nuclear VISTA expression after 10-30 min LPS stimulation. This
decreased afterwards for several hours. Sustaining LPS stimulation for 1080 min again
led to a small increase in the fluorescence ratio towards to nuclear expression.
The analysis in Figure 4.2.1.10 and 4.2.1.11 were only based IHC stainings. But to
investigate the expression of VISTA, it was important to measure the VISTA RNA as
well. For that, a qRT-PCR of VISTA was performed in monocyte derived macrophages
(Figure 4.2.1.12).

Results 74
Figure 4.2.1.12: qRT-PCR of VISTA in LPS stimulated human monocyte derived macrophages, n=1 in triplicates
Like described in 4.1.2, both reference genes RPSII and RPL27 for VISTA expression
(Figure 4.2.1.12), showed the same curve shape but a difference in VISTA amount.
But to classify the results, the curve shape was sufficient. The RNA amount of VISTA
basically followed the pattern of VISTA nuclear staining in BMDMs and monocyte
derived macrophages. After 10 min stimulation, VISTA amount dropped (on 40 %
compared to native state for RPSII), displaying that the existing VISTA RNA was
translated into protein, without sufficient transcription to RNA to compensate the drop.
After 30 min of LPS stimulation the VISTA expression was strongly increased up to
260 % (RPSII) compared to native state, displaying the highly increased transcription
of VISTA. The VISTA amount dropped again after 480 min LPS stimulation on 28 %
(RPSII) of the native state. Sustaining LPS stimulation for 1080 min (107 % of native
state for RPSII) balances the VISTA level back to native state.
The stimulation with LPS did show an effect on the nuclear expression of VISTA in
Antigen Presenting Cells, leading to a significant increase of nuclear VISTA after 30-
120 min of stimulation accompanied by increased VISTA RNA levels. Over night
stimulation with VISTA led to increased VISTA fluorescence caused by more VISTA
positive vesicles. But production level of VISTA was comparable to the native state
again after 18 h stimulation.
4.2.2 Effect of inhibitors
VISTA is a membrane protein, so the question arised how it can reach the nucleus.
One hypothesis was, that the γ-secretase cuts off the intracellular domain, leading to
a transport in the nucleus. The γ-secretase does not have a special recognition motif
and is responsible for the cutting of many type I membrane-proteins, like VISTA (Elad
et al. 2015). To test if the γ-secretase could have an impact on the nuclear
translocalization, the γ-secretase inhibitor N-[N-(3,5-difluorophenacetyl)-1-alanyl]-S-

Results 75
phenylglycine t-butyl ester (DAPT) (10 µM) (Kanungo et al. 2008) was incubated for
24 h. Afterwards the stimulation with LPS was performed for 30 min, to observe if the
nucleus translocation of VISTA is still occurring.
In addition, it is known, that VISTA is shedded by the membrane-type-I matrix
metalloprotease (MT-1 MMP) (Sakr et al. 2010). To test if the shedding is necessary
for the nuclear translocalization of VISTA 20 µM of the broad spectrum MMP and
ADAM inhibitor N-[2-[2-(Hydroxyamino)-2-oxoethyl]-4-methyl-1-oxopentyl]-3-methyl-
L-valyl-N-(2-aminoethyl)-Lalaninamide (TAPI-2) was incubated for 48 h (Raissi et al.
2014). Afterwards LPS was added for 30 min.
The confocal staining of human monocyte derived macrophages (Figure 4.2.2.1)
showed the expected pattern for native cells (a) and after 30 min of LPS stimulation
(b). The preincubation with DAPT (c) did not show any nuclear VISTA staining after 30
min of LPS stimulation. Instead the fluorescence signal in the cell body was stronger
than in the other conditions and the membrane staining is more pronounced. The
preincubation with TAPI-2 (d) also did not show any nuclear VISTA signal after 30 min
of LPS stimulation. The staining also showed a pronounced membrane staining which
was not observable in the native cells at all and a stronger VISTA fluorescence in the
cell body. To confirm these stainings, the percentage of cells with VISTA staining in
the nucleus was quantified (Figure 4.2.2.2).
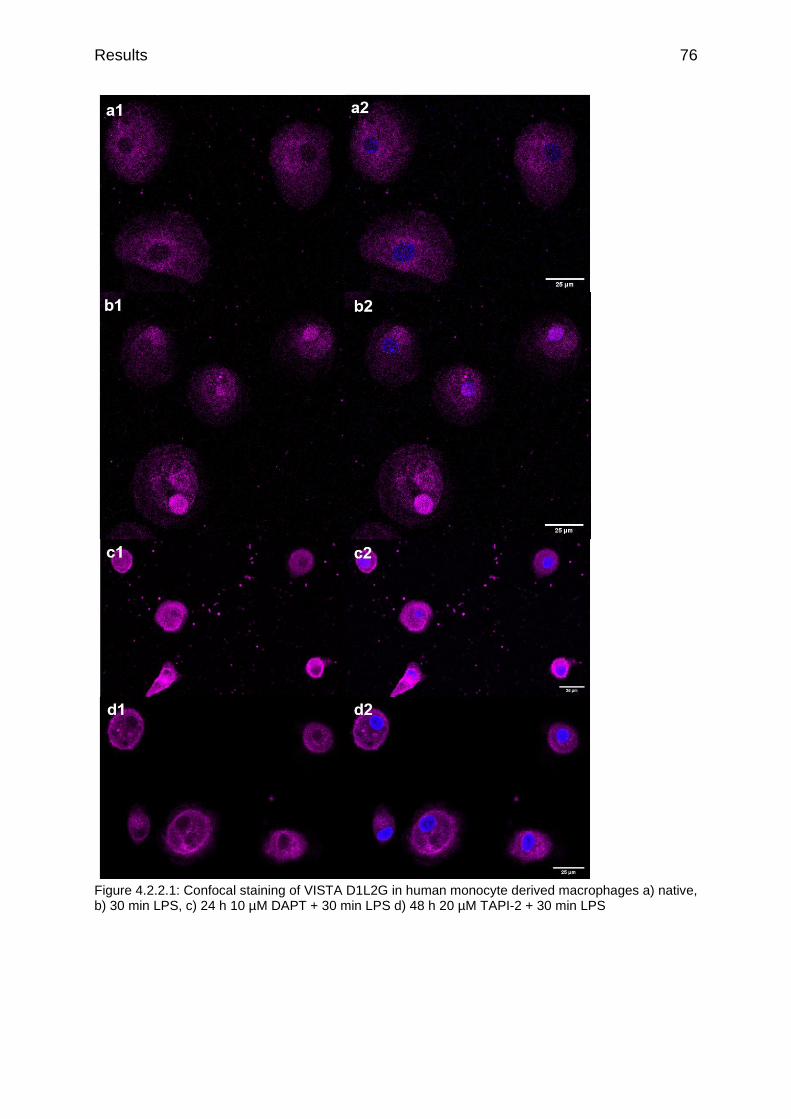
Results 76
Figure 4.2.2.1: Confocal staining of VISTA D1L2G in human monocyte derived macrophages a) native, b) 30 min LPS, c) 24 h 10 µM DAPT + 30 min LPS d) 48 h 20 µM TAPI-2 + 30 min LPS
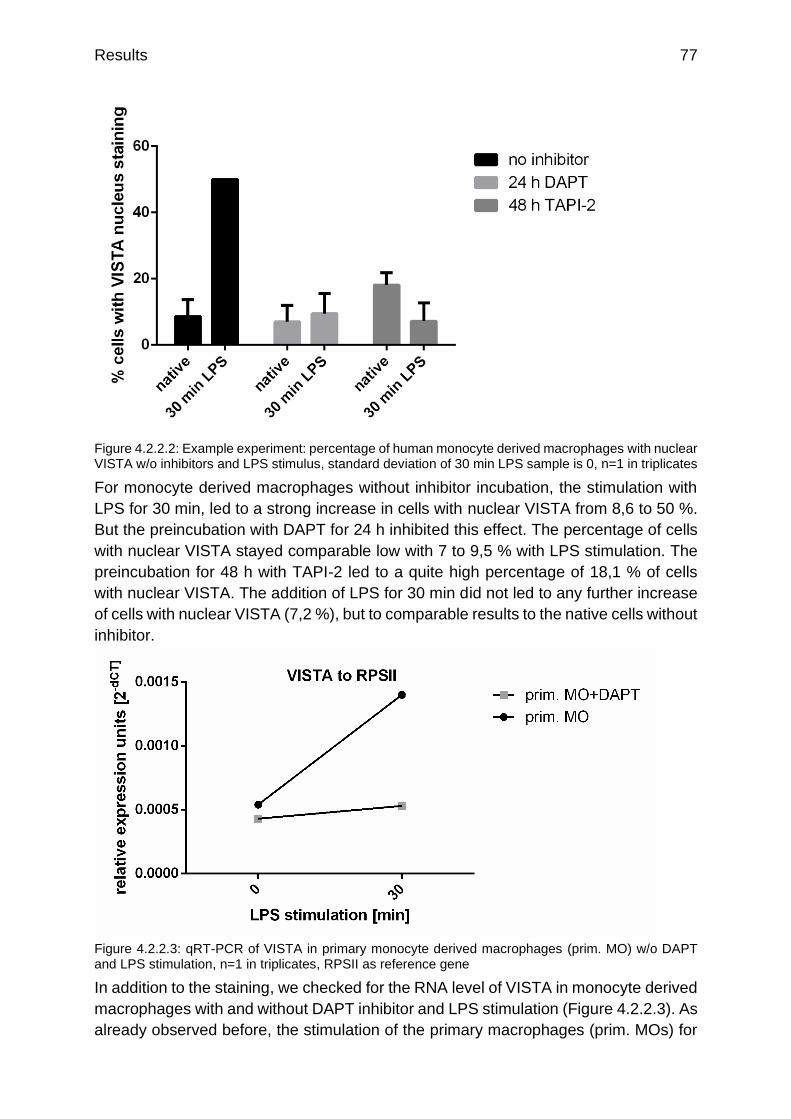
Results 77
Figure 4.2.2.2: Example experiment: percentage of human monocyte derived macrophages with nuclear VISTA w/o inhibitors and LPS stimulus, standard deviation of 30 min LPS sample is 0, n=1 in triplicates
For monocyte derived macrophages without inhibitor incubation, the stimulation with
LPS for 30 min, led to a strong increase in cells with nuclear VISTA from 8,6 to 50 %.
But the preincubation with DAPT for 24 h inhibited this effect. The percentage of cells
with nuclear VISTA stayed comparable low with 7 to 9,5 % with LPS stimulation. The
preincubation for 48 h with TAPI-2 led to a quite high percentage of 18,1 % of cells
with nuclear VISTA. The addition of LPS for 30 min did not led to any further increase
of cells with nuclear VISTA (7,2 %), but to comparable results to the native cells without
inhibitor.
Figure 4.2.2.3: qRT-PCR of VISTA in primary monocyte derived macrophages (prim. MO) w/o DAPT and LPS stimulation, n=1 in triplicates, RPSII as reference gene
In addition to the staining, we checked for the RNA level of VISTA in monocyte derived
macrophages with and without DAPT inhibitor and LPS stimulation (Figure 4.2.2.3). As
already observed before, the stimulation of the primary macrophages (prim. MOs) for

Results 78
30 min with LPS, led to a 2,6 times higher VISTA RNA amount compared to the native
state. The preincubation with DAPT for 24 h diminished this effect and led to only a 1,2
times higher VISTA RNA amount to the native state.
Overall, the inhibition of the γ-secretase via DAPT and MMPs and ADAMs via TAPI-2
seemed to influence the nuclear VISTA expression. But to clarify if the shedding and
cutting of the different VISTA domains was necessary for nuclear translocation, there
are further investigations necessary.
4.2.3 Stimulation by cell density
Missing cell-cell contact, or too high cellular density is another kind of stress stimulus
for cells. For nuclear PD-L1, it was observed, that lacking cell-cell-contact led to
higher percentage of nuclear PD-L1 (Satelli et al. 2016). To test if this stress led to a
similar translocation of VISTA like an immunogenic stimulus, BMDMs were seeded in
different densities.
0 500 1000 1500
3,0
3,5
4,0
4,5
5,0
5,5
6,0
6,5
7,0
7,5
8,0
8,5
IL-6
concentr
ation [pg/m
L]
LPS stimulation [minutes]
0,125x
0,25x
0,5x
1x
2x
4x
Figure 4.2.3.1: IL-6 Elisa of BMDM during LPS stimulation, seeded in different densities (Inset), n=1 in triplicates
To check if the different cell densities led to stress of BMDMs, the IL-6 concentration
was measured while an LPS kinetic (Figure 4.2.3.1). The missing cell-cell contact of
lower cell densities than 1x prevented the activation of BMDMs by LPS. Although after
sustaining LPS stimulation for 24 hours, no IL-6 production beside the basal
concentration (around 3,5 pg/mL) was observable for 0,125x, 0,25x and 0,5x cell
densities. The normal cell density showed the expected pattern. Short stimulation with
LPS first led to a drop of IL-6 concentration. Full activation and the highest IL-6
concentration was reached after 480 min with twice as much IL-6 than the basal state.
Long-term stimulation for 24 h with LPS led to a decrease of IL-6 to 6 pg/mL.

Results 79
An increased cell density of 2x or 4x led to a higher basal activity compared to 1x cell
density and IL-6 concentration of ~4,5 pg/mL. LPS stimulation for 5 minutes led
surprisingly to a high increase in IL-6 concentration up to 7-8 pg/mL which dropped
again after 10 min stimulation back to ~4,5 pg/mL. The peak of IL-6 concentration after
480 min LPS stimulation was not much higher for 2x and 4x cell density than for normal
cell density. Also, the decrease of IL-6 concentration after 24 h LPS stimulation
proceeded similar to the 1x cell density. Therefore, we could conclude, that missing
cell-cell-contact prevented stimulation of the cells. Whereas higher cell densities led to
a little higher basal activation and IL-6 concentration but permitted a normal LPS
stimulation of the cells.
0 1 2 3 4
0,4
0,5
0,6
0,7
0,8
0,9
1,0
1,1
1,2
1,3
1,4
1,5
1,6
1,7
1,8
1,9
2,0
2,1
2,2
IL-6
con
cen
tra
tion
[x-f
old
]
cell density (x-fold)
0
5
10
30
120
480
1440
Figure 4.2.3.2: Normalized IL-6 concentration for different BMDM densities (Inset) during LPS stimulation, similar dataset like Figure 4.2.3.1, n=1 in triplicates
If you normalize all samples to the values of the normal 1x cell density (Figure 4.2.3.2)
one can observe that higher cell densities only led to a 1,35 times higher IL-6
concentration as a maximum. There was only much higher activation and IL-6
concentration in the samples of 5 min LPS stimulation. But this strong activation was
not stable or consistent. In addition, there was nearly no difference observable if one
seeded BMDMs in 2x or 4x higher cell density. We could assume that a higher cell
density did not lead to a corresponding higher activation and IL-6 concentration.
To check if the cells did still show more nuclear expression for different cell densities,
we analyzed the nuclei/cytosol fluorescence for LPS kinetic on BMDMs. For lower cell
densities <1x it was not possible to fix and analyze enough cells/slide so they are not
part of Figure 4.2.3.3. Four times higher cell density showed for native BMDMs and 5
min LPS stimulation a highly significant lower nuclei/cytosol fluorescence. For 10 min
and 30 min, neither 2x nor 4x cell density showed any significant difference to the
normal cell density. So, we could assume that the slightly higher IL-6 concentration
with higher cell densities after LPS stimulation, did not have a strong effect on the
nuclear VISTA expression after stimulation with LPS. But higher cell densities seemed
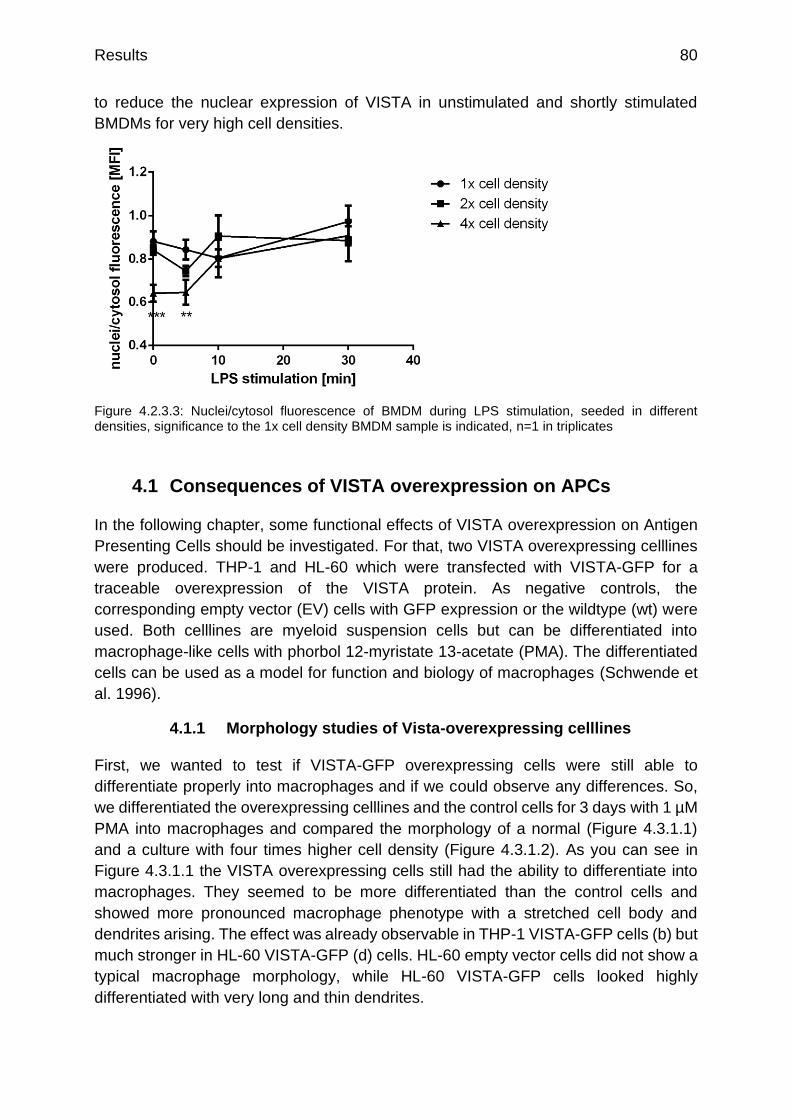
Results 80
to reduce the nuclear expression of VISTA in unstimulated and shortly stimulated
BMDMs for very high cell densities.
Figure 4.2.3.3: Nuclei/cytosol fluorescence of BMDM during LPS stimulation, seeded in different densities, significance to the 1x cell density BMDM sample is indicated, n=1 in triplicates
4.1 Consequences of VISTA overexpression on APCs
In the following chapter, some functional effects of VISTA overexpression on Antigen
Presenting Cells should be investigated. For that, two VISTA overexpressing celllines
were produced. THP-1 and HL-60 which were transfected with VISTA-GFP for a
traceable overexpression of the VISTA protein. As negative controls, the
corresponding empty vector (EV) cells with GFP expression or the wildtype (wt) were
used. Both celllines are myeloid suspension cells but can be differentiated into
macrophage-like cells with phorbol 12-myristate 13-acetate (PMA). The differentiated
cells can be used as a model for function and biology of macrophages (Schwende et
al. 1996).
4.1.1 Morphology studies of Vista-overexpressing celllines
First, we wanted to test if VISTA-GFP overexpressing cells were still able to
differentiate properly into macrophages and if we could observe any differences. So,
we differentiated the overexpressing celllines and the control cells for 3 days with 1 µM
PMA into macrophages and compared the morphology of a normal (Figure 4.3.1.1)
and a culture with four times higher cell density (Figure 4.3.1.2). As you can see in
Figure 4.3.1.1 the VISTA overexpressing cells still had the ability to differentiate into
macrophages. They seemed to be more differentiated than the control cells and
showed more pronounced macrophage phenotype with a stretched cell body and
dendrites arising. The effect was already observable in THP-1 VISTA-GFP cells (b) but
much stronger in HL-60 VISTA-GFP (d) cells. HL-60 empty vector cells did not show a
typical macrophage morphology, while HL-60 VISTA-GFP cells looked highly
differentiated with very long and thin dendrites.
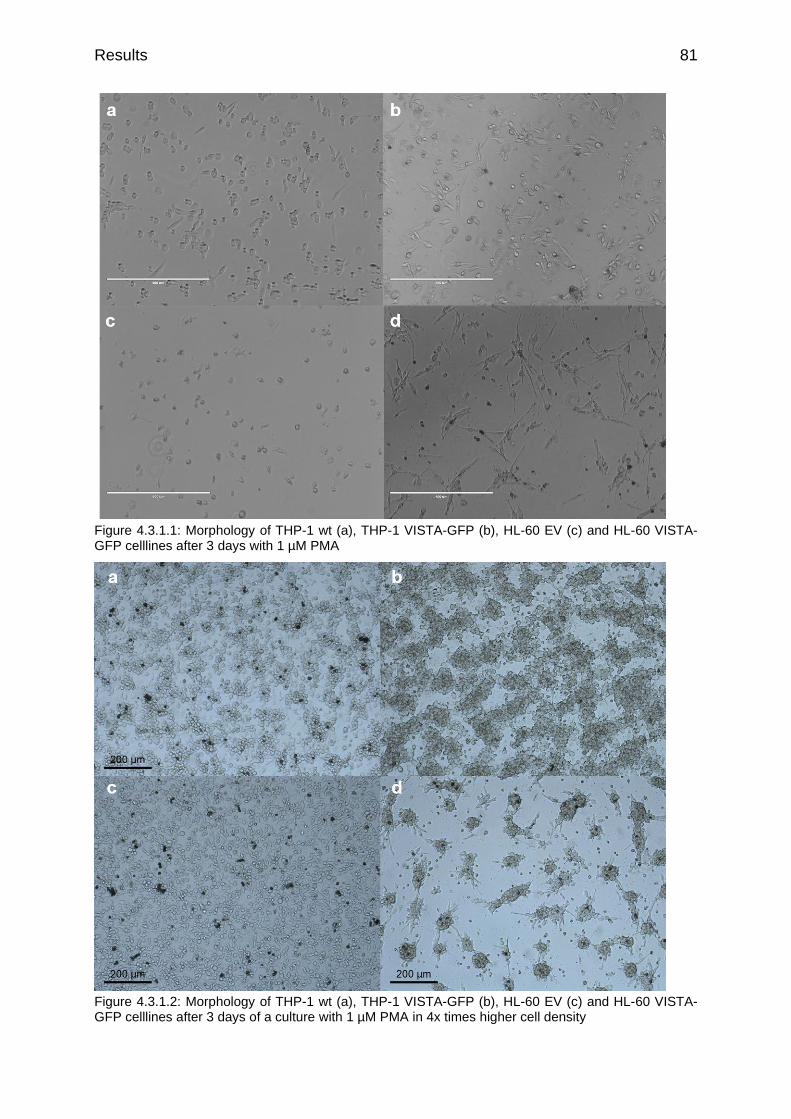
Results 81
Figure 4.3.1.1: Morphology of THP-1 wt (a), THP-1 VISTA-GFP (b), HL-60 EV (c) and HL-60 VISTA-GFP celllines after 3 days with 1 µM PMA
Figure 4.3.1.2: Morphology of THP-1 wt (a), THP-1 VISTA-GFP (b), HL-60 EV (c) and HL-60 VISTA-GFP celllines after 3 days of a culture with 1 µM PMA in 4x times higher cell density

Results 82
In Figure 4.3.1.2 one could see the effects of a high cell density on the different
celllines. There it became obvious that VISTA-GFP cells were not only stronger
differentiated than the control cells, but also showed much stronger adhesion. The
VISTA-GFP cells tended to cluster together and had a strong cell-cell contact. This
effect again was stronger for HL-60 cells but also observable for THP-1 cells. THP-1
wildtype cells were already more differentiated compared to HL-60 cells, because they
were monocytic cells whereas HL-60 cells were undifferentiated promyeloblasts. In
addition, the overexpression of VISTA was 1,5x stronger in HL-60 cells, than in THP-
1 (Figure 4.1.2.5). So, it was reasonable that the effects are stronger in HL-60 cells.
4.1.2 Adhesion assays of Vista-overexpressing celllines
To test the effect of VISTA overexpression on the adhesion of the celllines we
performed adhesion assays. Differentiated macrophages were always attached and
adherent, but the undifferentiated celllines were suspension cells. So, we tested if the
overexpression of VISTA led to an increased adherence of the undifferentiated
suspension cells.
Figure 4.3.2.1: Adhesion of suspension cells a) THP-1 wt, b) THP-1 VISTA-GFP, c) HL-60 EV and d) HL-60 VISTA-GFP after 4 days
Indeed, overexpression of VISTA allowed suspension cells to became adherent and
attached to the bottom of the wells (Figure 4.3.2.1).
Quantification of attached cells/well (Figure 4.3.2.2) showed for both celllines a higher
adhesion for VISTA overexpressing cells after 4 days compared to the control cells.
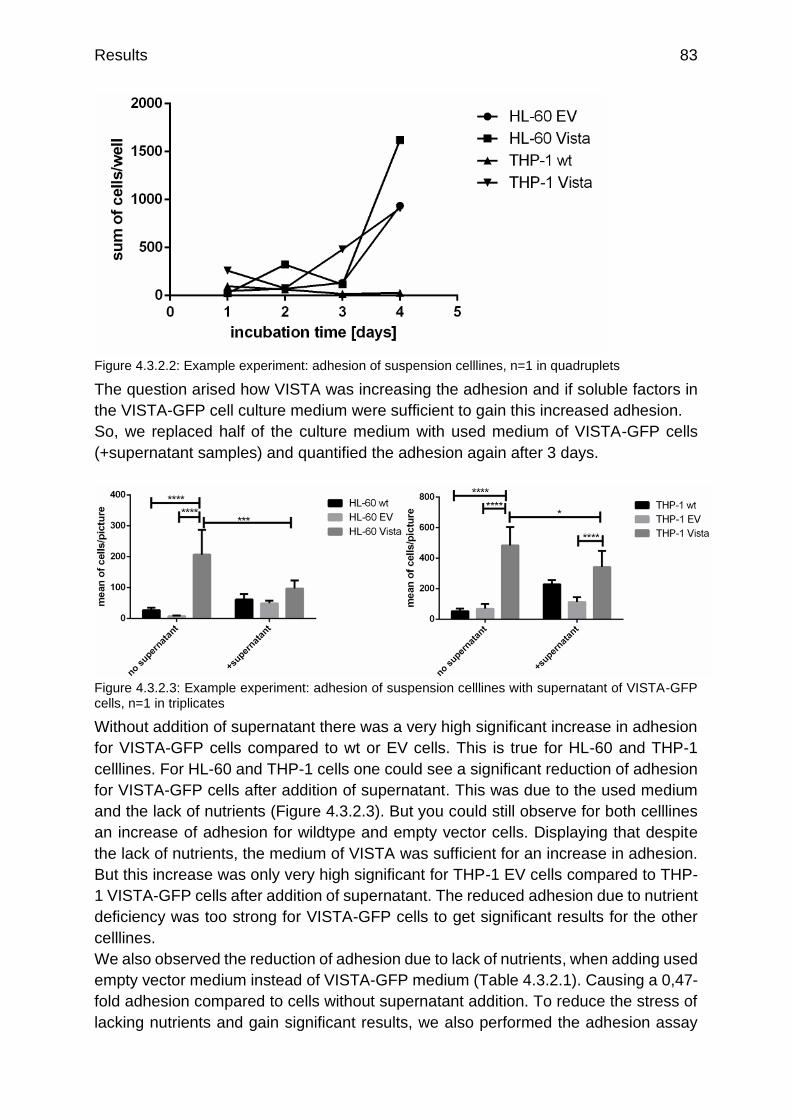
Results 83
Figure 4.3.2.2: Example experiment: adhesion of suspension celllines, n=1 in quadruplets
The question arised how VISTA was increasing the adhesion and if soluble factors in
the VISTA-GFP cell culture medium were sufficient to gain this increased adhesion.
So, we replaced half of the culture medium with used medium of VISTA-GFP cells
(+supernatant samples) and quantified the adhesion again after 3 days.
Figure 4.3.2.3: Example experiment: adhesion of suspension celllines with supernatant of VISTA-GFP cells, n=1 in triplicates
Without addition of supernatant there was a very high significant increase in adhesion
for VISTA-GFP cells compared to wt or EV cells. This is true for HL-60 and THP-1
celllines. For HL-60 and THP-1 cells one could see a significant reduction of adhesion
for VISTA-GFP cells after addition of supernatant. This was due to the used medium
and the lack of nutrients (Figure 4.3.2.3). But you could still observe for both celllines
an increase of adhesion for wildtype and empty vector cells. Displaying that despite
the lack of nutrients, the medium of VISTA was sufficient for an increase in adhesion.
But this increase was only very high significant for THP-1 EV cells compared to THP-
1 VISTA-GFP cells after addition of supernatant. The reduced adhesion due to nutrient
deficiency was too strong for VISTA-GFP cells to get significant results for the other
celllines.
We also observed the reduction of adhesion due to lack of nutrients, when adding used
empty vector medium instead of VISTA-GFP medium (Table 4.3.2.1). Causing a 0,47-
fold adhesion compared to cells without supernatant addition. To reduce the stress of
lacking nutrients and gain significant results, we also performed the adhesion assay
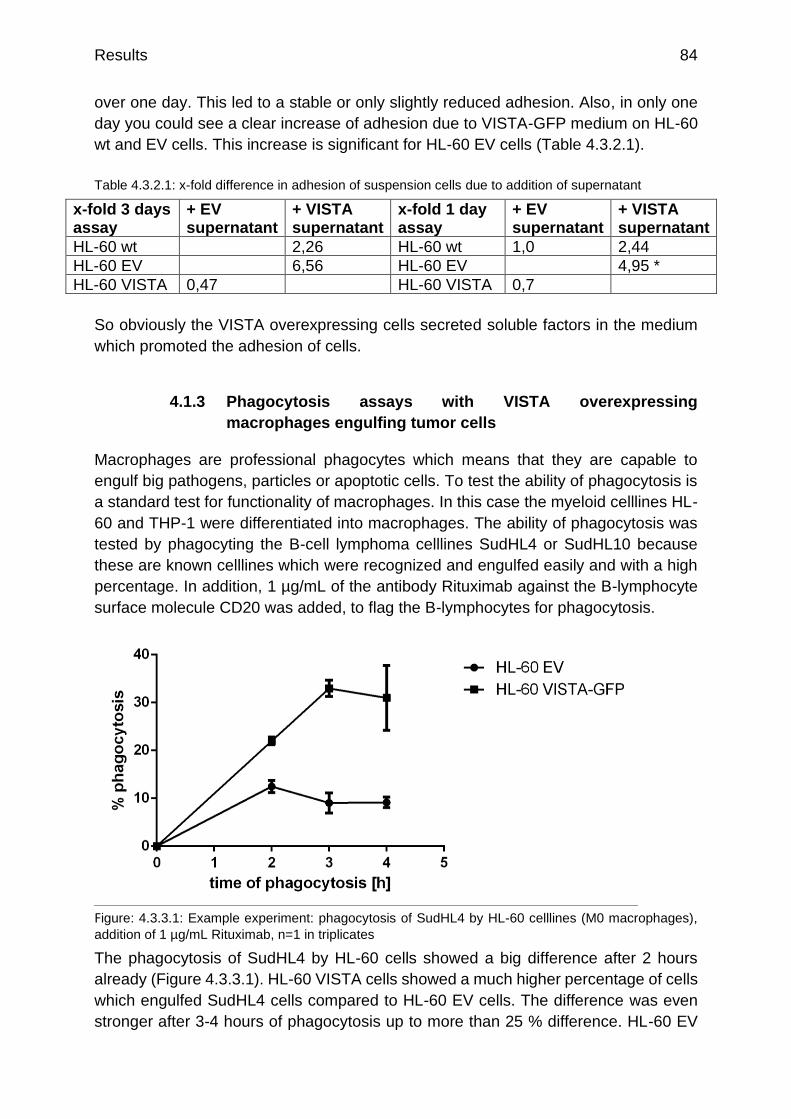
Results 84
over one day. This led to a stable or only slightly reduced adhesion. Also, in only one
day you could see a clear increase of adhesion due to VISTA-GFP medium on HL-60
wt and EV cells. This increase is significant for HL-60 EV cells (Table 4.3.2.1).
Table 4.3.2.1: x-fold difference in adhesion of suspension cells due to addition of supernatant
x-fold 3 days assay
+ EV supernatant
+ VISTA supernatant
x-fold 1 day assay
+ EV supernatant
+ VISTA supernatant
HL-60 wt 2,26 HL-60 wt 1,0 2,44
HL-60 EV 6,56 HL-60 EV 4,95 *
HL-60 VISTA 0,47 HL-60 VISTA 0,7
So obviously the VISTA overexpressing cells secreted soluble factors in the medium
which promoted the adhesion of cells.
4.1.3 Phagocytosis assays with VISTA overexpressing
macrophages engulfing tumor cells
Macrophages are professional phagocytes which means that they are capable to
engulf big pathogens, particles or apoptotic cells. To test the ability of phagocytosis is
a standard test for functionality of macrophages. In this case the myeloid celllines HL-
60 and THP-1 were differentiated into macrophages. The ability of phagocytosis was
tested by phagocyting the B-cell lymphoma celllines SudHL4 or SudHL10 because
these are known celllines which were recognized and engulfed easily and with a high
percentage. In addition, 1 µg/mL of the antibody Rituximab against the B-lymphocyte
surface molecule CD20 was added, to flag the B-lymphocytes for phagocytosis.
Figure: 4.3.3.1: Example experiment: phagocytosis of SudHL4 by HL-60 celllines (M0 macrophages),
addition of 1 µg/mL Rituximab, n=1 in triplicates
The phagocytosis of SudHL4 by HL-60 cells showed a big difference after 2 hours
already (Figure 4.3.3.1). HL-60 VISTA cells showed a much higher percentage of cells
which engulfed SudHL4 cells compared to HL-60 EV cells. The difference was even
stronger after 3-4 hours of phagocytosis up to more than 25 % difference. HL-60 EV

Results 85
cells did not have a high phagocytosis activity with a maximum of 12 %, which stayed
constantly low. HL-60 VISTA-GFP cells however showed a much higher phagocytosis
which increased up to 3 hours and remained high at around 31 %.
Figure 4.3.3.2: Pictures of phagocytosis of SudHL10 (red) by different macrophage types of HL-60 cells, addition of 1 µg/mL Rituximab
But the celllines could not only be differentiated into M0 macrophages, but also into
other macrophage types (Figure 4.3.3.2). For all macrophage types we could observe
much more red tumor cells engulfed by the VISTA overexpressing macrophages, but
also more tumor cells which were attached to the macrophages. This could be due to
the enhanced adhesion and promoted cell-cell contact of VISTA overexpressing
celllines. Phagocytosis first needs attachment of phagocyte and tumor cell to occur.
So, the increased adhesion and cell-cell contact of VISTA overexpressing cells could
also be a reason for the increased phagocytosis.
Figure 4.3.3.3: Example experiment: phagocytosis of SudHL10 for four hours by different macrophage types of HL-60 and THP-1 celllines, addition of 1 µg/mL Rituximab, n=2 in duplicates
When we quantified the percentage of macrophages, which performed phagocytosis,
HL-60 VISTA-GFP cells (between 39-51 %) showed much higher phagocytosis
compared to the control cells HL-60 EV (between 8,5-17 %). The phagocytosis of THP-
1 was already quite high for wildtype cells (43,5-56 %), limiting the possibility of
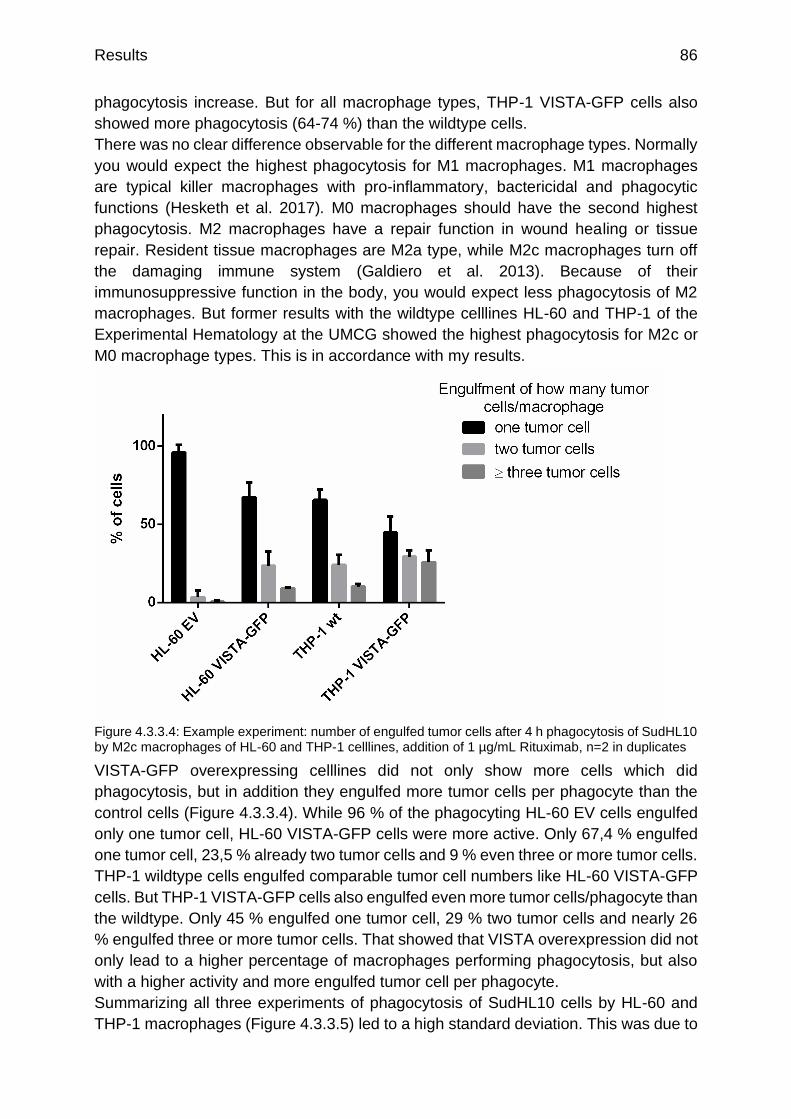
Results 86
phagocytosis increase. But for all macrophage types, THP-1 VISTA-GFP cells also
showed more phagocytosis (64-74 %) than the wildtype cells.
There was no clear difference observable for the different macrophage types. Normally
you would expect the highest phagocytosis for M1 macrophages. M1 macrophages
are typical killer macrophages with pro-inflammatory, bactericidal and phagocytic
functions (Hesketh et al. 2017). M0 macrophages should have the second highest
phagocytosis. M2 macrophages have a repair function in wound healing or tissue
repair. Resident tissue macrophages are M2a type, while M2c macrophages turn off
the damaging immune system (Galdiero et al. 2013). Because of their
immunosuppressive function in the body, you would expect less phagocytosis of M2
macrophages. But former results with the wildtype celllines HL-60 and THP-1 of the
Experimental Hematology at the UMCG showed the highest phagocytosis for M2c or
M0 macrophage types. This is in accordance with my results.
Figure 4.3.3.4: Example experiment: number of engulfed tumor cells after 4 h phagocytosis of SudHL10 by M2c macrophages of HL-60 and THP-1 celllines, addition of 1 µg/mL Rituximab, n=2 in duplicates
VISTA-GFP overexpressing celllines did not only show more cells which did
phagocytosis, but in addition they engulfed more tumor cells per phagocyte than the
control cells (Figure 4.3.3.4). While 96 % of the phagocyting HL-60 EV cells engulfed
only one tumor cell, HL-60 VISTA-GFP cells were more active. Only 67,4 % engulfed
one tumor cell, 23,5 % already two tumor cells and 9 % even three or more tumor cells.
THP-1 wildtype cells engulfed comparable tumor cell numbers like HL-60 VISTA-GFP
cells. But THP-1 VISTA-GFP cells also engulfed even more tumor cells/phagocyte than
the wildtype. Only 45 % engulfed one tumor cell, 29 % two tumor cells and nearly 26
% engulfed three or more tumor cells. That showed that VISTA overexpression did not
only lead to a higher percentage of macrophages performing phagocytosis, but also
with a higher activity and more engulfed tumor cell per phagocyte.
Summarizing all three experiments of phagocytosis of SudHL10 cells by HL-60 and
THP-1 macrophages (Figure 4.3.3.5) led to a high standard deviation. This was due to

Results 87
the individual activation state of the cells. For example, one aspect for the variability
was the cell number. A defined number of cells was seeded, but dependent on their
condition, the number of cells which differentiated and how strong they differentiated
and attached differed slightly. With that, the cell-cell contact, and activity of the
macrophages also differed.
But one could still see a much higher phagocytosis for HL-60 VISTA-GFP cells than
for HL-60 EV cells. For THP-1 cells, the difference was not so pronounced in the single
experiments (Figure 4.3.3.3), leading to a weaker increased phagocytosis for THP-1
VISTA-GFP cells compared to THP-1 wt cells. But you can still observe the trend.
Figure 4.3.3.5: Summary of phagocytosis of SudHL10 by different macrophage types of HL-60 and THP-1 celllines, macrophage type grouped, addition of 1 µg/mL Rituximab, n=4
Regarding the macrophage type difference for all three experiment of SudHL10
phagocytosis, there were still only small differences observable (Figure 4.3.3.6). But in
accordance with the former results of the UMCG working group and the single
experiment (Figure 4.3.3.3), M0 and M2c macrophages showed the highest
percentage of phagocyting macrophages.
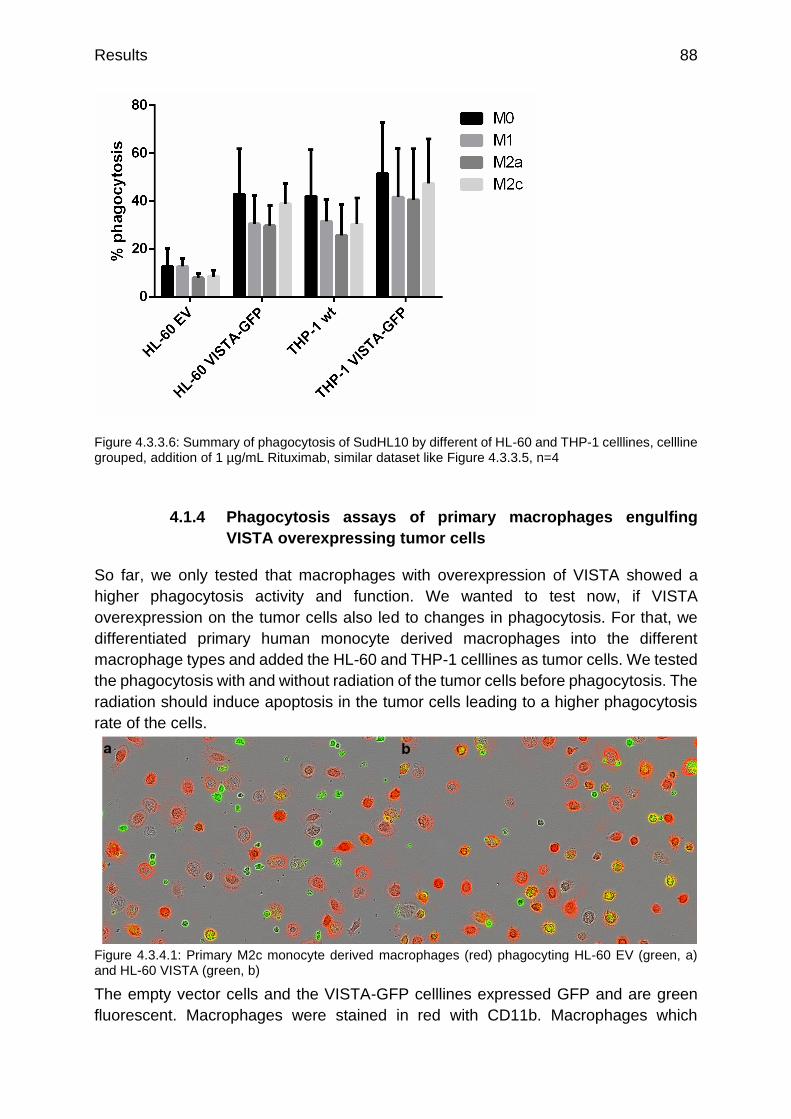
Results 88
Figure 4.3.3.6: Summary of phagocytosis of SudHL10 by different of HL-60 and THP-1 celllines, cellline grouped, addition of 1 µg/mL Rituximab, similar dataset like Figure 4.3.3.5, n=4
4.1.4 Phagocytosis assays of primary macrophages engulfing
VISTA overexpressing tumor cells
So far, we only tested that macrophages with overexpression of VISTA showed a
higher phagocytosis activity and function. We wanted to test now, if VISTA
overexpression on the tumor cells also led to changes in phagocytosis. For that, we
differentiated primary human monocyte derived macrophages into the different
macrophage types and added the HL-60 and THP-1 celllines as tumor cells. We tested
the phagocytosis with and without radiation of the tumor cells before phagocytosis. The
radiation should induce apoptosis in the tumor cells leading to a higher phagocytosis
rate of the cells.
Figure 4.3.4.1: Primary M2c monocyte derived macrophages (red) phagocyting HL-60 EV (green, a) and HL-60 VISTA (green, b)
The empty vector cells and the VISTA-GFP celllines expressed GFP and are green
fluorescent. Macrophages were stained in red with CD11b. Macrophages which
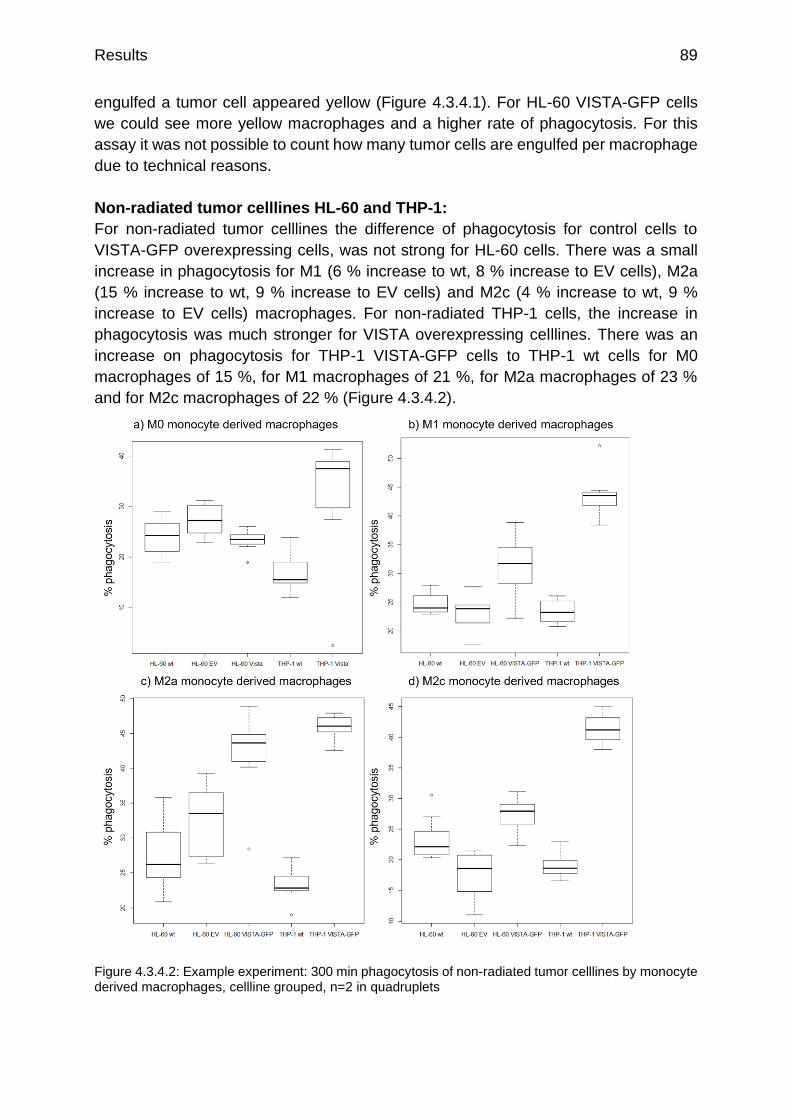
Results 89
engulfed a tumor cell appeared yellow (Figure 4.3.4.1). For HL-60 VISTA-GFP cells
we could see more yellow macrophages and a higher rate of phagocytosis. For this
assay it was not possible to count how many tumor cells are engulfed per macrophage
due to technical reasons.
Non-radiated tumor celllines HL-60 and THP-1:
For non-radiated tumor celllines the difference of phagocytosis for control cells to
VISTA-GFP overexpressing cells, was not strong for HL-60 cells. There was a small
increase in phagocytosis for M1 (6 % increase to wt, 8 % increase to EV cells), M2a
(15 % increase to wt, 9 % increase to EV cells) and M2c (4 % increase to wt, 9 %
increase to EV cells) macrophages. For non-radiated THP-1 cells, the increase in
phagocytosis was much stronger for VISTA overexpressing celllines. There was an
increase on phagocytosis for THP-1 VISTA-GFP cells to THP-1 wt cells for M0
macrophages of 15 %, for M1 macrophages of 21 %, for M2a macrophages of 23 %
and for M2c macrophages of 22 % (Figure 4.3.4.2).
Figure 4.3.4.2: Example experiment: 300 min phagocytosis of non-radiated tumor celllines by monocyte derived macrophages, cellline grouped, n=2 in quadruplets
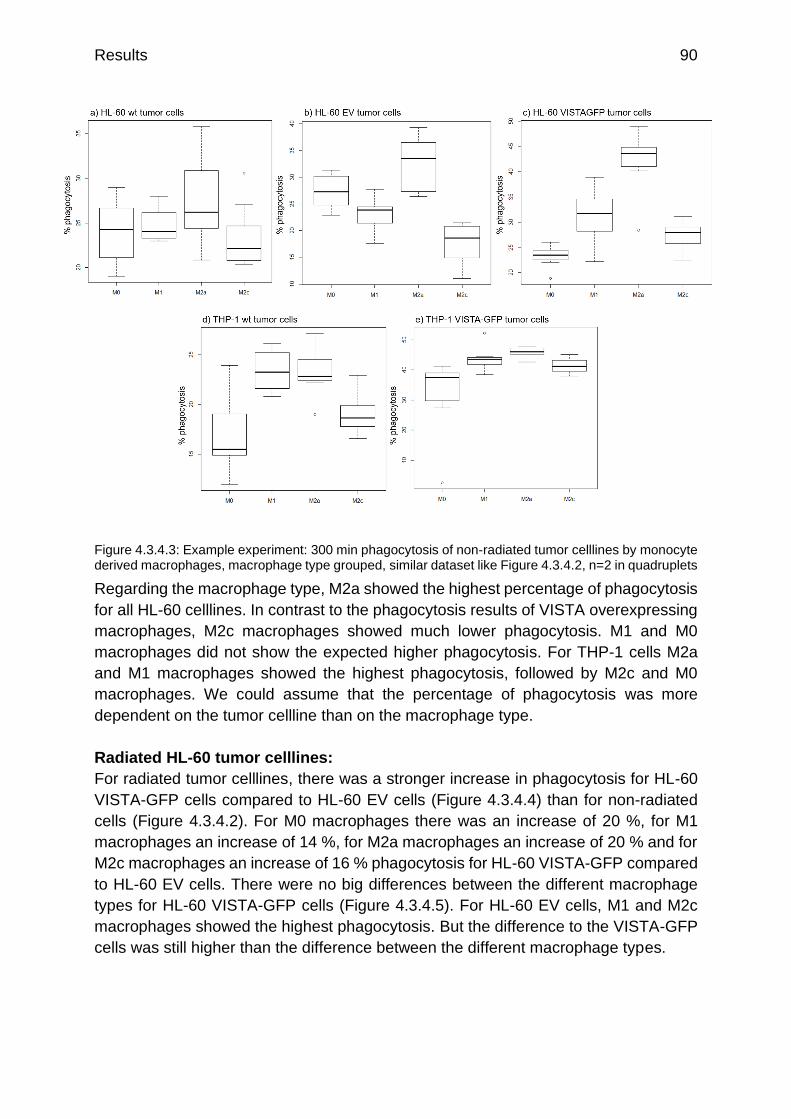
Results 90
Figure 4.3.4.3: Example experiment: 300 min phagocytosis of non-radiated tumor celllines by monocyte derived macrophages, macrophage type grouped, similar dataset like Figure 4.3.4.2, n=2 in quadruplets
Regarding the macrophage type, M2a showed the highest percentage of phagocytosis
for all HL-60 celllines. In contrast to the phagocytosis results of VISTA overexpressing
macrophages, M2c macrophages showed much lower phagocytosis. M1 and M0
macrophages did not show the expected higher phagocytosis. For THP-1 cells M2a
and M1 macrophages showed the highest phagocytosis, followed by M2c and M0
macrophages. We could assume that the percentage of phagocytosis was more
dependent on the tumor cellline than on the macrophage type.
Radiated HL-60 tumor celllines:
For radiated tumor celllines, there was a stronger increase in phagocytosis for HL-60
VISTA-GFP cells compared to HL-60 EV cells (Figure 4.3.4.4) than for non-radiated
cells (Figure 4.3.4.2). For M0 macrophages there was an increase of 20 %, for M1
macrophages an increase of 14 %, for M2a macrophages an increase of 20 % and for
M2c macrophages an increase of 16 % phagocytosis for HL-60 VISTA-GFP compared
to HL-60 EV cells. There were no big differences between the different macrophage
types for HL-60 VISTA-GFP cells (Figure 4.3.4.5). For HL-60 EV cells, M1 and M2c
macrophages showed the highest phagocytosis. But the difference to the VISTA-GFP
cells was still higher than the difference between the different macrophage types.

Results 91
Figure 4.3.4.4: Example experiment: 120 min phagocytosis of radiated tumor celllines by monocyte derived macrophages, macrophage type grouped, n=3 in quadruplets
Figure 4.3.4.5: Example experiment: 120 min phagocytosis of radiated tumor celllines by monocyte derived macrophages, tumor cellline grouped, similar dataset like Figure 4.3.4.4 n=3 in quadruplets
We could conclude that the overexpression of VISTA led to an increased phagocytosis
on both, the macrophage side and the tumor cell side.
4.1.5 Possible interaction partner
We wanted to investigate further the impact of VISTA overexpression on some other
proteins and surface marker. For that, the HL-60 and THP-1 celllines were
differentiated into M0 macrophages with PMA, before performing a qRT-PCR.
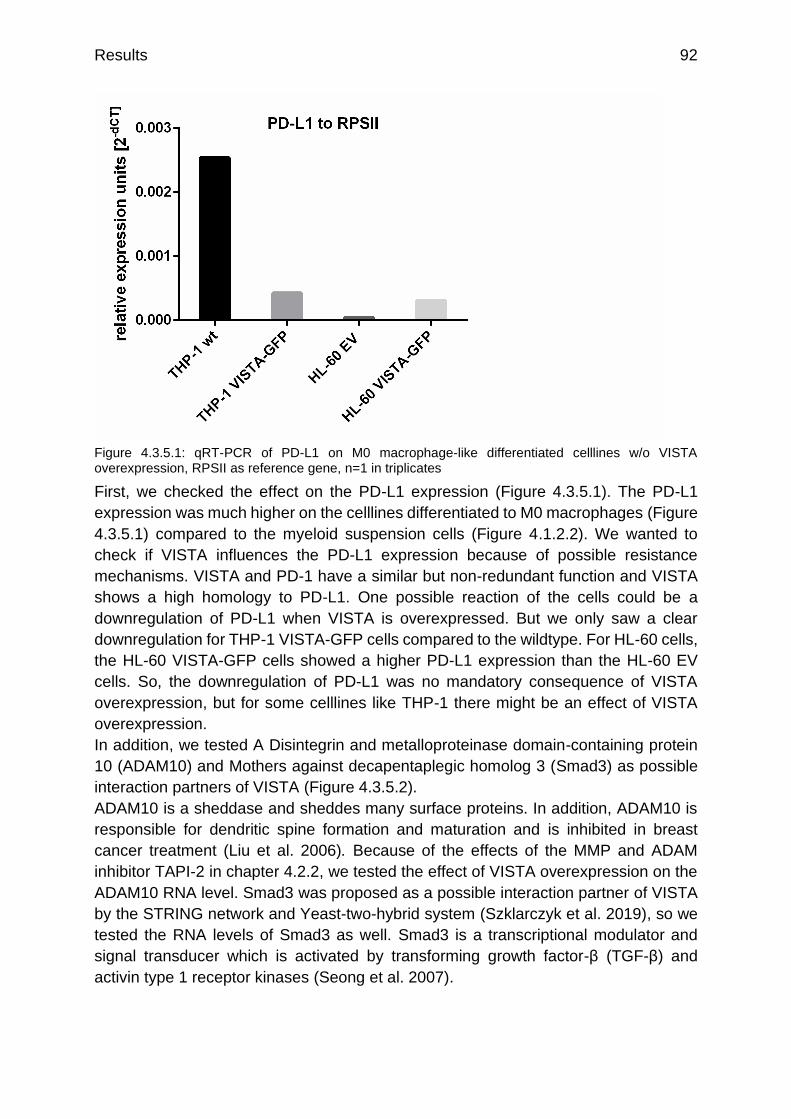
Results 92
Figure 4.3.5.1: qRT-PCR of PD-L1 on M0 macrophage-like differentiated celllines w/o VISTA overexpression, RPSII as reference gene, n=1 in triplicates
First, we checked the effect on the PD-L1 expression (Figure 4.3.5.1). The PD-L1
expression was much higher on the celllines differentiated to M0 macrophages (Figure
4.3.5.1) compared to the myeloid suspension cells (Figure 4.1.2.2). We wanted to
check if VISTA influences the PD-L1 expression because of possible resistance
mechanisms. VISTA and PD-1 have a similar but non-redundant function and VISTA
shows a high homology to PD-L1. One possible reaction of the cells could be a
downregulation of PD-L1 when VISTA is overexpressed. But we only saw a clear
downregulation for THP-1 VISTA-GFP cells compared to the wildtype. For HL-60 cells,
the HL-60 VISTA-GFP cells showed a higher PD-L1 expression than the HL-60 EV
cells. So, the downregulation of PD-L1 was no mandatory consequence of VISTA
overexpression, but for some celllines like THP-1 there might be an effect of VISTA
overexpression.
In addition, we tested A Disintegrin and metalloproteinase domain-containing protein
10 (ADAM10) and Mothers against decapentaplegic homolog 3 (Smad3) as possible
interaction partners of VISTA (Figure 4.3.5.2).
ADAM10 is a sheddase and sheddes many surface proteins. In addition, ADAM10 is
responsible for dendritic spine formation and maturation and is inhibited in breast
cancer treatment (Liu et al. 2006). Because of the effects of the MMP and ADAM
inhibitor TAPI-2 in chapter 4.2.2, we tested the effect of VISTA overexpression on the
ADAM10 RNA level. Smad3 was proposed as a possible interaction partner of VISTA
by the STRING network and Yeast-two-hybrid system (Szklarczyk et al. 2019), so we
tested the RNA levels of Smad3 as well. Smad3 is a transcriptional modulator and
signal transducer which is activated by transforming growth factor-β (TGF-β) and
activin type 1 receptor kinases (Seong et al. 2007).
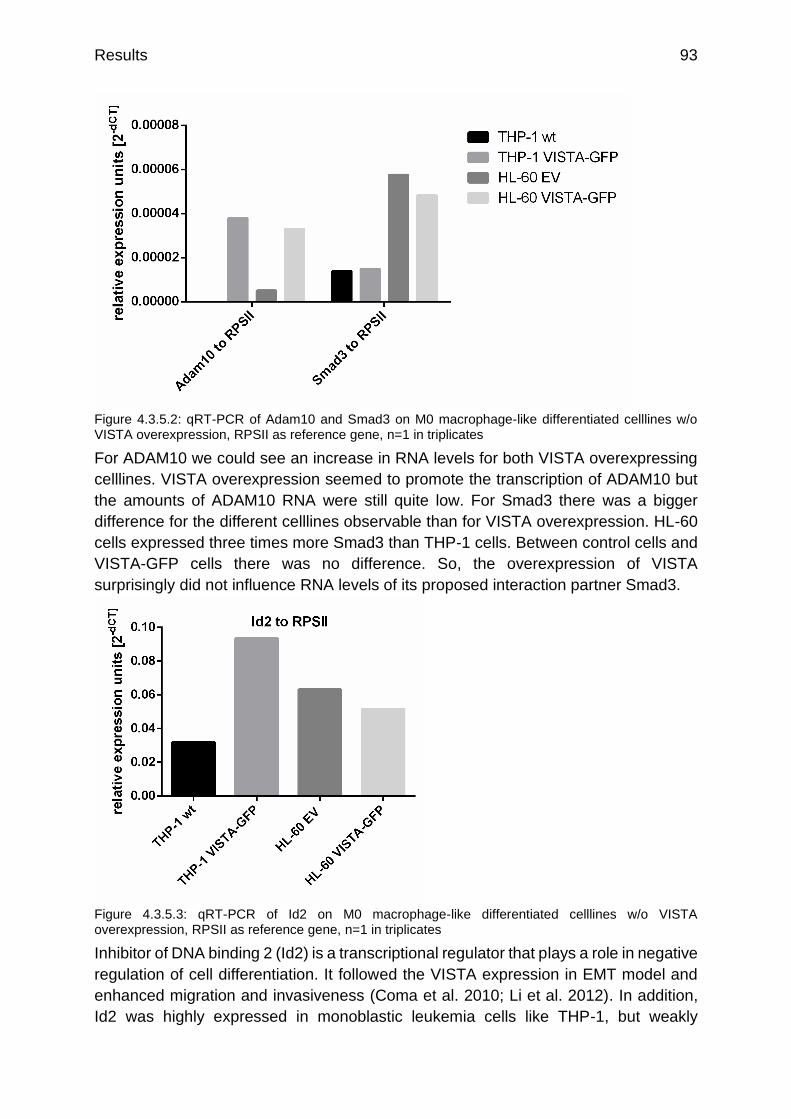
Results 93
Figure 4.3.5.2: qRT-PCR of Adam10 and Smad3 on M0 macrophage-like differentiated celllines w/o VISTA overexpression, RPSII as reference gene, n=1 in triplicates
For ADAM10 we could see an increase in RNA levels for both VISTA overexpressing
celllines. VISTA overexpression seemed to promote the transcription of ADAM10 but
the amounts of ADAM10 RNA were still quite low. For Smad3 there was a bigger
difference for the different celllines observable than for VISTA overexpression. HL-60
cells expressed three times more Smad3 than THP-1 cells. Between control cells and
VISTA-GFP cells there was no difference. So, the overexpression of VISTA
surprisingly did not influence RNA levels of its proposed interaction partner Smad3.
Figure 4.3.5.3: qRT-PCR of Id2 on M0 macrophage-like differentiated celllines w/o VISTA overexpression, RPSII as reference gene, n=1 in triplicates
Inhibitor of DNA binding 2 (Id2) is a transcriptional regulator that plays a role in negative
regulation of cell differentiation. It followed the VISTA expression in EMT model and
enhanced migration and invasiveness (Coma et al. 2010; Li et al. 2012). In addition,
Id2 was highly expressed in monoblastic leukemia cells like THP-1, but weakly
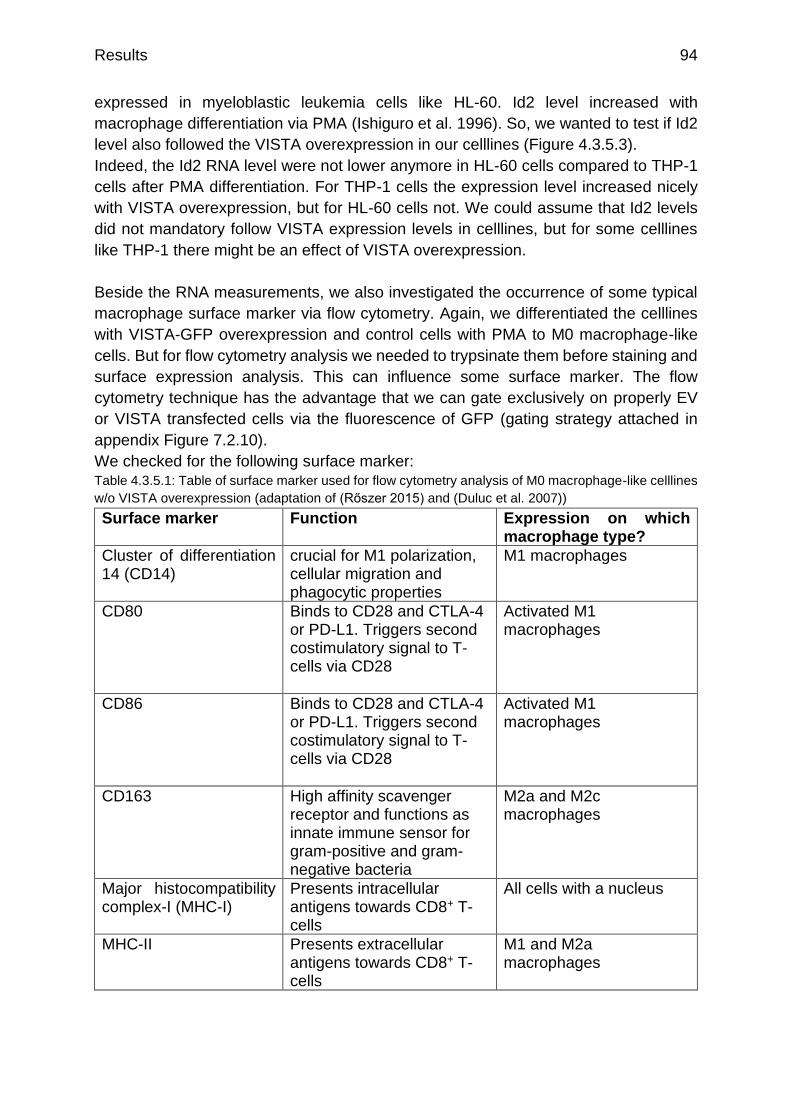
Results 94
expressed in myeloblastic leukemia cells like HL-60. Id2 level increased with
macrophage differentiation via PMA (Ishiguro et al. 1996). So, we wanted to test if Id2
level also followed the VISTA overexpression in our celllines (Figure 4.3.5.3).
Indeed, the Id2 RNA level were not lower anymore in HL-60 cells compared to THP-1
cells after PMA differentiation. For THP-1 cells the expression level increased nicely
with VISTA overexpression, but for HL-60 cells not. We could assume that Id2 levels
did not mandatory follow VISTA expression levels in celllines, but for some celllines
like THP-1 there might be an effect of VISTA overexpression.
Beside the RNA measurements, we also investigated the occurrence of some typical
macrophage surface marker via flow cytometry. Again, we differentiated the celllines
with VISTA-GFP overexpression and control cells with PMA to M0 macrophage-like
cells. But for flow cytometry analysis we needed to trypsinate them before staining and
surface expression analysis. This can influence some surface marker. The flow
cytometry technique has the advantage that we can gate exclusively on properly EV
or VISTA transfected cells via the fluorescence of GFP (gating strategy attached in
appendix Figure 7.2.10).
We checked for the following surface marker: Table 4.3.5.1: Table of surface marker used for flow cytometry analysis of M0 macrophage-like celllines
w/o VISTA overexpression (adaptation of (Rőszer 2015) and (Duluc et al. 2007))
Surface marker Function Expression on which macrophage type?
Cluster of differentiation 14 (CD14)
crucial for M1 polarization, cellular migration and phagocytic properties
M1 macrophages
CD80 Binds to CD28 and CTLA-4 or PD-L1. Triggers second costimulatory signal to T-cells via CD28
Activated M1 macrophages
CD86 Binds to CD28 and CTLA-4 or PD-L1. Triggers second costimulatory signal to T-cells via CD28
Activated M1 macrophages
CD163 High affinity scavenger receptor and functions as innate immune sensor for gram-positive and gram-negative bacteria
M2a and M2c macrophages
Major histocompatibility complex-I (MHC-I)
Presents intracellular antigens towards CD8+ T-cells
All cells with a nucleus
MHC-II Presents extracellular antigens towards CD8+ T-cells
M1 and M2a macrophages
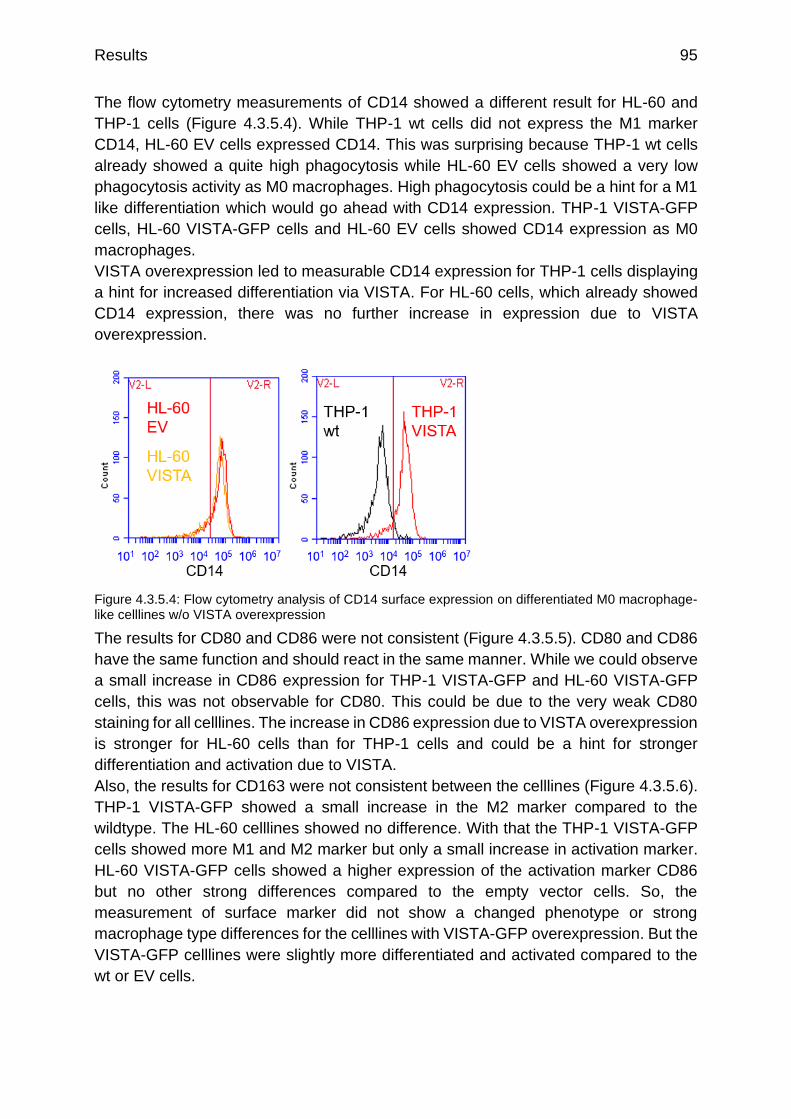
Results 95
The flow cytometry measurements of CD14 showed a different result for HL-60 and
THP-1 cells (Figure 4.3.5.4). While THP-1 wt cells did not express the M1 marker
CD14, HL-60 EV cells expressed CD14. This was surprising because THP-1 wt cells
already showed a quite high phagocytosis while HL-60 EV cells showed a very low
phagocytosis activity as M0 macrophages. High phagocytosis could be a hint for a M1
like differentiation which would go ahead with CD14 expression. THP-1 VISTA-GFP
cells, HL-60 VISTA-GFP cells and HL-60 EV cells showed CD14 expression as M0
macrophages.
VISTA overexpression led to measurable CD14 expression for THP-1 cells displaying
a hint for increased differentiation via VISTA. For HL-60 cells, which already showed
CD14 expression, there was no further increase in expression due to VISTA
overexpression.
Figure 4.3.5.4: Flow cytometry analysis of CD14 surface expression on differentiated M0 macrophage-like celllines w/o VISTA overexpression
The results for CD80 and CD86 were not consistent (Figure 4.3.5.5). CD80 and CD86
have the same function and should react in the same manner. While we could observe
a small increase in CD86 expression for THP-1 VISTA-GFP and HL-60 VISTA-GFP
cells, this was not observable for CD80. This could be due to the very weak CD80
staining for all celllines. The increase in CD86 expression due to VISTA overexpression
is stronger for HL-60 cells than for THP-1 cells and could be a hint for stronger
differentiation and activation due to VISTA.
Also, the results for CD163 were not consistent between the celllines (Figure 4.3.5.6).
THP-1 VISTA-GFP showed a small increase in the M2 marker compared to the
wildtype. The HL-60 celllines showed no difference. With that the THP-1 VISTA-GFP
cells showed more M1 and M2 marker but only a small increase in activation marker.
HL-60 VISTA-GFP cells showed a higher expression of the activation marker CD86
but no other strong differences compared to the empty vector cells. So, the
measurement of surface marker did not show a changed phenotype or strong
macrophage type differences for the celllines with VISTA-GFP overexpression. But the
VISTA-GFP celllines were slightly more differentiated and activated compared to the
wt or EV cells.

Results 96
. Figure 4.3.5.5: Flow cytometry analysis of CD80 and CD86 surface expression on differentiated M0 macrophage-like celllines w/o VISTA overexpression
Figure 4.3.5.6: Flow cytometry analysis of CD163 surface expression on differentiated M0 macrophage-like celllines w/o VISTA overexpression
Beside the classical macrophage type marker, we also checked for MHC clusters. The
immunogenic function of macrophages is the presentation of Antigens towards CD8+
T-cells via MHC complexes. In Figure 4.3.5.7 one could observe a reduced surface
expression of MHC-I and MHC-II cluster for VISTA-GFP overexpressing celllines. The
MHC-II complex was also verified as an interaction partner of VISTA via GFP-pull out
by the Experimental Hematology of the UMCG (data not shown).
As a negative checkpoint regulator, VISTA leads to less T-cell activation. VISTA
overexpression seems to cause less antigen presentation and less activation of T-
cells. This is interesting in combination with the increased phagocytosis of VISTA
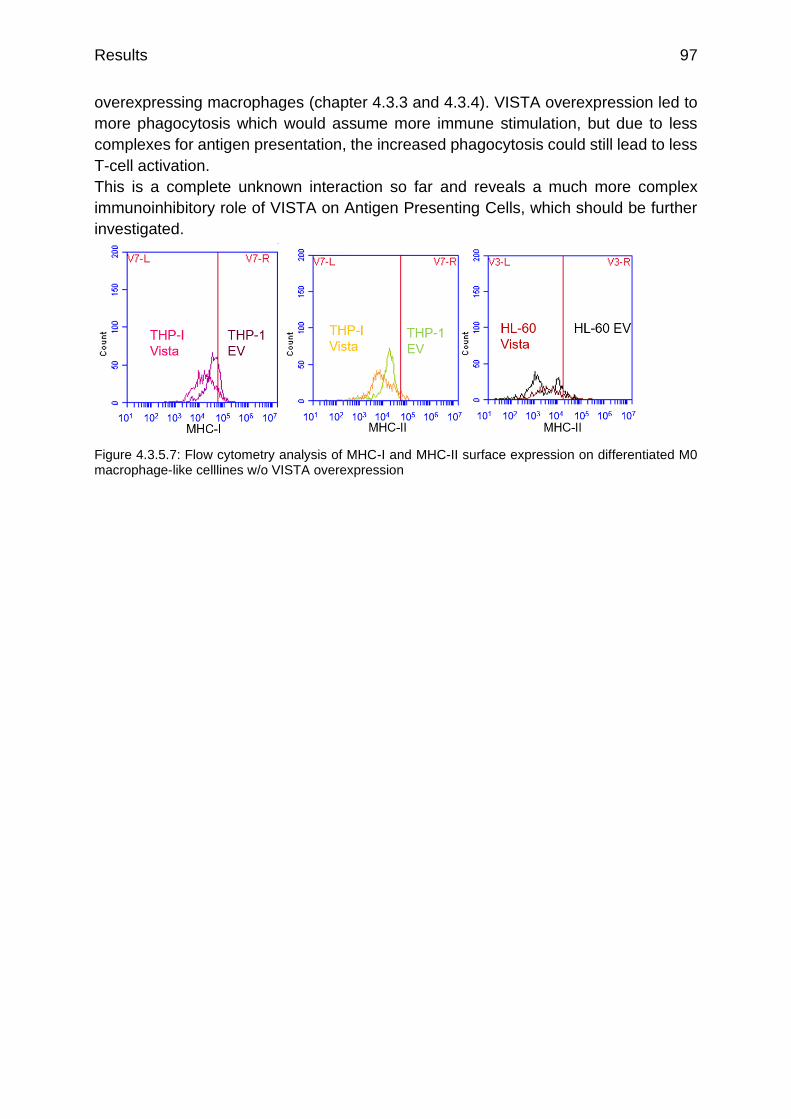
Results 97
overexpressing macrophages (chapter 4.3.3 and 4.3.4). VISTA overexpression led to
more phagocytosis which would assume more immune stimulation, but due to less
complexes for antigen presentation, the increased phagocytosis could still lead to less
T-cell activation.
This is a complete unknown interaction so far and reveals a much more complex
immunoinhibitory role of VISTA on Antigen Presenting Cells, which should be further
investigated.
Figure 4.3.5.7: Flow cytometry analysis of MHC-I and MHC-II surface expression on differentiated M0 macrophage-like celllines w/o VISTA overexpression

Discussion 98
5 Discussion
5.1 VISTA distribution in cell fractions and cell types
5.1.1 VISTA protein purification and characterization
There was no purification protocol of the IgV-VISTA domain established when we
started this project. Both tested protocols led to soluble and pure IgV-VISTA protein
and can be assumed as useful and successful.
The separation of proteins by SEC is mostly dependent on the protein size, but also
on the conformation of the protein and of its interactions with the stationary phase
(Striegel et al. 2009). All chromatograms showed peaks with comparable volumina of
elution. The column could separate proteins of 3-70 kDa. The calculated molecular
mass of the first peak was far over this, displaying that it was caused by protein
aggregates. But the SDS gel showed a single band at 20 kDa for the fraction, exhibiting
that the aggregates were made of IgV-VISTA protein. The biggest peak showed a
calculated molecular mass between 35-40 kDa. Accordingly, the main amount of
VISTA was appearing as a dimer and only a very small percentage of IgV-VISTA was
appearing as a monomer. Therefore, the monomer-dimer equilibrium is strongly shifted
towards the dimer.
In general, the renaturation of dialysis resulted in higher amounts of correctly folded
and not aggregated protein. After dialysis 78,7 % of the protein were not aggregated,
while renaturation on the column only led to 52,6 % of renatured protein. Both methods
provided comparable protein amounts, so the dialysis should be used preferential.
The higher amounts of correctly folded protein after dialysis are reasonable because
the folding is assisted due to the dialysis buffer. The dialysis buffer contains oxidized
and reduced Glutathione (GSSG/GSH), which is able to bind and refold cysteine-
cysteine connections of proteins. The IgV-domain contains four additional cysteines
(five cysteines in total) that are not present in other related proteins of the Ig
superfamily (Xu et al. 2018), so we can conclude that the IgV domain of VISTA is
probably able to build many cysteine-cysteine connections in the oxidized extracellular
environment. The assisted folding by GSSG/GSH allows a rebinding of the different
cysteines, until all cysteines are bound to the correct binding partner. This leads to a
higher proportion of correctly folded protein than the non-assisted refolding on the Ni2+-
column. It is not clear whether the IgV-VISTA domain was functional after this
purification and renaturation, but a soluble protein suggests a correctly folded protein,
which is probably functional.
It was published that VISTA can build dimers (Sakr et al. 2010). Our analysis confirmed
the former hypothesis that VISTA preferentially appears dimerized in solution, which is
supported by the fact that VISTA IgV contains several cysteines that could build
cysteine-cysteine connections between two IgV domains. With its tendency of
dimerization, VISTA could bind VISTA proteins on another cell surface, activating the
T-cell VISTA receptor and its immunoinhibitory pathways (Figure 1.3.3.3) (Liu et al.
2015; Yoon et al. 2015).
Discussion 99
5.1.2 VISTA expression in different cell types
For both, celllines and primary cells, our results confirmed that the VISTA expression
is higher on Antigen Presenting Cells (APCs) than on T-cells (Deng et al. 2016). This
demonstrates that VISTA is not a typical NCR like PD-1 but more related to its ligand
PD-L1. For VISTA signaling, the extrinsic T-cell function seem to be more important as
it shows higher expression, than the intrinsic T-cell function.
Like expected, the VISTA expression was higher on primary cells than on celllines.
The expression of VISTA on tumor cells was discovered recently (Wu et al. 2017;
Wang et al. 2018; Mulati et al. 2019; Böger et al. 2017; Mulati et al. 2019; Edwards et
al. 2019; Shrestha et al. 2018; Blando et al. 2019; Loeser et al. 2019; Muller et al. 2019;
Hong et al. 2019).
In screenings before, tumor cells were assumed as VISTA negative because of the low
VISTA expression compared to immune cells. Celllines are produced by tumor cells so
we expected no or only very low VISTA amounts on tumor cell-derived celllines. As
confirmed nowadays, the VISTA expression is only on some tumor cells and in low
amounts, so our preliminary results fitted to these studies. In addition, I could see
differences between the celllines.
The more differentiated monocytic celllines like THP-1 showed higher expression of
VISTA than undifferentiated or promyeloid blast celllines like HL-60. This is reasonable
because VISTA was originally discovered as the differentiation protein Dies1. It is
important for the stem cell differentiation in embryonic development and differentiates
cells dependent and independent of the bone morphogenetic protein-4 (BMP-4)
pathway (Oliveira et al. 2016). So higher amounts of VISTA could lead to increased
differentiation. This could be one aspect why celllines with higher VISTA expression
are more differentiated. For the future there should be more insight if there is a link of
differentiation and VISTA expression in tumor cells or a more important link of
immunological state of the tumor and VISTA expression.
5.1.3 VISTA expression in cellular fractions
VISTA in vesicles
The storage of VISTA in endocytic and secretory vesicles showed a high similarity to
the model NCR CTLA-4 (Linsley et al. 1996). The surface expression of CTLA-4 varies
depending on the T-cell activation and shows a high dynamic of endocytosis and
exocytosis. It is also known that VISTA is endocytosed rapidly but with a constant high
cell surface expression on myeloid cells (Deng et al. 2016).
Although there were indications of VISTA expression in the cytoplasm (Deng et al.
2016; Liu et al. 2018), VISTA expression was only investigated on the cell surface via
flow cytometry so far. My results strongly indicated that there are much higher VISTA
amounts expressed and stored in vesicles than expressed on the cell surface.
The storage of VISTA in vesicles could enable a fast reaction to immunogenic stimuli
and a fast regulation of the VISTA surface expression. VISTA vesicles could adapt the
cell surface expression rapidly via endocytosis and exocytosis with the plasma
membrane.
Discussion 100
VISTA in nuclei
The expression of VISTA in the nucleus was unexpected and needs further
investigation. VISTA is a membrane protein and does not contain a classical nucleus
import motif. Nevertheless, the expression of VISTA in the nucleus was observable
with four different VISTA antibodies and in the VISTA-GFP transfected cells, which
allowed me to exclude any unspecific antibody reaction.
But the nucleus expression of VISTA confirms the high similarity of VISTA with PD-L1
which is expressed in the nucleus as well. VISTA is also called PD-L1-like ligand
because of the high homology of VISTA and PD-L1 and shows a similar structure
(Lines et al. 2014a; Wang et al. 2014; Lines et al. 2014b; Baksh und Weber 2015). PD-
L1 does not contain any classical nucleus import motif as well, but shows interaction
with nuclear import/export proteins in its interactome (Escors et al. 2018).
In addition to its function of T-cell inhibition, an anti-apoptotic role with molecules in the
nucleolus is discussed for nuclear PD-L1. Nuclear PD-L1 is not only upregulated due
to chemotherapy with Doxorubicin, but also in strongly apoptosis resistant circulating
tumor cells (Ghebeh et al. 2010; Satelli et al. 2016). The nucleus expression seems to
enhance the apoptotic resistance and is correlated with a bad prognosis if found in
tumor cells.
VISTA also shows an anti-apoptotic role and is induced as a downstream target of p53
in response to stress and DNA damage (Yoon et al. 2015). With the high homology to
PD-L1 a similar function could be proposed for VISTA. To optimize the immunotherapy
of tumor, the nucleus expression of VISTA in (circulating) tumor cells should be
considered and investigated for the future.
VISTA in exosomes
While there are indications of the extracellular VISTA domain to be shedded and
released in the medium to operate as a signal molecule (Sakr et al. 2010), there were
no indications yet of VISTA being present in exosomes. This finding showed a
complete new possible pathway of cell-cell-communication via VISTA in secreted
exosomes and should be investigated further.
VISTA can bind itself and could forward the VISTA signal in a soluble or membrane-
bound form like exosomes. This signaling pathway would not require direct binding of
immune cells via VISTA for immunosuppressive signaling (Yang et al. 2017; Mehta et
al. 2019; Prodeus et al. 2017). It was shown that the soluble IgV domain of VISTA
binds the VISTA receptor on T-cells and is sufficient to temper the immune reaction of
T-cells (Prodeus et al. 2017). So, VISTA containing exosomes could be an important
way of immune evasion of tumor cells in the tumor microenvironment.
My results about the intracellular trafficking of VISTA are summed up in Figure 5.2.1.

Discussion 101
5.2 Effect of stimulation
Effect on VISTA vesicles
Based on 5.1.3, I tested if VISTA vesicles are released due to immunogenic stimulus
via particle analysis. The results showed a decrease of VISTA vesicles in the cytosol
due to immunogenic stimulus. The particle analysis gave no information about increase
of VISTA surface expression, but the standard transport mechanism of proteins in
endosomes is exocytosis to the plasma membrane.
The fact that VISTA vesicles seemed to be released to the cell surface due to
immunogenic stimulation is reasonable. As a negative checkpoint regulator, the main
function of VISTA, is the downregulation of immune reactions. To tender the reaction
of the immune system in inflammatory conditions, you need more inhibitory molecules
on the cell surface than in resting conditions. As already assumed in 5.1.3, the
vesicular storage of VISTA enables a fast response and upregulation of surface VISTA
towards immunogenic stimuli. This is a strong coherence to CTLA-4 which is also
transported to the cellular membrane due to immunogenic stimulation (Linsley et al.
1996).
So far, the expression level of VISTA was only measured by flow cytometry on the cell
surface or by RNA level. The fact that most of the VISTA protein is stored in vesicles
which can be released to the surface within a few minutes showed a new dimension of
dynamic in VISTA surface expression. The tumor microenvironment is an inflammatory
environment with many immunogenic stimuli which could have an impact on the
surface expression of VISTA. This fast adaptation is not only affecting the release of
vesicles to the cell surface. Deng et al. (2016) and Liu et al. (2018) also found a rapid
endocytosis of surface VISTA. The storage of VISTA in vesicles enables a rapid
dynamic adaptation of surface VISTA to any kind of environment.
Thus, my observations were consistent with VISTA being rapidly released to the cell
surface in high amounts in response to an immunogenic stimulus, but it might be
endocytosed quickly when VISTA is not needed anymore or blocked by an antibody.
This dynamic change in surface expression need to be considered for all future
expression measurements and dosage calculations of VISTA antibodies. Therefore,
detection of VISTA on the cell surface would only mirror a transient situation and
underestimate its true expression level.
Effect on nuclear VISTA
While the immunogenic stimulus showed a clear activation and effect on the nuclear
expression of VISTA, cell density did not lead to as strong effects. BMDMs only showed
a small difference in activation state between different cell densities. Very high cell
concentrations showed a slightly increased activation but did not lead to a
corresponding higher IL-6 concentration. Very high cell densities led to less nucleus
staining. This could be a hint that the results of more nuclear PD-L1 with missing cell-
cell contact (Satelli et al. 2016a) could be also true for VISTA. But lower cell densities
than normal were not testable due to technical reasons. Also, it is not clear whether
increased and decreased cell densities give opposite results.
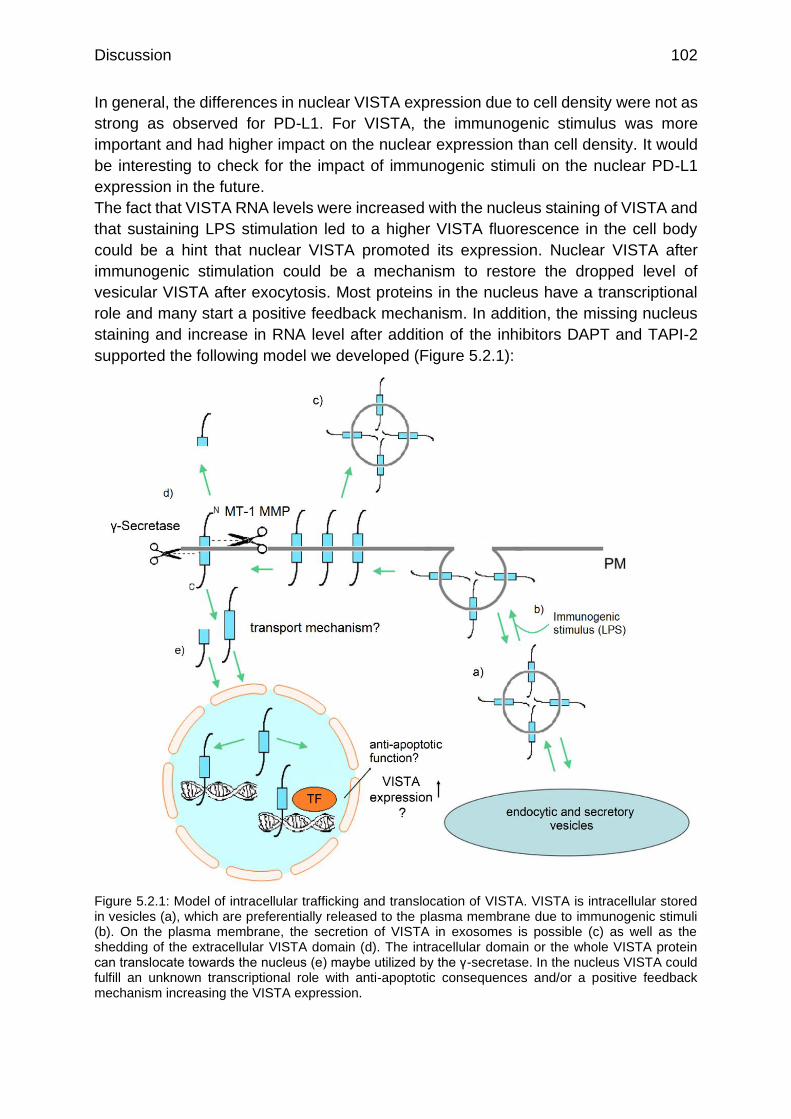
Discussion 102
In general, the differences in nuclear VISTA expression due to cell density were not as
strong as observed for PD-L1. For VISTA, the immunogenic stimulus was more
important and had higher impact on the nuclear expression than cell density. It would
be interesting to check for the impact of immunogenic stimuli on the nuclear PD-L1
expression in the future.
The fact that VISTA RNA levels were increased with the nucleus staining of VISTA and
that sustaining LPS stimulation led to a higher VISTA fluorescence in the cell body
could be a hint that nuclear VISTA promoted its expression. Nuclear VISTA after
immunogenic stimulation could be a mechanism to restore the dropped level of
vesicular VISTA after exocytosis. Most proteins in the nucleus have a transcriptional
role and many start a positive feedback mechanism. In addition, the missing nucleus
staining and increase in RNA level after addition of the inhibitors DAPT and TAPI-2
supported the following model we developed (Figure 5.2.1):
Figure 5.2.1: Model of intracellular trafficking and translocation of VISTA. VISTA is intracellular stored in vesicles (a), which are preferentially released to the plasma membrane due to immunogenic stimuli (b). On the plasma membrane, the secretion of VISTA in exosomes is possible (c) as well as the shedding of the extracellular VISTA domain (d). The intracellular domain or the whole VISTA protein can translocate towards the nucleus (e) maybe utilized by the γ-secretase. In the nucleus VISTA could fulfill an unknown transcriptional role with anti-apoptotic consequences and/or a positive feedback mechanism increasing the VISTA expression.
Discussion 103
I summarized my results regarding the intracellular trafficking and translocation based
on the chapters 4.1.3 and 4.2 in Figure 5.2.1. The storage of VISTA in vesicles (a) is
widely similar to the NCR CTLA-4 (Linsley et al. 1996), which allows a fast reaction to
immunogenic stimuli and a fast regulation of the VISTA surface expression. VISTA
vesicles can adapt the cell surface expression rapidly via endocytosis and exocytosis
with the plasma membrane. Immunogenic stimuli like LPS led to a fast release of
endosomal vesicles containing VISTA (b). VISTA will be brought to the surface leading
to a more diffuse and weaker staining and less VISTA positive vesicles in the
cytoplasm. This displays the fast adaptation of VISTA surface expression via
exocytosis and endocytosis towards the cellular environment, which should be
considered for further expression measurements and dosage calculations.
VISTA can be also released from the plasma membrane in the medium via exosomes
(c). The expression of VISTA in exosomes shows its importance for cell-cell-
communication and would point to a messenger role of VISTA. VISTA signaling via
exosomes symbolizes a new way of immunosuppressive communication in tumor
microenvironment and should be investigated further.
In addition, the extracellular domain of VISTA can be shedded by the MT-1 MMP
releasing it into the medium as a soluble signal molecule (d) (Sakr et al. 2010).
Because of its tendency to build dimers it will quickly bind to a VISTA receptor,
activating the immune inhibitory pathway.
The intracellular domain can probably be cut by the γ-secretase leading to a
translocalization of VISTA into the nucleus (e). Another possibility raising from 5.1.3 is
that the whole protein is cut and transported into the nucleus via nucleus-transporters.
PD-L1 for example also does not contain any classical nucleus import motif, but shows
interaction with nuclear import/export proteins in its interactome (Escors et al. 2018). It
would be important to search for binding partners in the cytoplasm and nucleus to
explore the transport of VISTA into the nucleus. In both possibilities VISTA has an
unknown transcriptional function while interacting with the DNA or transcription factors.
Regarding the increased RNA levels of VISTA one possibility would be a positive
feedback mechanism where VISTA in the nucleus promotes expression of itself. Of
course, it could also be a coincidence of nuclear VISTA expression and increasing
VISTA RNA levels. Adapted from the anti-apoptotic function of PD-L1 in the nucleus
and the high homology of VISTA and PD-L1 one possible transcriptional role of nuclear
VISTA could also be an anti-apoptotic function. The nuclear appearance of VISTA
should be confirmed by independent alternative experimental approaches in the future.
Important next steps would be the identification of interaction partners of VISTA for
nuclear translocation. In addition, it would be interesting to check the levels of the
phosphorylated protein kinase Akt in the nucleus while nuclear VISTA expression. The
PI3K/Akt pathway seems to be involved in the upregulation of nuclear PD-L1 displayed
by increased phosphorylated Akt in the nucleus (Ghebeh et al. 2010; Satelli et al. 2016;
Granier et al. 2017). In addition, it is known that the binding of VISTA receptor also has
an effect on the phosphorylation of downstream molecules like Akt (Liu et al. 2015).
Therefore, to characterize the effects of nuclear VISTA further, it would be important
to quantify the effects on Akt phosphorylation. Additionally, we did not check if the

Discussion 104
exosome level varies due to stimulation. Stimulation led to an increased release of
VISTA vesicles and nuclear VISTA it would be also reasonable if the secretion of
exosomes can also be promoted by immunogenic stimuli.
5.3 Consequences of VISTA overexpression on APCs
The main functional effects of VISTA overexpression were an increased differentiation,
increased adhesion, increased phagocytosis on macrophage and tumor cell side and
less MHC-II expression (chapter 4.1).
VISTA promotes the differentiation of stem cells via the BMP-4 pathway. In addition,
the only identified ligand of VISTA so far is VSIG-3 an adhesion protein. It is
responsible for homophilic, calcium-independent adhesion (Yang et al. 2017; Wang et
al. 2019). It seems to be reasonable that overexpression of VISTA showed increased
adhesion and differentiation. Both can also support each other. With increased
adhesion, the celllines will more likely differentiate into macrophages and a higher
differentiation into macrophages leads to a stronger adhesion.
The increased adhesion could also have an impact on phagocytosis. To perform
phagocytosis, target cells first need to attach to the phagocytes. With increased
adhesion and cell clustering, more tumor cells will attach to the phagocytes, promoting
the phagocytosis.
For phagocytes with VISTA overexpression I saw a higher increase in phagocytosis
than for VISTA overexpression on tumor cells. Beside the promoted cell-cell contact
the increased differentiation was probably also one aspect. The celllines only
differentiated into “macrophage-like” phagocytes. With the increased differentiation
due to VISTA overexpression the cells were probably closer to real macrophages with
a higher phagocytosis capacity. The aspects adhesion and differentiation definitely had
an impact on phagocytosis of VISTA overexpressing phagocytes.
In addition, the phagocytosis of primary macrophages, engulfing tumor cells with
VISTA overexpression was also increased. I conclude that VISTA overexpression also
increased phagocytosis itself, not only because of increased differentiation. The
primary macrophages were fully differentiated independently of VISTA overexpression.
These results confirmed the publication by Yoon et al. (2015) where they observed that
VISTA knockout (k/o) cells showed less phagocytosis on the macrophage and tumor
cell side. My results were the first independent test of these results by performing the
experiments the other way around. Instead of using k/o of VISTA, we used VISTA
overexpressing cells. The fact that our results were in agreement with each other
strengthens the validity.
Surprisingly, we didn’t see the expected differences between different macrophage
types. We would expect the highest phagocytosis of the M1 macrophages with pro-
inflammatory, bactericidal and phagocytic functions (Hesketh et al. 2017). In
comparison to that, M2 macrophages have primarily constructive functions with wound
healing and tissue repair. They are able to turn off the immune system activation by
secretion of IL-10 and TGF-β. That’s why tumor-associated macrophages have mainly
M2 phenotype and promote the tumor growth (Galdiero et al. 2013). Somehow these

Discussion 105
expected differences are not observable in our in vitro system. This issue is already
known from former experiments in other groups (personal communication with
Experimental Hematology, UMCG).
The Experimental Hematology identified MHC-II as a possible and unknown binding
partner of VISTA and my results demonstrated that VISTA overexpression led to less
MHC-II surface expression. These findings link how VISTA can be immunoinhibitory
but still lead to increased phagocytosis. With more phagocytosis you would expect
more antigen presentation and a higher stimulation of the immune system. But if VISTA
expression led to less MHC-II expression, there were less complexes available to
present antigens. VISTA led to an increased phagocytosis and an increased clearance
of tumor cells or pathogens, but less presentation of their antigens toward T-cells.
Therefore, the cells and pathogens got cleared but with less stimulation of the immune
system. In addition, the GFP pull-out showed that VISTA was able to bind MHC-II as
an interaction partner (Experimental Hematology, UMCG). Binding of MHC-II cluster
on other cells would block them that the antigens could not be presented to T-cells,
inhibiting the T-cell activation.
This would be similar to the immune checkpoint receptor Lymphocyte-Activation Gene-
3 (LAG-3). The main binding partner of LAG-3 is MHC-II preventing the binding of
MHC-II to CD4 and therefore affecting the proliferation, activation and homeostasis of
T-cells negatively, like PD-1 or CTLA-4. The LAG-3 MHC-II interaction is discussed as
target for immune therapy for MHC-II positive cancer like melanoma (Hemon et al.
2011). The effect of VISTA on MHC-II can also be observed in VISTA deficient myeloid
cells. VISTA deficiency promotes their activation leading to upregulation of
costimulatory molecules like CD80, CD40 and MHC-II (Ceeraz et al. 2017). Similar
effects are observable by VISTA antibody treatment. The VISTA antibody activates
tumor-associated myeloid DCs by upregulation of CD80 and MHC-II (Le Mercier et al.
2014; Wang et al. 2018). This confirms our findings and supports the importance of
further investigations on this immunoinhibitory axis.
Another ligand, which was identified by Yeast-two-hybrid screening and proposed by
the interaction network modeling via STRING network, is Smad3 (Szklarczyk et al.
2019).
My results did not show any correlation between VISTA overexpression and RNA level
of Smad3, only differences between the cell types. That is a hint that Smad3 is no
transcriptional target of VISTA and that Smad3 expression is independent from VISTA
expression. We did not test if VISTA expression was dependent on Smad3 expression.
Of course, they could still be interaction partner with independent expression.
To get more insight about the possible signaling pathways by VISTA I summarized all
publications about VISTA regarding possible dependencies (Figure 5.3.1):

Discussion 106
Figure 5.3.1: Overview about all published interaction partners, dependencies and signaling pathways so far. References addressing each pathway are in the main text.
VISTA is a direct transcriptional target of p53, which is similar to PD-1 and PD-L1 that
also show increased expression induced by p53 (Yoon et al. 2015). Increased VISTA
expression induced by p53 leads to a homophilic interaction of VISTA on macrophages
and tumor cells which induces increased phagocytosis and clearance of VISTA-
positive tumor cells (Yoon et al. 2015). My results confirmed the increased
phagocytosis by VISTA overexpression (chapter 4.3.3 and 4.3.4).
VISTA leads to a BMP pathway dependent and independent stem cell differentiation
in embryonic development (Oliveira et al. 2016) which is activated by TGFβ-1. My
results also confirmed that VISTA promotes differentiation (chapter 4.1.2 and 4.3.1).
The transcriptional regulator Id2 is a downstream target of the BMP pathway and
follows the VISTA expression in a EMT mouse model where it enhances migration and
invasiveness (Coma et al. 2010; Li et al. 2012). Id2 is also higher expressed on more
differentiated celllines and macrophages and seem to promote differentiation (Ishiguro
et al. 1996). This is supported by my results where PMA differentiation led to higher
Id2 levels which increased for THP-1 cells further with VISTA overexpression and a
stronger differentiation (chapter 4.3.5). Id2 is induced by Signal Transducer and
Activator of Transcription 5 (Stat5) which could be downregulated by VISTA. A VISTA
knockout leads to more activated Stat5 (Li et al. 2012). Interestingly, Stat5 regulates
Discussion 107
the PI3K/Akt pathway which is impaired after binding of the VISTA receptor on T-cells
(Liu et al. 2015).
Stat5 also induces the expression of the transcription factor Pu.1, which activates
genes for myeloid cell development (Li et al. 2012). Pu.1 is in addition discussed as a
potential regulator of the VISTA expression (Borggrewe et al. 2018) but not proved yet.
Also hypoxia seem to promote VISTA expression (Deng et al. 2019). This is also
observable for the VISTA homologue PD-L1 which is upregulated by HIF-α in the
hypoxic tumor microenvironment (TME) (Noman et al. 2014).
The three confirmed or proposed binding partner of VISTA are VSIG-3, Smad3 and
MHC-II. VSIG-3 and Smad3 are responsible for the adhesion of cells displaying the
important impact of VISTA on adhesion. My results confirmed an increased adhesion
with higher VISTA expression (chapter 4.3.1, 4.3.2 and 4.3.3). In addition, (Sakr et al.
2010) also found enhanced adhesion to fibronectin due to VISTA.
The binding of MHC-II (chapter 4.3.5) led to less antigen presentation, which is highly
similar to the immune checkpoint receptor LAG-3 as already explained.
In summary we can conclude that our results provided new and supporting properties
of VISTA which complement the interaction network of VISTA. With more insight on
the interaction partners and signaling pathways of VISTA, a sufficient characterization
of VISTA for future therapy is possible.
5.4 Future perspectives
We can conclude that VISTA has a much more complex function than described so
far. Former publications described VISTA either as a differentiation protein or a
classical negative checkpoint regulator with additional expression on Antigen
Presenting Cells (APCs). My results showed that VISTA is affecting adhesion,
differentiation, phagocytosis and the immune function of APCs. In addition, VISTA is
not exclusively expressed on the plasma membrane as described so far. It has a
unique expression pattern with storage in vesicles, translocalization to the nucleus with
unknown transcriptional function and is a signal molecule as shedded IgV-VISTA
molecule in the medium as well as in exosomes. All these results display its important
role on APCs which is investigated poorly yet. But the new characteristics discovered
in this thesis, revealed unexpected similarities to other immune checkpoint molecules
which complete the properties of VISTA published so far.
For the future therapy approach it is important to further investigate the VISTA
expression on more tumor types. In addition, the VSIG-3 expression should be
investigated to consider an immune therapy against the VISTA-VSIG-3 axis. VSIG-3
is upregulated in intestinal gastric cancer, colorectal cancer and hepatocellular
carcinoma, displaying promising new targets for immunotherapy of this axis (Marin-
Acevedo et al. 2018; Wang et al. 2019).
The second promising approach revealed in this thesis is the VISTA-MHC-II
interaction. Interesting questions for further research would be: Is VISTA responsible
for decreased antigen presentation? Can the VISTA-MHC-II interaction be prevented

Discussion 108
by an anti-VISTA antibody? Are MHC-II positive tumors like melanoma promising
targets for immunotherapy against the VISTA-MHC-II axis?
One additional aspect of VISTA binding MHC-II could be the possibility of overcoming
resistance of PD-1 therapy. One possible resistance mechanism against PD-1 therapy
is the downregulation of HLA-associated antigen presentation (Dempke et al. 2017;
Kakavand et al. 2017). Human leukocyte antigen gene complexes (HLAs) encode the
MHC classes I and II. If the blocking of VISTA prevents the downregulation of MHC-II
mediated antigen presentation, the combinatorial therapy of VISTA and PD-1 would
be able to overcome this resistance.
To use VISTA as a safe and efficient therapy in the future, it is important to further
investigate its role on all immune cells, to identify the signaling pathways VISTA
activates and its interaction partners. For dosage calculation, the storage of VISTA in
vesicles should be considered as well as its adapted expression pattern towards
immunogenic stimuli. To understand the function of VISTA, its transcriptional role
should also be investigated before applying VISTA therapy on patients. In addition, the
amounts of shedded VISTA IgV domain and the release of VISTA in exosomes need
to be investigated in the tumor microenvironment. These extracellular VISTA signals
display a new dimension of communication via VISTA in the tumor microenvironment
which need to be considered for a VISTA therapy in the future.
The results of this thesis support the approach of VISTA being a promising new target
for immune therapy against cancer. Especially in combination with PD-1 or PD-L1,
VISTA could be able to solve some of the occurring resistance and response rate
issues.
References 109
6 References
1. Agarwala, Sanjiv S. (2015): Practical Approaches to Immunotherapy in the Clinic. In: Seminars in oncology 42 Suppl 3, S20-7. DOI: 10.1053/j.seminoncol.2015.10.001.
2. Agata, Y.; Kawasaki, A.; Nishimura, H.; Ishida, Y.; Tsubata, T.; Yagita, H.; Honjo, T. (1996): Expression of the PD-1 antigen on the surface of stimulated mouse T and B lymphocytes. In: International immunology 8 (5), S. 765–772. DOI: 10.1093/intimm/8.5.765.
3. Alatrash, Gheath; Jakher, Haroon; Stafford, Patricia D.; Mittendorf, Elizabeth A. (2013): Cancer immunotherapies, their safety and toxicity. In: Expert opinion on drug safety 12 (5), S. 631–645. DOI: 10.1517/14740338.2013.795944.
4. Baksh, Kathryn; Weber, Jeffrey (2015): Immune checkpoint protein inhibition for cancer. Preclinical justification for CTLA-4 and PD-1 blockade and new combinations. In: Seminars in oncology 42 (3), S. 363–377. DOI: 10.1053/j.seminoncol.2015.02.015.
5. Bartlett, John M. S.; Stirling, David (2003): A short history of the polymerase chain reaction. In: Methods in molecular biology (Clifton, N.J.) 226, S. 3–6. DOI: 10.1385/1-59259-384-4:3.
6. Berg, Jeremy M.; Tymoczko, John L.; Stryer, Lubert; Häcker, Bärbel (2011): Biochemie. Korr. Nachdr. der 6. Aufl. Heidelberg: Spektrum Akad. Verl. Online verfügbar unter http://deposit.d-nb.de/cgi-bin/dokserv?id=2922186&prov=M&dok_var=1&dok_ext=htm.
7. Blando, Jorge; Sharma, Anu; Higa, Maria Gisela; Zhao, Hao; Vence, Luis; Yadav, Shalini S. et al. (2019): Comparison of immune infiltrates in melanoma and pancreatic cancer highlights VISTA as a potential target in pancreatic cancer. In: Proceedings of the National Academy of Sciences of the United States of America 116 (5), S. 1692–1697. DOI: 10.1073/pnas.1811067116.
8. Blank, Christian U.; Haanen, John B.; Ribas, Antoni; Schumacher, Ton N. (2016): CANCER IMMUNOLOGY. The "cancer immunogram". In: Science (New York, N.Y.) 352 (6286), S. 658–660. DOI: 10.1126/science.aaf2834.
9. Böger, Christine; Behrens, Hans-Michael; Krüger, Sandra; Röcken, Christoph (2017): The novel negative checkpoint regulator VISTA is expressed in gastric carcinoma and associated with PD-L1/PD-1. A future perspective for a combined gastric cancer therapy? In: Oncoimmunology 6 (4), e1293215. DOI: 10.1080/2162402X.2017.1293215.
10. Bonifant, Challice L.; Jackson, Hollie J.; Brentjens, Renier J.; Curran, Kevin J. (2016): Toxicity and management in CAR T-cell therapy. In: Molecular therapy oncolytics 3, S. 16011. DOI: 10.1038/mto.2016.11.
11. Borggrewe, Malte; Grit, Corien; Den Dunnen, Wilfred F. A.; Burm, Saskia M.; Bajramovic, Jeffrey J.; Noelle, Randolph J. et al. (2018): VISTA expression by microglia decreases during inflammation and is differentially regulated in CNS diseases. In: Glia 66 (12), S. 2645–2658. DOI: 10.1002/glia.23517.
12. Bradford, M. M. (1976): A rapid and sensitive method for the quantitation of microgram quantities of protein utilizing the principle of protein-dye binding. In: Analytical biochemistry 72, S. 248–254. DOI: 10.1006/abio.1976.9999.
13. Callahan, Margaret K.; Wolchok, Jedd D. (2013): At the bedside. CTLA-4- and PD-1-blocking antibodies in cancer immunotherapy. In: Journal of leukocyte biology 94 (1), S. 41–53. DOI: 10.1189/jlb.1212631.
14. Cameron, Fiona; Whiteside, Glenn; Perry, Caroline (2011): Ipilimumab. First global approval. In: Drugs 71 (8), S. 1093–1104. DOI: 10.2165/11594010-000000000-00000.
15. Ceeraz, Sabrina; Sergent, Petra A.; Plummer, Sean F.; Schned, Alan R.; Pechenick, Dov; Burns, Christopher M.; Noelle, Randolph J. (2017): VISTA Deficiency Accelerates the

References 110
Development of Fatal Murine Lupus Nephritis. In: Arthritis & rheumatology (Hoboken, N.J.) 69 (4), S. 814–825. DOI: 10.1002/art.40020.
16. CHAFFEY, N. et al. (2003): Molecular biology of the cell. 4th edn. In: Annals of Botany 91 (3), S. 401. DOI: 10.1093/aob/mcg023.
17. Chang, M. H.; Chen, C. J.; Lai, M. S.; Hsu, H. M.; Wu, T. C.; Kong, M. S. et al. (1997): Universal hepatitis B vaccination in Taiwan and the incidence of hepatocellular carcinoma in children. Taiwan Childhood Hepatoma Study Group. In: The New England journal of medicine 336 (26), S. 1855–1859. DOI: 10.1056/NEJM199706263362602.
18. Chen, Daniel S.; Mellman, Ira (2013): Oncology meets immunology. The cancer-immunity cycle. In: Immunity 39 (1), S. 1–10. DOI: 10.1016/j.immuni.2013.07.012.
19. Coma, Silvia; Amin, Dhara N.; Shimizu, Akio; Lasorella, Anna; Iavarone, Antonio; Klagsbrun, Michael (2010): Id2 promotes tumor cell migration and invasion through transcriptional repression of semaphorin 3F. In: Cancer research 70 (9), S. 3823–3832. DOI: 10.1158/0008-5472.CAN-09-3048.
20. Dankort, David; Curley, David P.; Cartlidge, Robert A.; Nelson, Betsy; Karnezis, Anthony N.; Damsky, William E. et al. (2009): Braf(V600E) cooperates with Pten loss to induce metastatic melanoma. In: Nature genetics 41 (5), S. 544–552. DOI: 10.1038/ng.356.
21. Dempke, Wolfram C. M.; Fenchel, Klaus; Uciechowski, Peter; Dale, Stephen P. (2017): Second- and third-generation drugs for immuno-oncology treatment-The more the better? In: European journal of cancer (Oxford, England : 1990) 74, S. 55–72. DOI: 10.1016/j.ejca.2017.01.001.
22. Deng, Jie; Le Mercier, Isabelle; Kuta, Anna; Noelle, Randolph J. (2016): A New VISTA on combination therapy for negative checkpoint regulator blockade. In: Journal for immunotherapy of cancer 4, S. 86. DOI: 10.1186/s40425-016-0190-5.
23. Deng, Jie; Li, Jiannan; Sarde, Aurelien; Lines, J. Louise; Lee, Yu-Chi; Qian, David C. et al. (2019): Hypoxia-Induced VISTA Promotes the Suppressive Function of Myeloid-Derived Suppressor Cells in the Tumor Microenvironment. In: Cancer immunology research 7 (7), S. 1079–1090. DOI: 10.1158/2326-6066.CIR-18-0507.
24. Duluc, Dorothée; Delneste, Yves; Tan, Fang; Moles, Marie-Pierre; Grimaud, Linda; Lenoir, Julien et al. (2007): Tumor-associated leukemia inhibitory factor and IL-6 skew monocyte differentiation into tumor-associated macrophage-like cells. In: Blood 110 (13), S. 4319–4330. DOI: 10.1182/blood-2007-02-072587.
25. Edwards, Jarem; Tasker, Annie; Pires da Silva, Inês; Quek, Camelia; Batten, Marcel; Ferguson, Angela et al. (2019): Prevalence and Cellular Distribution of Novel Immune Checkpoint Targets Across Longitudinal Specimens in Treatment-naïve Melanoma Patients. Implications for Clinical Trials. In: Clinical cancer research : an official journal of the American Association for Cancer Research 25 (11), S. 3247–3258. DOI: 10.1158/1078-0432.CCR-18-4011.
26. Elad, Nadav; Strooper, Bart de; Lismont, Sam; Hagen, Wim; Veugelen, Sarah; Arimon, Muriel et al. (2015): The dynamic conformational landscape of gamma-secretase. In: Journal of cell science 128 (3), S. 589–598. DOI: 10.1242/jcs.164384.
27. ElTanbouly, Mohamed A.; Croteau, Walburga; Noelle, Randolph J.; Lines, J. Louise (2019): VISTA. A novel immunotherapy target for normalizing innate and adaptive immunity. In: Seminars in immunology 42, S. 101308. DOI: 10.1016/j.smim.2019.101308.
28. Escors, David; Gato-Cañas, María; Zuazo, Miren; Arasanz, Hugo; García-Granda, María Jesus; Vera, Ruth; Kochan, Grazyna (2018): The intracellular signalosome of PD-L1 in cancer cells. In: Signal transduction and targeted therapy 3, S. 26. DOI: 10.1038/s41392-018-0022-9.
References 111
29. Eshhar, Z.; Waks, T.; Gross, G.; Schindler, D. G. (1993): Specific activation and targeting of cytotoxic lymphocytes through chimeric single chains consisting of antibody-binding domains and the gamma or zeta subunits of the immunoglobulin and T-cell receptors. In: Proceedings of the National Academy of Sciences of the United States of America 90 (2), S. 720–724. DOI: 10.1073/pnas.90.2.720.
30. Flies, Dallas B.; Han, Xue; Higuchi, Tomoe; Zheng, Linghua; Sun, Jingwei; Ye, Jessica Jane; Chen, Lieping (2014): Coinhibitory receptor PD-1H preferentially suppresses CD4⁺ T cell-mediated immunity. In: The Journal of clinical investigation 124 (5), S. 1966–1975. DOI: 10.1172/JCI74589.
31. Flies, Dallas B.; Higuchi, Tomoe; Chen, Lieping (2015): Mechanistic Assessment of PD-1H Coinhibitory Receptor-Induced T Cell Tolerance to Allogeneic Antigens. In: Journal of immunology (Baltimore, Md. : 1950) 194 (11), S. 5294–5304. DOI: 10.4049/jimmunol.1402648.
32. Flies, Dallas B.; Wang, Shengdian; Xu, Haiying; Chen, Lieping (2011): Cutting edge. A monoclonal antibody specific for the programmed death-1 homolog prevents graft-versus-host disease in mouse models. In: Journal of immunology (Baltimore, Md. : 1950) 187 (4), S. 1537–1541. DOI: 10.4049/jimmunol.1100660.
33. Freeman, G. J.; Long, A. J.; Iwai, Y.; Bourque, K.; Chernova, T.; Nishimura, H. et al. (2000): Engagement of the PD-1 immunoinhibitory receptor by a novel B7 family member leads to negative regulation of lymphocyte activation. In: The Journal of experimental medicine 192 (7), S. 1027–1034. DOI: 10.1084/jem.192.7.1027.
34. G. van Rossum (1995): Python tutorial. Technical Report CS-R9526.
35. Galdiero, Maria R.; Garlanda, Cecilia; Jaillon, Sébastien; Marone, Gianni; Mantovani, Alberto (2013): Tumor associated macrophages and neutrophils in tumor progression. In: Journal of cellular physiology 228 (7), S. 1404–1412. DOI: 10.1002/jcp.24260.
36. Gao, Jianjun; Ward, John F.; Pettaway, Curtis A.; Shi, Lewis Z.; Subudhi, Sumit K.; Vence, Luis M. et al. (2017): VISTA is an inhibitory immune checkpoint that is increased after ipilimumab therapy in patients with prostate cancer. In: Nature medicine 23 (5), S. 551–555. DOI: 10.1038/nm.4308.
37. Ghebeh, Hazem; Lehe, Cynthia; Barhoush, Eman; Al-Romaih, Khaldoon; Tulbah, Asma; Al-Alwan, Monther et al. (2010): Doxorubicin downregulates cell surface B7-H1 expression and upregulates its nuclear expression in breast cancer cells. Role of B7-H1 as an anti-apoptotic molecule. In: Breast cancer research : BCR 12 (4), R48. DOI: 10.1186/bcr2605.
38. Giarelli, Ellen (2007): Cancer vaccines. A new frontier in prevention and treatment. In: Oncology (Williston Park, N.Y.) 21 (11 Suppl Nurse Ed), 11-7; discussion 18.
39. Gonelle-Gispert et al. (2000): SNAP-25 in insulin-secreting cells.
40. Granier, Clemence; Guillebon, Eleonore de; Blanc, Charlotte; Roussel, Helene; Badoual, Cecile; Colin, Elia et al. (2017): Mechanisms of action and rationale for the use of checkpoint inhibitors in cancer. In: ESMO open 2 (2), e000213. DOI: 10.1136/esmoopen-2017-000213.
41. Hanahan; Weinberg (2011): Hallmarks of Cancer: The next Generation. In: Cell (144), S. 646–674.
42. Hartmann, Jessica; Schüßler-Lenz, Martina; Bondanza, Attilio; Buchholz, Christian J. (2017): Clinical development of CAR T cells-challenges and opportunities in translating innovative treatment concepts. In: EMBO molecular medicine 9 (9), S. 1183–1197. DOI: 10.15252/emmm.201607485.

References 112
43. Harvey, R. D. (2014): Immunologic and clinical effects of targeting PD-1 in lung cancer. In: Clinical pharmacology and therapeutics 96 (2), S. 214–223. DOI: 10.1038/clpt.2014.74.
44. Helleday, Thomas; Petermann, Eva; Lundin, Cecilia; Hodgson, Ben; Sharma, Ricky A. (2008): DNA repair pathways as targets for cancer therapy. In: Nature reviews. Cancer 8 (3), S. 193–204. DOI: 10.1038/nrc2342.
45. Hemon, Patrice; Jean-Louis, Francette; Ramgolam, Kiran; Brignone, Chrystelle; Viguier, Manuelle; Bachelez, Hervé et al. (2011): MHC class II engagement by its ligand LAG-3 (CD223) contributes to melanoma resistance to apoptosis. In: Journal of immunology (Baltimore, Md. : 1950) 186 (9), S. 5173–5183. DOI: 10.4049/jimmunol.1002050.
46. Hesketh, Mark; Sahin, Katherine B.; West, Zoe E.; Murray, Rachael Z. (2017): Macrophage Phenotypes Regulate Scar Formation and Chronic Wound Healing. In: International journal of molecular sciences 18 (7). DOI: 10.3390/ijms18071545.
47. Hodi, F. Stephen; O'Day, Steven J.; McDermott, David F.; Weber, Robert W.; Sosman, Jeffrey A.; Haanen, John B. et al. (2010): Improved survival with ipilimumab in patients with metastatic melanoma. In: The New England journal of medicine 363 (8), S. 711–723. DOI: 10.1056/NEJMoa1003466.
48. Hong, Shanjuan; Yuan, Qing; Xia, Haizhui; Zhu, Genzhen; Feng, Yu; Wang, Qiang et al. (2019): Analysis of VISTA expression and function in renal cell carcinoma highlights VISTA as a potential target for immunotherapy. In: Protein & cell. DOI: 10.1007/s13238-019-0642-z.
49. Ishida, Y.; Agata, Y.; Shibahara, K.; Honjo, T. (1992): Induced expression of PD-1, a novel member of the immunoglobulin gene superfamily, upon programmed cell death. In: The EMBO journal 11 (11), S. 3887–3895.
50. Ishiguro et al. (1996): Id2 Expression increases wirh differentiation of human myeloid cells. In: Blood Vol 87 (No 12), S. 5225–5231.
51. Iwai, Yoshiko; Ishida, Masayoshi; Tanaka, Yoshimasa; Okazaki, Taku; Honjo, Tasuku; Minato, Nagahiro (2002): Involvement of PD-L1 on tumor cells in the escape from host immune system and tumor immunotherapy by PD-L1 blockade. In: Proceedings of the National Academy of Sciences of the United States of America 99 (19), S. 12293–12297. DOI: 10.1073/pnas.192461099.
52. Iwai, Yoshiko; Terawaki, Seigo; Honjo, Tasuku (2005): PD-1 blockade inhibits hematogenous spread of poorly immunogenic tumor cells by enhanced recruitment of effector T cells. In: International immunology 17 (2), S. 133–144. DOI: 10.1093/intimm/dxh194.
53. Kakavand, Hojabr; Jackett, Louise A.; Menzies, Alexander M.; Gide, Tuba N.; Carlino, Matteo S.; Saw, Robyn P. M. et al. (2017): Negative immune checkpoint regulation by VISTA. A mechanism of acquired resistance to anti-PD-1 therapy in metastatic melanoma patients. In: Modern pathology : an official journal of the United States and Canadian Academy of Pathology, Inc 30 (12), S. 1666–1676. DOI: 10.1038/modpathol.2017.89.
54. Kanungo, Jyotshnabala; Zheng, Ya-Li; Amin, Niranjana D.; Pant, Harish C. (2008): The Notch signaling inhibitor DAPT down-regulates cdk5 activity and modulates the distribution of neuronal cytoskeletal proteins. In: Journal of neurochemistry 106 (5), S. 2236–2248. DOI: 10.1111/j.1471-4159.2008.05551.x.
55. Keir, Mary E.; Butte, Manish J.; Freeman, Gordon J.; Sharpe, Arlene H. (2008): PD-1 and its ligands in tolerance and immunity. In: Annual review of immunology 26, S. 677–704. DOI: 10.1146/annurev.immunol.26.021607.090331.
56. Khoja, Leila; Butler, Marcus O.; Kang, S. Peter; Ebbinghaus, Scot; Joshua, Anthony M. (2015): Pembrolizumab. In: Journal for immunotherapy of cancer 3, S. 36. DOI: 10.1186/s40425-015-0078-9.
References 113
57. Kinter, Audrey L.; Godbout, Emily J.; McNally, Jonathan P.; Sereti, Irini; Roby, Gregg A.; O'Shea, Marie A.; Fauci, Anthony S. (2008): The common gamma-chain cytokines IL-2, IL-7, IL-15, and IL-21 induce the expression of programmed death-1 and its ligands. In: Journal of immunology (Baltimore, Md. : 1950) 181 (10), S. 6738–6746. DOI: 10.4049/jimmunol.181.10.6738.
58. Kirkwood, John M.; Lorigan, Paul; Hersey, Peter; Hauschild, Axel; Robert, Caroline; McDermott, David et al. (2010): Phase II trial of tremelimumab (CP-675,206) in patients with advanced refractory or relapsed melanoma. In: Clinical cancer research : an official journal of the American Association for Cancer Research 16 (3), S. 1042–1048. DOI: 10.1158/1078-0432.CCR-09-2033.
59. Kondo, Yuta; Ohno, Tatsukuni; Nishii, Naoto; Harada, Kiyoshi; Yagita, Hideo; Azuma, Miyuki (2016): Differential contribution of three immune checkpoint (VISTA, CTLA-4, PD-1) pathways to antitumor responses against squamous cell carcinoma. In: Oral oncology 57, S. 54–60. DOI: 10.1016/j.oraloncology.2016.04.005.
60. Laemmli, U. K. (1970): Cleavage of structural proteins during the assembly of the head of bacteriophage T4. In: Nature 227 (5259), S. 680–685. DOI: 10.1038/227680a0.
61. Le Mercier, Isabelle; Chen, Wenna; Lines, Janet L.; Day, Maria; Li, Jiannan; Sergent, Petra et al. (2014): VISTA Regulates the Development of Protective Antitumor Immunity. In: Cancer research 74 (7), S. 1933–1944. DOI: 10.1158/0008-5472.CAN-13-1506.
62. Li, Haiyan S.; Yang, Cliff Y.; Nallaparaju, Kalyan C.; Zhang, Huiyuan; Liu, Yong-Jun; Goldrath, Ananda W.; Watowich, Stephanie S. (2012): The signal transducers STAT5 and STAT3 control expression of Id2 and E2-2 during dendritic cell development. In: Blood 120 (22), S. 4363–4373. DOI: 10.1182/blood-2012-07-441311.
63. Li, Na; Xu, Wenwen; Yuan, Ying; Ayithan, Natarajan; Imai, Yasutomo; Wu, Xuesong et al. (2017): Immune-checkpoint protein VISTA critically regulates the IL-23/IL-17 inflammatory axis. In: Scientific reports 7 (1), S. 1485. DOI: 10.1038/s41598-017-01411-1.
64. Lines, J. Louise; Pantazi, Eirini; Mak, Justin; Sempere, Lorenzo F.; Wang, Li; O'Connell, Samuel et al. (2014a): VISTA is an immune checkpoint molecule for human T cells. In: Cancer research 74 (7), S. 1924–1932. DOI: 10.1158/0008-5472.CAN-13-1504.
65. Lines, J. Louise; Sempere, Lorenzo F.; Broughton, Thomas; Wang, Li; Noelle, Randolph (2014b): VISTA is a novel broad-spectrum negative checkpoint regulator for cancer immunotherapy. In: Cancer immunology research 2 (6), S. 510–517. DOI: 10.1158/2326-6066.CIR-14-0072.
66. Linsley et al. (1996a): Intracellular Trafficking of CTLA-4 and Focal Localization Towards Sites of TCR Engagement. In: Immunity (Vol 4), S. 535–543.
67. Linsley et al. (1996b): Intracellular Trafficking of CTLA-4 and Focal Localization Towards Sites of TCR Engagement. In: Immunity (Vol. 4), S. 535–543.
68. Liu, Jinʼe; Xie, Xiaoxue; Xuan, Chunxiao; Li, Tingting; Wang, Lanlan; Teng, Lianghong; Liu, Jun (2018): High-Density Infiltration of V-domain Immunoglobulin Suppressor of T-cell Activation Up-regulated Immune Cells in Human Pancreatic Cancer. In: Pancreas 47 (6), S. 725–731. DOI: 10.1097/MPA.0000000000001059.
69. Liu, Jun; Yuan, Ying; Chen, Wenna; Putra, Juan; Suriawinata, Arief A.; Schenk, Austin D. et al. (2015): Immune-checkpoint proteins VISTA and PD-1 nonredundantly regulate murine T-cell responses. In: Proceedings of the National Academy of Sciences of the United States of America 112 (21), S. 6682–6687. DOI: 10.1073/pnas.1420370112.
70. Liu, Phillip C. C.; Liu, Xiangdong; Li, Yanlong; Covington, Maryanne; Wynn, Richard; Huber, Reid et al. (2006): Identification of ADAM10 as a major source of HER2 ectodomain sheddase activity in HER2 overexpressing breast cancer cells. In: Cancer biology & therapy 5 (6), S. 657–664. DOI: 10.4161/cbt.5.6.2708.
References 114
71. Livak, K. J.; Schmittgen, T. D. (2001): Analysis of relative gene expression data using real-time quantitative PCR and the 2(-Delta Delta C(T)) Method. In: Methods (San Diego, Calif.) 25 (4), S. 402–408. DOI: 10.1006/meth.2001.1262.
72. Loeser, Heike; Kraemer, Max; Gebauer, Florian; Bruns, Christiane; Schröder, Wolfgang; Zander, Thomas et al. (2019): The expression of the immune checkpoint regulator VISTA correlates with improved overall survival in pT1/2 tumor stages in esophageal adenocarcinoma. In: Oncoimmunology 8 (5), e1581546. DOI: 10.1080/2162402X.2019.1581546.
73. Makita, Shinichi; Yoshimura, Kiyoshi; Tobinai, Kensei (2017): Clinical development of anti-CD19 chimeric antigen receptor T-cell therapy for B-cell non-Hodgkin lymphoma. In: Cancer science 108 (6), S. 1109–1118. DOI: 10.1111/cas.13239.
74. Marelli, Giulia; Howells, Anwen; Lemoine, Nicholas R.; Wang, Yaohe (2018): Oncolytic Viral Therapy and the Immune System. A Double-Edged Sword Against Cancer. In: Frontiers in immunology 9, S. 866. DOI: 10.3389/fimmu.2018.00866.
75. Marin-Acevedo, Julian A.; Dholaria, Bhagirathbhai; Soyano, Aixa E.; Knutson, Keith L.; Chumsri, Saranya; Lou, Yanyan (2018): Next generation of immune checkpoint therapy in cancer. New developments and challenges. In: Journal of hematology & oncology 11 (1), S. 39. DOI: 10.1186/s13045-018-0582-8.
76. Mehta, Nishant; Maddineni, Sainiteesh; Mathews, Irimpan I.; Andres Parra Sperberg, R.; Huang, Po-Ssu; Cochran, Jennifer R. (2019): Structure and Functional Binding Epitope of V-domain Ig Suppressor of T Cell Activation. In: Cell reports 28 (10), 2509-2516.e5. DOI: 10.1016/j.celrep.2019.07.073.
77. Monjazeb, Arta M.; Hsiao, Hui-Hua; Sckisel, Gail D.; Murphy, William J. (2012): The role of antigen-specific and non-specific immunotherapy in the treatment of cancer. In: Journal of immunotoxicology 9 (3), S. 248–258. DOI: 10.3109/1547691X.2012.685527.
78. Mulati, Kumuluzi; Hamanishi, Junzo; Matsumura, Noriomi; Chamoto, Kenji; Mise, Nathan; Abiko, Kaoru et al. (2019): VISTA expressed in tumour cells regulates T cell function. In: British journal of cancer 120 (1), S. 115–127. DOI: 10.1038/s41416-018-0313-5.
79. Muller, Stephanie; Victoria Lai, W.; Adusumilli, Prasad S.; Desmeules, Patrice; Frosina, Denise; Jungbluth, Achim et al. (2019): V-domain Ig-containing suppressor of T-cell activation (VISTA), a potentially targetable immune checkpoint molecule, is highly expressed in epithelioid malignant pleural mesothelioma. In: Modern pathology : an official journal of the United States and Canadian Academy of Pathology, Inc. DOI: 10.1038/s41379-019-0364-z.
80. Nishimura, H.; Nose, M.; Hiai, H.; Minato, N.; Honjo, T. (1999): Development of lupus-like autoimmune diseases by disruption of the PD-1 gene encoding an ITIM motif-carrying immunoreceptor. In: Immunity 11 (2), S. 141–151. DOI: 10.1016/s1074-7613(00)80089-8.
81. Nishimura, H.; Okazaki, T.; Tanaka, Y.; Nakatani, K.; Hara, M.; Matsumori, A. et al. (2001): Autoimmune dilated cardiomyopathy in PD-1 receptor-deficient mice. In: Science (New York, N.Y.) 291 (5502), S. 319–322. DOI: 10.1126/science.291.5502.319.
82. Nishino, Mizuki; Ramaiya, Nikhil H.; Hatabu, Hiroto; Hodi, F. Stephen (2017): Monitoring immune-checkpoint blockade. Response evaluation and biomarker development. In: Nature reviews. Clinical oncology 14 (11), S. 655–668. DOI: 10.1038/nrclinonc.2017.88.
83. Nishioka, M.; Mizuguchi, H.; Fujiwara, S.; Komatsubara, S.; Kitabayashi, M.; Uemura, H. et al. (2001): Long and accurate PCR with a mixture of KOD DNA polymerase and its exonuclease deficient mutant enzyme. In: Journal of biotechnology 88 (2), S. 141–149.
84. Noman, Muhammad Zaeem; Desantis, Giacomo; Janji, Bassam; Hasmim, Meriem; Karray, Saoussen; Dessen, Philippe et al. (2014): PD-L1 is a novel direct target of HIF-1α, and its blockade under hypoxia enhanced MDSC-mediated T cell activation. In: The Journal of experimental medicine 211 (5), S. 781–790. DOI: 10.1084/jem.20131916.
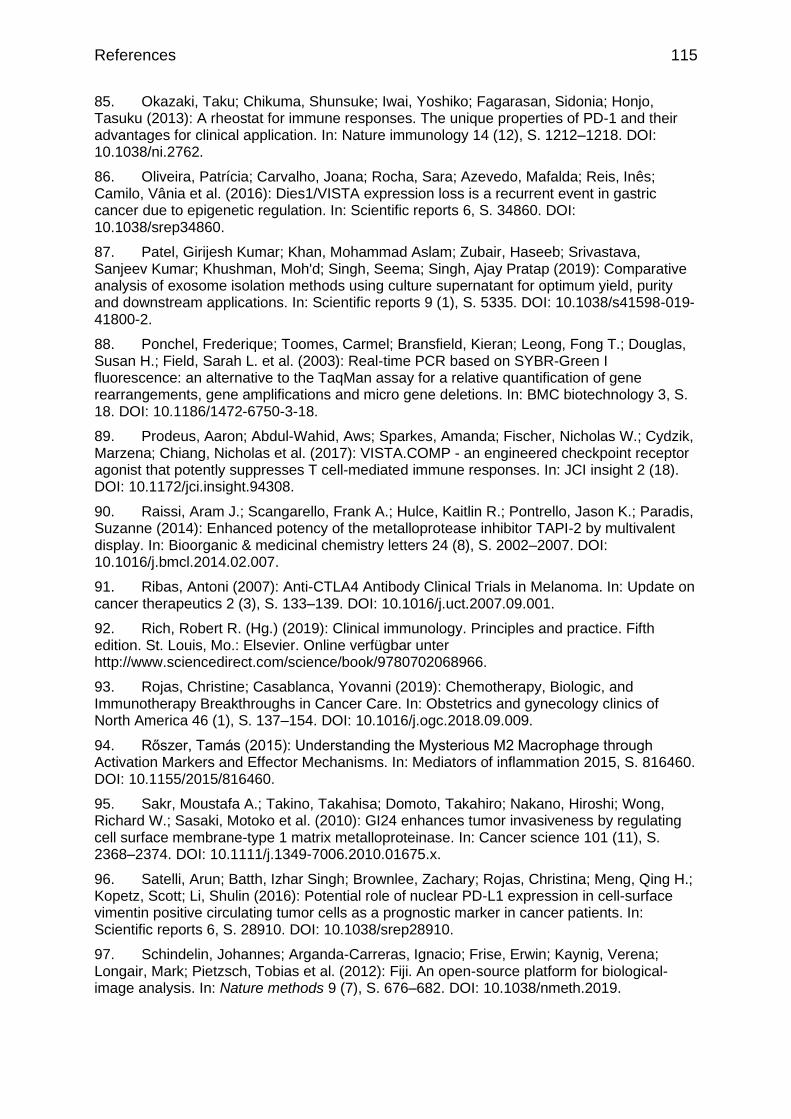
References 115
85. Okazaki, Taku; Chikuma, Shunsuke; Iwai, Yoshiko; Fagarasan, Sidonia; Honjo, Tasuku (2013): A rheostat for immune responses. The unique properties of PD-1 and their advantages for clinical application. In: Nature immunology 14 (12), S. 1212–1218. DOI: 10.1038/ni.2762.
86. Oliveira, Patrícia; Carvalho, Joana; Rocha, Sara; Azevedo, Mafalda; Reis, Inês; Camilo, Vânia et al. (2016): Dies1/VISTA expression loss is a recurrent event in gastric cancer due to epigenetic regulation. In: Scientific reports 6, S. 34860. DOI: 10.1038/srep34860.
87. Patel, Girijesh Kumar; Khan, Mohammad Aslam; Zubair, Haseeb; Srivastava, Sanjeev Kumar; Khushman, Moh'd; Singh, Seema; Singh, Ajay Pratap (2019): Comparative analysis of exosome isolation methods using culture supernatant for optimum yield, purity and downstream applications. In: Scientific reports 9 (1), S. 5335. DOI: 10.1038/s41598-019-41800-2.
88. Ponchel, Frederique; Toomes, Carmel; Bransfield, Kieran; Leong, Fong T.; Douglas, Susan H.; Field, Sarah L. et al. (2003): Real-time PCR based on SYBR-Green I fluorescence: an alternative to the TaqMan assay for a relative quantification of gene rearrangements, gene amplifications and micro gene deletions. In: BMC biotechnology 3, S. 18. DOI: 10.1186/1472-6750-3-18.
89. Prodeus, Aaron; Abdul-Wahid, Aws; Sparkes, Amanda; Fischer, Nicholas W.; Cydzik, Marzena; Chiang, Nicholas et al. (2017): VISTA.COMP - an engineered checkpoint receptor agonist that potently suppresses T cell-mediated immune responses. In: JCI insight 2 (18). DOI: 10.1172/jci.insight.94308.
90. Raissi, Aram J.; Scangarello, Frank A.; Hulce, Kaitlin R.; Pontrello, Jason K.; Paradis, Suzanne (2014): Enhanced potency of the metalloprotease inhibitor TAPI-2 by multivalent display. In: Bioorganic & medicinal chemistry letters 24 (8), S. 2002–2007. DOI: 10.1016/j.bmcl.2014.02.007.
91. Ribas, Antoni (2007): Anti-CTLA4 Antibody Clinical Trials in Melanoma. In: Update on cancer therapeutics 2 (3), S. 133–139. DOI: 10.1016/j.uct.2007.09.001.
92. Rich, Robert R. (Hg.) (2019): Clinical immunology. Principles and practice. Fifth edition. St. Louis, Mo.: Elsevier. Online verfügbar unter http://www.sciencedirect.com/science/book/9780702068966.
93. Rojas, Christine; Casablanca, Yovanni (2019): Chemotherapy, Biologic, and Immunotherapy Breakthroughs in Cancer Care. In: Obstetrics and gynecology clinics of North America 46 (1), S. 137–154. DOI: 10.1016/j.ogc.2018.09.009.
94. Rőszer, Tamás (2015): Understanding the Mysterious M2 Macrophage through Activation Markers and Effector Mechanisms. In: Mediators of inflammation 2015, S. 816460. DOI: 10.1155/2015/816460.
95. Sakr, Moustafa A.; Takino, Takahisa; Domoto, Takahiro; Nakano, Hiroshi; Wong, Richard W.; Sasaki, Motoko et al. (2010): GI24 enhances tumor invasiveness by regulating cell surface membrane-type 1 matrix metalloproteinase. In: Cancer science 101 (11), S. 2368–2374. DOI: 10.1111/j.1349-7006.2010.01675.x.
96. Satelli, Arun; Batth, Izhar Singh; Brownlee, Zachary; Rojas, Christina; Meng, Qing H.; Kopetz, Scott; Li, Shulin (2016): Potential role of nuclear PD-L1 expression in cell-surface vimentin positive circulating tumor cells as a prognostic marker in cancer patients. In: Scientific reports 6, S. 28910. DOI: 10.1038/srep28910.
97. Schindelin, Johannes; Arganda-Carreras, Ignacio; Frise, Erwin; Kaynig, Verena; Longair, Mark; Pietzsch, Tobias et al. (2012): Fiji. An open-source platform for biological-image analysis. In: Nature methods 9 (7), S. 676–682. DOI: 10.1038/nmeth.2019.

References 116
98. Schreiber, Robert D.; Old, Lloyd J.; Smyth, Mark J. (2011): Cancer immunoediting. Integrating immunity's roles in cancer suppression and promotion. In: Science (New York, N.Y.) 331 (6024), S. 1565–1570. DOI: 10.1126/science.1203486.
99. Schwende, H.; Fitzke, E.; Ambs, P.; Dieter, P. (1996): Differences in the state of differentiation of THP-1 cells induced by phorbol ester and 1,25-dihydroxyvitamin D3. In: Journal of leukocyte biology 59 (4), S. 555–561.
100. Seong, Hyun-A; Jung, Haiyoung; Kim, Kyong-Tai; Ha, Hyunjung (2007): 3-Phosphoinositide-dependent PDK1 negatively regulates transforming growth factor-beta-induced signaling in a kinase-dependent manner through physical interaction with Smad proteins. In: The Journal of biological chemistry 282 (16), S. 12272–12289. DOI: 10.1074/jbc.M609279200.
101. Shrestha, Ritu; Prithviraj, Prashanth; Anaka, Matthew; Bridle, Kim R.; Crawford, Darrell H. G.; Dhungel, Bijay et al. (2018): Monitoring Immune Checkpoint Regulators as Predictive Biomarkers in Hepatocellular Carcinoma. In: Frontiers in oncology 8, S. 269. DOI: 10.3389/fonc.2018.00269.
102. Striegel et al. (2009): Modern size-exclusion liquid chromatography. Practice of gel permeation and gel filtration chromatography. 2. ed. Hoboken, NJ: Wiley. Online verfügbar unter http://site.ebrary.com/lib/alltitles/docDetail.action?docID=10333033.
103. Sundar, Raghav; Cho, Byoung-Chul; Brahmer, Julie R.; Soo, Ross A. (2015): Nivolumab in NSCLC. Latest evidence and clinical potential. In: Therapeutic advances in medical oncology 7 (2), S. 85–96. DOI: 10.1177/1758834014567470.
104. Swann, Jeremy B.; Smyth, Mark J. (2007): Immune surveillance of tumors. In: The Journal of clinical investigation 117 (5), S. 1137–1146. DOI: 10.1172/JCI31405.
105. Szklarczyk, Damian; Gable, Annika L.; Lyon, David; Junge, Alexander; Wyder, Stefan; Huerta-Cepas, Jaime et al. (2019): STRING v11. Protein-protein association networks with increased coverage, supporting functional discovery in genome-wide experimental datasets. In: Nucleic acids research 47 (D1), D607-D613. DOI: 10.1093/nar/gky1131.
106. Tanja Seifert (2017): Rekombinante Expression, Reinigung und biochemische Charakterisierung der extra- und intrazellulären Domäne des Rezeptors V-domain Ig suppressor of T-cell activation (VISTA).
107. Tarhini, Ahmad; Lo, Ernest; Minor, David R. (2010): Releasing the brake on the immune system. Ipilimumab in melanoma and other tumors. In: Cancer biotherapy & radiopharmaceuticals 25 (6), S. 601–613. DOI: 10.1089/cbr.2010.0865.
108. Taube, Janis M.; Anders, Robert A.; Young, Geoffrey D.; Xu, Haiying; Sharma, Rajni; McMiller, Tracee L. et al. (2012): Colocalization of inflammatory response with B7-h1 expression in human melanocytic lesions supports an adaptive resistance mechanism of immune escape. In: Science translational medicine 4 (127), 127ra37. DOI: 10.1126/scitranslmed.3003689.
109. Thul, Peter J.; Åkesson, Lovisa; Wiking, Mikaela; Mahdessian, Diana; Geladaki, Aikaterini; Ait Blal, Hammou (2017): A subcellular map of the human proteome 356 (6340). DOI: 10.1126/science.aal3321.
110. Topalian, Suzanne L.; Hodi, F. Stephen; Brahmer, Julie R.; Gettinger, Scott N.; Smith, David C.; McDermott, David F. et al. (2012): Safety, activity, and immune correlates of anti-PD-1 antibody in cancer. In: The New England journal of medicine 366 (26), S. 2443–2454. DOI: 10.1056/NEJMoa1200690.
111. Torphy, Robert J.; Schulick, Richard D.; Zhu, Yuwen (2017): Newly Emerging Immune Checkpoints. Promises for Future Cancer Therapy. In: International journal of molecular sciences 18 (12). DOI: 10.3390/ijms18122642.
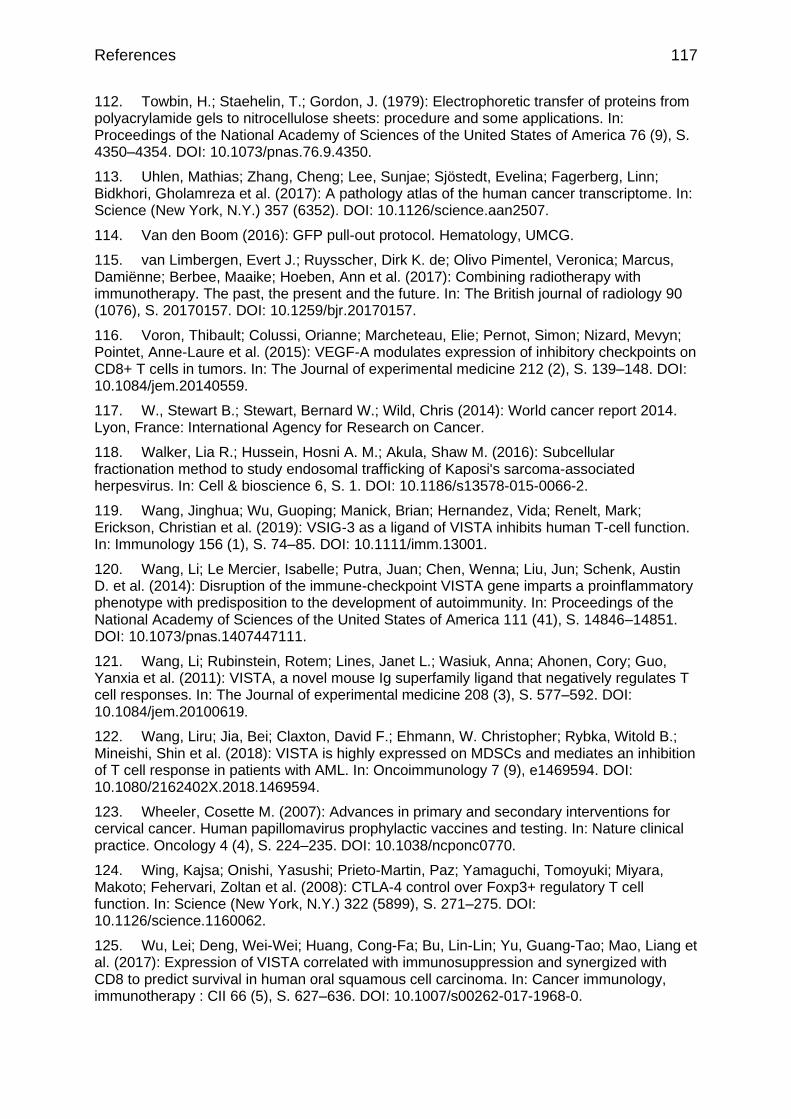
References 117
112. Towbin, H.; Staehelin, T.; Gordon, J. (1979): Electrophoretic transfer of proteins from polyacrylamide gels to nitrocellulose sheets: procedure and some applications. In: Proceedings of the National Academy of Sciences of the United States of America 76 (9), S. 4350–4354. DOI: 10.1073/pnas.76.9.4350.
113. Uhlen, Mathias; Zhang, Cheng; Lee, Sunjae; Sjöstedt, Evelina; Fagerberg, Linn; Bidkhori, Gholamreza et al. (2017): A pathology atlas of the human cancer transcriptome. In: Science (New York, N.Y.) 357 (6352). DOI: 10.1126/science.aan2507.
114. Van den Boom (2016): GFP pull-out protocol. Hematology, UMCG.
115. van Limbergen, Evert J.; Ruysscher, Dirk K. de; Olivo Pimentel, Veronica; Marcus, Damiënne; Berbee, Maaike; Hoeben, Ann et al. (2017): Combining radiotherapy with immunotherapy. The past, the present and the future. In: The British journal of radiology 90 (1076), S. 20170157. DOI: 10.1259/bjr.20170157.
116. Voron, Thibault; Colussi, Orianne; Marcheteau, Elie; Pernot, Simon; Nizard, Mevyn; Pointet, Anne-Laure et al. (2015): VEGF-A modulates expression of inhibitory checkpoints on CD8+ T cells in tumors. In: The Journal of experimental medicine 212 (2), S. 139–148. DOI: 10.1084/jem.20140559.
117. W., Stewart B.; Stewart, Bernard W.; Wild, Chris (2014): World cancer report 2014. Lyon, France: International Agency for Research on Cancer.
118. Walker, Lia R.; Hussein, Hosni A. M.; Akula, Shaw M. (2016): Subcellular fractionation method to study endosomal trafficking of Kaposi's sarcoma-associated herpesvirus. In: Cell & bioscience 6, S. 1. DOI: 10.1186/s13578-015-0066-2.
119. Wang, Jinghua; Wu, Guoping; Manick, Brian; Hernandez, Vida; Renelt, Mark; Erickson, Christian et al. (2019): VSIG-3 as a ligand of VISTA inhibits human T-cell function. In: Immunology 156 (1), S. 74–85. DOI: 10.1111/imm.13001.
120. Wang, Li; Le Mercier, Isabelle; Putra, Juan; Chen, Wenna; Liu, Jun; Schenk, Austin D. et al. (2014): Disruption of the immune-checkpoint VISTA gene imparts a proinflammatory phenotype with predisposition to the development of autoimmunity. In: Proceedings of the National Academy of Sciences of the United States of America 111 (41), S. 14846–14851. DOI: 10.1073/pnas.1407447111.
121. Wang, Li; Rubinstein, Rotem; Lines, Janet L.; Wasiuk, Anna; Ahonen, Cory; Guo, Yanxia et al. (2011): VISTA, a novel mouse Ig superfamily ligand that negatively regulates T cell responses. In: The Journal of experimental medicine 208 (3), S. 577–592. DOI: 10.1084/jem.20100619.
122. Wang, Liru; Jia, Bei; Claxton, David F.; Ehmann, W. Christopher; Rybka, Witold B.; Mineishi, Shin et al. (2018): VISTA is highly expressed on MDSCs and mediates an inhibition of T cell response in patients with AML. In: Oncoimmunology 7 (9), e1469594. DOI: 10.1080/2162402X.2018.1469594.
123. Wheeler, Cosette M. (2007): Advances in primary and secondary interventions for cervical cancer. Human papillomavirus prophylactic vaccines and testing. In: Nature clinical practice. Oncology 4 (4), S. 224–235. DOI: 10.1038/ncponc0770.
124. Wing, Kajsa; Onishi, Yasushi; Prieto-Martin, Paz; Yamaguchi, Tomoyuki; Miyara, Makoto; Fehervari, Zoltan et al. (2008): CTLA-4 control over Foxp3+ regulatory T cell function. In: Science (New York, N.Y.) 322 (5899), S. 271–275. DOI: 10.1126/science.1160062.
125. Wu, Lei; Deng, Wei-Wei; Huang, Cong-Fa; Bu, Lin-Lin; Yu, Guang-Tao; Mao, Liang et al. (2017): Expression of VISTA correlated with immunosuppression and synergized with CD8 to predict survival in human oral squamous cell carcinoma. In: Cancer immunology, immunotherapy : CII 66 (5), S. 627–636. DOI: 10.1007/s00262-017-1968-0.

References 118
126. Xu, Wenwen; Hiếu, TạMinh; Malarkannan, Subramaniam; Wang, Li (2018): The structure, expression, and multifaceted role of immune-checkpoint protein VISTA as a critical regulator of anti-tumor immunity, autoimmunity, and inflammation. In: Cellular & molecular immunology 15 (5), S. 438–446. DOI: 10.1038/cmi.2017.148.
127. Yamazaki, Tomohide; Akiba, Hisaya; Iwai, Hideyuki; Matsuda, Hironori; Aoki, Mami; Tanno, Yuka et al. (2002): Expression of programmed death 1 ligands by murine T cells and APC. In: Journal of immunology (Baltimore, Md. : 1950) 169 (10), S. 5538–5545. DOI: 10.4049/jimmunol.169.10.5538.
128. Yang, Wei; Padkjær, Søren Berg; Wang, Jishu; Sun, Zhe; Shan, Bing; Yang, Li et al. (2017): Construction of a versatile expression library for all human single-pass transmembrane proteins for receptor pairings by high throughput screening. In: Journal of biotechnology 260, S. 18–30. DOI: 10.1016/j.jbiotec.2017.08.023.
129. Yang, Yiping (2015): Cancer immunotherapy. Harnessing the immune system to battle cancer. In: The Journal of clinical investigation 125 (9), S. 3335–3337. DOI: 10.1172/JCI83871.
130. Yokosuka, Tadashi; Takamatsu, Masako; Kobayashi-Imanishi, Wakana; Hashimoto-Tane, Akiko; Azuma, Miyuki; Saito, Takashi (2012): Programmed cell death 1 forms negative costimulatory microclusters that directly inhibit T cell receptor signaling by recruiting phosphatase SHP2. In: The Journal of experimental medicine 209 (6), S. 1201–1217. DOI: 10.1084/jem.20112741.
131. Yoon, Kyoung Wan; Byun, Sanguine; Kwon, Eunjeong; Hwang, So-Young; Chu, Kiki; Hiraki, Masatsugu et al. (2015): Control of signaling-mediated clearance of apoptotic cells by the tumor suppressor p53. In: Science (New York, N.Y.) 349 (6247), S. 1261669. DOI: 10.1126/science.1261669.

Appendix 119
7 Appendix
7.1 Material and methods
Figure 7.1.1: Vector card of pETM-11
Figure 7.1.2: Vector card of pETGST1a

Appendix 120
7.2 Results
Figure 7.2.1: Analytical SEC of standard proteins
Figure 7.2.2: Raw chromatograms of standard proteins

Appendix 121
Figure 7.2.3: Raw SEC chromatogram of VISTA IgV after dialysis without baseline correction
Figure 7.2.4: Raw SEC chromatogram of VISTA IgV after renaturation of Ni2+-column without baseline correction
Figure 7.2.5: BMDM differentiation control, day 1 undifferentiated (a) and differentiated day 7 (b)
Appendix 122
Figure 7.2.6: Adsorption control of intracellular VISTA on VISTA antibody S14, a) mean fluorescent intensity in cell bodies after adsorption 24,05 b) mean fluorescent intensity in cell bodies without adsorption of intracellular VISTA protein 168,0
Figure 7.2.7: Secondary antibody controls of Jurkat cells, bone marrow derived macrophages and monocyte derived macrophages with anti-mouse, anti-rabbit and anti-goat antibodies

Appendix 123
Figure 7.2.8: Isolated exosomes of HL-60 VISTA-GFP cells (a) and HL-60 EV cells (b)
Figure 7.2.9: Isolated exosomes of THP-1 VISTA-GFP cells (a) and THP-1 EV cells (b)
Figure 7.2.10: Gating strategy for HL-60 EV and HL-60 VISTA-GFP cells. Plot 1: gating on viable cells, Plot 2: gating on GFP positive cells, Plot 3: gating for IgG control or blank cells
Curriculum vitae 124
Curriculum vitae
Lena Dübbel
Date of birth: 24.04.1992 in Oldenburg (Oldb)
Email: [email protected]
Education and Qualification
12/2016 – 12/2019 PhD student (Dr. rer. nat.)
Carl von Ossietzky University of Oldenburg
Thesis: Characterization of signaling pathways in tumor immunology and
immune therapy (Prof. Dr. Karl-Wilhelm Koch, Biochemistry) • Research stays in the Experimental Hematology at the UMCG in
Groningen, Netherlands in total for 5 month to transfer my results to the
human cell system
• 3-month supervision of an American participant of the DAAD Rise
program
• Focus: cell culture, immunohistochemistry, purification and
characterization of proteins
10/ 2014 – 11/2016 Master of Science, Molecular Biotechnology
Technical University of Munich, Thematic priority on cells and medicine
Thesis: Analysis of nutrient dependency and molecular characterization of
metabolic requirements for antigen uptake, processing and MHC-I-restricted
cross-presentation for CD8 T cells through liver sinusoidal endothelial cells
compared to dendritic cells (Univ.-Prof. Dr. med. Percy Knolle, Molecular
Immunology and Experimental Oncology)
• Research internship over six weeks at the institute „Molecular immunology
and Experimental Oncology “ of Prof. Dr. Knolle at University hospital
“Klinikum rechts der Isar” about immune function of LSECs
• Research internship over eight weeks at „Microbial diversity“ chair in the
group of Dr. Neuhaus about overlapping genes in EHEC sakai
10/ 2011 - 07/ 2014 Bachelor of Science, Molecular Biotechnology
Technical University of Munich
Thesis: Investigation of the soluble expression of the CMP-N-
acetylneuraminate synthetase of Neisseria meningitidis with masked
membrane anchor (Prof. Dr.-Ing. Dirk Weuster Botz, bioprocess engineering)
07/2011 Abitur
Herbartgymnasium (Oldenburg)

Curriculum vitae 125
Professional Experience
10/2017 – 12/2017 Lecturer for Biochemistry of the Cell Seminar, at Biochemistry Group, Prof.
Koch, Carl von Ossietzky University of Oldenburg
04/ 2013 – 07/2013 Student Employee at Chair of Biochemistry, Prof. Dr. Skerra, Technical
University of Munich
2010 Honorary group leader of a youth group in the OTB-tent camp Selker Noor
(training course „KTS & JuLeiCa Ausbildung“ for trainer assistant)
Courses within the PhD program Neurosensory Science and Systems
- Engagement as member of the Organization-Team of the research training group “Molecular
basis of sensory biology”, organization of an international conference
- Good Scientific Practice (GSP) – Basistraining certificate
- Good Manufacturing Practice (GMP) – Basistraining certificate
- Qualitätssicherung in der regulierten Forschung – GxP (GLP, GMP, GCLP) – Karlsruher
Institut für Technologie (KIT)
- Project Management – Fisher&Friends certificate
- Selfmanagement and Selfpresentation
- Mentoring program 2018-2019 for female young researcher
- How to publish in peer-reviewed journals – Tress and Tress certificate
- Scientific Image Processing and Analysis – Biovoxxel certificate
- Advanced Presentation techniques
Further Skills
Laboratory skills Cloning, expression and purification of recombinant proteins
Isolation and differentiation of several cell types from mice and human
Immunohistochemistry, FACS, Western Blot, SDS-PAGE, Elisa, phagocytosis
assay, migration assay, Ca-binding Assay with radioactive isotopes
IT skills Microsoft Office, ImageJ, Sigma Plot, GraphPad Prism, Flow Jo
Language German Native
English fluent, C1 Level
French Basic

List of publications 126
List of publications
Articles
Submitted: “Co-regulation of metabolism and immune functions in murine liver sinusoidal
endothelial cells”; Kerstin Lohr, Sainitin Donakonda, Michael Dudek, Tobias Baumann, Max
Lüdemann, Silke Hegenbarth, Lena Dübbel, Carola Eberhagen, Savvoula Michailidou, Marco
Prinz, Bastian Popper, Hans Zischka, Percy A. Knolle; Science Reports 2019
In preparation: “Intracellular localization of the negative checkpoint regulator VISTA in
immune cells”; Lena Dübbel, Karl-Wilhelm Koch, Edwin Bremer
Poster presentations
Dübbel, L., Meyer, H.N., Koch, K.-W. (2018); „Intracellular localization of the negative
checkpoint regulator VISTA in Antigen Presenting Cells”; 5th European Congress of
Immunology, Amsterdam, Netherlands
Dübbel, L., Meyer, H.N., Koch, K.-W. (2017); „VISTA, a new potential target for tumor
immune therapy”; Joint Networking day- The Groningen-Oldenburg Symposium, Groningen,
Netherlands
Oral presentations
Intracellular localization of VISTA, a new target for cancer immunotherapy (2018), Sensory Systems in Health and Disease, Verona, Italy
Danksagung 127
Danksagung
Hiermit möchte ich mich gerne bei allen Personen bedanken, die mich während meiner
Promotion begleitet und unterstützt haben. Dankeschön, ohne euch wäre die Arbeit
nicht annähernd so schön und erfolgreich abgelaufen!
Als Erstes geht ein großes Dankeschön an Prof. Dr. Karl-Wilhelm Koch! Danke für die
ungeplante Übernahme und Betreuung meiner Doktorarbeit. Danke für die
Unterstützung, Betreuung und Hilfestellung während meiner Arbeit und vielen Dank,
dass du meinetwegen einen Ausflug in die Tumorimmunologie gemacht hast!
In addition I want to thank Prof. Dr. Edwin Bremer being my second referee. Thank
you for your invitation, all the constructive discussions, your patience with me and the
possibility to hospitate in your laboratory!
Des Weiteren möchte ich mich bei apl. Prof. Dr. Ulrike Janssen-Bienhold bedanken.
Danke, dass du mich bei allen Mikroskopfragen beraten hast, dich für mich eingesetzt
hast und mir immer mit Rat und Tat zur Seite standest.
Ich möchte mich auch bei Tanja Seifert und Scott Wu für ihren Fleiß und ihre Arbeit
am VISTA Projekt mit mir, bedanken.
Vielen Dank auch an Bo der sehr viele Stunden und Nerven in den Versuch investiert
hat, um meine prozentualen Daten statistisch auswertbar zu machen.
Ganz besonders möchte ich mich auch bei der Arbeitsgruppe Biochemie bedanken.
Danke für die herzliche Aufnahme, die Unterstützung und die nette Atmosphäre. Ich
vermisse unsere Kohlfahrten, Weihnachtsfeiern und Betriebsausflüge jetzt schon!
Danke an Werner, Charlotte, Seher, Hanna und Chad für eine großartige
Bürogemeinschaft! Danke für die vielen schönen Gespräche, die gute Musik, die
hilfreichen Ratschläge und die konstruktiven Diskussionen. Danke an Jutta für die Hilfe
in der Zellkultur und dein offenes Ohr für mich.
Danke auch an Dana, Nicole, Katharina und Haijia. Die Arbeit mit euch hat mir sehr
viel Spaß gemacht und ich hoffe ich werde weiterhin zu den Cocktailabenden
eingeladen. Danke auch an Laura und Kristina für die vielen schönen Gespräche, euer
offenes Ohr und sehr lustige Zeiten als Zimmergenossinnen.
Einen besonderen Dank auch an Michael, der mich geduldig während dieser
stressigen Zeit ertragen und unterstützt hat.
Abschließend möchte ich mich ganz herzlich bei meiner Familie bedanken, die mich
seit Jahren aufbaut, auffängt, unterstützt und anfeuert. Ohne eure Hilfe und Motivation
wäre ich nicht in der Situation, in der ich jetzt bin. Danke!
Erklärung 128
Erklärung
Hiermit erkläre ich, dass ich die vorliegende Arbeit selbstständig verfasst habe und keine als die angegebenen Quellen und Hilfsmittel verwendet habe. Ich versichere, dass diese Arbeit weder in ihrer Gesamtheit noch in Teilen einer anderen Hochschule zur Begutachtung in einem Promotionsverfahren vorliegt oder vorgelegen hat und dass ich die Leitlinien guter wissenschaftlicher Praxis der Carl von Ossietzky Universität Oldenburg befolgt habe. Weiterhin versichere ich, dass im Zusammenhang mit dem Promotionsvorhaben keine kommerziellen Vermittlungs- oder Beratungsdienste (Promotionsberatung) in Anspruch genommen worden sind.
(Ort, Datum) (Lena Dübbel)