Characterization of Oil and Gas Production … · Characterization of Oil and Gas Production...
186
ERG No. 0227.03.026 TCEQ Contract No. 582-7-84003 Work Order No. 582-7-84003-FY10-26 Characterization of Oil and Gas Production Equipment and Develop a Methodology to Estimate Statewide Emissions FINAL REPORT TCEQ Contract No. 582-7-84003 Work Order No. 582-7-84003-FY10-26 Prepared by: Mike Pring, Daryl Hudson, Jason Renzaglia, Brandon Smith, and Stephen Treimel Eastern Research Group, Inc. 1600 Perimeter Park Drive Morrisville, NC 27560 Prepared for: Martha Maldonado Texas Commission on Environmental Quality Air Quality Division November 24, 2010
Transcript of Characterization of Oil and Gas Production … · Characterization of Oil and Gas Production...

ERG No. 0227.03.026
TCEQ Contract No. 582-7-84003
Work Order No. 582-7-84003-FY10-26
Characterization of Oil and Gas Production Equipment and Develop a
Methodology to Estimate Statewide Emissions
FINAL REPORT
TCEQ Contract No. 582-7-84003
Work Order No. 582-7-84003-FY10-26
Prepared by:
Mike Pring, Daryl Hudson, Jason Renzaglia,
Brandon Smith, and Stephen Treimel
Eastern Research Group, Inc.
1600 Perimeter Park Drive
Morrisville, NC 27560
Prepared for:
Martha Maldonado
Texas Commission on Environmental Quality
Air Quality Division
November 24, 2010

i
TABLE OF CONTENTS
Section Page No.
EXECUTIVE SUMMARY ........................................................................................................iv
1.0 INTRODUCTION ...................................................................................................... 1-1
2.0 AVAILABLE EMISSIONS ESTIMATION METHODOLOGY REVIEW................. 2-1
3.0 IDENTIFICATION OF OIL AND GAS OWNERS/OPERATORS AND SURVEY
DEVELOPMENT ................................................................................................................... 3-1
4.0 EMISSIONS CALCULATION METHODOLOGY.................................................... 4-1
4.1 Compressor Engines ........................................................................................ 4-1
4.2 Artificial Lift (Pumpjack) Engines ................................................................. 4-15
4.3 Dehydrators ................................................................................................... 4-20
4.3.1 Dehydrator Flash Vessels and Regenerator Vents ............................... 4-21
4.3.2 Glyol Regenerator Boilers .................................................................. 4-23
4.3.3 Dehydrator Emission Control Device ................................................. 4-24
4.4 Oil and Condensate Storage Tanks ................................................................. 4-27
4.5 Oil and Condensate Loading .......................................................................... 4-30
4.6 Well Completions .......................................................................................... 4-35
4.7 Wellhead Blowdowns .................................................................................... 4-39
4.8 Pneumatic Devices......................................................................................... 4-43
4.9 Fugitive Emissions (Equipment Leaks) .......................................................... 4-47
4.10 Heaters and Boilers ........................................................................................ 4-51
5.0 RESULTS................................................................................................................... 5-1
6.0 FORMATTED TexAER FILES .................................................................................. 6-1
7.0 CONCLUSIONS AND RECOMMENDATIONS ....................................................... 7-1
8.0 REFERENCES ........................................................................................................... 8-1
Appendix A – Task 2 Memorandum
Appendix B – Task 3 Memorandum
Appendix C – VOC and PM HAP Speciation Data
Appendix D – Compressor Engine Workbook
Appendix E – Texas Oil and Gas Emissions Inventory
Appendix F – Formatted TexAer Files

ii
LIST OF TABLES
Tables Page No.
Table E-1. State-wide Emissions Inventory for 2008 by Source Category................................. vii
Table E-2. State-wide Emissions Inventory for 2008 by County.................................................ix
Table 1-1. Upstream Oil and Gas Production Source Types..................................................... 1-1
Table 1-2. State-wide Emissions Inventory for 2008 by Source Category................................ 1-4
Table 1-3. State-wide Emissions Inventory for 2008 by County .............................................. 1-6
Table 4-1. Fraction of Wells >1 Year Old................................................................................ 4-3
Table 4-2. Engine Count by Survey......................................................................................... 4-4
Table 4-3. Emission Factor Data for Texas Attainment Areas.................................................. 4-6
Table 4-4. Emission Factor Data for Dallas Nonattainment Areas ........................................... 4-8
Table 4-5. Emission Factor Data for Houston Nonattainment Areas ........................................ 4-9
Table 4-6. Average Compression Requirements (Hp-hr/Mscf) .............................................. 4-11
Table 4-7. Distribution of Compressor Engine Emissions by SCC for Texas Attainment Counties
............................................................................................................................................. 4-13
Table 4-8. Distribution of Compressor Engine Emissions by SCC for Dallas Nonattainment
Counties................................................................................................................................ 4-13
Table 4-9. Distribution of Compressor Engine Emissions by SCC for Houston Nonattainment
Counties................................................................................................................................ 4-14
Table 4-10. Compressor Engine SCC Definitions.................................................................. 4-14
Table 4-11. Common Pumpjack Engine Emission Factors..................................................... 4-18
Table 4-12. Statewide Emission Factors for VOC, Benzene, Toluene, Ethylbenzene, and Xylene
from Dehydrator Flash Vessels and Regenerator Vents in Texas ........................................... 4-22
Table 4-13. Emission Factors for NOx and CO Emissions from Dehydrator Regenerator Boilers
............................................................................................................................................. 4-23
Table 4-14. Emission Factors for NOx and CO Emissions from Dehydrator Controls (Flares) 4-26
Table 4-15. Emission Factors for VOC, Benzene, Toluene, Ethylbenzene, and Xylene from Oil
Storage Tanks and Condensate Storage Tanks in Texas......................................................... 4-29
Table 4-16. Molecular Weight and True Vapor Pressure of Selected Petroleum Liquids........ 4-32
Table 4-17. Emission Factors for Benzene, Toluene, Ethylbenzene, and Xylene from Oil and
Condensate Loading in Texas................................................................................................ 4-34
Table 4-18. 2008 CENRAP Data for Volume of Gas Vented per Completion........................ 4-36
Table 4-19. 2008 CENRAP Data for Volume of Gas Vented per Blowdown per Wellhead ... 4-40
Table 4-20. 2008 CENRAP Data for Wellhead Blowdown Frequency................................... 4-41
Table 4-21. CENRAP Basin-Level Data for Pneumatic Devices at Gas Wells ....................... 4-45
Table 4-22. AP-42 Emissions Factors for Fugitive Components ............................................ 4-48
Table 4-23. CENRAP Basin-Level Data for Fugitives at Gas Wells ...................................... 4-49
Table 4-24. CENRAP Basin-Level Data for Fugitives at Oil Wells ....................................... 4-49
Table 4-25. AP-42 Emissions Factors for Natural Gas Fired Heaters ..................................... 4-53
Table 4-26. CENRAP Basin-Level Data for Heaters at Gas Wells ......................................... 4-55
Table 4-27. CENRAP Basin-Level Data for Heaters at Oil Wells .......................................... 4-55
Table 5-1. State-wide Emissions Inventory for 2008 by Source Category................................ 5-2
Table 5-2. State-wide Emissions Inventory for 2008 by County .............................................. 5-4
Table 5-3. State-wide Speciated HAP Emissions by Source Category .................................. 5-14

iii
List of Acronyms
Acronym Definition BBL Barrels
CENRAP Central Regional Air Planning Association
CO Carbon Monoxide
DFW Dallas-Fort Worth
EPA U.S. Environmental Protection Agency
EPRI Electric Power Research Institute
ERG Eastern Research Group
HAP Hazardous Air Pollutants
HARC Houston Advanced Research Center
Hp-Hr Horsepower Hour
Hp Horsepower
hr/yr Hours per year
lbs Pounds
MMBtu/hr Million British Thermal Units per hour
MMscf Million standard cubic feet
Mscf Thousand standard cubic feet
NEI National Emissions Inventory
NIF NEI Input Format
NOx Nitrogen Oxides
NSCR Non selective catalytic reduction
NSPS New Source Performance Standard
PM2.5 particulate matter with an aerodynamic diameter less than or
equal to 2.5 microns
PM10 particulate matter with an aerodynamic diameter less than or
equal to 10 microns
RVP Reid Vapor Pressure
SCC Source Classification Code
scf Standard cubic feet
SIP State Implementation Plan
SO2 Sulfur Dioxide
STP Standard temperature and pressure
TAC Texas Administrative Code
TCEQ Texas Commission on Environmental Quality
TERC Texas Environmental Research Consortium
TexAER Texas Air Emissions Repository
TOC Total Organic Carbon
TRC Texas Railroad Commission
VOC Volatile Organic Compound
iv
EXECUTIVE SUMMARY
This report is a deliverable for Texas Commission on Environmental Quality (TCEQ)
Work Order No. 582-07-84003-FY10-26 to better identify and characterize area source
emissions from upstream onshore oil and gas production sites that operated in Texas in 2008, and
to develop a 2008 base year air emissions inventory from these sites. On an individual basis,
emissions from any single oil and gas production site are likely minimal as there may only be a
few pieces of equipment at any one site. This equipment could include storage tanks,
dehydrators, oil and gas piping, or small natural gas fired engines. However, with over 90,000
gas wells and 150,000 oil wells in Texas, the cumulative magnitude of these emissions may be
significant. In particular, due to recent advancements in exploration and production technology
such as the hydraulic fracturing of natural gas wells, this activity is increasingly taking place in
populated areas, including ozone nonattainment areas. Therefore, closer scrutiny and evaluation
of this area source category is warranted.
Emissions estimates developed from this inventory project may be used for improved
input data to photochemical air quality dispersion modeling, emissions sensitivity analyses, State
Implementation Plan (SIP) development, and other agency activities.
The emissions inventory developed under this project addresses area source criteria
pollutant emissions of volatile organic compounds (VOC), nitrogen oxides (NOx), carbon
monoxide (CO), particulate matter with an aerodynamic diameter less than or equal to 10 microns
(PM10), particulate matter with an aerodynamic diameter less than or equal to 2.5 microns
(PM2.5), and sulfur dioxide (SO2); certain Hazardous Air Pollutant (HAPs) emissions such as
benzene, toluene, ethylbenzene, and xylene from dehydrators, oil and condensate storage tanks,
and oil and condensate loading racks; and a variety of HAPs from combustion sources.
This study builds on three previous studies ERG conducted for TCEQ to estimate
emissions from oil and gas exploration and production activities. The first, implemented in
2007, focused on compiling a state-wide emissions inventory (including both onshore and
offshore sources) for oil and gas exploration and production for a 2005 base year (TCEQ, 2007).
The second study, conducted in 2009 for a 2008 base year, focused only on emissions from
onshore oil and gas well drilling rig engines (TCEQ, 2009). The third study, which was just
v
completed, developed an emissions inventory for offshore oil and gas platforms (TCEQ, 2010).
In contrast, this current study addresses onshore area sources (those not included in the Texas
point source inventory). Collectively, these studies provide a comprehensive emissions
inventory from onshore area sources, offshore oil and gas platforms, and onshore drilling rig
activities.
In addition to compiling the emissions inventory, other objectives of this project were to
identify the emission source types operating at oil and gas production sites, to develop a
methodology for estimating area source emissions from oil and gas production sites based on the
oil and gas produced at the county level, to develop survey materials that may be used to obtain
detailed information needed to estimate emissions, and to identify the producers of oil and gas
for each county. In conjunction with these activities, an emissions calculator was developed in
Microsoft Excel that will allow TCEQ to update the emissions inventory for future years by
providing updated county-level activity data. Finally, the emissions inventory was compiled into
National Emissions Inventory Input Format (NIF) 3.0 text files for import into the Texas Air
Emissions Repository (TexAER).
ERG was able to compile the 2008 area source emissions inventory from upstream
onshore oil and gas production sites by obtaining both county-level activity data, and specific
emissions and emission factor data for each source type. This data was obtained from a variety
of sources, including existing databases (such as the Texas Railroad Commission (TRC) oil and
gas production data), point source emissions inventory reports submitted to TCEQ (for
dehydrators), vendor data (for compression engines and pumpjack engines), and published
emission factor and activity data from the Houston Advanced Research Center (HARC), the
Central Regional Air Planning Association (CENRAP), and the U.S. Environmental Protection
Agency (EPA).
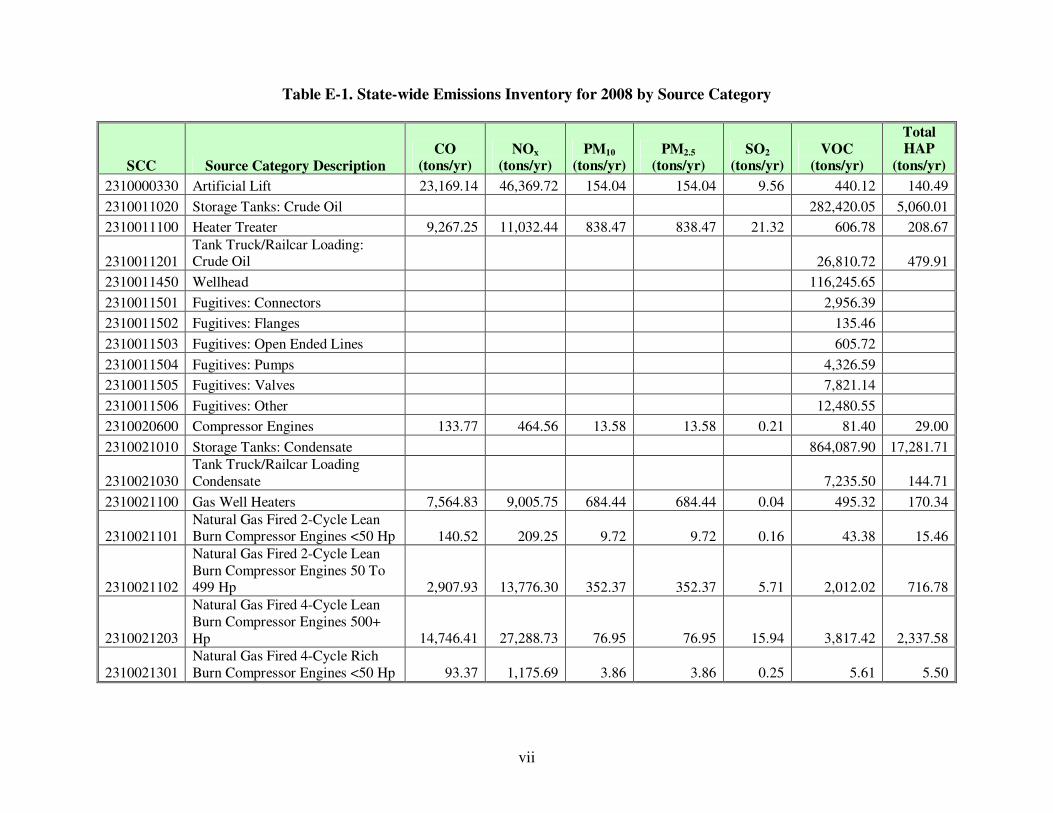
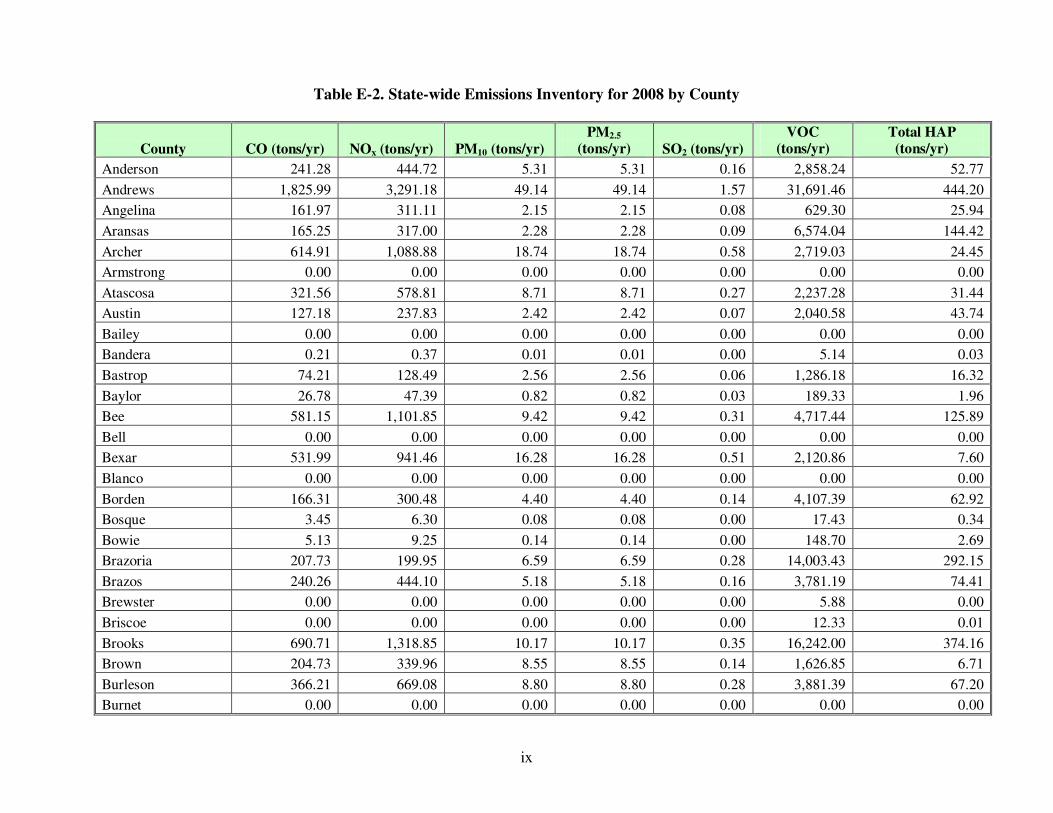
Table E-1 presents a state-wide summary of criteria pollutant (and total HAP) emissions
by source category, and Table E-2 presents a summary of criteria pollutant (and total HAP)
emissions for each county. As can be seen in these tables, emissions from area source upstream
oil and gas production sites on a state-wide basis are significant with over 200,000 tons of NOx,
1,500,000 tons of VOC, and 30,000 tons of HAPs emitted in 2008. The main source of NOx

vi
emissions are compressor engines, while the main source of VOC and HAP emissions are oil and
condensate storage tanks.
It should be noted that the emission estimates provided in this report were based on
available data and do not take into account more specific emission information such as county-
specific gas composition data, or the extent that control devices that may be used on certain
source types (such as well completions) to reduce emissions. More accurate emissions estimates
would require a comprehensive survey of upstream oil and gas site operators to obtain
information such as county-level gas composition data, quantification of the use of control
devices, updated equipment profiles (such as the number and size of heater treaters used on a
typical well pad), and updated equipment characteristics and counts.
vii
Table E-1. State-wide Emissions Inventory for 2008 by Source Category
SCC Source Category Description
CO
(tons/yr)
NOx
(tons/yr)
PM10
(tons/yr)
PM2.5
(tons/yr)
SO2
(tons/yr)
VOC
(tons/yr)
Total
HAP
(tons/yr)
2310000330 Artificial Lift 23,169.14 46,369.72 154.04 154.04 9.56 440.12 140.49
2310011020 Storage Tanks: Crude Oil 282,420.05 5,060.01
2310011100 Heater Treater 9,267.25 11,032.44 838.47 838.47 21.32 606.78 208.67
2310011201
Tank Truck/Railcar Loading: Crude Oil 26,810.72 479.91
2310011450 Wellhead 116,245.65
2310011501 Fugitives: Connectors 2,956.39
2310011502 Fugitives: Flanges 135.46
2310011503 Fugitives: Open Ended Lines 605.72
2310011504 Fugitives: Pumps 4,326.59
2310011505 Fugitives: Valves 7,821.14
2310011506 Fugitives: Other 12,480.55
2310020600 Compressor Engines 133.77 464.56 13.58 13.58 0.21 81.40 29.00
2310021010 Storage Tanks: Condensate 864,087.90 17,281.71
2310021030
Tank Truck/Railcar Loading
Condensate 7,235.50 144.71
2310021100 Gas Well Heaters 7,564.83 9,005.75 684.44 684.44 0.04 495.32 170.34
2310021101
Natural Gas Fired 2-Cycle Lean Burn Compressor Engines <50 Hp 140.52 209.25 9.72 9.72 0.16 43.38 15.46
2310021102
Natural Gas Fired 2-Cycle Lean
Burn Compressor Engines 50 To 499 Hp 2,907.93 13,776.30 352.37 352.37 5.71 2,012.02 716.78
2310021203
Natural Gas Fired 4-Cycle Lean
Burn Compressor Engines 500+
Hp 14,746.41 27,288.73 76.95 76.95 15.94 3,817.42 2,337.58
2310021301
Natural Gas Fired 4-Cycle Rich
Burn Compressor Engines <50 Hp 93.37 1,175.69 3.86 3.86 0.25 5.61 5.50

viii
Table E-1. State-wide Emissions Inventory for 2008 by Source Category (Cont.)
SCC Source Category Description
CO
(tons/yr)
NOx
(tons/yr)
PM10
(tons/yr)
PM2.5
(tons/yr)
SO2
(tons/yr)
VOC
(tons/yr)
Total
HAP
(tons/yr)
2310021302
Natural Gas Fired 4-Cycle Rich
Burn Compressor Engines 50 To 499hp 38,988.69 86,462.54 226.24 226.24 14.83 1,487.26 1,451.93
2310021400 Gas Well Dehydrators 904.59 293.36 6,344.85 5,255.17
2310021402
Natural Gas Fired 4-Cycle Rich Burn Compressor Engines 50-
499hp W/ Nscr 767.55 3,321.00 35.02 35.02 2.05 17.73 17.46
2310021403
Natural Gas Fired 4-Cycle Rich
Burn Compressor Engines 500+ Hp W/ Nscr 29,646.80 47,837.57 175.33 175.33 11.26 794.33 775.73
2310021501 Fugitives: Connectors 1,161.52
2310021502 Fugitives: Flanges 1,199.68
2310021503 Fugitives: Open Ended Lines 916.82
2310021504 Fugitives: Pumps 476.31
2310021505 Fugitives: Valves 7,387.52
2310021506 Fugitives: Other 8,732.37
2310021600 Gas Well Venting 8,601.78
2310121700
Gas Well Completion: All
Processes 10,139.56
2310111700
Oil Well Completion: All Processes 19,425.44
2310121401 Gas Well Pneumatic Pumps 169,209.86
Total: 128,330.85 247,236.91 2,570.01 2,570.01 81.34 1,568,522.73 34,090.45
ix
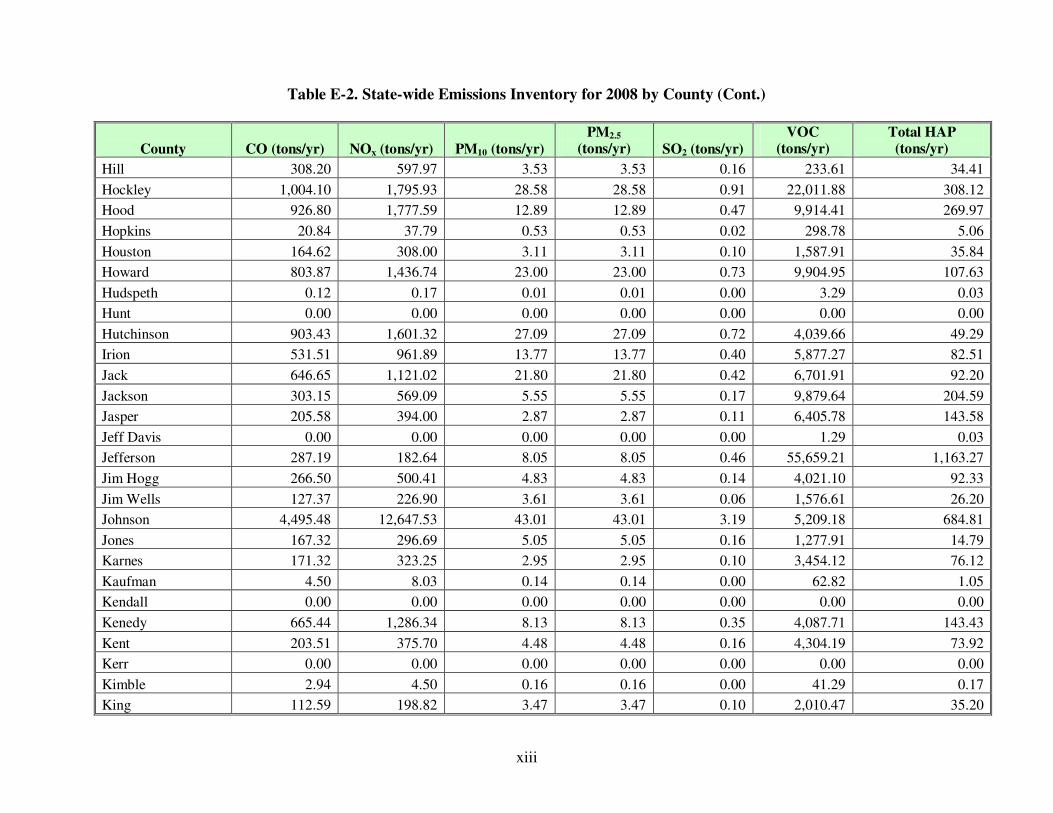
Table E-2. State-wide Emissions Inventory for 2008 by County
County CO (tons/yr) NOx (tons/yr) PM10 (tons/yr)
PM2.5
(tons/yr) SO2 (tons/yr)
VOC
(tons/yr)
Total HAP
(tons/yr)
Anderson 241.28 444.72 5.31 5.31 0.16 2,858.24 52.77
Andrews 1,825.99 3,291.18 49.14 49.14 1.57 31,691.46 444.20
Angelina 161.97 311.11 2.15 2.15 0.08 629.30 25.94
Aransas 165.25 317.00 2.28 2.28 0.09 6,574.04 144.42
Archer 614.91 1,088.88 18.74 18.74 0.58 2,719.03 24.45
Armstrong 0.00 0.00 0.00 0.00 0.00 0.00 0.00
Atascosa 321.56 578.81 8.71 8.71 0.27 2,237.28 31.44
Austin 127.18 237.83 2.42 2.42 0.07 2,040.58 43.74
Bailey 0.00 0.00 0.00 0.00 0.00 0.00 0.00
Bandera 0.21 0.37 0.01 0.01 0.00 5.14 0.03
Bastrop 74.21 128.49 2.56 2.56 0.06 1,286.18 16.32
Baylor 26.78 47.39 0.82 0.82 0.03 189.33 1.96
Bee 581.15 1,101.85 9.42 9.42 0.31 4,717.44 125.89
Bell 0.00 0.00 0.00 0.00 0.00 0.00 0.00
Bexar 531.99 941.46 16.28 16.28 0.51 2,120.86 7.60
Blanco 0.00 0.00 0.00 0.00 0.00 0.00 0.00
Borden 166.31 300.48 4.40 4.40 0.14 4,107.39 62.92
Bosque 3.45 6.30 0.08 0.08 0.00 17.43 0.34
Bowie 5.13 9.25 0.14 0.14 0.00 148.70 2.69
Brazoria 207.73 199.95 6.59 6.59 0.28 14,003.43 292.15
Brazos 240.26 444.10 5.18 5.18 0.16 3,781.19 74.41
Brewster 0.00 0.00 0.00 0.00 0.00 5.88 0.00
Briscoe 0.00 0.00 0.00 0.00 0.00 12.33 0.01
Brooks 690.71 1,318.85 10.17 10.17 0.35 16,242.00 374.16
Brown 204.73 339.96 8.55 8.55 0.14 1,626.85 6.71
Burleson 366.21 669.08 8.80 8.80 0.28 3,881.39 67.20
Burnet 0.00 0.00 0.00 0.00 0.00 0.00 0.00

x
Table E-2. State-wide Emissions Inventory for 2008 by County (Cont.)
County CO (tons/yr) NOx (tons/yr) PM10 (tons/yr)
PM2.5
(tons/yr) SO2 (tons/yr)
VOC
(tons/yr)
Total HAP
(tons/yr)
Caldwell 676.24 1,197.43 20.61 20.61 0.64 3,452.64 22.69
Calhoun 189.99 360.25 3.07 3.07 0.10 7,473.42 160.35
Callahan 182.61 321.30 5.76 5.76 0.16 983.48 9.65
Cameron 1.68 3.12 0.03 0.03 0.00 10.26 0.20
Camp 30.41 55.01 0.79 0.79 0.03 259.21 4.96
Carson 569.73 1,021.51 15.74 15.74 0.41 1,954.76 34.12
Cass 54.95 98.13 1.55 1.55 0.04 662.46 11.89
Castro 0.00 0.00 0.00 0.00 0.00 0.00 0.00
Chambers 84.76 94.63 2.75 2.75 0.11 4,424.08 90.13
Cherokee 364.58 682.18 6.78 6.78 0.18 2,911.32 72.93
Childress 1.69 2.99 0.05 0.05 0.00 57.40 0.71
Clay 231.82 409.65 7.14 7.14 0.21 1,476.89 16.60
Cochran 445.16 791.68 13.17 13.17 0.41 6,168.35 67.45
Coke 109.55 200.99 2.54 2.54 0.08 1,010.20 15.88
Coleman 173.73 295.58 6.51 6.51 0.13 1,363.81 9.92
Collin 0.00 0.00 0.00 0.00 0.00 0.00 0.00
Collingsworth 50.04 76.34 2.77 2.77 0.02 742.63 2.58
Colorado 319.38 601.84 5.54 5.54 0.16 4,980.62 115.78
Comal 0.00 0.00 0.00 0.00 0.00 0.00 0.00
Comanche 34.22 53.57 1.76 1.76 0.02 438.42 1.97
Concho 72.58 128.12 2.23 2.23 0.06 821.04 9.65
Cooke 495.43 884.64 14.25 14.25 0.45 3,467.02 50.26
Coryell 0.00 0.00 0.00 0.00 0.00 3.13 0.00
Cottle 95.67 180.55 1.63 1.63 0.05 2,376.44 52.30
Crane 1,739.98 3,208.47 38.61 38.61 1.26 17,274.91 291.73
Crockett 2,274.88 4,015.15 68.61 68.61 1.15 28,501.91 414.45
Crosby 85.55 151.51 2.61 2.61 0.08 1,056.14 9.67

xi
Table E-2. State-wide Emissions Inventory for 2008 by County (Cont.)
County CO (tons/yr) NOx (tons/yr) PM10 (tons/yr)
PM2.5
(tons/yr) SO2 (tons/yr)
VOC
(tons/yr)
Total HAP
(tons/yr)
Culberson 72.79 137.98 1.20 1.20 0.04 284.44 8.75
Dallam 0.00 0.00 0.00 0.00 0.00 0.00 0.00
Dallas 28.04 80.04 0.21 0.21 0.02 24.60 4.23
Dawson 275.48 492.78 7.84 7.84 0.25 5,344.51 72.02
Deaf Smith 0.00 0.00 0.00 0.00 0.00 0.00 0.00
Delta 0.00 0.00 0.00 0.00 0.00 0.00 0.00
Denton 1,763.52 4,690.36 29.51 29.51 1.14 13,254.59 416.58
Dewitt 676.49 1,300.83 9.00 9.00 0.35 11,617.04 287.72
Dickens 49.70 88.22 1.49 1.49 0.05 1,446.43 20.78
Dimmit 197.89 353.20 5.65 5.65 0.15 2,515.16 31.86
Donley 0.53 0.77 0.03 0.03 0.00 15.82 0.17
Duval 1,111.17 2,101.02 18.70 18.70 0.63 12,897.27 314.00
Eastland 285.26 476.94 11.51 11.51 0.18 3,654.84 39.72
Ector 1,798.24 3,277.22 44.40 44.40 1.47 26,211.12 388.97
Edwards 270.78 492.35 6.60 6.60 0.13 1,377.01 25.49
El Paso 0.00 0.00 0.00 0.00 0.00 0.00 0.00
Ellis 51.17 144.09 0.47 0.47 0.04 52.43 7.56
Erath 161.14 295.43 3.68 3.68 0.07 1,556.95 32.84
Falls 4.01 7.09 0.12 0.12 0.00 21.49 0.09
Fannin 0.00 0.00 0.00 0.00 0.00 11.86 0.00
Fayette 356.62 659.40 7.64 7.64 0.23 5,607.61 115.67
Fisher 107.82 193.50 2.99 2.99 0.09 1,365.54 16.44
Floyd 0.42 0.75 0.01 0.01 0.00 2.97 0.03
Foard 27.94 43.90 1.42 1.42 0.01 414.38 2.57
Fort Bend 169.68 171.80 5.51 5.51 0.22 8,072.59 166.58
Franklin 69.40 127.99 1.52 1.52 0.05 1,389.52 28.31
Freestone 3,821.60 7,289.51 56.95 56.95 1.93 9,858.72 475.09

xii
Table E-2. State-wide Emissions Inventory for 2008 by County (Cont.)
County CO (tons/yr) NOx (tons/yr) PM10 (tons/yr)
PM2.5
(tons/yr) SO2 (tons/yr)
VOC
(tons/yr)
Total HAP
(tons/yr)
Frio 139.12 246.28 4.21 4.21 0.12 1,393.74 14.40
Gaines 1,165.52 2,133.47 27.65 27.65 0.92 27,788.32 460.84
Galveston 86.46 76.28 2.61 2.61 0.12 17,475.45 358.12
Garza 445.72 790.41 13.45 13.45 0.42 6,133.80 63.01
Gillespie 0.00 0.00 0.00 0.00 0.00 0.00 0.00
Glasscock 416.67 761.54 10.00 10.00 0.32 5,431.20 84.49
Goliad 731.21 1,386.08 11.85 11.85 0.37 7,851.72 199.63
Gonzales 51.40 92.76 1.37 1.37 0.04 578.12 8.62
Gray 825.55 1,440.69 27.11 27.11 0.64 4,163.88 45.84
Grayson 201.98 365.62 5.22 5.22 0.16 1,707.03 31.65
Gregg 1,423.90 2,592.32 34.92 34.92 1.00 10,980.44 227.68
Grimes 334.10 638.29 4.87 4.87 0.17 1,264.12 50.60
Guadalupe 402.11 711.73 12.29 12.29 0.38 2,576.45 22.66
Hale 62.99 114.67 1.57 1.57 0.05 2,698.37 46.20
Hall 0.00 0.00 0.00 0.00 0.00 0.00 0.00
Hamilton 3.12 5.33 0.11 0.11 0.00 36.47 0.47
Hansford 377.68 676.20 10.32 10.32 0.17 2,601.06 43.25
Hardeman 52.13 92.68 1.54 1.54 0.05 1,230.36 19.89
Hardin 258.68 348.83 7.85 7.85 0.30 22,648.65 447.94
Harris 176.00 181.67 5.65 5.65 0.23 8,801.29 184.44
Harrison 1,879.59 3,514.48 35.19 35.19 0.93 25,383.90 583.58
Hartley 39.06 70.27 1.04 1.04 0.02 399.51 6.56
Haskell 53.83 95.30 1.64 1.64 0.05 443.81 5.44
Hays 0.00 0.00 0.00 0.00 0.00 0.00 0.00
Hemphill 2,092.63 3,936.72 37.08 37.08 1.03 32,774.76 754.74
Henderson 453.75 854.13 7.99 7.99 0.24 2,535.12 73.92
Hidalgo 3,264.69 6,276.64 43.49 43.49 1.68 56,554.95 1,407.72
xiii
Table E-2. State-wide Emissions Inventory for 2008 by County (Cont.)
County CO (tons/yr) NOx (tons/yr) PM10 (tons/yr)
PM2.5
(tons/yr) SO2 (tons/yr)
VOC
(tons/yr)
Total HAP
(tons/yr)
Hill 308.20 597.97 3.53 3.53 0.16 233.61 34.41
Hockley 1,004.10 1,795.93 28.58 28.58 0.91 22,011.88 308.12
Hood 926.80 1,777.59 12.89 12.89 0.47 9,914.41 269.97
Hopkins 20.84 37.79 0.53 0.53 0.02 298.78 5.06
Houston 164.62 308.00 3.11 3.11 0.10 1,587.91 35.84
Howard 803.87 1,436.74 23.00 23.00 0.73 9,904.95 107.63
Hudspeth 0.12 0.17 0.01 0.01 0.00 3.29 0.03
Hunt 0.00 0.00 0.00 0.00 0.00 0.00 0.00
Hutchinson 903.43 1,601.32 27.09 27.09 0.72 4,039.66 49.29
Irion 531.51 961.89 13.77 13.77 0.40 5,877.27 82.51
Jack 646.65 1,121.02 21.80 21.80 0.42 6,701.91 92.20
Jackson 303.15 569.09 5.55 5.55 0.17 9,879.64 204.59
Jasper 205.58 394.00 2.87 2.87 0.11 6,405.78 143.58
Jeff Davis 0.00 0.00 0.00 0.00 0.00 1.29 0.03
Jefferson 287.19 182.64 8.05 8.05 0.46 55,659.21 1,163.27
Jim Hogg 266.50 500.41 4.83 4.83 0.14 4,021.10 92.33
Jim Wells 127.37 226.90 3.61 3.61 0.06 1,576.61 26.20
Johnson 4,495.48 12,647.53 43.01 43.01 3.19 5,209.18 684.81
Jones 167.32 296.69 5.05 5.05 0.16 1,277.91 14.79
Karnes 171.32 323.25 2.95 2.95 0.10 3,454.12 76.12
Kaufman 4.50 8.03 0.14 0.14 0.00 62.82 1.05
Kendall 0.00 0.00 0.00 0.00 0.00 0.00 0.00
Kenedy 665.44 1,286.34 8.13 8.13 0.35 4,087.71 143.43
Kent 203.51 375.70 4.48 4.48 0.16 4,304.19 73.92
Kerr 0.00 0.00 0.00 0.00 0.00 0.00 0.00
Kimble 2.94 4.50 0.16 0.16 0.00 41.29 0.17
King 112.59 198.82 3.47 3.47 0.10 2,010.47 35.20

xiv
Table E-2. State-wide Emissions Inventory for 2008 by County (Cont.)
County CO (tons/yr) NOx (tons/yr) PM10 (tons/yr)
PM2.5
(tons/yr) SO2 (tons/yr)
VOC
(tons/yr)
Total HAP
(tons/yr)
Kinney 0.00 0.00 0.00 0.00 0.00 0.00 0.00
Kleberg 494.21 948.96 6.71 6.71 0.25 8,845.84 217.77
Knox 46.18 81.72 1.41 1.41 0.04 354.81 4.00
La Salle 259.22 470.95 6.38 6.38 0.13 4,078.69 76.37
Lamar 0.00 0.00 0.00 0.00 0.00 0.00 0.00
Lamb 15.10 27.13 0.42 0.42 0.01 686.85 11.01
Lampasas 0.16 0.20 0.01 0.01 0.00 4.24 0.00
Lavaca 924.67 1,764.89 13.68 13.68 0.47 12,277.67 311.64
Lee 307.30 564.26 7.08 7.08 0.23 2,650.76 49.84
Leon 1,079.72 2,070.29 15.01 15.01 0.58 5,733.49 197.49
Liberty 331.40 341.24 9.92 9.92 0.45 27,316.75 570.30
Limestone 1,393.87 2,655.14 21.17 21.17 0.71 4,377.56 180.91
Lipscomb 1,125.34 2,104.13 21.36 21.36 0.58 17,104.94 381.52
Live Oak 378.16 709.70 6.91 6.91 0.20 6,807.99 149.58
Llano 0.00 0.00 0.00 0.00 0.00 0.00 0.00
Loving 1,567.71 3,023.10 20.15 20.15 0.89 6,348.57 251.69
Lubbock 89.19 158.04 2.71 2.71 0.08 1,825.32 23.15
Lynn 18.52 33.00 0.54 0.54 0.02 350.40 4.52
Madison 117.26 216.26 2.56 2.56 0.07 1,290.52 26.07
Marion 96.78 174.38 2.56 2.56 0.06 1,407.02 25.69
Martin 596.73 1,088.02 14.69 14.69 0.49 10,928.66 168.72
Mason 0.00 0.00 0.00 0.00 0.00 0.00 0.00
Matagorda 609.79 1,168.96 8.47 8.47 0.32 19,098.24 428.64
Maverick 182.47 323.89 5.42 5.42 0.15 3,715.58 42.08
McCulloch 14.65 25.47 0.50 0.50 0.01 109.65 1.15
McLennan 8.65 15.30 0.26 0.26 0.01 27.43 0.12
McMullen 493.90 900.42 11.92 11.92 0.29 6,027.42 110.63

xv
Table E-2. State-wide Emissions Inventory for 2008 by County (Cont.)
County CO (tons/yr) NOx (tons/yr) PM10 (tons/yr)
PM2.5
(tons/yr) SO2 (tons/yr)
VOC
(tons/yr)
Total HAP
(tons/yr)
Medina 275.72 487.25 8.50 8.50 0.26 1,235.77 4.54
Menard 27.00 47.52 0.85 0.85 0.02 266.84 2.69
Midland 1,610.04 2,951.97 37.75 37.75 1.27 20,938.23 333.93
Milam 218.91 387.83 6.65 6.65 0.21 1,216.87 9.32
Mills 0.36 0.51 0.02 0.02 0.00 6.38 0.02
Mitchell 502.49 890.13 15.28 15.28 0.48 6,645.63 65.00
Montague 551.48 987.06 15.59 15.59 0.49 3,448.92 48.39
Montgomery 73.56 81.80 2.86 2.86 0.08 2,890.56 54.67
Moore 744.02 1,343.19 19.29 19.29 0.40 3,502.87 63.64
Morris 0.21 0.37 0.01 0.01 0.00 2.01 0.03
Motley 3.80 6.72 0.12 0.12 0.00 52.75 0.49
Nacogdoches 1,527.76 2,897.04 24.29 24.29 0.77 12,723.39 353.60
Navarro 170.24 301.61 5.16 5.16 0.16 1,444.51 18.73
Newton 78.50 145.69 1.63 1.63 0.05 1,601.94 31.72
Nolan 133.50 240.21 3.63 3.63 0.11 1,931.63 25.88
Nueces 605.47 1,127.23 11.99 11.99 0.31 15,740.17 332.51
Ochiltree 561.88 1,020.35 13.94 13.94 0.31 5,760.68 108.67
Oldham 5.68 10.02 0.17 0.17 0.00 247.24 3.74
Orange 67.79 71.25 2.06 2.06 0.09 8,467.82 172.90
Palo Pinto 455.72 785.82 15.70 15.70 0.21 7,033.45 105.26
Panola 3,784.21 7,052.88 73.18 73.18 1.82 50,362.96 1,170.88
Parker 1,225.52 3,294.01 19.49 19.49 0.80 9,840.76 290.06
Parmer 0.00 0.00 0.00 0.00 0.00 0.00 0.00
Pecos 4,534.56 8,670.50 66.30 66.30 2.63 21,760.89 703.44
Polk 415.68 797.76 5.69 5.69 0.22 29,650.93 625.12
Potter 350.79 632.33 9.25 9.25 0.21 1,799.21 27.27
Presidio 0.00 0.00 0.00 0.00 0.00 0.00 0.00

xvi
Table E-2. State-wide Emissions Inventory for 2008 by County (Cont.)
County CO (tons/yr) NOx (tons/yr) PM10 (tons/yr)
PM2.5
(tons/yr) SO2 (tons/yr)
VOC
(tons/yr)
Total HAP
(tons/yr)
Rains 59.61 115.43 0.71 0.71 0.03 38.47 6.62
Randall 0.00 0.00 0.00 0.00 0.00 0.00 0.00
Reagan 1,209.82 2,204.56 29.89 29.89 0.99 11,808.61 158.58
Real 1.91 3.34 0.06 0.06 0.00 16.74 0.15
Red River 9.57 16.96 0.29 0.29 0.01 159.73 2.26
Reeves 575.50 1,077.94 10.88 10.88 0.36 3,146.28 72.34
Refugio 652.55 1,218.19 12.72 12.72 0.40 9,671.07 197.77
Roberts 881.18 1,659.43 15.47 15.47 0.45 15,296.54 346.65
Robertson 3,591.03 6,960.37 41.87 41.87 1.90 4,202.14 427.68
Rockwall 0.00 0.00 0.00 0.00 0.00 0.00 0.00
Runnels 145.66 262.06 3.96 3.96 0.12 1,177.54 15.82
Rusk 2,394.04 4,447.78 48.27 48.27 1.34 26,428.99 597.16
Sabine 2.04 3.67 0.06 0.06 0.00 19.20 0.14
San Augustine 159.66 309.99 1.77 1.77 0.09 452.69 23.22
San Jacinto 182.43 350.28 2.47 2.47 0.09 6,462.64 144.35
San Patricio 303.08 570.53 5.36 5.36 0.16 12,721.07 267.75
San Saba 0.00 0.00 0.00 0.00 0.00 0.00 0.00
Schleicher 297.16 521.39 9.30 9.30 0.15 3,975.13 56.43
Scurry 920.14 1,696.28 20.52 20.52 0.72 16,745.60 282.63
Shackelford 446.66 787.83 13.87 13.87 0.39 2,584.60 27.41
Shelby 788.21 1,506.84 11.24 11.24 0.40 4,681.48 153.59
Sherman 382.36 689.34 9.93 9.93 0.17 2,226.58 38.78
Smith 600.16 1,117.21 11.83 11.83 0.32 6,759.09 157.15
Somervell 69.05 132.73 0.93 0.93 0.04 261.32 10.71
Starr 1,801.98 3,435.69 27.08 27.08 0.92 39,905.70 922.75
Stephens 548.00 962.55 17.22 17.22 0.36 6,028.28 86.04
Sterling 507.62 898.57 15.24 15.24 0.35 5,045.87 54.84

xvii
Table E-2. State-wide Emissions Inventory for 2008 by County (Cont.)
County CO (tons/yr) NOx (tons/yr) PM10 (tons/yr)
PM2.5
(tons/yr) SO2 (tons/yr)
VOC
(tons/yr)
Total HAP
(tons/yr)
Stonewall 125.21 222.61 3.72 3.72 0.12 1,647.78 17.01
Sutton 1,536.07 2,640.40 53.45 53.45 0.57 14,703.05 158.36
Swisher 0.00 0.00 0.00 0.00 0.00 0.00 0.00
Tarrant 4,070.91 11,441.36 39.54 39.54 2.88 4,929.92 620.02
Taylor 92.16 163.25 2.80 2.80 0.09 693.08 8.42
Terrell 890.56 1,697.22 13.46 13.46 0.45 4,554.08 153.52
Terry 217.93 388.12 6.39 6.39 0.20 5,118.11 70.81
Throckmorton 221.50 393.95 6.55 6.55 0.20 1,242.06 15.21
Titus 42.19 74.68 1.29 1.29 0.04 506.68 8.03
Tom Green 170.07 304.64 4.76 4.76 0.14 1,945.37 23.40
Travis 3.37 5.97 0.10 0.10 0.00 14.43 0.07
Trinity 10.94 19.88 0.27 0.27 0.01 193.38 3.42
Tyler 463.76 896.18 5.69 5.69 0.25 57,953.39 1,201.05
Upshur 604.48 1,126.42 11.73 11.73 0.30 10,582.53 238.20
Upton 1,602.98 2,998.03 30.90 30.90 1.09 32,833.54 647.89
Uvalde 0.20 0.26 0.02 0.02 0.00 4.37 0.01
Val Verde 210.53 394.38 3.90 3.90 0.10 620.76 21.64
Van Zandt 193.81 352.82 4.81 4.81 0.15 1,204.59 23.27
Victoria 287.47 535.68 5.67 5.67 0.16 3,296.01 69.83
Walker 13.49 24.74 0.31 0.31 0.01 85.26 1.73
Waller 88.01 106.67 2.83 2.83 0.11 2,859.24 56.46
Ward 1,288.64 2,381.97 28.00 28.00 0.94 9,588.88 230.25
Washington 256.76 485.36 4.31 4.31 0.14 2,513.65 64.54
Webb 3,123.82 5,806.41 62.66 62.66 1.48 28,275.41 664.71
Wharton 692.11 1,309.84 11.43 11.43 0.37 15,986.48 354.54
Wheeler 2,223.92 4,231.74 34.40 34.40 1.15 40,674.02 955.94
Wichita 1,185.96 2,099.33 36.23 36.23 1.13 5,040.04 46.60

xviii
Table E-2. State-wide Emissions Inventory for 2008 by County (Cont.)
County CO (tons/yr) NOx (tons/yr) PM10 (tons/yr)
PM2.5
(tons/yr) SO2 (tons/yr)
VOC
(tons/yr)
Total HAP
(tons/yr)
Wilbarger 174.53 308.95 5.33 5.33 0.17 1,147.90 13.03
Willacy 353.53 681.05 4.59 4.59 0.19 8,274.58 193.92
Williamson 9.07 16.05 0.28 0.28 0.01 53.29 0.33
Wilson 129.98 230.01 3.98 3.98 0.12 757.55 6.10
Winkler 917.14 1,698.44 19.52 19.52 0.63 7,815.47 141.18
Wise 2,749.59 5,099.17 55.75 55.75 1.35 24,225.59 597.53
Wood 239.16 438.82 5.52 5.52 0.18 4,200.35 82.03
Yoakum 1,074.18 1,960.14 26.21 26.21 0.88 25,649.46 414.59
Young 556.32 978.60 17.57 17.57 0.50 3,394.26 35.11
Zapata 4,438.24 8,472.07 65.54 65.54 2.24 13,384.86 594.31
Zavala 64.75 114.70 1.94 1.94 0.05 1,016.76 14.24
Total: 128,330.85 247,236.91 2,570.01 2,570.01 81.34 1,568,522.73 34,090.45

1-1
1.0 INTRODUCTION
This study was implemented for the Texas Commission on Environmental Quality
(TCEQ) to identify and characterize area source emissions from upstream oil and gas production
sites that operated in Texas in 2008, and to provide county level emission estimates for each of
these source types.
This study was divided into four primary technical work tasks:
• Identification and review of existing studies pertaining to estimating emissions from oil
and gas production sites and recommendation of a preferred emission estimation
approach for each identified emissions source type;
• Development of survey materials that may be used to obtain detailed information needed
to estimate emissions, and identification of the producers of oil and gas for each county;
• Development of a methodology and calculator to estimate county-level emissions from
each identified source type; and
• Performance of emissions estimation calculations for a 2008 base year, including the
preparation of emissions inventory calculation spreadsheets (including activity data and
emission factors) and documentation of data, procedures, and results in a final project
report. Additionally, the final emissions inventory was imported into National Emissions
Inventory Input Format (NIF) 3.0 text files for import into the Texas Air Emissions
Repository (TexAER).
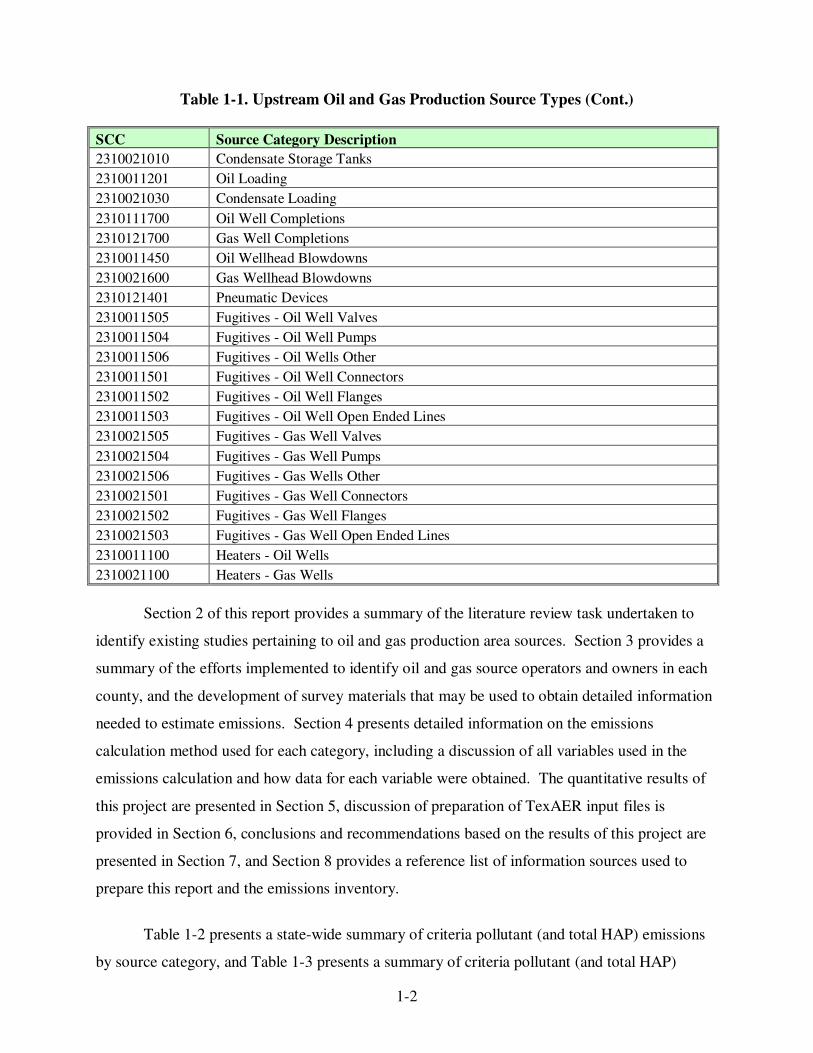
This project required compilation of data for each emission source type found at
upstream oil and gas production sites. Table 1-1 presents a list of each source type, including
their associated Source Classification Code (SCC).
Table 1-1. Upstream Oil and Gas Production Source Types
SCC Source Category Description
2310021101 Natural Gas Fired 2-Cycle Lean Burn Compressor Engines <50 Hp
2310021102 Natural Gas Fired 2-Cycle Lean Burn Compressor Engines 50 TO 499 Hp
2310020600 Natural Gas Fired 2-Cycle Rich Burn Compressor Engines
2310021203 Natural Gas Fired 4-Cycle Lean Burn Compressor Engines 500+ Hp
2310021301 Natural Gas Fired 4-Cycle Rich Burn Compressor Engines <50 Hp
2310021302 Natural Gas Fired 4-Cycle Rich Burn Compressor Engines 50 TO 499 Hp
2310021402 Natural Gas Fired 4-Cycle Rich Burn Compressor Engines 50-499 Hp W/ NSCR
2310021403 Natural Gas Fired 4-Cycle Rich Burn Compressor Engines 500+ Hp W/ NSCR
2310000330 Oil and Gas Exploration and Production Artificial Lift Engines
2310021400 Dehydrators
2310011020 Oil Storage Tanks
1-2
Table 1-1. Upstream Oil and Gas Production Source Types (Cont.)
SCC Source Category Description
2310021010 Condensate Storage Tanks
2310011201 Oil Loading
2310021030 Condensate Loading
2310111700 Oil Well Completions
2310121700 Gas Well Completions
2310011450 Oil Wellhead Blowdowns
2310021600 Gas Wellhead Blowdowns
2310121401 Pneumatic Devices
2310011505 Fugitives - Oil Well Valves
2310011504 Fugitives - Oil Well Pumps
2310011506 Fugitives - Oil Wells Other
2310011501 Fugitives - Oil Well Connectors
2310011502 Fugitives - Oil Well Flanges
2310011503 Fugitives - Oil Well Open Ended Lines
2310021505 Fugitives - Gas Well Valves
2310021504 Fugitives - Gas Well Pumps
2310021506 Fugitives - Gas Wells Other
2310021501 Fugitives - Gas Well Connectors
2310021502 Fugitives - Gas Well Flanges
2310021503 Fugitives - Gas Well Open Ended Lines
2310011100 Heaters - Oil Wells
2310021100 Heaters - Gas Wells
Section 2 of this report provides a summary of the literature review task undertaken to
identify existing studies pertaining to oil and gas production area sources. Section 3 provides a
summary of the efforts implemented to identify oil and gas source operators and owners in each
county, and the development of survey materials that may be used to obtain detailed information
needed to estimate emissions. Section 4 presents detailed information on the emissions
calculation method used for each category, including a discussion of all variables used in the
emissions calculation and how data for each variable were obtained. The quantitative results of
this project are presented in Section 5, discussion of preparation of TexAER input files is
provided in Section 6, conclusions and recommendations based on the results of this project are
presented in Section 7, and Section 8 provides a reference list of information sources used to
prepare this report and the emissions inventory.
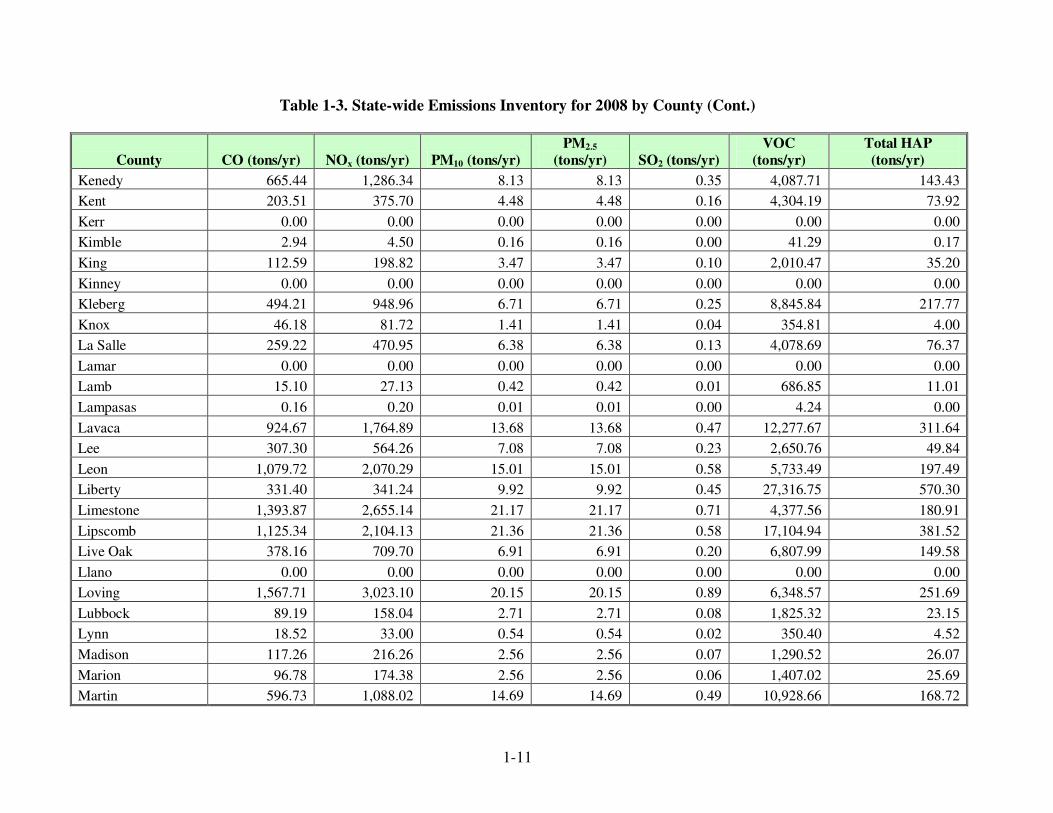
Table 1-2 presents a state-wide summary of criteria pollutant (and total HAP) emissions
by source category, and Table 1-3 presents a summary of criteria pollutant (and total HAP)

1-3
emissions for each county. As can be seen in these tables, emissions in 2008 from this area
source category on a state-wide basis are significant with over 200,000 tons of NOx, 1,500,000
tons of VOC, and 30,000 tons of HAP. The main source of NOx emissions are compressor
engines, while the main source of VOC and HAP emissions are oil and condensate storage tanks.

1-4
Table 1-2. State-wide Emissions Inventory for 2008 by Source Category
SCC Source Category Description
CO
(tons/yr)
NOx
(tons/yr)
PM10
(tons/yr)
PM2.5
(tons/yr)
SO2
(tons/yr)
VOC
(tons/yr)
Total
HAP
(tons/yr)
2310000330 Artificial Lift 23,169.14 46,369.72 154.04 154.04 9.56 440.12 140.49
2310011020 Storage Tanks: Crude Oil 282,420.05 5,060.01
2310011100 Heater Treater 9,267.25 11,032.44 838.47 838.47 21.32 606.78 208.67
2310011201
Tank Truck/Railcar Loading:
Crude Oil 26,810.72 479.91
2310011450 Wellhead 116,245.65
2310011501 Fugitives: Connectors 2,956.39
2310011502 Fugitives: Flanges 135.46
2310011503 Fugitives: Open Ended Lines 605.72
2310011504 Fugitives: Pumps 4,326.59
2310011505 Fugitives: Valves 7,821.14
2310011506 Fugitives: Other 12,480.55
2310020600 Compressor Engines 133.77 464.56 13.58 13.58 0.21 81.40 29.00
2310021010 Storage Tanks: Condensate 864,087.90 17,281.71
2310021030
Tank Truck/Railcar Loading
Condensate 7,235.50 144.71
2310021100 Gas Well Heaters 7,564.83 9,005.75 684.44 684.44 0.04 495.32 170.34
2310021101
Natural Gas Fired 2-Cycle Lean
Burn Compressor Engines <50 Hp 140.52 209.25 9.72 9.72 0.16 43.38 15.46
2310021102
Natural Gas Fired 2-Cycle Lean
Burn Compressor Engines 50 To
499 Hp 2,907.93 13,776.30 352.37 352.37 5.71 2,012.02 716.78
2310021203
Natural Gas Fired 4-Cycle Lean Burn Compressor Engines 500+
Hp 14,746.41 27,288.73 76.95 76.95 15.94 3,817.42 2,337.58
2310021301
Natural Gas Fired 4-Cycle Rich
Burn Compressor Engines <50 Hp 93.37 1,175.69 3.86 3.86 0.25 5.61 5.50

1-5
Table 1-2. State-wide Emissions Inventory for 2008 by Source Category (Cont.)
SCC Source Category Description
CO
(tons/yr)
NOx
(tons/yr)
PM10
(tons/yr)
PM2.5
(tons/yr)
SO2
(tons/yr)
VOC
(tons/yr)
Total
HAP
(tons/yr)
2310021302
Natural Gas Fired 4-Cycle Rich
Burn Compressor Engines 50 To
499hp 38,988.69 86,462.54 226.24 226.24 14.83 1,487.26 1,451.93
2310021400 Gas Well Dehydrators 904.59 293.36 6,344.85 5,255.17
2310021402
Natural Gas Fired 4-Cycle Rich
Burn Compressor Engines 50-
499hp W/ Nscr 767.55 3,321.00 35.02 35.02 2.05 17.73 17.46
2310021403
Natural Gas Fired 4-Cycle Rich
Burn Compressor Engines 500+
Hp W/ Nscr 29,646.80 47,837.57 175.33 175.33 11.26 794.33 775.73
2310021501 Fugitives: Connectors 1,161.52
2310021502 Fugitives: Flanges 1,199.68
2310021503 Fugitives: Open Ended Lines 916.82
2310021504 Fugitives: Pumps 476.31
2310021505 Fugitives: Valves 7,387.52
2310021506 Fugitives: Other 8,732.37
2310021600 Gas Well Venting 8,601.78
2310121700
Gas Well Completion: All Processes 10,139.56
2310111700
Oil Well Completion: All
Processes 19,425.44
2310121401 Gas Well Pneumatic Pumps 169,209.86
Total: 128,330.85 247,236.91 2,570.01 2,570.01 81.34 1,568,522.73 34,090.45

1-6
Table 1-3. State-wide Emissions Inventory for 2008 by County
County CO (tons/yr) NOx (tons/yr) PM10 (tons/yr)
PM2.5
(tons/yr) SO2 (tons/yr)
VOC
(tons/yr)
Total HAP
(tons/yr)
Anderson 241.28 444.72 5.31 5.31 0.16 2,858.24 52.77
Andrews 1,825.99 3,291.18 49.14 49.14 1.57 31,691.46 444.20
Angelina 161.97 311.11 2.15 2.15 0.08 629.30 25.94
Aransas 165.25 317.00 2.28 2.28 0.09 6,574.04 144.42
Archer 614.91 1,088.88 18.74 18.74 0.58 2,719.03 24.45
Armstrong 0.00 0.00 0.00 0.00 0.00 0.00 0.00
Atascosa 321.56 578.81 8.71 8.71 0.27 2,237.28 31.44
Austin 127.18 237.83 2.42 2.42 0.07 2,040.58 43.74
Bailey 0.00 0.00 0.00 0.00 0.00 0.00 0.00
Bandera 0.21 0.37 0.01 0.01 0.00 5.14 0.03
Bastrop 74.21 128.49 2.56 2.56 0.06 1,286.18 16.32
Baylor 26.78 47.39 0.82 0.82 0.03 189.33 1.96
Bee 581.15 1,101.85 9.42 9.42 0.31 4,717.44 125.89
Bell 0.00 0.00 0.00 0.00 0.00 0.00 0.00
Bexar 531.99 941.46 16.28 16.28 0.51 2,120.86 7.60
Blanco 0.00 0.00 0.00 0.00 0.00 0.00 0.00
Borden 166.31 300.48 4.40 4.40 0.14 4,107.39 62.92
Bosque 3.45 6.30 0.08 0.08 0.00 17.43 0.34
Bowie 5.13 9.25 0.14 0.14 0.00 148.70 2.69
Brazoria 207.73 199.95 6.59 6.59 0.28 14,003.43 292.15
Brazos 240.26 444.10 5.18 5.18 0.16 3,781.19 74.41
Brewster 0.00 0.00 0.00 0.00 0.00 5.88 0.00
Briscoe 0.00 0.00 0.00 0.00 0.00 12.33 0.01
Brooks 690.71 1,318.85 10.17 10.17 0.35 16,242.00 374.16
Brown 204.73 339.96 8.55 8.55 0.14 1,626.85 6.71
Burleson 366.21 669.08 8.80 8.80 0.28 3,881.39 67.20

1-7
Table 1-3. State-wide Emissions Inventory for 2008 by County (Cont.)
County CO (tons/yr) NOx (tons/yr) PM10 (tons/yr)
PM2.5
(tons/yr) SO2 (tons/yr)
VOC
(tons/yr)
Total HAP
(tons/yr)
Burnet 0.00 0.00 0.00 0.00 0.00 0.00 0.00
Caldwell 676.24 1,197.43 20.61 20.61 0.64 3,452.64 22.69
Calhoun 189.99 360.25 3.07 3.07 0.10 7,473.42 160.35
Callahan 182.61 321.30 5.76 5.76 0.16 983.48 9.65
Cameron 1.68 3.12 0.03 0.03 0.00 10.26 0.20
Camp 30.41 55.01 0.79 0.79 0.03 259.21 4.96
Carson 569.73 1,021.51 15.74 15.74 0.41 1,954.76 34.12
Cass 54.95 98.13 1.55 1.55 0.04 662.46 11.89
Castro 0.00 0.00 0.00 0.00 0.00 0.00 0.00
Chambers 84.76 94.63 2.75 2.75 0.11 4,424.08 90.13
Cherokee 364.58 682.18 6.78 6.78 0.18 2,911.32 72.93
Childress 1.69 2.99 0.05 0.05 0.00 57.40 0.71
Clay 231.82 409.65 7.14 7.14 0.21 1,476.89 16.60
Cochran 445.16 791.68 13.17 13.17 0.41 6,168.35 67.45
Coke 109.55 200.99 2.54 2.54 0.08 1,010.20 15.88
Coleman 173.73 295.58 6.51 6.51 0.13 1,363.81 9.92
Collin 0.00 0.00 0.00 0.00 0.00 0.00 0.00
Collingsworth 50.04 76.34 2.77 2.77 0.02 742.63 2.58
Colorado 319.38 601.84 5.54 5.54 0.16 4,980.62 115.78
Comal 0.00 0.00 0.00 0.00 0.00 0.00 0.00
Comanche 34.22 53.57 1.76 1.76 0.02 438.42 1.97
Concho 72.58 128.12 2.23 2.23 0.06 821.04 9.65
Cooke 495.43 884.64 14.25 14.25 0.45 3,467.02 50.26
Coryell 0.00 0.00 0.00 0.00 0.00 3.13 0.00
Cottle 95.67 180.55 1.63 1.63 0.05 2,376.44 52.30
Crane 1,739.98 3,208.47 38.61 38.61 1.26 17,274.91 291.73

1-8
Table 1-3. State-wide Emissions Inventory for 2008 by County (Cont.)
County CO (tons/yr) NOx (tons/yr) PM10 (tons/yr)
PM2.5
(tons/yr) SO2 (tons/yr)
VOC
(tons/yr)
Total HAP
(tons/yr)
Crockett 2,274.88 4,015.15 68.61 68.61 1.15 28,501.91 414.45
Crosby 85.55 151.51 2.61 2.61 0.08 1,056.14 9.67
Culberson 72.79 137.98 1.20 1.20 0.04 284.44 8.75
Dallam 0.00 0.00 0.00 0.00 0.00 0.00 0.00
Dallas 28.04 80.04 0.21 0.21 0.02 24.60 4.23
Dawson 275.48 492.78 7.84 7.84 0.25 5,344.51 72.02
Deaf Smith 0.00 0.00 0.00 0.00 0.00 0.00 0.00
Delta 0.00 0.00 0.00 0.00 0.00 0.00 0.00
Denton 1,763.52 4,690.36 29.51 29.51 1.14 13,254.59 416.58
Dewitt 676.49 1,300.83 9.00 9.00 0.35 11,617.04 287.72
Dickens 49.70 88.22 1.49 1.49 0.05 1,446.43 20.78
Dimmit 197.89 353.20 5.65 5.65 0.15 2,515.16 31.86
Donley 0.53 0.77 0.03 0.03 0.00 15.82 0.17
Duval 1,111.17 2,101.02 18.70 18.70 0.63 12,897.27 314.00
Eastland 285.26 476.94 11.51 11.51 0.18 3,654.84 39.72
Ector 1,798.24 3,277.22 44.40 44.40 1.47 26,211.12 388.97
Edwards 270.78 492.35 6.60 6.60 0.13 1,377.01 25.49
El Paso 0.00 0.00 0.00 0.00 0.00 0.00 0.00
Ellis 51.17 144.09 0.47 0.47 0.04 52.43 7.56
Erath 161.14 295.43 3.68 3.68 0.07 1,556.95 32.84
Falls 4.01 7.09 0.12 0.12 0.00 21.49 0.09
Fannin 0.00 0.00 0.00 0.00 0.00 11.86 0.00
Fayette 356.62 659.40 7.64 7.64 0.23 5,607.61 115.67
Fisher 107.82 193.50 2.99 2.99 0.09 1,365.54 16.44
Floyd 0.42 0.75 0.01 0.01 0.00 2.97 0.03
Foard 27.94 43.90 1.42 1.42 0.01 414.38 2.57

1-9
Table 1-3. State-wide Emissions Inventory for 2008 by County (Cont.)
County CO (tons/yr) NOx (tons/yr) PM10 (tons/yr)
PM2.5
(tons/yr) SO2 (tons/yr)
VOC
(tons/yr)
Total HAP
(tons/yr)
Fort Bend 169.68 171.80 5.51 5.51 0.22 8,072.59 166.58
Franklin 69.40 127.99 1.52 1.52 0.05 1,389.52 28.31
Freestone 3,821.60 7,289.51 56.95 56.95 1.93 9,858.72 475.09
Frio 139.12 246.28 4.21 4.21 0.12 1,393.74 14.40
Gaines 1,165.52 2,133.47 27.65 27.65 0.92 27,788.32 460.84
Galveston 86.46 76.28 2.61 2.61 0.12 17,475.45 358.12
Garza 445.72 790.41 13.45 13.45 0.42 6,133.80 63.01
Gillespie 0.00 0.00 0.00 0.00 0.00 0.00 0.00
Glasscock 416.67 761.54 10.00 10.00 0.32 5,431.20 84.49
Goliad 731.21 1,386.08 11.85 11.85 0.37 7,851.72 199.63
Gonzales 51.40 92.76 1.37 1.37 0.04 578.12 8.62
Gray 825.55 1,440.69 27.11 27.11 0.64 4,163.88 45.84
Grayson 201.98 365.62 5.22 5.22 0.16 1,707.03 31.65
Gregg 1,423.90 2,592.32 34.92 34.92 1.00 10,980.44 227.68
Grimes 334.10 638.29 4.87 4.87 0.17 1,264.12 50.60
Guadalupe 402.11 711.73 12.29 12.29 0.38 2,576.45 22.66
Hale 62.99 114.67 1.57 1.57 0.05 2,698.37 46.20
Hall 0.00 0.00 0.00 0.00 0.00 0.00 0.00
Hamilton 3.12 5.33 0.11 0.11 0.00 36.47 0.47
Hansford 377.68 676.20 10.32 10.32 0.17 2,601.06 43.25
Hardeman 52.13 92.68 1.54 1.54 0.05 1,230.36 19.89
Hardin 258.68 348.83 7.85 7.85 0.30 22,648.65 447.94
Harris 176.00 181.67 5.65 5.65 0.23 8,801.29 184.44
Harrison 1,879.59 3,514.48 35.19 35.19 0.93 25,383.90 583.58
Hartley 39.06 70.27 1.04 1.04 0.02 399.51 6.56
Haskell 53.83 95.30 1.64 1.64 0.05 443.81 5.44

1-10
Table 1-3. State-wide Emissions Inventory for 2008 by County (Cont.)
County CO (tons/yr) NOx (tons/yr) PM10 (tons/yr)
PM2.5
(tons/yr) SO2 (tons/yr)
VOC
(tons/yr)
Total HAP
(tons/yr)
Hays 0.00 0.00 0.00 0.00 0.00 0.00 0.00
Hemphill 2,092.63 3,936.72 37.08 37.08 1.03 32,774.76 754.74
Henderson 453.75 854.13 7.99 7.99 0.24 2,535.12 73.92
Hidalgo 3,264.69 6,276.64 43.49 43.49 1.68 56,554.95 1,407.72
Hill 308.20 597.97 3.53 3.53 0.16 233.61 34.41
Hockley 1,004.10 1,795.93 28.58 28.58 0.91 22,011.88 308.12
Hood 926.80 1,777.59 12.89 12.89 0.47 9,914.41 269.97
Hopkins 20.84 37.79 0.53 0.53 0.02 298.78 5.06
Houston 164.62 308.00 3.11 3.11 0.10 1,587.91 35.84
Howard 803.87 1,436.74 23.00 23.00 0.73 9,904.95 107.63
Hudspeth 0.12 0.17 0.01 0.01 0.00 3.29 0.03
Hunt 0.00 0.00 0.00 0.00 0.00 0.00 0.00
Hutchinson 903.43 1,601.32 27.09 27.09 0.72 4,039.66 49.29
Irion 531.51 961.89 13.77 13.77 0.40 5,877.27 82.51
Jack 646.65 1,121.02 21.80 21.80 0.42 6,701.91 92.20
Jackson 303.15 569.09 5.55 5.55 0.17 9,879.64 204.59
Jasper 205.58 394.00 2.87 2.87 0.11 6,405.78 143.58
Jeff Davis 0.00 0.00 0.00 0.00 0.00 1.29 0.03
Jefferson 287.19 182.64 8.05 8.05 0.46 55,659.21 1,163.27
Jim Hogg 266.50 500.41 4.83 4.83 0.14 4,021.10 92.33
Jim Wells 127.37 226.90 3.61 3.61 0.06 1,576.61 26.20
Johnson 4,495.48 12,647.53 43.01 43.01 3.19 5,209.18 684.81
Jones 167.32 296.69 5.05 5.05 0.16 1,277.91 14.79
Karnes 171.32 323.25 2.95 2.95 0.10 3,454.12 76.12
Kaufman 4.50 8.03 0.14 0.14 0.00 62.82 1.05
Kendall 0.00 0.00 0.00 0.00 0.00 0.00 0.00
1-11
Table 1-3. State-wide Emissions Inventory for 2008 by County (Cont.)
County CO (tons/yr) NOx (tons/yr) PM10 (tons/yr)
PM2.5
(tons/yr) SO2 (tons/yr)
VOC
(tons/yr)
Total HAP
(tons/yr)
Kenedy 665.44 1,286.34 8.13 8.13 0.35 4,087.71 143.43
Kent 203.51 375.70 4.48 4.48 0.16 4,304.19 73.92
Kerr 0.00 0.00 0.00 0.00 0.00 0.00 0.00
Kimble 2.94 4.50 0.16 0.16 0.00 41.29 0.17
King 112.59 198.82 3.47 3.47 0.10 2,010.47 35.20
Kinney 0.00 0.00 0.00 0.00 0.00 0.00 0.00
Kleberg 494.21 948.96 6.71 6.71 0.25 8,845.84 217.77
Knox 46.18 81.72 1.41 1.41 0.04 354.81 4.00
La Salle 259.22 470.95 6.38 6.38 0.13 4,078.69 76.37
Lamar 0.00 0.00 0.00 0.00 0.00 0.00 0.00
Lamb 15.10 27.13 0.42 0.42 0.01 686.85 11.01
Lampasas 0.16 0.20 0.01 0.01 0.00 4.24 0.00
Lavaca 924.67 1,764.89 13.68 13.68 0.47 12,277.67 311.64
Lee 307.30 564.26 7.08 7.08 0.23 2,650.76 49.84
Leon 1,079.72 2,070.29 15.01 15.01 0.58 5,733.49 197.49
Liberty 331.40 341.24 9.92 9.92 0.45 27,316.75 570.30
Limestone 1,393.87 2,655.14 21.17 21.17 0.71 4,377.56 180.91
Lipscomb 1,125.34 2,104.13 21.36 21.36 0.58 17,104.94 381.52
Live Oak 378.16 709.70 6.91 6.91 0.20 6,807.99 149.58
Llano 0.00 0.00 0.00 0.00 0.00 0.00 0.00
Loving 1,567.71 3,023.10 20.15 20.15 0.89 6,348.57 251.69
Lubbock 89.19 158.04 2.71 2.71 0.08 1,825.32 23.15
Lynn 18.52 33.00 0.54 0.54 0.02 350.40 4.52
Madison 117.26 216.26 2.56 2.56 0.07 1,290.52 26.07
Marion 96.78 174.38 2.56 2.56 0.06 1,407.02 25.69
Martin 596.73 1,088.02 14.69 14.69 0.49 10,928.66 168.72

1-12
Table 1-3. State-wide Emissions Inventory for 2008 by County (Cont.)
County CO (tons/yr) NOx (tons/yr) PM10 (tons/yr)
PM2.5
(tons/yr) SO2 (tons/yr)
VOC
(tons/yr)
Total HAP
(tons/yr)
Mason 0.00 0.00 0.00 0.00 0.00 0.00 0.00
Matagorda 609.79 1,168.96 8.47 8.47 0.32 19,098.24 428.64
Maverick 182.47 323.89 5.42 5.42 0.15 3,715.58 42.08
McCulloch 14.65 25.47 0.50 0.50 0.01 109.65 1.15
McLennan 8.65 15.30 0.26 0.26 0.01 27.43 0.12
McMullen 493.90 900.42 11.92 11.92 0.29 6,027.42 110.63
Medina 275.72 487.25 8.50 8.50 0.26 1,235.77 4.54
Menard 27.00 47.52 0.85 0.85 0.02 266.84 2.69
Midland 1,610.04 2,951.97 37.75 37.75 1.27 20,938.23 333.93
Milam 218.91 387.83 6.65 6.65 0.21 1,216.87 9.32
Mills 0.36 0.51 0.02 0.02 0.00 6.38 0.02
Mitchell 502.49 890.13 15.28 15.28 0.48 6,645.63 65.00
Montague 551.48 987.06 15.59 15.59 0.49 3,448.92 48.39
Montgomery 73.56 81.80 2.86 2.86 0.08 2,890.56 54.67
Moore 744.02 1,343.19 19.29 19.29 0.40 3,502.87 63.64
Morris 0.21 0.37 0.01 0.01 0.00 2.01 0.03
Motley 3.80 6.72 0.12 0.12 0.00 52.75 0.49
Nacogdoches 1,527.76 2,897.04 24.29 24.29 0.77 12,723.39 353.60
Navarro 170.24 301.61 5.16 5.16 0.16 1,444.51 18.73
Newton 78.50 145.69 1.63 1.63 0.05 1,601.94 31.72
Nolan 133.50 240.21 3.63 3.63 0.11 1,931.63 25.88
Nueces 605.47 1,127.23 11.99 11.99 0.31 15,740.17 332.51
Ochiltree 561.88 1,020.35 13.94 13.94 0.31 5,760.68 108.67
Oldham 5.68 10.02 0.17 0.17 0.00 247.24 3.74
Orange 67.79 71.25 2.06 2.06 0.09 8,467.82 172.90
Palo Pinto 455.72 785.82 15.70 15.70 0.21 7,033.45 105.26

1-13
Table 1-3. State-wide Emissions Inventory for 2008 by County (Cont.)
County CO (tons/yr) NOx (tons/yr) PM10 (tons/yr)
PM2.5
(tons/yr) SO2 (tons/yr)
VOC
(tons/yr)
Total HAP
(tons/yr)
Panola 3,784.21 7,052.88 73.18 73.18 1.82 50,362.96 1,170.88
Parker 1,225.52 3,294.01 19.49 19.49 0.80 9,840.76 290.06
Parmer 0.00 0.00 0.00 0.00 0.00 0.00 0.00
Pecos 4,534.56 8,670.50 66.30 66.30 2.63 21,760.89 703.44
Polk 415.68 797.76 5.69 5.69 0.22 29,650.93 625.12
Potter 350.79 632.33 9.25 9.25 0.21 1,799.21 27.27
Presidio 0.00 0.00 0.00 0.00 0.00 0.00 0.00
Rains 59.61 115.43 0.71 0.71 0.03 38.47 6.62
Randall 0.00 0.00 0.00 0.00 0.00 0.00 0.00
Reagan 1,209.82 2,204.56 29.89 29.89 0.99 11,808.61 158.58
Real 1.91 3.34 0.06 0.06 0.00 16.74 0.15
Red River 9.57 16.96 0.29 0.29 0.01 159.73 2.26
Reeves 575.50 1,077.94 10.88 10.88 0.36 3,146.28 72.34
Refugio 652.55 1,218.19 12.72 12.72 0.40 9,671.07 197.77
Roberts 881.18 1,659.43 15.47 15.47 0.45 15,296.54 346.65
Robertson 3,591.03 6,960.37 41.87 41.87 1.90 4,202.14 427.68
Rockwall 0.00 0.00 0.00 0.00 0.00 0.00 0.00
Runnels 145.66 262.06 3.96 3.96 0.12 1,177.54 15.82
Rusk 2,394.04 4,447.78 48.27 48.27 1.34 26,428.99 597.16
Sabine 2.04 3.67 0.06 0.06 0.00 19.20 0.14
San Augustine 159.66 309.99 1.77 1.77 0.09 452.69 23.22
San Jacinto 182.43 350.28 2.47 2.47 0.09 6,462.64 144.35
San Patricio 303.08 570.53 5.36 5.36 0.16 12,721.07 267.75
San Saba 0.00 0.00 0.00 0.00 0.00 0.00 0.00
Schleicher 297.16 521.39 9.30 9.30 0.15 3,975.13 56.43
Scurry 920.14 1,696.28 20.52 20.52 0.72 16,745.60 282.63
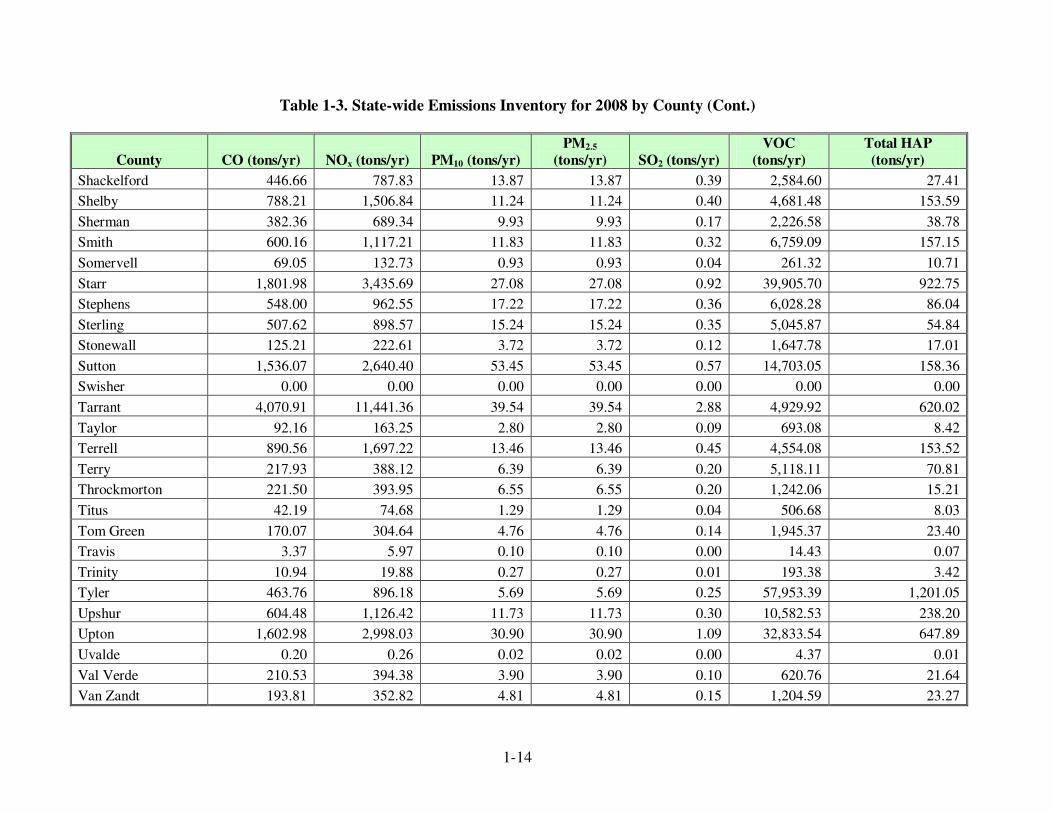
1-14
Table 1-3. State-wide Emissions Inventory for 2008 by County (Cont.)
County CO (tons/yr) NOx (tons/yr) PM10 (tons/yr)
PM2.5
(tons/yr) SO2 (tons/yr)
VOC
(tons/yr)
Total HAP
(tons/yr)
Shackelford 446.66 787.83 13.87 13.87 0.39 2,584.60 27.41
Shelby 788.21 1,506.84 11.24 11.24 0.40 4,681.48 153.59
Sherman 382.36 689.34 9.93 9.93 0.17 2,226.58 38.78
Smith 600.16 1,117.21 11.83 11.83 0.32 6,759.09 157.15
Somervell 69.05 132.73 0.93 0.93 0.04 261.32 10.71
Starr 1,801.98 3,435.69 27.08 27.08 0.92 39,905.70 922.75
Stephens 548.00 962.55 17.22 17.22 0.36 6,028.28 86.04
Sterling 507.62 898.57 15.24 15.24 0.35 5,045.87 54.84
Stonewall 125.21 222.61 3.72 3.72 0.12 1,647.78 17.01
Sutton 1,536.07 2,640.40 53.45 53.45 0.57 14,703.05 158.36
Swisher 0.00 0.00 0.00 0.00 0.00 0.00 0.00
Tarrant 4,070.91 11,441.36 39.54 39.54 2.88 4,929.92 620.02
Taylor 92.16 163.25 2.80 2.80 0.09 693.08 8.42
Terrell 890.56 1,697.22 13.46 13.46 0.45 4,554.08 153.52
Terry 217.93 388.12 6.39 6.39 0.20 5,118.11 70.81
Throckmorton 221.50 393.95 6.55 6.55 0.20 1,242.06 15.21
Titus 42.19 74.68 1.29 1.29 0.04 506.68 8.03
Tom Green 170.07 304.64 4.76 4.76 0.14 1,945.37 23.40
Travis 3.37 5.97 0.10 0.10 0.00 14.43 0.07
Trinity 10.94 19.88 0.27 0.27 0.01 193.38 3.42
Tyler 463.76 896.18 5.69 5.69 0.25 57,953.39 1,201.05
Upshur 604.48 1,126.42 11.73 11.73 0.30 10,582.53 238.20
Upton 1,602.98 2,998.03 30.90 30.90 1.09 32,833.54 647.89
Uvalde 0.20 0.26 0.02 0.02 0.00 4.37 0.01
Val Verde 210.53 394.38 3.90 3.90 0.10 620.76 21.64
Van Zandt 193.81 352.82 4.81 4.81 0.15 1,204.59 23.27

1-15
Table 1-3. State-wide Emissions Inventory for 2008 by County (Cont.)
County CO (tons/yr) NOx (tons/yr) PM10 (tons/yr)
PM2.5
(tons/yr) SO2 (tons/yr)
VOC
(tons/yr)
Total HAP
(tons/yr)
Victoria 287.47 535.68 5.67 5.67 0.16 3,296.01 69.83
Walker 13.49 24.74 0.31 0.31 0.01 85.26 1.73
Waller 88.01 106.67 2.83 2.83 0.11 2,859.24 56.46
Ward 1,288.64 2,381.97 28.00 28.00 0.94 9,588.88 230.25
Washington 256.76 485.36 4.31 4.31 0.14 2,513.65 64.54
Webb 3,123.82 5,806.41 62.66 62.66 1.48 28,275.41 664.71
Wharton 692.11 1,309.84 11.43 11.43 0.37 15,986.48 354.54
Wheeler 2,223.92 4,231.74 34.40 34.40 1.15 40,674.02 955.94
Wichita 1,185.96 2,099.33 36.23 36.23 1.13 5,040.04 46.60
Wilbarger 174.53 308.95 5.33 5.33 0.17 1,147.90 13.03
Willacy 353.53 681.05 4.59 4.59 0.19 8,274.58 193.92
Williamson 9.07 16.05 0.28 0.28 0.01 53.29 0.33
Wilson 129.98 230.01 3.98 3.98 0.12 757.55 6.10
Winkler 917.14 1,698.44 19.52 19.52 0.63 7,815.47 141.18
Wise 2,749.59 5,099.17 55.75 55.75 1.35 24,225.59 597.53
Wood 239.16 438.82 5.52 5.52 0.18 4,200.35 82.03
Yoakum 1,074.18 1,960.14 26.21 26.21 0.88 25,649.46 414.59
Young 556.32 978.60 17.57 17.57 0.50 3,394.26 35.11
Zapata 4,438.24 8,472.07 65.54 65.54 2.24 13,384.86 594.31
Zavala 64.75 114.70 1.94 1.94 0.05 1,016.76 14.24
Total: 128,330.85 247,236.91 2,570.01 2,570.01 81.34 1,568,522.73 34,090.45
2-1
2.0 AVAILABLE EMISSIONS ESTIMATION METHODOLOGY
REVIEW
One of the objectives of this project was to conduct a literature review of available
studies, reports, and research activities relevant to the development of a 2008 base year area
source emissions inventory for upstream oil and gas production sites. From this review, a
preferred emission estimation approach for each category was selected. In the project Work
Plan, this work was referred to as Task 2. The existing studies which were reviewed, and a
summary of the available and recommended emission estimation approaches for each source
type were presented in a memo submitted to TCEQ on April 26, 2010. This memo included
summaries of the data required to implement the preferred approach, and ERG’s
recommendations how best to obtain the needed data. In addition, any data gaps identified that
impacted the ability to develop a 2008 inventory estimate for each source type were described
and possible methods for addressing the data gaps (through the use of existing or default data)
were presented.
Appendix A contains a copy of this memo summarizing the activities conducted under
this part of the project.

3-1
3.0 IDENTIFICATION OF OIL AND GAS OWNERS/OPERATORS AND
SURVEY DEVELOPMENT
As mentioned above, one of the objectives of this project was the development of survey
materials that may be used to obtain the detailed, source-specific data needed to estimate county-
level emissions for each source type. Additionally, identification of the producers of oil and gas
for each county was needed to assist in possible future implementation of a field survey to obtain
the required data. In the project Work Plan, this work was referred to as Task 3. Both of these
objectives were met and this information was provided to TCEQ in a memo submitted on July 9,
2010.
Appendix B contains a copy of this memo summarizing the activities conducted under
this part of the project.

4-1
4.0 EMISSIONS CALCULATION METHODOLOGY
This section presents a discussion of each source type included in the 2008 baseline area
source emissions inventory of upstream oil and gas production sites. Each source type is
discussed separately, including a process description, a description of the emissions estimation
methodology used to calculate emissions, a description of the derivation of all activity data and
input parameters used in the calculation, presentation of all data used in the calculation, the
equations used to calculate emissions for each source type, and an example calculation for each
source type.
4.1 Compressor Engines
Natural gas fueled spark-ignited internal combustion engines are normally used to drive
gas field compressors. The compressors are used to boost the pressure of well-head natural gas
so that it can be injected into higher pressure gathering lines. These compressor engines burn
well-head natural gas and can represent a significant NOx area emissions source category as they
generally operate 8,760 hours per year with minimum down-time.
Emissions from compressor engines were calculated using a methodology similar to that
employed in the Houston Advanced Research Council’s (HARC) study “Natural Gas
Compressor Engine Survey and Engine NOx Emissions at Gas Production Facilities” (HARC,
2005).1 For this 2008 inventory, the calculation methodology uses annual natural gas production
by county along with vender-derived county-level emission factors to determine emissions from
compressor engines at gas production facilities. ERG combined engine data from the HARC
study with two 2007 TCEQ engine surveys conducted on the counties located in the Dallas -
Forth Worth (DFW) metropolitan area and Southeast Texas. The two TCEQ surveys were
completed as efforts to amend the state clean air plan for ozone. Engine operators reported
engine models and sizes, and other data to TCEQ. Using these data, ERG calculated county-
level emissions from compressor engines with the following equation:
1 The HARC 2005 report was updated in 2006 to include more engine size categories and to add the year 2000 to the
previous inventory; however, these updates did not change the calculation methodology used in the original 2005
report.

4-2
where:
Eik is the emissions for county i, and pollutant k [tons/yr]
TGPi is the total gas production in county i [Mscf/yr]
F1i is the fraction of wells requiring compression in county i
F2j is the fraction of compression load represented by engines of type j
EFjk is the emission factor for engine type j, and pollutant k [g/Hp-hr]
Ci is the compression requirements for county i [Hp-hr/Mscf]
907,180 is the conversion factor from grams to tons of emissions
Total gas production in county i, TGPi:
Natural gas production data by county (TGPi) was provided for 2008 by the TRC for 241
counties. Burnet, Castro, Collin, Comal, Dallam, Deaf Smith, Delta, El Paso, Gillespie, Hall,
Kendall, Lamar, Llano, Mason, Parmer, Presidio, Randall, San Saba, and Swisher counties had
no gas or oil production in 2008.
Fraction of wells requiring compression in county i, F1i:
Upon initial well completion, not all wells require compression. Therefore, the fraction
of wells requiring compression (F1i) was estimated in the HARC study as the fraction of active
wells greater than one year old. Using the same assumption for this 2008 inventory, ERG
determined the fraction of wells active in 2008 that were greater than one year old using the
following equation:
−=>
2008) 5,February on WellsActive (Total
2007)in Completed (Wells1 OldYear 1 WellsofFraction
For each Texas Railroad Commission (TRC) District, results are shown in Table 4-1.
ERG determined the number of wells completed in 2007 using TRC annual drilling, completion,
and plugging summaries which are available at:
http://www.rrc.state.tx.us/data/drilling/drillingsummary/index.php. Total active wells by district
for January 1, 2008 are not readily available from the TRC website; therefore, in order to
determine total active wells, ERG used gas well distribution data showing the number of regular
producing gas wells by county. Gas well distribution data by county is only available from the
TRC website on a bi-annual (February and September) basis and can be found at:
∗∗∗×=
180,907
21 ijkji
iik
CEFFFTGPE

4-3
http://www.rrc.state.tx.us/data/wells/wellcount/index.php. Using the February 2008 TRC report,
ERG summed the county specific numbers for regular producing gas wells by TRC district.
The fraction of wells greater than one year old are likely to be slightly different than what
is shown below because each well that was completed in 2007 could have been completed on
any day of that year. Using the methodology explained above, ERG has assumed that all wells
completed in 2007 were completed on February 5, 2007. ERG applied the fractions shown in the
Table 4-1 to the counties in each respective district.
Table 4-1. Fraction of Wells >1 Year Old
TRC
District
Wells Completed
in 2007
Total Active Wells
on February 5, 2008
Fraction of Wells
>1 Year Old (F1i)
1 176 2,513 0.9300
2 515 3,293 0.8436
3 317 3,977 0.9203
4 1,070 13,098 0.9183
5 644 7,008 0.9081
6 1,957 13,706 0.8572
7B 121 6,769 0.9821
7C 947 13,101 0.9277
8 225 3,909 0.9424
8A 36 265 0.8642
9 1,781 7,739 0.7699
10 854 12,647 0.9325
Total 8,643 88,025 0.9018
Fraction of compression load represented by engines of type j, F2j:
Fraction of compression load by engine type (F2j) was determined by the HARC report
for eight engine types (i.e. 2-cycle lean, 50-499 Hp; 4-cycle lean, 50-499 Hp; etc.) in three areas
categorized by their attainment status, including the Texas attainment areas, the Houston
nonattainment area, and the Dallas nonattainment area. For this 2008 inventory, in an effort to
achieve more accurate emissions data results, ERG combined data from the two 2007 TCEQ
engine surveys with the HARC survey data and determined the distribution or fraction of
compression load by engine type for the most reported engines (comprising 80% of the
population) for each of the three categories used in the HARC report.

4-4
In order to prevent duplication, 103 engines from the HARC study were removed prior to
combining the data with the two 2007 TCEQ engine surveys. These engines were removed
because they were located in thirteen counties (Austin, Ellis, Hardin, Houston, Jasper, Jefferson,
Newton, Polk, San Augustine, San Jacinto, Trinity, Tyler, and Walker) that overlapped with the
2007 survey data. The 2007 data had a greater population (335) of engines for these counties
than the HARC study. ERG also removed the following engines from the two 2007 TCEQ
engine survey data sets:
• Fifty-five engines from the DFW survey and two engines from the Southeast survey that
lacked engine characteristic data;
• Two engines from the HARC study that were labeled as electric motors;
• Three engines from the HARC study that were identified as not being located at a gas
well; and
• One engine from the DFW survey identified as no longer operational.
After combining the data sets (and removing certain engines as discussed above), a total
of 2,880 engines were included for the analysis as detailed in Table 4-2 below.
Table 4-2. Engine Count by Survey
Specific Survey Number of Engines
HARC Survey 1,252
2007 TCEQ DFW Survey 1,321
2007 TCEQ SE Survey 307
Total 2,880
In order to ensure engines were grouped appropriately, ERG performed extensive internet
research as well as phone interviews with engine manufactures to standardize engine make and
model naming conventions. Additionally, some assumptions were made such as all Caterpillar
engines reported in the survey data are natural gas fired (many respondents had reported engine
models without using the term “G” in front of the model number which defines the engine as a
natural gas fired engine). ERG also assumed that any potential (future) engines identified in the
2007 DFW survey would be located in the Dallas nonattainment area. Minor gap-filling was
also performed on the combined dataset which included completing any empty “Engine Cycle (2
or 4)” data fields based on the known engine make and model.
Using the combined dataset, ERG determined an average size (horsepower) for each
specific engine model and then calculated the fraction of compression load by engine type (F2j)

4-5
for three categories (Texas attainment areas, the Dallas nonattainment area, and the Houston
nonattainment area) as shown in Tables 4-3 through 4-5. Due to minimal engine data in the
Jefferson, Hardin, and Orange nonattainment counties, these counties were combined into the
Houston nonattainment area.
Emission factor for engine type j, and pollutant k, EFjk:
Emission factors for each unique engine make and model (based on approximately the
top 80% most reported engines in each of the three attainment status categories) are shown in
Tables 4-3 through 4-5. The NOx, CO, and VOC emission factors for the engines located in
attainment counties (Table 4-3) were each determined through extensive internet research as well
as phone interviews with specific engine manufactures. Manufacture emissions data was
averaged across all performance data given for a specific engine.
NOx emission factors for the engines located in nonattainment counties (Table 4-5) are
based on Texas’s rules for the Houston-Galveston-Brazoria eight-hour ozone nonattainment area
(30 TAC, Chapter 117, Subchapter D, Division 1 and 2). These rules regulate certain minor
sources of NOx, including some stationary, gas-fired reciprocating internal combustion engines.
Considering the Houston-Galveston-Brazoria rule, all stationary, gas-fired reciprocating internal
combustion engines greater than 50 horsepower are restricted to 0.5 g/Hp-hr. Considering the
Dallas-Fort Worth rule, rich burn engines greater than 50 horsepower are restricted to 0.5 g/Hp-
hr, lean burn engines installed or moved before June 1, 2007 are limited to 0.7 g/Hp-hr, and lean
burn engines installed or moved after June 1, 2007 are limited to 0.5 g/Hp-hr. ERG calculated
that ~16% percent of lean burn engines operating in DFW counties in 2008 could have
potentially been installed after June 1, 2007. Therefore, an adjusted NOx emission factor of 0.67
g/Hp-hr [(0.50 * .16) + (0.70 * .84)] was applied to any lean burn engines in Table 4-4.
However, the compliance date for the Dallas-Fort Worth rule was not until after 2008, therefore
the attainment area NOx emission factor in Table 4-3 was used for these counties for this 2008
base year inventory.
CO and VOC emission factors for the engines located in nonattainment counties (Tables
4-4 and 4-5) were determined through extensive internet research as well as phone interviews
with specific engine manufactures. However, ERG assumed any four stroke rich burn engine,
greater than 50 Hp and located in a nonattainment area, would have non-selective catalytic

4-6
Table 4-3. Emission Factor Data for Texas Attainment Areas
Emission Factor (EFjk) (g/Hp-hr)
Engine Make & Model SCC Number of
Engines
[Lean / Rich]
Engine
Horsepower
(Hp)
Compression
Load by Engine
Type (F2j)
Fuel Consumption
(MMBtu/Hp-hr) PM NOx CO VOC SO2
CAT G3306 NA 2310021302 0 / 165 145 8.98% 0.007775 3.35E-02 13.48 13.46 0.22 2.07E-03
CAT G3304 NA 2310021302 0 / 130 95 4.64% 0.007567 3.26E-02 21.08 1.6 0.24 2.02E-03
Wauk VRG330 2310021302 0 / 107 68 2.73% 0.008038 3.46E-02 12.951 1.104 0.05 (1) 2.14E-03
CAT G3306 TA 2310021302 0 / 67 203 5.11% 0.008098 3.49E-02 16.57 16.57 0.12 2.16E-03
Wauk F817 G 2310021302 0 / 42 87 1.37% 0.007253 3.13E-02 16.0 1.0 1.7 (2) 1.93E-03
AJAX DPC-60 2310021102 39 / 0 58 0.85% 0.009000 1.57E-01 4.4 1.7 0.8 2.40E-03
AJAX DPC-115 2310021102 /2310020600
31 / 2 110 1.36% 0.009000 1.57E-01 4.4 2.4 0.9 2.40E-03
Wauk F1197 G 2310021302 0 / 32 183 2.20% 0.007253 3.13E-02 20.0 1.0 0.20 (1) 1.93E-03
CAT G3406 NA (3) 2310021302 0 / 31 290 3.37% 0.007407 3.19E-02 23.2267 6.14 0.17 1.98E-03
CAT G3516 TALE 2310021203 30 / 0 1245 14.02% 0.007365 2.58E-04 2.0 1.805 0.28 1.96E-03
CAT G3306 NA HCR (4) 2310021302 0 / 29 145 1.58% 0.007775 3.35E-02 13.48 13.46 0.22 2.07E-03
AJAX DPC-360 2310021102
/2310020600 27 / 1 346 3.64% 0.008400 1.46E-01 6.3 1.4 1.0 2.24E-03
AJAX DPC-180 2310021102 28 / 0 173 1.82% 0.008400 1.46E-01 6.3 1.4 1.0 2.24E-03
AJAX DPC-140 2310021102 26 / 0 134 1.31% 0.008200 1.43E-01 10.5 1.3 0.7 2.19E-03
AJAX DPC-280 2310021102 25 / 0 269 2.52% 0.008200 1.43E-01 11.4 1.3 0.7 2.19E-03
Wauk VRG220 (5) 2310021301 0 / 24 45 0.41% 0.008038 3.46E-02 12.951 1.104 0.05 (1) 2.14E-03
AJAX DPC-80 2310021102 22 / 0 77 0.64% 0.008900 1.55E-01 4.4 2.8 0.9 2.37E-03
CAT G342 NA (6) 2310021302 0 / 21 225 1.77% 0.008588 3.70E-02 0.101 0.317 0.086 (1) 2.29E-03
AJAX C-42 2310021101 /2310020600
19 / 1 40 0.30% 0.009900 1.72E-01 4.4 3.3 0.8 2.64E-03
GEMINI G26 2310021301 0 / 19 26 0.19% 0.008038 3.46E-02 12.951 1.104 0.05 (1) 2.14E-03
Wauk L7042 GL (7) 2310021203 19 / 0 1357 9.68% 0.007238 2.53E-02 1.0 2.85 0.95 (1) 1.93E-03
CAT G342 TA (6) 2310021302 0 / 16 225 1.35% 0.008588 3.70E-02 0.101 0.317 0.086 (1) 2.29E-03
Wauk VRG310 (5) 2310021302 0 / 16 68 0.41% 0.008038 3.46E-02 12.951 1.104 0.05 (1) 2.14E-03
CAT G399 TA (10) 2310021403 0 / 16 802 4.82% 0.008710 3.75E-02 0.7756 0.1592 0.0086 (8) 2.32E-03
Wauk L7042 GSI (10) 2310021403 0 / 15 1357 7.64% 0.007558 3.26E-02 1.6 1.3 0.025 (1) 2.02E-03
CAT G398 TA (9, 10) 2310021403 0 / 15 605 3.41% 0.008710 3.75E-02 0.7756 0.1592 0.0086 (8) 2.32E-03
CAT G3406 TA 2310021302 0 / 14 290 1.52% 0.007407 3.19E-02 23.2267 6.14 0.17 1.98E-03
CAT G3512 TALE 2310021203 14 / 0 932 4.90% 0.007385 2.58E-04 2.0 2.04 0.295 1.97E-03
CAT G3406 (11) 2310021302 0 / 14 290 1.52% 0.007407 3.19E-02 23.2267 6.14 0.17 1.98E-03
Wauk L7042 G (10) 2310021403 0 / 14 961 5.05% 0.007180 3.09E-02 1.6 1.3 0.025 (1) 1.91E-03

4-7
Table 4-3. Emission Factor Data for Texas Attainment Areas (Cont.)
Emission Factor (EFjk) (g/Hp-hr)
Engine Make & Model SCC Number of
Engines
[Lean / Rich]
Engine
Horsepower
(Hp)
Compression
Load by Engine
Type (F2j)
Fuel Consumption
(MMBtu/Hp-hr) PM NOx CO VOC SO2
AJAX DPC-230 2310021102 /2310020600
10 / 1 221 0.91% 0.008700 1.52E-01 4.4 2.4 0.90 2.32E-03
TOTAL -- 1082 -- 100% Weighted Average
EFs 0.04 7.57 3.85 0.35 2.07E-03
1. Non-Methane Hydrocarbon.
2. Total Hydrocarbon.
3. There is no emission factor data available distinguishing CAT G4306 NA from G3406 TA, thus it was assumed that emission factors were the same for both models.
4. There is no emission factor data available distinguishing CAT G3306 NA HCR from G3306 NA, thus it was assumed that emission factors were the same for both models.
5. Based on discussions with Waukesha, the VRG220 and VRG310 models have the same emission factors as the VRG330.
6. Emissions data based on AP-42 background document with no HAP control. Emission factor data did not differentiate between a G342 TA or NA engine, thus same emission factors were assumed for both models.
7. No emission factor data could be found for this engine. Because it is a 4-stroke and has similar horsepower to the Wauk VRG220, it was assumed that emission factors were the same for both models.
8. Assumed to be equal to CAT G342 NA.
9. No emission factor data could be found for this engine. Since it is a similar model manufactured in the same time period, it was assumed that emission factors were the same as CAT G399 TA.
10. Engines are documented as having non-selective catalytic reduction (NSCR) control technology. ERG has applied a 90% reduction to the emission factors for CO and VOC for these engines
11. There is some ambiguity in the survey data as to whether this engine is a CAT G3406 NA or TA; however, the emissions are the same for the G3406 TA and NA versions.
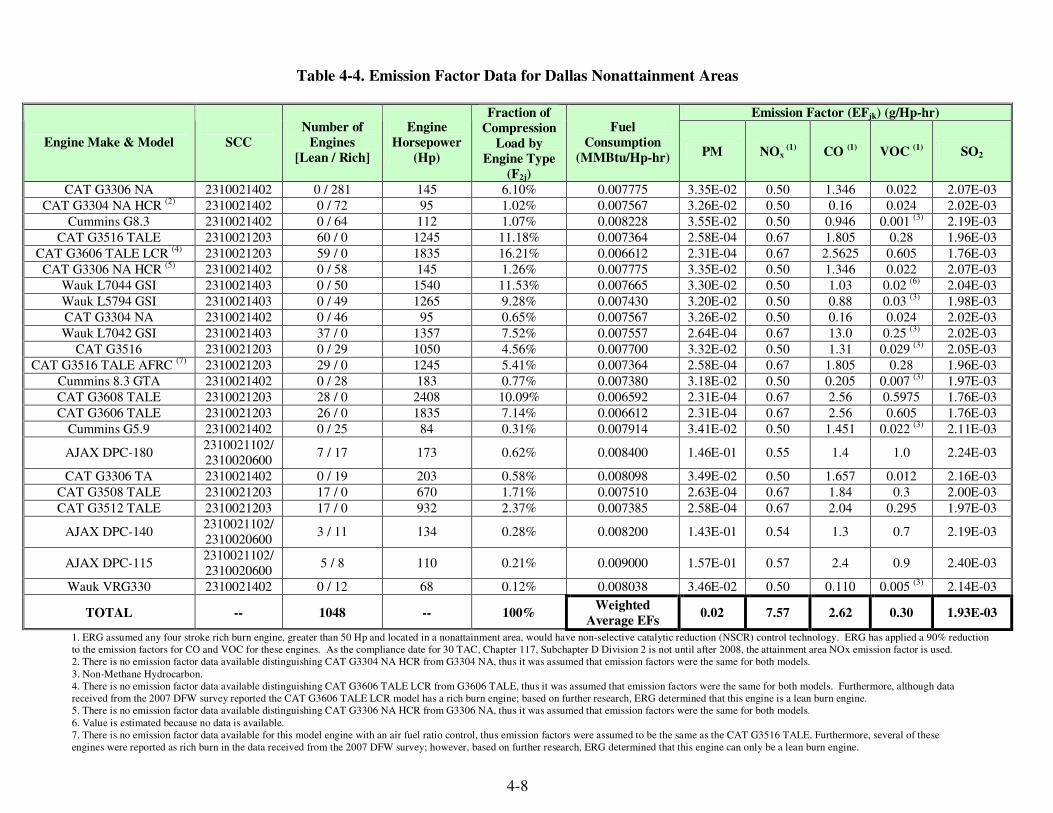
4-8
Table 4-4. Emission Factor Data for Dallas Nonattainment Areas
Emission Factor (EFjk) (g/Hp-hr)
Engine Make & Model SCC
Number of
Engines
[Lean / Rich]
Engine
Horsepower
(Hp)
Fraction of
Compression
Load by
Engine Type
(F2j)
Fuel
Consumption
(MMBtu/Hp-hr) PM NOx
(1) CO
(1) VOC
(1) SO2
CAT G3306 NA 2310021402 0 / 281 145 6.10% 0.007775 3.35E-02 0.50 1.346 0.022 2.07E-03
CAT G3304 NA HCR (2) 2310021402 0 / 72 95 1.02% 0.007567 3.26E-02 0.50 0.16 0.024 2.02E-03
Cummins G8.3 2310021402 0 / 64 112 1.07% 0.008228 3.55E-02 0.50 0.946 0.001 (3) 2.19E-03
CAT G3516 TALE 2310021203 60 / 0 1245 11.18% 0.007364 2.58E-04 0.67 1.805 0.28 1.96E-03
CAT G3606 TALE LCR (4) 2310021203 59 / 0 1835 16.21% 0.006612 2.31E-04 0.67 2.5625 0.605 1.76E-03
CAT G3306 NA HCR (5) 2310021402 0 / 58 145 1.26% 0.007775 3.35E-02 0.50 1.346 0.022 2.07E-03
Wauk L7044 GSI 2310021403 0 / 50 1540 11.53% 0.007665 3.30E-02 0.50 1.03 0.02 (6) 2.04E-03
Wauk L5794 GSI 2310021403 0 / 49 1265 9.28% 0.007430 3.20E-02 0.50 0.88 0.03 (3) 1.98E-03
CAT G3304 NA 2310021402 0 / 46 95 0.65% 0.007567 3.26E-02 0.50 0.16 0.024 2.02E-03
Wauk L7042 GSI 2310021403 37 / 0 1357 7.52% 0.007557 2.64E-04 0.67 13.0 0.25 (3) 2.02E-03
CAT G3516 2310021203 0 / 29 1050 4.56% 0.007700 3.32E-02 0.50 1.31 0.029 (3) 2.05E-03
CAT G3516 TALE AFRC (7) 2310021203 29 / 0 1245 5.41% 0.007364 2.58E-04 0.67 1.805 0.28 1.96E-03
Cummins 8.3 GTA 2310021402 0 / 28 183 0.77% 0.007380 3.18E-02 0.50 0.205 0.007 (3) 1.97E-03
CAT G3608 TALE 2310021203 28 / 0 2408 10.09% 0.006592 2.31E-04 0.67 2.56 0.5975 1.76E-03
CAT G3606 TALE 2310021203 26 / 0 1835 7.14% 0.006612 2.31E-04 0.67 2.56 0.605 1.76E-03
Cummins G5.9 2310021402 0 / 25 84 0.31% 0.007914 3.41E-02 0.50 1.451 0.022 (3) 2.11E-03
AJAX DPC-180 2310021102/
2310020600 7 / 17 173 0.62% 0.008400 1.46E-01 0.55 1.4 1.0 2.24E-03
CAT G3306 TA 2310021402 0 / 19 203 0.58% 0.008098 3.49E-02 0.50 1.657 0.012 2.16E-03
CAT G3508 TALE 2310021203 17 / 0 670 1.71% 0.007510 2.63E-04 0.67 1.84 0.3 2.00E-03
CAT G3512 TALE 2310021203 17 / 0 932 2.37% 0.007385 2.58E-04 0.67 2.04 0.295 1.97E-03
AJAX DPC-140 2310021102/
2310020600 3 / 11 134 0.28% 0.008200 1.43E-01 0.54 1.3 0.7 2.19E-03
AJAX DPC-115 2310021102/
2310020600 5 / 8 110 0.21% 0.009000 1.57E-01 0.57 2.4 0.9 2.40E-03
Wauk VRG330 2310021402 0 / 12 68 0.12% 0.008038 3.46E-02 0.50 0.110 0.005 (3) 2.14E-03
TOTAL -- 1048 -- 100% Weighted
Average EFs 0.02 7.57 2.62 0.30 1.93E-03
1. ERG assumed any four stroke rich burn engine, greater than 50 Hp and located in a nonattainment area, would have non-selective catalytic reduction (NSCR) control technology. ERG has applied a 90% reduction
to the emission factors for CO and VOC for these engines. As the compliance date for 30 TAC, Chapter 117, Subchapter D Division 2 is not until after 2008, the attainment area NOx emission factor is used. 2. There is no emission factor data available distinguishing CAT G3304 NA HCR from G3304 NA, thus it was assumed that emission factors were the same for both models.
3. Non-Methane Hydrocarbon.
4. There is no emission factor data available distinguishing CAT G3606 TALE LCR from G3606 TALE, thus it was assumed that emission factors were the same for both models. Furthermore, although data
received from the 2007 DFW survey reported the CAT G3606 TALE LCR model has a rich burn engine; based on further research, ERG determined that this engine is a lean burn engine.
5. There is no emission factor data available distinguishing CAT G3306 NA HCR from G3306 NA, thus it was assumed that emission factors were the same for both models.
6. Value is estimated because no data is available.
7. There is no emission factor data available for this model engine with an air fuel ratio control, thus emission factors were assumed to be the same as the CAT G3516 TALE. Furthermore, several of these
engines were reported as rich burn in the data received from the 2007 DFW survey; however, based on further research, ERG determined that this engine can only be a lean burn engine.

4-9
Table 4-5. Emission Factor Data for Houston Nonattainment Areas
Emission Factor (EFjk) (g/Hp-hr)
Engine Make & Model SCC
Number of
Engines
[Lean / Rich]
Engine
Horsepower
(Hp)
Fraction of
Compression
Load by
Engine Type
(F2j)
Fuel
Consumption
(MMBtu/Hp-hr) PM NOx
(1) CO
(1) VOC
(1) SO2
CAT G3304 NA 2310021402 0 / 26 95 5.49% 0.007567 3.26E-02 0.50 0.16 0.024 2.02E-03
CAT G3306 NA 2310021402 0 / 24 145 7.73% 0.007775 3.35E-02 0.50 1.346 0.022 2.07E-03
Wauk VRG330 2310021402 0 / 23 68 3.47% 0.008038 3.46E-02 0.50 0.1104 0.005 (2) 2.14E-03
CAT G379 NA (3) 2310021402 0 / 14 327 10.17% 0.008710 3.75E-02 0.50 0.1592 0.009 (4) 2.32E-03
Wauk F1197 G 2310021402 0 / 13 183 5.28% 0.007253 3.13E-02 0.50 0.1 0.020 (2) 1.93E-03
CAT G3306 TA 2310021402 0 / 13 203 5.86% 0.008098 3.49E-02 0.50 1.657 0.012 2.16E-03
CAT G342 NA (5) 2310021402 0 / 10 225 5.00% 0.008588 3.70E-02 0.101 0.0317 0.009 (2) 2.29E-03
CAT G3406 TA 2310021402 0 / 9 290 5.80% 0.007407 3.19E-02 0.50 0.614 0.017 1.98E-03
Wauk F817 G 2310021402 0 / 7 87 1.35% 0.007253 3.13E-02 0.50 0.1 0.17 (6) 1.93E-03
AJAX C-42 2310021101 5 / 0 40 0.44% 0.009900 1.72E-01 4.4 (8) 3.3 0.8 2.64E-03
CAT G398 TA (3) 2310021403 0 / 5 605 6.72% 0.008710 3.75E-02 0.50 0.1592 0.009 (4) 2.32E-03
AJAX DPC-140 2310021102 5 / 0 134 1.49% 0.008200 1.43E-01 0.50 1.3 0.7 2.19E-03
SUPERIOR 8GTLB 2310021203 4 / 0 1100 9.77% 0.008788 3.07E-04 0.50 3.6 0.4 2.34E-03
CAT G379 TA (3) 2310021402 0 / 4 417 3.70% 0.008710 3.75E-02 0.50 0.1592 0.009 (4) 2.32E-03
CAT G3516 TALE 2310021203 3 / 0 1245 8.30% 0.007364 2.58E-04 0.50 1.805 0.28 1.96E-03
Wauk F11 G 2310021402 0 / 3 119 0.79% 0.007600 3.27E-02 0.50 0.079 0.027 (2) 2.03E-03
CAT G3306 2310021402 0 / 3 183 1.22% 0.007579 3.27E-02 0.50 0.146 0.012 2.02E-03
Wauk VRG220 (7) 2310021301 0 / 3 45 0.30% 0.008038 3.46E-02 12.951 (8) 1.104 0.05 (2) 2.14E-03
Wauk VRG330 TA 2310021402 0 / 3 100 0.67% 0.007307 3.15E-02 0.50 0.1587 0.002 (2) 1.95E-03
Wauk L7042 GL 2310021203 3 / 0 1357 9.04% 0.007237 2.53E-04 0.50 2.85 0.95 (2) 1.93E-03
Wauk L7042 G 2310021403 0 / 3 961 6.40% 0.007180 3.09E-02 0.50 1.3 0.025 (2) 1.91E-03
CAT G342 TA (5) 2310021402 0 / 2 225 1.00% 0.008588 3.70E-02 0.101 0.0317 0.009 (2) 2.29E-03
TOTAL 199 100% Weighted
Average EFs 0.03 0.53 1.17 0.17 2.12E-03
1. NOx emission factors were adjusted for 30 TAC, Chapter 117, Subchapter D, Division 2 nonattainment rule. Also, ERG assumed any four stroke rich burn engine, greater than 50 Hp and located in a
nonattainment area, would have non-selective catalytic reduction (NSCR) control technology. ERG has applied a 90% reduction to the emission factors for CO and VOC for these engines. 2. Non-Methane Hydrocarbon.
3. No emission factors could be found for these engines. Since they are similar models manufactured in the same time period, it was assumed that emission factors were the same as CAT G399 TA.
4. Assumed to be equal to CAT G342 NA.
5. Emission factors are based on AP-42 background document testing with no HAP emission control. Emissions data did not differentiate between a G342 TA or NA engine, so it was assumed that they have
the same emission factors. No control device is needed since NOx emissions are below Texas mandated emission standards.
6. Total Hydrocarbon.
7. Based on discussions with Waukesha, the VRG220 and VRG310 models have the same emission factors as the VRG330.
8. The AJAX C-42 and Wauk VRG220 engines are less than 50 Hp and therefore are not subject to 30 TAC, Chapter 117, Subchapter D, Division 2.

4-10
reduction (NSCR) control technology. AP-42 Section 3.2 (US EPA, 2000) recommends
applying an efficiency of 90% to the uncontrolled emissions of CO for engines equipped with
NSCR technology; other studies (EPRI 2005) state the technology can also achieve 85 to 90%
reduction of VOCs. Therefore, the CO and VOC emission factors in Tables 4-4 and 4-5 reflect a
90% control efficiency adjustment.
All PM and SO2 emission factors were obtained from AP-42 Section 3.2 (US EPA,
2000). PM emission factors are based on whether each engine is a 2 or 4 stroke lean-burn engine
or a 4 stroke rich-burn engine. The PM emission factor represents both PM10 and PM2.5. The
SO2 emission factor assumes the sulfur content in natural gas is 0.002 grams per standard cubic
foot.
By applying the emissions data (EFjk) in Tables 4-3 through 4-5 to the fraction of
compression load by engine type (F2j), a single set of weighted emission factors was calculated
for each pollutant in each attainment status category.
Compression requirements for county i, Ci:
A compressor’s operating behavior is generally dependent on the relationship between
pressure ratio and volume or mass flow rate. In particular, the operating behavior for a
compressor engine located at a gas well is based on the compressor suction and discharge
pressures required to convey the natural gas from the well head to the gathering lines. These
pressures, or the compression ratio, along with the natural gas flow-rate through the compressor,
define the engine load in terms of the amount of mechanical work that is required to compress
the natural gas produced by the well. This mechanical work, in terms of horsepower-hour (Hp-
hr), is directly proportional to the volume of fuel, in terms of thousand cubic feet (Mscf), that
must be burned by the compressor engine and the relationship is termed a compression
requirement (Hp-hr/Mscf). Special compressor calculators can be used to convert inlet and
outlet pressures into compression requirements which can then be used to determine emissions
created by compressor engines. Because of this direct relationship of mechanical work to
volume of fuel burned, one would expect a 100 Hp engine to burn almost an equal amount of
fuel as two (2) 50 Hp engines when compressing the same volume of natural gas produced by the
same well. Therefore, it is not necessary to know the specific numbers of engines, or their
individual sizes when calculating emissions from compressors at the county level.

4-11
The 2005 HARC report developed compression requirements ranging between 3.1 and
3.5 (Hp-hr/Mscf) for three distinct districts in eastern Texas, including one attainment area and
two nonattainment areas (Houston and Dallas) by obtaining typical well pressures and gathering
line pressures through a field study. The engines in this particular field survey were operated at
loads ranging from about 10% to 70% of full load, and averaged 40% load. Additionally,
compression requirements deduced from two Pollution Solutions studies are relatively in-line
with the compression requirements used in the 2005 HARC report. More specifically, a 191
Hp-day/Mscf compression requirement determined in a 2005 Pollutions Solutions study, when
adjusted2 for the findings in a 2008 Pollution Solutions study, yields a compression requirement
of 2.97 (Hp-hr/Mscf).
Compression requirements calculated by specific Texas studies are shown in Table 4-6.
Those compression requirements were applied to counties in each respective TRC District and an
average was calculated for application to the rest of Texas.
Table 4-6. Average Compression Requirements (Hp-hr/Mscf)
Study TRC District 2 TRC District 3 TRC District 6 All Other
Texas Areas
HARC 2005 3.5 3.1 3.1 --
2005 and 2008
Pollution
Solutions (1)
-- -- 2.97 --
Final 3.5 3.1 3.03 3.21 (2)
1. Included Gregg, Harrison, Rusk, Smith, Upshur, and Panola Counties.
2. TRC districts 2, 3, and 6 averaged together.
2 In a 2002 emissions inventory (Pollution Solutions, 2005) entitled “Tyler/Longview/Marshall Flexible Attainment
Region Emission Inventory”, the author developed a compression requirement (Hp-day/MSCF) through survey data
assuming the compressor engines were operating under full load or maximum installed horsepower. This
assumption caused an overestimation of the amount of fuel that was consumed by the compressor engines and
consequently overestimated the amount of emissions from these engines. A more recent study by Pollution
Solutions (2008) entitled “2005 and 2007 Compressor Engine Emissions and Load Factors Report” determined average load factors for three engine categories, all of which were less than 100%. For engines less than 240 Hp, the
load factor was 70%. For engines between 240-500 Hp, the load factor was 69%. For engines greater than 500 Hp,
the load factor was 58%. Applying the load factors reduced the estimated 2005 emissions of NOx by 34% and
similar reductions were seen for VOC and CO.

4-12
HAP Emissions for Compressor Engines
HAP emissions from compressor engines were calculated using VOC and PM speciation
data as follows:
EVOC-HAP = EVOC x (E%VOC-HAP /100)
where:
EVOC-HAP = Speciated VOC-HAP emissions [tons/yr]
EVOC = VOC emissions [tons/yr]
E%VOC-HAP = % HAP composition of VOC emissions
and
EPM-HAP = EPM x (E%PM-HAP /100)
where:
EPM-HAP = Speciated PM-HAP emissions [tons/yr]
EPM = PM emissions [tons/yr]
E%PM-HAP = % HAP composition of PM emissions
Appendix C contains the VOC and PM HAP speciation data.
Emissions for county i, and pollutant k, EFik:
Appendix D presents county-level emissions for compressor engines corresponding to
county-level natural gas production, based on the input variables discussed above. Tables 4-7
through 4-9 depict the distribution of emissions for various engine types by Source Classification
Code (SCC) as found in the Texas attainment areas, the Houston nonattainment area, and the
Dallas nonattainment area. ERG applied these distributions in order to determine compressor
engine emissions by SCC and county (see Appendix D). Table 4-10 defines each SCC used for
Compressor Engines.

4-13
Table 4-7. Distribution of Compressor Engine Emissions by SCC for Texas Attainment
Counties
SCC PM NOx CO VOC SO2
2310020600 1.10% 0.16% 0.11% 0.75% 0.34%
2310021101 1.15% 0.13% 0.17% 0.59% 0.36%
2310021102 44.40% 9.21% 3.80% 29.00% 13.93%
2310021103 0% 0% 0% 0% 0%
2310021201 0% 0% 0% 0% 0%
2310021202 0% 0% 0% 0% 0%
2310021203 7.23% 4.76% 11.53% 37.84% 26.92%
2310021301 0.48% 0.77% 0.12% 0.08% 0.61%
2310021302 28.83% 58.22% 51.62% 21.66% 36.53%
2310021303 0% 0% 0% 0% 0%
2310021401 0% 0% 0% 0% 0%
2310021402 0% 0% 0% 0% 0%
2310021403 16.81% 26.75% 32.64% 10.08% 21.30%
Table 4-8. Distribution of Compressor Engine Emissions by SCC for Dallas Nonattainment
Counties
SCC PM NOx CO VOC SO2
2310020600 5.93% 0.72% 0.46% 2.39% 0.92%
2310021101 0% 0% 0% 0% 0%
2310021102 2.42% 0.29% 0.20% 0.99% 0.38%
2310021103 0% 0% 0% 0% 0%
2310021201 0% 0% 0% 0% 0%
2310021202 0% 0% 0% 0% 0%
2310021203 24.14% 63.66% 49.49% 87.85% 56.38%
2310021301 0% 0% 0% 0% 0%
2310021302 0% 0% 0% 0% 0%
2310021303 0% 0% 0% 0% 0%
2310021401 0% 0% 0% 0% 0%
2310021402 20.38% 9.82% 4.88% 0.75% 12.77%
2310021403 47.13% 25.51% 44.97% 8.02% 29.55%

4-14
Table 4-9. Distribution of Compressor Engine Emissions by SCC for Houston
Nonattainment Counties
SCC PM NOx CO VOC SO2
2310020600 0% 0% 0% 0% 0%
2310021101 2.79% 3.68% 1.25% 2.03% 0.55%
2310021102 7.76% 1.40% 1.65% 5.96% 1.54%
2310021103 0% 0% 0% 0% 0%
2310021201 0% 0% 0% 0% 0%
2310021202 0% 0% 0% 0% 0%
2310021203 0.27% 25.54% 64.67% 84.77% 26.66%
2310021301 0.38% 7.32% 0.28% 0.09% 0.30%
2310021302 0% 0% 0% 0% 0%
2310021303 0% 0% 0% 0% 0%
2310021401 0% 0% 0% 0% 0%
2310021402 72.39% 49.69% 24.15% 5.90% 57.84%
2310021403 16.41% 12.36% 8.00% 1.25% 13.11%
Table 4-10. Compressor Engine SCC Definitions
SCC Definition
2310020600 GENERIC NATURAL GAS FIRED COMPRESSOR ENGINES (All 2-CYCLE RICH BURN)
2310021101 Natural Gas Fired 2-Cycle Lean Burn Compressor Engines <50 Hp
2310021102 Natural Gas Fired 2-Cycle Lean Burn Compressor Engines 50 To 499 Hp
2310021103 Natural Gas Fired 2-Cycle Lean Burn Compressor Engines 500+ Hp
2310021201 Natural Gas Fired 4-Cycle Lean Burn Compressor Engines <50 Hp
2310021202 Natural Gas Fired 4-Cycle Lean Burn Compressor Engines 50-499 Hp
2310021203 Natural Gas Fired 4-Cycle Lean Burn Compressor Engines 500+ Hp
2310021301 Natural Gas Fired 4-Cycle Rich Burn Compressor Engines <50 Hp
2310021302 Natural Gas Fired 4-Cycle Rich Burn Compressor Engines 50 To 499 Hp
2310021303 Natural Gas Fired 4-Cycle Rich Burn Compressor Engines 500+ Hp
2310021401 Natural Gas Fired 4-Cycle Rich Burn Compressor Engines <50 Hp W/ Nscr
2310021402 Natural Gas Fired 4-Cycle Rich Burn Compressor Engines 50-499 Hp W/ Nscr
2310021403 Natural Gas Fired 4-Cycle Rich Burn Compressor Engines 500+ Hp W/ Nscr
Example Calculation for Compressor Engines
Using the equation provided above, ERG calculated NOx emissions in Anderson County
from natural gas fired 2-cycle lean burn compressor engines less than 50 Hp as follows:
where:
Eik = NOx emissions in Anderson County [tons/year]
TGPi = 12,044,998 (the total gas production in Anderson County) [Mscf/yr]
F1i = 0.8572 (the fraction of wells requiring compression in Anderson County)
F2j = 0.0013 (the fraction of compression load represented by natural gas fired 2-cycle
lean burn compressor engines)
∗∗∗×=
180,907
21 ijkji
iik
CEFFFTGPE

4-15
EFjk = 7.57 (the NOx emission factor for natural gas fired 2-cycle lean burn compressor
engines) [g/Hp-hr]
Ci = 3.03 (the compression requirements for Anderson County) [Hp-hr/Mscf]
907,180 is the conversion factor from grams to tons of emissions
Therefore:
Eik = 12,044,998 [Mscf] x ((0.8572 * 0.0013 * 7.57 [g NOx/Hp-hr] * 3.03 [Hp-
hr/Mscf])/907,180)
Eik = 0.339373 [tons NOx/yr]
4.2 Artificial Lift (Pumpjack) Engines
A pumpjack is used to mechanically lift liquid out of the well if there is not enough
bottom hole pressure for the liquid to flow all the way to the surface. The pumpjack tends to be
driven by an electric motor; however, in isolated locations without access to electricity,
combustion engines are used. The most common “off-grid” pumpjack engines run on casing gas
produced from the well, but pumpjacks have been run on many types of fuel, such as propane
(LPG) and diesel. Generally, pumpjacks have smaller engines than wellhead compressor
engines.
Emissions from pumpjack engines were calculated using a methodology similar to that
employed in a 2008 CENRAP study entitled: “Recommendations for Improvements to the
CENRAP States’ Oil and Gas Emission Inventories” (Bar-Ilan, et al., 2008). For this 2008
inventory, ERG calculated county-level emissions from pumpjack engines with the following
equation:
where:
Eik is the emissions for county i, and pollutant k [tons/yr]
Wi is the total number of active oil wells in county i [wells]
fpumpjack is the fraction of oil wells with artificial lift engines
epumpjack is the fraction of artificial lift engines that are electrically operated
EFk is the emission factor for pollutant k [g/Hp-hr]
HP is the horsepower of the engine [Hp]
LF is the load factor of the engine while operating
tannual is the annual number of hours the engine is used [hr/yr]
907,180 is the conversion factor from grams to tons of emissions
( )
∗∗∗×−××=
180,9071 annualk
pumpjackpumpjackiik
tLFHPEFefWE

4-16
Total number of active oil wells in county i, Wi:
Total active oil wells by county for the full 2008 year are not readily available from the
TRC website. However, oil well distribution data by county is available from the TRC website
on a bi-annual (February and September) basis and can be found at:
http://www.rrc.state.tx.us/data/wells/wellcount/index.php. ERG used the September 2008 TRC
report to get a count of regular producing oil wells by county.
Fraction of oil wells with artificial lift engines, fpumpjack:
The fraction of oil wells requiring artificial lift was estimated as the fraction of active oil
wells greater than one year old. Typically, oil wells in their first year of existence do not require
an artificial lift engine because the wells have enough bottom hole pressure for the oil to flow
freely all the way to the surface. This trend was confirmed through phone interviews with five
companies specializing in artificial lift engines (four engineering consultants with expertise in oil
and gas production, and one company that sells, installs, and repairs pumpjacks and pumpjack
engines). It was the general consensus among the interviewees that the majority of oil wells
located in Texas are older than one year and thus would require some sort of artificial lift engine.
ERG determined the fraction of oil wells active in 2008 that were greater than one year
old using the following equation:
−=>
2008) 5,February on WellsOil Active (Total
2007)in Completed Wells(Oil1 OldYear 1 WellsOil ofFraction
ERG determined the number of oil wells completed in 2007 using TRC annual drilling,
completion, and plugging summaries which are available at:
http://www.rrc.state.tx.us/data/drilling/drillingsummary/index.php. ERG used oil well
distribution data showing the number of regular producing oil wells by county. Oil well
distribution data by county is only available from the TRC website on a bi-annual (February and
September) basis and can be found at: http://www.rrc.state.tx.us/data/wells/wellcount/index.php.
Using the February 2008 TRC report, ERG summed the county specific numbers for regular
producing oil wells.

4-17
The fraction of oil wells greater than one year old was determined to be 0.967 (1 – (5,084
/ 153,831) = 0.967). The actual fraction may be slightly different because each oil well that was
completed in 2007 could have been completed on any day of that year. However, using the
methodology explained above, ERG has assumed that all wells completed in 2007 were
completed on February 5, 2007.
Fraction of artificial lift engines that are electrically operated, epumpjack:
ERG assumed that 70% of the artificial lift systems located in Texas operate with an
electric motor as opposed to a fuel driven engine. This assumption was based on phone
interviews with four companies specializing in artificial lift engines, three of which were
engineering consultants with expertise in oil and gas production, and one company that sells,
installs, and repairs pumpjacks and pumpjack engines. From these interviews, it was ascertained
that it is most common to run pumpjack engines on electricity as this is the most cost effective
option, thus if an oil well has access to electricity, electricity would typically be used to power
the artificial lift engine. Fractions of artificial lift engines that are electrically operated ranged
from 50 to 90 percent among interviewees. Therefore, ERG used a conservative estimate of
70%.
Emission factor for pollutant k, EFk:
Through various phone interviews, ERG determined that the most popular pumpjack
engines located in Texas are those in the Arrow C series. These engines burn natural gas and
range from about 5 to 32 horsepower (depending on the model number). Criteria pollutant
emission factors for the Arrow C engine models were provided by the manufacturer and are
shown in Table 4-11. A single set of averaged emission factors was calculated for each pollutant
assuming equal fuel usage by each engine size for all pollutants.
The New Source Performance Standard (NSPS), Subpart JJJJ limits emissions of NOx,
CO, and VOC from stationary spark ignition internal combustion engines less than 500
horsepower that were manufactured after July 1, 2008. Also, stationary spark ignition engines
that were modified or reconstructed after June 12, 2006 are subject to the rule. As a conservative
estimate, ERG assumed all pumpjack engines were manufactured prior to July 1, 2008 and/or

4-18
were not modified or reconstructed after June 12, 2006. Therefore, no pumpjack engines in this
analysis are considered subject to the emission limitations of NSPS, Subpart JJJJ.
All PM and SO2 emission factors were obtained from AP-42 Section 3.2 (US EPA,
2000). The PM emission factor is 9.50E-03 lb/MMBtu (based on a 4 stroke rich-burn engine).
The PM emission factor represents both PM10 and PM2.5. The SO2 emission factor is 5.88E-04
lb/MMBtu and assumes the sulfur content in natural gas is 0.002 grams per standard cubic foot.
Both of these emission factors have been converted to g/Hp-hr using the fuel consumption rate of
the engine.
Table 4-11. Common Pumpjack Engine Emission Factors
Emission Factor for Engine Type j, and Pollutant k
(g/Hp-hr) (EFjk)
Arrow
C Series
Model
Horsepower
(Hp)
Fuel
Consumption
(MMBtu/Hp-hr) PM NOx CO VOC SO2
C-46 11 0.0126 0.054 9.26 20.19 0.006 3.36E-03
C-66 15.8 0.0117 0.050 14.54 4.03 0.332 3.12E-03
C-96 21.4 0.0121 0.052 11.87 5.05 0.142 3.23E-03
C-106 34 0.0092 0.040 23.32 0.222 0.094 2.46E-03
Average 20.55 0.21 0.049 14.75 7.37 0.14 3.04E-03
Horsepower of the engine, HP:
ERG determined an average horsepower per pumpjack engine (20.55 Hp) by assuming
that all pumpjack engines located in Texas were of the Arrow C series types listed in Table 4-11,
with the engine population distributed evenly across the four engine models.
Load factor of the engine while operating, LF:
A 2006 study entitled: “Ozone Precursors Emission Inventory for San Juan and Rio
Arriba Counties, New Mexico” (Pollack, et al., 2006) assumed the maximum power delivered by
a pumpjack engine to be 100 percent of available engine power and the minimum power to be a
10 percent load representative of idling. With these bounds and the approximate form of the
power curve, the report estimated an average loading of 71 percent. For this 2008 inventory,
ERG also used 71 percent as the load factor.

4-19
Annual number of hours the engine is used, tannual:
The 2006 New Mexico study assumed that pumpjack engines operate nearly without
interruption year-round (8,760 hours per year). However, this assumption would likely be an
over estimate for Texas pumpjack engines as many of the oil wells located in Texas have
intermittent activity and are not producing oil 24 hours per day. For this reason, ERG assumed a
pumpjack engine only runs half the year, or 4,380 hours. ERG also verified this assumption
through phone interviews with companies specializing in artificial lit engines. For future work,
ERG recommends surveying operators to verify this assumption. Another way to verify this
assumption would be to use oil well production data from the TRC as well as individual oil well
pumpjack engine size information (most likely from survey data) to estimate the amount of hours
each engine would need to operate in order to pump the stated oil production.
HAP Emissions for Pumpjack Engines:
HAP emissions from pumpjack engines were calculated using VOC and PM speciation
data as follows:
EVOC-HAP = EVOC x (E%VOC-HAP /100)
where: EVOC-HAP = Speciated VOC-HAP emissions [tons/yr]
EVOC = VOC emissions [tons/yr]
E%VOC-HAP = % HAP composition of VOC emissions
and
EPM-HAP = EPM x (E%PM-HAP /100)
where:
EPM-HAP = Speciated PM-HAP emissions [tons/yr] EPM = PM emissions [tons/yr]
E%PM-HAP = % HAP composition of PM emissions
Appendix C contains the VOC and PM HAP speciation data.
Emissions for county i, and pollutant k, Eik:
Appendix E presents county-level pumpjack engine emissions corresponding to the
number of active oil wells located in each county, based on the input variables discussed above.
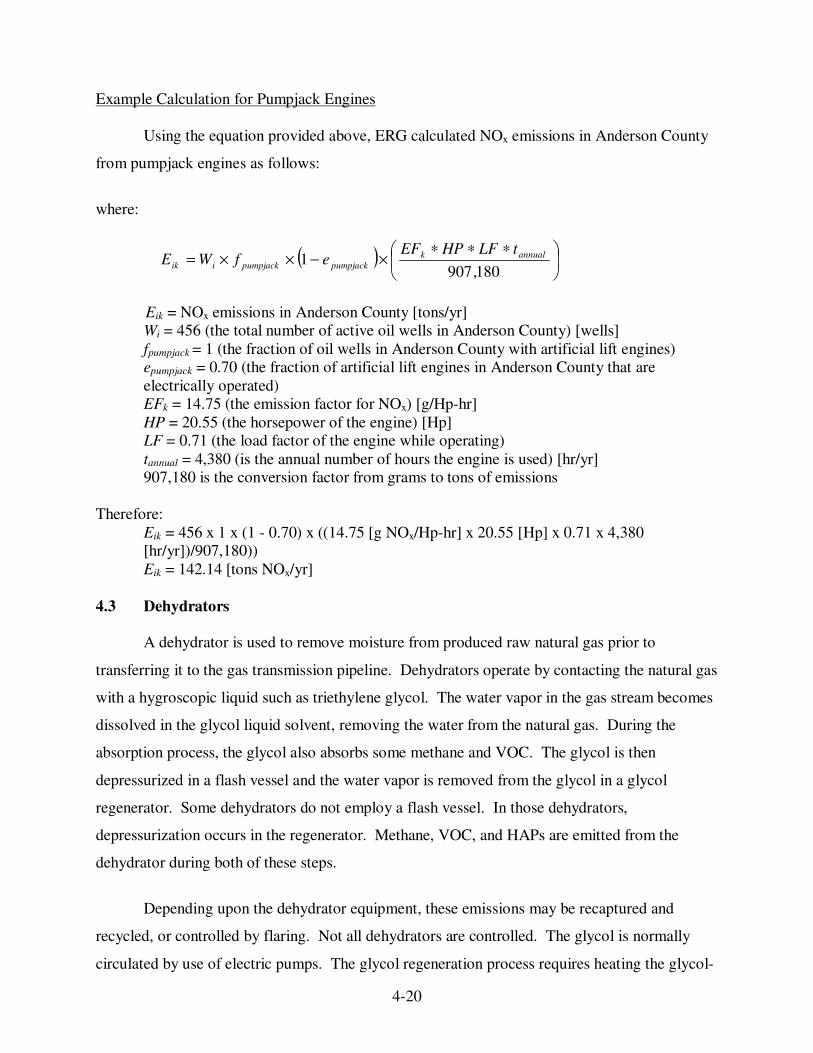
4-20
Example Calculation for Pumpjack Engines
Using the equation provided above, ERG calculated NOx emissions in Anderson County
from pumpjack engines as follows:
where:
Eik = NOx emissions in Anderson County [tons/yr] Wi = 456 (the total number of active oil wells in Anderson County) [wells]
fpumpjack = 1 (the fraction of oil wells in Anderson County with artificial lift engines) epumpjack = 0.70 (the fraction of artificial lift engines in Anderson County that are
electrically operated)
EFk = 14.75 (the emission factor for NOx) [g/Hp-hr]
HP = 20.55 (the horsepower of the engine) [Hp] LF = 0.71 (the load factor of the engine while operating)
tannual = 4,380 (is the annual number of hours the engine is used) [hr/yr] 907,180 is the conversion factor from grams to tons of emissions
Therefore:
Eik = 456 x 1 x (1 - 0.70) x ((14.75 [g NOx/Hp-hr] x 20.55 [Hp] x 0.71 x 4,380 [hr/yr])/907,180))
Eik = 142.14 [tons NOx/yr]
4.3 Dehydrators
A dehydrator is used to remove moisture from produced raw natural gas prior to
transferring it to the gas transmission pipeline. Dehydrators operate by contacting the natural gas
with a hygroscopic liquid such as triethylene glycol. The water vapor in the gas stream becomes
dissolved in the glycol liquid solvent, removing the water from the natural gas. During the
absorption process, the glycol also absorbs some methane and VOC. The glycol is then
depressurized in a flash vessel and the water vapor is removed from the glycol in a glycol
regenerator. Some dehydrators do not employ a flash vessel. In those dehydrators,
depressurization occurs in the regenerator. Methane, VOC, and HAPs are emitted from the
dehydrator during both of these steps.
Depending upon the dehydrator equipment, these emissions may be recaptured and
recycled, or controlled by flaring. Not all dehydrators are controlled. The glycol is normally
circulated by use of electric pumps. The glycol regeneration process requires heating the glycol-
( )
∗∗∗×−××=
180,9071 annualk
pumpjackpumpjackiik
tLFHPEFefWE
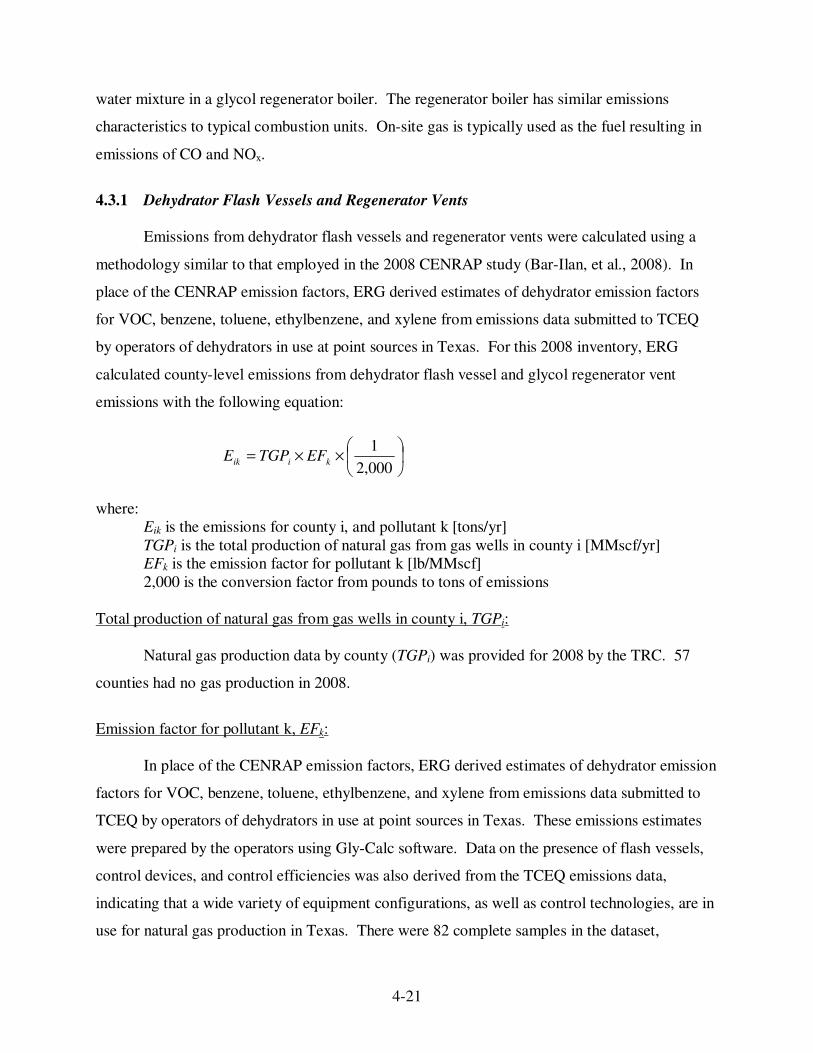
4-21
water mixture in a glycol regenerator boiler. The regenerator boiler has similar emissions
characteristics to typical combustion units. On-site gas is typically used as the fuel resulting in
emissions of CO and NOx.
4.3.1 Dehydrator Flash Vessels and Regenerator Vents
Emissions from dehydrator flash vessels and regenerator vents were calculated using a
methodology similar to that employed in the 2008 CENRAP study (Bar-Ilan, et al., 2008). In
place of the CENRAP emission factors, ERG derived estimates of dehydrator emission factors
for VOC, benzene, toluene, ethylbenzene, and xylene from emissions data submitted to TCEQ
by operators of dehydrators in use at point sources in Texas. For this 2008 inventory, ERG
calculated county-level emissions from dehydrator flash vessel and glycol regenerator vent
emissions with the following equation:
where:
Eik is the emissions for county i, and pollutant k [tons/yr]
TGPi is the total production of natural gas from gas wells in county i [MMscf/yr] EFk is the emission factor for pollutant k [lb/MMscf]
2,000 is the conversion factor from pounds to tons of emissions
Total production of natural gas from gas wells in county i, TGPi:
Natural gas production data by county (TGPi) was provided for 2008 by the TRC. 57
counties had no gas production in 2008.
Emission factor for pollutant k, EFk:
In place of the CENRAP emission factors, ERG derived estimates of dehydrator emission
factors for VOC, benzene, toluene, ethylbenzene, and xylene from emissions data submitted to
TCEQ by operators of dehydrators in use at point sources in Texas. These emissions estimates
were prepared by the operators using Gly-Calc software. Data on the presence of flash vessels,
control devices, and control efficiencies was also derived from the TCEQ emissions data,
indicating that a wide variety of equipment configurations, as well as control technologies, are in
use for natural gas production in Texas. There were 82 complete samples in the dataset,
××=
000,2
1kiik EFTGPE

4-22
spanning the full range of gas-producing regions in Texas. Statewide weighted averages for
these five pollutants were derived from the emissions data, and are shown in Table 4-12 below.
These emission factors may produce emissions estimates that are lower than actual
emissions at the area-source dehydrators in the state. TCEQ recognizes that the types of control
technologies in use at dehydrators located at point sources may be different than the control
technologies in use at dehydrators located at smaller area sources. Control requirements are
different and incentives for recapturing and/or controlling VOC and HAP emissions may be
different for operators of (larger) point sources and (smaller) area sources. However, this dataset
of dehydrator emissions represents the full range of uncontrolled and controlled dehydrators in
Texas and is a good composite representation of statewide dehydrator emissions.
Table 4-12. Statewide Emission Factors for VOC, Benzene, Toluene, Ethylbenzene, and
Xylene from Dehydrator Flash Vessels and Regenerator Vents in Texas
Pollutant Emission Factor (lb/MMscf) Number of Samples
VOC 1.63 82
Benzene 0.38 68
Toluene 0.20 64
Ethylbenzene 0.02 45
Xylene 0.75 60
Emissions for county i, and pollutant k, Eik:
Appendix E presents county-level dehydrator flash vessel and regenerator emissions
corresponding to the production of natural gas at wells located in each county, based on the input
variables discussed above.
Example Calculation for Dehydrator Flash Vessels and Regeneration Vents
Using the equation provided above, ERG calculated Benzene emissions in Anderson
County from dehydrator flash vessels and regeneration vents as follows:
where:
Eik = (the Benzene emissions for Anderson County) [tons/yr]
TGPi = 12,045 (the total production of natural gas from gas wells in Anderson County) [MMCF/yr]
EFk = 0.38 (the emission factor for Benzene) [lb/MMscf]
××=
000,2
1kiik EFTGPE

4-23
2,000 is the conversion factor from pounds to tons of emissions
Therefore:
Eik = 12,045 [MMCF/yr] x 0.38 [lb/MMscf] x (1/2,000) Eik = 2.29 [tons/yr]
4.3.2 Glyol Regenerator Boilers
Emissions from glycol regenerator boilers were calculated using the methodology and
emission factors employed in the 2008 CENRAP study (Bar-Ilan, et al., 2008). For this 2008
inventory, ERG calculated county-level emissions from dehydrator regenerator boilers with the
following equation:
where:
Eik is the emissions for county i, and pollutant k [tons/yr]
TGPi is the total production of natural gas from gas wells in county i [MMscf/yr]
EFk is the emission factor for pollutant k [lb/MMscf] 2,000 is the conversion factor from pounds to tons of emissions
Total production of natural gas from gas wells in county i, TGPi:
Natural gas production data by county (TGPi) was provided for 2008 by the TRC. 57
counties had no gas production in 2008.
Emission factor for pollutant k, EFk:
ERG used the CENRAP emission factors for regenerator boiler emissions. The
CENRAP emission factors are in terms of pounds of pollutant emitted for each million cubic feet
(MMscf) of gas produced. These emission factors are shown in Table 4-13 below.
Table 4-13. Emission Factors for NOx and CO Emissions
from Dehydrator Regenerator Boilers
Pollutant Emission Factor (lb/MMscf)
NOx 0.052
CO 0.105
××=
000,2
1kiik EFTGPE

4-24
Emissions for county i, and pollutant k, Eik:
Appendix E presents county-level dehydrator regenerator boiler emissions corresponding
to the production of natural gas at wells located in each county, based on the input variables
discussed above.
Example Calculation for Glycol Regenerator Boilers:
Using the equation provided above, ERG calculated NOx emissions in Anderson County
from glycol regenerator boilers as follows:
where:
Eik = NOx emissions in Anderson County [tons/yr]
TGPi = 12,045 (the total production of natural gas from gas wells in Anderson County) [MMscf/yr]
EFk = 0.052 (the emission factor for NOx) [lb/MMscf] 2,000 is the conversion factor from pounds to tons of emissions
Therefore:
Eik = 12,045 [MMscf/yr] x 0.052 [lb/MMscf] x (1/2,000) Eik = 0.31 [tons NOx/yr]
4.3.3 Dehydrator Emission Control Device
Emissions from dehydrator control devices were calculated using the basic methodology
employed in the 2008 CENRAP study (Bar-Ilan, et al., 2008). Like the 2008 CENRAP study,
ERG used the emission factors from AP 42, Chapter 13.5 for NOx and CO. ERG also used the
heat value of the gas flared from the CENRAP study. ERG derived estimates of the amount of
gas flared for each unit of gas produced from the emissions data submitted to TCEQ by operators
of dehydrators in use at point sources in Texas. For this 2008 inventory, ERG calculated county-
level emissions from dehydrator emission control devices with the following equation:
where:
Eik is the emissions for county i, and pollutant k [tons/yr]
TGPi is the total production of natural gas from gas wells in county i [MMscf/yr]
Fflared is the fraction of produced gas that is flared [lbs flared/MMscf produced] D is the density of the gas flared [lbs/MMscf]
××=
000,2
1kiik EFTGPE
000,2
11×××××= kflarediik EFHV
DfTGPE

4-25
HV is the heat value of the gas flared [MMBtu/MMscf]
EFk is the emission factor for pollutant k [lbs/MMBtu] 2,000 is the conversion factor from pounds to tons of emissions
Total production of natural gas from gas wells in county i, TGPi:
Natural gas production data by county (TGPi) was provided for 2008 by the TRC. 57
counties had no gas production in 2008.
Fraction of produced gas that is flared, Fflared:
ERG derived estimates of the amount of gas flared for each unit of gas produced from the
emissions data submitted to TCEQ by operators of dehydrators in use at point sources in Texas.
The sum of the reported emissions from flash vessels and regenerator vents before controls, in
tons of total hydrocarbons, was tallied for all 82 samples in the dataset. This figure was
compared with the total production of natural gas reported in those 82 samples, producing a
weighted average. Because emissions are reported in pounds, and production is reported in
Millions of standard cubic feet (MMscf), the units for this fraction are pounds of gas flared per
million standard cubic feet of gas produced (lbs flared/MMscf produced). The dehydrator
emissions data indicated that 1 ton (2,000 pounds) of gas is flared for each 149.2 million
standard cubic feet (MMscf) of gas produced.
Density of the gas flared, D:
ERG derived estimates of the density of the gas flared by assuming it was equivalent to
the density of the dry gas produced by the dehydrator. This data was taken from the dehydrator
emissions reports submitted to TCEQ. The amount of dry gas produced, in pounds per hour, was
divided by the flow rate of gas produced, in cubic feet per hour, producing a density for dry gas
in units of pounds per cubic foot. The sum of the amount of dry gas produced was tallied for all
82 samples in the dataset, and was divided by the sum of the flow rate of gas produced,
producing a weighted average, with units of pounds per standard cubic foot (lbs/scf). This figure
was then multiplied by 106 standard cubic feet per MMscf, to yield a factor with units of pounds
per million standard cubic feet (lbs/MMscf). The dehydrator emissions data indicated that the
density of the gas produced is 0.047 pounds per standard cubic foot or 46,952 (lbs/MMscf).

4-26
Heat value of the gas flared, HV:
The heat value of the gas flared is taken from the 2008 CENRAP study. This value is
equivalent to 1,209 Btu per standard cubic feet of gas (Btu/scf).
Emission factor for pollutant k, EFk:
ERG used the CENRAP emission factors for dehydrator control emissions. Although the
dehydrator emissions data from TCEQ showed that a small percentage of dehydrator flash vessel
and regenerator vent emissions are controlled by incinerators, the vast majority (over 90%) are
burned in flares. ERG chose to use the simplifying assumption that all dehydrator flash vessel
and regenerator vent emissions that are controlled by combustion are directed to flares. The
emission factors for flares are taken directly from AP 42, Chapter 13.5. The emission factors are
in terms of pounds of pollutant emitted for each million Btu (lbs/MMBtu) of gas flared. These
emission factors are shown in Table 4-14 below.
Table 4-14. Emission Factors for NOx and CO Emissions
from Dehydrator Controls (Flares)
Pollutant
Emission Factor
(lb/MMBtu)
NOx 0.068
CO 0.37
Emissions for county i, and pollutant k, Eik:
Appendix E presents county-level dehydrator control emissions corresponding to the
production of natural gas at wells located in each county, based on the input variables discussed
above.
Example Calculation for Dehydrator Controls:
Using the equation provided above, ERG calculated NOx emissions in Anderson County
from dehydrator controls as follows:
000,2
11×××××= kflarediik EFHV
DfTGPE

4-27
where:
Eik = NOx emissions for Anderson County [tons/yr] TGPi = 12,045 (the total production of natural gas from gas wells in Anderson County)
[MMscf/yr] Fflared = 13 (the fraction of produced gas that is flared) [lbs flared/MMscf produced]
D = 46,952 (the density of the gas flared) [lbs/MMscf] HV = 1,209 (the heat value of the gas flared) [MMBtu/MMscf]
EFk = 0.068 (the NOx emission factor) [lbs/MMBtu] 2,000 is the conversion factor from pounds to tons of emissions
Therefore:
Eik = 12,045 [MMscf/yr] x 13.41 [lbs flared/MMscf produced] x (1/46,952 [lbs/MMscf]) x 1,209 [MMBtu/MMscf] x 0.068 [lbs/MMBtu] x (1/2,000)
Eik = 0.14 [tons NOx/yr]
4.4 Oil and Condensate Storage Tanks
Storage tanks are used in a variety of applications in the oil and gas industry. An oil and
gas well may produce oil, natural gas, or a mixture of the two. When oil and gas are brought to
the surface, the liquids produced may contain a mixture of liquid and gaseous organic
compounds, nitrogen, carbon dioxide, water, sand, and other impurities. The mixture is typically
passed through a three-phase separator, which allows the water, oil and gas to separate. The
liquid oil and water components are then piped to storage tanks. If the well produces gas, it is
possible that liquids may condense out of the gas as the pressure is decreased. The hydrocarbon
liquid produced at gas wells is known as condensate. Oil and condensate are piped to storage
tanks until they can be transported offsite. Tanks are typically vented to the atmosphere.
Oil and condensate storage tank emissions at wellhead and gathering sites are composed
of flashing losses, working losses, and breathing losses. Flashing losses occur when a produced
liquid (crude oil or condensate) with entrained gases experiences a pressure drop, as during the
transfer of liquid hydrocarbons from a wellhead or separator to a storage tank. As the pressure
on the liquid drops, some of the lighter compounds dissolved in the liquid are released or
“flashed”. Some compounds that are liquids at the initial pressure and temperature, change
phase from a liquid to a gas and are also released or “flashed” from the liquid in the storage tank.
Working losses occur when vapors are displaced from a tank during the filling and unloading
cycles, and when the fluid is agitated during filling of the tank. Breathing losses (also called
standing losses) occur due to the normal evaporation of liquid in a tank. Breathing losses are
vapors that are produced in response to the daily temperature change.

4-28
Emissions from oil and condensate storage tanks were calculated using the methodology
and emission factor data developed in the 2009 TERC study “VOC Emissions From Oil and
Condensate Storage Tanks” (TERC, 2009). These emission factors were multiplied by county-
specific oil and gas production data obtained from the TRC. The calculations assume that
venting emissions are uncontrolled by flares or vapor recovery units. For this 2008 inventory,
ERG calculated county-level emissions from oil storage tank and condensate storage tank vent
emissions with the following equations:
and
where: Eik is the emissions for county i, and pollutant k [tons/yr]
TOPi is the total production of oil from oil wells in county i [BBL/yr] TCPi is the total production of condensate from gas wells in county i [BBL/yr]
EFik is the emission factor for county i, and pollutant k [lb/BBL] 2,000 is the conversion factor from pounds to tons of emissions
Total production of oil from oil wells in county i, TOPi:
Oil production data by county (TOPi) was provided for 2008 by the TRC. 42 counties
had no oil production in 2008.
Total production of condensate from gas wells in county i, TCPi:
Condensate production data by county (TOPi) was provided for 2008 by the TRC. 80
counties had no condensate production in 2008.
Emission factor for county i, and pollutant k, EFik:
VOC Emission Factors: The VOC emission factors for oil storage tank batteries and
condensate storage tank batteries are taken from the 2009 TERC study and are in units of pounds
per barrel of oil/condensate produced and are shown in Table 4-15 below.
××=
000,2
1ikiik EFTOPE
××=
000,2
1ikiik EFTCPE

4-29
HAP Emission Factors: Benzene, toluene, ethylbenzene, and xylene are a constituent of
the vapors emitted from oil and condensate storage tanks. The benzene, toluene, ethylbenzene,
and xylene emission factors are derived from the data published in the 2009 TERC study. Tables
3-4 and 3-5 in the TERC study showed the measured vent gas speciation profiles for oil tanks
and condensate tanks, respectively. This data was used in combination with the measured weight
percent VOC data from those same tables and the VOC emission factors taken from that study to
calculate emission factors for benzene, toluene, ethylbenzene, and xylene from both oil and
condensate storage tanks in terms of lbs per barrel of oil or condensate produced. These
emission factors are in units of pounds per barrel of oil/condensate produced and are shown in
Table 4-15 below.
Table 4-15. Emission Factors for VOC, Benzene, Toluene,
Ethylbenzene, and Xylene from Oil Storage Tanks and
Condensate Storage Tanks in Texas
Pollutant Emission Factors (lb/BBL)
Oil Condensate
VOC 1.60 33.3
Benzene 0.00533 0.187
Toluene 0.0083 0.319
Ethylbenzene 0.003 0.018
Xylene 0.012 0.141
Emissions for county i, and pollutant k, Eik:
Appendix E present county-level oil storage tank and condensate storage tank vent
emissions corresponding to the production of oil and condensate at oil wells and natural gas
wells located in each county, based on the input variables discussed above.
Example Calculation for Oil and Condensate Storage Tanks:
Using the equation provided above, ERG calculated VOC emissions in Anderson County
from oil storage tanks as follows:
where: Eik = VOC emissions for Anderson County [tons/yr]
TOPi = 678,901 (the total production of oil from oil wells in Anderson County) [BBL/yr] EFik = 1.60 (the VOC emission factor for Anderson County) [lb/BBL]
××=
000,2
1ikiik EFTOPE

4-30
2,000 is the conversion factor from pounds to tons of emissions
Therefore:
Eik = 678,901 [BBL/yr] x 1.6 [lb/BBL] x (1/2,000) Eik = 543 [tons/yr]
4.5 Oil and Condensate Loading
Oil and condensate stored in field storage tanks is transferred to trucks and railcars and
shipped to refineries for further processing. Fugitive VOC emissions are released from these
loading processes as the vapors in the receiving vessel are displaced by the liquids from the
storage tanks. These vapors are normally vented to the atmosphere.
Emissions from oil and condensate loading were calculated using the emission estimation
methodology in the 2009 TCEQ study. This methodology is taken from AP 42, Chapter 5.2 -
Transportation and Marketing of Petroleum Liquids. Emission factors for loading losses were
calculated at the county level. These emission factors were multiplied by county-specific 2008
oil and condensate production data obtained from the TRC to derive county-specific emission
estimates. ERG obtained monthly temperature data for the counties in which the oil and
condensate are produced. Per the 2007 TCEQ study, ERG used AP-42 data for crude oil (50
lb/lb-mole) at 60 degrees F to approximate the molecular weight of tank vapors for oil. ERG
used AP-42 data for gasoline (Reid Vapor Pressure (RVP) 7) (68 lb/lb-mole) at 60 degrees F to
approximate the molecular weight of tank vapors for condensate. The AP-42 equation was used
to calculate temperature-dependent emission factors for loadout losses for each county. Truck or
railcar loading emissions were calculated by multiplying the emission factor by county-level oil
and condensate production data. The calculations assume that venting emissions are
uncontrolled by flares or vapor recovery units. The AP-42 equation to calculate loading
emission factors is shown in the following equation.
4-31
where:
LLik is the loading loss [lb/1,000 gal of liquid loaded] for county i, and pollutant k S is the saturation factor (based on type of loading operation)
Pi is the true vapor pressure of liquid loaded [psia] for county i M is the molecular weight of tank vapors [lb/lb-mole]
Ti is the temperature of bulk liquid loaded [oR] for county i
Saturation factor, S:
The saturation factor is taken from Table 5.2-1 of Chapter 5.2 of AP-42 and is based on
submerged or splash loading of liquid with dedicated vapor balance service. This assumes that
tank vapors from the truck or railcar being loaded are vented back into the tank being emptied.
True vapor pressure of the liquid being loaded, for county i, Pi:
The true vapor pressure for oil is estimated to be equivalent to the true vapor pressure for
crude oil RVP 5. The true vapor pressure for condensate is estimated to be equivalent to the true
vapor pressure for gasoline RVP 7. The true vapor pressure for these liquids at various
temperatures are shown in Table 4-16 below. The true vapor pressure for the county-specific
average temperature is calculated for oil loading with the equation.
where: Pi is the true vapor pressure of liquid loaded [psia] for county i
Ti is the temperature of bulk liquid loaded [oF] for county i
The true vapor pressure for the county-specific average temperature is calculated for
condensate loading with the equation.
where:
Pi is the true vapor pressure of liquid loaded [psia] for county i Ti is the temperature of bulk liquid loaded [
oF] for county i
These formulas are derived from linear interpolation of the slope and intercept of the line
formed between the values for the true vapor pressure of crude oil RVP 5 (representing oil) and
gasoline RVP 7 (representing condensate) at 55 degrees Fahrenheit and 75 degrees Fahrenheit.
∗∗×=
i
i
ikT
MPSLL 46.12
( ) 58.0057.0 −×= ii TP
( ) 03.1077.0 −×= ii TP

4-32
Molecular weight of the tank vapors, M:
The molecular weight of the tank vapors for oil is estimated to be equivalent to the
molecular weight of crude oil RVP 5. The molecular weight of the tank vapors for condensate is
estimated to be equivalent to the molecular weight of gasoline RVP 7. The molecular weight of
these liquids at 60 degrees Fahrenheit are shown in Table 4-16 below. The data in Table 4-16 is
taken directly from AP-42, Chapter 7.1.
Table 4-16. Molecular Weight and True Vapor Pressure of Selected Petroleum Liquids
Petroleum
Liquid
Molecular
Weight at 60°
F (lb/lb-mole)
True Vapor Pressure (psia)
40° F 50° F 60° F 70° F 80° F 90° F 100° F
Crude Oil RVP 5 50 1.8 2.3 2.8 3.4 4.0 4.8 5.7
Gasoline RVP 7 68 2.3 2.9 3.5 4.3 5.2 6.2 7.4
Temperature of the bulk liquid loaded, Ti:
The average 2008 temperature data, degrees Fahrenheit, for 115 Texas counties was
obtained from the National Weather Service and from several state/local monitoring sites. These
data were used to estimate the average temperature in the adjacent 139 counties. The average
liquid temperature is assumed to be equivalent to the average ambient air temperature.
Loading loss for county i, and pollutant k, LLik:
The loading loss is the county-specific emission factor and has units of pounds per 1,000
gallons of oil or condensate loaded (lbs/1,000 gal).
For this 2008 inventory, ERG calculated county-level emissions from oil loading
emissions and condensate loading emissions with the following equations:
and
×××=
000,2
142kiik LLTOPE
×××=
000,2
142ikiik LLTCPE
4-33
where:
Eik is the loading emissions for county i, and pollutant k [tons/yr] TOPi is the total production of oil from oil wells in county i [BBL/yr]
TCPi is the total production of condensate from gas wells in county i [BBL/yr] LLik is the loading loss (emission factor) for pollutant k [lb/1,000 gal loaded]
42 is the conversion factor from barrels to gallons 2,000 is the conversion factor from pounds to tons of emissions
Total production of oil from oil wells in county i, TOPi:
Oil production data by county (TOPi) was provided for 2008 by the TRC. 42 counties
had no oil production in 2008.
Total production of condensate from gas wells in county i, TCPi:
Condensate production data by county (TOPi) was provided for 2008 by the TRC. 80
counties had no condensate production in 2008.
Loading loss, LLik:
The loading loss is the emission factor calculated above and has units of pounds per
1,000 gallons of oil or condensate loaded.
HAP Emission Factors: Benzene, toluene, ethylbenzene, and xylene are a constituent of
the vapors emitted during oil and condensate loading. The benzene, toluene, ethylbenzene, and
xylene emission factors for oil loading and condensate loading in all oil and gas producing basins
in Texas are derived from the data published in the 2009 TERC study. Tables 3-4 and 3-5 in the
TERC study showed the measured vent gas speciation profiles for oil tanks and condensate
tanks, respectively. This data was used in combination with the measured weight percent VOC
data from those same tables and the VOC emission factors taken from that study to calculate
emission factors for benzene, toluene, ethylbenzene, and xylene from both oil and condensate
loading. These emission factors are in terms of units of HAP emitted per units of VOC emitted.
and are shown in Table 4-17 below.

4-34
Table 4-17. Emission Factors for Benzene, Toluene, Ethylbenzene, and Xylene from
Oil and Condensate Loading in Texas
All Texas Basins Emission Factors (lb HAP/lb VOC) Pollutant Oil Condensate
Benzene 0.0033 0.2808
Toluene 0.0052 0.479
Ethylbenzene 0.00187 0.027
Xylene 0.0075 0.212
Loading emissions for county i, for pollutant k, Eik:
Emissions for oil and condensate loading racks for each county are calculated by
multiplying a county-specific loading loss factor by the county-specific oil and condensate
production. Appendix E present county-level oil condensate loading rack emissions
corresponding to the production of oil and condensate at oil wells and natural gas wells located
in each county, based on the input variables discussed above.
Example Calculation for Oil and Condensate Loading:
Using the equations provided above, ERG calculated VOC emissions in Anderson
County from oil loading as follows:
where:
LLik = (the loading loss [lb/1,000 gal of liquid loaded] for Anderson County, and pollutant k)
S = 1.00 (the saturation factor (based on type of loading operation)) Pi = 3.1 (the true vapor pressure of liquid loaded for Anderson County) [psia]
M = 50 (the molecular weight of tank vapors) [lb/lb-mole] Ti = 524.27 (the temperature of bulk liquid loaded for Anderson County) [
oR]
where: Eik = loading VOC emissions for county i, and pollutant k [tons/yr]
TOPi = 678,901 (the total production of oil from oil wells in Anderson County) [BBL/yr] LLik = the loading loss (emission factor) for VOC [lb/1,000 gal loaded]
42 is the conversion factor from barrels to gallons 2,000 is the conversion factor from pounds to tons of emissions
∗∗×=
i
i
ikT
MPSLL 46.12
×××=
000,2
142kiik LLTOPE

4-35
Therefore: LLik = 12.46 x ((1.00 x 3.1 [psia] x 50 [lb/lb-mole])/524.27 [
oR])
LLik = 3.684 [lb/1,000 gal of liquid loaded]
Eik = 678,901 [BBL/yr] x 3.684 [lb/1,000 gal of liquid loaded] x 42 x (1/2,000) Eik = 52.52 [tons VOC/yr]
4.6 Well Completions
Following drilling and casing, a well must be “completed.” Completion is the process
which enables the well to produce oil or gas. To complete the production well, casing is
installed and cemented and the drilling rig is removed from the site. As the well is completed, an
initial mixture of gas, hydrocarbon liquids, water, sand, and other materials comes to the surface.
Standard practice during the completion process has been to vent or flare the natural gas
released, some of which is VOC. This category addresses VOC emissions associated with the
completion process at oil and gas wells. County-level emissions from this source were estimated
for the purpose of this inventory.
Emissions from well completions were calculated using the methodology from the 2008
CENRAP study (Bar-Ilan, et al., 2008). Emissions from well completions are estimated on the
basis of the volume of gas vented during completion and the average VOC content of that gas,
obtained from a gas composition analyses. Emissions rates are evaluated at standard temperature
and pressure (STP).
The calculation methodology for completion emissions follows the following equations:
907200000035.0)/(
)(,
i
gas
vented
icompletion
f
TMWR
VPE ×
××
×=
where:
Ecompletion,i is the emissions of pollutant i from a single completion event [ton/event]
P is atmospheric pressure [1 atm]
Vvented is the volume of vented gas per completion [MCF/event]
R is the universal gas constant [0.082 L-atm/mol-oK]
MWgas is the molecular weight of the gas [g/mol]
T is the atmospheric temperature [298 oK]
0.000035 is the conversion factor from Mscf to liters
fi is the mass fraction of pollutant i in the vented gas
907,200 is the conversion factor from grams to tons of emissions

4-36
The total emissions from all completions occurring in a county can be evaluated
following:
countyicompletionTOTALcompletion SEE ×= ,,
where:
Ecompletion,TOTAL are the total emissions county-wide from completions [tons/year]
Ecompletion,i are the completion emissions from a single completion event [tons/event]
Scounty is the county-wide new well and recompleted well count
No data were available to account for the number of completions that were completed
using green completion or add-on control technologies. While these technologies exist and are
used to reduce emissions, no data is currently available to estimate the extent at which they are
employed in Texas. Also, the 2008 CENRAP study did not contain data on green completions or
add-on control technologies.
Volume of vented gas per completion, Vvented:
ERG was unable to obtain estimates for the volume of vented gas per completion from
the TRC. Therefore, ERG used the average volume vented presented in the 2008 CENRAP
study. This data was presented on a basin-level basis. The data obtained is summarized in
Table 4-18 below.
Table 4-18. 2008 CENRAP Data for Volume of Gas Vented per Completion
Basin
Volume of Gas Vented
per Completion
(MCF/event)
Anadarko 1,737
Bend Arch-Fort Worth 637
East Texas 2,417
Palo Duro a 1,198
Permian 0
Perman/Marathon Thrust Belt a 1,198
Western Gulf 1,200 a Data for the Palo Duro and Permian/Marathon Thrust Belt Basins
were not included in the CENRAP study. These values are an
average of the values from the other basins.

4-37
The data were applied to each county in Texas based on the county’s corresponding
basin.
Mass fraction for a single pollutant, fi:
ERG used the average basin-level mass fraction for VOCs obtained from the 2008
CENRAP study (3.6% for gas wells and 14.1% for oil wells).
Number of completions controlled by flares, cflare and the number of green completions, cgreen:
ERG was unable to obtain estimates for the number of completions controlled by flares
and the number of green completions. Therefore, ERG used default values presented in the 2008
CENRAP study, which was 0 for both parameters.
County-level new/recompleted well count, Scounty:
ERG obtained county-level data for the number of new and recompleted wells from the
TRC for each county included in this analysis. The TRC data indicated a total of 15,946
new/recompletions were finished in 2008. Of these, 3,032 were designated as gas wells and
2,687 were designated as oil wells. The remaining 10,227 wells were classified as O/G (as they
may end up producing oil, gas or a combination of both). For the purposes of emissions
calculations, ERG assigned the wells classified as O/G to the oil and gas categories by assuming
that the percentage of oil and gas well completions in each county was identical to the percentage
of producing oil and gas wells in each county. For example, if 75% of the producing wells in a
single county were oil wells, then 75% of the wells classified as O/G were designated as oil
wells. If there were no producing wells in a county, the completion was assumed to be an oil
well completion to represent worst-case emissions. As a result of this analysis, there were an
estimated 8,702 gas well competions and 7,244 oil well completions in 2008.
Emissions by county Ecompletion,TOTAL:
Appendix E presents county-level well completion emissions corresponding to the
number of wells completed in each county, based on the input variables discussed above.

4-38
Example Calculation for Well Completions:
Using the equations provided above, ERG calculated VOC emissions in Anderson
County from oil well completions as follows:
907200000035.0)/(
)(,
i
gas
vented
voccompletion
f
TMWR
VPE ×
××
×=
where:
Ecompletion,voc = the VOC emissions in Anderson County from a single oil well completion
event [ton/event]
P = 1 (atmospheric pressure) [atm]
Vvented = 2,417 (the volume of vented gas per completion for Anderson County (East
Texas Basin)) [MCF/event]
R = 0.082 (the universal gas constant) [L-atm/mol-oK]
MWgas = 27 (the molecular weight of the gas) [g/mol]
T = 298 (the atmospheric temperature) [oK]
0.000035 is the conversion factor from Mscf to liters
fi = 0.141 (the mass fraction of pollutant i in the vented gas)
907,200 is the conversion factor from grams to tons of emissions
Therefore:
Ecompletion,voc = ((1 atm x 2,417 [MCF/event])/((0.082 [L-atm/mol-oK]/27 [g/mol]) x 298
[oK] x 0.000035) x 0.141/907200
Ecompletion,voc = 11.86 [tons VOC/event]
The total emissions from all completions occurring in Anderson County can be evaluated
following:
countyvoccompletionTOTALcompletion SEE ×= ,,
where:
Ecompletion,TOTAL = the total VOC emissions from completions in Anderson County [tons
VOC/year]
Ecompletion,voc = 11.86 (completion emissions from a single completion event) [tons
VOC/event]
Scounty = 45.94 (the county-wide new well and recompleted well count for Anderson
County) [oil well completion events/yr]
Therefore:
Ecompletion,voc = 11.86 [tons VOC/event] x 50 [oil well completion events/yr]
Ecompletion,voc = 544.76 [tons VOC/yr]

4-39
4.7 Wellhead Blowdowns
Wellhead blowdowns refer to the practice of venting gas from wells that have developed
some kind of cap or obstruction before any additional intervention work can be done on the
wells. Typically, wellhead blowdowns are conducted on wells that have been shut in for a period
of time and the operator desires to bring the well back into production. Wellhead blowdowns are
also sometimes conducted to remove fluid caps that have built up in producing gas wells.
Because gas is directly vented from the blowdown event, blowdowns can be a source of VOC
emissions. County-level emissions from this source were estimated for the purpose of this
inventory.
Emissions from wellhead blowdowns were calculated using the methodology from the
2008 CENRAP study (Bar-Ilan, et al., 2008). Emissions from wellhead blowdowns are
estimated on the basis of the volume of gas vented during a blowdown, and the average VOC
content of that gas, obtained from a gas composition analyses. The emissions are also estimated
based on the frequency of blowdowns. Emissions rates are evaluated at standard temperature
and pressure (STP).
The calculation methodology for blowdown emissions is identical to the method for
completion emissions, and follows the following equations:
907200000035.0)/(
)(,
i
gas
vented
iblowdown
f
TMWR
VPE ×
××
×=
where:
Ecompletion,i is the emissions of pollutant i from a single blowdown event [ton/event]
P is atmospheric pressure [1 atm]
Vvented is the volume of vented gas per blowdown [MCF/event]
R is the universal gas constant [0.082 L-atm/mol-oK]
MWgas is the molecular weight of the gas [g/mol]
T is the atmospheric temperature [298 oK]
0.000035 is the conversion factor from Mscf to liters
fi is the mass fraction of pollutant i in the vented gas
907,200 is the conversion factor from grams to tons of emissions
The total emissions from all blowdowns occurring in a county can be evaluated
following:

4-40
wellsblowdowniblowdownTOTALblowdown NNEE ××= ,,
where:
Eblowdown,TOTAL are the total emissions county-wide from blowdowns [tons/year]
Eblowdown,I are the blowdown emissions from a single blowdown event [tons/event]
Nblowdown is the number of blowdowns per well in the county
Nwells is the total number of active wells in the county
No data were available to account for the number of blowdowns using green completion
or add-on control technologies. While these technologies exist and are used to reduce emissions,
no data is currently available to estimate the extent at which they are employed in Texas. Also,
the 2008 CENRAP study did not contain data on green blowdowns or add-on control
technologies. Therefore, we have assumed 0 for these parameters.
Volume of vented gas per blowdown, Vvented:
ERG was unable to obtain estimates for the volume of vented gas per blowdown from the
TRC. Therefore, ERG used the average volume vented presented in the 2008 CENRAP study.
This data was presented on a basin-level basis. The data obtained is summarized in Table 4-19
below.
Table 4-19. 2008 CENRAP Data for Volume of Gas Vented per
Blowdown per Wellhead
Basin
Volume of Gas Vented
per Blowdown per
Wellhead
(MCF/event/wellhead)
Anadarko 7.28
Bend Arch-Fort Worth 38.9
East Texas 31.67
Palo Duro a 60.35
Permian 50
Perman/Marathon Thrust Belt a 60.35
Western Gulf 173.9 a Data for the Palo Duro and Permian/Marathon Thrust Belt Basins were not included in
the CENRAP study. These values are an average of the values from the other basins.
The data were applied to each county in Texas based on the county’s corresponding
basin.

4-41
Mass fraction for a single pollutant, fi:
ERG used the average basin-level mass fraction for VOCs obtained from the 2008
CENRAP study (3.6% for gas wells and 14.1% for oil wells).
County-level number of blowdowns per well, Nblowdown:
ERG was unable to obtain estimates for the number of blowdowns per well from the
TRC. Therefore, ERG used the average volume vented presented in the 2008 CENRAP study.
This data was presented on a basin-level basis. The data obtained is summarized in Table 4-20
below.
Table 4-20. 2008 CENRAP Data for Wellhead Blowdown Frequency
Basin
Blowdown Frequency
(events/wellhead/yr)
Anadarko 3.3
Bend Arch-Fort Worth 1.54
East Texas 1.09
Palo Duro a 5
Permian 5
Perman/Marathon Thrust Belt a 5
Western Gulf 0.71 a Data for the Palo Duro and Permian/Marathon Thrust Belt Basins were not included in
the CENRAP study. These values are an average of the values from the other basins.
The data were applied to each county in Texas based on the county’s corresponding
basin.
County-level well count, Nwells:
ERG obtained county-level data for the number of wells from the TRC for each county
included in this analysis. The TRC data (for onshore wells only) indicated a total of 91,732 gas
wells and 153,831 oil wells for the State of Texas.

4-42
Number of blowdowns controlled by flares, cflare and the number of green blowdowns, cgreen:
ERG was unable to obtain estimates for the number of blowdowns controlled by flares
and the number of green blowdowns. Therefore, ERG used default values presented in the 2008
CENRAP study, which was 0 for both parameters.
Emissions by county Eblowdown,TOTAL:
Appendix E presents county-level wellhead blowdown emissions corresponding to the
number of wells in each county, based on the input variables discussed above.
Example Calculation for Wellhead Blowdowns
Using the equations provided above, ERG calculated VOC emissions in Anderson
County from oil wellhead blowdowns as follows:
907200000035.0)/(
)(,
i
gas
vented
vocblowdown
f
TMWR
VPE ×
××
×=
where:
Eblowdown,voc = the VOC emissions in Anderson County from a single oil wellhead
blowdown event [ton/event]
P = 1 (atmospheric pressure) [atm]
Vvented = 31.7 (the volume of vented gas per blowdown for Anderson County (East Texas
Basin)) [MCF/event]
R = 0.082 (the universal gas constant) [L-atm/mol-oK]
MWgas = 27 (the molecular weight of the gas) [g/mol]
T = 298 (the atmospheric temperature) [oK]
0.000035 is the conversion factor from Mscf to liters
fi = 0.141 (the mass fraction of pollutant i in the vented gas)
907,200 is the conversion factor from grams to tons of emissions
Therefore:
Eblowdown,voc = ((1 [atm] x 31.7 [MCF/event])/((0.082 [L-atm/mol-oK]/27 [g/mol]) x 298
[oK] x 0.000035) x 0.141/907200
Eblowdown,voc = 0.1554 [tons/event]
The total emissions from all blowdowns occurring in Anderson County can be evaluated
following:
wellsblowdownvocblowdownTOTALblowdown NNEE ××= ,,

4-43
where:
Eblowdown,TOTAL = the total VOC emissions county-wide from blowdowns [tons/year]
Eblowdown,voc =0.1554 (the VOC blowdown emissions from a single blowdown event)
[tons/event]
Nblowdown =1.09 (the number of blowdowns per well in Anderson County (East Texas
Basin)) [events/wellhead/yr]
Nwells = 456 (the total number of active wells in Anderson County) [wells]
Therefore:
Eblowdown, TOTAL = 0.1554 [tons VOC/event] x 1.09 [events/wellhead/yr] x 456 [wells]
Eblowdown, TOTAL = 77.24 [tons VOC/yr]
4.8 Pneumatic Devices
Pneumatic devices are used for a variety of gas well processes and are powered by high-
pressure produced gas. These devices include transducers, liquid level controllers, pressure
controllers and positioners. During the normal operation of these devices, they release or bleed
natural gas to the atmosphere making them a source of VOC emissions. County-level emissions
from these sources are estimated for the purpose of this inventory.
Emissions from pneumatic devices were calculated using the methodology from the 2008
CENRAP study (Bar-Ilan, et al., 2008). In this emission estimation approach, emissions from
pneumatic devices at a single well site are calculated using the following equation:
000035.0907200
,
××
×
××= ∑
TMW
R
PtNV
fE
gas
i
annualii
j
jpneumatic
where:
Epneumatic,j is the total emissions of pollutant j from all pneumatic devices for a typical well
[ton/well-year]
907,200 is the conversion factor from grams to tons of emissions
fj is the mass fraction of pollutant j in the vented gas
Vi is the volumetric bleed rate from device i [scf/hr/device]
Ni is the total number of device i owned by the participating companies
tannual is the number of hours per year that devices are operating
P is the atmospheric pressure [1 atm]
R is the universal gas constant [0.082 L-atm/mol-oK]
MWgas is the molecular weight of the gas [g/mol]
T is the atmospheric temperature [298 oK]
0.000035 is the conversion factor from Mscf to liters
4-44
County-wide emissions are calculated using the following equation:
welljpneumaticTOTALpneumaticNEE ×= ,,
where:
Epneumatic,TOTAL is the total pneumatic device emissions in the county [ton/yr]
Epneumatic,j is the pneumatic device emissions for a single well of pollutant j [ton/yr]
Nwell is the total number of active wells in the county for a given year
Emissions rates are evaluated at STP.
Number of active wells in a given county for 2008, Nwell:
Total active wells by county for the full 2008 year are not readily available from the TRC
website. However, well distribution data by county is available from the TRC website on a bi-
annual (February and September) basis and can be found at:
http://www.rrc.state.tx.us/data/wells/wellcount/index.php. ERG used the September 2008 TRC
report to get a count of regular producing wells by county.
Volumetric bleed rate from device i, Vi:
Bleed rates for various devices are presented in a 2004 EPA Natural Gas Star program
study. We have used these when calculating emissions from pneumatic devices at gas
production sites. This data is summarized in Table 4-21.
Total number of devices, Ni:
The 2008 CENRAP study obtained basin-level data for the total number of devices per
well from survey data. The same value for each device type was used for each basin in the
CENRAP report. ERG used this basin level data as a basis for the number of devices per well.
This data is summarized in Table 4-21.
Number of hours per year that devices are operating, tannual:
ERG has assumed the annual operating hours for these devices is 8,760.
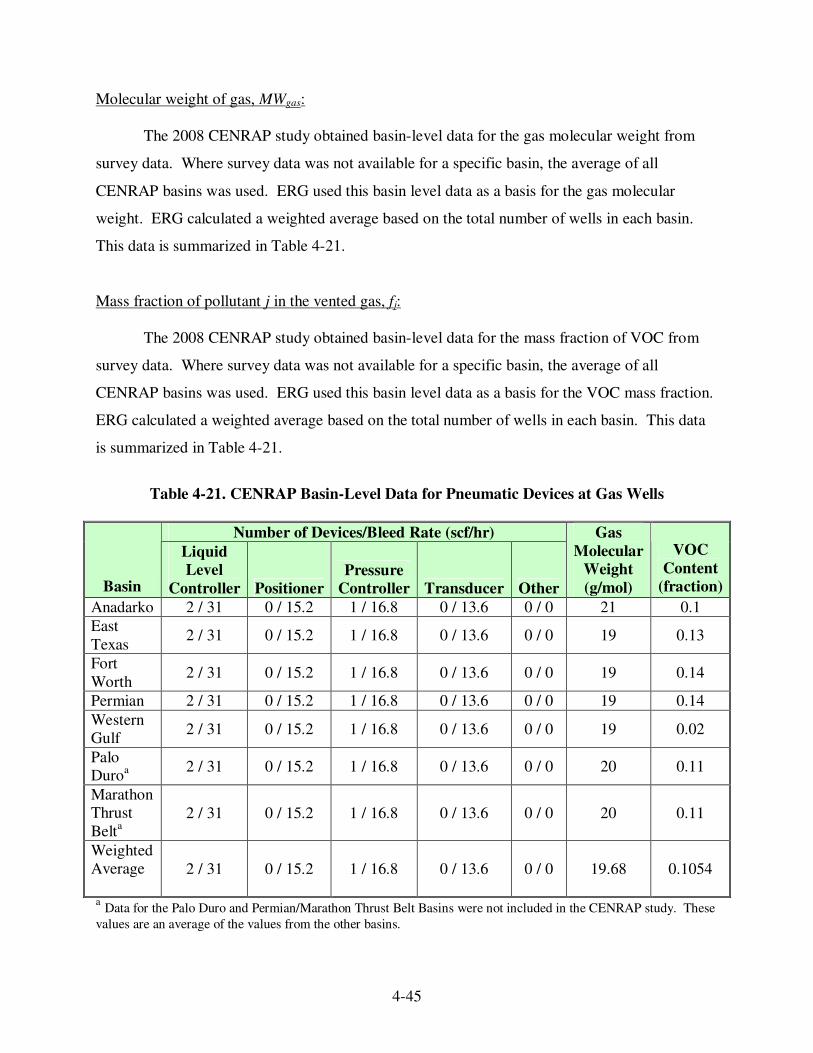
4-45
Molecular weight of gas, MWgas:
The 2008 CENRAP study obtained basin-level data for the gas molecular weight from
survey data. Where survey data was not available for a specific basin, the average of all
CENRAP basins was used. ERG used this basin level data as a basis for the gas molecular
weight. ERG calculated a weighted average based on the total number of wells in each basin.
This data is summarized in Table 4-21.
Mass fraction of pollutant j in the vented gas, fj:
The 2008 CENRAP study obtained basin-level data for the mass fraction of VOC from
survey data. Where survey data was not available for a specific basin, the average of all
CENRAP basins was used. ERG used this basin level data as a basis for the VOC mass fraction.
ERG calculated a weighted average based on the total number of wells in each basin. This data
is summarized in Table 4-21.
Table 4-21. CENRAP Basin-Level Data for Pneumatic Devices at Gas Wells
Number of Devices/Bleed Rate (scf/hr)
Basin
Liquid
Level
Controller Positioner
Pressure
Controller Transducer Other
Gas
Molecular
Weight
(g/mol)
VOC
Content
(fraction)
Anadarko 2 / 31 0 / 15.2 1 / 16.8 0 / 13.6 0 / 0 21 0.1
East
Texas 2 / 31 0 / 15.2 1 / 16.8 0 / 13.6 0 / 0 19 0.13
Fort
Worth 2 / 31 0 / 15.2 1 / 16.8 0 / 13.6 0 / 0 19 0.14
Permian 2 / 31 0 / 15.2 1 / 16.8 0 / 13.6 0 / 0 19 0.14
Western
Gulf 2 / 31 0 / 15.2 1 / 16.8 0 / 13.6 0 / 0 19 0.02
Palo
Duroa
2 / 31 0 / 15.2 1 / 16.8 0 / 13.6 0 / 0 20 0.11
Marathon
Thrust
Belta
2 / 31 0 / 15.2 1 / 16.8 0 / 13.6 0 / 0 20 0.11
Weighted
Average
2 / 31 0 / 15.2 1 / 16.8 0 / 13.6 0 / 0 19.68 0.1054
a Data for the Palo Duro and Permian/Marathon Thrust Belt Basins were not included in the CENRAP study. These
values are an average of the values from the other basins.

4-46
Emissions by county Epneumatic,TOTAL:
Appendix E presents county-level pneumatic device emissions corresponding to the
number of active oil and gas wells in each county, based on the input variables discussed above.
Example Calculation for Pneumatic Devices:
Using the equations provided above, ERG calculated VOC emissions in Anderson
County from pneumatic devices as follows:
For one well:
000035.0907200
,
××
×
××= ∑
TMW
R
PtNV
fE
gas
i
annualii
j
jpneumatic
Where:
Epneumatic,j = VOC emissions from one well in Anderson County [tons/well-year]
907,200 is the conversion factor from grams to tons of emissions
fj = 0.1054 (the VOC fraction in the vented gas in Anderson County)
Vi = 0.031 for liquid level controllers and 0.0168 for pressure controllers (bleed rate for
devices present in wells in Anderson County) [Mcf/device-hr]
Ni = 2 for liquid level controllers and 1 for pressure controllers (number of devices
present in wells in Anderson County)
tannual = 8,760 (annual operating hours of wells in Anderson County) [hr/yr]
P = 1 (standard pressure) [atm]
T = 298 (standard temperature) [oK]
R = 0.082 (universal gas constant) [L-atm/mol-oK]
MWgas = 19.68 (molecular weight of vented gas at wells in Anderson County) [g/mol]
0.000035 is the conversion factor from Mscf to liters
Therefore:
Epneumatic,j = (0.1504/907,200) x ((0.031 [Mcf/device-hr] * 2 [devices] * 8,760 [hrs]) +
(0.0168 [MCF/device-hr] * 1 [device] * 8,760 [hrs])) x (1/((0.082 [L-atm/mol-oK] / 19.68
[g/mol]) * 298 [oK] * 0.000035))
Epneumatic,j = 1.845 [tons VOC/well-yr]
For all wells in Anderson County:
welljpneumaticTOTALpneumaticNEE ×= ,,
Where:
Epneumatic,TOTAL = VOC emissions from all gas wells in Anderson County [tons/yr]
Epneumatic,j = 1.845 [tons VOC/well-yr]
Nwell = 133 (number of wells in Anderson County)

4-47
Therefore:
Epneumatic,TOTAL = 1.845 [tons VOC/well-yr] x 133 [wells]
Epneumatic,TOTAL = 245 [tons VOC/yr]
4.9 Fugitive Emissions (Equipment Leaks)
All oil and gas producing sites have a system of pumps and piping to transport oil and gas
from the wellhead to the processing area. These pumps and piping networks are constructed
with many individual components including flanges, valves, seals, and connectors. As a result of
high operating pressures, varying fitting tightness, and age and condition, each of these
components has the potential to release fugitive emissions while oil and gas product flows
through them. County-level emissions from these sources are estimated for the purpose of this
inventory.
Emissions from fugitive components were calculated using the methodology from the
2008 CENRAP study (Bar-Ilan, et al., 2008). In this methodology, fugitive emissions from a
single well site may be calculated using the following equation:
∑ ××××=i
jannualiijfugitive YtNEFE 0011.0,
where:
Efugitive,j is the fugitive emissions for a single typical well for pollutant j [ton/yr/well]
EFi is the emission factor of Total Organic Carbon (TOC) for a single component i
[kg/hr/component]
Ni is the total number of components of type i
tannual is the annual number of hours the well is in operation [hr/yr]
Yj is the mass fraction of pollutant j to TOC in the vented gas
0.0011 is the conversion factor from tons to kilograms
County-wide fugitive emissions are calculated using the following equation:
welljfugitiveTOTALfugitiveNEE ×= ,,
where:
Efugitive,TOTAL is the total fugitive emission in the county [ton/yr]
Efugitive,j is the fugitive emissions for a single well of pollutant j [ton/yr]
Nwell is the total number of active wells in the county for a given year
Emissions rates are evaluated at STP.

4-48
Number of active wells in a given county for 2008, Nwell:
Total active wells by county for the full 2008 year are not readily available from the TRC
website. However, well distribution data by county is available from the TRC website on a bi-
annual (February and September) basis and can be found at:
http://www.rrc.state.tx.us/data/wells/wellcount/index.php. ERG used the September 2008 TRC
report to get a count of regular producing wells by county.
Emission factor of TOC for a single component, EFi:
AP-42 emissions factors were used to calculate fugitive emissions from equipment leaks
at oil and gas production sites. Emissions factors are referenced from the AP-42 supporting
document entitled “Protocol for Equipment Leak Emission Estimations” and summarized in
Table 4-22 below.
Table 4-22. AP-42 Emissions Factors for Fugitive Components
Emissions Factor (kg-TOC/hr) Component Type Gas Light Oil
Valves 0.0045 0.0025
Pump Seals 0.0024 0.013
Others 0.0088 0.0075
Connectors 0.0002 0.00021
Flanges 0.00039 0.00011
Open-ended Lines 0.002 0.0014
Total number of components, Ni:
The 2008 CENRAP study obtained basin-level data for the total number of components
per well from survey data. ERG used this basin level data as a basis for the number of
components per well. ERG calculated a weighted average based on the number of wells at each
basin. This data is summarized in Table 4-23 for gas wells and Table 4-24 for oil wells. The
CENRAP data did not contain information on component counts for “Pump Seals”, or “Others”
(equipment such as dump lever arms, polish rod pumps, or hatches). Therefore, an estimate of 2
“Pump Seals” and 10 “Others” were used to gapfill the CENRAP data to complete the inventory
(Maldonado, 2010).

4-49
Annual number of hours the well is in operation, tannual:
ERG used 8,760 hours per year for the hours the well is in operation.
Mass fraction of pollutant j to TOC in the vented gas, Yj:
The 2008 CENRAP study obtained basin-level data for the fraction of VOC to TOC in
the vented gas from survey data. ERG used this basin level data as a basis for the fraction of
VOC to TOC in the vented gas. ERG calculated a weighted average based on the number of
wells at each basin. This data is summarized in Table 4-23 for gas wells and Table 4-24 for oil
wells.
Table 4-23. CENRAP Basin-Level Data for Fugitives at Gas Wells
Number of Components Per Typical Well
Basin Valves
Pump
Seals Others Connectors Flanges
Open-
Ended
Lines
Fraction
of VOC
in TOC
Anadarko 12 2 10 35 18 6 0.12
East Texas 12 2 10 35 18 6 0.14
Fort
Worth 12 2 10 35 18 6 0.15
Permian 19 2 10 43 29 3 0.14
Western
Gulf 24 2 10 118 59 3 0.02
Palo Duroa 16 2 10 53 28 5 0.11
Marathon
Thrust
Belta
16 2 10 53 28 5 0.11
Weighted
Average 16.54 2.00 10.00 58.53 31.00 4.62 0.11226
a Data for the Palo Duro and Permian/Marathon Thrust Belt Basins were not included in the CENRAP study. These
values are an average of the values from the other basins.
Table 4-24. CENRAP Basin-Level Data for Fugitives at Oil Wells
Number of Components Per Typical Well
Basin Valves
Pump
Seals Others Connectors Flanges
Open-
Ended
Lines
Fraction
of VOC
in TOC
Anadarko 20 2 10 90 0 3 0.12
East Texas 20 2 10 90 0 3 0.14
Fort
Worth 20 2 10 90 0 3 0.15
Permian 16 2 10 58 12 2 0.14

4-50
Table 4-24. CENRAP Basin-Level Data for Fugitives at Oil Wells (Cont.)
Number of Components Per Typical Well
Basin Valves
Pump
Seals Others Connectors Flanges
Open-
Ended
Lines
Fraction
of VOC
in TOC
Western
Gulf 18 2 10 95 25 2 0.02
Palo Duroa 19 2 10 85 7 3 0.11
Marathon
Thrust
Belta
19 2 10 85 7 3 0.11
Weighted
Average 18.80 2.00 10.00 84.60 7.40 2.60 0.11226
a Data for the Palo Duro and Permian/Marathon Thrust Belt Basins were not included in the CENRAP study. These
values are an average of the values from the other basins.
Emissions by county Efugitive,TOTAL:
Appendix E presents county-level fugitive emissions corresponding to the number of
active oil and gas wells in each county, based on the input variables discussed above.
Example Calculation for Fugitive Emissions (Equipment Leaks):
Using the equations provided above, ERG calculated VOC emissions in Anderson
County from equipment leaks at oil wells as follows:
For one well:
∑ ××××=i
jannualiijfugitive YtNEFE 0011.0,
Where:
Efugitive,j = VOC emissions from one oil well in Anderson County [tons/well-year]
EFi = AP-42 emissions factors 0.0025 for valves, 0.013 for pump seals, 0.0075 for others,
0.00021 for connectors, 0.00011 for flanges, and 0.0014 for open ended lines [kg-
TOC/hr]
Ni = 18.80 for valves, 2.00 for pump seals, 10.00 for others, 84.60 for connectors, 7.40
for flanges, and 2.60 for open ended lines (number of fugitive areas present in oil wells in
Anderson County)
tannual = 8,760 (annual operating hours of oil wells in Anderson County) [hr/yr]
Yj = 0.11226 (mass fraction of VOC in the TOC vented from the fugitive areas) [ton
VOC/ton TOC]

4-51
Therefore:
Efugitive,j = 8,760 [hr/yr] x 0.11226 [ton VOC/ton TOC] x 0.0011 [tons/kg] x ((0.0025 *
18.80) + (0.013 * 2.00) + (0.0075 * 10.00) + (0.00021 * 84.60) + (0.00011 * 7.40) +
(0.0014 * 2.60) [kg-VOC/well-hr]))
Epneumatic,j = 0.18413 [tons VOC/well-yr]
For all wells in Anderson County:
welljfugitiveTOTALfugitiveNEE ×= ,,
Where:
Efugitive,TOTAL = VOC emissions from all oil wells in Anderson County [tons/yr]
Efugitive,j = 0.18413 [tons VOC/well-yr]
Nwell = 456 (number of oil wells in Anderson County)
Therefore:
Epneumatic,TOTAL = 0.18413 [tons VOC/well-yr] x 456 wells
Epneumatic,TOTAL = 83.97 [tons VOC/yr]
4.10 Heaters and Boilers
The purpose of heaters and boilers at oil and gas production facilities is to provide
thermal energy input to certain operations within the production process. They can be used as
separator heaters (heater treaters) to provide heat input to separation units, as tank heaters to
maintain storage tank temperatures, or as inline heaters to maintain temperature within pipes and
connections. Heaters and boilers may also be used in dehydrators; however, these sources are
covered under the dehydrator source methodology. Heaters and boilers are typically natural gas-
fired external combustors and are a source of NOx, CO, VOC and PM emissions. SO2 emissions
may also occur if the gas used to fire the heaters contains Hydrogen Sulfide (H2S) which will be
subsequently converted to SO2 during combustion. County-level emissions from heater sources
are estimated for the purpose of this inventory.
Emissions from heaters and boilers were calculated using the methodology from the 2008
CENRAP study (Bar-Ilan, et al., 2008). In this methodology, emissions from a single heater may
be calculated using the following equation (excluding SO2 emissions):
( )2000×
×××=
local
annualheaterheater
heaterHV
hctQEFE

4-52
where:
Eheater is the emissions from a given heater [ton/yr] EFheater is the emission factor for a heater for a given pollutant [lb/MMscf]
Qheater is the heater MMBtu/hr rating [MMBturated/hr] HVlocal is the local natural gas heating value [MMBtulocal/MMscf]
tannual is the annual hours of operation [hr/yr] hc is the heater cycling fraction to account for the fraction of operating hours that the
heater is firing. 2000 is the conversion factor from pounds to tons of emissions
SO2 emissions from a single heater may be calculated using the following equation:
××
×
×××
×=
035.0907200
78.12
2,
TMW
R
P
HV
hctQfE
gas
local
annualheaterSH
SOheater
where:
Eheater,SO2 is the SO2 emissions from a given heater [ton-SO2/yr] 1.78 is the mass ratio of SO2 to H2S
fH2S is the mass fraction of H2S in the gas 907200 is the conversion factor from grams to tons of emissions
Qheater is the heater MMBtu/hr rating [MMBturated/hr] tannual is the annual hours of operation [hr/yr]
hc is the heater cycling fraction to account for the fraction of operating hours that the heater is firing.
HVlocal is the local natural gas heating value [MMBtulocal/MMscf] P is atmospheric pressure [1 atm]
R is the universal gas constant [0.082 L-atm/mol-oK]
MWgas is the molecular weight of the gas [g/mol]
T = 298 (standard temperature) [oK]
0.035 is the conversion factor from cubic feet to liters
The total emissions generated by heaters and boilers from specific county are calculated
using the following equation:
2000
,
,,
jTOTAL
heateriheaterTOTALheater
WNEE ××=
where:
Eheater,TOTAL is the total heater emissions of pollutant i in county j [ton/yr] Eheater,i is the total emissions of pollutant i from a single heater [ton/yr]
WTOTAL,j is the total number of wells in county j Nheater is the typical number of heaters per well in the county
2000 is the conversion factor from pounds to tons of emissions

4-53
Total number of wells in a given county for 2008, WTOTAL,j:
Total active wells by county for the full 2008 year are not readily available from the TRC
website. However, well distribution data by county is available from the TRC website on a bi-
annual (February and September) basis and can be found at:
http://www.rrc.state.tx.us/data/wells/wellcount/index.php. ERG used the September 2008 TRC
report to get a count of regular producing wells by county.
Emission factor for a heater for a given pollutant, EFheater:
ERG used EPA’s AP-42 emissions factors when calculating emissions from heaters and
boilers at oil and gas production sites. Emissions factors are referenced from Tables 1.4-1 and
1.4-2 of AP 42, Fifth Edition, Volume I, Chapter 1: External Combustion Sources and
summarized in Table 4-25 below.
Table 4-25. AP-42 Emissions Factors for Natural Gas Fired Heaters
Pollutant Emissions Factor
(lb/MMscf)
NOx 100
CO 84
PM10 7.6a
VOC 5.5 a PM10 assumed to be equal to PM2.5.
Heater MMBTU/hr rating, Qheater:
The 2008 CENRAP study obtained basin-level data for the heater rating from survey
data. ERG used this basin level data as a basis for the heater rating. ERG calculated a weighted
average based on the number of wells at each basin. This data is summarized in Table 4-26 for
gas wells and Table 4-27 for oil wells.
Local natural gas heating value, HVlocal:
The 2008 CENRAP study obtained basin-level data for the local heating value from
survey data. The same value was used for the gas well heating value and oil well heating value
for each basin in the CENRAP report. The gas well value was 1,209 MMBtu/MMscf, and the oil

4-54
well value was 1,655 MMBtu/MMscf. ERG used this basin level data as a basis for the local
heating values.
Annual hours of operation, tannual:
The 2008 CENRAP study obtained basin-level data for the annual heater operating hours
from survey data. ERG used this basin level data as a basis for the annual operating hours. ERG
calculated a weighted average based on the number of wells at each basin. This data is
summarized in Table 4-26 for gas wells and Table 4-27 for oil wells.
Heater cycling fraction, hc:
The 2008 CENRAP study used a default value of 1 for heater cycling fraction. ERG also
used this as a basis for the heater cycling fraction.
Mass fraction of H2S, fH2S:
The 2008 CENRAP study obtained basin-level data for the mass fraction of H2S from
survey data. ERG used this basin level data as a basis for the mass fraction of H2S. ERG
calculated a weighted average based on the number of wells at each basin. This data is
summarized in Table 4-26 for gas wells and Table 4-27 for oil wells.
Molecular weight of gas, MWgas:
The 2008 CENRAP study obtained basin-level data for the gas molecular weight from
survey data. ERG used this basin level data as a basis for the gas molecular weight. ERG
calculated a weighted average based on the number of wells at each basin. This data is
summarized in Table 4-26 for gas wells and Table 4-27 for oil wells.
Typical number of heater per well, Nheater:
The 2008 CENRAP study obtained basin-level data for the average number of heaters per
well from survey data. ERG used this basin level data as a basis for the average number of
heaters per well. ERG calculated a weighted average based on the number of wells at each
basin. This data is summarized in Table 4-26 for gas wells and Table 4-27 for oil wells.

4-55
Table 4-26. CENRAP Basin-Level Data for Heaters at Gas Wells
Heater Operating Parameters
Natural Gas Fuel
Parameters
Basin
Number of
heaters in
a typical
well setup
Heater
Firing Rate
[MMBtu/hr]
Annual
Activity
[hr]
Local Heating
Value
[MMBtu/MMscf]
Heater
Cycling
MWgas
[g/mol]
H2S Mass
Fraction
Anadarko 0.94 0.92 4,601 1,209 1 21 -
East Texas
0.95 0.64 2,982 1,209 1 19 0.02
Fort
Worth 1 0.50 4,380 1,209 1 20 -
Permian 0.54 0.69 4,121 1,209 1 19 0.0001
Western Gulf
1.1 0.46 4,297 1,209 1 19 -
Palo Duro
a
0.91 0.64 4,076 1,209 1 20 0.005
Marathon Thrust
Belta
0.91 0.64 4,076 1,209 1 20 0.005
Weighted
Average 0.91 0.64 4,076 1,209 1 20 0.005
a Data for the Palo Duro and Permian/Marathon Thrust Belt Basins were not included in the CENRAP study. These values
are an average of the values from the other basins.
Table 4-27. CENRAP Basin-Level Data for Heaters at Oil Wells
Heater Operating Parameters
Natural Gas Fuel
Parameters
Basin
Number of
heaters in
a typical
well setup
Heater
Firing Rate
[MMBtu/hr]
Annual
Activity
[hr]
Local Heating
Value
[MMBtu/MMscf]
Heater
Cycling
MWgas
[g/mol]
H2S Mass
Fraction
Anadarko 0.94 0.92 4,601 1,655 1 23 -
East Texas
0.95 0.64 2,982 1,655 1 27 1.30
Fort Worth
1 0.50 4,380 1,655 1 25 -
Permian 0.54 0.69 4,121 1,655 1 34 6.50
Western Gulf
1.1 0.46 4,297 1,655 1 25 -
Palo Duro
a
0.91 0.64 4,076 1,655 1 27 1.56

4-56
Table 4-27. CENRAP Basin-Level Data for Heaters at Oil Wells (Cont.)
Heater Operating Parameters
Natural Gas Fuel
Parameters
Basin
Number of
heaters in
a typical
well setup
Heater
Firing Rate
[MMBtu/hr]
Annual
Activity
[hr]
Local Heating
Value
[MMBtu/MMscf]
Heater
Cycling
MWgas
[g/mol]
H2S Mass
Fraction
Marathon
Thrust Belt
a
0.91 0.64 4,076 1,655 1 27 1.56
Weighted Average
0.91 0.64 4,076 1,655 1 27 1.56
a Data for the Palo Duro and Permian/Marathon Thrust Belt Basins were not included in the CENRAP study. These values
are an average of the values from the other basins.
HAP Emissions for Heaters and Boilers:
HAP emissions from heaters and boilers were calculated using VOC and PM speciation
data as follows:
EVOC-HAP = EVOC x (E%VOC-HAP /100)
where: EVOC-HAP = Speciated VOC-HAP emissions [tons/yr]
EVOC = VOC emissions [tons/yr] E%VOC-HAP = % HAP composition of VOC emissions
and
EPM-HAP = EPM x (E%PM-HAP /100)
where:
EPM-HAP = Speciated PM-HAP emissions [tons/yr] EPM = PM emissions [tons/yr]
E%PM-HAP = % HAP composition of PM emissions
Appendix C contains the VOC and PM HAP speciation data.
Emissions by county Eheater,TOTAL:
Appendix E presents county-level heater emissions corresponding to the number of active
oil and gas wells in each county, based on the input variables discussed above.

4-57
Example Calculation for Heaters and Boilers:
Using the equations provided above, ERG calculated NOx and SO2 emissions in
Anderson County from heaters and boilers at oil wells as follows:
For NOx emissions from one heater:
( )2000×
×××=
local
annualheaterheater
heaterHV
hctQEFE
Where:
Eheater = NOx emissions from one heater in Anderson County [tons/year] EFheater = 100 (AP-42 emissions factor for NOx) [lb/MMscf]
Qheater = 0.64 (heater firing rate) [MMBtu/hr] HVlocal = 1,655 (local natural gas heating value) [MMBTUlocal/MMscf])
tannual = 4,076 (annual hours of heater operation) [hr/yr] hc = 1 (heater cycling fraction to account for the fraction of operating hours that the
heater is firing) 2000 is the conversion factor from pounds to tons of emissions
Therefore:
Eheater = (100 [lb/MMscf] * 0.64 [MMBtu/hr] * 4,076 [hr/yr] * 1)/(1,655 [MMBtu/MMscf] * 2000 [lb/ton])
Eheater = 0.07881 [tons NOx /heater-yr]
For all wells in Anderson County:
jTOTALheateriheaterTOTALheater WNEE ,,, ××=
Where:
Eheater,TOTAL = NOx emissions from all oil wells in Anderson County [tons/yr]
Eheater,j = 0.07881 [tons NOx /heater-yr] Nheater = 0.91 (average number of heaters per well)
WTOTAL,j = 456 (number of wells in Anderson County)
Therefore: Eheater,TOTAL = 0.07881 [tons NOx /heater-yr] x 0.91 [heaters/well] x 456 [wells]
Eheater,TOTAL = 32.70 [tons NOx /yr]

4-58
For SO2 emissions from one heater:
××
×
×××
×=
035.0907200
78.12
2,
TMW
R
P
HV
hctQfE
gas
local
annualheaterSH
SOheater
Where:
Eheater,SO2 = SO2 emissions from one heater [ton-SO2/yr] fH2S = 1.56 (mass fraction of H2S in the gas)
Qheater = 0.64 (heater firing rate) [MMBtu/hr] HVlocal = 1,655 (local natural gas heating value) [MMBtulocal/MMscf])
tannual = 4,076 (annual hours of heater operation) [hr/yr] hc = 1 (heater cycling fraction to account for the fraction of operating hours that the
heater is firing) P = 1 (standard pressure) [atm]
R = 0.082 (universal gas constant) [L-atm/mol-oK]
T = 298 (standard temperature) [oK]
MWgas = 27 (molecular weight of the gas) [g/mol]
Therefore: Eheater,SO2 = ((1.78 * 1.56)/907,200) x (((0.64 [MMbtu/hr] * 4,076 [hr/yr] * 1)/1,655
[MMBtu/MMscf]) x (1/((0.082 [L-atm/mol-oK] /27 [g/mol]) * 298 [
oK] * 0.035))
Eheater,SO2 = 1.5231 x 10⁻⁴
[tons SO2/heater-yr]
For all wells in Anderson County:
jTOTALheateriheaterTOTALheater WNEE ,,, ××=
Where:
Eheater,TOTAL = SO2 emissions from all oil wells in Anderson County [tons/yr]
Eheater,j = 1.5231 x 10⁻⁴
[tons SO2/heater-yr]
Nheater = 0.91 (average number of heaters per well) WTOTAL,j = 456 (number of wells in Anderson County)
Therefore:
Eheater,TOTAL = 1.5231 x 10⁻⁴
[tons SO2/heater-yr] x 0.91 [heaters/well] x 456 wells Eheater,TOTAL = 0.0632 [tons SO2/yr]
5-1
5.0 RESULTS
Detailed emission estimates developed for this project are found in Appendix D for
compressor engines, and in Appendix E for the remainder of the source types. These Appendices
contain county-level emissions for source category on an individual pollutant basis. Table 5-1
presents a state-wide summary of criteria pollutant (and total HAP) emissions by source category,
Table 5-2 presents a summary of criteria pollutant (and total HAP) emissions for each county, and
Table 5-3 presents a summary of state-wide speciated HAP emissions by source type.
As Table 5-1 indicates, natural gas compressor engines account for nearly 70 percent of
state-wide NOx emissions with pumpjack engines accounting for another 20 percent of total NOx
emissions. Oil and gas well heaters account for the remaining 10 percent, with a small contribution
from glycol dehydrator boilers. The relative contribution of these sources to state-wide CO
emissions are similar, with oil and gas well heaters comprising a slightly higher percentage of
emissions at approximately 13 percent.
The majority of PM10 and PM2.5 emissions are also from combustion sources, but the oil
and gas well heaters are the primary source type, contributing nearly 60 percent to state-wide
totals. The remainder of PM10 and PM2.5 emissions come from compressor engines and pumpjack
engines, with a small contribution from glycol dehydrator boilers.
The profile is quite different for VOC, where over 70 percent of emissions originate from
oil and condensate storage tanks. Condensate tanks in particular comprise over 50 percent of state-
wide VOC emissions from oil and gas area sources. The remainder of VOC is emitted from the
combustion sources mentioned above, and other minor source types such as well completions and
blowdowns, pneumatic devices (which contribute over 10% of the total VOC emissions), and
equipment leak fugitives.
The relative profile of the contribution of each source type to state-wide HAP emissions is
similar to that of VOC emissions. Oil and condensate storage tanks contribute over 65 percent of
the state-wide total HAP emissions, with dehydrators contributing over 15 percent of the state-
wide total HAP emissions. The remainder of HAP emissions come from combustion sources and
oil and condensate loading racks.

5-2
Table 5-1. State-wide Emissions Inventory for 2008 by Source Category
SCC Source Category Description
CO
(tons/yr)
NOx
(tons/yr)
PM10
(tons/yr)
PM2.5
(tons/yr)
SO2
(tons/yr)
VOC
(tons/yr)
Total
HAP
(tons/yr)
2310000330 Artificial Lift 23,169.14 46,369.72 154.04 154.04 9.56 440.12 140.49
2310011020 Storage Tanks: Crude Oil 282,420.05 5,060.01
2310011100 Heater Treater 9,267.25 11,032.44 838.47 838.47 21.32 606.78 208.67
2310011201
Tank Truck/Railcar Loading:
Crude Oil 26,810.72 479.91
2310011450 Wellhead 116,245.65
2310011501 Fugitives: Connectors 2,956.39
2310011502 Fugitives: Flanges 135.46
2310011503 Fugitives: Open Ended Lines 605.72
2310011504 Fugitives: Pumps 4,326.59
2310011505 Fugitives: Valves 7,821.14
2310011506 Fugitives: Other 12,480.55
2310020600 Compressor Engines 133.77 464.56 13.58 13.58 0.21 81.40 29.00
2310021010 Storage Tanks: Condensate 864,087.90 17,281.71
2310021030
Tank Truck/Railcar Loading
Condensate 7,235.50 144.71
2310021100 Gas Well Heaters 7,564.83 9,005.75 684.44 684.44 0.04 495.32 170.34
2310021101
Natural Gas Fired 2-Cycle Lean
Burn Compressor Engines <50 Hp 140.52 209.25 9.72 9.72 0.16 43.38 15.46
2310021102
Natural Gas Fired 2-Cycle Lean
Burn Compressor Engines 50 To
499 Hp 2,907.93 13,776.30 352.37 352.37 5.71 2,012.02 716.78
2310021203
Natural Gas Fired 4-Cycle Lean Burn Compressor Engines 500+
Hp 14,746.41 27,288.73 76.95 76.95 15.94 3,817.42 2,337.58
2310021301
Natural Gas Fired 4-Cycle Rich
Burn Compressor Engines <50 Hp 93.37 1,175.69 3.86 3.86 0.25 5.61 5.50

5-3
Table 5-1. State-wide Emissions Inventory for 2008 by Source Category (Cont.)
SCC Source Category Description
CO
(tons/yr)
NOx
(tons/yr)
PM10
(tons/yr)
PM2.5
(tons/yr)
SO2
(tons/yr)
VOC
(tons/yr)
Total
HAP
(tons/yr)
2310021302
Natural Gas Fired 4-Cycle Rich
Burn Compressor Engines 50 To
499hp 38,988.69 86,462.54 226.24 226.24 14.83 1,487.26 1,451.93
2310021400 Gas Well Dehydrators 904.59 293.36 6,344.85 5,255.17
2310021402
Natural Gas Fired 4-Cycle Rich
Burn Compressor Engines 50-
499hp W/ Nscr 767.55 3,321.00 35.02 35.02 2.05 17.73 17.46
2310021403
Natural Gas Fired 4-Cycle Rich
Burn Compressor Engines 500+
Hp W/ Nscr 29,646.80 47,837.57 175.33 175.33 11.26 794.33 775.73
2310021501 Fugitives: Connectors 1,161.52
2310021502 Fugitives: Flanges 1,199.68
2310021503 Fugitives: Open Ended Lines 916.82
2310021504 Fugitives: Pumps 476.31
2310021505 Fugitives: Valves 7,387.52
2310021506 Fugitives: Other 8,732.37
2310021600 Gas Well Venting 8,601.78
2310121700
Gas Well Completion: All Processes 10,139.56
2310111700
Oil Well Completion: All
Processes 19,425.44
2310121401 Gas Well Pneumatic Pumps 169,209.86
Total: 128,330.85 247,236.91 2,570.01 2,570.01 81.34 1,568,522.73 34,090.45
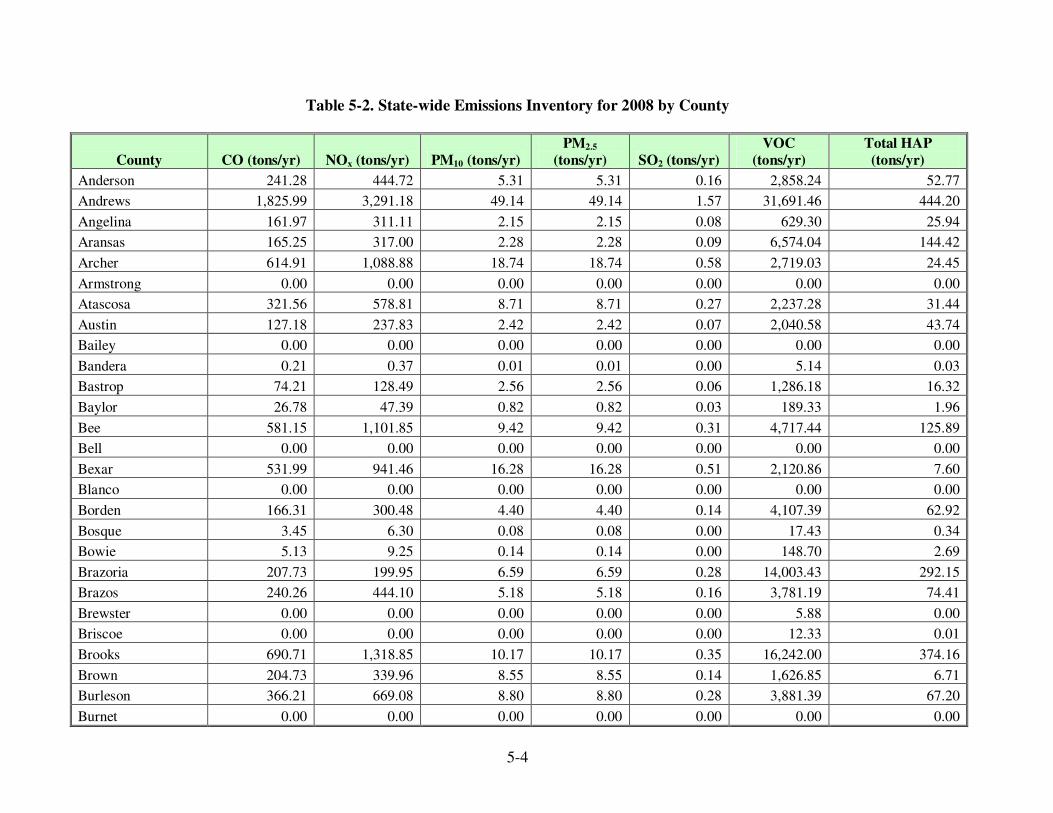
5-4
Table 5-2. State-wide Emissions Inventory for 2008 by County
County CO (tons/yr) NOx (tons/yr) PM10 (tons/yr)
PM2.5
(tons/yr) SO2 (tons/yr)
VOC
(tons/yr)
Total HAP
(tons/yr)
Anderson 241.28 444.72 5.31 5.31 0.16 2,858.24 52.77
Andrews 1,825.99 3,291.18 49.14 49.14 1.57 31,691.46 444.20
Angelina 161.97 311.11 2.15 2.15 0.08 629.30 25.94
Aransas 165.25 317.00 2.28 2.28 0.09 6,574.04 144.42
Archer 614.91 1,088.88 18.74 18.74 0.58 2,719.03 24.45
Armstrong 0.00 0.00 0.00 0.00 0.00 0.00 0.00
Atascosa 321.56 578.81 8.71 8.71 0.27 2,237.28 31.44
Austin 127.18 237.83 2.42 2.42 0.07 2,040.58 43.74
Bailey 0.00 0.00 0.00 0.00 0.00 0.00 0.00
Bandera 0.21 0.37 0.01 0.01 0.00 5.14 0.03
Bastrop 74.21 128.49 2.56 2.56 0.06 1,286.18 16.32
Baylor 26.78 47.39 0.82 0.82 0.03 189.33 1.96
Bee 581.15 1,101.85 9.42 9.42 0.31 4,717.44 125.89
Bell 0.00 0.00 0.00 0.00 0.00 0.00 0.00
Bexar 531.99 941.46 16.28 16.28 0.51 2,120.86 7.60
Blanco 0.00 0.00 0.00 0.00 0.00 0.00 0.00
Borden 166.31 300.48 4.40 4.40 0.14 4,107.39 62.92
Bosque 3.45 6.30 0.08 0.08 0.00 17.43 0.34
Bowie 5.13 9.25 0.14 0.14 0.00 148.70 2.69
Brazoria 207.73 199.95 6.59 6.59 0.28 14,003.43 292.15
Brazos 240.26 444.10 5.18 5.18 0.16 3,781.19 74.41
Brewster 0.00 0.00 0.00 0.00 0.00 5.88 0.00
Briscoe 0.00 0.00 0.00 0.00 0.00 12.33 0.01
Brooks 690.71 1,318.85 10.17 10.17 0.35 16,242.00 374.16
Brown 204.73 339.96 8.55 8.55 0.14 1,626.85 6.71
Burleson 366.21 669.08 8.80 8.80 0.28 3,881.39 67.20
Burnet 0.00 0.00 0.00 0.00 0.00 0.00 0.00

5-5
Table 5-2. State-wide Emissions Inventory for 2008 by County (Cont.)
County CO (tons/yr) NOx (tons/yr) PM10 (tons/yr)
PM2.5
(tons/yr) SO2 (tons/yr)
VOC
(tons/yr)
Total HAP
(tons/yr)
Caldwell 676.24 1,197.43 20.61 20.61 0.64 3,452.64 22.69
Calhoun 189.99 360.25 3.07 3.07 0.10 7,473.42 160.35
Callahan 182.61 321.30 5.76 5.76 0.16 983.48 9.65
Cameron 1.68 3.12 0.03 0.03 0.00 10.26 0.20
Camp 30.41 55.01 0.79 0.79 0.03 259.21 4.96
Carson 569.73 1,021.51 15.74 15.74 0.41 1,954.76 34.12
Cass 54.95 98.13 1.55 1.55 0.04 662.46 11.89
Castro 0.00 0.00 0.00 0.00 0.00 0.00 0.00
Chambers 84.76 94.63 2.75 2.75 0.11 4,424.08 90.13
Cherokee 364.58 682.18 6.78 6.78 0.18 2,911.32 72.93
Childress 1.69 2.99 0.05 0.05 0.00 57.40 0.71
Clay 231.82 409.65 7.14 7.14 0.21 1,476.89 16.60
Cochran 445.16 791.68 13.17 13.17 0.41 6,168.35 67.45
Coke 109.55 200.99 2.54 2.54 0.08 1,010.20 15.88
Coleman 173.73 295.58 6.51 6.51 0.13 1,363.81 9.92
Collin 0.00 0.00 0.00 0.00 0.00 0.00 0.00
Collingsworth 50.04 76.34 2.77 2.77 0.02 742.63 2.58
Colorado 319.38 601.84 5.54 5.54 0.16 4,980.62 115.78
Comal 0.00 0.00 0.00 0.00 0.00 0.00 0.00
Comanche 34.22 53.57 1.76 1.76 0.02 438.42 1.97
Concho 72.58 128.12 2.23 2.23 0.06 821.04 9.65
Cooke 495.43 884.64 14.25 14.25 0.45 3,467.02 50.26
Coryell 0.00 0.00 0.00 0.00 0.00 3.13 0.00
Cottle 95.67 180.55 1.63 1.63 0.05 2,376.44 52.30
Crane 1,739.98 3,208.47 38.61 38.61 1.26 17,274.91 291.73
Crockett 2,274.88 4,015.15 68.61 68.61 1.15 28,501.91 414.45
Crosby 85.55 151.51 2.61 2.61 0.08 1,056.14 9.67
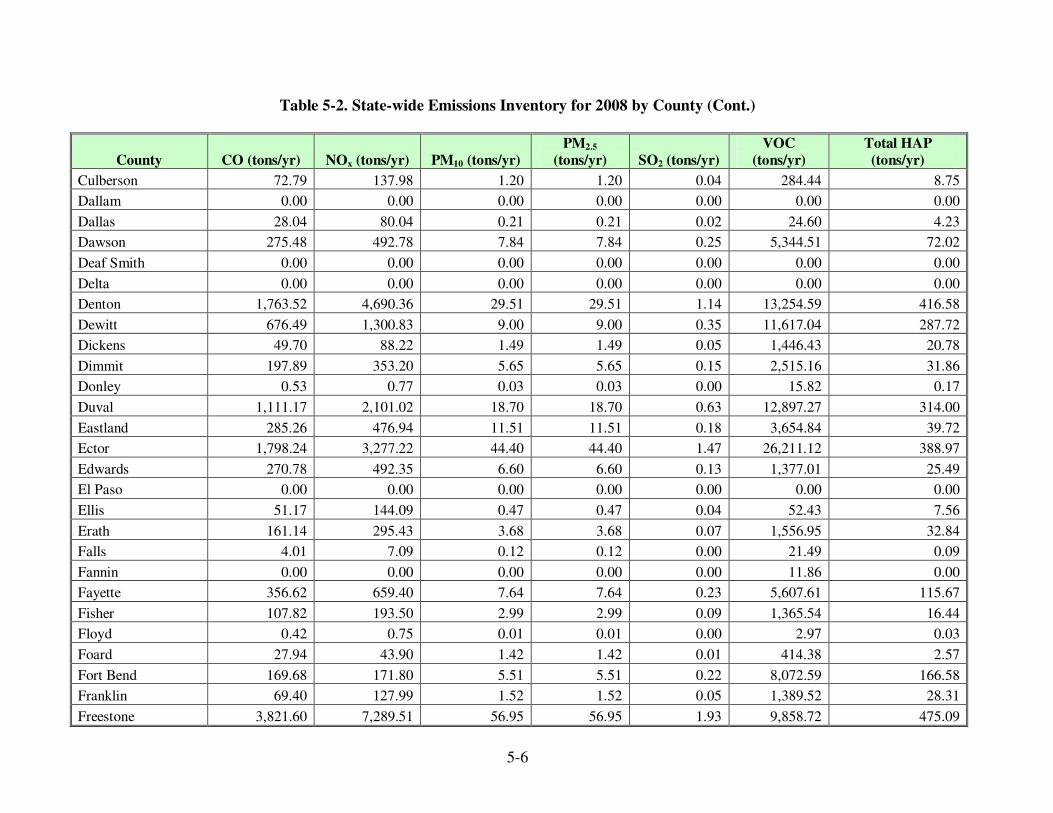
5-6
Table 5-2. State-wide Emissions Inventory for 2008 by County (Cont.)
County CO (tons/yr) NOx (tons/yr) PM10 (tons/yr)
PM2.5
(tons/yr) SO2 (tons/yr)
VOC
(tons/yr)
Total HAP
(tons/yr)
Culberson 72.79 137.98 1.20 1.20 0.04 284.44 8.75
Dallam 0.00 0.00 0.00 0.00 0.00 0.00 0.00
Dallas 28.04 80.04 0.21 0.21 0.02 24.60 4.23
Dawson 275.48 492.78 7.84 7.84 0.25 5,344.51 72.02
Deaf Smith 0.00 0.00 0.00 0.00 0.00 0.00 0.00
Delta 0.00 0.00 0.00 0.00 0.00 0.00 0.00
Denton 1,763.52 4,690.36 29.51 29.51 1.14 13,254.59 416.58
Dewitt 676.49 1,300.83 9.00 9.00 0.35 11,617.04 287.72
Dickens 49.70 88.22 1.49 1.49 0.05 1,446.43 20.78
Dimmit 197.89 353.20 5.65 5.65 0.15 2,515.16 31.86
Donley 0.53 0.77 0.03 0.03 0.00 15.82 0.17
Duval 1,111.17 2,101.02 18.70 18.70 0.63 12,897.27 314.00
Eastland 285.26 476.94 11.51 11.51 0.18 3,654.84 39.72
Ector 1,798.24 3,277.22 44.40 44.40 1.47 26,211.12 388.97
Edwards 270.78 492.35 6.60 6.60 0.13 1,377.01 25.49
El Paso 0.00 0.00 0.00 0.00 0.00 0.00 0.00
Ellis 51.17 144.09 0.47 0.47 0.04 52.43 7.56
Erath 161.14 295.43 3.68 3.68 0.07 1,556.95 32.84
Falls 4.01 7.09 0.12 0.12 0.00 21.49 0.09
Fannin 0.00 0.00 0.00 0.00 0.00 11.86 0.00
Fayette 356.62 659.40 7.64 7.64 0.23 5,607.61 115.67
Fisher 107.82 193.50 2.99 2.99 0.09 1,365.54 16.44
Floyd 0.42 0.75 0.01 0.01 0.00 2.97 0.03
Foard 27.94 43.90 1.42 1.42 0.01 414.38 2.57
Fort Bend 169.68 171.80 5.51 5.51 0.22 8,072.59 166.58
Franklin 69.40 127.99 1.52 1.52 0.05 1,389.52 28.31
Freestone 3,821.60 7,289.51 56.95 56.95 1.93 9,858.72 475.09

5-7
Table 5-2. State-wide Emissions Inventory for 2008 by County (Cont.)
County CO (tons/yr) NOx (tons/yr) PM10 (tons/yr)
PM2.5
(tons/yr) SO2 (tons/yr)
VOC
(tons/yr)
Total HAP
(tons/yr)
Frio 139.12 246.28 4.21 4.21 0.12 1,393.74 14.40
Gaines 1,165.52 2,133.47 27.65 27.65 0.92 27,788.32 460.84
Galveston 86.46 76.28 2.61 2.61 0.12 17,475.45 358.12
Garza 445.72 790.41 13.45 13.45 0.42 6,133.80 63.01
Gillespie 0.00 0.00 0.00 0.00 0.00 0.00 0.00
Glasscock 416.67 761.54 10.00 10.00 0.32 5,431.20 84.49
Goliad 731.21 1,386.08 11.85 11.85 0.37 7,851.72 199.63
Gonzales 51.40 92.76 1.37 1.37 0.04 578.12 8.62
Gray 825.55 1,440.69 27.11 27.11 0.64 4,163.88 45.84
Grayson 201.98 365.62 5.22 5.22 0.16 1,707.03 31.65
Gregg 1,423.90 2,592.32 34.92 34.92 1.00 10,980.44 227.68
Grimes 334.10 638.29 4.87 4.87 0.17 1,264.12 50.60
Guadalupe 402.11 711.73 12.29 12.29 0.38 2,576.45 22.66
Hale 62.99 114.67 1.57 1.57 0.05 2,698.37 46.20
Hall 0.00 0.00 0.00 0.00 0.00 0.00 0.00
Hamilton 3.12 5.33 0.11 0.11 0.00 36.47 0.47
Hansford 377.68 676.20 10.32 10.32 0.17 2,601.06 43.25
Hardeman 52.13 92.68 1.54 1.54 0.05 1,230.36 19.89
Hardin 258.68 348.83 7.85 7.85 0.30 22,648.65 447.94
Harris 176.00 181.67 5.65 5.65 0.23 8,801.29 184.44
Harrison 1,879.59 3,514.48 35.19 35.19 0.93 25,383.90 583.58
Hartley 39.06 70.27 1.04 1.04 0.02 399.51 6.56
Haskell 53.83 95.30 1.64 1.64 0.05 443.81 5.44
Hays 0.00 0.00 0.00 0.00 0.00 0.00 0.00
Hemphill 2,092.63 3,936.72 37.08 37.08 1.03 32,774.76 754.74
Henderson 453.75 854.13 7.99 7.99 0.24 2,535.12 73.92
Hidalgo 3,264.69 6,276.64 43.49 43.49 1.68 56,554.95 1,407.72

5-8
Table 5-2. State-wide Emissions Inventory for 2008 by County (Cont.)
County CO (tons/yr) NOx (tons/yr) PM10 (tons/yr)
PM2.5
(tons/yr) SO2 (tons/yr)
VOC
(tons/yr)
Total HAP
(tons/yr)
Hill 308.20 597.97 3.53 3.53 0.16 233.61 34.41
Hockley 1,004.10 1,795.93 28.58 28.58 0.91 22,011.88 308.12
Hood 926.80 1,777.59 12.89 12.89 0.47 9,914.41 269.97
Hopkins 20.84 37.79 0.53 0.53 0.02 298.78 5.06
Houston 164.62 308.00 3.11 3.11 0.10 1,587.91 35.84
Howard 803.87 1,436.74 23.00 23.00 0.73 9,904.95 107.63
Hudspeth 0.12 0.17 0.01 0.01 0.00 3.29 0.03
Hunt 0.00 0.00 0.00 0.00 0.00 0.00 0.00
Hutchinson 903.43 1,601.32 27.09 27.09 0.72 4,039.66 49.29
Irion 531.51 961.89 13.77 13.77 0.40 5,877.27 82.51
Jack 646.65 1,121.02 21.80 21.80 0.42 6,701.91 92.20
Jackson 303.15 569.09 5.55 5.55 0.17 9,879.64 204.59
Jasper 205.58 394.00 2.87 2.87 0.11 6,405.78 143.58
Jeff Davis 0.00 0.00 0.00 0.00 0.00 1.29 0.03
Jefferson 287.19 182.64 8.05 8.05 0.46 55,659.21 1,163.27
Jim Hogg 266.50 500.41 4.83 4.83 0.14 4,021.10 92.33
Jim Wells 127.37 226.90 3.61 3.61 0.06 1,576.61 26.20
Johnson 4,495.48 12,647.53 43.01 43.01 3.19 5,209.18 684.81
Jones 167.32 296.69 5.05 5.05 0.16 1,277.91 14.79
Karnes 171.32 323.25 2.95 2.95 0.10 3,454.12 76.12
Kaufman 4.50 8.03 0.14 0.14 0.00 62.82 1.05
Kendall 0.00 0.00 0.00 0.00 0.00 0.00 0.00
Kenedy 665.44 1,286.34 8.13 8.13 0.35 4,087.71 143.43
Kent 203.51 375.70 4.48 4.48 0.16 4,304.19 73.92
Kerr 0.00 0.00 0.00 0.00 0.00 0.00 0.00
Kimble 2.94 4.50 0.16 0.16 0.00 41.29 0.17
King 112.59 198.82 3.47 3.47 0.10 2,010.47 35.20
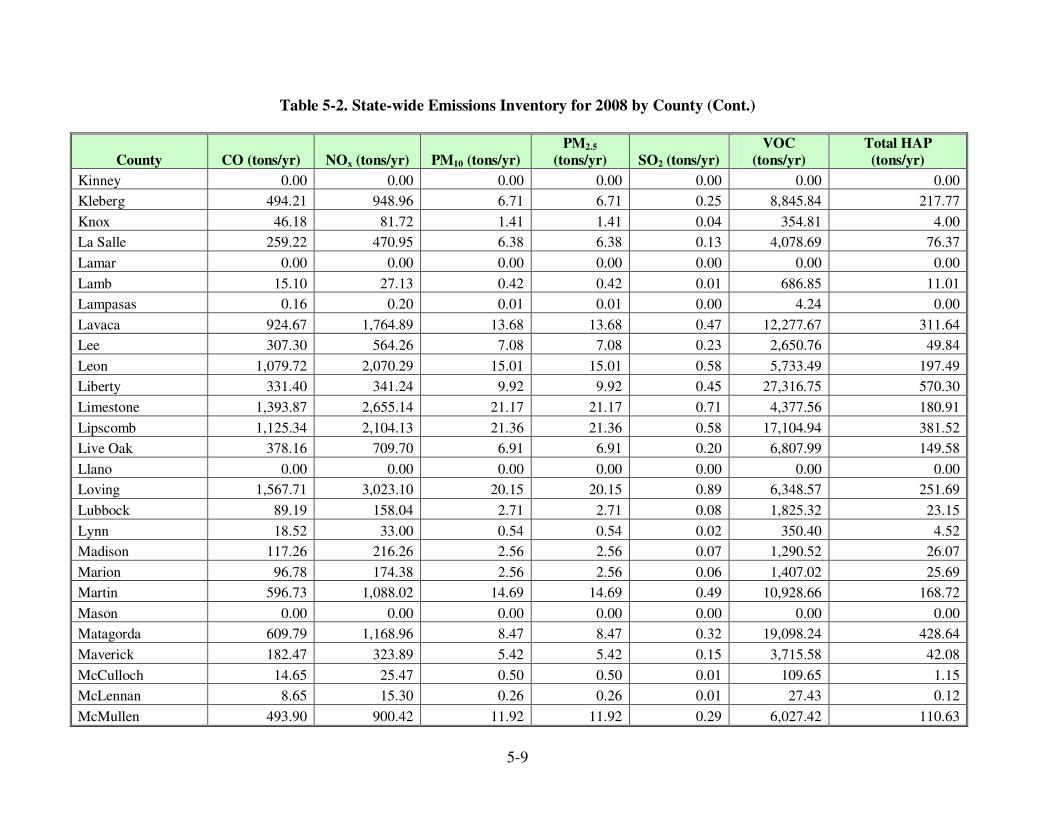
5-9
Table 5-2. State-wide Emissions Inventory for 2008 by County (Cont.)
County CO (tons/yr) NOx (tons/yr) PM10 (tons/yr)
PM2.5
(tons/yr) SO2 (tons/yr)
VOC
(tons/yr)
Total HAP
(tons/yr)
Kinney 0.00 0.00 0.00 0.00 0.00 0.00 0.00
Kleberg 494.21 948.96 6.71 6.71 0.25 8,845.84 217.77
Knox 46.18 81.72 1.41 1.41 0.04 354.81 4.00
La Salle 259.22 470.95 6.38 6.38 0.13 4,078.69 76.37
Lamar 0.00 0.00 0.00 0.00 0.00 0.00 0.00
Lamb 15.10 27.13 0.42 0.42 0.01 686.85 11.01
Lampasas 0.16 0.20 0.01 0.01 0.00 4.24 0.00
Lavaca 924.67 1,764.89 13.68 13.68 0.47 12,277.67 311.64
Lee 307.30 564.26 7.08 7.08 0.23 2,650.76 49.84
Leon 1,079.72 2,070.29 15.01 15.01 0.58 5,733.49 197.49
Liberty 331.40 341.24 9.92 9.92 0.45 27,316.75 570.30
Limestone 1,393.87 2,655.14 21.17 21.17 0.71 4,377.56 180.91
Lipscomb 1,125.34 2,104.13 21.36 21.36 0.58 17,104.94 381.52
Live Oak 378.16 709.70 6.91 6.91 0.20 6,807.99 149.58
Llano 0.00 0.00 0.00 0.00 0.00 0.00 0.00
Loving 1,567.71 3,023.10 20.15 20.15 0.89 6,348.57 251.69
Lubbock 89.19 158.04 2.71 2.71 0.08 1,825.32 23.15
Lynn 18.52 33.00 0.54 0.54 0.02 350.40 4.52
Madison 117.26 216.26 2.56 2.56 0.07 1,290.52 26.07
Marion 96.78 174.38 2.56 2.56 0.06 1,407.02 25.69
Martin 596.73 1,088.02 14.69 14.69 0.49 10,928.66 168.72
Mason 0.00 0.00 0.00 0.00 0.00 0.00 0.00
Matagorda 609.79 1,168.96 8.47 8.47 0.32 19,098.24 428.64
Maverick 182.47 323.89 5.42 5.42 0.15 3,715.58 42.08
McCulloch 14.65 25.47 0.50 0.50 0.01 109.65 1.15
McLennan 8.65 15.30 0.26 0.26 0.01 27.43 0.12
McMullen 493.90 900.42 11.92 11.92 0.29 6,027.42 110.63

5-10
Table 5-2. State-wide Emissions Inventory for 2008 by County (Cont.)
County CO (tons/yr) NOx (tons/yr) PM10 (tons/yr)
PM2.5
(tons/yr) SO2 (tons/yr)
VOC
(tons/yr)
Total HAP
(tons/yr)
Medina 275.72 487.25 8.50 8.50 0.26 1,235.77 4.54
Menard 27.00 47.52 0.85 0.85 0.02 266.84 2.69
Midland 1,610.04 2,951.97 37.75 37.75 1.27 20,938.23 333.93
Milam 218.91 387.83 6.65 6.65 0.21 1,216.87 9.32
Mills 0.36 0.51 0.02 0.02 0.00 6.38 0.02
Mitchell 502.49 890.13 15.28 15.28 0.48 6,645.63 65.00
Montague 551.48 987.06 15.59 15.59 0.49 3,448.92 48.39
Montgomery 73.56 81.80 2.86 2.86 0.08 2,890.56 54.67
Moore 744.02 1,343.19 19.29 19.29 0.40 3,502.87 63.64
Morris 0.21 0.37 0.01 0.01 0.00 2.01 0.03
Motley 3.80 6.72 0.12 0.12 0.00 52.75 0.49
Nacogdoches 1,527.76 2,897.04 24.29 24.29 0.77 12,723.39 353.60
Navarro 170.24 301.61 5.16 5.16 0.16 1,444.51 18.73
Newton 78.50 145.69 1.63 1.63 0.05 1,601.94 31.72
Nolan 133.50 240.21 3.63 3.63 0.11 1,931.63 25.88
Nueces 605.47 1,127.23 11.99 11.99 0.31 15,740.17 332.51
Ochiltree 561.88 1,020.35 13.94 13.94 0.31 5,760.68 108.67
Oldham 5.68 10.02 0.17 0.17 0.00 247.24 3.74
Orange 67.79 71.25 2.06 2.06 0.09 8,467.82 172.90
Palo Pinto 455.72 785.82 15.70 15.70 0.21 7,033.45 105.26
Panola 3,784.21 7,052.88 73.18 73.18 1.82 50,362.96 1,170.88
Parker 1,225.52 3,294.01 19.49 19.49 0.80 9,840.76 290.06
Parmer 0.00 0.00 0.00 0.00 0.00 0.00 0.00
Pecos 4,534.56 8,670.50 66.30 66.30 2.63 21,760.89 703.44
Polk 415.68 797.76 5.69 5.69 0.22 29,650.93 625.12
Potter 350.79 632.33 9.25 9.25 0.21 1,799.21 27.27
Presidio 0.00 0.00 0.00 0.00 0.00 0.00 0.00

5-11
Table 5-2. State-wide Emissions Inventory for 2008 by County (Cont.)
County CO (tons/yr) NOx (tons/yr) PM10 (tons/yr)
PM2.5
(tons/yr) SO2 (tons/yr)
VOC
(tons/yr)
Total HAP
(tons/yr)
Rains 59.61 115.43 0.71 0.71 0.03 38.47 6.62
Randall 0.00 0.00 0.00 0.00 0.00 0.00 0.00
Reagan 1,209.82 2,204.56 29.89 29.89 0.99 11,808.61 158.58
Real 1.91 3.34 0.06 0.06 0.00 16.74 0.15
Red River 9.57 16.96 0.29 0.29 0.01 159.73 2.26
Reeves 575.50 1,077.94 10.88 10.88 0.36 3,146.28 72.34
Refugio 652.55 1,218.19 12.72 12.72 0.40 9,671.07 197.77
Roberts 881.18 1,659.43 15.47 15.47 0.45 15,296.54 346.65
Robertson 3,591.03 6,960.37 41.87 41.87 1.90 4,202.14 427.68
Rockwall 0.00 0.00 0.00 0.00 0.00 0.00 0.00
Runnels 145.66 262.06 3.96 3.96 0.12 1,177.54 15.82
Rusk 2,394.04 4,447.78 48.27 48.27 1.34 26,428.99 597.16
Sabine 2.04 3.67 0.06 0.06 0.00 19.20 0.14
San Augustine 159.66 309.99 1.77 1.77 0.09 452.69 23.22
San Jacinto 182.43 350.28 2.47 2.47 0.09 6,462.64 144.35
San Patricio 303.08 570.53 5.36 5.36 0.16 12,721.07 267.75
San Saba 0.00 0.00 0.00 0.00 0.00 0.00 0.00
Schleicher 297.16 521.39 9.30 9.30 0.15 3,975.13 56.43
Scurry 920.14 1,696.28 20.52 20.52 0.72 16,745.60 282.63
Shackelford 446.66 787.83 13.87 13.87 0.39 2,584.60 27.41
Shelby 788.21 1,506.84 11.24 11.24 0.40 4,681.48 153.59
Sherman 382.36 689.34 9.93 9.93 0.17 2,226.58 38.78
Smith 600.16 1,117.21 11.83 11.83 0.32 6,759.09 157.15
Somervell 69.05 132.73 0.93 0.93 0.04 261.32 10.71
Starr 1,801.98 3,435.69 27.08 27.08 0.92 39,905.70 922.75
Stephens 548.00 962.55 17.22 17.22 0.36 6,028.28 86.04
Sterling 507.62 898.57 15.24 15.24 0.35 5,045.87 54.84
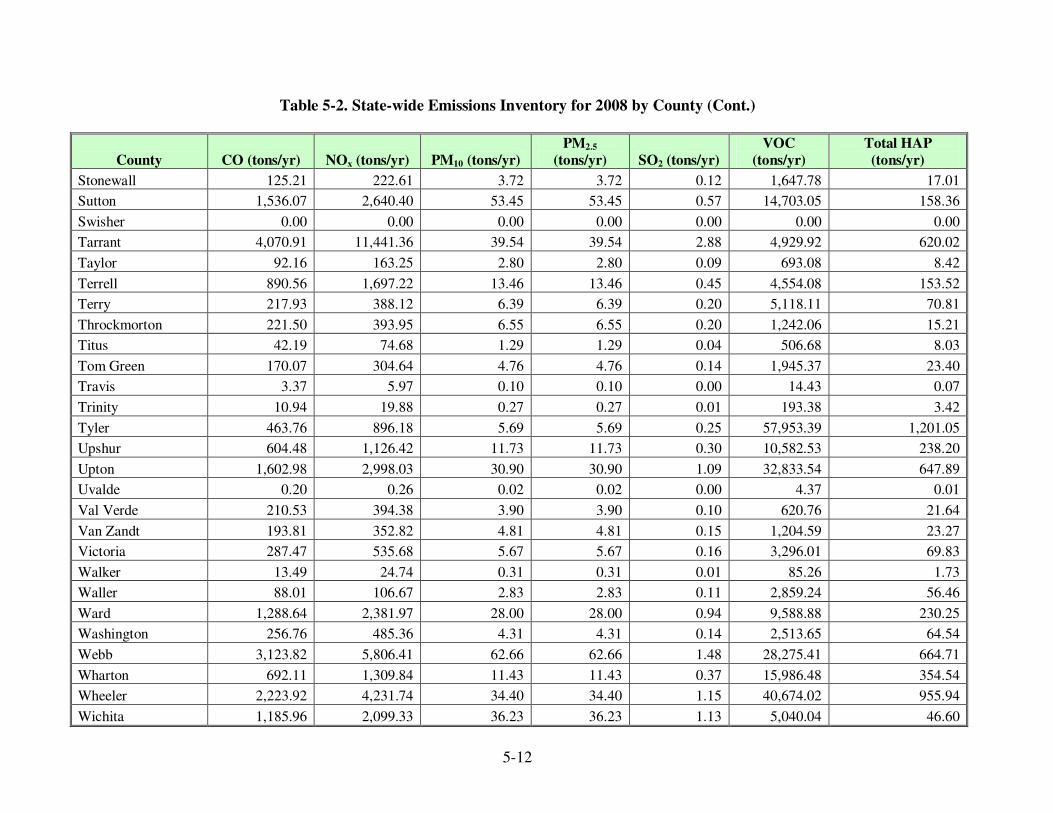
5-12
Table 5-2. State-wide Emissions Inventory for 2008 by County (Cont.)
County CO (tons/yr) NOx (tons/yr) PM10 (tons/yr)
PM2.5
(tons/yr) SO2 (tons/yr)
VOC
(tons/yr)
Total HAP
(tons/yr)
Stonewall 125.21 222.61 3.72 3.72 0.12 1,647.78 17.01
Sutton 1,536.07 2,640.40 53.45 53.45 0.57 14,703.05 158.36
Swisher 0.00 0.00 0.00 0.00 0.00 0.00 0.00
Tarrant 4,070.91 11,441.36 39.54 39.54 2.88 4,929.92 620.02
Taylor 92.16 163.25 2.80 2.80 0.09 693.08 8.42
Terrell 890.56 1,697.22 13.46 13.46 0.45 4,554.08 153.52
Terry 217.93 388.12 6.39 6.39 0.20 5,118.11 70.81
Throckmorton 221.50 393.95 6.55 6.55 0.20 1,242.06 15.21
Titus 42.19 74.68 1.29 1.29 0.04 506.68 8.03
Tom Green 170.07 304.64 4.76 4.76 0.14 1,945.37 23.40
Travis 3.37 5.97 0.10 0.10 0.00 14.43 0.07
Trinity 10.94 19.88 0.27 0.27 0.01 193.38 3.42
Tyler 463.76 896.18 5.69 5.69 0.25 57,953.39 1,201.05
Upshur 604.48 1,126.42 11.73 11.73 0.30 10,582.53 238.20
Upton 1,602.98 2,998.03 30.90 30.90 1.09 32,833.54 647.89
Uvalde 0.20 0.26 0.02 0.02 0.00 4.37 0.01
Val Verde 210.53 394.38 3.90 3.90 0.10 620.76 21.64
Van Zandt 193.81 352.82 4.81 4.81 0.15 1,204.59 23.27
Victoria 287.47 535.68 5.67 5.67 0.16 3,296.01 69.83
Walker 13.49 24.74 0.31 0.31 0.01 85.26 1.73
Waller 88.01 106.67 2.83 2.83 0.11 2,859.24 56.46
Ward 1,288.64 2,381.97 28.00 28.00 0.94 9,588.88 230.25
Washington 256.76 485.36 4.31 4.31 0.14 2,513.65 64.54
Webb 3,123.82 5,806.41 62.66 62.66 1.48 28,275.41 664.71
Wharton 692.11 1,309.84 11.43 11.43 0.37 15,986.48 354.54
Wheeler 2,223.92 4,231.74 34.40 34.40 1.15 40,674.02 955.94
Wichita 1,185.96 2,099.33 36.23 36.23 1.13 5,040.04 46.60

5-13
Table 5-2. State-wide Emissions Inventory for 2008 by County (Cont.)
County CO (tons/yr) NOx (tons/yr) PM10 (tons/yr)
PM2.5
(tons/yr) SO2 (tons/yr)
VOC
(tons/yr)
Total HAP
(tons/yr)
Wilbarger 174.53 308.95 5.33 5.33 0.17 1,147.90 13.03
Willacy 353.53 681.05 4.59 4.59 0.19 8,274.58 193.92
Williamson 9.07 16.05 0.28 0.28 0.01 53.29 0.33
Wilson 129.98 230.01 3.98 3.98 0.12 757.55 6.10
Winkler 917.14 1,698.44 19.52 19.52 0.63 7,815.47 141.18
Wise 2,749.59 5,099.17 55.75 55.75 1.35 24,225.59 597.53
Wood 239.16 438.82 5.52 5.52 0.18 4,200.35 82.03
Yoakum 1,074.18 1,960.14 26.21 26.21 0.88 25,649.46 414.59
Young 556.32 978.60 17.57 17.57 0.50 3,394.26 35.11
Zapata 4,438.24 8,472.07 65.54 65.54 2.24 13,384.86 594.31
Zavala 64.75 114.70 1.94 1.94 0.05 1,016.76 14.24
Total: 128,330.85 247,236.91 2,570.01 2,570.01 81.34 1,568,522.73 34,090.45
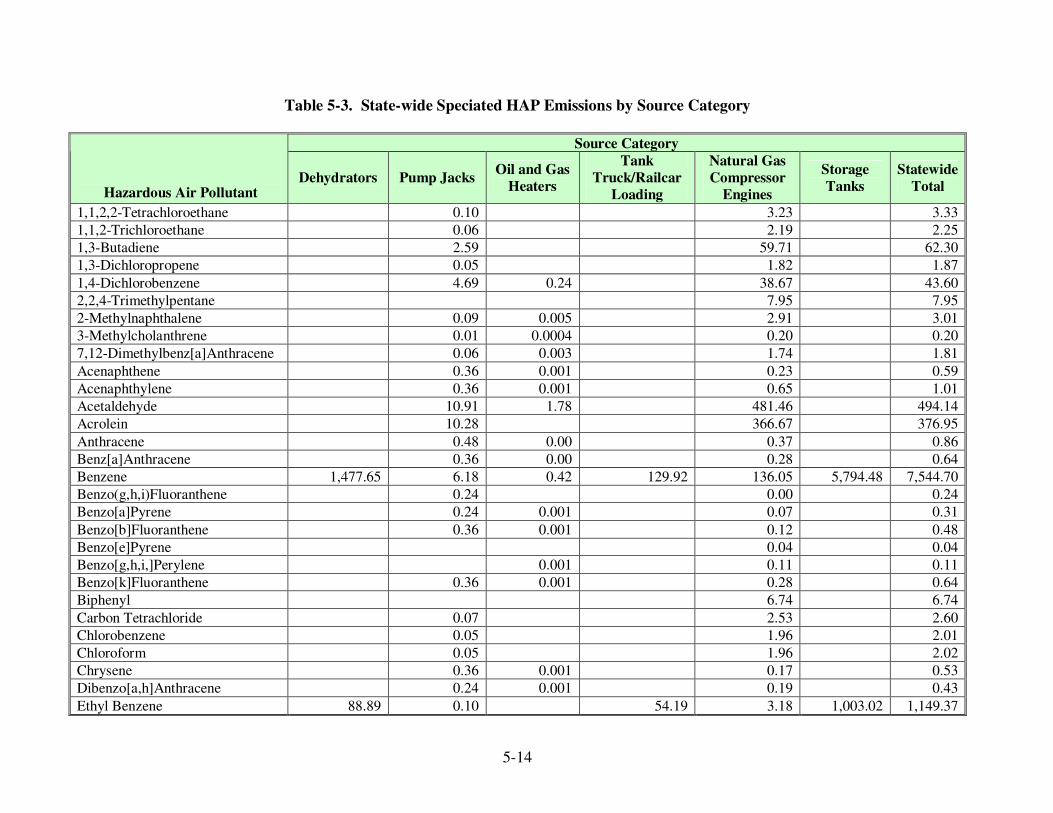
5-14
Table 5-3. State-wide Speciated HAP Emissions by Source Category
Source Category
Hazardous Air Pollutant Dehydrators Pump Jacks
Oil and Gas
Heaters
Tank
Truck/Railcar
Loading
Natural Gas
Compressor
Engines
Storage
Tanks
Statewide
Total
1,1,2,2-Tetrachloroethane 0.10 3.23 3.33
1,1,2-Trichloroethane 0.06 2.19 2.25
1,3-Butadiene 2.59 59.71 62.30
1,3-Dichloropropene 0.05 1.82 1.87
1,4-Dichlorobenzene 4.69 0.24 38.67 43.60
2,2,4-Trimethylpentane 7.95 7.95
2-Methylnaphthalene 0.09 0.005 2.91 3.01
3-Methylcholanthrene 0.01 0.0004 0.20 0.20
7,12-Dimethylbenz[a]Anthracene 0.06 0.003 1.74 1.81
Acenaphthene 0.36 0.001 0.23 0.59
Acenaphthylene 0.36 0.001 0.65 1.01
Acetaldehyde 10.91 1.78 481.46 494.14
Acrolein 10.28 366.67 376.95
Anthracene 0.48 0.00 0.37 0.86
Benz[a]Anthracene 0.36 0.00 0.28 0.64
Benzene 1,477.65 6.18 0.42 129.92 136.05 5,794.48 7,544.70
Benzo(g,h,i)Fluoranthene 0.24 0.00 0.24
Benzo[a]Pyrene 0.24 0.001 0.07 0.31
Benzo[b]Fluoranthene 0.36 0.001 0.12 0.48
Benzo[e]Pyrene 0.04 0.04
Benzo[g,h,i,]Perylene 0.001 0.11 0.11
Benzo[k]Fluoranthene 0.36 0.001 0.28 0.64
Biphenyl 6.74 6.74
Carbon Tetrachloride 0.07 2.53 2.60
Chlorobenzene 0.05 1.96 2.01
Chloroform 0.05 1.96 2.02
Chrysene 0.36 0.001 0.17 0.53
Dibenzo[a,h]Anthracene 0.24 0.001 0.19 0.43
Ethyl Benzene 88.89 0.10 54.19 3.18 1,003.02 1,149.37
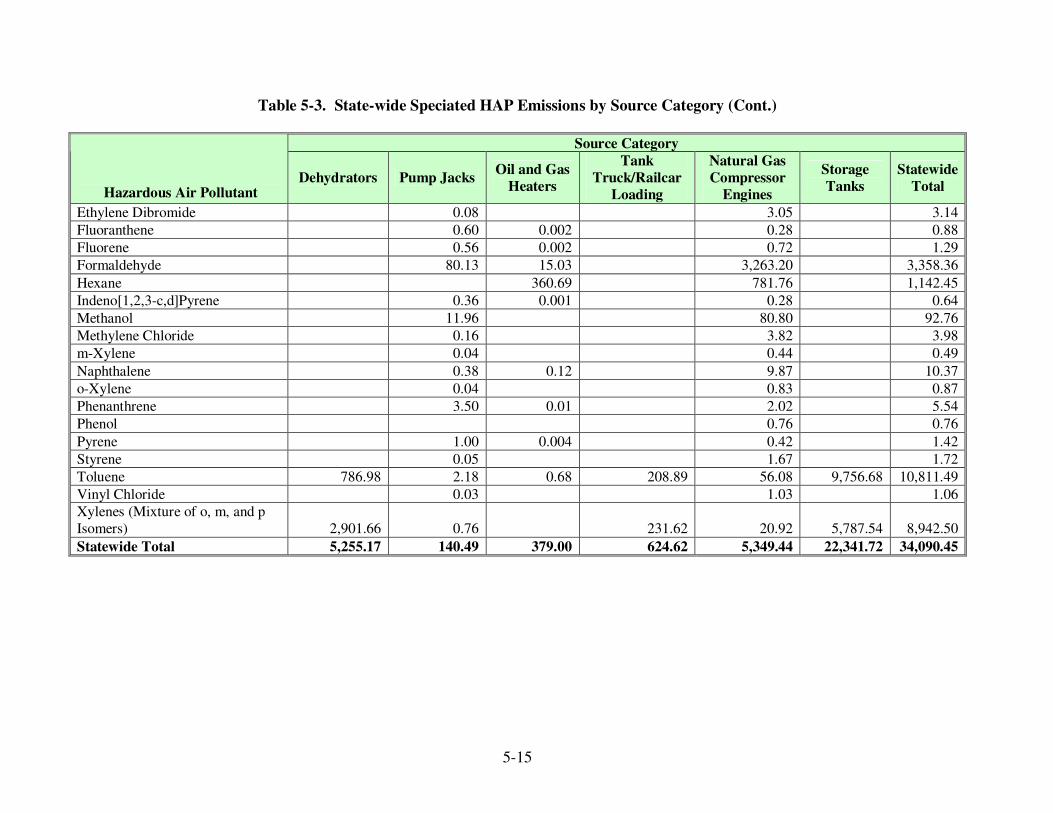
5-15
Table 5-3. State-wide Speciated HAP Emissions by Source Category (Cont.)
Source Category
Hazardous Air Pollutant Dehydrators Pump Jacks
Oil and Gas
Heaters
Tank
Truck/Railcar
Loading
Natural Gas
Compressor
Engines
Storage
Tanks
Statewide
Total
Ethylene Dibromide 0.08 3.05 3.14
Fluoranthene 0.60 0.002 0.28 0.88
Fluorene 0.56 0.002 0.72 1.29
Formaldehyde 80.13 15.03 3,263.20 3,358.36
Hexane 360.69 781.76 1,142.45
Indeno[1,2,3-c,d]Pyrene 0.36 0.001 0.28 0.64
Methanol 11.96 80.80 92.76
Methylene Chloride 0.16 3.82 3.98
m-Xylene 0.04 0.44 0.49
Naphthalene 0.38 0.12 9.87 10.37
o-Xylene 0.04 0.83 0.87
Phenanthrene 3.50 0.01 2.02 5.54
Phenol 0.76 0.76
Pyrene 1.00 0.004 0.42 1.42
Styrene 0.05 1.67 1.72
Toluene 786.98 2.18 0.68 208.89 56.08 9,756.68 10,811.49
Vinyl Chloride 0.03 1.03 1.06
Xylenes (Mixture of o, m, and p
Isomers) 2,901.66 0.76 231.62 20.92 5,787.54 8,942.50
Statewide Total 5,255.17 140.49 379.00 624.62 5,349.44 22,341.72 34,090.45

6-1
6.0 FORMATTED TexAER FILES
Once the emissions inventory was completed, the data was prepared for electronic
submittal to the Texas Air Emissions Repository (TexAER) using the National Emissions
Inventory (NEI) Input Format (NIF) 3.0. Area source text-formatted input files were prepared
for all onshore oil and gas area source categories for a 2008 base year. The NIF 3.0 files were
created using information provided by TCEQ regarding the correct format and valid code listings
for submittal to TexAER. Prior to submittal to TCEQ, the NIF 3.0 files were pre-processed
using EPA’s NIF Basic Format and Content Checker to check for errors and inconsistencies.
Additionally, ERG performed a test upload to TexAER to ensure the files were complete and
accurate and in a format consistent with the TexAER area source file data requirements. The
formatted TexAER files are included as Appendix F.

7-1
7.0 CONCLUSIONS AND RECOMMENDATIONS
This study presents a comprehensive, statewide 2008 emissions inventory for Texas for
onshore, upstream oil and gas production area sources. Data used to prepare the emissions
inventory were obtained from a variety of sources, including existing databases (such as the
Texas Railroad Commission (TRC) oil and gas production data), point source emissions
inventory reports submitted to TCEQ (for dehydrators), vendor data (for compression engines
and pumpjack engines), and published emission factor and activity data from the Houston
Advanced Research Center (HARC), the Central Regional Air Planning Association (CENRAP),
and the U.S. Environmental Protection Agency (EPA).
Further improvements to this inventory could be made through collection of County-level
activity data through use of the survey instrument developed as described in Section 3.0. Such a
survey will help quantify the specific number, size, type, and location of the various equipment
types used at upstream oil and gas production sites in Texas.
While characterization of emissions from all of the source types would benefit from
detailed survey data, there are a few categories where minimal Texas-specific data was available.
Specifically, this inventory was based on default profiles for several source categories that could
be improved through implementation of the survey as follows:
• Well Completions and Well Blowdowns - survey data is needed to determine the volumes of gas released during these operations, the composition of the gas released, and the extent that these operations are controlled;
• Pneumatic Devices - survey data is needed to determine the number of devices used at each upstream oil and gas production site, the bleed rates for each equipment type, and the composition of the natural gas released from these sources;
• Fugitive Emissions (Equipment Leaks) - this could be a significant source category and there is some uncertainty as to the current estimate of the number and types of fugitive emission soruces (valves, flanges, etc.). As with well completions and well blowdowns,
gas composition data is needed to be able to speciate the emissions from this source category; and
• Heaters and Boilers - survey data is needed to quantify the number and size of these small combustion units located at upstream oil and gas production sites.
Also, HAP emissions could be estimated for several source categories not currently
included in the HAP inventory if HAP speciation data could be obtained for the chemical
composition of the natural gas emitted during various processes. In particular, this data would be
7-2
used to estimate HAP emissions from well completions, well blowdowns, pneumatic devices,
and equipment leaks.
It is likely the current inventory may be overestimating emissions to some degree from
some sources due to the lack of information on control device use. In particular, this data would
be useful for well completions (flaring and “green completion” techniques), oil and condensate
storage tanks and loading racks (vapor recovery units and flares), and engines (SCR and NSCR).
Again, information submitted by the operators would help account for emission control measures
providing more accurate emission estimates.

8-1
8.0 REFERENCES
Bar-Ilan, Amnon; Parikh, Rajashi; Grant, John; Shah, Tejas; and Pollack, Alison, 2008. Recommendations for Improvements to the CENRAP States’ Oil and Gas Emissions Inventories.
Prepared for Central States Regional Air Partnership. November, 2008
US EPA, 1991. “AP 42, Fifth Edition, Volume I, Chapter 13: Industrial Flares.” EPA’s Compilation of Air Pollutant Emission Factors, AP-42 Section 13.5, September, 1991.
US EPA, 1995. “Protocol for Equipment Leak Emission Estimates,” U.S. Environmental
Protection Agency, Research Triangle Park, NC, 1995.
US EPA, 1998. “AP 42, Fifth Edition, Volume I, Chapter 1: External Combustion Sources,” EPA’s Compilation of Air Pollutant Emission Factors, AP-42 Section 1, September, 1998.
US EPA, 2000. “AP 42, Fifth Edition, Volume I, Chapter 3: Internal Combustion Sources,”
EPA’s Compilation of Air Pollutant Emission Factors, AP-42 Section 3.2, August, 2000.
US EPA, 2005. US Environmental Protection Agency, 2005. WebFIRE Emission Factors. Accessed July 2, 2010. Internet address:
http://cfpub.epa.gov/oarweb/download/WebFIREFactors.csv
US EPA, 2006. “AP 42, Fifth Edition, Volume I, Chapter 7: Liquid Storage Tanks,” EPA’s Compilation of Air Pollutant Emission Factors, AP-42 Section 7.1, November, 2006.
US EPA, 2008. “AP 42, Fifth Edition, Volume I, Chapter 5: Petroleum Industry,” EPA’s
Compilation of Air Pollutant Emission Factors, AP-42 Section 5.2, June, 2008.
The Electric Power Research Institute (EPRI), 2005. Assessment of Emerging Low-Emission Technologies for Combustion-Based Distributed Resource Generators. Prepared by Energy and
Environmental Analysis, Inc. March, 2005.
Houston Advanced Research Center (HARC), 2005. Natural Gas Compressor Engine Survey and Engine NOx Emissions at Gas Production Facilities. Prepared by Eastern Research Group,
Inc. August 31, 2005.
Houston Advanced Research Center (HARC), 2006. Natural Gas Compressor Engine Survey for Gas Production and Processing Facilities. Prepared by Eastern Research Group, Inc. October 5,
2006.
Maldonado, Martha, 2010. Fugitive component equipment counts for Pump Seals and Others in Texas. Personal Communication with Mr. Mike Pring, Eastern Research Group, Inc. August 18,
2010.

8-2
Pollack, Alison; Russell, James; Grant, John; Friesen, Ron; Fields, Paula; and Wolf, Marty,
2006. Ozone Precursors Emission Inventory for San Juan and Rio Arriba Counties, New Mexico. Prepared for New Mexico Environment Department. August, 2006.
Pollution Solutions, 2005. “Tyler/Longview/Marshall Flexible Attainment Region Emission
Inventory of Ozone Precursors VOC, NOx and CO,” Prepared for Northeast Texas Air Care. February, 2005.
Pollution Solutions, 2007. “Special Study Relating to Oil and Gas Production: 2005 and 2007
Emissions from Compressor Engines with Consideration for Load Factor” Final report prepared for the East Texas Council of Governments, Kilgore, TX.
Texas Environmental Research Consortium (TERC), October 2006, revised April 2009. VOC
Emissions from Oil and Condensate Storage Tanks.
Texas Commission on Environmental Quality (TCEQ), 2007. Emissions from Oil and Gas Production Facilities, 2007. Prepared by Eastern Research Group, Inc. August 31, 2007.
Texas Commission on Environmental Quality (TCEQ), 2009. Drilling Rig Emission Inventory for the State of Texas, 2009. Prepared by Eastern Research Group, Inc. July 15, 2009.
Texas Commission on Environmental Quality (TCEQ), 2010. Offshore Oil and Gas Platform
Report. Prepared by Eastern Research Group, Inc. August 16, 2010.
Appendix A – Task 2 Memorandum

A-1
TECHNICAL MEMORANDUM Date: April 26, 2010
To: Martha Maldonado Project Representative
Texas Commission on Environmental Quality (TCEQ)
From: Richard Billings, Eastern Research Group (ERG) Daryl Hudson (ERG)
Mike Pring (ERG) Jason Renzaglia (ERG)
Brandon Smith (ERG) Stephen Treimel (ERG)
Re: Oil and Gas Sources Inventory - Final Technical Memorandum for Task 2
TCEQ Contract No. 582-7-84003, Work Order No. 582-7-84003-FY10-26
1.0 Introduction
The purpose of this Work Order is to develop a 2008 base year air emissions inventory from upstream onshore oil and gas production sites for select counties in Texas. The inventory will
address area source criteria pollutant emissions of volatile organic compounds (VOC), nitrogen oxides (NOX), carbon monoxide (CO), particulate matter with an aerodynamic diameter less than
or equal to 10 microns (PM10), particulate matter with an aerodynamic diameter less than or equal to 2.5 microns (PM2.5), and sulfur dioxide (SO2); and certain toxic pollutant emissions such as
formaldehyde, benzene, toluene, ethylbenzene, and xylene. In addition to compiling the emissions inventory, other goals of this Work Order are to identify the emission source types
operating at oil and gas production sites, identify the best emissions determination methodology for each emission source type, and develop a methodology for estimating emissions from oil and
gas production sites based on the oil and gas produced at the county level.
This Work Order builds on two previous studies ERG conducted for TCEQ to estimate emissions from oil and gas exploration and production activities. The first, implemented in 2007,
focused on compiling a state-wide emissions inventory (including both onshore and offshore sources) for oil and gas exploration and production for a 2005 base year (ERG, 2007). The
second study, conducted in 2009 for a 2008 base year, focused only on emissions from onshore oil and gas well drilling rig engines (ERG, 2009). Both of these studies included emission
estimates for every county in Texas. In contrast, this current study will only address onshore area sources (those not included in the Texas point source inventory), and excludes the 23
counties in the Barnett Shale area (Archer, Bosque, Clay, Comanche, Cooke, Coryell, Dallas, Denton, Eastland, Ellis, Erath, Hill, Hood, Jack, Johnson, Montague, Palo Pinto, Parker,
Shackelford, Somervell, Stephens, Tarrant, and Wise). TCEQ is currently developing an
A-2
emissions inventory for oil and gas sources in the Barnett Shale, and offshore oil and gas platforms are currently under evaluation as part of TCEQ Work Order No. 582-07-84003-FY10-
25.
The project is divided into four primary technical work tasks:
• Identification and review of existing studies pertaining to estimating emissions from oil and gas production sites and recommendation of an emission estimation approach for
each identified source type;
• Collection of activity and emissions data through an industry survey and, as available, obtain data from existing studies and databases;
• Development of a methodology to estimate county-level emissions from each identified source type; and
• Performance of emissions estimation calculations, including documentation of data, procedures, and results in a final project report. The final emissions inventory will be
compiled into National Emissions Inventory Input Format (NIF) 3.0 text files for import into Texas Air Emissions Repository (TexAER).
The purpose of this memo is to identify and summarize emission estimation methodologies
available for oil and gas production sites as determined through a technical review and evaluation of recent studies of emission sources at oil and gas production sites. In the project
Work Plan, this work is referred to as Task 2. The existing studies reviewed and a summary of the available and recommended emission estimation approaches for each source type are
presented in this memo, including summaries of the data required to implement the preferred approach and ERG’s recommendations how best to obtain the needed data. In addition, any data
gaps identified that impact the ability to develop a 2008 inventory estimate for a category are described and possible methods for addressing the data gaps (through the use of existing or
default data) are presented.
This discussion begins by presenting the list of oil and gas source types that are the focus of this project in Section 2.0, Identification of Source Categories. A specific list of source types was
contained in the Work Order and these source types were the focus of the Task 2 analysis, although this analysis was not limited to only those source types. As other additional source
types were identified in the course of reviewing the existing studies, they are also included in this analysis. In Section 3.0, the specific oil and gas emission source types addressed in the project
are presented, along with a review of any relevant existing studies, and a recommended emission estimation approach. Section 4.0 includes the references used in preparation of this
memorandum. Appendix A contains a list of acronyms and abbreviations used in the text of this document. Terms are also defined in the text the first time they are used.
2.0 Identification of Source Categories
The majority of the oil and gas production source categories analyzed in this project were also
included in the previous TCEQ Oil and Gas study (ERG, 2007). Other oil and gas emissions sources were specified by TCEQ in the work order.

A-3
For the purposes of this project and this memorandum, the following oil and gas source types have been addressed:
• Well Completions
• Well Blowdowns
• Wellheads
• Pneumatic Devices
• Fugitive Emissions (Equipment Leaks)
• Artificial Lift (Pumpjack) Engines
• Heaters and Boilers
• Dehydrators
• Storage Tanks
• Oil and Condensate Loading Racks
• Compressor Engines
• Turbines
These types of sources are considered "upstream" sources, which include activities associated with searching for potential oil and gas fields, drilling of exploratory wells, and subsequently
development and operating the wells that recover and bring the natural gas and/or oil to the surface. The majority of upstream sources are area sources and are not currently accounted for
in the point sources inventory.
"Midstream" and "downstream" sources are associated with those operations that subsequently store, process, refine, market, and transport oil and gas products such as crude oil, natural gas,
gasoline, and natural gas liquids. These types of sources are typically included in the point source emissions inventory, and consist of gas processing plants, pipeline compressor stations,
and oil refineries. Point sources are not included in this inventory effort.
Table 1 provides a summary of the general source category types listed above, the specific operations or processes that generate air emissions, and identification of the pollutants associated
with each source. Table 2 identifies the specific emission processes, and the list of available Source Classification Codes (SCCs) for association with each source type. The SCC list is based
on a list of available SCC’s for oil and gas sources as provided to ERG by TCEQ.
The final list of SCC's used to compile the emissions inventory into the NIF 3.0 text files will be provided in the emissions inventory report. The structure of the SCC scheme for many of the
source types included in this study allows for aggregation of emissions under one SCC, or the use of multiple SCC's if sufficient detailed data is obtained to disaggregate emissions into
smaller sub-categories. For example, SCC 2310011500 may be used for "FUGITIVES: ALL PROCESSES" from oil production, or there are 6 separate SCC's that may be used to
disaggregate fugitive emissions into sub-categories of "connectors", "flanges", "valves", "open ended lines", "pumps", and "other".

A
-4
Table 1. Identification of Source Categories Addressed in the Texas Oil and Gas Emission Inventory
Oil & Gas Source Type Specific Emission Sources Potential Pollutants
Well Completions Emissions from venting/flaring from the well completion phase CO, NOX, VOC
Well Blowdowns Emissions from venting/flaring from well blowdowns CO, NOX, VOC
Wellheads Emissions from wellhead assemblies and rod pumps VOC
Pneumatic Devices Fugitive emissions from pneumatic devices used during well exploration
and production VOC
Fugitive Emissions (Equipment
Leaks) Fugitive emissions from pumps and piping components VOC
Artificial Lift Engines (Pumpjack
Engines)
Combustion emissions from artificial lift engines associated with oil
production SO2, NOx, VOC, PM, CO
Heaters and Boilers Emissions from natural gas-fired heaters and boilers SO2, NOx, VOC, PM, CO
Dehydrators Emissions from glycol dehydrator still vents and reboilers VOC, Benzene, Toluene,
Ethylbenzene, Xylene
Storage Tanks Working, breathing, and flashing losses from oil and condensate storage
tanks VOC
Oil and Condensate Loading Racks Fugitive emissions from truck and/or railcar loading VOC
Compressor Engines Combustion emissions from compressor engines associated with oil and
gas production SO2, NOx, VOC, PM, CO,
Formaldehyde
Turbines Combustion emissions from turbines associated with oil and gas
production SO2, NOx, VOC, PM, CO

A
-5
Table 2. Assignment of SCCs to Texas Oil and Gas Sourcesa
SCC Tier Description Short Description
2270010010 OTHER OIL FIELD EQUIPMENT DIESEL: INDUSTRIAL EQUIPMENT: OTHER OIL FIELD EQUIPMENT
(DRILLING RIGS)
2310000000 TOTAL: ALL PROCESSES OIL & GAS EXPLORATION AND PRODUCTION ALL PROCESSES
2310000330 ARTIFICIAL LIFT OIL AND GAS EXPLORATION AND PRODUCTION ARTIFICIAL LIFT
2310001000 TOTAL: ALL PROCESSES ON SHORE OIL & GAS EXPLORATION & PRODUCTION ALL
PROCESSES
2310010000 TOTAL: ALL PROCESSES CRUDE OIL PRODUCTION ALL PROCESSES
2310010100 OIL WELL HEATERS OIL PRODUCTION WELL HEATERS
2310010200 TANKS - FLASHING & STANDING/ WORKING/
BREATHING
OIL PRODUCTION TANKS INCLUDING FLASHING
2310010300 PNEUMATIC DEVICES OIL PRODUCTION PNEUMATIC DEVICES
2310010700 OIL WELL FUGITIVES OIL AND GAS EXPLORATION AND PRODUCTION OIL WELL FUGITIVES
2310010800 OIL WELL TRUCK LOADING OIL AND GAS EXPLORATION AND PRODUCTION OIL WELL TRUCK
LOADING
2310011000 TOTAL: ALL PROCESSES ON SHORE CRUDE OIL PRODUCTION ALL PROCESSES
2310011020 STORAGE TANKS: CRUDE OIL ON SHORE OIL PRODUCTION CRUDE TANKS
2310011100 HEATER TREATER ON SHORE OIL PRODUCTION HEATER TREATER
2310011201 TANK TRUCK/RAILCAR LOADING: CRUDE OIL ON SHORE OIL PRODUCTION TRUCK/RAIL LOADING OF CRUDE
2310011450 WELLHEAD ON SHORE OIL PRODUCTION WELLHEAD
2310011500 FUGITIVES: ALL PROCESSES ON SHORE OIL PRODUCTION FUGITIVES ALL PROCESSES
2310011501 FUGITIVES: CONNECTORS ON SHORE OIL PRODUCTION FUGITIVES CONNECTORS
2310011502 FUGITIVES: FLANGES ON SHORE OIL PRODUCTION FUGITIVES FLANGES
2310011503 FUGITIVES: OPEN ENDED LINES ON SHORE OIL PRODUCTION FUGITIVES OPEN ENDED LINES
2310011504 FUGITIVES: PUMPS ON SHORE OIL PRODUCTION FUGITIVES PUMPS
2310011505 FUGITIVES: VALVES ON SHORE OIL PRODUCTION FUGITIVES VALVES
2310011506 FUGITIVES: OTHER ON SHORE OIL PRODUCTION FUGITIVES OTHER
2310020000 TOTAL: ALL PROCESSES NATURAL GAS EXPLORATION AND PRODUCTION: ALL PROCESSES
2310020309 NATURAL GAS FIRED 4-CYCLE RICH BURN COMPRESSOR ENGINES: ALL
ON-SHORE GAS PRODUCTION 4CYCLE RICH BURN COMPRESSORS
2310020600 COMPRESSOR ENGINES GAS PRODUCTION COMPRESSOR ENGINES (FOR WRAP USE)
2310020700 GAS WELL FUGITIVES NATURAL GAS PRODUCTION GAS WELL FUGITIVES
2310020800 GAS WELL TRUCK LOADING NATURAL GAS PRODUCTION GAS WELL TRUCK LOADING

A
-6
SCC Tier Description Short Description
2310021000 TOTAL: ALL PROCESSES ON SHORE GAS PRODUCTION: ALL PROCESSES
2310021010 STORAGE TANKS: CONDENSATE ON-SHORE GAS PRODUCTION: STORAGE TANKS: CONDENSATE
2310021030 TANK TRUCK/RAILCAR LOADING CONDENSATE
ON SHORE GAS PRODUCTION TRUCK AND RAIL LOADING OF CONDENSATE
2310021100 GAS WELL HEATERS ON-SHORE GAS PRODUCTION HEATERS
2310021101 NATURAL GAS FIRED 2-CYCLE LEAN BURN
COMPRESSOR ENGINES <50 HP
ON-SHORE GAS PRODUCTION: NATURAL GAS FIRED 2-CYCLE LEAN
BURN COMPRESSOR ENGINES <50 HP
2310021102 NATURAL GAS FIRED 2-CYCLE LEAN BURN
COMPRESSOR ENGINES 50 TO 499 HP
ON-SHORE GAS PRODUCTION: NATURAL GAS FIRED 2-CYCLE LEAN
BURN COMPRESSOR ENGINES 50 TO 499 HP
2310021103 NATURAL GAS FIRED 2-CYCLE LEAN BURN COMPRESSOR ENGINES 500+ HP
ON-SHORE GAS PRODUCTION NATURAL GAS FIRED 2-CYCLE LEAN BURN COMPRESSOR ENGINES 500+ HP
2310021109 NATURAL GAS FIRED 2-CYCLE LEAN BURN
COMPRESSOR ENGINES: ALL
ON-SHORE GAS PRODUCTION: NATURAL GAS FIRED 2-CYCLE LEAN
BURN COMPRESSOR ENGINES: ALL
2310021201 NATURAL GAS FIRED 4-CYCLE LEAN BURN COMPRESSOR ENGINES <50 HP
ON-SHORE GAS PRODUCTION NATURAL GAS FIRED 4-CYCLE LEAN BURN COMPRESSOR ENGINES <50 HP
2310021202 NATURAL GAS FIRED 4-CYCLE LEAN BURN
COMPRESSOR ENGINES 50-499HP
ON-SHORE GAS PRODUCTION NATURAL GAS FIRED 4-CYCLE LEAN
BURN COMPRESSOR ENGINES 50 HP - 499 HP
2310021203 NATURAL GAS FIRED 4-CYCLE LEAN BURN COMPRESSOR ENGINES 500+ HP
ON-SHORE GAS PRODUCTION NATURAL GAS FIRED 4-CYCLE LEAN BURN COMPRESSOR ENGINES 500+ HP
2310021209 NATURAL GAS FIRED 4-CYCLE LEAN BURN
COMPRESSOR ENGINES
ON-SHORE GAS PRODUCTION NATURAL GAS FIRED 4-CYCLE LEAN
BURN COMPRESSOR ENGINES
2310021300 GAS WELL PNEUMATIC DEVICES ON-SHORE GAS PRODUCTION PNEUMATIC DEVICES
2310021301 NATURAL GAS FIRED 4-CYCLE RICH BURN COMPRESSOR ENGINES <50 HP
ON-SHORE GAS PRODUCTION NATURAL GAS FIRED 4-CYCLE RICH BURN COMPRESSOR ENGINES <50 HP
2310021302 NATURAL GAS FIRED 4-CYCLE RICH BURN
COMPRESSOR ENGINES 50 TO 499HP
ON-SHORE GAS PRODUCTION NATURAL GAS FIRED 4-CYCLE RICH
BURN COMPRESSOR ENGINES 50 TO 499 HP
2310021303 NATURAL GAS FIRED 4-CYCLE RICH BURN COMPRESSOR ENGINES 500+ HP
ON-SHORE GAS PRODUCTION NATURAL GAS FIRED 4-CYCLE RICH BURN COMPRESSOR ENGINES 500+ HP
2310021400 GAS WELL DEHYDRATORS ON-SHORE GAS PRODUCTION DEHYDRATORS
2310021401 NATURAL GAS FIRED 4-CYCLE RICH BURN COMPRESSOR ENGINES <50 HP W/ NSCR
ON-SHORE GAS PRODUCTION NATURAL GAS FIRED 4-CYCLE RICH BURN COMPRESSOR ENG. <50HP W/ NON SPECIFIC CATALYTIC
REDUCTION
2310021402 NATURAL GAS FIRED 4-CYCLE RICH BURN
COMPRESSOR ENGINES 50-499HP W/ NSCR
ON-SHORE GAS PRODUCTION NATURAL GAS FIRED 4-CYCLE RICH
BURN COMPRESSOR ENG. 50-499HP W/ NON SPECIFIC CATALYTIC REDUCTION

A
-7
SCC Tier Description Short Description
2310021403 NATURAL GAS FIRED 4-CYCLE RICH BURN
COMPRESSOR ENGINES 500+ HP W/ NSCR
ON-SHORE GAS PRODUCTION NATURAL GAS FIRED 4-CYCLE RICH
BURN COMPRESSOR ENG. 500+ HP W/ NON SPECIFIC CATALYTIC REDUCTION
2310021409 NATURAL GAS FIRED 4-CYCLE RICH BURN
COMPRESSOR ENGINES W/NSCR: ALL
ON-SHORE GAS PRODUCTION NATURAL GAS FIRED 4-CYCLE RICH
BURN COMPRESSOR ENGINES WITH NON-SPECIFIC CATALYTIC
REDUCTION: ALL
2310021450 WELLHEAD ON-SHORE GAS PRODUCTION: WELLHEAD
2310021500 GAS WELL COMPLETION - FLARING &
VENTING
ON SHORE GAS PRODUCTION WELL COMPLETION - FLARING AND
VENTING
2310021501 FUGITIVES: CONNECTORS ON-SHORE GAS PRODUCTION: FUGITIVES: CONNECTORS
2310021502 FUGITIVES: FLANGES ON-SHORE GAS PRODUCTION: FUGITIVES: FLANGES
2310021503 FUGITIVES: OPEN ENDED LINES ON-SHORE GAS PRODUCTION: FUGITIVES: OPEN ENDED LINES
2310021504 FUGITIVES: PUMPS ON-SHORE GAS PRODUCTION: FUGITIVES: PUMPS
2310021505 FUGITIVES: VALVES ON-SHORE GAS PRODUCTION: FUGITIVES: VALVES
2310021506 FUGITIVES: OTHER ON-SHORE GAS PRODUCTION: FUGITIVES: OTHER
2310021509 FUGITIVES: ALL PROCESSES ON-SHORE GAS PRODUCTION: FUGITIVES: ALL PROCESSES
2310021600 GAS WELL VENTING ON-SHORE GAS PRODUCTION GAS WELL VENTING
2310030000 TOTAL: ALL PROCESSES OIL AND GAS EXPLORATION AND PRODUCTION: NATURAL GAS
LIQUIDS
2310030210 TANKS - FLASHING & STANDING/ WORKING/
BREATHING, UNCONTROLLED
OIL AND GAS PRODUCTION NATURAL GAS LIQUIDS TANKS
INCLUDING FLASH UNCONTROLLED
2310030220 TANKS - FLASHING & STANDING/ WORKING/
BREATHING, CONTROLLED
OIL & GAS PRODUCTION NATURAL GAS LIQUIDS TANKS INCLUDING
FLASH CONTROLLED
2310031000 TOTAL: ALL PROCESSES ON-SHORE OIL AND GAS EXPLORATION AND PRODUCTION:
NATURAL GAS LIQUIDS
2310111000 ALL PROCESSES ON-SHORE OIL EXPLORATION: ALL PROCESSES
2310111401 OIL WELL PNEUMATIC PUMPS ON-SHORE OIL EXPLORATION: OIL WELL PNEUMATIC PUMPS
2310111700 OIL WELL COMPLETION: ALL PROCESSES ON-SHORE OIL EXPLORATION: OIL WELL COMPLETION: ALL
PROCESSES
2310111701 OIL WELL COMPLETION: FLARING ON-SHORE OIL EXPLORATION: OIL WELL COMPLETION: FLARING
2310111702 OIL WELL COMPLETION: VENTING ON-SHORE OIL EXPLORATION: OIL WELL COMPLETION: VENTING
2310121000 ALL PROCESSES ON-SHORE GAS EXPLORATION: ALL PROCESSES
2310121401 GAS WELL PNEUMATIC PUMPS ON-SHORE GAS EXPLORATION: GAS WELL PNEUMATIC PUMPS
2310121700 GAS WELL COMPLETION: ALL PROCESSES ON-SHORE GAS EXPLORATION: GAS WELL COMPLETION: ALL
PROCESSES
2310121701 GAS WELL COMPLETION: FLARING ON-SHORE GAS EXPLORATION: GAS WELL COMPLETION: FLARING

A
-8
SCC Tier Description Short Description
2310121702 GAS WELL COMPLETION: VENTING ON-SHORE GAS EXPLORATION: GAS WELL COMPLETION: VENTING a SCCs were obtained from TCEQ.

A-9
3.0 Source Types
3.1 Well Completions
Following drilling and casing, a well must be “completed.” Completion is the process which enables the well to produce oil or gas. To complete the production well, casing is installed and
cemented and the drilling rig is removed from the site. As the well is completed, an initial mixture of gas, hydrocarbon liquids, water, sand, and other materials comes to the surface.
Standard practice during the completion process has been to vent or flare the natural gas released, some of which is VOC. This category addresses VOC emissions associated with the
completion process at oil and gas wells. County-level emissions from this source will be estimated for the purpose of this inventory.
3.1.1 Literature Review
ERG conducted a literature review to obtain information on established methodologies to
estimate the atmospheric release of pollutants from well completions. The relevant sources reviewed are listed in Table 3.1.
Table 3.1 Existing Oil and Gas Exploration Emissions Studies Containing Methodologies
for Well Completion Emissions Estimates
Report Title Geographic
Coverage Publication Date
Emissions from Oil and Gas Production Facilities (TCEQ, 2007)
Texas August, 2007
Recommendations for Improvements to the CENRAP States’ Oil and Gas Emissions
Inventories (Bar-Ilan, et al., 2008)
CENRAP States
November, 2008
Development of Baseline 2006 Emissions from Oil and Gas Activity in the Piceance Basin (Bar-Ilan, et al., 2009a)
Piceance Basin,
Colorado January, 2009
Development of Emissions Inventories for
Natural Gas Exploration and Product Activities in the Haynesville Shale (Grant, et al., 2009)
Haynesville
Shale, Texas August, 2009
3.1.2 Emission estimation approaches
The reviewed literature provided component-based approaches for estimating releases from well
completions/recompletions. One component-based method is utilized in several studies including the 2008 CENRAP study “Recommendations for Improvements to the CENRAP
States’ Oil and Gas Emissions Inventories” (Bar-Ilan, et al. 2008), “Development of Emissions Inventories for Natural Gas Exploration and Product Activities in the Haynesville Shale” (Grant,
et al., 2009) and the “Development of Baseline 2006 Emissions from Oil and Gas Activity in the Piceance Basin” (Bar-Ilan, et al., 2009a). These studies estimate the emissions per completion

A-10
event based on the volume of vented gas per completion and the mass fraction of the given pollutant in the venting gas. This value is multiplied by the number completion events and takes
into account destruction of a portion of the pollutant based on flaring or other “green” completion methods (methods by which emissions are minimized during well completion
through capture and/or destruction of the vented gases). The “Emissions from Oil and Gas Production Facilities” (TCEQ, 2007) study uses U.S. Environmental Protection Agency’s
(EPA’s) AP-42 emissions factors for CO and NOx emissions and uses a displacement equation (mass balance approach) to estimate SO2 and VOC emissions. Emissions are then calculated by
multiplying this emissions factor by the number of completions, and the mass fraction of the given pollutant in the vented gas. The latter data may be collected via industry surveys.
3.1.3 Preferred emission estimation approach
As a preferred method to estimate emissions from well completions, ERG will use the
methodology from the Central Regional Air Planning Association (CENRAP) study.
Emissions from well completions will be estimated on the basis of the volume of gas vented during completion and the average VOC content of that gas, obtained from a gas composition
analyses. Emissions rates are evaluated at standard temperature and pressure (STP) in the CENRAP study. Data on the operating temperature and pressure will be collected via survey and
emissions will be adjusted for the appropriate operating parameters.
The calculation methodology for completion emissions follows Equations 1 and 2:
9072005105.3)/(
)(,
i
gas
ventedicompletion
f
TMWR
VPE ×
−×××
×= Equation (1)
where:
Ecompletion,i is the emissions of pollutant i from a single completion event [ton/event] P is atmospheric pressure [1 atm]
Vvented is the volume of vented gas per completion [MCF/event] R is the universal gas constant [0.082 L-atm/mol-K]
MWgas is the molecular weight of the gas [g/mol] T is the atmospheric temperature [298 K]
fi is the mass fraction of pollutant i in the vented gas
The total emissions from all completions occurring in a county can be evaluated following Equation 2:
( )greenflarecountyicompletionTOTALcompletion ccSEE −−××= 98.01,, Equation (2)
where: Ecompletion,TOTAL are the total emissions county-wide from completions [tons/year]
Ecompletion,i are the completion emissions from a single completion event [tons/event] cflare is the fraction of completions in the basin controlled by flares
A-11
cgreen is the fraction of completions in the basin controlled by green completion techniques
Scounty is the county-wide new well and recompleted well count
Volume of vented gas per completion, Vvented: The 2008 CENRAP study obtained basin-level vented gas volumes from survey data. ERG will
attempt to obtain estimates for the volume of vented gas per completion by conducting a survey of oil and gas producers. Depending on the amount of data collected, averages may be
determined at the county level, the Texas Railroad Commission (TRC) District level, the basin level, or state-wide. If insufficient data is collected on all counties, ERG may default to the
average volume vented presented in the 2008 CENRAP study. The CENRAP data can also be used as a QA check to ensure that results from the survey are reasonable.
Mass fraction for a single pollutant, fi:
The 2008 CENRAP study obtained basin-level mass fractions for various pollutants from survey data. Where survey data were not available for a specific basin, the average of all CENRAP
basins was used. ERG will attempt to obtain estimates for the mass fraction of pollutants by conducting a survey of oil and gas. Depending on the amount of data collected, averages may be
determined at the county level, the TRC District level, the basin level, or state-wide. If insufficient data is collected on all counties, ERG may default to the average mass fractions of
pollutants presented in the 2008 CENRAP study. The CENRAP data can also be used as a QA check to ensure that results from the survey are reasonable.
Number of completions controlled by flares, cflare and the number of green completions, cgreen:
The 2008 CENRAP study obtained basin-level estimates for the number of completions controlled by flares and the number of completions controlled by green completion techniques
from survey data. ERG will attempt to obtain estimates for the number of completions controlled by flares or green completions either by conducting a survey of oil and gas producers,
or from existing data from the TRC. Depending on the amount of data collected, averages may be determined at the county level, the TRC District level, the basin level, or state-wide.
County-level new/recompleted well count, Scounty:
ERG will obtain county-level data for the number of new and recompleted wells from the TRC for each county included in this analysis.
3.1.4 Data Needs
In order to implement the preferred emissions estimation approach, county-level data on the
number of well completions, volume of vented gas per completion, oil and gas product composition, and number of completions controlled by flares or controlled by green completion
techniques, and the number of active oil and gas wells are required. ERG will collect data on the number of oil and gas well completions per county using the most recently available database
from the TRC. ERG will attempt to collect all other data items by conducting a survey of oil and gas producers owning active wells in the Texas counties covered in this emissions inventory
development effort.

A-12
3.2 Well Blowdowns
Well blowdowns refer to the practice of venting gas from wells that have developed some kind of cap or obstruction before any additional intervention work can be done on the wells.
Typically, well blowdowns are conducted on wells that have been shut in for a period of time and the operator desires to bring the well back into production. Well blowdowns are also
sometimes conducted to remove fluid caps that have built up in producing gas wells. Because gas is directly vented from the blowdown event, blowdowns can be a source of VOC emissions.
County-level emissions from this source will be estimated for the purpose of this inventory.
3.2.1 Literature Review
ERG conducted a literature review to obtain information on established methodologies to estimate the atmospheric release of pollutants from well blowdowns. The relevant sources
reviewed are listed in Table 3.2.
Table 3.2 Existing Oil and Gas Exploration Emissions Studies Containing Methodologies
for Well Blowdown Emissions Estimates
Report Title Geographic
Coverage Publication Date
Emissions from Oil and Gas Production Facilities (TCEQ, 2007)
Texas August, 2007
Recommendations for Improvements to the CENRAP States’ Oil and Gas Emissions
Inventories (Bar-Ilan, et al., 2008)
CENRAP States
November, 2008
Development of Baseline 2006 Emissions from Oil and Gas Activity in the Piceance Basin (Bar-
Ilan, et al., 2009a)
Piceance Basin,
Colorado January, 2009
Development of Emissions Inventories for Natural Gas Exploration and Product Activities in
the Haynesville Shale (Grant, et al., 2009)
Haynesville Shale, Texas
August, 2009
3.2.2 Emission estimation approaches
The reviewed literature provided component-based approaches for estimating releases from well blowdowns. One component-based method is utilized in several studies including the 2008
CENRAP study “Recommendations for Improvements to the CENRAP States’ Oil and Gas Emissions Inventories” (Bar-Ilan, et al. 2008), “Development of Emissions Inventories for
Natural Gas Exploration and Product Activities in the Haynesville Shale” (Grant, et al., 2009) and the “Development of Baseline 2006 Emissions from Oil and Gas Activity in the Piceance
Basin” (Bar-Ilan, et al., 2009a). Emissions from blowdowns are estimated on the basis of the volume of gas vented during a blowdown and the average pollutant content of that gas, obtained
from gas composition analyses. This methodology is very similar to that of completion venting. Flaring and/or green practices may be used to control emissions from the blowdown process.
A-13
The previous ERG study, “Emissions from Oil and Gas Production Facilities” (TCEQ, 2007), did not estimate emissions from well blowdowns.
3.2.3 Preferred emission estimation approach
As a preferred method, ERG will use the methodology from the CENRAP study to generate
estimated emissions from well blowdowns.
Emissions from well blowdowns will be estimated on the basis of the volume of gas vented during blowdown and the average VOC content of that gas, obtained from a gas composition
analyses. Emissions rates are evaluated at STP in the CENRAP study. Data on the operating temperature and pressure will be collected via survey and emissions will be adjusted for the
appropriate operating parameters.
The calculation methodology for blowdown emissions is identical to the method for completion emissions, and follows Equations 3 and 4:
9072005105.3)/(
)(,
i
gas
vented
iblowdown
f
TMWR
VPE ×
−×××
×= Equation (3)
where: Ecompletion,i is the emissions of pollutant i from a single blowdown event [ton/event]
P is atmospheric pressure [1 atm] Vvented is the volume of vented gas per blowdown [MCF/event]
R is the universal gas constant [0.082 L-atm/mol-K] MWgas is the molecular weight of the gas [g/mol]
T is the atmospheric temperature [298 K] fi is the mass fraction of pollutant i in the vented gas
The total emissions from all blowdowns occurring in a county can be evaluated following
Equation 4:
( )greenflarewellsblowdowniblowdownTOTALblowdown ccNNEE −−×××= 98.01,, Equation (4)
where:
Eblowdown,TOTAL are the total emissions county-wide from blowdowns [tons/year] Eblowdown,i are the blowdown emissions from a single blowdown event [tons/event]
Nblowdown is the number of blowdowns per well in the county
Nwells is the total number of active wells in the county
cflare is the fraction of blowdowns in the basin controlled by flares cgreen is the fraction of blowdowns in the basin controlled by green completion techniques

A-14
Volume of vented gas per blowdown, Vvented:
The 2008 CENRAP study obtained basin-level vented gas volumes from survey data. ERG will attempt to obtain estimates for the volume of vented gas per blowdown by conducting a survey
of oil and gas producers. In the event that insufficient data is collected on a particular county, ERG will use the average of all other counties. If insufficient data is collected on all counties,
ERG may default to the average volume vented presented in the 2008 CENRAP study. The CENRAP data can also be used as a Quality Assurance (QA) check to ensure that results from
the survey are reasonable.
Mass fraction for a single pollutant, fi: The 2008 CENRAP study obtained basin-level mass fractions for various pollutants from survey
data. Where survey data was not available for a specific basin, the average of all CENRAP basins was used. ERG will attempt to obtain estimates for the mass fraction of pollutants by
conducting a survey of oil and gas producers. Depending on the amount of data collected, averages may be determined at the county level, the TRC District level, the basin level, or state-
wide. If insufficient data is collected on all counties, ERG may default to the average mass fractions of pollutants presented in the 2008 CENRAP study. The CENRAP data can also be
used as a QA check to ensure that results from the survey are reasonable.
County-level number of blowdowns per well, Nblowdown: The 2008 CENRAP study obtained basin-level number of blowdowns from survey data. ERG
will attempt to obtain estimates for the number of blowdowns per county by conducting a survey of oil and gas producers. In the event that insufficient data is collected on a particular county,
ERG will use the average of all other counties. Depending on the amount of data collected, averages may be determined at the county level, the TRC District level, the basin level, or state-
wide. If insufficient data is collected on all counties, ERG may default to the average mass fractions of pollutants presented in the 2008 CENRAP study. The CENRAP data can also be
used as a QA check to ensure that results from the survey are reasonable.
County-level well count, Nwells: The 2008 CENRAP study obtained basin-level number of wells from survey data. ERG will
attempt to obtain estimates for the number of wells per county by conducting a survey of oil and gas producers. In the event that insufficient data is collected on a particular county, ERG will
use the average of all other counties. Depending on the amount of data collected, averages may be determined at the county level, the TRC District level, the basin level, or state-wide. If
insufficient data is collected on all counties, ERG may default to the average mass fractions of pollutants presented in the 2008 CENRAP study. The CENRAP data can also be used as a QA
check to ensure that results from the survey are reasonable.
Number of blowdowns controlled by flares, cflare and the number of green blowdowns, cgreen: The 2008 CENRAP study obtained basin-level estimates for the number of blowdowns
controlled by flares and the number of blowdowns controlled by green techniques from survey data. ERG will attempt to obtain county-level estimates for the number of blowdowns controlled
by flares or green blowdown methods either by conducting a survey of oil and gas producers, or

A-15
from existing data from the TRC. Depending on the amount of data collected, averages may be determined at the county level, the TRC District level, the basin level, or state-wide.
3.2.4 Data Needs
In order to implement the preferred emissions estimation approach, county-level data on the
number of well blowdowns, volume of vented gas per blowdown, oil and gas product composition, and number of blowdowns controlled by flares or controlled by green techniques,
and the number of active oil and gas wells are required. ERG will collect data on the number of oil and gas wells per county using the most recently available database from the TRC. ERG will
attempt to collect all other data items by conducting a survey of oil and gas producers owning active wells in the Texas counties covered in this emissions inventory development effort.
3.3 Wellheads
The wellhead is the part of an oil or gas well that terminates at the surface and is the location
where oil or gas products can be withdrawn. The primary function of the wellhead is to hold the casings and the production tubing of the well. On top of the wellhead sits the tubing hanger,
from which the production tubing is run. The well christmas tree rests on top of the tubing hanger, as well as surface flow-control facilities used in the production phase of the well. The
wellhead is a source of VOC emissions from various fugitive outlets including seals and joints. County-level emissions from this source will be estimated for the purpose of this inventory.
3.3.1 Literature Review
ERG conducted a literature review to obtain information on established methodologies to
estimate the atmospheric release of pollutants from emissions generated at oil and gas wellheads. The relevant sources reviewed are listed in Table 3.3.
Table 3.3 Existing Oil and Gas Exploration Emissions Studies Containing Methodologies
for Wellhead Emissions Estimates
Report Title Geographic
Coverage Publication Date
Oil and Gas Emission Inventories for the Western States (Russell, et al., 2005)
WRAP States December, 2005
Emissions from Oil and Gas Production Facilities (TCEQ, 2007)
Texas August, 2007
3.3.2 Emission estimation approaches
The reviewed literature provided two similar approaches to estimate emissions from wellheads at oil and gas sites. The first of these approaches is presented in the study: “Oil and Gas Emission
Inventories for the Western States” (Russell, et al., 2005), which uses oil and gas production data along with emission factors for various wellhead sources to determine wellhead emissions.
These sources include: tanks, dehydrators, heaters, completions, and pneumatic devices.

A-16
Emissions from all of these sources are discussed elsewhere in this report. The “Emissions from Oil and Gas Production Facilities” (TCEQ, 2007) study uses AP-42 emission factors for oil and
gas facilities to determine wellhead emissions from wellhead assemblies and rod pumps. Other reviewed sources did not provide wellhead emissions calculation methodologies.
3.3.3 Preferred emission estimation approach
As a preferred method to estimate emissions from wellheads, ERG will use the AP-42 emission
factor to calculate emissions from oil and gas wellheads, based on the number of oil and gas wellheads in place. The AP-42 emission factor for VOC emissions from gas wellheads is based
on gas production. Gas production data by county in Texas is also available from the TRC. However, additional emission methodologies may be developed if additional sources are located.
3.3.4 Data Needs
In order to implement the preferred emissions estimation approach, county-level data on the
number of oil wellheads and gas production are required. ERG will collect data on the number of oil wellheads and gas production wellhead sites per county using the most recently available
database from the TRC.
3.4 Pneumatic Devices
Pneumatic devices are used for a variety of gas and oil well processes and are powered by high-pressure produced gas. These devices include transducers, liquid level controllers, pressure
controllers and positioners. During the normal operation of these devices, they release or bleed natural gas to the atmosphere making them a source of VOC emissions. County-level emissions
from these sources will be estimated for the purpose of this inventory.
3.4.1 Literature Review
ERG conducted a literature review to obtain information on established methodologies to estimate the atmospheric release of pollutants from emissions generated by pneumatic devices
typically utilized at oil and natural gas production wells. The relevant sources reviewed are listed in Table 3.4.
Table 3.4 Existing Oil and Gas Exploration Emissions Studies Containing Methodologies
for Pneumatic Device Emissions Estimates
Report Title Geographic
Coverage Publication Date
Oil and Gas Emission Inventories for the Western
States (Russell, et al., 2005) WRAP States December, 2005
Emissions from Oil and Gas Production Facilities (TCEQ, 2007)
Texas August, 2007

A-17
Table 3.4 Existing Oil and Gas Exploration Emissions Studies Containing Methodologies
for Pneumatic Device Emissions Estimates (Cont.)
Report Title Geographic
Coverage Publication Date
WRAP Area Source Emissions Inventory Projections and Control Strategy Evaluation
Phase II (Bar-Ilan, et al., 2007) WRAP States September, 2007
Recommendations for Improvements to the CENRAP States’ Oil and Gas Emissions
Inventories (Bar-Ilan, et al., 2008)
CENRAP States
November, 2008
Development of Baseline 2006 Emissions from Oil and Gas Activity in the Piceance Basin (Bar-
Ilan, et al., 2009a)
Piceance Basin,
Colorado January, 2009
3.4.2 Emission estimation approaches
The reviewed literature provided two similar approaches with different bases to estimate
emissions from pneumatic devices at oil and gas sites. The first of these approaches is presented in the Western Regional Air Partnership (WRAP) Phase I (Russell, et al., 2005) and WRAP
Phase II (Bar-Ilan, et al., 2007) reports which utilize separate emissions factors for oil wells and gas wells provided by the Wyoming Department of Environmental Quality (WYDEQ). The
emissions factors for VOC and Hazardous Air Pollutants (HAPs) from pumps are given on a per well basis (tons/yr/well) and are calculated based on an average usage/bleed rate of 5 scf/hr,
statewide average weighted gas compositions, continuous operation, and an assumption of two pumps per gas well and one pump per oil well. Area-wide emissions are then calculated based
on the number of gas wells and oil wells currently active in a specific area. This approach was also adopted in the 2007 TCEQ report on emissions from oil and gas production facilities.
However, the emissions factors were recalculated using weight percents provided in a 2004 report from the Gas Processors Association (GPA).
An alternative approach is presented in both the 2008 CENRAP study “Recommendations for
Improvements to the CENRAP States’ Oil and Gas Emissions Inventories” (Bar-Ilan, et al. 2008) and “Development of Baseline 2006 Emissions from Oil and Gas Activity in the Piceance Basin”
(Bar-Ilan, et al., 2009a). The same calculation approach is used in this method; however, this method uses bleed rates obtained from the results of an extensive study performed by EPA as
part of the Natural Gas Star program in 2004. This study provides bleed rate estimates for several different device types – liquid level controllers, positioners, pressure controllers, and
transducers. This approach also conducted a survey to estimate the number of each device type present at typical gas and oil well sites. Given the additional level of detail presented with this
approach, it will be the preferred approach for estimating emissions from pneumatic devices.

A-18
3.4.3 Preferred emission estimation approach
As a preferred method to estimate emissions from pneumatic devices, ERG will use the CENRAP methodology.
Emissions from a single well site are calculated using Equation 5:
5
,
105.3907200
−×××
×
××= ∑
TMW
R
PtNV
fE
gas
i
annualii
j
jpneumatic Equation (5)
where:
Epneumatic,j is the total emissions of pollutant j from all pneumatic devices for a typical well
[ton/year/well]
Vi is the volumetric bleed rate from device i [scf/hr/device]
Ni is the total number of device i owned by the participating companies
tannual is the number of hours per year that devices are operating
P is the atmospheric pressure [1 atm]
R is the universal gas constant [0.082 L-atm/mol-K]
MWgas is the molecular weight of the gas [g/mol]
T is the atmospheric temperature [298 K]
fj is the mass fraction of pollutant j in the vented gas
County-wide emissions are calculated using Equation 6:
welljpneumaticTOTALpneumatic NEE ×= ,, Equation (6)
where:
Epneumatic,TOTAL is the total pneumatic device emissions in the county [ton/yr]
Epneumatic,j is the pneumatic device emissions for a single well of pollutant j [ton/yr]
Nwell is the total number of active wells in the county for a given year
Emissions rates are evaluated at STP in the CENRAP study. Data on the operating temperature
and pressure will be collected via survey and emissions will be adjusted for the appropriate
operating parameters.
Volumetric bleed rate from device i, Vi:
The 2008 CENRAP study uses bleed rates for various devices presented in a 2004 EPA Natural
Gas Star program study. ERG will also use the bleed rates from the EPA Natural Gas Star
program study when calculating emissions from pneumatic devices at oil and gas production
sites.
Total number of devices, Ni:
The 2008 CENRAP study obtained basin-level total number of devices per well from survey
data. Where survey data was not available for a specific basin, the average of all CENRAP

A-19
basins was used. ERG will attempt to obtain estimates for the number of devices per well by
conducting a survey of oil and gas producers. Depending on the amount of data collected,
averages may be determined at the county level, the TRC District level, the basin level, or state-
wide. If insufficient data is collected on all counties, ERG may default to the average of number
of devices for each type presented in the 2008 CENRAP study. The CENRAP data can also be
used as a quality assurance check to ensure that results from the survey are reasonable.
Number of hours per year that devices are operating, tannual:
The 2008 CENRAP study assumed basin-level annual hours of device operation to be 8760 hr/yr
(non-stop operation). ERG will attempt to obtain estimates for the annual hours of device
operation by conducting a survey of oil and gas producers. Depending on the amount of data
collected, averages may be determined at the county level, the TRC District level, the basin
level, or state-wide. If insufficient data is collected on all counties, ERG may default to a value
of 8760 hr/yr assumed in the 2008 CENRAP study. The CENRAP data can also be used as a
quality assurance check to ensure that results from the survey are reasonable.
Molecular weight of gas, MWgas:
The 2008 CENRAP study obtained basin-level molecular weights of gas bleeding from survey
data. ERG will attempt to obtain data on the molecular weights by conducting a survey of oil
and gas producers. Depending on the amount of data collected, averages may be determined at
the county level, the TRC District level, the basin level, or state-wide. If insufficient data is
collected on all counties, ERG may default to the average of the molecular weights in the 2008
CENRAP study. The CENRAP data can also be used as a quality assurance check to ensure that
results from the survey are reasonable.
Mass fraction of pollutant j in the vented gas, fj:
The 2008 CENRAP study obtained basin-level mass fractions from survey data. ERG will
attempt to obtain estimates for the mass fractions of pollutants by conducting a survey of oil and
gas producers. Depending on the amount of data collected, averages may be determined at the
county level, the TRC District level, the basin level, or state-wide. If insufficient data is
collected on all counties, ERG may default to the compositions presented in the 2008 CENRAP
study. The CENRAP data can also be used as a quality assurance check to ensure that results
from the survey are reasonable.
3.4.4 Data Needs
In order to implement the preferred emissions estimation approach, county-level data on the
number of devices per well, annual hours of device operation, oil and gas product composition
and molecular weight, and number of active oil and gas wells are required. ERG will collect
data on the number of oil and gas wells per county using the most recently available database
from the TRC. ERG will attempt to collect all other data items by conducting a survey of oil and
gas producers owning active wells in the Texas counties covered in this emissions inventory
development effort.

A-20
3.5 Fugitive Emissions (Equipment Leaks)
All oil and gas producing sites have a system of pumps and piping to transport oil and gas from
the wellhead to the processing area. These pumps and piping networks are constructed with
many individual components including flanges, valves, seals, and connectors. As a result of high
operating pressures, varying fitting tightness, and age and condition, each of these components
has the potential to release fugitive emissions while oil and gas product flows through them.
County-level emissions from these sources will be estimated for the purpose of this inventory.
3.5.1 Literature Review
ERG conducted a literature review to obtain information on established methodologies to
estimate the atmospheric release of pollutants from fugitive emissions generated by non-point
source equipment and components typically utilized at oil and natural gas production wells. The
relevant sources reviewed are listed in Table 3.5.
Table 3.5 Existing Oil and Gas Exploration Emissions Studies Containing Methodologies
for Fugitive Emissions Estimates
Report Title Geographic
Coverage Publication Date
Ozone Precursors Emissions Inventory for San Juan and Rio Arriba Counties, New Mexico
(Pollack, et al., 2006)
San Juan and Rio Arriba
Counties,
New Mexico
August, 2006
Emissions from Oil and Gas Production Facilities (TCEQ, 2007)
Texas August, 2007
Recommendations for Improvements to the CENRAP States’ Oil and Gas Emissions
Inventories (Bar-Ilan, et al., 2008)
CENRAP States
November, 2008
Development of Baseline 2006 Emissions from Oil and Gas Activity in the Piceance Basin (Bar-
Ilan, et al., 2009a)
Piceance Basin,
Colorado January, 2009
3.5.2 Emission estimation approaches
The reviewed literature sources all provided a similar approach for estimating fugitive emissions
from equipment leaks. This method estimates emissions using component-based emissions
factors. The component-based method uses EPA’s AP-42 emissions factors for each component
type based on the type of service to which the equipment applies – gas, light liquid, heavy liquid,
or water. Emissions are then calculated by multiplying this emissions factor by the number of
components per well, the annual number of hours the well is in operation, and the mass fraction
of the given pollutant in the vented gas. The latter data were collected via industry surveys.
These well-based emissions are then multiplied by the number of wells for a given area. The
2007 TCEQ study uses emissions factors developed by the American Petroleum Institute (API),

A-21
and the number of components per well was obtained from a study conducted by the Canadian
Association of Petroleum Producers (CAPP).
The component-based method applies to both oil and gas producing wells. If sufficient data on
the number of components at each well site can be obtained, performing a component-based
analysis will allow for the most comprehensive estimates for fugitive releases.
3.5.3 Preferred emission estimation approach
As a preferred method to estimate fugitive emissions from equipment leaks, ERG will use the
CENRAP methodology.
Fugitive emissions from a single well site may be calculated using Equation 7:
∑ ××××=i
jannualiijfugitive YtNEFE 0011.0, Equation (7)
where:
Efugitive,j is the fugitive emissions for a single typical well for pollutant j [ton/yr/well]
EFi is the emission factor of TOC for a single component i [kg/hr/component]
Ni is the total number of components of type i
tannual is the annual number of hours the well is in operation [hr/yr]
Yj is the mass fraction of pollutant j to TOC in the vented gas
County-wide fugitive emissions are calculated using Equation 8:
welljfugitiveTOTALfugitive NEE ×= ,, Equation (8)
where:
Efugitive,TOTAL is the total fugitive emission in the county [ton/yr]
Efugitive,j is the fugitive emissions for a single well of pollutant j [ton/yr]
Nwell is the total number of active wells in the county for a given year
Emissions rates are evaluated at STP in the CENRAP study. Data on the operating temperature
and pressure will be collected via survey and emissions will be adjusted for the appropriate
operating parameters.
Emission factor of TOC for a single component, EFi:
ERG will use EPA’s AP-42 emissions factors when calculating fugitive emissions from
equipment leaks at oil and gas production sites.
Total number of components, Ni:
The 2008 CENRAP study obtained basin-level total number of components per well from survey
data. Where survey data was not available for a specific basin, the average of all CENRAP
basins was used. ERG will attempt to obtain estimates for the number of components per well by
conducting a survey of oil and gas producers. Depending on the amount of data collected,
averages may be determined at the county level, the TRC District level, the basin level, or state-

A-22
wide. If insufficient data is collected on all counties, ERG may default to the average number of
components for each service type presented in the 2008 CENRAP study. The CENRAP data can
also be used as a quality assurance check to ensure that results from the survey are reasonable.
Annual number of hours the well is in operation, tannual:
The 2008 CENRAP study assumed basin-level annual hours of well operation to be 8760 hr/yr
(non-stop operation). ERG will attempt to obtain estimates for the annual hours of well
operation by conducting a survey of oil and gas producers. Depending on the amount of data
collected, averages may be determined at the county level, the TRC District level, the basin
level, or state-wide. If insufficient data is collected on all counties, ERG may default to a value
of 8760 hr/yr assumed in the 2008 CENRAP study. The CENRAP data can also be used as a
quality assurance check to ensure that results from the survey are reasonable.
Mass fraction of pollutant j to TOC in the vented gas, Yj:
The 2008 CENRAP study obtained basin-level mass fractions from survey data. ERG will
attempt to obtain estimates for the mass fractions of pollutants by conducting a survey of oil and
gas producers. Depending on the amount of data collected, averages may be determined at the
county level, the TRC District level, the basin level, or state-wide. If insufficient data is
collected on all counties, ERG may default to the compositions presented in the 2008 CENRAP
study. The CENRAP data can also be used as a quality assurance check to ensure that results
from the survey are reasonable.
3.5.4 Data Needs
In order to implement the preferred emissions estimation approach, county-level data on the
number of components per well, annual hours of well operation, oil and gas product
composition, and number of active oil and gas wells are required. ERG will collect data on the
number of oil and gas wells per county using the most recently available database from the TRC.
ERG will attempt to collect all other data items by conducting a survey of oil and gas producers
owning active wells in the Texas counties covered in this emissions inventory development
effort.
3.6 Artificial Lift (Pumpjack) Engines
A pumpjack is used to mechanically lift liquid out of the well if there is not enough bottom hole
pressure for the liquid to flow all the way to the surface. The pumpjack can be driven by an
electric motor; however, in isolated locations without access to electricity, combustion engines
are used. The most common "off-grid" pumpjack engines run on casing gas produced from the
well, but pumpjacks have been run on many types of fuel, such as propane (LPG) and diesel.
Generally, pumpjacks have smaller engines than wellhead compressor engines, but they operate
continuously (8760 hours per year) with minimum down-time. For this project, criteria pollutant
emissions from pumpjack engines will be estimated.

A-23
3.6.1 Literature Review
ERG conducted a literature review to obtain information on established methodologies to
estimate the atmospheric release of pollutants from artificial lift pumpjack engines. The relevant
sources reviewed are listed in Table 3.6.
Table 3.6 Existing Oil and Gas Exploration Emissions Studies Containing Methodologies
for Artificial Lift (Pumpjack) Engines
Report Title Geographic
Coverage Publication Date
Natural Gas Compressor Engine Survey and Engine NOx Emissions at Gas Production
Facilities (HARC, 2005)
Eastern Portion of
Texas August, 2005
Ozone Precursors Emission Inventory for San Juan and Rio Arriba Counties, New Mexico
(Pollack, et al., 2006)
San Juan and Rio Arriba
Counties,
New Mexico
August, 2006
Natural Gas Compressor Engine Survey for Gas Production and Processing
Facilities (HARC, 2006)
Eastern Portion of
Texas October, 2006
Recommendations for Improvements to the
CENRAP States’ Oil and Gas Emissions Inventories (Bar-Ilan, et al., 2008)
CENRAP
States November, 2008
3.6.2 Emission estimation approaches
Of the studies reviewed, there was basically only one methodology used in determining
emissions from pumpjack engines. The 2008 study conducted by ENIRON entitled:
"Recommendations for Improvements to the CENRAP States' Oil and Gas Emission Inventories"
(Bar-Ilan, et al., 2008), applies pollutant specific emission factors (g/hp-hr) to various data
gathered from an inventory of artificial lift engines (based off of surveyed companies). The data
consisted of engine specific information including horsepower, load factors, and actual hours
operated. The emissions were scaled up to the basin level on the basis of well counts and then
scaled to county-level using the fraction of total oil production from oil wells located in each
county. All engine emissions factors (except those for SO2) were obtained from the EPA’s
NONROAD model (EPA, 2005), which contains default emissions factors for an artificial lift
natural gas fired engine. A similar methodology was used to calculate emissions from artificial
pumpjack engines in the 2006 study entitled: "Ozone Precursors Emission Inventory for San
Juan and Rio Arriba Counties, New Mexico" (Pollack, et al., 2006). However, the emission
factors used in the 2006 New Mexico study were based on survey data of specific engine
types/categories and their manufacturers' emission rates instead of the EPA’s NONROAD
model. The specific methodology from these two studies is discussed in Section 3.6.3.

A-24
As an alternative to the methodology used in the CENRAP 2008 and the 2006 New Mexico
studies, ERG explored the idea of applying the methodology we have proposed for estimating
emissions from compressor engines (see Section 3.11) to determine emissions from pumpjack
engines. We believe this approach would be optimal when calculating pumpjack emissions at
the county level because it would not require knowing the specific count of pumpjack engines,
nor their individual sizes. However, the approach would require ERG to develop power-to-pump
requirements (Hp-hr/bbl) which are certain to vary with the depth of the oil in each well and may
also depend on other factors such as plunger/equipment variations. ERG will attempt to obtain
the required data to implement this methodology (pumpjack engine size, hours of operation,
engine loads, well depth, and production data for each well) through the industry survey.
Depending upon the response rate to the survey, ERG may be able to proceed with this approach
and develop power-to-pump requirements in terms of Hp-hr/bbl based on engine size, hours of
operation, and oil production data. At this point, we consider this to be an alternative approach.
3.6.3 Preferred emission estimation approach
ERG will use the methodology from the 2008 CENRAP study to generate estimated emissions
from pumpjack engines. The calculation methodology for this particular approach is shown in
Equations 9 and 10:
185,907
annuali
engine
tLFHPEFE
×××= Equation (9)
where:
Eengine are emissions from a pumpjack engine [ton/year/engine]
EFi is the emissions factor of pollutant i [g/hp-hr]
HP is the horsepower of the engine [hp]
LF is the load factor of the engine
tannual is the annual number of hours the engine is used [hr/yr]
County-wide pumpjack engine emissions would then be calculated using Equation (10):
)1(, pumpjackpumpjackTOTALengineTOTALengine efWEE −×××= Equation (10)
where:
Eengine,TOTAL is the total emissions from pumpjack engines in the county [ton/yr]
Eengine is the total emissions from a pumpjack engine [ton/yr]
WTOTAL is the total number of wells in the county
fpumpjack is the fraction of oil wells with pumpjack engines
epumpjack is the fraction of pumpjack engines that are electrified
3.6.4 Data Needs
ERG will implement the approach used in the 2008 CENRAP study and 2006 New Mexico study
to estimate emissions from pumpjack engines. In order to perform the emission calculations,

A-25
information on engine ratings, load factors, annual hours of engine operation and county-level
data of the number of oil wells with and without pumpjack engines is required. ERG will collect
data on the number of oil wells per county using the most recently available database from the
TRC. ERG will attempt to collect all other data items by conducting a survey of oil and gas
producers owning active oil wells in the Texas counties covered in this emissions inventory
development effort.
If the industry response is sufficient, ERG may attempt to develop power-to-pump requirements
(Hp-hr/bbl) for pumpjack engines to implement the alternative approach.
3.7 Heaters and Boilers
The purpose of heaters and boilers at oil and gas production facilities is to provide thermal
energy input to certain operations within the production process. They can be used as separator
heaters (heater treaters) to provide heat input to separation units, as tank heaters to maintain
storage tank temperatures, or as inline heaters to maintain temperature within pipes and
connections. Heaters and boilers may also be used in dehydrators; however, these sources will
be covered under the dehydrator source methodology of this report. Heaters and boilers are
typically natural gas-fired external combustors. They are primarily considered a source of NOx,
as well as a minor source of CO, VOC and PM emissions. SO2 emissions may also occur if the
gas used to fire the heaters contains Hydrogen Sulfide (H2S) which will be subsequently
converted to SO2 during combustion. County-level emissions from heater sources will be
estimated for the purpose of this inventory.
3.7.1 Literature Review
ERG conducted a literature review to obtain information on established methodologies to
estimate the atmospheric release of pollutants from emissions generated by heaters and boilers
typically utilized at oil and natural gas production wells. The relevant sources reviewed are
listed in Table 3.7.
Table 3.7 Existing Oil and Gas Exploration Emissions Studies Containing Methodologies
for Heater and Boiler Emissions Estimates
Report Title Geographic
Coverage Publication Date
Oil and Gas Emission Inventories for the Western
States (Russell, et al., 2005) WRAP States December, 2005
Ozone Precursors Emission Inventory for San Juan and Rio Arriba Counties, New Mexico
(Pollack, et al., 2006)
San Juan and Rio Arriba Counties,
New Mexico
August, 2006
Emissions from Oil and Gas Production Facilities
(TCEQ, 2007) Texas August, 2007

A-26
Table 3.7 Existing Oil and Gas Exploration Emissions Studies Containing Methodologies
for Heater and Boiler Emissions Estimates (Cont.)
Report Title Geographic
Coverage Publication Date
WRAP Area Source Emissions Inventory Projections and Control Strategy Evaluation
Phase II (Bar-Ilan, et al., 2007)
WRAP States September, 2007
Recommendations for Improvements to the CENRAP States’ Oil and Gas Emissions
Inventories (Bar-Ilan, et al., 2008)
CENRAP
States November, 2008
Development of Baseline 2006 Emissions from Oil and Gas Activity in the Piceance Basin (Bar-
Ilan, et al., 2009a)
Piceance Basin,
Colorado
January, 2009
3.7.2 Emission estimation approaches
The reviewed literature provided two different approaches to estimating emissions from heaters
and boilers at oil and gas sites. The first of these approaches is presented in the WRAP Phase I
report “Oil and Gas Emission Inventories for the Western States” (Russell, et al., 2005) and
WRAP Phase II report “WRAP Area Source Emissions Inventory Projections and Control
Strategy Evaluation Phase II” (Bar-Ilan, et al., 2007). This approach will subsequently be
referred to as Method 1. Method 1 utilizes separate emissions factors for oil wells and gas wells
provided by the WYDEQ. The emissions factors for gas wells are given on a per well basis
(lbs/yr per well) and oil well emissions factors are given on a per barrel produced basis
(lbs/barrel). Area-wide emissions are then calculated based on the number of gas wells and
barrels of oil produced in a specific area. Method 1 was also adopted in the 2007 TCEQ report
on emissions from oil and gas production facilities.
An alternative approach to estimate emissions from heaters and boilers was presented in the 2008
CENRAP report “Recommendations for Improvements to the CENRAP States’ Oil and Gas
Emissions Inventories” (Bar-Ilan, et al. 2008) and the Piceance Basin study “Development of
Baseline 2006 Emissions from Oil and Gas Activity in the Piceance Basin” (Bar-Ilan, et al.,
2009a) from the Independent Petroleum Association of Mountain States (IPMAS)/WRAP Phase
III reports. This approach will subsequently be referred to as Method 2. For Method 2,
emissions of a particular pollutant from a single heater are based on the emissions factor of the
heater, the annual flow rate of gas and the annual operating time of the heater. The gas flow is
derived from the rating of the heater and the local natural gas heating value. All emissions
factors used were based on EPA’s AP-42 emissions factors for natural gas-fired heaters provided
under the external combustion sources category. An additional heater cycling fraction factor was
also incorporated which takes into account the fraction of operating hours that the heater is
actually firing. The 2008 CENRAP report also provides a separate methodology for estimating
SO2 emissions by estimating the mass of gas combusted in the heater using the ideal gas law and
then utilizing the mass fraction of H2S in the gas assuming 100 percent conversion to SO2.
Basin-wide emissions were then estimated by determining the typical number of heaters per well
and scaling up by well count. These estimates were then expanded to the county-level by

A-27
allocating the total basin-wide heater emissions into each county according to the fraction of
basin total wells that are located in each county.
Between the two methodologies, Method 2 provides a fundamental, bottom-up approach which
allows for emissions to be estimated based on site-specific parameters and results in a more
accurate and dynamic emissions inventory for heaters and boilers. Method 1 uses emissions
factors which are previously calculated based on industry-wide averages for heater ratings and
gas heating values specific to Wyoming, resulting in a lack of flexibility and detail as compared
to Method 2. Additionally, Method 2 incorporates a scaling factor based on the number of
heaters per well to supplement the scaling factor for the total number of wells. This level of
detail is advantageous and allows for an additional layer of data collection when calculating
emissions on the county-level. This is not captured in Method 1 which only accounts for the
total number of wells.
There are some short-comings with Method 2 that will need to be addressed in the development
of this current emissions inventory. Due to lack of detail in the utilized databases, a breakdown
of emissions by well type (i.e. oil or gas) was not available. Additionally, county-level
emissions were derived from the allocation of basin-wide emissions based on the fraction of
wells located in each county. The development of the updated TCEQ emissions inventory will
attempt to obtain county-level data by well type in all aspects of the analysis to obtain a more
accurate model of emissions from county to county.
3.7.3 Preferred emission estimation approach
As a preferred method to estimate emissions from heaters and boilers, ERG will use the
CENRAP methodology.
Emissions from a single heater may be calculated using Equation 11 (excluding SO2 emissions):
( )2000106××
×××=
local
annualheaterheater
heaterHV
hctQEFE Equation (11)
where:
Eheater is the emissions from a given heater [ton/yr]
EFheater is the emission factor for a heater for a given pollutant [lb/MMSCF]
Qheater is the heater MMBTU/hr rating [MMBTUrated/hr]
HVlocal is the local natural gas heating value [MMBTUlocal/scf]
tannual is the annual hours of operation [hr/yr]
hc is the heater cycling fraction to account for the fraction of operating hours that the
heater is firing.
SO2 emissions from a single heater may be calculated using Equation 12:
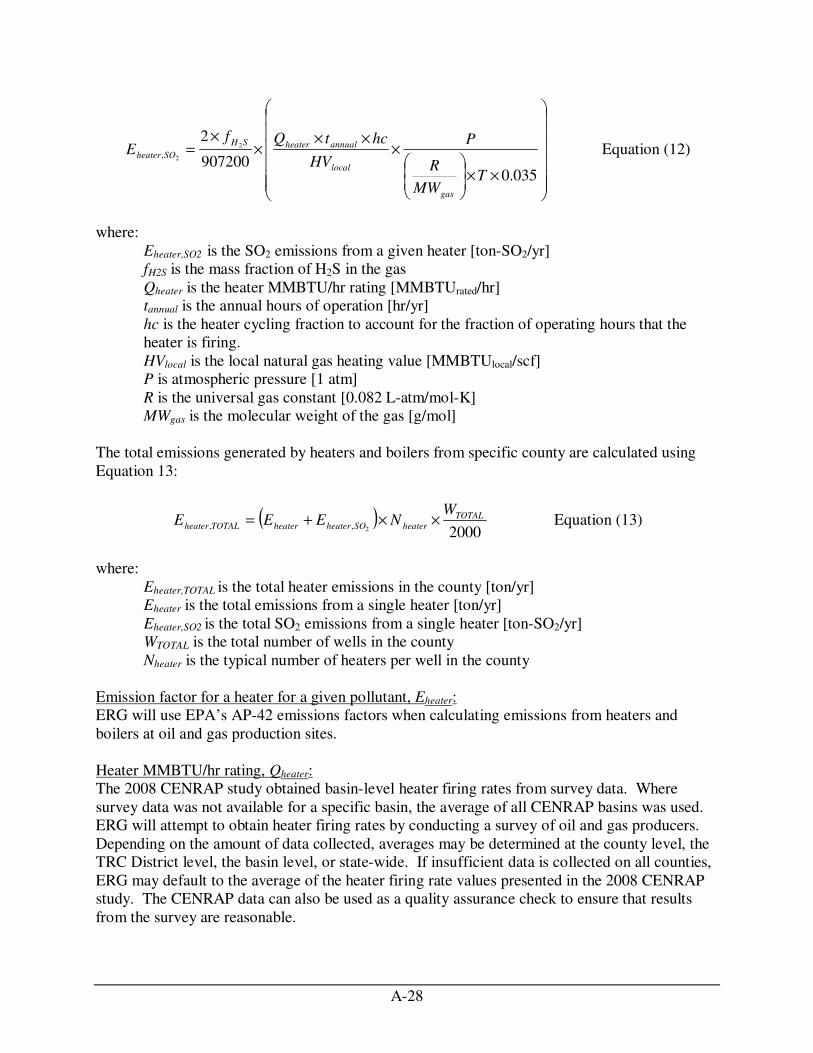
A-28
××
×
×××
×=
035.0907200
22
2,
TMW
R
P
HV
hctQfE
gas
local
annualheaterSH
SOheater Equation (12)
where:
Eheater,SO2 is the SO2 emissions from a given heater [ton-SO2/yr]
fH2S is the mass fraction of H2S in the gas
Qheater is the heater MMBTU/hr rating [MMBTUrated/hr]
tannual is the annual hours of operation [hr/yr]
hc is the heater cycling fraction to account for the fraction of operating hours that the
heater is firing.
HVlocal is the local natural gas heating value [MMBTUlocal/scf]
P is atmospheric pressure [1 atm]
R is the universal gas constant [0.082 L-atm/mol-K]
MWgas is the molecular weight of the gas [g/mol]
The total emissions generated by heaters and boilers from specific county are calculated using
Equation 13:
( )20002,,
TOTAL
heaterSOheaterheaterTOTALheater
WNEEE ××+= Equation (13)
where:
Eheater,TOTAL is the total heater emissions in the county [ton/yr]
Eheater is the total emissions from a single heater [ton/yr]
Eheater,SO2 is the total SO2 emissions from a single heater [ton-SO2/yr]
WTOTAL is the total number of wells in the county
Nheater is the typical number of heaters per well in the county
Emission factor for a heater for a given pollutant, Eheater:
ERG will use EPA’s AP-42 emissions factors when calculating emissions from heaters and
boilers at oil and gas production sites.
Heater MMBTU/hr rating, Qheater:
The 2008 CENRAP study obtained basin-level heater firing rates from survey data. Where
survey data was not available for a specific basin, the average of all CENRAP basins was used.
ERG will attempt to obtain heater firing rates by conducting a survey of oil and gas producers.
Depending on the amount of data collected, averages may be determined at the county level, the
TRC District level, the basin level, or state-wide. If insufficient data is collected on all counties,
ERG may default to the average of the heater firing rate values presented in the 2008 CENRAP
study. The CENRAP data can also be used as a quality assurance check to ensure that results
from the survey are reasonable.
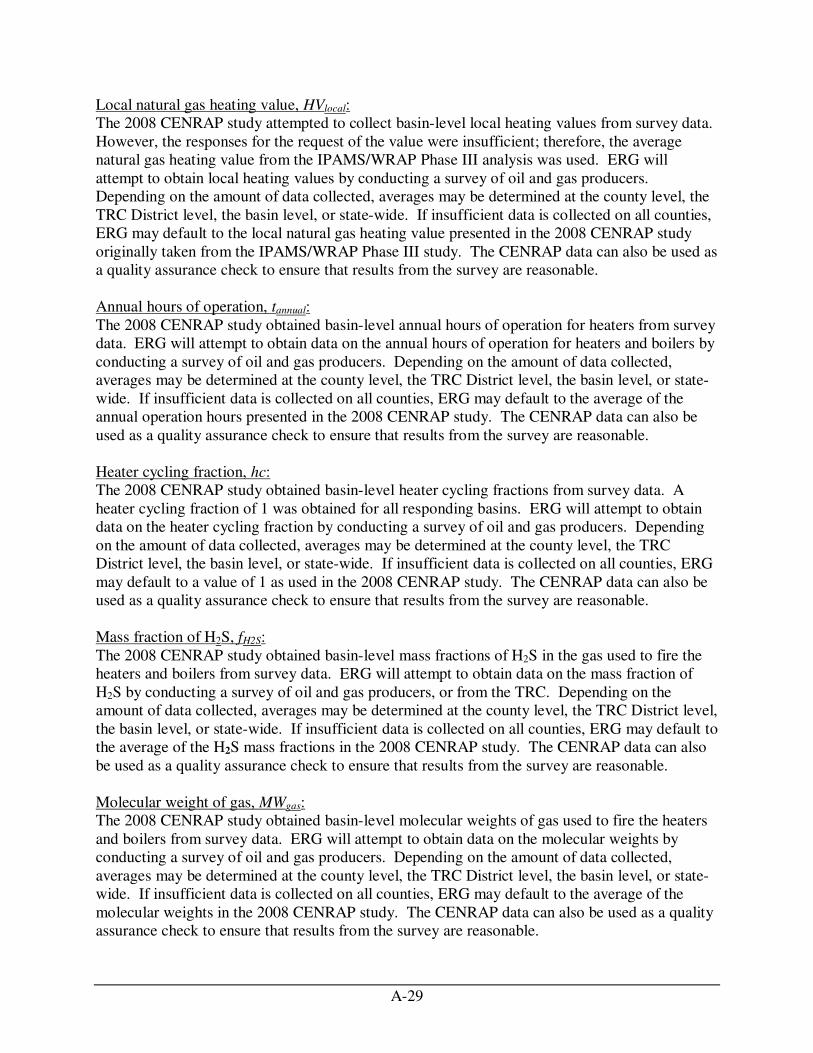
A-29
Local natural gas heating value, HVlocal:
The 2008 CENRAP study attempted to collect basin-level local heating values from survey data.
However, the responses for the request of the value were insufficient; therefore, the average
natural gas heating value from the IPAMS/WRAP Phase III analysis was used. ERG will
attempt to obtain local heating values by conducting a survey of oil and gas producers.
Depending on the amount of data collected, averages may be determined at the county level, the
TRC District level, the basin level, or state-wide. If insufficient data is collected on all counties,
ERG may default to the local natural gas heating value presented in the 2008 CENRAP study
originally taken from the IPAMS/WRAP Phase III study. The CENRAP data can also be used as
a quality assurance check to ensure that results from the survey are reasonable.
Annual hours of operation, tannual:
The 2008 CENRAP study obtained basin-level annual hours of operation for heaters from survey
data. ERG will attempt to obtain data on the annual hours of operation for heaters and boilers by
conducting a survey of oil and gas producers. Depending on the amount of data collected,
averages may be determined at the county level, the TRC District level, the basin level, or state-
wide. If insufficient data is collected on all counties, ERG may default to the average of the
annual operation hours presented in the 2008 CENRAP study. The CENRAP data can also be
used as a quality assurance check to ensure that results from the survey are reasonable.
Heater cycling fraction, hc:
The 2008 CENRAP study obtained basin-level heater cycling fractions from survey data. A
heater cycling fraction of 1 was obtained for all responding basins. ERG will attempt to obtain
data on the heater cycling fraction by conducting a survey of oil and gas producers. Depending
on the amount of data collected, averages may be determined at the county level, the TRC
District level, the basin level, or state-wide. If insufficient data is collected on all counties, ERG
may default to a value of 1 as used in the 2008 CENRAP study. The CENRAP data can also be
used as a quality assurance check to ensure that results from the survey are reasonable.
Mass fraction of H2S, fH2S:
The 2008 CENRAP study obtained basin-level mass fractions of H2S in the gas used to fire the
heaters and boilers from survey data. ERG will attempt to obtain data on the mass fraction of
H2S by conducting a survey of oil and gas producers, or from the TRC. Depending on the
amount of data collected, averages may be determined at the county level, the TRC District level,
the basin level, or state-wide. If insufficient data is collected on all counties, ERG may default to
the average of the H2S mass fractions in the 2008 CENRAP study. The CENRAP data can also
be used as a quality assurance check to ensure that results from the survey are reasonable.
Molecular weight of gas, MWgas:
The 2008 CENRAP study obtained basin-level molecular weights of gas used to fire the heaters
and boilers from survey data. ERG will attempt to obtain data on the molecular weights by
conducting a survey of oil and gas producers. Depending on the amount of data collected,
averages may be determined at the county level, the TRC District level, the basin level, or state-
wide. If insufficient data is collected on all counties, ERG may default to the average of the
molecular weights in the 2008 CENRAP study. The CENRAP data can also be used as a quality
assurance check to ensure that results from the survey are reasonable.

A-30
Typical number of heater per well, Nheater:
The 2008 CENRAP study obtained basin-level typical number of heaters per well from survey
data. ERG will attempt to obtain data on the number of heaters per well by conducting a survey
of oil and gas producers. Depending on the amount of data collected, averages may be
determined at the county level, the TRC District level, the basin level, or state-wide. If
insufficient data is collected on all counties, ERG may default to the average of the number of
heaters per well in the 2008 CENRAP study. The CENRAP data can also be used as a quality
assurance check to ensure that results from the survey are reasonable.
3.7.4 Data Needs
In order to implement the preferred emissions estimation approach, county-level data on the
number of heaters and boilers per well, annual hours of heater operation, heater ratings, local
natural gas heating values, heater cycling fractions, gas molecular weight and H2S content, and
number of active oil and gas wells are required. ERG will collect data on the number of oil and
gas wells per county using the most recently available database from the TRC. ERG will attempt
to collect all other data items by conducting a survey of oil and gas producers owning active
wells in the Texas counties covered in this emissions inventory development effort.
3.8 Dehydrators
Oil and natural gas, when first pumped from the ground, may contain a mixture of liquid and
gaseous organic compounds, nitrogen, carbon dioxide, water, sand, and other impurities. The
extracted product is passed through a three-phase separator. The separator allows the water, oil
and gas to separate. The gaseous component is then piped to a dehydrator to remove any
remaining moisture, improving its quality for sale, and to help prevent corrosion in downstream
pipelines.
The most common and economical process for dehydrating natural gas is to contact the gas with
a hygroscopic liquid such as one of the glycols. Glycol dehydration is an absorption process,
where the water vapor in the gas stream becomes dissolved in a relatively pure stream of glycol
liquid solvent, removing the water from the natural gas. This process is completed in an
absorption column. After the water is removed from the gas stream, the gas is pumped to a gas
transmission pipeline. During the absorption process, the glycol also absorbs some methane and
VOC.
After leaving the absorber, the water-rich glycol is de-pressurized. This step is necessary as the
absorber is typically operated at high pressure. The pressure must be reduced before the
regeneration step. This step may occur in a flash vessel, if the dehydration system is equipped
with one, or it may occur in the glycol regenerator vessel. If the water-rich glycol is first fed to a
flash vessel, the hydrocarbon vapors are vented and any liquid hydrocarbons are skimmed from
the glycol. The de-pressurization step is the primary source of VOC emissions from dehydrator
systems.
The glycol is regenerated by boiling the water out of the glycol. The water-rich glycol is
pumped into a vented boiler vessel called a glycol regenerator boiler. Heat is added until the

A-31
temperature of the mixture is greater than 212 degrees (the boiling point of water), but less than
400 degrees (the boiling point of glycol). The regeneration step allows the glycol to be purified
and recovered for reuse with minimal loss of glycol. Any VOCs remaining in the glycol are
volatized and vented to the atmosphere. The glycol regeneration step involves burning a fuel in a
boiler to heat the glycol-water mixture. The combustion results in emissions of NOX and CO,
and small amounts of PM10, SO2, VOC, and HAPs.
In summary, the two discreet units in a dehydrator system that generate pollutant emissions are
the flash vessel (if present) and the glycol regenerator boiler. The flash vessel and glycol
regenerator normally vent methane, VOC, and HAP during normal, uncontrolled operation,
while the glycol regenerator boiler also has combustion emissions.
3.8.1 Literature Review
ERG conducted a literature review to obtain information on established methodologies to
estimate the atmospheric release of pollutants from dehydrators. The relevant sources reviewed
are listed in Table 3.8.
Table 3.8 Existing Oil and Gas Exploration Emissions Studies
Report Title Geographic
Coverage
Publication
Date
Oil and Gas Emission Inventories for the Western States
(Russell, et al., 2005)
WRAP
States December 2005
Emissions from Oil and Gas Production Facilities (TCEQ,
2007) Texas August, 2007
WRAP Area Source Emissions Inventory Projections and
Control Strategy Evaluation Phase II (Bar-Ilan, et al., 2007)
WRAP
States September, 2007
Development of Baseline 2006 Emissions from Oil and Gas
Activity in the South San Juan Basin (Bar-Ilan, et al.,
2009b)
New Mexico November, 2009
Recommendations for Improvements to the CENRAP
States’ Oil and Gas Emissions Inventories (Bar-Ilan, et al.,
2008)
CENRAP
States November, 2008
Development of Emissions Inventories for Natural Gas
Exploration and Production Activity in the Haynesville
Shale (Grant, et al., 2009)
Haynesville
Shale, Texas
& Louisiana
August 2009
3.8.2 Emission Estimation Approaches
The reviewed literature provided both component-based and production-based approaches for
estimating emissions from dehydrator flash vessels, glycol regenerator vents, and glycol
regenerator boilers.

A-32
The 2005 WRAP Phase I study “Oil and Gas Emission Inventories for the Western States”
(Russell, et al., 2005), the 2007 WRAP Phase II study “WRAP Area Source Emissions Inventory
Projections and Control Strategy Evaluation Phase II” (Bar-Ilan, et al., 2007), and the 2007
TCEQ study “Emissions from Oil and Gas Production Facilities” estimated uncontrolled VOC
emissions from dehydrator flash vessels and glycol regenerator vents using a gas production-
based emission factor provided by the WYDEQ. The emission factor was multiplied by well-
specific gas production figures obtained from the State oil and gas commissions. The Wyoming
emission factor was derived by calculating a production-weighted average composition of wet
gas for each formation across the state. The weighted average was then used with GlyCalc
modeling software to calculate emission factors based on one million standard cubic foot of gas
per day (MSCFD). This methodology is not preferred for the 2008 inventory as the emission
factor is based on gas composition data from Wyoming.
The 2009 WRAP Phase III study “Development of Baseline 2006 Emissions from Oil and Gas
Activity in the South San Juan Basin” (Bar-Ilan, et al., 2009b) utilized a similar approach to
estimating emissions from dehydrator flash vessels and glycol regenerator vents as was done in
the WRAP Phase I study. Emissions from glycol regenerator boilers were calculated using AP-
42 emission factors and the limited data available for field dehydrators to produce an emission
factor on a per-unit-of-gas-throughput basis. This emission factor was applied to basin-wide gas
production rates to determine basin-wide emissions from the regenerator boilers.
The 2008 CENRAP study “Recommendations for Improvements to the CENRAP States’ Oil and
Gas Emissions Inventories” (Bar-Ilan, et al., 2008) utilized the same approach to estimating
emissions as was done in the WRAP Phase III study, except for the Texas basins. For Texas
basins, the VOC emissions from dehydrator flash vessels were estimated with GlyCalc software
using data on the composition of wellhead gas for each of the basins. This gas composition data
were obtained from Northeast Texas Air Care (NETAC) and TCEQ and was based on sampling.
This emission factor was applied to all gas production in each basin to derive basin-wide
emissions estimates for dehydrator flash vessels and glycol regenerator vents. Emissions from
glycol regenerator boilers were calculated using AP-42 emission factors to produce an emission
factor on a per-unit of gas throughput basis. This emission factor was applied to all gas
production in each basin to derive basin-wide emissions estimates for glycol regenerator boilers.
This methodology was also used in the 2009 study “Development of Emissions Inventories for
Natural Gas Exploration and Production Activity in the Haynesville Shale” (Grant, et al., 2009)
for the East Texas Basin.
The reviewed literature also addressed the effect of dehydrator system control technologies on
emissions. The 2007 WRAP Phase II study “WRAP Area Source Emissions Inventory
Projections and Control Strategy Evaluation Phase II” (Bar-Ilan, et al. 2007) evaluated three
strategies or technologies for controlling VOC and HAP emissions from dehydrator systems.
These are: optimize glycol circulation rate, install electric pumps, and install flash tank
separators.
• Optimizing Glycol Recirculation Rate: The study determined that VOC emissions
could be reduced by 33 to 67 percent by optimizing the glycol circulation rate. Glycol

A-33
recirculation rate is set for the optimal rate based on the initial rate of gas production at a
well. However, the rate is typically not adjusted as the gas production rate declines. As
production rates decrease over time, glycol units designed for the original production
rates tend to over circulate causing emission increases without significant reduction in
gas moisture content.
• Using Electric Pumps: The study determined that VOC emissions could be reduced by
67 percent by using electric pumps to move the glycol fluids. Typically, fluids are
moved through the glycol dehydration and regeneration system by using the pressurized
gas produced at the wellhead. VOC emissions occur when the gas is vented during the
regenerator step.
• Installing a Flash Vessel Separator: The study determined that VOC emissions could
be reduced by 10-40 percent by installing a flash vessel separator on dehydrator systems
that do not already incorporate one.
The 2007 WRAP Phase II study “WRAP Area Source Emissions Inventory Projections and
Control Strategy Evaluation Phase II” (Bar-Ilan, et al. 2007) estimated that VOC and HAP
emissions could be reduced by 98% through the use of VRUs. The US EPA, in AP-42, Chapter
13.5 (Industrial Flares), estimates that control of waste VOC via flaring would control VOC by a
minimum of 98%. These technologies are also applicable for vents in dehydrator systems.
VRUs also ‘increase’ oil and gas production by recovering hydrocarbons that would be lost and
redirecting them for pipeline sale or onsite fuel supply.
3.8.3 Preferred Emission Estimation Approach
Dehydrator System Flash Vessels and Glycol Regenerator Vents: As a preferred method,
ERG will use the basic methodology from the CENRAP study to generate estimated emissions
from dehydrators. The calculation of emission factors will be based on gas composition and
production data obtained from the survey or other available data, and the annual natural gas
production by county will be obtained for the year 2008 from the TRC. Survey data will be used
to estimate the percentage of dehydration systems using four control technologies (optimize flow
rate, flash tanks, VRUs, and flares). GlyCalc will be used to develop emission factors for VOC,
benzene, toluene, ethylbenzene, and xylene (BTEX). Depending on the amount of data
collected, averages may be determined at the county level, the TRC District level, the basin
level, or state-wide.
Glycol Regenerator Boilers: Emission factors for glycol regenerator boilers will be based on
survey data for the amount of fuel needed to regenerate the glycol given the glycol flow rates and
average moisture content of the gas produced. Depending on the amount of data collected,
averages may be determined at the county level, the TRC District level, the basin level, or state-
wide.
The equations and methodology for estimating dehydrator-related emissions are discussed
below. These equations assume that all gas requires dehydration, either in the field or at a
central processing facility, that all dehydrators circulate glycol at the optimum rate, and that the
standard dehydrator system does not incorporate a flash vessel.
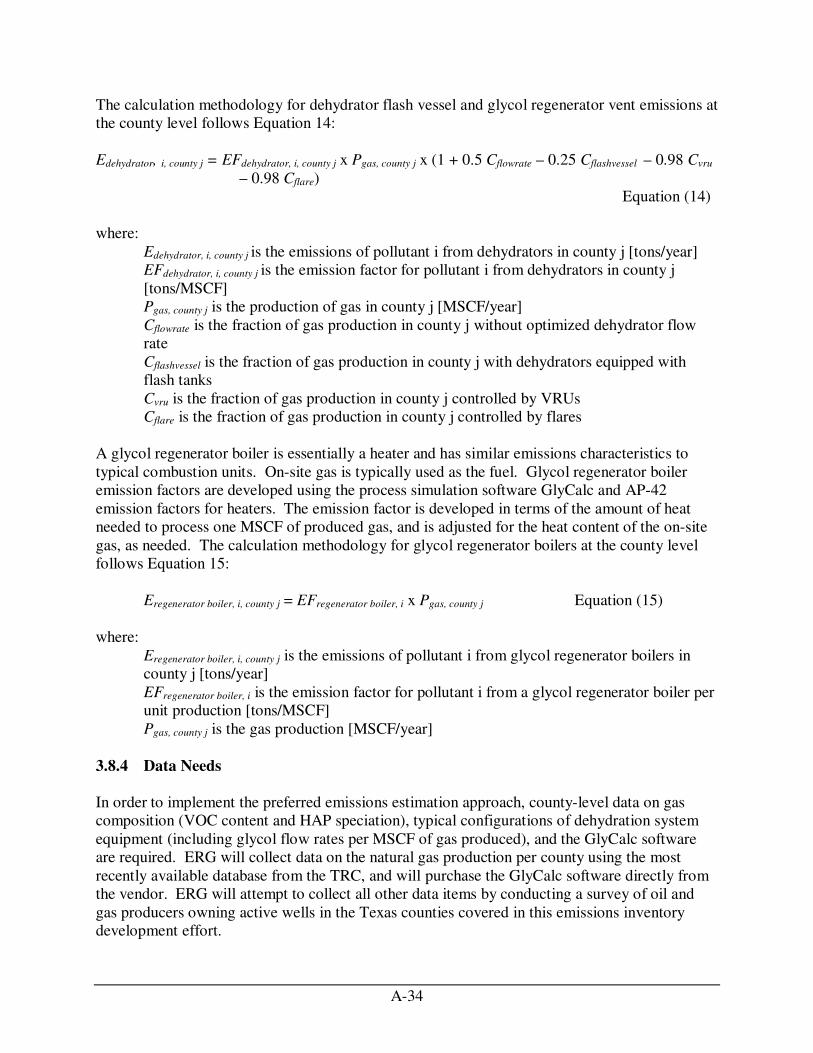
A-34
The calculation methodology for dehydrator flash vessel and glycol regenerator vent emissions at
the county level follows Equation 14:
Edehydrator, i, county j = EFdehydrator, i, county j x Pgas, county j x (1 + 0.5 Cflowrate – 0.25 Cflashvessel – 0.98 Cvru
– 0.98 Cflare)
Equation (14)
where:
Edehydrator, i, county j is the emissions of pollutant i from dehydrators in county j [tons/year]
EFdehydrator, i, county j is the emission factor for pollutant i from dehydrators in county j
[tons/MSCF]
Pgas, county j is the production of gas in county j [MSCF/year]
Cflowrate is the fraction of gas production in county j without optimized dehydrator flow
rate
Cflashvessel is the fraction of gas production in county j with dehydrators equipped with
flash tanks
Cvru is the fraction of gas production in county j controlled by VRUs
Cflare is the fraction of gas production in county j controlled by flares
A glycol regenerator boiler is essentially a heater and has similar emissions characteristics to
typical combustion units. On-site gas is typically used as the fuel. Glycol regenerator boiler
emission factors are developed using the process simulation software GlyCalc and AP-42
emission factors for heaters. The emission factor is developed in terms of the amount of heat
needed to process one MSCF of produced gas, and is adjusted for the heat content of the on-site
gas, as needed. The calculation methodology for glycol regenerator boilers at the county level
follows Equation 15:
Eregenerator boiler, i, county j = EFregenerator boiler, i x Pgas, county j Equation (15)
where:
Eregenerator boiler, i, county j is the emissions of pollutant i from glycol regenerator boilers in
county j [tons/year]
EFregenerator boiler, i is the emission factor for pollutant i from a glycol regenerator boiler per
unit production [tons/MSCF]
Pgas, county j is the gas production [MSCF/year]
3.8.4 Data Needs
In order to implement the preferred emissions estimation approach, county-level data on gas
composition (VOC content and HAP speciation), typical configurations of dehydration system
equipment (including glycol flow rates per MSCF of gas produced), and the GlyCalc software
are required. ERG will collect data on the natural gas production per county using the most
recently available database from the TRC, and will purchase the GlyCalc software directly from
the vendor. ERG will attempt to collect all other data items by conducting a survey of oil and
gas producers owning active wells in the Texas counties covered in this emissions inventory
development effort.

A-35
3.9 Storage Tanks
Storage tanks are used in a variety of applications in the oil and gas industry. An oil and gas
well may produce oil, natural gas, or a mixture of the two. When oil and gas are brought to the
surface, the liquids produced may contain a mixture of liquid and gaseous organic compounds,
nitrogen, carbon dioxide, water, sand, and other impurities. The mixture is typically passed
through a three-phase separator, which allows the water, oil and gas to separate. The liquid oil
and water components are then piped to storage tanks. If the well produces gas, it is possible that
liquids may condense out of the gas as the pressure is decreased. The hydrocarbon liquid
produced at gas wells is known as condensate. Oil and condensate are piped to storage tanks
until they can be transported offsite. Tanks are typically vented to the atmosphere.
Oil and condensate storage tank emissions at wellhead and gathering sites are composed of
flashing losses, working losses, and breathing losses. Flashing losses occur when a produced
liquid (crude oil or condensate) with entrained gases experiences a pressure drop, as during the
transfer of liquid hydrocarbons from a wellhead or separator to a storage tank. As the pressure
on the liquid drops, some of the lighter compounds dissolved in the liquid are released or
“flashed”. Some compounds that are liquids at the initial pressure and temperature, change
phase from a liquid to a gas and are also released or “flashed” from the liquid in the storage tank.
Working losses occur when vapors are displaced from a tank during the filling and unloading
cycles, and when the fluid is agitated during filling of the tank. Breathing losses (also called
standing losses) occur due to the normal evaporation of liquid in a tank. Breathing losses are
vapors that are produced in response to the daily temperature change.
3.9.1 Literature Review
ERG conducted a literature review to obtain information on established methodologies to
estimate the atmospheric release of pollutants from oil and condensate storage tanks. The
relevant sources reviewed are listed in Table 3.9.
Table 3.9 Existing Oil and Gas Exploration Emissions Studies Containing Methodologies
for Storage Tanks
Report Title Geographic
Coverage Publication Date
Calculation of Flashing Losses/VOC Emissions from Hydrocarbon Storage Tanks (ODEQ, 2004)
All Regions July, 2004
Emissions from Oil and Gas Production Facilities (TCEQ, 2007)
Texas August, 2007
WRAP Area Source Emissions Inventory Projections and Control Strategy Evaluation
Phase II (Bar-Ilan, et al., 2007) WRAP States September, 2007
Development of Baseline 2006 Emissions from Oil and Gas Activity in the Uinta Basin (Friesen,
et al., 2009)
Uinta Basin, Utah
March , 2009

A-36
Table 3.9 Existing Oil and Gas Exploration Emissions Studies Containing Methodologies
for Storage Tanks (Cont.)
Report Title Geographic
Coverage Publication Date
Development of Baseline 2006 Emissions from Oil and Gas Activity in the Piceance Basin (Bar-
Ilan, et al., 2009a)
Piceance Basin,
Colorado January, 2009
Development of Baseline 2006 Emissions from Oil and Gas Activity in the South San Juan Basin
(Bar-Ilan, et al., 2009b)
San Juan Basin, New
Mexico November, 2009
Recommendations for Improvements to the CENRAP States’ Oil and Gas Emissions
Inventories (Bar-Ilan, et al., 2008)
CENRAP States
November, 2008
Technical Supplement 6: Above Ground Liquid Storage Tanks (TCEQ, 2009a)
Texas January 2009
Upstream Oil and Gas Storage Tank Project Flash Emissions Models Evaluation (TCEQ, 2009b)
Texas July, 2009
Flash Emissions Model Evaluation Quantifying Volatile Organic Compound Emissions from
Upstream Oil and Gas Storage Tanks (TCEQ,
2009d)
Texas October 2009
VOC Emissions From Oil And Condensate Storage Tanks (TERC, 2009)
East Texas April, 2009
Calculating Volatile Organic Compounds (VOC) Flash Emissions from Crude Oil and Condensate
Tanks at Oil and Gas Production Sites (APDG 5942) (TCEQ, 2009c)
Texas September, 2009
3.9.2 Emission Estimation Approaches
The reviewed literature provided both component-based and production-based approaches for
estimating emissions from oil and condensate storage tanks. The three 2009 WRAP Phase III
studies “Development of Baseline 2006 Emissions from Oil and Gas Activity in the San Juan
Basin” (Bar-Ilan, et al., 2009b), “Development of Baseline 2006 Emissions from Oil and Gas
Activity in the Piceance Basin” (Bar Ilan, et al., 2009a), and “Development of Baseline 2006
Emissions from Oil and Gas Activity in the Uinta Basin” (Friesen, et al., 2009) either used
storage tank emission factors supplied by producers or calculated emission factors for storage
tanks based on data provided by the producers. These emission factors were then used to
directly calculate emissions based on production at each well site (Piceance Basin), or to derive
weighted average emission factors for the basin that were then multiplied by basin-wide
production to derive emission estimates (San Juan Basin, Uinta Basin).

A-37
The 2009 TERC study “VOC Emissions From Oil And Condensate Storage Tanks” (TERC,
2009) used data from the measured emissions from oil and condensate tank batteries to develop
emission factors for the other oil and condensate storage tanks in the East Texas region.
The 2009 TCEQ study “Upstream Oil and Gas Storage Tank Project Flash Emissions Models
Evaluation” (TCEQ, 2009b) compared data from directly measured emissions from 36 oil and
condensate storage tank batteries to the emissions estimates generated using the HYSYS process
simulator, the E&P Tank model, the Gas-to-Oil Ratio (GOR), the Vasquez-Beggs correlation, the
GRI-HAPCalc program, the Valko-McCain correlation, the EC/R equation, and TANKS 4.09d.
The 2008 CENRAP study “Recommendations for Improvements to the CENRAP States’ Oil and
Gas Emissions Inventories” (Bar-Ilan, et al., 2008) estimated emission factors for oil and
condensate storage tanks using GRI-GLYCalc or HYSYS software, and these emission factors
were multiplied by production figures for oil and condensate to develop emissions estimates.
The 2009 TCEQ study “Upstream Oil and Gas Storage Tank Project Flash Emissions Models
Evaluation” (TCEQ, 2009b), the 2009 TCEQ guidance “Technical Supplement 6: Above Ground
Liquid Storage Tanks” (TCEQ, 2009a), and the 2009 TCEQ guide “Calculating Volatile Organic
Compounds (VOC) Flash Emissions from Crude Oil and Condensate Tanks at Oil and Gas
Production Sites (APDG 5942)” (TCEQ, 2009c) recommend calculating working and breathing
losses with EPA TANKS and calculating flashing losses from black oil systems and gas
condensate systems using, in order of preference, direct measurement, process simulator models
(HYSIM, HYSIS, WINSIM, or PROSIM), the E&P TANK program, GRI-HAPCalc, or the GOR
method.
The 2007 TCEQ study used an emission factor developed for gas production in Wyoming, which
was applied to oil and condensate production data for Texas.
The reviewed literature also addressed the effect of storage tank control technologies on
emissions. The 2007 WRAP Phase II study “WRAP Area Source Emissions Inventory
Projections and Control Strategy Evaluation Phase II” (Bar-Ilan, et al. 2007) estimated that VOC
and HAP emissions could be reduced by 98% through the use of VRUs. VRUs also ‘increase’
oil and gas production by recovering hydrocarbons that would be lost and redirecting them for
pipeline sale or onsite fuel supply. The US EPA, in AP-42, Chapter 13.5 (Industrial Flares),
estimates that control of waste VOC via flaring would control VOC by a minimum of 98%.
3.9.3 Preferred Emission Estimation Approach
ERG proposes a two tiered approach to developing regional emission estimates. ERG will use
the methodology and emission factor data developed in the 2009 TERC to develop emission
estimates for oil and condensate storage tanks in the East Texas Shale region. ERG will use this
same methodology in other regions of Texas for which adequate existing direct measurement
data are available. For other regions of Texas, ERG will use the methodology recommended in
the 2009 TCEQ study, the 2009 TCEQ guidance, and the 2009 TCEQ APDG 5942. Specifically,
we anticipate that working and breathing losses will be calculated with EPA TANKS, and
flashing losses will be calculated using process simulator models, the E&P TANK program,

A-38
GRI-HAPCalc, or the GOR method, using the average VOC content of wellhead gas, obtained
from a gas composition analyses, the API gravity of oil, and the gas-oil ratio, as data is available.
Emission factors developed using these approaches will be assigned to the counties within their
respective regions and will be multiplied by county-specific production data obtained from the
TRC to derive county-specific emission estimates. Data on operating temperature and pressure
will be collected via survey and emissions will be adjusted for the appropriate operating
parameters.
The calculation methodology for oil storage tank emissions at the county level follows Equation
16:
Eoil tank, i, county j = EFoil, i, county j x Poil, county j x (1 – 0.98 Cvru – 0.95 Cflare) Equation (16)
where:
Eoil tank, i, county j is the emissions of pollutant i from oil storage tanks in county j [tons/year]
EFoil, i, county j is the emission factor for pollutant i from oil storage tanks in county j
[tons/MSCF]
Poil, county j is the production of oil in county j [MSCF/year]
Cvru is the fraction of oil production in county j controlled by VRUs
Cflare is the fraction of oil production in county j controlled by flares
The calculation methodology for condensate storage tank emissions at the county level follows
Equation 17:
Econdensate tank, i, county j = EFcondensate, i, county j x Pcondensate, county j x (1 – 0.98 Cvru – 0.95 Cflare)
Equation (17)
where:
Econdensate tank, i, county j is the emissions of pollutant i from oil storage tanks in county j
[tons/year]
EFcondensate, i, county j is the emission factor for pollutant i from oil storage tanks in county j
[tons/MSCF]
Pcondensate, county j is the production of oil in county j [MSCF/year]
Cvru is the fraction of condensate production in county j controlled by VRUs
Cflare is the fraction of condensate production in county j controlled by flares
Emission factors, EFoil, i, county j, EFcondensate, i, county j:
The 2009 TERC study developed emission factors for oil and condensate storage tanks in the
East Texas region. ERG will use these emission factors in developing emissions estimates for
the counties covered by these studies. For the remainder of Texas, ERG will attempt to obtain
county-level data on the properties of oil and condensate produced to develop emission factors
for oil and condensate storage tanks using process simulation models or other emissions
estimation models as outlined above. Depending on the amount of data collected, averages may
be determined at the county level, the TRC District level, the basin level, or state-wide.

A-39
Production of oil and condensate Poil, county j, Pcondensate, county j
ERG will obtain county level data on the production of oil and condensate from the TRC.
Fraction of storage tanks controlled by flares, Cflare and the fraction of storage tanks controlled
by VRUs, Cvru:
ERG will attempt to obtain estimates for the number of storage tanks controlled by flares or
VRUs either by conducting a survey of oil and gas producers, or from existing data from the
TRC. Depending on the amount of data collected, averages may be determined at the county
level, the TRC District level, the basin level, or state-wide.
3.9.4 Data Needs
In order to implement the preferred emission estimation approach, county-level data on monthly
oil and condensate production data, monthly average temperature data, the frequency of oil and
condensate tank unloading operations, and oil and gas composition/speciation profiles are
needed. ERG will collect survey data on the number, size, configuration and usage of tanks at
oil wells and gas wells, along with production data matched to those sites, so that averages for
tank volume relative to production rate can be determined. ERG will collect data on oil and
condensate production data using the most recently available database from the TRC. ERG will
attempt to collect all other data items by conducting a survey of oil and gas producers owning
active wells in the Texas counties covered in this emissions inventory development effort.
3.10 Oil and Condensate Loading Racks
Oil and condensate stored in field storage tanks is transferred to trucks and railcars and shipped
to refineries for further processing. Fugitive VOC emissions are released from these loading
processes as the vapors in the receiving vessel are displaced by the liquids from the storage
tanks. These vapors are normally vented to the atmosphere.
3.10.1 Literature Review
ERG conducted a literature review to obtain information on established methodologies to
estimate the atmospheric release of pollutants from oil and condensate loading racks. The
relevant sources reviewed are listed in Table 3.10.
Table 3.10 Oil and Gas Exploration Emissions Studies
Report Title Geographic
Coverage
Publication
Date
Emissions from Oil and Gas Production Facilities (TCEQ, 2007) Texas August,
2007
WRAP Area Source Emissions Inventory Projections and Control
Strategy Evaluation Phase II (Bar-Ilan, et al. 2007) Western States
September,
2007
Development of Baseline 2006 Emissions from Oil and Gas
Activity in the South San Juan Basin (Bar-Ilan, et al., 2009b) New Mexico
November,
2009

A-40
3.10.2 Emission Estimation Approaches
The August 2007 TCEQ report “Emissions from Oil and Gas Production Facilities” (TCEQ,
2007) and the November 2009 report “Development of Baseline 2006 Emissions from Oil and
Gas Activity in the South San Juan Basin” (Bar-Ilan, et al., 2009b) included a production-based
emissions methodology for oil and condensate loading. Both of these studies estimated
uncontrolled VOC emissions from oil and condensate loading using the AP-42 loading equation.
In the 2007 TCEQ study, the true vapor pressure of oil and condensate was determined by using
average temperature data for each county in Texas and temperature-dependent vapor pressures of
crude oil from AP-42. Temperature data from 87 weather stations throughout Texas were
obtained and isotherms were developed to estimate average annual temperatures for each county
in Texas. These temperatures determined both the true vapor pressure using AP-42 data and the
average temperature of the bulk liquid (T). The molecular weight of tank vapors was assumed
constant and equal to AP-42 data for crude oil (50 lb/lb-mole) and gasoline (RVP 7) (68 lb/lb-
mole) at 60 degrees F for oil and condensate, respectively. The gasoline value was used for
condensate since no specific number for condensate was available. The type of loading
operation was assumed to be submerged loading with a dedicated vapor balance.
The AP-42 equation to calculate temperature-dependent emission factors for loadout losses
generates an emission factor based on the amount of liquid loaded. The calculated emission
factors were applied to the amount of oil and condensate produced in each county, which was
obtained from data provided by the TRC.
The reviewed literature also addressed the effect of storage tank control technologies on
emissions. These technologies could be adapted to control emissions from storage tank
unloading. The 2007 WRAP Phase II study “WRAP Area Source Emissions Inventory
Projections and Control Strategy Evaluation Phase II” (Bar-Ilan, et al. 2007) estimated that VOC
and HAP emissions could be reduced by 98% through the use of VRUs. The US EPA, in AP-42,
Chapter 13.5 (Industrial Flares), estimates that control of waste VOC via flaring would control
VOC by a minimum of 98%.
3.10.3 Preferred Emission Estimation Approach
ERG will use the methodology in the 2007 TCEQ study and the 2009 WRAP Phase III study.
AP-42 emission factors for loading losses will be calculated at the county level. These emission
factors will be multiplied by county-specific production data obtained from the TRC to derive
county-specific emission estimates. This methodology requires oil and condensate production
data, data on the composition and RVP of the oil and condensate produced, and monthly
temperature data for the counties in which the oil and condensate are produced. Survey data will
be gathered on the number of sites in the county that use VRUs or flares to control loading
emissions. These data will be used to account for emissions controlled by VRUs or flares.
The AP-42 equation to calculate loading emission factors is shown in Equation 18:
LLoil, condensate, county j = 12.46 x S x P x M / Tcounty j Equation (18)
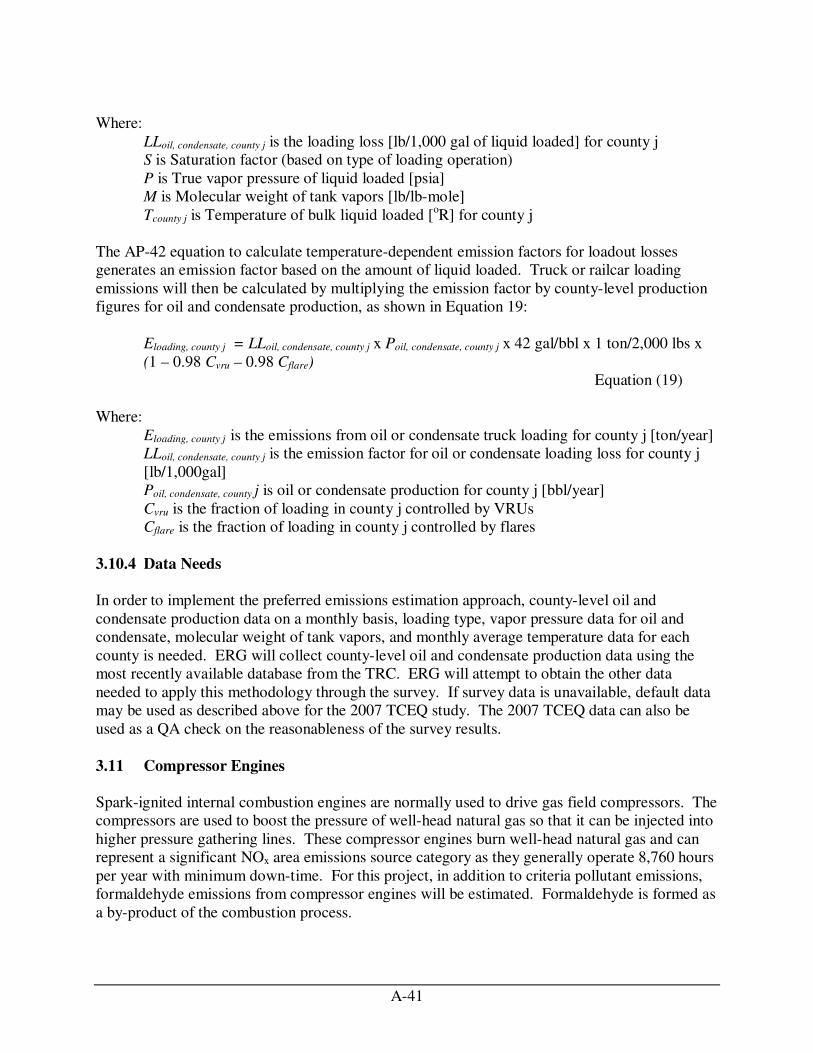
A-41
Where:
LLoil, condensate, county j is the loading loss [lb/1,000 gal of liquid loaded] for county j
S is Saturation factor (based on type of loading operation)
P is True vapor pressure of liquid loaded [psia]
M is Molecular weight of tank vapors [lb/lb-mole]
Tcounty j is Temperature of bulk liquid loaded [oR] for county j
The AP-42 equation to calculate temperature-dependent emission factors for loadout losses
generates an emission factor based on the amount of liquid loaded. Truck or railcar loading
emissions will then be calculated by multiplying the emission factor by county-level production
figures for oil and condensate production, as shown in Equation 19:
Eloading, county j = LLoil, condensate, county j x Poil, condensate, county j x 42 gal/bbl x 1 ton/2,000 lbs x
(1 – 0.98 Cvru – 0.98 Cflare)
Equation (19)
Where:
Eloading, county j is the emissions from oil or condensate truck loading for county j [ton/year]
LLoil, condensate, county j is the emission factor for oil or condensate loading loss for county j
[lb/1,000gal]
Poil, condensate, county j is oil or condensate production for county j [bbl/year]
Cvru is the fraction of loading in county j controlled by VRUs
Cflare is the fraction of loading in county j controlled by flares
3.10.4 Data Needs
In order to implement the preferred emissions estimation approach, county-level oil and
condensate production data on a monthly basis, loading type, vapor pressure data for oil and
condensate, molecular weight of tank vapors, and monthly average temperature data for each
county is needed. ERG will collect county-level oil and condensate production data using the
most recently available database from the TRC. ERG will attempt to obtain the other data
needed to apply this methodology through the survey. If survey data is unavailable, default data
may be used as described above for the 2007 TCEQ study. The 2007 TCEQ data can also be
used as a QA check on the reasonableness of the survey results.
3.11 Compressor Engines
Spark-ignited internal combustion engines are normally used to drive gas field compressors. The
compressors are used to boost the pressure of well-head natural gas so that it can be injected into
higher pressure gathering lines. These compressor engines burn well-head natural gas and can
represent a significant NOx area emissions source category as they generally operate 8,760 hours
per year with minimum down-time. For this project, in addition to criteria pollutant emissions,
formaldehyde emissions from compressor engines will be estimated. Formaldehyde is formed as
a by-product of the combustion process.

A-42
3.11.1 Literature Review
ERG conducted a literature review to obtain information on established methodologies to
estimate the atmospheric release of pollutants from compressor engines. The relevant sources
reviewed are listed in Table 3.11.
Table 3.11 Existing Oil and Gas Exploration Emissions Studies Containing Methodologies
for Compressor Engines
Report Title Geographic
Coverage Publication Date
Tyler/Longview/Marshall Flexible Attainment Region Emission Inventory of Ozone Precursors
VOC, NOx and CO (Pollution Solutions, 2005)
Tyler, Longview,
Marshall
area, Texas
February, 2005
Natural Gas Compressor Engine Survey and Engine NOx Emissions at Gas Production
Facilities (HARC, 2005)
Eastern Portion of
Texas August, 2005
Ozone Precursors Emission Inventory for San Juan and Rio Arriba Counties, New Mexico (Pollack, et al., 2006)
San Juan and Rio Arriba Counties,
New Mexico
August, 2006
Natural Gas Compressor Engine Survey
for Gas Production and Processing
Facilities (Burklin and Heaney, 2006)
Eastern Portion of
Texas October, 2006
Emissions from Oil and Gas Production Facilities (TCEQ, 2007)
Texas August, 2007
Special Study Relating to Oil and Gas Production: 2005 and 2007 Emissions from
Compressor Engines with Consideration for Load
Factor (Pollution Solutions, 2008)
Tyler, Longview,
Marshall
area, Texas
August, 2008
Recommendations for Improvements to the CENRAP States’ Oil and Gas Emissions
Inventories (Bar-Ilan, et al., 2008)
CENRAP States
November, 2008
2008 Southeast Texas Compressor Engines and Dehydrators Survey (TCEQ, 2009e)
Southeast Texas
Presentation May, 2009
Development of Emissions Inventories for Natural Gas Exploration and Production Activity
in the Haynesville Shale (Grant, et al., 2009)
Northeast Texas and
Northwest Louisiana
August, 2009

A-43
3.11.2 Emission estimation approaches
Of the studies reviewed, the majority take a similar approach in determining emissions from
compressor engines at oil and gas production facilities. These studies typically apply a county
specific emission factor (developed through various survey data) to natural gas production by
county. The specific methodology is discussed in Section 3.11.3.
It should be noted that the CENRAP 2008 report varies from this approach in that it recommends
using well count as a surrogate for scaling wellhead compressor emissions to the basin level.
The report states that gas production estimates may underestimate the number of wellhead
compressors in use. County-level emissions estimates were then derived by allocating basin total
wellhead compressor engine emissions to the county level by the fraction of total basin wells in
each county.
3.11.3 Preferred emission estimation approach
As a preferred method to estimate emissions from natural gas compressor engines, ERG will use
annual natural gas production by county along with survey-generated county-level emission
factors to determine emissions from compressor engines at oil and gas production facilities. The
annual natural gas production by county will be obtained for the year 2008 from the TRC.
County-level emission factors will be calculated using the methodology from the study “Natural
Gas Compressor Engine Survey and Engine NOX Emissions at Gas Production Facilities”
conducted by ERG for the Houston Advanced Research Council (HARC) to generate emission
factors from compressor engines at oil and gas production facilities (HARC, 2005). The HARC
2005 report was updated in 2006 to include more engine size categories and to add the year 2000
to the previous inventory; however, these updates did not change the calculation methodology
used in the original 2005 report.
County-level emission factors will be calculated Equation (19) as provided in the HARC study
reports:
EFijk = F1i x F2j x Ci x Hj x EFjk x 1/2000 Equation (19)
Where:
EFijk is the emission factor for county i, for engine type j, and pollutant k [tons/MSCF]
F1i is the fraction of wells requiring compression in county i
F2j is the fraction of compression load represented by engines of type j
Ci is the compression requirements for county i [hp-hr/MSCF]
Hj is the brake specific fuel consumption for engine type j [MMBtu/hp-hr]
EFjk is the emission factor for engine type j, and pollutant k [lb/MMBtu]
The data needed to implement this approach is discussed below.

A-44
Fraction of wells requiring compression in county i, F1i:
The HARC studies (HARC, 2005 and 2006) assumed the fraction of wells requiring compression
is equal to the fraction of wells greater than one year old. As 2008 is the base year for this study
and was an unusually active year in Texas for well drilling, ERG will attempt to verify this
assumption by contacting experts in the field by phone as well as through a survey questionnaire.
Although the fraction of wells greater than one year old was relatively constant in the three
districts examined by the HARC studies, ERG will re-calculate an average fraction across the
entire state using data from all twelve TRC districts for 2008. The number of wells completed
each year and the total number of operating wells by district are available from the TRC.
Fraction of compression load represented by engines of type j, F2j:
While the initial report (HARC, 2005) focused on engines less than 500 horsepower (hp), the
follow-up report (HARC, 2006) included engines greater than 500 hp and also provided a more
detailed breakdown of engines less than 500 hp. ERG will attempt to update the distribution of
engine types through a new survey questionnaire. In addition, ERG will combine engine data
from the two 2007 TCEQ engine surveys conducted on the counties located in the Dallas -Forth
Worth (D-FW) metropolitan area and Southeast Texas. These TCEQ surveys were completed as
efforts to amend the state clean air plan for ozone. Engine operators reported engine counts,
engine sizes, NOX emissions, and other data to TCEQ. If insufficient data are available through
the D-FW and Southeast Texas surveys, ERG may default to the distribution of engine types
presented in the follow-up HARC report and TCEQ surveys to estimate the fractions of various
engine types in attainment and nonattainment areas of Texas.
Compression Requirements for county i, Ci:
A compressor's operating behavior is generally dependent on the relationship between pressure
ratio and volume or mass flow rate. In particular, the operating behavior for a compressor engine
located at an oil and gas well is based on the compressor suction and discharge pressures
required to convey the natural gas from the well head to the gathering lines. These pressures, or
the compression ratio, along with the natural gas flow-rate through the compressor, define the
engine load in terms of the amount of mechanical work that is required to compress the natural
gas produced by the well. This mechanical work (hp-hr) is directly proportional to the volume of
fuel (MSCF) that must be burned by the compressor engine and the relationship is termed a
compression requirement (hp-hr/MSCF). Special compressor calculators can be used to convert
inlet and outlet pressures into compression requirements which can then be used to determine
emissions created by compressor engines. Because of this direct relationship of mechanical
work to volume of fuel burned, one would expect a 100 Hp engine to burn almost an equal
amount of fuel as two (2) 50 Hp engines when compressing the same volume of natural gas
produced by the same well. Therefore, it is not necessary to know the specific numbers of
engines, or their individual sizes when calculating emissions from compressors at the county
level.
In spite of this observable fact, all natural gas compressors have a maximum rating and most of
them deliver less natural gas than their maximum rating. In a 2002 emissions inventory
(Pollution Solutions, 2005) entitled "Tyler/Longview/Marshall Flexible Attainment Region
Emission Inventory", the author developed a compression requirement (hp-day/MSCF) through
survey data assuming the compressor engines were operating under full load or maximum

A-45
installed horsepower. This assumption caused an overestimation of the amount of fuel that was
consumed by the compressor engines and consequently overestimated the amount of emissions
from these engines. A more recent study by Pollution Solutions (2008) entitled "2005 and 2007
Compressor Engine Emissions and Load Factors Report" determined average load factors for
three engine categories, all of which were less than 100%. For engines less than 240 hp, the load
factor was 70%. For engines between 240-500 hp, the load factor was 69%. For engines greater
than 500 hp, the load factor was 58%. These engine load factors were applied to the previous
study (Pollution Solutions, 2005) in order to determine more accurate emissions estimates for
compressor engines located in Panola County as well as the five NETAC counties.
The 2005 HARC report developed compression requirements ranging between 3.1 and 3.5 Hp-
hr/MSCF for three distinct districts in eastern Texas, including one attainment area and two
nonattainment areas (Houston and Dallas) by obtaining typical well pressures and gathering line
pressures through a field study. The engines in this particular field survey were operated at loads
ranging from about 10% to 70% of full load, and averaged 40% load. Additionally, compression
requirements that can be deduced from the 2008 Pollution Solutions study are relatively in-line
with the compression requirements used in the 2005 HARC report. More specifically, the 191
Hp-day/MSCF compression requirement used in the 2005 Pollutions Solutions study, when
adjusted for the load factors from the 2008 Pollutions Solutions study, yield compression
requirements between 4.5 to 5.5 Hp-hr/MSCF. Additionally, TCEQ determined through a 2007
TCEQ engine survey (conducted on the counties located in the D-FW metropolitan area) a
compression requirement of 226 Hp-day/MMcf for area source compressor engines outside the
D-FW metropolitan area. This value equates to approximately 5.4 Hp-hr/MSCF which is also in
agreement with previous studies mentioned.
ERG will attempt to develop 2008 compression requirements through a new survey
questionnaire that would aim to collect typical well pressures and gathering line pressures, as
well as engine load factors. As mentioned previously, the compression requirements developed
for the 2005 HARC study, the 2008 Pollution Solutions study, and the 2007 TCEQ engine D-FW
metropolitan survey were all relatively consistent. ERG may default to and apply an average of
these factors to the entire state in both attainment and nonattainment areas if insufficient data is
obtained through the survey effort.
Brake specific fuel consumption for engine type j, Hj:
The HARC studies (HARC, 2005 and 2006) determined brake specific fuel consumption for the
most common engine model of each engine category using engine model distributions provided
by engine leasing companies. ERG will develop updated representative engine models using data
gathered through a survey questionnaire. In addition, ERG will use the engine data from the two
2007 TCEQ engine surveys conducted on the counties located in the D-FW metropolitan area
and Southeast Texas, and may use the 2005 and 2006 HARC data as well.
Emission factor for engine type j, and pollutant k, EFjk:
As noted in the 2008 CENRAP study, there are two distinct types of compressor engines used to
boost the pressure of well-head natural gas: “rich-burn” engines that are characterized by NOx
emissions factors in the range of approximately 10 – 20 g/bhp-hr; and “lean-burn” engines that
are characterized by NOx emissions factors in the range of approximately 1.0 – 5.0 g/bhp-hr. The
A-46
exact NOx emissions factors depend on the horsepower, make and model, and model year of the
engine, and whether the engine has been converted from a rich-burn to a lean-burn engine.
Many of the compressor engine emission factors used in the 2008 CENRAP study came from a
2006 study entitled: "Ozone Precursors Emission Inventory for San Juan and Rio Arriba
Counties, New Mexico" (Pollack, et al., 2006). This particular study contained an extensive
database of emissions factors for a range of well-head compressor engine makes and models.
From this database, average rich-burn and lean-burn engine emissions factors for NOx, VOC,
CO, and SO2 were derived. PM10, CO2, and CH4 emission factors were obtained from AP-42. It
should be noted that all pollutant and engine-specific emission factors used in the 2005/2006
HARC studies were taken from AP-42.
For this study, ERG will attempt to develop improved emission factors (especially for NOx and
formaldehyde emissions) using data gathered through a survey questionnaire in order to estimate
pollutant emissions from each engine type based on the county-by-county breakdown of engine
use described above. In addition to new survey data, ERG will use the engine data from the two
2007 TCEQ engine surveys conducted on the counties located in the D-FW metropolitan area
and Southeast Texas; as well as the data from the 2006 New Mexico study. If insufficient data
is collected through the survey effort, ERG may default to and apply the average rich-burn and
lean-burn engine emissions factors used in the 2006 New Mexico study, or AP-42 emission
factors.
ERG has not found any studies using a different formaldehyde emission factor than provided in
EPA's AP-42 document (July 2000) entitled "Natural Gas-fired Reciprocating Engines". AP-42
presents Formaldehyde emission factors for 2-stroke lean burn engines, 4-stroke lean burn
engines, and 4-stroke rich burn engines. All the AP-42 formaldehyde emission factors have an
"A" rating.
3.11.4 Data Needs
In order to implement the preferred emission estimation approach, the gas production in each
county is needed. ERG will collect data on throughput per county using the most recently
available database from the TRC. This activity data when applied to the different factors
mentioned in Section 3.11.3 above, will allow ERG to estimate county-level emissions from
compressor engines.
3.12 Turbines
Turbines are used in the oil and gas industry to compress gas or to generate electricity. In the gas
industry they tend to be used in processing and transmission rather than gathering applications
(CAPP, 2004). Compressors driven by turbines may be found at midstream oil and gas facilities
such as large pipeline compressor stations, gas storage facilities, or gas processing plants.
Turbines may also be utilized in some smaller upstream applications to assist in the transfer of
gas produced in the field from multiple or individual well sites or gas gathering plants to
midstream facilities. However, some of these applications (at the well or gas gathering plant
level) are usually handled by reciprocating internal combustion engines, which are covered in

A-47
Section 3.11 of this memo. Most midstream facilities utilizing natural gas-fired turbines are
assumed to be permitted and included in the inventory as major point sources. Turbines used in
the oil and gas industry burn natural gas and can represent a significant source of NOx emissions,
in addition to other combustion-related pollutants.
In remote locations such as offshore platforms or oil and gas fields where electricity off the grid
is not readily available, gas turbines may be used in a combined heat and power (CHP)
application to drive generators for electricity and to provide heat in buildings and crew quarters.
3.12.1 Literature Review
ERG conducted a literature review to obtain information on established methodologies to
estimate the atmospheric release of pollutants from turbines. The relevant sources reviewed are
listed in Table 3.12.
Table 3.12 Existing Oil and Gas Exploration Emissions Studies Containing Methodologies
for Turbines
Report Title Geographic
Coverage Publication Date
Emissions from Oil and Gas Production Facilities (TCEQ, 2007)
Texas August, 2007
Development of Baseline 2006 Emissions from Oil and Gas Activity in the Uinta Basin (Friesen,
et al., 2009)
Uinta Basin, Utah
March , 2009
3.12.2 Emission estimation approaches
The reviewed literature did not provide any sources that explicitly included gas-fired turbines as
an area source emissions source.
The study “Development of baseline 2006 Emissions From Oil and Gas Activity in the Unita
Basin” (Friesen, et al., 2009) included one compressor station that was defined as a turbine as
part of the point source inventory. The data for this point source was provided directly by the
State of Utah.
The study “Emissions from Oil and Gas Production Facilities” (TCEQ, 2007) included emission
from turbines located at offshore platforms as obtained from the Minerals Management Service
(MMS). The study did not estimate emissions from onshore turbines.
3.12.3 Preferred emission estimation approach
At this point, it is unknown whether turbines will be found at locations other than point sources
already included in the State of Texas Air Reporting System (STARS) emissions inventory.
There are no existing studies that present approaches for estimating area sources emissions from
turbines used in oil and gas upstream production sources, but there are AP-42 emission factors

A-48
that could be used if it is discovered that there are turbines not counted in the point source
inventory.
3.12.4 Data Needs
As part of the survey efforts, ERG will include questions pertaining to turbine usage in gas field
applications at the well level and at gas gathering and processing stations. As any smaller
turbines (those not already included in the point source inventory) would be used for the same
purposes as compressor engines, the target recipients of the survey would be identical. Based on
the findings of the HARC “Natural Gas Compressor Engine Survey for Gas Production and
Processing Facilities” study (HARC, 2006), there are very few engines used in gas field
compressor applications approaching the size of the smallest turbines (approximately 1,500 hp).
ERG will coordinate inclusion of turbines in this area source inventory with TCEQ if it is
determined that there are turbines unaccounted for in the point source inventory.
4.0 References
Bar-Ilan, Amnon; Grant, John; Parikh, Rajashi; Pollack, Alison; Henderer, Doug; Pring, Daniel;
and Sgamma, Kathleen, 2009a. Development of Baseline 2006 Emissions from Oil and Gas
Activity in the Piceance Basin. Prepared for the Western Governor’s Association and the
Independent Petroleum Association of Mountain States. January, 2009.
Bar-Ilan, Amnon; Grant, John; Parikh, Rajashi; Pollack, Alison; Henderer, Doug; Pring, Daniel;
and Sgamma, Kathleen, 2009b. Development of Baseline 2006 Emissions from Oil and Gas
Activity in the South San Juan Basin. Prepared for the Western Regional Air Partnership and the
Independent Petroleum Association of Mountain States. November, 2009.
Bar-Ilan, Amnon; Parikh, Rajashi; Grant, John; Shah, Tejas; and Pollack, Alison, 2008.
Recommendations for Improvements to the CENRAP States’ Oil and Gas Emissions Inventories.
Prepared for Central States Regional Air Partnership. November, 2008
Bar-Ilan, Amnon; Friesen, Ron; Pollack, Alison; and Hoats, Abigail, 2007. WRAP Area Source
Emissions Inventory Projections and Control Strategy Evaluation Phase II. Prepared for the
Western Governor’s Association. September, 2007.
Canadian Association of Petroleum Producers (CAPP), September 2004. A National Inventory
of Greenhouse Gas (GHG), Criteria Air Contaminant (CAC) and Hydrogen Sulfide (H2S)
Emissions by the Upstream Oil and Gas Industry, Volume 3, Methodology for Greenhouse
Gases.
EPA, 2005. “User’s Guide for the Final NONROAD2005 Model,” U.S. Environmental
Protection Agency, Research Triangle Park, NC, 2005. EPA420-R-05-013.
Friesen, John; Parikh, Rajashi; Grant, John; Bar-Ilan, Amnon; Pollack, Alison; Henderer, Doug;
Pring, Daniel; Sgamma, Kathleen; and Schlagel, Phil, 2009. Development of Baseline 2006

A-49
Emissions from Oil and Gas Activity in the Uinta Basin. Prepared for the Western Governor’s
Association and the Independent Petroleum Association of Mountain States. March, 2009.
Grant, John; Parker, Lynsey; Bar-Ilan, Amnon; Kemball-Cook, Sue; Yarwood, Greg.
Development of Emissions Inventories for Natural Gas Exploration and Production Activities in
the Haynesville Shale. Prepared for The East Texas Council of Governments. August 2009.
Houston Advanced Research Center (HARC), 2005. Natural Gas Compressor Engine Survey and
Engine NOX Emissions at Gas Production Facilities. Prepared by Eastern Research Group, Inc.
August 31, 2005.
Houston Advanced Research Center (HARC), 2006. Natural Gas Compressor Engine Survey for
Gas Production and Processing Facilities. Prepared by Eastern Research Group, Inc. October 5,
2006.
Oklahoma Department of Environmental Quality (ODEQ), July 2004. Calculation of Flashing
Losses/VOC Emissions from Hydrocarbon Storage Tanks. Internet Address:
http://www.deq.state.ok.us/factsheets/air/CalculationLosses.pdf
Pollack, Alison; Russell, James; Grant, John; Friesen, Ron; Fields, Paula; and Wolf, Marty,
2006. Ozone Precursors Emission Inventory for San Juan and Rio Arriba Counties, New Mexico.
Prepared for New Mexico Environment Department. August, 2006.
Pollution Solutions, 2005. “Tyler/Longview/Marshall Flexible Attainment Region Emission
Inventory of Ozone Precursors VOC, NOx and CO,” Prepared for Northeast Texas Air Care.
February, 2005.
Pollution Solutions, 2007. “Special Study Relating to Oil and Gas Production: 2005 and 2007
Emissions from Compressor Engines with Consideration for Load Factor" Final report prepared
for the East Texas Council of Governments, Kilgore, TX.
Russell, James and Pollack, Alison, 2005. Oil and Gas Emissions Inventories for the Western
States. Prepared for Western Governor’s Association. December, 2005.
Texas Commission on Environmental Quality (TCEQ), 2007. Emissions from Oil and Gas
Production Facilities, 2007. Prepared by Eastern Research Group, Inc. August 31, 2007.
Texas Commission on Environmental Quality (TCEQ), 2009a. 2009 Emissions Inventory
Guidelines: Appendix A: Technical Supplement 6: Above Ground Liquid Storage Tanks. Texas
Commission on Environmental Quality, TCEQ Publication RG-360A/09. January 2009.
Texas Commission on Environmental Quality (TCEQ), 2009b. Upstream Oil and Gas Storage
Tank Project Flash Emissions Models Evaluation. July, 2009.

A-50
Texas Commission on Environmental Quality (TCEQ), 2009c. Calculating Volatile Organic
Compounds (VOC) Flash Emissions from Crude Oil and Condensate Tanks at Oil and Gas
Production Sites (APDG 5942), 2009. September, 2009.
Texas Commission on Environmental Quality (TCEQ), 2009d. Flash Emissions Model
Evaluation Quantifying Volatile Organic Compound Emissions from Upstream Oil and Gas
Storage Tanks, 2009. Slide Presentation by Danielle Nesvacil, John Jolly, and Russ Nettles
(TCEQ) and Butch Gidney and Stephen Pena (Hy-Bon Engineering). October 2009.
Texas Environmental Research Consortium (TERC), October 2006, revised April 2009. VOC
Emissions from Oil and Condensate Storage Tanks.

A-51
APPENDIX A
LIST OF ACRONYMS/ABBREVIATIONS
API American Petroleum Institute
BTEX Benzene, Toluene, Ethylbenzene, and Xylene
CAPP Canadian Association of Petroleum Producers
CenRAP Central States Regional Air Partnership
CO Carbon Monoxide
DOE U.S. Department of Energy
ERG Eastern Research Group, Inc.
GOR Gas-to-Oil Ratio
GPA Gas Processors Association
GRI Gas Research Institute
HAP Hazardous Air Pollutant
HARC Houston Advanced Research Center
hp Horsepower
H2S Hydrogen Sulfide
IPMAS Independent Petroleum Association of Mountain States
LPG Liquefied Petroleum Gas
MMS Minerals Management Service
MMSCF Million Standard Cubic Feet
MMSCFD Million Standard Cubic Feet Per Day
MSCF Thousand Standard Cubic Feet
MW Molecular Weight
NETAC Northeast Texas Air Care
NIF National Emissions Inventory Input Format
NOx Nitrogen Oxides
PM10 Particulate Matter that has particle diameter less than 10 micrometers
PM2.5 Particulate Matter that has particle diameter less than 2.5 micrometers
QA Quality Assurance
SCC Source Classification Code
SCF Standard Cubic Feet
SO2 Sulfur Dioxide
STARS State of Texas Air Reporting System
STP Standard Temperature and Pressure
TCEQ Texas Commission on Environmental Quality
TexAER Texas Air Emissions Repository
TRC Texas Railroad Commission
US EPA United States Environmental Protection Agency
VOC Volatile Organic Compounds
VRU Vapor Recovery Unit
WRAP Western Regional Air Partnership
WYDEQ Wyoming Department of Environmental Quality
Appendix B – Task 3 Memorandum

B-1
TECHNICAL MEMORANDUM Date: July 9, 2010
To: Martha Maldonado
Project Representative
Texas Commission on Environmental Quality (TCEQ)
From: Mike Pring, Eastern Research Group, Inc. (ERG)
Daryl Hudson (ERG)
Jason Renzaglia (ERG)
Brandon Smith (ERG)
Stephen Treimel (ERG)
Re: Oil and Gas Sources Inventory – Final Technical Memorandum for Task 3
TCEQ Contract No. 582-7-84003, Work Order No. 582-7-84003-FY10-26
1.0 Introduction
The purpose of this Work Order is to develop a 2008 base year air emissions inventory from
upstream onshore oil and gas production sites for select counties in Texas. The inventory will
address area source criteria pollutant emissions of volatile organic compounds (VOC), nitrogen
oxides (NOX), carbon monoxide (CO), particulate matter with an aerodynamic diameter less than
or equal to 10 microns (PM10), particulate matter with an aerodynamic diameter less than or equal
to 2.5 microns (PM2.5), and sulfur dioxide (SO2); and certain toxic pollutant emissions such as
formaldehyde from compressor engines, and benzene, toluene, ethylbenzene, and xylene from
dehydrators. In addition to compiling the emissions inventory, other goals of this Work Order
are to identify the emission source types operating at oil and gas production sites, identify the
best emissions determination methodology for each emission source type, develop a
methodology for estimating emissions from oil and gas production sites based on the oil and gas
produced at the county level, and identify the producers of oil and gas for each county.
This Work Order builds on two previous studies ERG conducted for TCEQ to estimate emissions
from oil and gas exploration and production activities. The first, implemented in 2007,
focused on compiling a state-wide emissions inventory (including both onshore and offshore
sources) for oil and gas exploration and production for a 2005 base year (ERG, 2007). The
second study, conducted in 2009 for a 2008 base year, focused only on emissions from onshore
oil and gas well drilling rig engines (ERG, 2009). Both of these studies included emission
estimates for every county in Texas. In contrast, this current study will only address onshore
area sources (those not included in the Texas point source inventory), and does not address
drilling rig engines. TCEQ is also currently developing an emissions inventory for offshore oil
and gas platforms under TCEQ Work Order No. 582-07-84003-FY10-25.

B-2
The onshore area source project is divided into four primary technical work tasks:
• Identification and review of existing studies pertaining to estimating emissions from oil
and gas production sites and recommendation of an emission estimation approach for
each identified source type;
• Identification of oil and gas well operators and preparation of draft survey materials,
including obtaining data from existing studies and databases;
• Development of a methodology to estimate county-level emissions from each identified
source type; and
• Development of a 2008 base year emissions inventory, including collection of activity
and emissions data (as available), the preparation of emissions inventory calculation
spreadsheets (including activity data and emission factors) and documentation of data,
procedures, and results in a final project report. The final emissions inventory will be
compiled into National Emissions Inventory Input Format (NIF) 3.0 text files for import
into Texas Air Emissions Repository (TexAER).
The purpose of this memo is to document the methodology ERG will use to identify the owners
and/or operators of oil and gas production sites, and to provide TCEQ with draft survey
materials. Additionally, the methodology used to develop the draft survey materials are
provided. In the project Work Plan, this work is referred to as Task 3.
This discussion begins by presenting the references and datasets that were used to identify oil
and gas production sites owners and operators in Section 2.0. Section 3.0 presents example draft
survey forms, the process used to develop these, with the forms and instructions for each source
type provided in Attachment B.
County-level, area source emission estimates will be developed based on county-level oil and gas
production data (total oil and gas produced in each county in 2008).
2.0 Identification of Oil and Gas Owners and Operators
This task targets identification of Oil and Gas Area Source operators who were active in Texas in
2008. A list of candidate owners and operators were obtained from multiple sources as follows:
• Texas Railroad Commission (RRC) and RigData® - ERG obtained data from the RRC for
all oil and gas wells drilled in Texas in 2008. This database contains over 18,500 records
for wells where drilling occurred in 2008. In addition, ERG obtained the RigData®
database (a commercial database) in 2009 as part of the “Drilling Rig Emission Inventory
for the State of Texas” project conducted for TCEQ. In addition to drilling contractor
data, this database also contains owner and operator contact information (Company
Name, Company Contact Name, and Company Contact Mailing Address) for over 24,000
wells. The combined data for these 2 datasets is included in Attachment A as “Drilling
Data 2008 Contact Directory.xls”.
• TCEQ Permit Data – TCEQ provided contact information for approximately 9,000
regulated entities registered with TCEQ pursuant to Standard Permit pursuant to 116.620
(Installation and/or Modification of Oil and Gas Facilities). This database contains
B-3
owner and operator contact information (Company Name, Company Contact Name,
Company Contact Mailing Address, Company Contact Title, and Company Contact E-
mail address for some sources). It is assumed that many of these sources are not
currently required to report their air emissions to TCEQ under TAC 101.10(a)(1-3). This
data is included in Attachment A as “Standard Permit 116.620 Contact Directory.xls”.
• Texas Railroad Commission (RRC) Oil & Gas Directory - Operator Contact Information
– This data was obtained directly from the RRC and includes a listing of entities
registered with the Commission's Oil and Gas Division by name, including address and
telephone number. The listing includes all operators with Active status on Commission
organization records, as well as those with "Delinquent" status (indicating that they still
have activity, but have not updated their organizational registration). The listing does not
include those with "Inactive" status (indicating no activity and no current registration).
This data was obtained from
(http://www.rrc.state.tx.us/data/operators/ogdirectory/index.php) on April 28, 2010 and is
included in Attachment A as “TRC Oil and Gas Contact Directory.xls”.
These databases were imported into MS Access for easy querying for duplicates and to QA
addresses and contact information. The final datasets of contact information are included in
Attachment A.
3.0 Survey Forms
As TCEQ may wish to conduct a state-wide survey of oil and gas owners and operators in the
future in order to refine the emissions inventory, survey forms were prepared for Artificial Lift
Engines, Compressor Engines, Dehydrators, Equipment Leaks, Heaters, Loading Racks,
Pneumatic Devices, Storage Tanks, Well Blowdowns, and Well Completions. These forms were
structured such that the information needed to develop more highly-refined emissions estimates
for each source category (at a county-level, using area source approaches) would be obtained.
While obtaining the needed data, other goals in the development of these forms was to make
them as straightforward as possible, to make them universally accessible (through the use of
widely used software found in MS-Office), and to make them consistent with the format and
nomenclature used in TCEQ’s current Barnett Shale study. TCEQ comments on the draft survey
materials have been incorporated into the final survey materials provided herein.
Attachment B presents final survey forms for Artificial Lift Engines, Compressor Engines,
Dehydrators, Equipment Leaks, Heaters, Loading Racks, Pneumatic Devices, Storage Tanks,
Well Blowdowns, and Well Completions.

B-4
ATTACHMENT A
(See files “Standard Permit 116.620 Contact Directory.xls”, “TRC Oil and Gas Contact
Directory.xls”, and “Drilling Data 2008 Contact Directory.xls”)
B-5
ATTACHMENT B
Draft Survey Packages
(See files “Artificial Lift Engine Survey.xls”, “Compressor Engine Survey.xls”, “Dehydrator
Survey.xls”, “Equipment Leaks Survey.xls”, “Heater Survey.xls”, “Loading Rack Survey.xls”,
“Pneumatic Device Survey.xls”, “Storage Tank Survey.xls”, “Well Blowdown Survey.xls”, and
“Well Completion Survey.xls”)

Appendix C - VOC and PM HAP Speciation Data

C-1
Appendix C. HAP Factors
Source Category Fuel Type Pollutant Emission Factors
Emission
Factor Unit % HAP Emission Factor Source
Pump Jack Natural Gas VOC 0.11259434 lb/MMBtu
Pump Jack Natural Gas Acetaldehyde 2.79E-03 lb/MMBtu 2.48E+00 AP-42, Section 3.2 (U.S. EPA 2002)
Pump Jack Natural Gas Acrolein 2.63E-03 lb/MMBtu 2.34E+00 AP-42, Section 3.2 (U.S. EPA 2002)
Pump Jack Natural Gas Benzene 1.58E-03 lb/MMBtu 1.40E+00 AP-42, Section 3.2 (U.S. EPA 2002)
Pump Jack Natural Gas 1,3-Butadiene 6.63E-04 lb/MMBtu 5.89E-01 AP-42, Section 3.2 (U.S. EPA 2002)
Pump Jack Natural Gas Carbon Tetrachloride* 1.77E-05 lb/MMBtu 1.57E-02 AP-42, Section 3.2 (U.S. EPA 2002)
Pump Jack Natural Gas Chlorobenzene* 1.29E-05 lb/MMBtu 1.15E-02 AP-42, Section 3.2 (U.S. EPA 2002)
Pump Jack Natural Gas Chloroform* 1.37E-05 lb/MMBtu 1.22E-02 AP-42, Section 3.2 (U.S. EPA 2002)
Pump Jack Natural Gas Dichlorobenzene 1.20E-03 lb/MMBtu 1.07E+00 AP-42, Section 3.2 (U.S. EPA 2002) Natural Gas Combustion
Pump Jack Natural Gas 1,3-Dichloropropene* 1.27E-05 lb/MMBtu 1.13E-02 AP-42, Section 3.2 (U.S. EPA 2002)
Pump Jack Natural Gas 7,12-Dimethylbenz(a)anthracene* 1.60E-05 lb/MMBtu 1.42E-02 AP-42, Section 3.2 (U.S. EPA 2002) Natural Gas Combustion
Pump Jack Natural Gas Ethylbenzene* 2.48E-05 lb/MMBtu 2.20E-02 AP-42, Section 3.2 (U.S. EPA 2002)
Pump Jack Natural Gas Ethylene Dibromide* 2.13E-05 lb/MMBtu 1.89E-02 AP-42, Section 3.2 (U.S. EPA 2002)
Pump Jack Natural Gas Formaldehyde 2.05E-02 lb/MMBtu 1.82E+01 AP-42, Section 3.2 (U.S. EPA 2002)
Pump Jack Natural Gas Methanol 3.06E-03 lb/MMBtu 2.72E+00 AP-42, Section 3.2 (U.S. EPA 2002)
Pump Jack Natural Gas Methylene Chloride 4.12E-05 lb/MMBtu 3.66E-02 AP-42, Section 3.2 (U.S. EPA 2002)
Pump Jack Natural Gas 2-Methylnaphthalene 2.40E-05 lb/MMBtu 2.13E-02 AP-42, Section 3.2 (U.S. EPA 2002) Natural Gas Combustion
Pump Jack Natural Gas 3-Methylchloranthrene* 1.80E-06 lb/MMBtu 1.60E-03 AP-42, Section 3.2 (U.S. EPA 2002)
Natural Gas Combustion
Pump Jack Natural Gas Naphthalene* 9.71E-05 lb/MMBtu 8.62E-02 AP-42, Section 3.2 (U.S. EPA 2002)
Pump Jack Natural Gas Propylene 0.016842105 lb/MMBtu 1.50E+01
Air Resources Board. California Environmental Protection Agency. http://www.arb.ca.gov/app/emsinv/catef_form.html
Pump Jack Natural Gas Styrene* 1.19E-05 lb/MMBtu 1.06E-02 AP-42, Section 3.2 (U.S. EPA 2002)
Pump Jack Natural Gas 1,1,2,2-Tetrachloroethane 2.53E-05 lb/MMBtu 2.25E-02 AP-42, Section 3.2 (U.S. EPA 2002)
Pump Jack Natural Gas Toluene 5.58E-04 lb/MMBtu 4.96E-01 AP-42, Section 3.2 (U.S. EPA 2002)
Pump Jack Natural Gas 1,1,2-Trichloroethane* 1.53E-05 lb/MMBtu 1.36E-02 AP-42, Section 3.2 (U.S. EPA 2002)
Pump Jack Natural Gas Vinyl Chloride* 7.18E-06 lb/MMBtu 6.38E-03 AP-42, Section 3.2 (U.S. EPA 2002)
Pump Jack Natural Gas Xylenes (isomers and mixture) 1.95E-04 lb/MMBtu 1.73E-01 AP-42, Section 3.2 (U.S. EPA 2002)
Pump Jack Natural Gas o-Xylenes 0.01 EPA Speciate 4.2 Database
Pump Jack Natural Gas m-Xylenes 0.01 EPA Speciate 4.2 Database
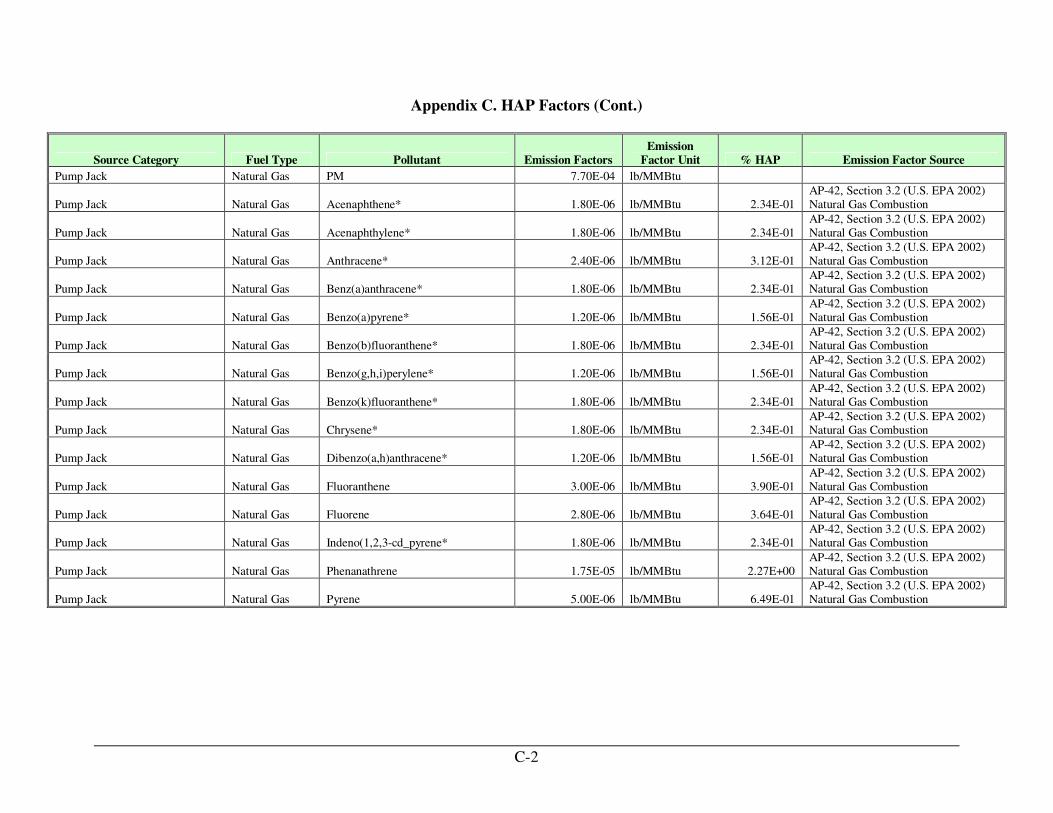
C-2
Appendix C. HAP Factors (Cont.)
Source Category Fuel Type Pollutant Emission Factors
Emission
Factor Unit % HAP Emission Factor Source
Pump Jack Natural Gas PM 7.70E-04 lb/MMBtu
Pump Jack Natural Gas Acenaphthene* 1.80E-06 lb/MMBtu 2.34E-01 AP-42, Section 3.2 (U.S. EPA 2002) Natural Gas Combustion
Pump Jack Natural Gas Acenaphthylene* 1.80E-06 lb/MMBtu 2.34E-01 AP-42, Section 3.2 (U.S. EPA 2002) Natural Gas Combustion
Pump Jack Natural Gas Anthracene* 2.40E-06 lb/MMBtu 3.12E-01 AP-42, Section 3.2 (U.S. EPA 2002) Natural Gas Combustion
Pump Jack Natural Gas Benz(a)anthracene* 1.80E-06 lb/MMBtu 2.34E-01 AP-42, Section 3.2 (U.S. EPA 2002) Natural Gas Combustion
Pump Jack Natural Gas Benzo(a)pyrene* 1.20E-06 lb/MMBtu 1.56E-01 AP-42, Section 3.2 (U.S. EPA 2002) Natural Gas Combustion
Pump Jack Natural Gas Benzo(b)fluoranthene* 1.80E-06 lb/MMBtu 2.34E-01 AP-42, Section 3.2 (U.S. EPA 2002) Natural Gas Combustion
Pump Jack Natural Gas Benzo(g,h,i)perylene* 1.20E-06 lb/MMBtu 1.56E-01 AP-42, Section 3.2 (U.S. EPA 2002) Natural Gas Combustion
Pump Jack Natural Gas Benzo(k)fluoranthene* 1.80E-06 lb/MMBtu 2.34E-01 AP-42, Section 3.2 (U.S. EPA 2002) Natural Gas Combustion
Pump Jack Natural Gas Chrysene* 1.80E-06 lb/MMBtu 2.34E-01 AP-42, Section 3.2 (U.S. EPA 2002) Natural Gas Combustion
Pump Jack Natural Gas Dibenzo(a,h)anthracene* 1.20E-06 lb/MMBtu 1.56E-01 AP-42, Section 3.2 (U.S. EPA 2002) Natural Gas Combustion
Pump Jack Natural Gas Fluoranthene 3.00E-06 lb/MMBtu 3.90E-01 AP-42, Section 3.2 (U.S. EPA 2002) Natural Gas Combustion
Pump Jack Natural Gas Fluorene 2.80E-06 lb/MMBtu 3.64E-01 AP-42, Section 3.2 (U.S. EPA 2002) Natural Gas Combustion
Pump Jack Natural Gas Indeno(1,2,3-cd_pyrene* 1.80E-06 lb/MMBtu 2.34E-01 AP-42, Section 3.2 (U.S. EPA 2002) Natural Gas Combustion
Pump Jack Natural Gas Phenanathrene 1.75E-05 lb/MMBtu 2.27E+00 AP-42, Section 3.2 (U.S. EPA 2002) Natural Gas Combustion
Pump Jack Natural Gas Pyrene 5.00E-06 lb/MMBtu 6.49E-01 AP-42, Section 3.2 (U.S. EPA 2002) Natural Gas Combustion

C-3
Appendix C. HAP Factors (Cont.)
Source Category Fuel Type Pollutant Emission Factors
Emission
Factor Unit % HAP Emission Factor Source
Boiler-Max MMBTU/hr<10-natural gas Natural Gas Total VOC 5.5
lb/MMscf burned AP-42, Sections 1.4 (U.S. EPA 2002)
Boiler-Max MMBTU/hr<10-natural gas Natural Gas Acetaldehyde 0.0089
lb/MMscf burned 1.6127E-01
Air Resources Board. California Environmental Protection Agency.
http://www.arb.ca.gov/app/emsinv/catef_form.html
Boiler-Max MMBTU/hr<10-natural gas Natural Gas Benzene 0.0021
lb/MMscf burned 3.8182E-02
AP-42, Sections 1.4 (U.S. EPA 2002) Natural Gas Combustion
Boiler-Max MMBTU/hr<10-natural gas Natural Gas Dichlorobenzene 1.2000E-03
lb/MMscf burned 2.1818E-02
AP-42, Sections 1.4 (U.S. EPA 2002) Natural Gas Combustion
Boiler-Max MMBTU/hr<10-natural gas Natural Gas 7,12-Dimethylbenz(a)anthracene* 1.6000E-05
lb/MMscf burned 2.9091E-04
AP-42, Sections 1.4 (U.S. EPA 2002) Natural Gas Combustion
Boiler-Max MMBTU/hr<10-natural gas Natural Gas Formaldehyde 0.0750
lb/MMscf burned 1.3636E+00
AP-42, Sections 1.4 (U.S. EPA 2002) Natural Gas Combustion
Boiler-Max MMBTU/hr<10-natural gas Natural Gas Hexane 1.8000E+00
lb/MMscf burned 3.2727E+01
AP-42, Sections 1.4 (U.S. EPA 2002) Natural Gas Combustion
Boiler-Max MMBTU/hr<10-natural gas Natural Gas 2-Methylnaphthalene 2.4000E-05
lb/MMscf burned 4.3636E-04
AP-42, Sections 1.4 (U.S. EPA 2002) Natural Gas Combustion
Boiler-Max MMBTU/hr<10-
natural gas Natural Gas 3-Methylchloranthrene* 1.8000E-06 lb/MMscf
burned 3.2727E-05 AP-42, Sections 1.4 (U.S. EPA 2002)
Natural Gas Combustion
Boiler-Max MMBTU/hr<10-
natural gas Natural Gas Naphthalene 6.1000E-04 lb/MMscf
burned 1.1091E-02 AP-42, Sections 1.4 (U.S. EPA 2002)
Natural Gas Combustion
Boiler-Max MMBTU/hr<10-natural gas Natural Gas Toluene 3.4000E-03
lb/MMscf burned 6.1818E-02
AP-42, Sections 1.4 (U.S. EPA 2002) Natural Gas Combustion
Boiler-Max MMBTU/hr<10-natural gas Natural Gas Total PM 1.9
lb/MMscf burned AP-42, Sections 1.4 (U.S. EPA 2002)
Boiler-Max MMBTU/hr<10-natural gas Natural Gas Acenaphthene* 1.8000E-06
lb/MMscf burned 9.4737E-05
AP-42, Sections 1.4 (U.S. EPA 2002) Natural Gas Combustion
Boiler-Max MMBTU/hr<10-natural gas Natural Gas Acenaphthylene* 1.8000E-06
lb/MMscf burned 9.4737E-05
AP-42, Sections 1.4 (U.S. EPA 2002) Natural Gas Combustion
Boiler-Max MMBTU/hr<10-natural gas Natural Gas Anthracene* 2.4000E-06
lb/MMscf burned 1.2632E-04
AP-42, Sections 1.4 (U.S. EPA 2002) Natural Gas Combustion

C-4
Appendix C. HAP Factors (Cont.)
Source Category Fuel Type Pollutant Emission Factors
Emission
Factor Unit % HAP Emission Factor Source
Boiler-Max MMBTU/hr<10-natural gas Natural Gas Benz(a)anthracene* 1.8000E-06
lb/MMscf burned 9.4737E-05
AP-42, Sections 1.4 (U.S. EPA 2002) Natural Gas Combustion
Boiler-Max MMBTU/hr<10-natural gas Natural Gas Benzo(a)pyrene* 1.2000E-06
lb/MMscf burned 6.3158E-05
AP-42, Sections 1.4 (U.S. EPA 2002) Natural Gas Combustion
Boiler-Max MMBTU/hr<10-
natural gas Natural Gas Benzo(b)fluoranthene* 1.8000E-06 lb/MMscf
burned 9.4737E-05 AP-42, Sections 1.4 (U.S. EPA 2002)
Natural Gas Combustion
Boiler-Max MMBTU/hr<10-
natural gas Natural Gas Benzo(g,h,i)perylene* 1.2000E-06 lb/MMscf
burned 6.3158E-05 AP-42, Sections 1.4 (U.S. EPA 2002)
Natural Gas Combustion
Boiler-Max MMBTU/hr<10-natural gas Natural Gas Benzo(k)fluoranthene* 1.8000E-06
lb/MMscf burned 9.4737E-05
AP-42, Sections 1.4 (U.S. EPA 2002) Natural Gas Combustion
Boiler-Max MMBTU/hr<10-natural gas Natural Gas Chrysene* 1.8000E-06
lb/MMscf burned 9.4737E-05
AP-42, Sections 1.4 (U.S. EPA 2002) Natural Gas Combustion
Boiler-Max MMBTU/hr<10-natural gas Natural Gas Dibenzo(a,h)anthracene* 1.2000E-06
lb/MMscf burned 6.3158E-05
AP-42, Sections 1.4 (U.S. EPA 2002) Natural Gas Combustion
Boiler-Max MMBTU/hr<10-natural gas Natural Gas Fluoranthene 3.0000E-06
lb/MMscf burned 1.5789E-04
AP-42, Sections 1.4 (U.S. EPA 2002) Natural Gas Combustion
Boiler-Max MMBTU/hr<10-natural gas Natural Gas Fluorene 2.8000E-06
lb/MMscf burned 1.4737E-04
AP-42, Sections 1.4 (U.S. EPA 2002) Natural Gas Combustion
Boiler-Max MMBTU/hr<10-natural gas Natural Gas Indeno(1,2,3-cd)pyrene* 1.8000E-06
lb/MMscf burned 9.4737E-05
AP-42, Sections 1.4 (U.S. EPA 2002) Natural Gas Combustion
Boiler-Max MMBTU/hr<10-natural gas Natural Gas Phenanathrene 1.7000E-05
lb/MMscf burned 8.9474E-04
AP-42, Sections 1.4 (U.S. EPA 2002) Natural Gas Combustion
Boiler-Max MMBTU/hr<10-natural gas Natural Gas Pyrene 5.0000E-06
lb/MMscf burned 2.6316E-04
AP-42, Sections 1.4 (U.S. EPA 2002) Natural Gas Combustion

C-5
Appendix C. HAP Factors (Cont.)
Source Category Fuel Type Pollutant Emission Factors
Emission
Factor Unit % HAP Emission Factor Source
Natural Gas Engines 2 cycle rich Natural Gas VOC 5.152709841 lb/MMscf AP-42, Section 5.2 (U.S. EPA 2002)
Natural Gas Engines 2 cycle rich Natural Gas Acetaldehyde 2.79E-03 lb/MMscf 5.41E-02 AP-42, Section 3.2 (U.S. EPA 2002)
Natural Gas Engines 2 cycle rich Natural Gas Acrolein 2.63E-03 lb/MMscf 5.10E-02 AP-42, Section 3.2 (U.S. EPA 2002)
Natural Gas Engines 2 cycle rich Natural Gas Benzene 1.58E-03 lb/MMscf 3.07E-02 AP-42, Section 3.2 (U.S. EPA 2002)
Natural Gas Engines 2 cycle rich Natural Gas 1,3-Butadiene 6.63E-04 lb/MMBtu 1.29E-02 AP-42, Section 3.2 (U.S. EPA 2002)
Natural Gas Engines 2 cycle rich Natural Gas Carbon Tetrachloride* 1.77E-05 lb/MMBtu 3.44E-04 AP-42, Section 3.2 (U.S. EPA 2002)
Natural Gas Engines 2 cycle rich Natural Gas Chlorobenzene* 1.29E-05 lb/MMBtu 2.50E-04 AP-42, Section 3.2 (U.S. EPA 2002)
Natural Gas Engines 2 cycle rich Natural Gas Chloroform* 1.37E-05 lb/MMBtu 2.66E-04 AP-42, Section 3.2 (U.S. EPA 2002)
Natural Gas Engines 2 cycle rich Natural Gas Dichlorobenzene 1.20E-03 lb/MMscf 2.33E-02 AP-42, Section 3.2 (U.S. EPA 2002) Natural Gas Combustion
Natural Gas Engines 2 cycle rich Natural Gas 1,3-Dichloropropene* 1.27E-05 lb/MMBtu 2.46E-04 AP-42, Section 3.2 (U.S. EPA 2002)
Natural Gas Engines 2 cycle rich Natural Gas 7,12-Dimethylbenz(a)anthracene* 1.60E-05 lb/MMscf 3.11E-04 AP-42, Section 3.2 (U.S. EPA 2002) Natural Gas Combustion
Natural Gas Engines 2 cycle rich Natural Gas Ethylbenzene* 2.48E-05 lb/MMscf 4.81E-04 AP-42, Section 3.2 (U.S. EPA 2002)
Natural Gas Engines 2 cycle rich Natural Gas Ethylene Dibromide* 2.13E-05 lb/MMscf 4.13E-04 AP-42, Section 3.2 (U.S. EPA 2002)
Natural Gas Engines 2 cycle rich Natural Gas Formaldehyde 2.05E-02 lb/MMscf 3.98E-01 AP-42, Section 3.2 (U.S. EPA 2002)
Natural Gas Engines 2 cycle rich Natural Gas Hexane 1.80E+00 lb/MMscf 3.49E+01 AP-42, Section 3.2 (U.S. EPA 2002) Natural Gas Combustion
Natural Gas Engines 2 cycle rich Natural Gas Methanol 3.06E-03 lb/MMscf 5.94E-02 AP-42, Section 3.2 (U.S. EPA 2002)
Natural Gas Engines 2 cycle rich Natural Gas Methylene Chloride 4.12E-05 lb/MMscf 8.00E-04 AP-42, Section 3.2 (U.S. EPA 2002)
Natural Gas Engines 2 cycle rich Natural Gas 2-Methylnaphthalene 2.40E-05 lb/MMscf 4.66E-04 AP-42, Section 3.2 (U.S. EPA 2002)
Natural Gas Combustion
Natural Gas Engines 2 cycle rich Natural Gas 3-Methylchloranthrene* 1.80E-06 lb/MMscf 3.49E-05 AP-42, Section 3.2 (U.S. EPA 2002) Natural Gas Combustion
Natural Gas Engines 2 cycle rich Natural Gas Naphthalene* 9.71E-05 lb/MMBtu 1.88E-03 AP-42, Section 3.2 (U.S. EPA 2002)
Natural Gas Engines 2 cycle rich Natural Gas Propylene 0.016842105 lb/MMBtu 3.27E-01
Air Resources Board. California Environmental Protection Agency. http://www.arb.ca.gov/app/emsinv/catef_form.html
Natural Gas Engines 2 cycle rich Natural Gas Styrene* 1.19E-05 lb/MMBtu 2.31E-04 AP-42, Section 3.2 (U.S. EPA 2002)
Natural Gas Engines 2 cycle rich Natural Gas 1,1,2,2-Tetrachloroethane 2.53E-05 lb/MMBtu 4.91E-04 AP-42, Section 3.2 (U.S. EPA 2002)
Natural Gas Engines 2 cycle rich Natural Gas Toluene 5.58E-04 lb/MMBtu 1.08E-02 AP-42, Section 3.2 (U.S. EPA 2002)
Natural Gas Engines 2 cycle rich Natural Gas 1,1,2-Trichloroethane* 1.53E-05 lb/MMBtu 2.97E-04 AP-42, Section 3.2 (U.S. EPA 2002)
Natural Gas Engines 2 cycle rich Natural Gas Vinyl Chloride* 7.18E-06 lb/MMBtu 1.39E-04 AP-42, Section 3.2 (U.S. EPA 2002)
Natural Gas Engines 2 cycle rich Natural Gas Xylenes (isomers and mixture) 1.95E-04 lb/MMBtu 3.78E-03 AP-42, Section 3.2 (U.S. EPA 2002)
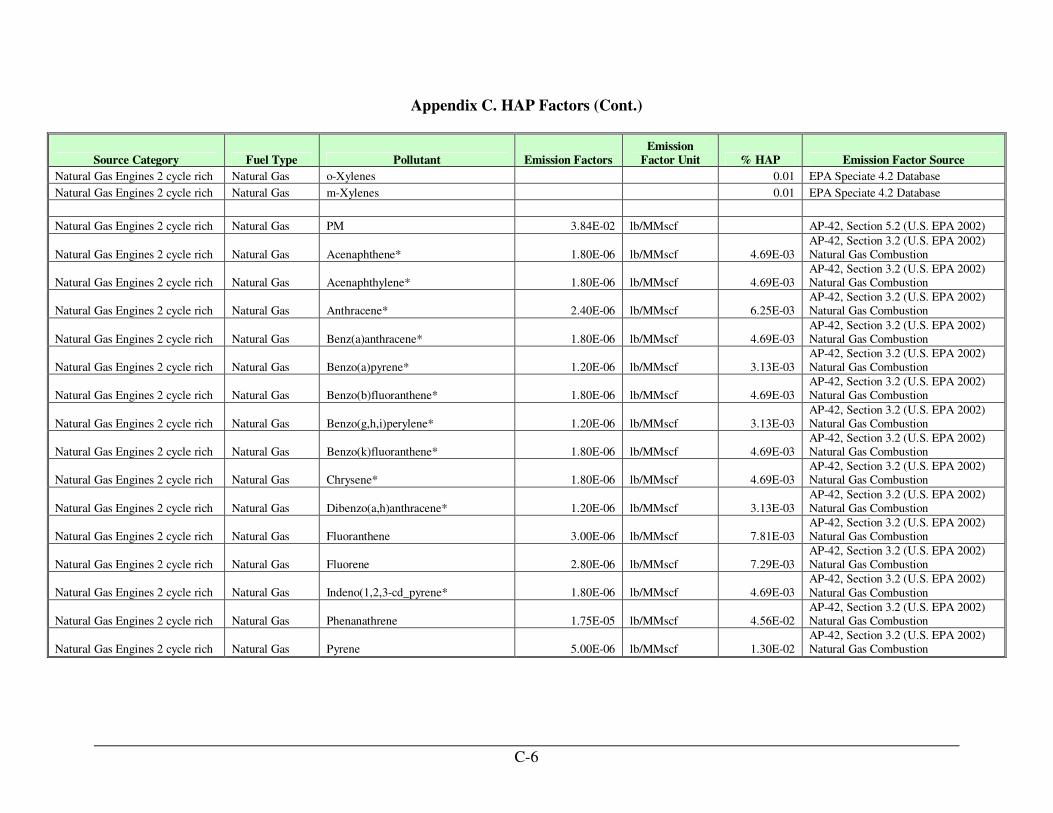
C-6
Appendix C. HAP Factors (Cont.)
Source Category Fuel Type Pollutant Emission Factors
Emission
Factor Unit % HAP Emission Factor Source
Natural Gas Engines 2 cycle rich Natural Gas o-Xylenes 0.01 EPA Speciate 4.2 Database
Natural Gas Engines 2 cycle rich Natural Gas m-Xylenes 0.01 EPA Speciate 4.2 Database
Natural Gas Engines 2 cycle rich Natural Gas PM 3.84E-02 lb/MMscf AP-42, Section 5.2 (U.S. EPA 2002)
Natural Gas Engines 2 cycle rich Natural Gas Acenaphthene* 1.80E-06 lb/MMscf 4.69E-03 AP-42, Section 3.2 (U.S. EPA 2002) Natural Gas Combustion
Natural Gas Engines 2 cycle rich Natural Gas Acenaphthylene* 1.80E-06 lb/MMscf 4.69E-03 AP-42, Section 3.2 (U.S. EPA 2002) Natural Gas Combustion
Natural Gas Engines 2 cycle rich Natural Gas Anthracene* 2.40E-06 lb/MMscf 6.25E-03 AP-42, Section 3.2 (U.S. EPA 2002) Natural Gas Combustion
Natural Gas Engines 2 cycle rich Natural Gas Benz(a)anthracene* 1.80E-06 lb/MMscf 4.69E-03 AP-42, Section 3.2 (U.S. EPA 2002) Natural Gas Combustion
Natural Gas Engines 2 cycle rich Natural Gas Benzo(a)pyrene* 1.20E-06 lb/MMscf 3.13E-03 AP-42, Section 3.2 (U.S. EPA 2002) Natural Gas Combustion
Natural Gas Engines 2 cycle rich Natural Gas Benzo(b)fluoranthene* 1.80E-06 lb/MMscf 4.69E-03 AP-42, Section 3.2 (U.S. EPA 2002) Natural Gas Combustion
Natural Gas Engines 2 cycle rich Natural Gas Benzo(g,h,i)perylene* 1.20E-06 lb/MMscf 3.13E-03 AP-42, Section 3.2 (U.S. EPA 2002) Natural Gas Combustion
Natural Gas Engines 2 cycle rich Natural Gas Benzo(k)fluoranthene* 1.80E-06 lb/MMscf 4.69E-03 AP-42, Section 3.2 (U.S. EPA 2002) Natural Gas Combustion
Natural Gas Engines 2 cycle rich Natural Gas Chrysene* 1.80E-06 lb/MMscf 4.69E-03 AP-42, Section 3.2 (U.S. EPA 2002) Natural Gas Combustion
Natural Gas Engines 2 cycle rich Natural Gas Dibenzo(a,h)anthracene* 1.20E-06 lb/MMscf 3.13E-03 AP-42, Section 3.2 (U.S. EPA 2002) Natural Gas Combustion
Natural Gas Engines 2 cycle rich Natural Gas Fluoranthene 3.00E-06 lb/MMscf 7.81E-03 AP-42, Section 3.2 (U.S. EPA 2002) Natural Gas Combustion
Natural Gas Engines 2 cycle rich Natural Gas Fluorene 2.80E-06 lb/MMscf 7.29E-03 AP-42, Section 3.2 (U.S. EPA 2002) Natural Gas Combustion
Natural Gas Engines 2 cycle rich Natural Gas Indeno(1,2,3-cd_pyrene* 1.80E-06 lb/MMscf 4.69E-03 AP-42, Section 3.2 (U.S. EPA 2002)
Natural Gas Combustion
Natural Gas Engines 2 cycle rich Natural Gas Phenanathrene 1.75E-05 lb/MMscf 4.56E-02 AP-42, Section 3.2 (U.S. EPA 2002) Natural Gas Combustion
Natural Gas Engines 2 cycle rich Natural Gas Pyrene 5.00E-06 lb/MMscf 1.30E-02 AP-42, Section 3.2 (U.S. EPA 2002) Natural Gas Combustion

C-7
Appendix C. HAP Factors (Cont.)
Source Category Fuel Type Pollutant Emission Factors
Emission
Factor Unit % HAP Emission Factor Source
Natural Gas Engine 4 cycle lean Natural Gas VOC 0.12 lb/MMBtu AP-42, Section 3.2 (U.S. EPA 2002)
Natural Gas Engine 4 cycle lean Natural Gas Acetaldehyde 8.36E-03 lb/MMBtu 6.97E+00 AP-42, Section 3.2 (U.S. EPA 2002)
Natural Gas Engine 4 cycle lean Natural Gas Acrolein 5.14E-03 lb/MMBtu 4.28E+00 AP-42, Section 3.2 (U.S. EPA 2002)
Natural Gas Engine 4 cycle lean Natural Gas Benzene 4.40E-04 lb/MMBtu 3.67E-01 AP-42, Section 3.2 (U.S. EPA 2002)
Natural Gas Engine 4 cycle lean Natural Gas Biphenyl 2.12E-04 lb/MMBtu 1.77E-01 AP-42, Section 3.2 (U.S. EPA 2002)
Natural Gas Engine 4 cycle lean Natural Gas 1,3-Butadiene 2.67E-04 lb/MMBtu 2.23E-01 AP-42, Section 3.2 (U.S. EPA 2002)
Natural Gas Engine 4 cycle lean Natural Gas Carbon Tetrachloride* 3.67E-05 lb/MMBtu 3.06E-02 AP-42, Section 3.2 (U.S. EPA 2002)
Natural Gas Engine 4 cycle lean Natural Gas Chlorobenzene* 3.04E-05 lb/MMBtu 2.53E-02 AP-42, Section 3.2 (U.S. EPA 2002)
Natural Gas Engine 4 cycle lean Natural Gas Chloroform* 2.85E-05 lb/MMBtu 2.38E-02 AP-42, Section 3.2 (U.S. EPA 2002)
Natural Gas Engine 4 cycle lean Natural Gas Dichlorobenzene 1.20E-03 lb/MMBtu 1.00E+00 AP-42, Section 3.2 (U.S. EPA 2002) Natural Gas Combustion
Natural Gas Engine 4 cycle lean Natural Gas 1,3-Dichloropropene* 2.64E-05 lb/MMBtu 2.20E-02 AP-42, Section 3.2 (U.S. EPA 2002)
Natural Gas Engine 4 cycle lean Natural Gas 7,12-Dimethylbenz(a)anthracene* 1.60E-05 lb/MMBtu 1.33E-02 AP-42, Section 3.2 (U.S. EPA 2002)
Natural Gas Combustion
Natural Gas Engine 4 cycle lean Natural Gas Ethylbenzene 3.97E-05 lb/MMBtu 3.31E-02 AP-42, Section 3.2 (U.S. EPA 2002)
Natural Gas Engine 4 cycle lean Natural Gas Ethylene Dibromide* 4.43E-05 lb/MMBtu 3.69E-02 AP-42, Section 3.2 (U.S. EPA 2002)
Natural Gas Engine 4 cycle lean Natural Gas Formaldehyde 5.28E-02 lb/MMBtu 4.40E+01 AP-42, Section 3.2 (U.S. EPA 2002)
Natural Gas Engine 4 cycle lean Natural Gas Methanol 2.50E-03 lb/MMBtu 2.08E+00 AP-42, Section 3.2 (U.S. EPA 2002)
Natural Gas Engine 4 cycle lean Natural Gas 2-Methylnaphthalene 3.32E-05 lb/MMBtu 2.77E-02 AP-42, Section 3.2 (U.S. EPA 2002)
Natural Gas Engine 4 cycle lean Natural Gas 3-Methylchloranthrene* 1.80E-06 lb/MMBtu 1.50E-03 AP-42, Section 3.2 (U.S. EPA 2002) Natural Gas Combustion
Natural Gas Engine 4 cycle lean Natural Gas Methylene Chloride 2.00E-05 lb/MMBtu 1.67E-02 AP-42, Section 3.2 (U.S. EPA 2002)
Natural Gas Engine 4 cycle lean Natural Gas n-Hexane 1.11E-03 lb/MMBtu 9.25E-01 AP-42, Section 3.2 (U.S. EPA 2002)
Natural Gas Engine 4 cycle lean Natural Gas Naphthalene 7.44E-05 lb/MMBtu 6.20E-02 AP-42, Section 3.2 (U.S. EPA 2002)
Natural Gas Engine 4 cycle lean Natural Gas Phenol 2.40E-05 lb/MMBtu 2.00E-02 AP-42, Section 3.2 (U.S. EPA 2002)
Natural Gas Engine 4 cycle lean Natural Gas Propylene 0.012673684 lb/MMBtu 1.06E+01
Air Resources Board. California Environmental Protection Agency. http://www.arb.ca.gov/app/emsinv/catef_form.html
Natural Gas Engine 4 cycle lean Natural Gas Styrene* 2.36E-05 lb/MMBtu 1.97E-02 AP-42, Section 3.2 (U.S. EPA 2002)
Natural Gas Engine 4 cycle lean Natural Gas Tetrachloroethane 2.48E-06 lb/MMBtu 2.07E-03 AP-42, Section 3.2 (U.S. EPA 2002)
Natural Gas Engine 4 cycle lean Natural Gas 1,1,2,2-Tetrachloroethane* 4.00E-05 lb/MMBtu 3.33E-02 AP-42, Section 3.2 (U.S. EPA 2002)
Natural Gas Engine 4 cycle lean Natural Gas Toluene 4.08E-04 lb/MMBtu 3.40E-01 AP-42, Section 3.2 (U.S. EPA 2002)
Natural Gas Engine 4 cycle lean Natural Gas 1,1,2-Trichloroethane* 3.18E-05 lb/MMBtu 2.65E-02 AP-42, Section 3.2 (U.S. EPA 2002)

C-8
Appendix C. HAP Factors (Cont.)
Source Category Fuel Type Pollutant Emission Factors
Emission
Factor Unit % HAP Emission Factor Source
Natural Gas Engine 4 cycle lean Natural Gas 2,2,4-Trimethylpentane 2.50E-04 lb/MMBtu 2.08E-01 AP-42, Section 3.2 (U.S. EPA 2002)
Natural Gas Engine 4 cycle lean Natural Gas Vinyl Chloride 1.49E-05 lb/MMBtu 1.24E-02 AP-42, Section 3.2 (U.S. EPA 2002)
Natural Gas Engine 4 cycle lean Natural Gas Xylene 1.84E-04 lb/MMBtu 1.53E-01 AP-42, Section 3.2 (U.S. EPA 2002)
Natural Gas Engine 4 cycle lean Natural Gas o-Xylenes 0.01 EPA Speciate 4.2 Database
Natural Gas Engine 4 cycle lean Natural Gas m,p-Xylenes 0.01 EPA Speciate 4.2 Database
Natural Gas Engine 4 cycle lean Natural Gas PM 7.71E-04 lb/MMBtu AP-42, Section 3.2 (U.S. EPA 2002)
Natural Gas Engine 4 cycle lean Natural Gas Acenaphthene 1.25E-06 lb/MMBtu 1.62E-01 AP-42, Section 3.2 (U.S. EPA 2002)
Natural Gas Engine 4 cycle lean Natural Gas Acenaphthylene 5.53E-06 lb/MMBtu 7.17E-01 AP-42, Section 3.2 (U.S. EPA 2002)
Natural Gas Engine 4 cycle lean Natural Gas Anthracene* 2.40E-06 lb/MMBtu 3.11E-01 AP-42, Section 3.2 (U.S. EPA 2002) Natural Gas Combustion
Natural Gas Engine 4 cycle lean Natural Gas Benz(a)anthracene* 1.80E-06 lb/MMBtu 2.33E-01 AP-42, Section 3.2 (U.S. EPA 2002) Natural Gas Combustion
Natural Gas Engine 4 cycle lean Natural Gas Benzo(b)fluoranthene 1.66E-07 lb/MMBtu 2.15E-02 AP-42, Section 3.2 (U.S. EPA 2002)
Natural Gas Engine 4 cycle lean Natural Gas Benzo(e)pyrene 4.15E-07 lb/MMBtu 5.38E-02 AP-42, Section 3.2 (U.S. EPA 2002)
Natural Gas Engine 4 cycle lean Natural Gas Benzo(g,h,i)perylene 4.14E-07 lb/MMBtu 5.37E-02 AP-42, Section 3.2 (U.S. EPA 2002)
Natural Gas Engine 4 cycle lean Natural Gas Benzo(k)fluoranthene* 1.80E-06 lb/MMBtu 2.33E-01 AP-42, Section 3.2 (U.S. EPA 2002) Natural Gas Combustion
Natural Gas Engine 4 cycle lean Natural Gas Chrysene 6.93E-07 lb/MMBtu 8.99E-02 AP-42, Section 3.2 (U.S. EPA 2002)
Natural Gas Engine 4 cycle lean Natural Gas Dibenzo(a,h)anthracene* 1.20E-06 lb/MMBtu 1.56E-01 AP-42, Section 3.2 (U.S. EPA 2002) Natural Gas Combustion
Natural Gas Engine 4 cycle lean Natural Gas Fluoranthene 1.11E-06 lb/MMBtu 1.44E-01 AP-42, Section 3.2 (U.S. EPA 2002)
Natural Gas Engine 4 cycle lean Natural Gas Fluorene 5.67E-06 lb/MMBtu 7.35E-01 AP-42, Section 3.2 (U.S. EPA 2002)
Natural Gas Engine 4 cycle lean Natural Gas Indeno(1,2,3-cd)pyrene* 1.80E-06 lb/MMBtu 2.33E-01 AP-42, Section 3.2 (U.S. EPA 2002) Natural Gas Combustion
Natural Gas Engine 4 cycle lean Natural Gas Phenanthrene 1.04E-05 lb/MMBtu 1.35E+00 AP-42, Section 3.2 (U.S. EPA 2002)
Natural Gas Engine 4 cycle lean Natural Gas Pyrene 1.36E-06 lb/MMBtu 1.76E-01 AP-42, Section 3.2 (U.S. EPA 2002)
Natural Gas Engines 4 cycle rich Natural Gas VOC 0.03 lb/MMBtu
Natural Gas Engines 4 cycle rich Natural Gas Acetaldehyde 2.79E-03 lb/MMBtu 9.30E+00 AP-42, Section 3.2 (U.S. EPA 2002)
Natural Gas Engines 4 cycle rich Natural Gas Acrolein 2.63E-03 lb/MMBtu 8.77E+00 AP-42, Section 3.2 (U.S. EPA 2002)
Natural Gas Engines 4 cycle rich Natural Gas Benzene 1.58E-03 lb/MMBtu 5.27E+00 AP-42, Section 3.2 (U.S. EPA 2002)
Natural Gas Engines 4 cycle rich Natural Gas 1,3-Butadiene 6.63E-04 lb/MMBtu 2.21E+00 AP-42, Section 3.2 (U.S. EPA 2002)
Natural Gas Engines 4 cycle rich Natural Gas Carbon Tetrachloride* 1.77E-05 lb/MMBtu 5.90E-02 AP-42, Section 3.2 (U.S. EPA 2002)

C-9
Appendix C. HAP Factors (Cont.)
Source Category Fuel Type Pollutant Emission Factors
Emission
Factor Unit % HAP Emission Factor Source
Natural Gas Engines 4 cycle rich Natural Gas Chlorobenzene* 1.29E-05 lb/MMBtu 4.30E-02 AP-42, Section 3.2 (U.S. EPA 2002)
Natural Gas Engines 4 cycle rich Natural Gas Chloroform* 1.37E-05 lb/MMBtu 4.57E-02 AP-42, Section 3.2 (U.S. EPA 2002)
Natural Gas Engines 4 cycle rich Natural Gas 1,3-Dichloropropene* 1.27E-05 lb/MMBtu 4.23E-02 AP-42, Section 3.2 (U.S. EPA 2002)
Natural Gas Engines 4 cycle rich Natural Gas 7,12-Dimethylbenz(a)anthracene* 1.60E-05 lb/MMBtu 5.33E-02 AP-42, Section 3.2 (U.S. EPA 2002)
Natural Gas Combustion
Natural Gas Engines 4 cycle rich Natural Gas Ethylbenzene* 2.48E-05 lb/MMBtu 8.27E-02 AP-42, Section 3.2 (U.S. EPA 2002)
Natural Gas Engines 4 cycle rich Natural Gas Ethylene Dibromide* 2.13E-05 lb/MMBtu 7.10E-02 AP-42, Section 3.2 (U.S. EPA 2002)
Natural Gas Engines 4 cycle rich Natural Gas Formaldehyde 2.05E-02 lb/MMBtu 6.83E+01 AP-42, Section 3.2 (U.S. EPA 2002)
Natural Gas Engines 4 cycle rich Natural Gas Methylene Chloride 4.12E-05 lb/MMBtu 1.37E-01 AP-42, Section 3.2 (U.S. EPA 2002)
Natural Gas Engines 4 cycle rich Natural Gas 2-Methylnaphthalene 2.40E-05 lb/MMBtu 8.00E-02 AP-42, Section 3.2 (U.S. EPA 2002) Natural Gas Combustion
Natural Gas Engines 4 cycle rich Natural Gas 3-Methylchloranthrene* 1.80E-06 lb/MMBtu 6.00E-03 AP-42, Section 3.2 (U.S. EPA 2002)
Natural Gas Combustion
Natural Gas Engines 4 cycle rich Natural Gas Naphthalene* 9.71E-05 lb/MMBtu 3.24E-01 AP-42, Section 3.2 (U.S. EPA 2002)
Natural Gas Engines 4 cycle rich Natural Gas Styrene* 1.19E-05 lb/MMBtu 3.97E-02 AP-42, Section 3.2 (U.S. EPA 2002)
Natural Gas Engines 4 cycle rich Natural Gas 1,1,2,2-Tetrachloroethane 2.53E-05 lb/MMBtu 8.43E-02 AP-42, Section 3.2 (U.S. EPA 2002)
Natural Gas Engines 4 cycle rich Natural Gas Toluene 5.58E-04 lb/MMBtu 1.86E+00 AP-42, Section 3.2 (U.S. EPA 2002)
Natural Gas Engines 4 cycle rich Natural Gas 1,1,2-Trichloroethane* 1.53E-05 lb/MMBtu 5.10E-02 AP-42, Section 3.2 (U.S. EPA 2002)
Natural Gas Engines 4 cycle rich Natural Gas Vinyl Chloride* 7.18E-06 lb/MMBtu 2.39E-02 AP-42, Section 3.2 (U.S. EPA 2002)
Natural Gas Engines 4 cycle rich Natural Gas Xylenes (isomers and mixture) 1.95E-04 lb/MMBtu 6.50E-01 AP-42, Section 3.2 (U.S. EPA 2002)
Natural Gas Engines 4 cycle rich Natural Gas o-Xylenes 0.01 EPA Speciate 4.2 Database
Natural Gas Engines 4 cycle rich Natural Gas m-Xylenes 0.01 EPA Speciate 4.2 Database
Natural Gas Engines 4 cycle rich Natural Gas PM 9.50E-03 lb/MMBtu
Natural Gas Engines 4 cycle rich Natural Gas Acenaphthene* 1.80E-06 lb/MMBtu 1.89E-02 AP-42, Section 3.2 (U.S. EPA 2002) Natural Gas Combustion
Natural Gas Engines 4 cycle rich Natural Gas Acenaphthylene* 1.80E-06 lb/MMBtu 1.89E-02 AP-42, Section 3.2 (U.S. EPA 2002) Natural Gas Combustion
Natural Gas Engines 4 cycle rich Natural Gas Anthracene* 2.40E-06 lb/MMBtu 2.53E-02 AP-42, Section 3.2 (U.S. EPA 2002) Natural Gas Combustion
Natural Gas Engines 4 cycle rich Natural Gas Benz(a)anthracene* 1.80E-06 lb/MMBtu 1.89E-02 AP-42, Section 3.2 (U.S. EPA 2002) Natural Gas Combustion
Natural Gas Engines 4 cycle rich Natural Gas Benzo(a)pyrene* 1.20E-06 lb/MMBtu 1.26E-02 AP-42, Section 3.2 (U.S. EPA 2002) Natural Gas Combustion

C-10
Appendix C. HAP Factors (Cont.)
Source Category Fuel Type Pollutant Emission Factors
Emission
Factor Unit % HAP Emission Factor Source
Natural Gas Engines 4 cycle rich Natural Gas Benzo(b)fluoranthene* 1.80E-06 lb/MMBtu 1.89E-02 AP-42, Section 3.2 (U.S. EPA 2002) Natural Gas Combustion
Natural Gas Engines 4 cycle rich Natural Gas Benzo(g,h,i)perylene* 1.20E-06 lb/MMBtu 1.26E-02 AP-42, Section 3.2 (U.S. EPA 2002) Natural Gas Combustion
Natural Gas Engines 4 cycle rich Natural Gas Benzo(k)fluoranthene* 1.80E-06 lb/MMBtu 1.89E-02 AP-42, Section 3.2 (U.S. EPA 2002) Natural Gas Combustion
Natural Gas Engines 4 cycle rich Natural Gas Chrysene* 1.80E-06 lb/MMBtu 1.89E-02 AP-42, Section 3.2 (U.S. EPA 2002) Natural Gas Combustion
Natural Gas Engines 4 cycle rich Natural Gas Dibenzo(a,h)anthracene* 1.20E-06 lb/MMBtu 1.26E-02 AP-42, Section 3.2 (U.S. EPA 2002) Natural Gas Combustion
Natural Gas Engines 4 cycle rich Natural Gas Fluoranthene 3.00E-06 lb/MMBtu 3.16E-02 AP-42, Section 3.2 (U.S. EPA 2002) Natural Gas Combustion
Natural Gas Engines 4 cycle rich Natural Gas Fluorene 2.80E-06 lb/MMBtu 2.95E-02 AP-42, Section 3.2 (U.S. EPA 2002) Natural Gas Combustion
Natural Gas Engines 4 cycle rich Natural Gas Indeno(1,2,3-cd_pyrene* 1.80E-06 lb/MMBtu 1.89E-02 AP-42, Section 3.2 (U.S. EPA 2002) Natural Gas Combustion
Natural Gas Engines 4 cycle rich Natural Gas Phenanathrene 1.75E-05 lb/MMBtu 1.84E-01 AP-42, Section 3.2 (U.S. EPA 2002) Natural Gas Combustion
Natural Gas Engines 4 cycle rich Natural Gas Pyrene 5.00E-06 lb/MMBtu 5.26E-02 AP-42, Section 3.2 (U.S. EPA 2002) Natural Gas Combustion

Appendix D – Compressor Engine Workbook

Appendix E – Texas Oil and Gas Emissions Inventory

Appendix F – Formatted TexAer Files