Oil Natural Gas Technology - Digital Library/67531/metadc930598/m2/1/high... · Oil & Natural Gas...
207
Oil & Natural Gas Technology DOE Award No.: DE-FC26-01NT41099 Characterization and Alteration of Wettability States of Alaskan Reservoirs to Improve Oil Recovery Efficiency (including the within-scope expansion based on Cyclic Water Injection – a pulsed waterflood for Enhanced Oil Recovery) Submitted by: Petroleum Development Laboratory Institute of Northern Engineering University of Alaska Fairbanks P.O. Box 755880 Fairbanks, Alaska 99775-5880 Prepared for: United States Department of Energy National Energy Technology Laboratory November 2008 Office of Fossil Energy
Transcript of Oil Natural Gas Technology - Digital Library/67531/metadc930598/m2/1/high... · Oil & Natural Gas...
Oil & Natural Gas Technology
DOE Award No.: DE-FC26-01NT41099
Characterization and Alteration of Wettability States of Alaskan Reservoirs to Improve
Oil Recovery Efficiency (including the within-scope expansion
based on Cyclic Water Injection – a pulsed waterflood for Enhanced Oil Recovery)
Submitted by: Petroleum Development Laboratory
Institute of Northern Engineering University of Alaska Fairbanks
P.O. Box 755880 Fairbanks, Alaska 99775-5880
Prepared for: United States Department of Energy
National Energy Technology Laboratory
November 2008
Office of Fossil Energy

University of Alaska Fairbanks America's Arctic University
UAF is an affirmative action/equal opportunity employer and educational institution
Characterization and Alteration of Wettability States of Alaskan Reservoirs to Improve Oil Recovery Efficiency
(including the within-scope expansion based on Cyclic Water Injection – a pulsed waterflood for Enhanced Oil Recovery)
Final Report
Submitted to
United States Department of Energy National Energy Technology Laboratory
3610 Collins Ferry Road P.O. Box 880
Morgantown, WV 26507-0880 Ph: 304-285-4764, Fax: 304-285-4403
Principal Authors
Abhijit Dandekar
Shirish Patil
Santanu Khataniar
Submitted by
Petroleum Development Laboratory Institute of Northern Engineering
University of Alaska Fairbanks P.O. Box 755880, Fairbanks, Alaska 99775-5880
Telephone: (907) 474 – 7734, FAX: (907) 474 – 5912
November 2008
PDL
INE

i
DISCLAIMER
This report was prepared as an account of work sponsored by an agency of the United States
Government. Neither the United States Government nor any agency thereof, nor any of their
employees, makes any warranty, express or implied, or assumes any legal liability or
responsibility for the accuracy, completeness, or usefulness of any information, apparatus,
product, or process disclosed, or represents that its use would not infringe privately owned rights.
Reference herein to any specific commercial product, process, or service by trade name,
trademark, manufacturer, or otherwise does not necessarily constitute or imply its endorsement,
recommendation, or favoring by the United States Government or any agency thereof. The views
and opinions of authors expressed herein do not necessarily state or reflect those of the United
States Government or any agency thereof.
ii
ABSTRACT
Numerous early reports on experimental works relating to the role of wettability in various
aspects of oil recovery have been published. Early examples of laboratory waterfloods show oil
recovery increasing with increasing water-wetness. This result is consistent with the intuitive
notion that strong wetting preference of the rock for water and associated strong capillary-
imbibition forces gives the most efficient oil displacement. This report examines the effect of
wettability on waterflooding and gasflooding processes respectively. Waterflood oil recoveries
were examined for the dual cases of uniform and non-uniform wetting conditions.
Based on the results of the literature review on effect of wettability and oil recovery,
coreflooding experiments were designed to examine the effect of changing water chemistry
(salinity) on residual oil saturation. Numerous corefloods were conducted on reservoir rock
material from representative formations on the Alaska North Slope (ANS). The corefloods
consisted of injecting water (reservoir water and ultra low-salinity ANS lake water) of different
salinities in secondary as well as tertiary mode. Additionally, complete reservoir condition
corefloods were also conducted using live oil. In all the tests, wettability indices, residual oil
saturation, and oil recovery were measured. All results consistently lead to one conclusion; that
is, a decrease in injection water salinity causes a reduction in residual oil saturation and a slight
increase in water-wetness, both of which are comparable with literature observations. These
observations have an intuitive appeal in that water easily imbibes into the core and displaces oil.
Therefore, low-salinity waterfloods have the potential for improved oil recovery in the secondary
recovery process, and ultra low-salinity ANS lake water is an attractive source of injection water
or a source for diluting the high-salinity reservoir water.
As part of the within-scope expansion of this project, cyclic water injection tests using high as
well as low salinity were also conducted on several representative ANS core samples. These
results indicate that less pore volume of water is required to recover the same amount of oil as
compared with continuous water injection. Additionally, in cyclic water injection, oil is produced
even during the idle time of water injection. It is understood that the injected brine front
spreads/smears through the pores and displaces oil out uniformly rather than viscous fingering.
iii
The overall benefits of this project include increased oil production from existing Alaskan
reservoirs. This conclusion is based on the performed experiments and results obtained on low-
salinity water injection (including ANS lake water), vis-à-vis slightly altering the wetting
conditions. Similarly, encouraging cyclic water-injection test results indicate that this method
can help achieve residual oil saturation earlier than continuous water injection. If proved in field,
this would be of great use, as more oil can be recovered through cyclic water injection for the
same amount of water injected.
iv
TABLE OF CONTENTS
DISCLAIMER ................................................................................................................................. i ABSTRACT.................................................................................................................................... ii LIST OF FIGURES ...................................................................................................................... vii LIST OF TABLES......................................................................................................................... xi ACKNOWLEDGMENTS ............................................................................................................ xii CHAPTER 1: Introduction ............................................................................................................12
1.1 Fundamental Concepts of Wettability ..............................................................................13 1.2 Measurements of Wettability ...........................................................................................13
1.2.1 Contact Angle Measurement.....................................................................................14 1.2.2 Amott-Harvey Wettability Test ................................................................................15 1.2.3 United State Bureau of Mines (USBM) Wettability Test.........................................18 1.2.4 Combined USBM/Amott Method.............................................................................20
1.3 Recent Advances in Methods of Wettability Index Determination..................................21 1.4 Wettability in Reservoirs..................................................................................................22 1.5 Mechanism of Wettability Variation in Reservoirs..........................................................25 1.6 Reservoir Wettability and Oil Recovery Efficiency.........................................................27 1.7 Wettability Alteration in Cores ........................................................................................27 1.8 Objectives .........................................................................................................................28
EXECUTIVE SUMMARY ...........................................................................................................31 CHAPTER 2: Literature Review – Wettability and Oil Recovery ................................................33
2.1 Wettability and Relative Permeability..............................................................................35 2.1.1 Wettability and Relative Permeability in Uniformly Wetted Media ........................35 2.1.2 Wettability and Relative Permeability in a Non-uniformly Wetted Media. .............39
2.2 Wettability and Fractional Flow of Water during Waterflooding ....................................42 2.3 Wettability Effects on Oil Recovery Efficiency...............................................................46
2.3.1 Uniformly Wetted Media..........................................................................................46 2.3.2 Non-Uniformly-Wetted Systems ..............................................................................52
2.3.2.1 Mixed-Wet Systems ..........................................................................................53 2.3.2.2 Fractionally-Wetted Systems ............................................................................56
2.4 Effect of Brine Salinity and Valency on Wettability and Oil Recovery ..........................57 CHAPTER 3: Experimental Setup.................................................................................................61
3.1 Overview of Equipment Setup .........................................................................................61 3.2 Fluid Circulation and Pressure Maintenance Pump .........................................................63 3.3 Floating Piston Fluid Accumulator ..................................................................................65 3.4 Core Holder ......................................................................................................................68 3.5 Overburden Pressure Pump ..............................................................................................71 3.6 Differential Pressure Transducer......................................................................................72 3.7 Produced Fluid Separator .................................................................................................77 3.8 Backpressure Regulator....................................................................................................81 3.9 Digital Scale .....................................................................................................................82 3.10 Laminated Silicone Rubber Heater Blankets .................................................................83 3.11 Gas Supply and Regulator ..............................................................................................86 3.12 Fluid Lines and Fittings..................................................................................................86
CHAPTER 4: Experimental Description and Procedure ...............................................................87 4.1 Experimental Description – DNR and Berea Cores .........................................................87
v
4.1.1 Core Samples ............................................................................................................88 4.1.2 Brine 91 4.1.3 Crude Oils .................................................................................................................92
4.2 Experimental Description – ANS Representative Cores..................................................92 4.3 Experimental Procedure – DNR and Berea Cores ...........................................................96
4.3.1 Core Sample Preparation ..........................................................................................96 4.3.2 Core Saturation .........................................................................................................96 4.3.3 Pore Volume and Porosity Determination ................................................................97 4.3.4 Establishing Initial Water Saturation ........................................................................98 4.3.5. Absolute Permeability Determination....................................................................100 4.3.6 Coreflooding ...........................................................................................................102 4.3.7 Imbibition and Wettability Index Determination....................................................104
4.4 Experimental Procedure – ANS Representative Cores ..................................................106 Waterflooding .............................................................................................................106 Oil Aging.....................................................................................................................107 Waterflooding .............................................................................................................107
CHAPTER 5: Salinity Influence on Oil-Water Interfacial Area, Wettability and Oil Recovery Work Performed by PNNL..........................................................................................109
5.1 Material and Methods.....................................................................................................109 5.2 Results ............................................................................................................................111 5.3 Analysis of Results .........................................................................................................116
CHAPTER 6: Advanced Coreflooding Tests at Reservoir Conditions .......................................117 6.1 Materials Used................................................................................................................117 6.2 Modified Setup ...............................................................................................................117 6.3 Experimental Procedure .................................................................................................117 6.4 Results ............................................................................................................................118
CHAPTER 7: Results and Discussion – DNR and Berea Cores .................................................120 7.1 EOR Potential of Low-Salinity Brine.............................................................................122 7.2. EOR Potential of Injecting Hot High-Salinity Brine Followed by Low-Salinity Brine125 7.3 EOR Potential of Injecting Low-Salinity Brine at Ambient and Elevated Temperature128 7.4 Secondary Oil Recovery Potential of Low-Salinity Waterflood at Ambient and
Elevated Temperature ...................................................................................................133 7.5 Impact of Low-Salinity Waterflood (Ambient and Elevated Temperatures) and/or
Variation in Wettability on Residual Oil Saturation .....................................................143 CHAPTER 8: Results and Discussion – Representative Cores ...................................................149
8.1 Experiment on New (Clean) Cores.................................................................................150 8.2 Experiment on Oil Aged Cores ......................................................................................152 8.3 Experiment Using ANS Lake Water ..............................................................................154
CHAPTER 9: Cyclic Water Injection (Within-Scope Expansion) ..............................................178 9.1 Introduction ....................................................................................................................178 9.2 Experimental Description and Setup ..............................................................................179 9.3 Results ............................................................................................................................180
9.3.1 First Set (Used Cores with 3 Salinities)..................................................................181 9.3.2 Second Set (Used Cores with 22,000 TDS and ANS Lake Water) ........................184 9.3.3 Third Set (New Cores with 22,000 TDS and Different Time Intervals) ................185
CHAPTER 10: Conclusions and Recommendations...................................................................190

vi
10.1 Conclusions ..................................................................................................................190 10.2 Recommendations ........................................................................................................193
REFERENCES ............................................................................................................................194 NOMENCLATURE ...................................................................................................................203 APPENDIX .................................................................................................................................204
vii
LIST OF FIGURES
Figure 1.1: Wettability of Oil/Water/Rock System. ......................................................................14 Figure 1.2: Apparatus for Spontaneous Displacement of (a) Brine and (b) Oil ............................16 Figure 1.3: USBM Wettability Measurement: (A) Untreated Core; (B) Core Treated with 10% Dri-Film 99; (C) Core Pretreated with Oil for 324 Hours at 140°F; Brine Contains 1,000 PPM Sodium Tripolyphosphate..............................................................................................................19 Figure 1.4: Effect of Mineralogy on Wetting Condition ...............................................................24 Figure 2.1: Waterflood Oil Displacement in a Strongly Water-Wet Rock. ..................................34 Figure 2.2: Waterflood Oil Displacement in a Strongly Oil-Wet Rock. ......................................34 Figure 2.3A: Relative Permeabilities for Two Wetting Conditions. .............................................36 Figure 2.3B: Relative Permeabilities for a Range of Wetting Conditions.....................................37 Figure 2.4: Relative Permeability Curves for Berea Sandstone before and after Dri-Film Treatment. .....................................................................................................................................40 Figure 2.5: Fractional Flow Curves for Waterfloods of Water- and Oil-Wet Rocks at an Oil/Water Viscosity Ratio of 25. ...................................................................................................44 Figure 2.6: Effect of Wettability on Oil Displacement by Water Injection...................................45 Figure 2.7: Oil Recovery vs. Amott-Harvey Index at Different Injected PVs. .............................48 Figure 2.8: Residual Oil Saturation vs. Amott-Harvey Index at Different PVs. ...........................49 Figure 2.9: Schematic Representation of a Mixed-Wet System. ...................................................52 Figure 2.10: Schematic Representation of a Fractionally-Wet System. ........................................53 Figure 2.11: Comparison of Waterflood Behavior for Mixed-wet and Water-wet Cores from East Texas Field.....................................................................................................................................54 Figure 2.12: Comparison of Waterfloods under Different Wetting Conditions in Several Porous Rocks..............................................................................................................................................55 Figure 2.13: Comparison of Reservoir Condition Secondary Waterflood Characteristics (Low-Salinity vs. High-Salinity Brine Floods)........................................................................................59 Figure 2.14: Micro-Visualization of ROS Post High- and Low-Salinity Waterflood. ..................60 Figure 3.1: Schematic Representation of the Coreflooding Setup.................................................62 Figure 3.2: Photographic Representation of the Teledyne ISCO D-Series Pump (Model 100DM).65 Figure 3.3: Cross-Sectional View of the Fluid Accumulator. .......................................................67 Figure 3.4: Photographic Representation of the Temco Model CFR-100-50 Fluid Accumulators.68 Figure 3.5: Photographic Representation of the Temco RCHR-Series Core Holder. ...................70 Figure 3.6: Schematic Representation of the RCHR-Series Hassler-Type Core Holder...............70 Figure 3.7: Photographic Representation of the PH-Series (Model PH1) Hand Pump. ................72 Figure 3.8: Photographic Representation of the Model DP-360 Differential Pressure Transducer.74 Figure 3.9: Photographic Representation of the Model CD-15 Carrier Demodulator...................75 Figure 3.10: Photographic Representation of the SC5 Strip Chart with History...........................76 Figure 3.11: Schematic Representation of the Produced Fluid Separator. ....................................79 Figure 3.12: Photographic Representation of the PFS Configuration Window.............................80 Figure 3.13: Photographic Representation of the Backpressure Regulator. ..................................82 Figure 3.14: Photographic Representation of the Laminated Silicon Rubber Heater Blanket (Wrapped Around One of the Pieces of Equipment). ....................................................................85 Figure 4.1: Absolute Permeability and Porosity Values of the Berea Core Plugs.........................90 Figure 4.2: Absolute Permeability and Porosity Values of the DNR Cores..................................90 Figure 4.3 Porosity and Permeability Measurement of Tested Core Samples. .............................94
viii
Figure 4.4: Interstitial Water Saturation in the Berea Cores after Forced Brine Displacement. ...99 Figure 4.5: Interstitial Water Saturation in the DNR Cores after Forced Brine Displacement. ..100 Figure 4.6: Typical Pressure Drop Profile for Absolute Permeability Determination. ...............101 Figure 5.1: Effluent Tracer Curves from Decane-containing Columns after Flushing with Water at Different Salinities. ..................................................................................................................111 Figure 5.2: Decane Residual Saturation, Sor, and Oil/Water-specific Interfacial Area, anw, vs. Salinity. Sor Decreased with Decreasing Salinity, While the anw Reached a Maximum at Salinity of ~2%..........................................................................................................................................112 Figure 5.3: Effluent Tracer Curves from ANS Oil-containing Columns after Flushing with Water at Different Salinities. ..................................................................................................................114 Figure 5.4: Interfacial Tension (IFT) between ANS Oil and Water vs. Water Salinity. .............115 Figure 5.5: ANS Oil Residual Saturation, Sor, and Oil/Water-specific Interfacial Area, anw, vs. Water Salinity. .............................................................................................................................115 Figure 6.1: Cumulative Oil Recovery (Recombined Oil Floods). ...............................................119 Figure 6.2: Oil Saturation (Recombined Oil Floods)...................................................................119 Figure 7.1: Effect of Low-Salinity Flooding on Oil Recovery – Core Sample #3 (Berea/Crude Oil System). .................................................................................................................................123 Figure 7.2: Effect of Variation in Brine Salinity on Residual Oil Saturation – Core Sample #3 (Berea/Crude Oil System)............................................................................................................123 Figure 7.3: Effect of Low-Salinity Flooding on Oil Recovery – Core Sample #6 (Berea/Crude Oil System). .................................................................................................................................124 Figure 7.4: Effect of Variation in Injection Brine Salinity on Sor – Core Sample #6 (Berea/Crude Oil System). .................................................................................................................................124 Figure 7.5: Effect of Brine Temperature and Salinity on Oil Recovery – Core Sample #2 (Berea/Crude Oil System)............................................................................................................126 Figure 7.6: Effect of Brine Temperature and Brine Salinity on Sor – Core Sample #2 (Berea/Crude Oil System)............................................................................................................126 Figure 7.7: Effect of Brine Temperature and Salinity on Oil Recovery – Core Sample #1 (Berea/Crude Oil System)............................................................................................................127 Figure 7.8: Effect of Brine Temperature and Salinity on Sor – Core Sample #1 (Berea/Crude Oil System). .......................................................................................................................................127 Figure 7.9: Effect of Brine Temperature and Salinity on Oil Recovery – Core Sample #4 (Berea/Crude Oil System)............................................................................................................129 Figure 7.10: Effect of Brine Temperature and Salinity on Sor – Core Sample #4 (Berea/Crude Oil System). .......................................................................................................................................129 Figure 7.11: Effect of Brine Temperature and Salinity on Oil Recovery – Core Sample #5 (Berea/Crude Oil System)............................................................................................................130 Figure 7.12: Effect of Brine Temperature and Salinity on Sor – Core Sample #5 (Berea/Crude Oil System). .......................................................................................................................................130 Figure 7.13: Viscosity Dependence of TAPS Crude Oil Blend on Temperature. .......................133 Figure 7.14: Oil Recovery Profile - Temperature and Salinity Effects, Core Sample #1 (DNR Cores/Decane System). ................................................................................................................139 Figure 7.15: Oil Recovery Profile - Temperature and Salinity Effects, Core Sample #2 (DNR Core/Decane System)...................................................................................................................140 Figure 7.16: Oil Recovery Profile - Temperature and Salinity Effects, Core Sample #3 (DNR Core/Decane System)...................................................................................................................141
ix
Figure 7.17: Oil Recovery Profile - Temperature and Salinity Effects, Core Sample #4 (DNR Core/Decane System)...................................................................................................................142 Figure 7.18: Oil Recovery Profile - Temperature and Salinity Effects, Core Sample #5 (DNR Core/Decane System)...................................................................................................................143 Figure 7.19: ROS - Temperature and Salinity Effects on Wettability, Core Sample #1 (DNR Cores/Decane System). ................................................................................................................146 Figure 7.20: ROS - Temperature and Salinity Effects on Wettability, Core Sample #2 (DNR Cores/Decane System). ................................................................................................................146 Figure 7.21: ROS - Temperature and Salinity Effects on Wettability, Core Sample #3 (DNR Cores/Decane System). ................................................................................................................147 Figure 7.22: ROS - Temperature and Salinity Effects on Wettability, Core Sample #4 (DNR Cores/Decane System). ................................................................................................................147 Figure 7.23: ROS - Temperature and Salinity Effects on Wettability, Core Sample #5 (DNR Cores/Decane System). ................................................................................................................148 Figure 8.1: Effect of Brine Salinity on Wettability (Core E).......................................................150 Figure 8.2: Effect of Brine Salinity on Residual Oil Saturation (Core E). ..................................151 Figure 8.3: Oil Recovery Profile for New Core E. ......................................................................152 Figure 8.4: Oil Recovery Profile for Oil Aged Core E. ...............................................................153 Figure 8.5: Effect of Brine Salinity on Wettability (Core H). .....................................................155 Figure 8.6: Effect of Brine Salinity on Residual Oil Saturation (Core H)...................................156 Figure 8.7: Oil Recovery Profile (Core H). .................................................................................157 Figure 8.8: Increase in % Oil Recovery/Change in % Sor With Reduction of Brine Salinity for Different Studies (McGuire et al.93; Webb et al.95; present work is using ANS representative core samples). ......................................................................................................................................159 Figure 8.9: Effect of Brine Salinity on Wettability (Core A). .....................................................162 Figure 8.10: Effect of Brine Salinity on Residual Oil Saturation (Core A).................................162 Figure 8.11: Oil Recovery Profile for New Core A.....................................................................163 Figure 8.12: Oil Recovery Profile for Oil Aged Core A..............................................................163 Figure 8.13: Effect of Brine Salinity on Wettability for New Core B.........................................164 Figure 8.14: Effect of Brine Salinity on Residual Oil Saturation for New Core B. ....................164 Figure 8.15: Oil Recovery Profile for New Core B. ....................................................................165 Figure 8.16: Effect of Brine Salinity on Wettability (Core C). ...................................................166 Figure 8.17: Effect of Brine Salinity on Residual Oil Saturation (Core C).................................166 Figure 8.18: Oil Recovery Profile for New Core C. ....................................................................167 Figure 8.19: Oil Recovery Profile for Oil Aged Core C..............................................................167 Figure 8.20: Effect of Brine Salinity on Wettability (Core D). ...................................................168 Figure 8.21: Effect of Brine Salinity on Residual Oil Saturation (Core D).................................168 Figure 8.22: Oil Recovery Profile for New Core D.....................................................................169 Figure 8.23: Oil Recovery Profile for Oil Aged Core D..............................................................169 Figure 8.24: Effect of Brine Salinity on Wettability (Core F).....................................................170 Figure 8.25: Effect of Brine Salinity on Residual Oil Saturation (Core F). ................................170 Figure 8.26: Oil Recovery Profile for New Core F. ....................................................................171 Figure 8.27: Oil Recovery Profile for Oil Aged Core F. .............................................................171 Figure 8.28: Effect of Brine Salinity on Wettability (Core G). ...................................................172 Figure 8.29: Effect of Brine Salinity on Residual Oil Saturation (Core G).................................172 Figure 8.30: Oil Recovery Profile for New Core G.....................................................................173
x
Figure 8.31: Oil Recovery Profile for Oil Aged Core G..............................................................173 Figure 8.32: Effect of Brine Salinity on Wettability for New Core I. .........................................174 Figure 8.33: Effect of Brine Salinity on Residual Oil Saturation for New Core I.......................174 Figure 8.34: Oil Recovery Profile for New Core I. .....................................................................175 Figure 8.35: Effect of Brine Salinity on Wettability for New Core J. .........................................176 Figure 8.36: Effect of Brine Salinity on Residual Oil Saturation for New Core J. .....................176 Figure 8.37: Oil Recovery Profile for New Core J. .....................................................................177 Figure 9.1: Oil Recovery (3 Salinities) ........................................................................................181 Figure 9.2: Initial vs. Residual Oil Saturation (5,500 TDS, 3 Salinities) ....................................181 Figure 9.3: Injected Brine vs. Oil Produced (Core 149) ..............................................................182 Figure 9.4: Injected Brine vs. Oil Produced (Core 151) ..............................................................182 Figure 9.5: Injected Brine vs. Oil Produced (Core 152) ..............................................................183 Figure 9.6: Injected Brine vs. Oil Produced (Core 43) ................................................................184 Figure 9.7: Injected Brine vs. Oil Produced (Core 45) ................................................................184 Figure 9.8: Injected Brine vs. Oil Produced (Core 46) ................................................................185 Figure 9.9: Residual Oil Saturation (Varying Time Intervals) ....................................................185 Figure 9.10: Oil Recovery (Varying Time Intervals) ..................................................................186 Figure 9.11: Injected Brine vs. Oil Recovered (Core 1) ..............................................................186 Figure 9.12: Injected Brine vs. Oil Recovered (Core 141) ..........................................................187 Figure 9.13: Injected Brine vs. Oil Recovered (Core 180) ..........................................................187 Figure 9.14: Injected Brine vs. Oil Recovered (Core 181) ..........................................................188
xi
LIST OF TABLES
Table 1.1: Approximate Relationship between Wettability, Contact Angle, USBM, and Amott Wettability Indices..............................................................................................................20 Table 2.1: Craig’s Rules of Thumb for Determining Wettability from Relative Permeability Curves.......................................................................................................................39 Table 3.1: Heater Blanket Dial Settings and the Corresponding Temperature..............................84 Table 4.1: Berea Sandstone Core Properties..................................................................................89 Table 4.2: Core Properties from Milne Point Kuparuk River Unit L-01.......................................89 Table 4.3: Composition of ANS Reservoir Water from McGuire et al.93 .....................................95 Table 4.4: Densities of Different Brines Used in the Experiment .................................................96 Table 4.5: Core Porosities Measured from Saturation and Displacement Methods – DNR Core Samples .................................................................................................................................98 Table 5.1: Parameters for decane-containing columns tests. .......................................................113 Table 6.1: Oil/Gas Recovery and Residual Oil Saturation ..........................................................118 Table 8.1: Results of Core Samples (A through G) Using Laboratory Brine..............................160 Table 8.2: Results of Core Samples (H through J) Using ANS Lake Water ...............................161 Table 9.1: Results (Cyclic) ..........................................................................................................183 Table 9.2: Results (Varying Time Intervals) ...............................................................................189
xii
ACKNOWLEDGMENTS
The authors are thankful to the U.S. Department of Energy (USDOE) for its financial assistance
in support of the presented work.
CHAPTER 1: Introduction
The monotonic and geometric increase in world demand for energy in the face of rapid
industrialization requires the production of increasing quantities of crude oil, even with declining
production of individual fields, while maintaining acceptable cost levels. Many abandoned
and/or matured fields have become the subject of novel enhanced oil recovery (EOR) field trials
in order to meet energy demand. Resources have gone into research and development in a bid to
better understand ways to manipulate factors at pore scale levels and higher to improve oil
recovery.
Oil recovery efficiency is a function of many interacting variables/factors at pore levels as well
as macroscopic scales. Some of these interacting factors include the reservoir rock-wetting state,
pore geometry, size and distribution, salinity of the connate water and the displacing fluid,
recovery/displacement mechanisms, rock mineralogy, and other reservoir rock and fluid
properties. Efficient and cost-effective oil recovery requires an in-depth understanding of the
nature and, where possible, the optimal manipulation of these interacting variables. The study of
these variables has been a subject of interest and research in the oil industry for several decades.
Among the many identified factors that affect the pore-scale displacement mechanism, the
reservoir-wetting state has been shown to be one of the most important. Information about
wettability is fundamental to understanding multiphase flow problems, ranging from oil
migration from source rocks through primary production mechanisms to EOR processes.
Wettability also determines the nature of fluid distribution observed in the reservoir. Based on
research findings over the last six decades on the nature of wettability, the importance of
wettability in the oil recovery process has been agreed on by many researchers1,2,3,4,5.
13
1.1 Fundamental Concepts of Wettability
Wettability is the tendency of the reservoir rock surface to preferentially contact a particular fluid
in a multiphase or two-phase fluid system. Consequently, a water-wet reservoir rock will
preferentially contact water; an oil-wet reservoir will preferentially contact oil; and a gas-wet
reservoir will preferentially contact gas. However, the concept and the possibility of a truly gas-
wet reservoir has been the subject of intense debate among researchers. Experimental reports on
wettability effects on recovery in gas condensate reservoirs6 suggest that wettability in gas-
liquid-rock systems can be altered from strong preferential liquid-wetness to preferential neutral
gas-wetness by chemical treatment. However, there is currently no acceptable, unified definition
of gas wettability and the conditions under which it is achieved. Whether a reservoir rock is
strongly water-wet or oil-wet depends on the chemical composition of the fluids, resulting in
molecular attraction between the water molecules and the rock and/or the oil molecules and the
rock. The degree to which a rock is either water-wet or oil-wet is strongly affected by the
following:
(1) Adsorption or desorption of constituents in the oil phase: Usually the presence of large,
polar compounds such as asphaltenes in the oil phase enables adsorption onto the solid
surface, leaving an oil film which may alter the reservoir rock surface wettability. Where a
reservoir neither imbibes the oleic phase nor the water phase, a neutral-wet condition exists.
(2) Reservoir rock mineralogy: In the presence of “pure” paraffinic hydrocarbons, water
preferentially wets calcite and silica surfaces. However, variation in the constituents of the
crude oil component may result in the observation of other wetting states even for these
surfaces.
(3) Film deposition and spreading capability of the oleic phase.
1.2 Measurements of Wettability
Currently, there is no universally accepted method of wettability determination in the petroleum
industry. A number of wettability determination methods are available and are divided broadly
into two categories: quantitative and qualitative methods. Quantitative methods include
(1) contact angles, (2) Amott/Modified Amott (Amott-Harvey), and (3) USBM. Qualitative
methods include (1) imbibition rates7,8, (2) permeability/saturation relationship, (3) nuclear
14
magnetic resonance, NMR9, (4) dye absorption, (5) relative permeability curves10,11, and
(6) capillary pressure curves. Of the two methods—qualitative and quantitative—the latter is
generally used.
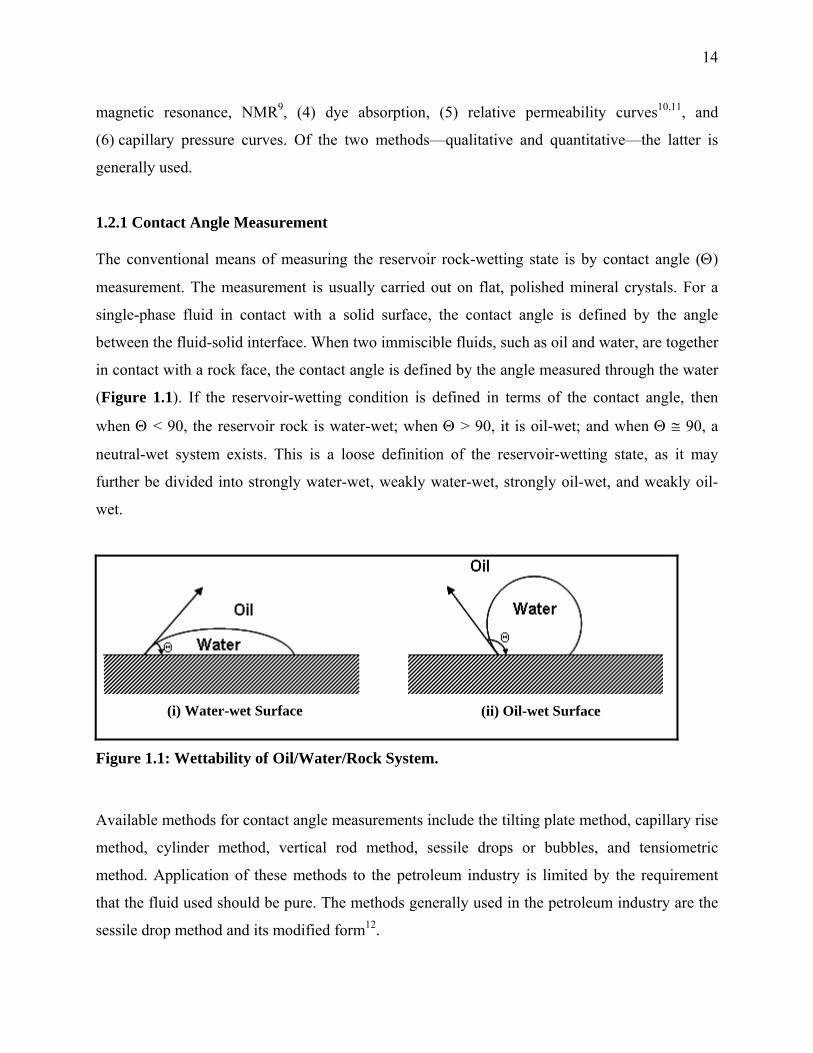
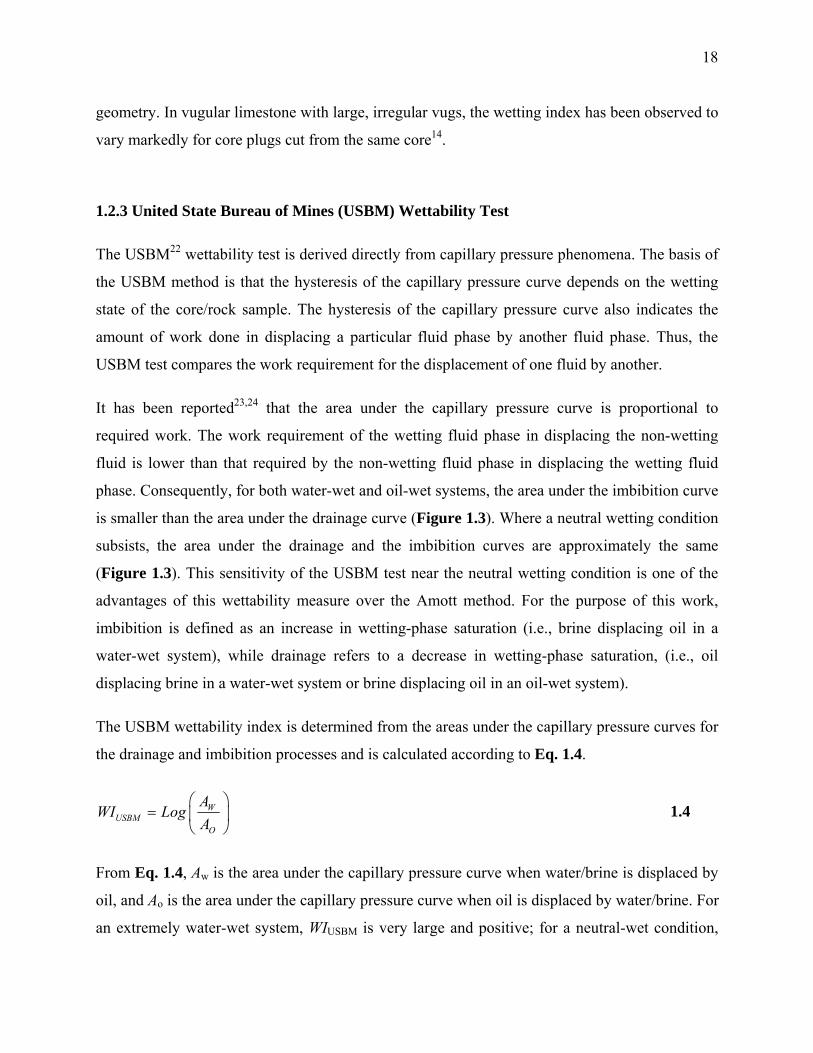
1.2.1 Contact Angle Measurement
The conventional means of measuring the reservoir rock-wetting state is by contact angle (Θ)
measurement. The measurement is usually carried out on flat, polished mineral crystals. For a
single-phase fluid in contact with a solid surface, the contact angle is defined by the angle
between the fluid-solid interface. When two immiscible fluids, such as oil and water, are together
in contact with a rock face, the contact angle is defined by the angle measured through the water
(Figure 1.1). If the reservoir-wetting condition is defined in terms of the contact angle, then
when Θ < 90, the reservoir rock is water-wet; when Θ > 90, it is oil-wet; and when Θ ≅ 90, a
neutral-wet system exists. This is a loose definition of the reservoir-wetting state, as it may
further be divided into strongly water-wet, weakly water-wet, strongly oil-wet, and weakly oil-
wet.
Figure 1.1: Wettability of Oil/Water/Rock System.
Available methods for contact angle measurements include the tilting plate method, capillary rise
method, cylinder method, vertical rod method, sessile drops or bubbles, and tensiometric
method. Application of these methods to the petroleum industry is limited by the requirement
that the fluid used should be pure. The methods generally used in the petroleum industry are the
sessile drop method and its modified form12.
(i) Water-wet Surface (ii) Oil-wet Surface
15
An important phenomenon worthy of note in contact angle measurement is the observed
hysteresis of the contact angle. It has been found experimentally that a liquid drop can have
many different stable contact angles12. Because of reproducibility problems, the contact angles
reported in literature are based either on the water-advancing contact angle or the water-receding
contact angle. However, in an experiment carried out by Treiber et al.13, only the water-
advancing contact angle was reported to correlate with other wettability indicators.
One of the more obvious limitations of wettability characterization using contact angle
measurement is the absence of a standard reference. Consequently, except at the end-value
wetting states (i.e., strongly water-wet or strongly oil-wet states), the classification of wetting
state from contact angle measurement is arbitrary and subjective. Another important limitation of
the contact angle method is that the required length of equilibration time cannot be reproduced in
the lab. This may lead to problems such as erroneous classification of wetting state and
sometimes lack of reproducibility. A third and equally important limitation is that contact angle
measurement does not take into account the rock surface heterogeneity. Contact angle
measurements are carried out on a “pure” single mineral crystal, which excludes the many other
different mineral constituents present in the reservoir rock. A fourth limitation is that information
about the presence or absence of strongly adsorbed organic materials cannot be obtained. This
information is particularly important in determining the efficiency of the core-cleaning process
when working with restored state cores.
1.2.2 Amott-Harvey Wettability Test
The Amott14 wettability test is one of the traditional means of characterizing reservoir wettability
from displacement studies. It involves a series of forced and spontaneous displacements of oil by
water and vice versa. The principle behind this method is that the core sample will spontaneously
imbibe a higher volume of the wetting phase than the non-wetting phase. Consequently, the
Amott wettability index reflects the ease with which the wetting fluid will displace the non-
wetting fluid (spontaneous imbibition), as shown in Figure 1.2.
16
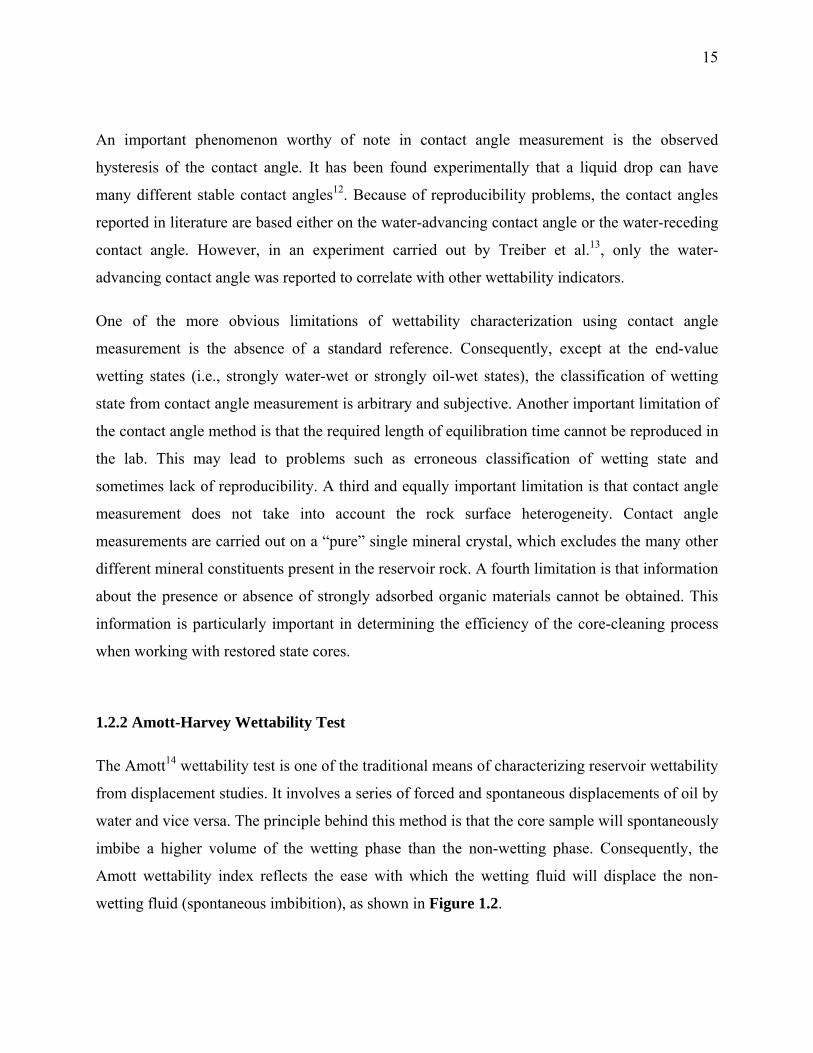
Determination of the wetting condition using the Amott test consists of the determination of two
different ratios (1) the displacement-by-water ratio, Iw, which is the ratio of oil volume
spontaneously displaced by water (Vosp) (Figure 1.2a) to the total volume of oil displaced by
water, spontaneously and by forced displacement (Vofd),
=+osp
wosp ofd
VI
V V 1.1
and (2) the displacement-by-oil ratio, Io, which is the ratio of water volume spontaneously
displaced by oil (Vwsp) (Figure 1.2b) to the total volume of water displaced by oil, spontaneously
and by forced displacement (Vwfd),
=+wsp
owsp wfd
VI
V V 1.2
Figure 1.2: Apparatus for Spontaneous Displacement of (a) Brine and (b) Oil15
17
For an extremely water-wet system, Iw will be positive (≅ 1) while Io will be zero, which
indicates that oil is not imbibed spontaneously. Similarly, Iw will be zero for an extremely oil-
wet system, while Io will be positive (≅ 1). For a neutral-wet system, both Io and Iw will be zero.
A modified Amott test, popularly known as the Amott-Harvey Relative Displacement Index16,
has gained increasing popularity and is now used instead of the original Amott test. The
experimental process for both tests is the same except that the modified Amott test has an
additional step in core preparation prior to running the test. The additional step involves the
saturation of the core sample with water/brine and flooding with (or centrifuging under) oil to
reduce the water/brine to some initial water saturation. A further modification of the modified
Amott test, called the Amott/IFP method, replaces all the centrifuging steps by injection at a
constant rate17. The expression for the Amott-Harvey Relative Displacement Index is given by
= − = −+ +osp wsp
AMOTT W Oosp ofd wsp wfd
V VWI I I
V V V V 1.3
Since the maximum and minimum values of Io and Iw are 1 and 0, respectively, it follows that the
Amott-Harvey Relative Displacement Index will take values between +1 and -1. These extremes,
respectively, represent the strongly/completely water-wet and oil-wet conditions. Cuiec18
classified the index between +0.3 and 1 (inclusive) as water-wet, -1 and -0.3 (inclusive) as oil-
wet and -0.3 and +0.3 (non-inclusive) as intermediate-wet. This classification of the relative
displacement index for different wetting states by Cuiec is arbitrary. Robin17 reported the values
of the Amott-Harvey Relative Displacement Index for two mixed-wet sandstone and carbonate
samples as equal to -0.57 and -0.81, respectively.
One of the limitations of the Amott method and its modified form is the insensitivity of the
calculated index at near-neutral wetting conditions. The key principle to the Amott test is that the
wetting phase will spontaneously imbibe and displace the non-wetting phase from the core.
However, it has been discovered19,20,21 that neither phase will spontaneously imbibe nor displace
the other at contact angles roughly between 60° to 120°12. Another limitation is the dependence
of the value of the limiting contact angle above which spontaneous imbibition will occur on the
initial saturation of the core. A third limitation is imposed to a lesser extent by the pore
18
geometry. In vugular limestone with large, irregular vugs, the wetting index has been observed to
vary markedly for core plugs cut from the same core14.
1.2.3 United State Bureau of Mines (USBM) Wettability Test
The USBM22 wettability test is derived directly from capillary pressure phenomena. The basis of
the USBM method is that the hysteresis of the capillary pressure curve depends on the wetting
state of the core/rock sample. The hysteresis of the capillary pressure curve also indicates the
amount of work done in displacing a particular fluid phase by another fluid phase. Thus, the
USBM test compares the work requirement for the displacement of one fluid by another.
It has been reported23,24 that the area under the capillary pressure curve is proportional to
required work. The work requirement of the wetting fluid phase in displacing the non-wetting
fluid is lower than that required by the non-wetting fluid phase in displacing the wetting fluid
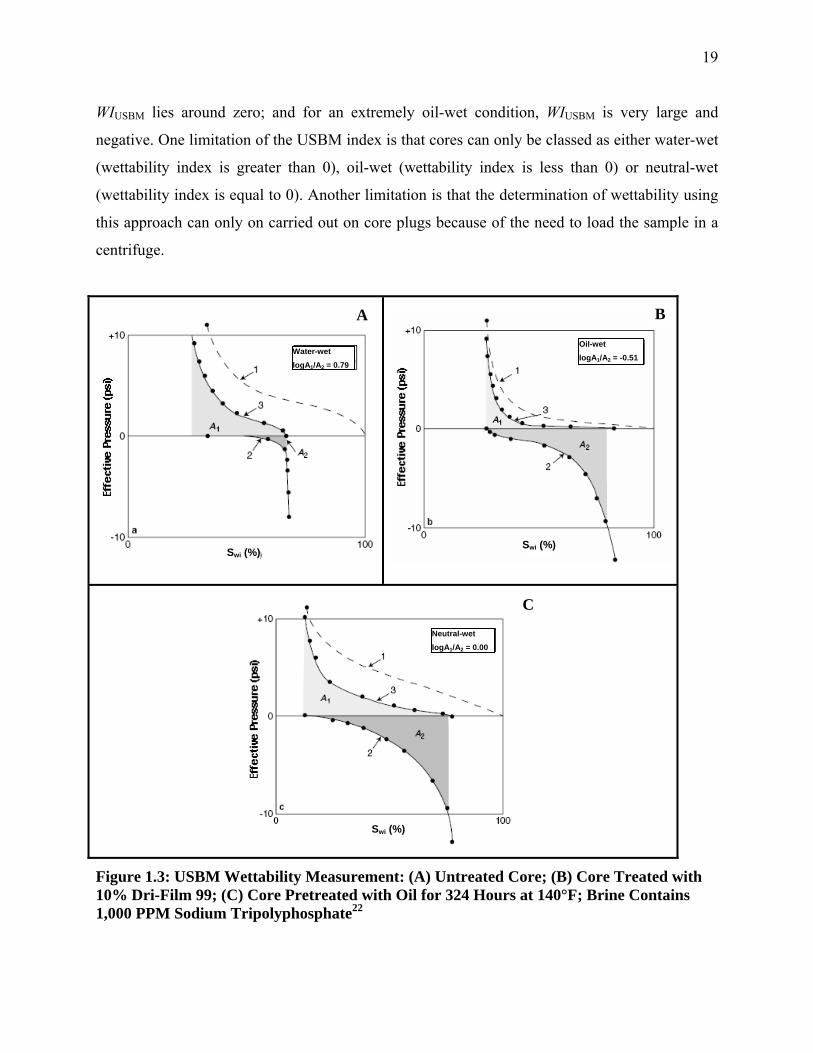
phase. Consequently, for both water-wet and oil-wet systems, the area under the imbibition curve
is smaller than the area under the drainage curve (Figure 1.3). Where a neutral wetting condition
subsists, the area under the drainage and the imbibition curves are approximately the same
(Figure 1.3). This sensitivity of the USBM test near the neutral wetting condition is one of the
advantages of this wettability measure over the Amott method. For the purpose of this work,
imbibition is defined as an increase in wetting-phase saturation (i.e., brine displacing oil in a
water-wet system), while drainage refers to a decrease in wetting-phase saturation, (i.e., oil
displacing brine in a water-wet system or brine displacing oil in an oil-wet system).
The USBM wettability index is determined from the areas under the capillary pressure curves for
the drainage and imbibition processes and is calculated according to Eq. 1.4.
WUSBM
O
AWI Log
A⎛ ⎞
= ⎜ ⎟⎝ ⎠
1.4
From Eq. 1.4, Aw is the area under the capillary pressure curve when water/brine is displaced by
oil, and Ao is the area under the capillary pressure curve when oil is displaced by water/brine. For
an extremely water-wet system, WIUSBM is very large and positive; for a neutral-wet condition,
19
WIUSBM lies around zero; and for an extremely oil-wet condition, WIUSBM is very large and
negative. One limitation of the USBM index is that cores can only be classed as either water-wet
(wettability index is greater than 0), oil-wet (wettability index is less than 0) or neutral-wet
(wettability index is equal to 0). Another limitation is that the determination of wettability using
this approach can only on carried out on core plugs because of the need to load the sample in a
centrifuge.
Figure 1.3: USBM Wettability Measurement: (A) Untreated Core; (B) Core Treated with 10% Dri-Film 99; (C) Core Pretreated with Oil for 324 Hours at 140°F; Brine Contains 1,000 PPM Sodium Tripolyphosphate22
A B
C
Oil-wet logA1/A2 = -0.51
Water-wet logA1/A2 = 0.79
Neutral-wet logA1/A2 = 0.00
Swi (%)Swi (%)
Swi (%)
20
On a general note, contact angle measurement, Amott/Amott-Harvey indices and the USBM
Index are best suited for characterizing wettability where a uniform wetting condition exists.
However, the use of the Amott wettability test to distinguish the occurrence of speckled
wettability (a form of non-uniform wetting) from uniform wettability and to characterize mixed-
wet systems has been reported17,25. In both cases, the fact that the displacement-by-water and the
displacement-by-oil ratios were both positive was taken to indicate that the system is non-
uniformly wetted.
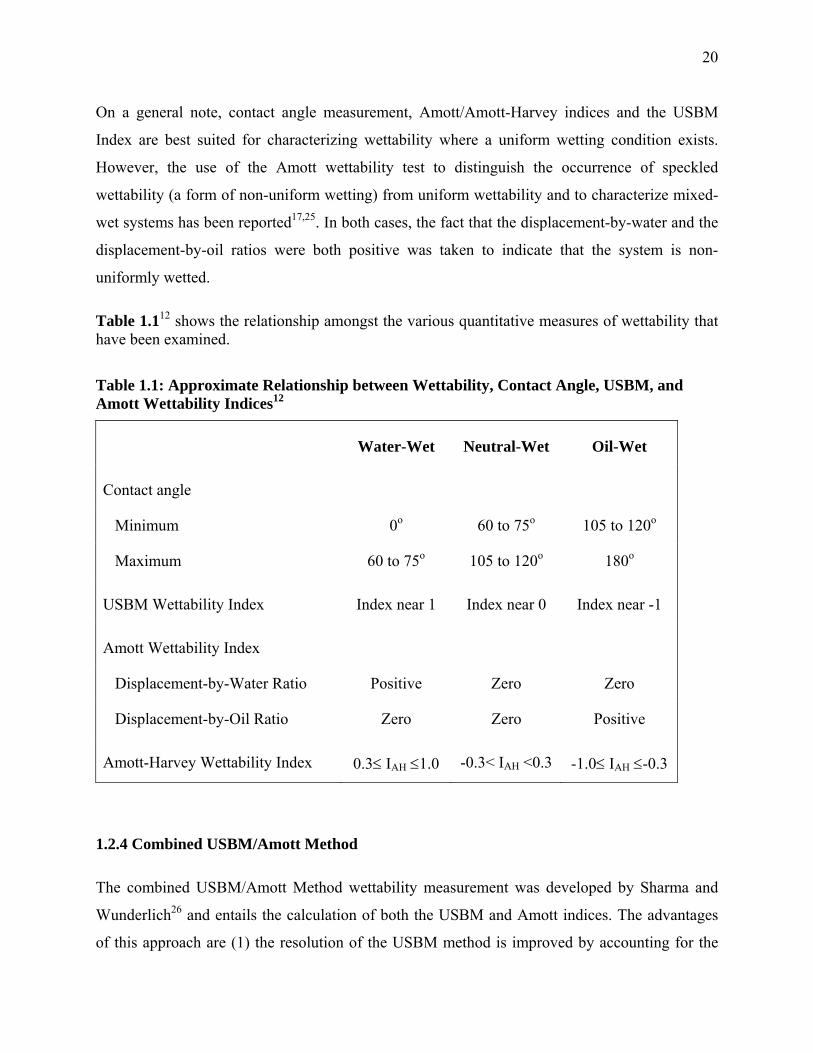
Table 1.112 shows the relationship amongst the various quantitative measures of wettability that have been examined.
Table 1.1: Approximate Relationship between Wettability, Contact Angle, USBM, and Amott Wettability Indices12
Water-Wet Neutral-Wet Oil-Wet
Contact angle
Minimum 0o 60 to 75o 105 to 120o
Maximum 60 to 75o 105 to 120o 180o
USBM Wettability Index Index near 1 Index near 0 Index near -1
Amott Wettability Index
Displacement-by-Water Ratio Positive Zero Zero
Displacement-by-Oil Ratio Zero Zero Positive
Amott-Harvey Wettability Index 0.3≤ IAH ≤1.0 -0.3< IAH <0.3 -1.0≤ IAH ≤-0.3
1.2.4 Combined USBM/Amott Method
The combined USBM/Amott Method wettability measurement was developed by Sharma and
Wunderlich26 and entails the calculation of both the USBM and Amott indices. The advantages
of this approach are (1) the resolution of the USBM method is improved by accounting for the
21
saturation changes that occur at zero capillary pressure, and the Amott index is also calculated;
and (2) it incorporates the advantage of the Amott method in sometimes determining non-
uniformly wetted systems.
1.3 Recent Advances in Methods of Wettability Index Determination
Because of the inherent limitations in the currently accepted industry standard for wettability
characterization, new methods of wettability determination have been developed. Some of the
recently developed methods include (1) Spontaneous Imbibition Measurement27, (2) Atomic
Force Microscopy28, (3) Chromatographic Method29, (4) Nuclear Magnetic Resonance (NMR)30,
and (5) Three Phase Wettability Index31,32.
Spontaneous Imbibition Measurement: This method proposed by Ma et al.27 addresses specific
limitations of the Amott/Harvey and the USBM methods with respect to certain observed
capillary pressure effects, namely (1) the inability of the Amott/Harvey index to discriminate
between systems that attain residual non-wetting phase saturation without change in sign of the
imbibition capillary pressure (usually for strongly wetted system; and (2) the inability of the
USBM method to recognize variation in wetting behavior for contact angles ranging from 0° to
55°. Within this range, the area under the forced imbibition curve is zero.
Atomic Force Microscopy28: This method is proposed for the characterization of mixed-wet
states by direct measurement of the capillary pressure required to rupture brine films on mineral
surfaces. This is achieved by measuring the force versus distance curve between crude oil and a
mineral surface in brine using an atomic force microscope.
Chromatographic Method29: This method is based on the chromatographic separation between
the tracer thiocyanate (SCN-) and the potential determining sulfate ion, −24SO , at the water-wet
sites on the rock surface. The area between the effluent curves of the tracer and sulfate is directly
proportional to the water-wet surface area inside the core. Heptane is used as the reference oil to
symbolize a completely water-wet system. This method is reported to be sensitive to small
wettability changes, even at close to neutral conditions where the Amott test method is not very
sensitive.
22
Nuclear Magnetic Resonance (NMR)30: This method is used to determine in situ wettability of
rocks from NMR logs. It is based on the fact that fluids experience additional relaxation when in
direct contact with the rock surface. The reduction of oil relaxation time away from its bulk
value is generally known as a qualitative measure of wettability. Based on this concept, a
quantitative wettability index, Iw, is developed based on detailed modeling of NMR response and
is defined by
SurfaceTotaloilbywettedSurfacewaterbywettedSurfaceI w
−= 1.5
It is reported that this new wettability method has been verified extensively on core data against
standard wettability tests.
Three Phase Wettability Index31,32: This index is based on the evaluation of the relative
permeability and capillary pressure at specific wetting-phase saturation using the developed
analytical expression given in Eq 1.6. The authors proposed that the index is suitable for
wettability evaluation for both a gas-liquid-rock system and a liquid-liquid-rock system. The
equation is expressed as follows:
⎟⎟⎠
⎞⎜⎜⎝
⎛⎟⎟⎠
⎞⎜⎜⎝
⎛⎟⎠⎞
⎜⎝⎛ +
= *
2
w
rwciw S
kFkP
Wφλ
λσ
1.6
where Wiw is the wettability index at a specific wetting-phase saturation; λ is the pore size
distribution index; k and φ are the absolute permeability and the porosity of the rock; F is the
lithology factor; σ is the interfacial tension between the fluids; Pc and *wS are the capillary
pressure and the normalized saturation of the wetting phase; krw is the relative permeability of the
wetting phase. The value of Wiw ranges from -1 to +1.
1.4 Wettability in Reservoirs
Most early analyses on the effect of wettability on oil recovery were based on two simplistic
assumptions, which state that (1) most of the reservoirs were strongly water-wet and the
23
reservoir rock surface was completely “coated” with water22,33 and that (2) the wetting state was
such that a uniform/homogeneous wetting condition existed throughout the reservoir.
The assumption of a strongly water-wet reservoir was informed by the saturation history of the
reservoir, wherein the reservoir was completely saturated by water prior to the displacement of
the initial volume of water occupying the pore volume (PV) due to migration and trapping of oil.
It was believed that there was no alteration of the wetting condition in the reservoir after the
migration of oil. This opinion held sway for a long time and guided many research experiments.
While the fact that the pore volume was initially occupied by water is generally not in doubt, it
has been shown13,21,34 that the actual wetting state of the reservoir may depart from the strongly
water-wet state to other wetting states. This final wetting state of the reservoir is dependent on a
number of factors, including the following:
(1) the presence or absence in the crude oil of (a) polar compounds, (b) film forming
components, and (c) high molecular-weight hydrocarbon compounds such as paraffins,
porphyrins;
(2) the type and distribution of minerals present;
(3) the reservoir rock type; and
(4) the height of the oil-water contact.
After it became clear that the initial wetting state of the reservoir may possibly depart from the
strongly water-wet condition, the assumption of uniform wetting condition was unchallenged.
Consequently, initial studies into the relationship between wettability and oil recovery were
conducted on samples that were uniformly wetted, that is, strongly water-wet, strongly oil-wet,
intermediate/neutral wettability, etc. However, problems connected with observed reservoir
production data sparked research interest into a possible departure of the reservoir-wetting state
from uniform wettability. Consequently, beginning from the early 1950s, the assumption of
uniform wettability for most reservoirs was challenged by many early authors who posited35,36
that the wetting of the reservoir rock surface is indeed heterogeneous. Further research insights,
into the wetting state of reservoir rocks, did suggest9,37 that heterogeneous wettability may be the
24
normal condition in reservoirs. The discovery of possible non-uniform wetting conditions in the
reservoir opened up new vistas of understanding and research in reservoir rock wettability and
led to the definition of other wetting states, besides the gamut covering strongly water-wet to
strongly oil-wet conditions. These conditions include
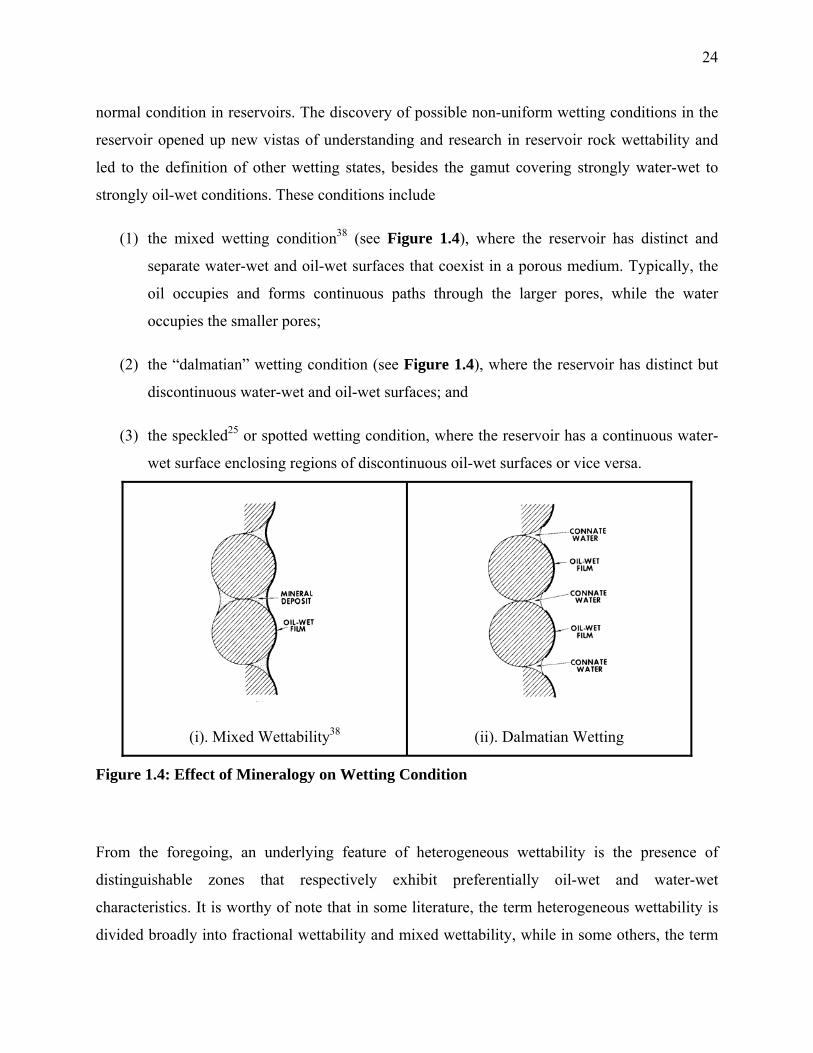
(1) the mixed wetting condition38 (see Figure 1.4), where the reservoir has distinct and
separate water-wet and oil-wet surfaces that coexist in a porous medium. Typically, the
oil occupies and forms continuous paths through the larger pores, while the water
occupies the smaller pores;
(2) the “dalmatian” wetting condition (see Figure 1.4), where the reservoir has distinct but
discontinuous water-wet and oil-wet surfaces; and
(3) the speckled25 or spotted wetting condition, where the reservoir has a continuous water-
wet surface enclosing regions of discontinuous oil-wet surfaces or vice versa.
(i). Mixed Wettability38
(ii). Dalmatian Wetting
Figure 1.4: Effect of Mineralogy on Wetting Condition
From the foregoing, an underlying feature of heterogeneous wettability is the presence of
distinguishable zones that respectively exhibit preferentially oil-wet and water-wet
characteristics. It is worthy of note that in some literature, the term heterogeneous wettability is
divided broadly into fractional wettability and mixed wettability, while in some others, the term
25
fractional wettability is defined as synonymous to heterogeneous wettability. For this work, the
former definition is adopted.
The extent, type, and distribution of wetting heterogeneity are greatly influenced by the chemical
variation/distribution of the minerals present in the pores of the reservoir rock. Carbonates are
believed to be more oil-wet than clastics. Clean sandstone or quartz has been known to exhibit
extremely water-wet conditions, although departure from this general trend has been reported
due to the presence of certain minerals. A case in point is the quartz reservoir rock of North
Burbank that was observed to exhibit a strongly oil-wet character because of the coating of
chamosite [(Fe52+ Al)(Si3Al)O10(OH)8] clay, which is reported to cover about 70% of the
reservoir rock surface39. It is noteworthy that the existence of an extremely water-wet or
extremely oil-wet reservoir is rare; only for the gas-liquid system is it generally safe to assume
that gas is always in the non-wetting phase.
1.5 Mechanism of Wettability Variation in Reservoirs
It is generally accepted that the initial/“first” wetting state of the reservoirs, particularly for
sandstone reservoirs, is a strongly water-wet state, since all reservoirs are initially occupied by
water. With the migration of oil into the reservoir, the water is displaced first from the very large
pores and then from progressively smaller pores until such a point where the capillary forces
holding the water in the very small pores cannot be overcome by the displacing force of the oil.
This condition is typically observed at grain contacts and small capillaries. Over a long geologic
period and equilibration/stabilization time, certain components from the oil, which include
surface active materials, polar compounds, porphyrins, or high molecular paraffinic hydrocarbon,
may deposit on or be adsorbed into the rock matrix, altering the wettability of the reservoir.
Where film deposition accounts for wettability variation, it has been suggested40 that the
deposited film is identical to the “prune skin” film observed at the oil-brine interface. From the
foregoing, it is evident that the crude oil composition is important in wettability variation in the
reservoir, a fact that has been demonstrated by several researchers41,42. In addition to the
composition of the crude oil, the “ability of the oil to contact the reservoir rock surface” is
equally as important in the wettability variation process.
26
Hirasaki43 observed that variations in wettability are often related to the presence or absence of
stable water films between the oil and the reservoir rock surface. He argued that wetting in crude
oil/brine/rock (COBR) systems would be determined by thickness of the water film. If stable
thick water films separate the oil from the rock, the system will be water-wet. Conversely,
unstable films will rupture possibly leaving one to a few molecular layers of water, and the oil
comes in close contact with the rock surface. Polar oil components can then adsorb or deposit on
the rock surface. Asphaltenes have specifically been considered responsible for wettability
alterations because of their polar groups that may interact and bind to the mineral surface.
This concept of water-film stability may be extended to account for the variation of wettability
with height above the oil-water contact. The stability of water film depends on the capillary
pressure and the value of the critical disjoining pressure. The disjoining pressure is the change in
energy per unit area with change in distance that is observed when two interfaces are brought
together from a large separation distance to finite thickness43. A positive disjoining pressure
tends to disjoin or separate two interfaces while a negative disjoining pressure tends to attract
two interfaces. The relationship between the disjoining pressure and capillary pressure is
expressed by the augmented Young-Laplace equation thusly:
2α γ αγ αγσ− = Π + +p p H 1.3
where α γ−p p = Laplace pressure or capillary pressure, Pc
Π = disjoining pressure αγH = mean curvature αγσ = interfacial tension (IFT)
Where the capillary pressure is above the critical disjoining pressure, thin films of water that wet
the reservoir rock are ruptured such that the crude oil contacts the reservoir rock and eventually
wets it. Consequently, it is expected that the reservoir will get progressively more oil-wet as the
capillary pressure increases and the water saturation decreases. This accounts for the variation in
wetting condition with increasing height above the oil-water contact.
27
Kaminsky and Radke44 have reported, however, that it is possible for the wettability of the
reservoir to be altered without rupturing the stable film of water. In their work, it was shown that
components having only minute solubility in water are capable of diffusing through the water
films at fast enough rates (laboratory scale) and then adsorbing onto the mineral surface. The fact
that not all asphaltic oil reservoirs are oil-wet seems to contradict this explanation. In explaining
this apparent contradiction, they suggested that in such cases, asphaltene adsorption in the
presence of a finite water film is not necessarily strong enough to alter the wetting state.
1.6 Reservoir Wettability and Oil Recovery Efficiency
The fact that wettability affects oil recovery efficiency is widely acknowledged. One of the
seminal works on the importance of wettability on waterflooding performance was by Buckley
and Leverett1 in 1941. However, the wetting phase that will result in optimal recovery of oil
appears to be the subject of intense research debate. Reported observed cases of optimal oil
recovery for water-wet, intermediate-wet/neutral-wet and oil-wet conditions have been
published2,11,14,22. The reason for this divergence in reports is attributable to a number of
modifying factors, which include, among other reasons, the following:
(1) constraint of difficulty in wetting state reproducibility;
(2) lack of a unified standard procedure for coring, core handing, and core storage;
(3) different methods adopted for wetting-state characterization and their inherent
limitations; and
(4) the fact that a host of other reservoir rock and fluid properties, in addition to the reservoir
wetting condition, also act to influence oil recovery efficiency.
1.7 Wettability Alteration in Cores
Departure from strongly water-wet conditions has been reported to result in either a decrease or
an increase in oil recovery efficiency, reflecting the range of possible wettability changes. The
difficulty in measuring the in situ reservoir-wetting state necessitates the “surface” determination
of reservoir wettability through the use of core plugs or whole length cores. However, the
wetting state of the core samples may be altered from their in situ values during cutting,
28
surfacing, and handling of the core samples. Variation of core wettability from in situ reservoir
wettability is due to a number of reasons including the following:
1. Temperature and pressure drop as the core sample is brought to the surface which results
in the flashing of the connate water present
2. Drying of the core
3. Invasion of drilling mud during coring
4. Compositional changes resulting in asphaltene deposition or wax precipitation from the
crude oil because of reduction in temperature and pressure
5. Oxidation, contamination, and desiccation during handling/storage. The oxidation
process may sometimes enhance deposition.
Care must be taken in the handling of the core samples to ensure that the actual wettability is not
altered. Usually the wetting state of the core plug may be altered in one of the stages beginning
with coring, core handling, core preservation, and wettability measurement in the laboratory.
Where the core wetting state has been altered, care should be taken to duplicate/reproduce the
reservoir wetting conditions as closely as possible. The subject of preservation of core wettability
and the accurate reproduction of altered core wettability is another area of research debate.
However, some published reports7,5,42,45,46,47,48 in this regard have suggested ways of preserving
and restoring in situ core wetting state so as to ensure that reservoir rock wettability is accurately
measured. In addition, these methods help to ensure that core samples used in the laboratory for
determination of oil recovery efficiency and related studies are representative.
1.8 Objectives
The primary aim of this research study is to experimentally ascertain the influence of wettability
on oil recovery efficiency in representative Alaskan cores. Analysis of the resulting data from the
experimental work will be used to demonstrate how influencing the wettability through injection
of fluids with different salinities can be used to improve recovery efficiency in typical EOR
processes of interest to ANS exploration.
29
Several EOR methods have been evaluated for use in Alaska for improved oil recovery (IOR)
and these include (1) thermal methods; (2) gasflooding (including water-alternating gas [WAG]);
(3) chemical methods for medium to light oils; and (4) microbial methods. Currently only the
second option is applied widely at the ANS field for EOR applications, while active research is
still ongoing in the applicability of some of the other EOR methods to ANS. Apart from these
EOR methods, secondary oil recovery methods such as waterflooding (using formation and/or
treated seawater) and gas injection (for pressure maintenance) are also employed in a bid to
increase the total volume of oil recovered from ANS. Despite the application of all these EOR
and secondary oil recovery methods in Alaska, significant oil volumes remain in place in a
typical reservoir after these methods are applied. Industry production data do suggest, however,
the possibility of significantly improving EOR operations in ANS fields by developing (1) a
better understanding of wettability in general and mixed wettability in particular; and
(2) methods to alter wetting states in Alaskan reservoirs. Consequently, characterizing the
wetting state of ANS reservoirs, understanding how the injected and resident fluid composition
influences wettability and oil recovery, and developing methods that fundamentally improve
wettability to achieve higher recovery efficiencies, are crucial to the EOR mission of the Arctic
Energy Technology Development Laboratory (AETDL).
In order to realize the EOR mission of AEDTL and improve oil production characteristics in
ANS fields, the need exists to (1) experimentally ascertain the influence of wettability on
recovery efficiency in representative Alaskan cores; and (2) demonstrate how influencing the
reservoir wettability through injection of fluids with different salinities and composition can be
used to improve recovery efficiency. The effects of salinity on wettability, oil recovery
efficiencies, and residual oil saturation during waterflooding are of particular interest in Alaska,
where a unique opportunity exists to develop low-salinity reservoirs (e.g. the Prince Creek
formation) to provide injection water for new waterfloods in Western Prudhoe Bay, and new
heavy oilfloods at Milne Point and Kuparuk.
Based on the foregoing, the overall aim of this research study entails the determination of the
effect of wettability and its variation (because of changes in brine salinity) on oil recovery on
representative cores from ANS. Based on this development, the experimental studies were

30
conducted on core samples: Berea sandstone samples, Kuparuk River unit cores (KR-L01), cores
from the archives of the Alaska Department of Natural Resources (DNR), and representative
core samples from an ANS operator. Consequently, the specific objectives of this research study
are as follows:
1. Observe the effect of variation in the salinity of the injected brine on oil recovery and
residual oil saturation.
2. Determine the effect of increasing the temperature of the injected brine on oil recovery
efficiency
3. Characterize the wettability changes/alteration, if any, induced by (1) and (2) using the
Amott-Harvey wettability index
4. Employ cyclic water injection for EOR (within scope expansion of the project)

31
EXECUTIVE SUMMARY
Multiphase fluid flow distribution and behavior in petroleum reservoirs is influenced by a myriad of interacting variables like pore geometry, wettability, rock mineralogy, brine salinity, oil composition, brine injection rate, and chemical properties of the brine. Reservoir wettability is known to have very significant influence on pore scale displacement and is a strong determinant of the final residual oil saturation and hence the oil recovery. Studies have indicated the improved oil recovery potential of low-salinity brine injection.
The experimental work and the results covered in this report can aptly be divided into three phases. The first and second phases investigate low-salinity brine injection effect on wettability of the rock and final residual saturation. The third phase evaluates the added benefits of cyclic water injection to the earlier work.
As part of the first phase, extensive literature study was performed on wettability characterization of reservoir rocks and low-salinity brine injection as a means for improved oil recovery. Coreflood studies were carried out on DNR and Berea cores to determine the recovery benefits of low-salinity waterflood over high-salinity waterflood and the role of wettability in any observed recovery benefit. Two sets of coreflood experiments were conducted; the first set examined the EOR potential of low-salinity floods in tertiary oil recovery processes while the second set examined the secondary oil recovery potential of low-salinity floods. Changes in residual oil saturation with variation in wettability and brine salinity were monitored. All the coreflood tests consistently showed an increase in produced oil and water-wetness with decrease in brine salinity and increase in brine temperature.
In the second phase, three sets of coreflood experiments were conducted on representative Alaska North Slope (ANS) core samples. All the sets of experiments examined the effect of brine salinity variation on wettability and residual oil saturation of representative core samples. The core samples used in the first and third set were new (clean) while in the second set core samples were oil aged. For first and second sets laboratory reconstituted 22,000 TDS, 11,000 TDS and 5,500 TDS (total dissolved solids) brines were used while for the third set ANS lake water was used. Oil aging of core decreased the water-wetting state of cores slightly. This observation could be attributed to adsorption of polar compounds of crude oil. The general trend observed in all the coreflood experiment was reduction in Sor (up to 20%) and slight increase in the Amott-Harvey wettability index with decrease in salinity of the injected brine at reservoir temperature. Additional coreflooding tests included water injection (high as well as low salinity in tertiary mode) under complete reservoir conditions using live oil. These tests, which were carried out on two core samples, also indicated a reduction in residual oil saturation with decrease in water salinity.
Cyclic flooding is performed by injecting the brine at a lesser flow rate with cyclic pulses of flow period and idle period. This allows the brine to spread well into the pore capillaries and displace the oil effectively. Low-salinity cyclic water injection is an interesting combination that offers the effects of both, with notably high oil recovery and less usage of water. In this third phase of the project work, water-oil flood experiments were conducted on dry sandstone cores from BPXA (some of them used in the second phase) in a core holder apparatus at atmospheric
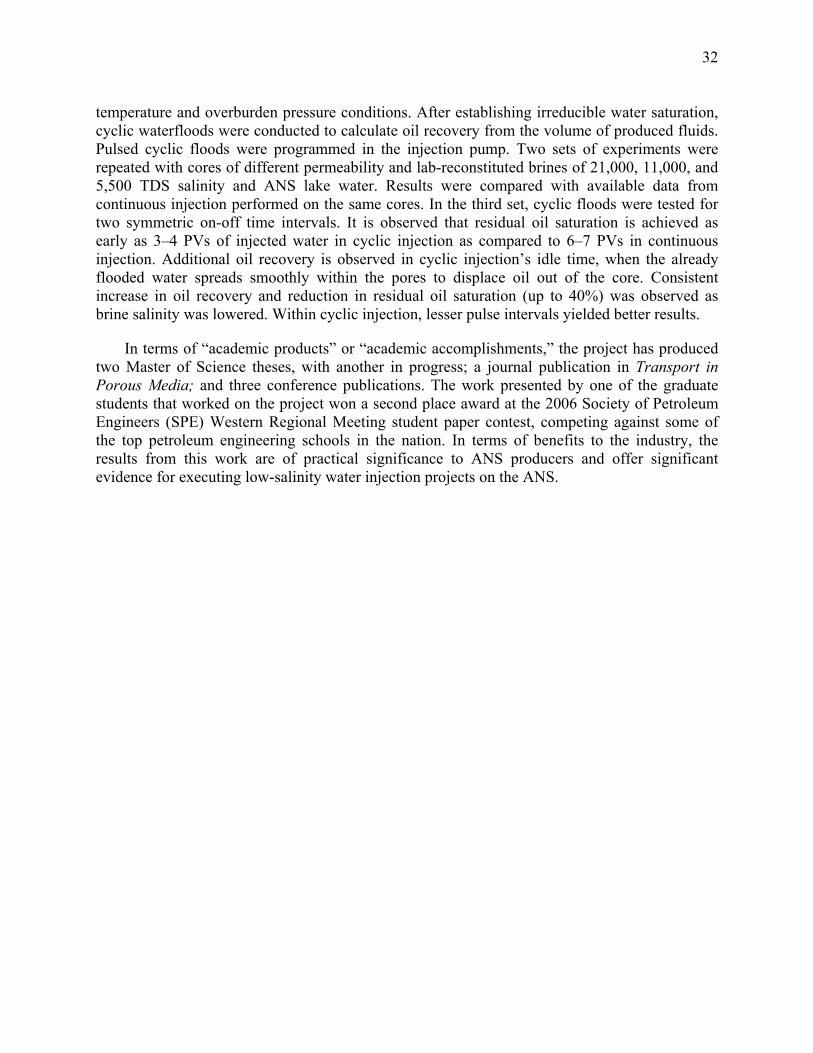
32
temperature and overburden pressure conditions. After establishing irreducible water saturation, cyclic waterfloods were conducted to calculate oil recovery from the volume of produced fluids. Pulsed cyclic floods were programmed in the injection pump. Two sets of experiments were repeated with cores of different permeability and lab-reconstituted brines of 21,000, 11,000, and 5,500 TDS salinity and ANS lake water. Results were compared with available data from continuous injection performed on the same cores. In the third set, cyclic floods were tested for two symmetric on-off time intervals. It is observed that residual oil saturation is achieved as early as 3–4 PVs of injected water in cyclic injection as compared to 6–7 PVs in continuous injection. Additional oil recovery is observed in cyclic injection’s idle time, when the already flooded water spreads smoothly within the pores to displace oil out of the core. Consistent increase in oil recovery and reduction in residual oil saturation (up to 40%) was observed as brine salinity was lowered. Within cyclic injection, lesser pulse intervals yielded better results.
In terms of “academic products” or “academic accomplishments,” the project has produced two Master of Science theses, with another in progress; a journal publication in Transport in Porous Media; and three conference publications. The work presented by one of the graduate students that worked on the project won a second place award at the 2006 Society of Petroleum Engineers (SPE) Western Regional Meeting student paper contest, competing against some of the top petroleum engineering schools in the nation. In terms of benefits to the industry, the results from this work are of practical significance to ANS producers and offer significant evidence for executing low-salinity water injection projects on the ANS.

33
CHAPTER 2: Literature Review – Wettability and Oil Recovery
Waterflooding is a secondary oil recovery process in which water is injected into a reservoir to
recover additional quantities of oil that have been left behind after primary recovery.
Waterflooding is by far the most widely applied method for improved oil recovery and accounts
for more than one-half of U.S. domestic oil production. Similar proportions hold worldwide.
When waterflooding is carried out in a strongly water-wet system, water is imbibed into smaller
pores because of favorable capillary forces and oil displaced into the larger pores. The
displacement process is such that the water phase maintains a fairly uniform front, and only the
oleic phase moves ahead of the front. Because of the preferential wetting of the rock surface by
water, the oil is displaced in front of the water, which advances along the walls of the pores. At
some point, the neck connecting the oil in the pore with the remaining oil will become unstable
and snap off, leaving spherical oil globule trapped in the center of the pore49 (Figure 2.1). After
water passes and traps the oil, almost all the remaining oil is immobile. The disconnected
residual oil exists as (1) small, spherical globules in the center of the larger pores; and (2) larger
patches of oil extending over many pores that are surrounded by water.
In strongly oil-wet systems, the location of the two fluids is reversed from the water-wet case.
Waterflooding in strongly oil-wet system is generally less efficient than in a strongly water-wet
case. After the start of waterflooding, the water will form continuous channels or fingers through
the centers of the larger pores, pushing oil in front of it (Figure 2.2). Oil is then left in the
smaller pores and crevices. Typically, in strongly oil-wet reservoirs, the oil remaining is found
(1) as continuous film over pore surfaces, (2) in pore throats, and (3) big pockets of oil trapped
and surrounded by water (due to formation of continuous fingers and channels of the displacing
water in the center of the pore. These fingers may eventually merge trapping the oil in between
them).
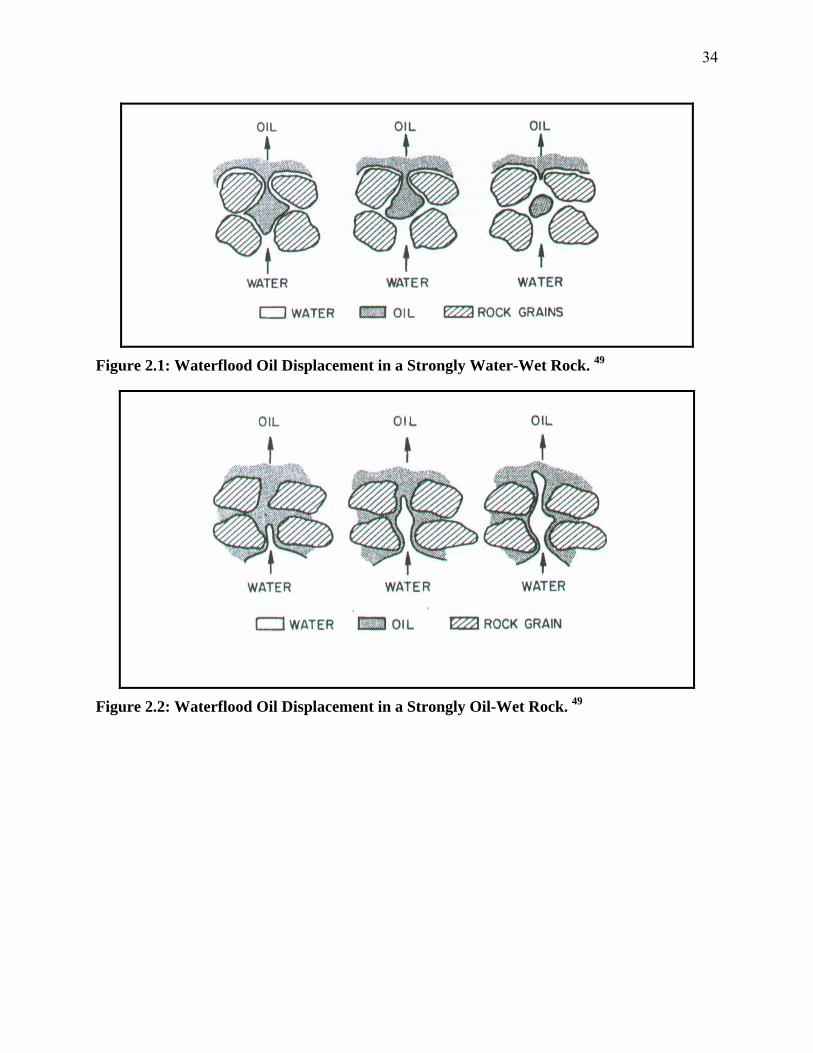
34
Figure 2.1: Waterflood Oil Displacement in a Strongly Water-Wet Rock. 49
Figure 2.2: Waterflood Oil Displacement in a Strongly Oil-Wet Rock. 49

35
2.1 Wettability and Relative Permeability
It has long been known that wettability is a primary determinant of waterflood recovery
efficiency1,2,11,14,22. Additionally, waterflood recovery is controlled by the oil-water relative
permeability, which is an implicit function of wettability. In practice, the most generally
accepted method of taking wettability effects into account in waterflooding is through making
relative permeability measurements on reservoir core samples using reservoir fluids at reservoir
temperature and pressure50
2.1.1 Wettability and Relative Permeability in Uniformly Wetted Media
The uniformly wetted medium represents a system where the wettability of the entire surface is
uniform; that is, it is either oil-wet, water-wet, or intermediate-wet. Depending on the way the
relative permeability curve is normalized, the shape of the relative permeability curve may differ
for similar fluid combinations under the same condition as wettability changes. Normalization of
the relative permeability curve is achieved either by using the absolute permeability of the rock
to brine/air or the effective permeability of the rock to oil at interstitial water saturation (IWS). In
this work, the terms interstitial water saturation, connate water saturation and irreducible water
saturation are assumed to mean the same thing and are thus used interchangeably. It has been
reported that the effective permeability to oil at IWS decreases as the core becomes more oil
wet11. It has also been shown that as the core becomes more oil-wet, relative permeability curves
normalized with the absolute permeability result in the decline in relative (effective) oil
permeability at initial water saturation51. Where the relative permeability curve is normalized
with the effective oil permeability, the wettability effect observed in the former case (absolute
permeability normalization) is factored out such that the curves start at the same point
irrespective of wettability changes52.
Figure 2.3A and Figure 2.3B illustrate the dependence of the oil-water relative permeability on
wettability. They show the imbibition relative permeability (on a semilog scale) for oil and water
in a fired Torpedo sandstone core11.

36
Figure 2.3A11: Relative Permeabilities for Two Wetting Conditions.
In the experiment, uniform rock surface was created through firing the core. Oil wettability was
induced by the use of an oil-soluble surfactant in the oil. Contact angle measurement was used to
characterize the wetting state of the core. Base permeabilities for both figures were determined
as the effective permeabilities of the rock to the oil at connate water saturation. From Figure
2.3A, the relative permeability to oil is higher in the slightly water-wet case ( o47Θ = ) than in
the strongly oil-wet case ( o180Θ = ). This observed hysteresis of the relative permeability curves
agrees with the understanding of saturation distribution obtainable for the different wetting
states. Because of the fact that oil is strongly held in the pore throats (for Θ = 180o) by strong
capillary forces, it is easier to displace water than the oleic phase in this case. The converse
situation is also observed for a strongly water-wet system.
The trend in relative permeability relationship to wettability observed in Figure 2.3A is also
illustrated in Figure 2.3B. It is observed that for all values of water saturation above the connate

37
water saturation, the relative permeability to water decreases with increasing water-wetness.
When the water saturation is 60%, the relative permeability of the rock to water is 4% while that
to oil is 11% for the strongly water-wet case (contact angle equal to 0o). For the strongly oil-wet
case, with contact angle equal to 180o, the relative permeability to water at the same saturation
increases a factor of 10 to a value of 40% while that to oil decreases to a value almost equal to
zero. The implication is that at higher values of contact angle (where the reservoir rock becomes
progressively more oil-wet), the transmissibility of the reservoir rock to water is higher than to
oil and as such the recovery of oil should be less efficient in a strongly oil-wet case than in a
water-wet case.
Figure 2.3B11: Relative Permeabilities for a Range of Wetting Conditions.
Morrow et al.4 studied the effect of wettability variation on steady-state relative permeability
with water and mineral oil. Their studies were conducted under water-wet, neutral-wet, and oil-
wet conditions. Wettability changes were achieved by the use of varying concentrations of

38
octanoic acid in the oil. They observed that the water relative permeability increased as the
system became more oil-wet, while the oil relative permeability decreased. They also observed
that the crossover point occurred at lower water saturations as oil-wetness of the system
increased.
Mungan53 measured the unsteady state relative permeability in Teflon cores and reported that the
relative permeability ratio (displacing to the displaced phase) is nearly vertical and extends over
a short saturation interval when the wetting fluid displaces the non-wetting fluid. He further
observed that the converse situation is obtained when the non-wetting fluid displaces the wetting
phase. In this case, the relative permeability ratio is comparatively higher at a given ratio and
extends over a greater saturation range.
The reported dependence of the relative permeability curve on wettability changes/variation has
been validated by many researchers53,54,55. However, McCaffery et al.55 reported that relative
permeability is not affected by wettability changes at strongly wetted conditions and that large
changes occurred only when the system’s wettability is near neutral. Similar observations were
reported by Morrow et al.56,57 on changes in capillary pressure curves with variation in
wettability. However, the reported observation by Owen and Archer11 disagreed with this finding
as they only observed changes in relative permeability curves for the wettability range between
the contact angles of 0° and 47°.
Trend observations of the relative permeability behavior (Figure 2.3) suggest the possibility of
developing some generic correlation relating relative permeability to wettability for uniform
wetness and for homogeneous wettability. Development of this correlation will aid in inferring
wettability from relative permeability curves. However, no functional correlation has been
developed even though guidelines for evaluating wetting conditions have been proposed.
Before concluding this section, it is pertinent to present Craig’s Rule of Thumb48 for determining
wettability from relative permeability curves for strongly wetted systems. The rule of thumb is
presented in Table 2.1. Note, however, that other factors such as pore geometry, initial water
saturation, pore size distribution, and pore connectivity also influence the shape of the relative
permeability curve. Morgan and Gordon58 demonstrated this fact when they measured relative
permeabilities in cleaned water-wet cores and reported pronounced differences between the cores

39
that have large, well-connected pores and ones that have smaller, less-well-interconnected pores.
Caudle et al.59 reported that relative permeability curves measured on water-wet sandstone were
dependent on initial water saturation. Changes in the initial water saturation will result in a
change in shape and location of the curves. Consequently interpretation of rock wettability using
Craig’s Rule of Thumb 48 should be supplemented where possible with other measures of
wettability less susceptible to “noise” (i.e., other factors which also influence the shape of the
relative permeability curve as already described above).
Table 2.1: Craig’s Rules of Thumb for Determining Wettability from Relative Permeability Curves48
Water-Wet Oil-Wet
Interstitial water saturation Usually greater than 20%
to 25% PV.
Generally less than 15%
PV. Frequently less than
10%
Saturation at which water and oil
relative permeabilities are equal
Greater than 50% water
saturation
Less than 50% water
saturation
Relative permeability to water at
the maximum water saturation
(i.e., floodout); Based on the
effective oil permeability at
interstitial water saturation
Generally less than 30% Greater than 50% and
approaching 100%
2.1.2 Wettability and Relative Permeability in a Non-uniformly Wetted Media.
For a mixed-wet case, water and oil may be spontaneously imbibed respectively at high oil and
water saturations. The peculiar characteristic of a mixed-wet reservoir is that parts of the rock
surfaces (usually the large pore spaces) are preferentially oil-wet with the oil film being
continuous, while the remaining parts (fine pores and grain contacts, pore throats) are
preferentially water-wet. For mixed-wet systems, the relative permeability to oil is reasonably
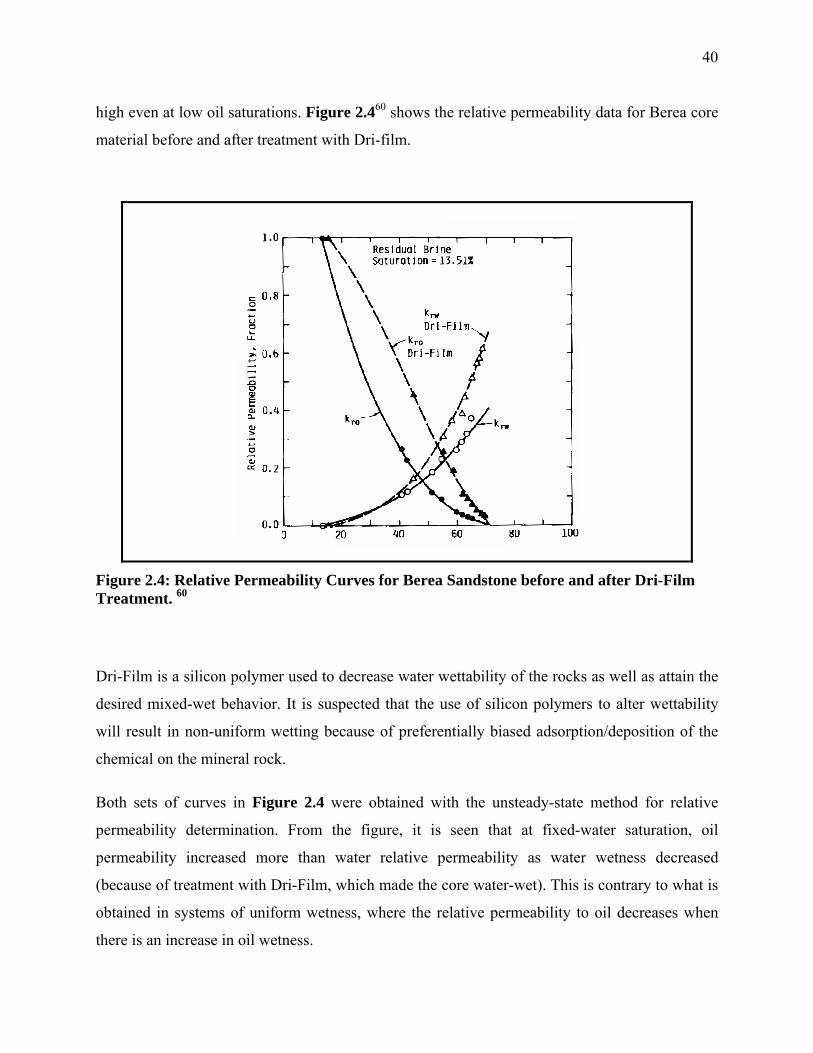
40
high even at low oil saturations. Figure 2.460 shows the relative permeability data for Berea core
material before and after treatment with Dri-film.
Figure 2.4: Relative Permeability Curves for Berea Sandstone before and after Dri-Film Treatment. 60
Dri-Film is a silicon polymer used to decrease water wettability of the rocks as well as attain the
desired mixed-wet behavior. It is suspected that the use of silicon polymers to alter wettability
will result in non-uniform wetting because of preferentially biased adsorption/deposition of the
chemical on the mineral rock.
Both sets of curves in Figure 2.4 were obtained with the unsteady-state method for relative
permeability determination. From the figure, it is seen that at fixed-water saturation, oil
permeability increased more than water relative permeability as water wetness decreased
(because of treatment with Dri-Film, which made the core water-wet). This is contrary to what is
obtained in systems of uniform wetness, where the relative permeability to oil decreases when
there is an increase in oil wetness.

41
Wang et al.61 examined the effect of wettability alteration on water-oil relative permeability
using two Berea and Loudon cores. The Loudon cores were initially mixed-wet and were made
water-wet by Dean Stark’s extraction, while the mixed wetting state was achieved in the water-
wet Berea core by aging in Loudon crude. Measurement of the steady-state relative permeability
was done using the principle described by Braun and Blackwell62. They compared the imbibition
relative permeabilities of the Berea before and after aging, and discovered significant differences
at high-water saturations >50%. They reported that the aged Berea had a residual oil saturation of
17% while the natural Berea showed a value as high as 47%. The endpoint water relative
permeability was 35% in the aged Berea and 3.4% in the natural Berea. For water saturation
lower than 50%, the relative permeability characteristics were similar. Similar observations were
made with the Loudon cores where the endpoint water relative permeability reduced from 20%
for the mixed-wet state to 7.8% for the water-wet case. Similar reduction in endpoint oil relative
permeability from 82% to 63% was observed.
Richardson et al.63 studied the behavior of the relative permeability ratio on native-state and
cleaned East Texas Woodbine cores by measuring the unsteady-state oil-water relative
permeabilities on the cores. They observed that as the core was rendered more water-wet through
cleaning, the behavior differed from that observed in uniformly and fractionally wetted systems.
For uniformly and fractionally wetted systems, the relative permeability ratio (wetting phase
displacing non-wetting phase) at a given water saturation was lowest for a strongly water-wet
system, and the more oil-wet curves were located to the left of the strongly water-wet curve. That
is, there was a higher relative permeability ratio at similar water saturation. However, they
observed that the water-wet curve was positioned to the left of the native-state curve. Flooding of
the native-state core resulted in very low ROS, ranging from 2% PV to 12% PV, while that of the
extracted (water-wet) core resulted in average residual oil saturation (ROS) of 30% PV. This
observation was attributed to the mixed-wet condition of the native-state cores.
Other researchers64,65 have measured the relative permeability ratio (kw/ko) in fractionally wetted
systems, using either treated/untreated sandpacks or glass/Teflon beads to simulate fractional
wetting condition. The general observation is that the changes in the relative permeability ratio
as the oil-wet fraction is increased from 0 to 1 (or decreased from 1 to 0) is similar to the
42
trend/changes observed when the wettability of a uniformly wetted core is changed from water-
wet to oil-wet (or from oil-wet to water-wet).
2.2 Wettability and Fractional Flow of Water during Waterflooding
As has already been noted, oil typically occupies the larger pore spaces in water-wet reservoirs,
while the water is held/trapped in the much smaller pores and/or pore throats. The pressure
gradient required to displace water from the reservoir is thus higher than that of the oleic phase
because of high capillary forces. Consequently, increase in water-wetness is reflected in an
increase in oil effective permeability and a decrease in water effective permeability. From the
foregoing, if other rock and fluid parameters/properties are kept constant, oil recovered at any
given time interval will be higher in a water-wet reservoir than an oil-wet reservoir.
A pragmatic approach to the assessment of waterflood displacement efficiency is through the
analysis of the fractional flow curve. While the highly idealized nature of the fractional flow
equation is recognized, it does provide, within the limits of its inherent assumptions, an insight
into saturation distributions in waterflood displacement studies as well as the observed effects of
the wetting state on the shape and position of the curve. The expression for fractional flow curve,
fw, is given by Eq. 2.1.
Swo
w
rw
row
kk
f
⎥⎥⎥⎥⎥
⎦
⎤
⎢⎢⎢⎢⎢
⎣
⎡
⎟⎟⎠
⎞⎜⎜⎝
⎛⎟⎟⎠
⎞⎜⎜⎝
⎛+
=
μμ
1
1 2.1
where
fw = fractional flow of water,
kro, krw = oil and water relative permeability respectively (or effective permeability, in md),
μo, μw = oil and water viscosities, respectively, cp
Sw = water saturation of interest.
In its most simplistic form, the fractional flow equation is an indication of the amount of water
that is produced along with the oil at any point in time. Eq. 2.1 shows that this depends on

43
viscosity and relative permeability relationship. Since relative permeability is an implicit
function of wettability and an explicit function of saturation, it follows that the breakthrough
water-saturation value depends also on the wetting state of the reservoir. Consequently, at
constant values of the oil-water viscosity ratio, the fractional flow value depends implicitly on
the observed wetting state in the reservoir. Figure 2.560 shows this relationship between the
fractional flow curve and wettability. The wetting state was determined using the contact angle
measurement, and the oil-water viscosity ratio was kept constant at a value of 25.
The fractional flow curve for the oil-wet case is much steeper and has a longer tail compared to
the water-wet case. Consequently, the flood front/breakthrough saturation and the average
saturation behind the front at breakthrough is much higher for the slightly water-wet system
( o47Θ = ) than the strongly oil-wet system ( o180Θ = ). The implication is that more oil will be
produced at breakthrough in a slightly water-wet system compared to a strongly oil-wet system.
Another important deduction that may be made from Figure 2.560 is that, though the ultimate
recovery of both wetting systems will ultimately be the same, recovery for the strongly oil-
wetted case after breakthrough will be at the expense of large volumes of produced water
because of the long tail. Ultimately, the unfavorable economics will prevent the attainment of the
ultimate recovery.
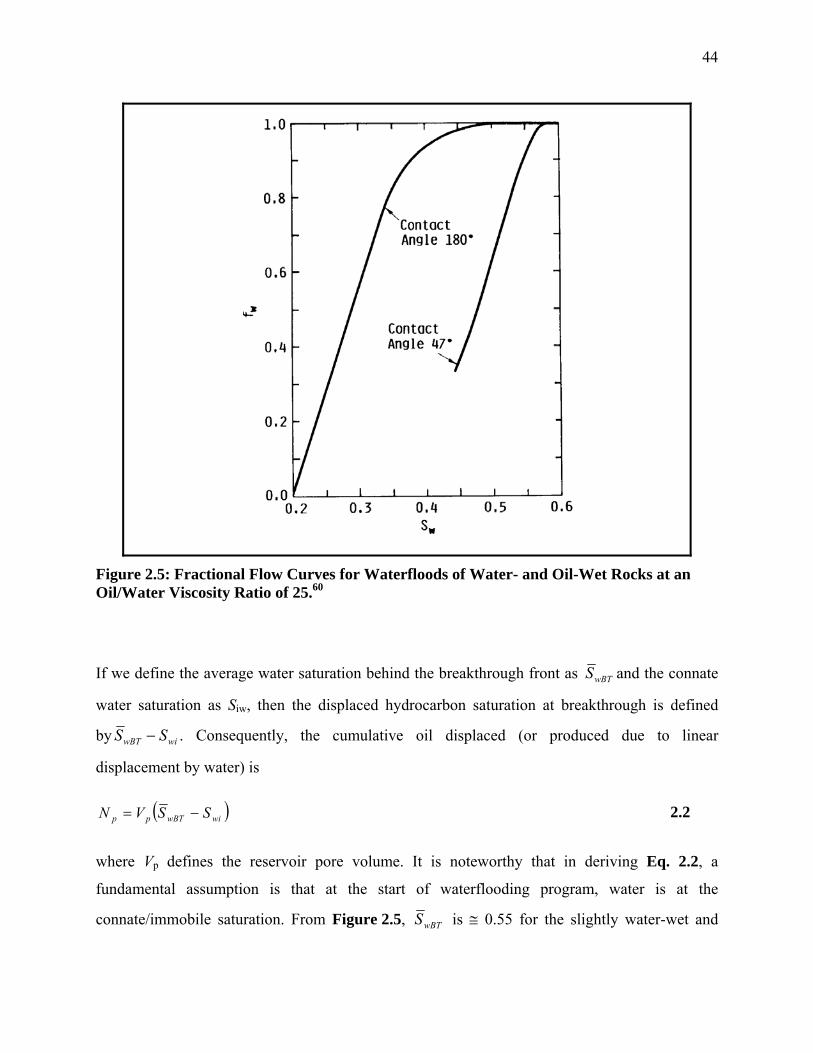
44
Figure 2.5: Fractional Flow Curves for Waterfloods of Water- and Oil-Wet Rocks at an Oil/Water Viscosity Ratio of 25.60
If we define the average water saturation behind the breakthrough front as wBTS and the connate
water saturation as Siw, then the displaced hydrocarbon saturation at breakthrough is defined
by wiwBT SS − . Consequently, the cumulative oil displaced (or produced due to linear
displacement by water) is
( )wiwBTpp SSVN −= 2.2
where Vp defines the reservoir pore volume. It is noteworthy that in deriving Eq. 2.2, a
fundamental assumption is that at the start of waterflooding program, water is at the
connate/immobile saturation. From Figure 2.5, wBTS is ≅ 0.55 for the slightly water-wet and
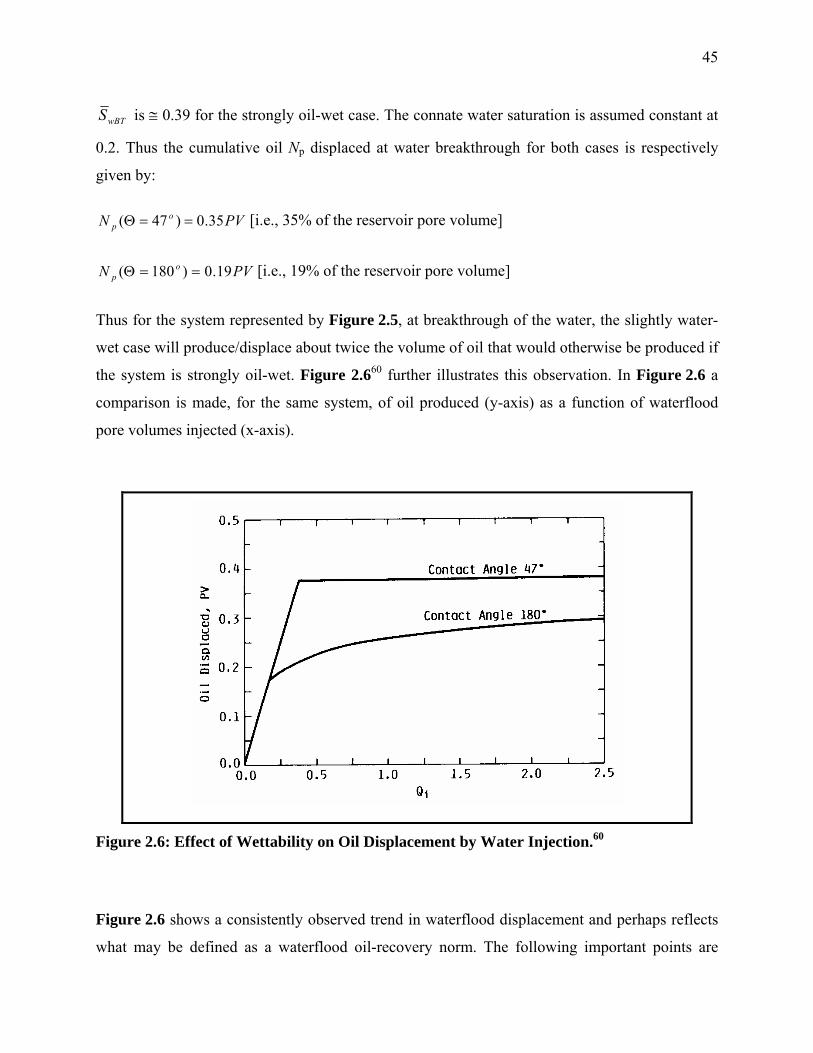
45
wBTS is ≅ 0.39 for the strongly oil-wet case. The connate water saturation is assumed constant at
0.2. Thus the cumulative oil Np displaced at water breakthrough for both cases is respectively
given by:
PVN op 35.0)47( ==Θ [i.e., 35% of the reservoir pore volume]
PVN op 19.0)180( ==Θ [i.e., 19% of the reservoir pore volume]
Thus for the system represented by Figure 2.5, at breakthrough of the water, the slightly water-
wet case will produce/displace about twice the volume of oil that would otherwise be produced if
the system is strongly oil-wet. Figure 2.660 further illustrates this observation. In Figure 2.6 a
comparison is made, for the same system, of oil produced (y-axis) as a function of waterflood
pore volumes injected (x-axis).
Figure 2.6: Effect of Wettability on Oil Displacement by Water Injection.60
Figure 2.6 shows a consistently observed trend in waterflood displacement and perhaps reflects
what may be defined as a waterflood oil-recovery norm. The following important points are
46
worthy of note: (1) there is no further (significant) oil recovery after breakthrough, for the
slightly water-wet (to strongly water-wet) system; (2) water breakthrough occurred at less than 1
PV of injected water. Typical field observations range from 1 to 1.5 PVs; and (3) for volumes
above 1 PV of injected water, the strongly oil-wet system is a weak function of injected PVs.
2.3 Wettability Effects on Oil Recovery Efficiency
2.3.1 Uniformly Wetted Media
A number of laboratory studies and research have been performed in a bid to understand the
effect of uniform wettability on oil recovery and recovery efficiencies. One of the early works on
the effect of oil-wet and water-wet systems on oil recovery in waterflood displacement studies
was by Donaldson and Thomas51. They utilized micromodels (double-layered sand between two
flat microscopic specimen slides) to observe the effect of uniform wettability on oil recovery.
Results from the micromodel studies were validated by sandstone coreflood studies. Wetting
state for the micromodels were determined from visual observation while that of the sandstone
cores were characterized using the USBM index. Wettability alteration of the core samples was
achieved by treating with GE Dri-Film No. 144. Brine used was reconstituted brine (0.10 NaCl).
The coreflood test was conducted at constant differential pressure of 50 psi. From their
experiment, they reported that more oil is recovered from a water-wet system than from either
the intermediate-wet or the oil-wet system. Low oil recoveries in oil-wet systems were attributed
to the very fast formation of brine fingers resulting in simultaneous brine breakthrough with the
first oil produced. However, production of oil still continued for a long time even after this
breakthrough. After production of oil ceased, large oil pockets (extending from 20 to 30 grain
diameters of space) were still trapped in the system and extended from the inlet to the outlet. For
the water-wet case, similar trapped oil pockets were observed. However, the oil pockets extended
for only short distances (usually 3 to 4 grain diameters of space), and further migration of these
trapped oil pockets was reported possible at very high injection rates.
Contrary to the Donaldson and Thomas report51 on the relatively poor displacement efficiency
and oil recovery under intermediate wetting conditions compared to strongly water-wet case,
other researchers66,67,68,69 had indicated that recovery from the strongly water-wet or oil-wet
cores is actually lower than recovery from cores that are at some intermediate wettability. Some
47
plausible explanations for this apparent discrepancy in observed experimental outcome may lie
in (1) the varying definition of intermediate wettability as well as the method of wettability
characterization; (2) The influence of waterflood injection rate on recovery (some research
studies neglect this effect). The lack of standardized definition for this wetting state is such that
different authors have different, subjective, definitions. Some of the observed wetting states that
have been classified under intermediate wettability by different authors include (1) neutral
wetting state; (2) weakly water-wet to weakly oil-wet state; and (3) mixed wetting state (a
combination of strong water-wet and strong oil-wet regions). The wetting characteristics of each
of these wetting states have been shown to have varying effects on oil recovery and displacement
efficiencies.
Jadhunandan and Morrow69 investigated the relationship between wettability and oil recovery by
waterflooding and the dominant variables that control wettability in COBR systems using Berea
sandstone. Wettability alteration of the core from water-wet to oil-wet was achieved by aging for
10 days at temperatures between 26°C and 80°C inclusive. Blends of Soltrol 130 and paraffin oil
were prepared to give refined oils with the desired viscosities and were subsequently referred to
as Moutray and ST-86 crude oil. Water injection was carried out at room temperature, and rates
ranged from 2 to 100 ft/day (to determine the effect of flood rate on oil recovery) with most
between 3.5 to 7 ft/day (to characterize wettability effects on oil recovery). The wetting index
was determined using the modified Amott method. A spontaneous imbibition time of 3 weeks
was adopted after observing the trend of imbibition-versus-time curves. A pressure drop of ≤ 35
psi was used in the study because of core damage at pressure gradients above 50 psi. Results of
their work reported that aging temperature, initial water saturation, brine composition, and crude
oil were all factors in determining the wettability of COBR systems. The authors further reported
that in determining the effect of wettability on oil recovery, data that showed obvious end effects
and viscous fingering were discarded.
Figure 2.769 and Figure 2.869 show the observed effect of wettability on oil recovery at
breakthrough, 1 PV, 3 PVs, 5 PVs, and 20 PVs of injected brine. From Figure 2.769, the
maximum recovery of oil is attained at wettability close to the water-wet side of neutral (Iw-o ≈
0.2). A similar trend is observed in Figure 2.869, which shows the corresponding result for

48
residual oil saturation. In both cases the maximum oil recovery and minimum oil saturation
values were reported to become “better defined” with continued flooding. The curves show that
(1) a strongly water-wet system (Iw-o ≈ 1.0) is independent of the number of PVs of water
injected;
(2) oil-wet systems (Iw-o ≈ -0.5) are weakly dependent on injected PVs with the weak
dependence getting stronger as the wetting states tend toward some intermediate state; and
(3) if we define the value of the modified Amott-Harvey index as being equal to zero (Iw-o ≈
0) at neutral wetting state then the optimum oil recovery/waterflood residual oil saturation is
obtained at this wetting state.
Figure 2.7: Oil Recovery vs. Amott-Harvey Index at Different Injected PVs.69
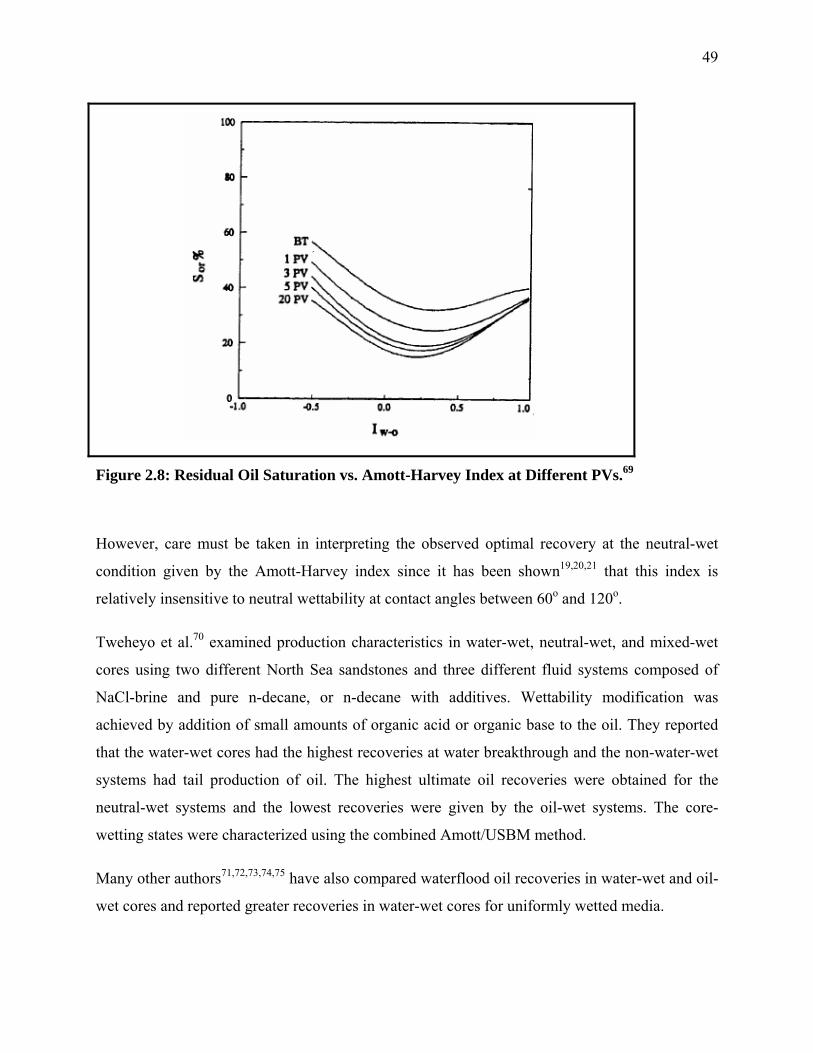
49
Figure 2.8: Residual Oil Saturation vs. Amott-Harvey Index at Different PVs.69
However, care must be taken in interpreting the observed optimal recovery at the neutral-wet
condition given by the Amott-Harvey index since it has been shown19,20,21 that this index is
relatively insensitive to neutral wettability at contact angles between 60o and 120o.
Tweheyo et al.70 examined production characteristics in water-wet, neutral-wet, and mixed-wet
cores using two different North Sea sandstones and three different fluid systems composed of
NaCl-brine and pure n-decane, or n-decane with additives. Wettability modification was
achieved by addition of small amounts of organic acid or organic base to the oil. They reported
that the water-wet cores had the highest recoveries at water breakthrough and the non-water-wet
systems had tail production of oil. The highest ultimate oil recoveries were obtained for the
neutral-wet systems and the lowest recoveries were given by the oil-wet systems. The core-
wetting states were characterized using the combined Amott/USBM method.
Many other authors71,72,73,74,75 have also compared waterflood oil recoveries in water-wet and oil-
wet cores and reported greater recoveries in water-wet cores for uniformly wetted media.
50
Contrary to the wetting condition observed in sandstone reservoirs, 90% of carbonate reservoirs
are characterized as neutral to preferentially oil-wet. For carbonate oil reservoirs, the water-
wetting nature increases with temperature. It is believed that the acid number, AN, may be a
crucial factor in dictating the reservoir wetting state since it has been observed that water
wetness decreases as AN increases. The AN is defined as the milligrams of KOH required in
tests to neutralize all the acidic constituents present in a 1 gram sample of petroleum product.
Acid number is an indirect function of reservoir temperature, since decarboxylation occurs as
temperature increases. Consequently, the AN in the crude oil decreases as temperature increases.
Zhang and Austad76 experimentally decoupled the effects of temperature and AN as wetting
parameters of chalk formations and determined that the wettability of a carbonate reservoir is
mainly dictated by the AN of the crude oil and not the reservoir temperature.
Tang and Firoozabadi77 studied the effect of wettability and initial water saturation on water
injection performance on a Kansas chalk outcrop sample. Since Kansas chalk is strongly water-
wet, wettability alteration from this condition was achieved by use of stearic acid. The Amott
index to water (Iw) and rate of spontaneous imbibition were used to characterize wettability.
Water injection was carried out at different rates and pressure gradients. They reported that
initial water saturation has a very pronounced effect on waterflood oil recoveries in intermediate-
wet chalk and much less pronounced effect in strongly water-wet chalk; for a strongly water-wet
condition, oil recovery decreased mildly with increase in initial water saturation, while for
weakly water-wet and intermediate-wet conditions, oil recovery increased significantly with an
increase in initial saturation. They further reported that oil recovery efficiency is susceptible to
viscous forces when the chalk is intermediate and/or weakly water-wet. There was no effect on
endpoint recovery when the chalk was strongly water-wet. When the viscous force was high (Δp
= 13.5 psi/cm), the intermediate-wet state (Iw = 0.09) gave the best waterflood performance and
the strongly water-wet state the worst performance. However, at low viscous force, (Δp = 0.96
psi/cm) the strongly water-wet gave the best performance.
Høgnesen et al.78 examined the improvement of oil recovery efficiency in oil-wet carbonates by
spontaneous water imbibition through wettability modification to water-wetting condition.
Spontaneous imbibition tests were performed on chalk outcrops and reservoir limestone samples
at different temperature ranges (70°C–130°C) using modified seawater with various
51
concentrations of sulfate. They reported favorable results at elevated temperatures, more so with
increase in the sulfate concentration in the seawater. At lower temperatures, increased
spontaneous imbibition was achieved by the addition of cationic surfactant to the imbibing fluid.
Limitations to the use of sulfate as a potential determining ion include (1) the problem of souring
and scale formation and (2) initial brine salinity and temperature.
The work by Zhang and Austad79 further validated the reported observations by Høgnesen et al78.
They correlated the waterflood oil recovery in chalk formation in terms of a “new” wettability
index (based on the chromatographic method defined by Strand29) and the brine composition
(similar to the work done by Høgnesen et al.). They noted that spontaneous imbibition will only
occur in chalk formation if the water-wet fraction of the chalk surface is > 0.6.
Al-Hadhrami and Blunt80 examined the effect of hot-water injection on oil recovery from
naturally fractured oil-wet carbonate reservoirs. They reported that conventional recovery from
an Omani field having extensive fractures was only 2% after 20 years. Water injection in such
fields will be inefficient because of significant bypass issues. However, use of hot water/steam
resulted in a thermally induced wettability reversal/shift to a water-wet state, which allows
imbibition of the hot water into the rock matrix leading to improved oil recovery.
Graue and Bognø81 examined the oil recovery mechanism in fractured chalks at different
wettability conditions by iterative comparison between experimental work (coreflood studies)
and numerical simulation. For all the chalk blocks used, the authors reported two vertical and
three horizontal fractures. The first and second vertical fractures were at 4 cm and 13 cm,
respectively, from the inlet end, and the horizontal fractures were at the center line of the block
and at the inlet and outlet ends to provide hydraulic contact from inlet to outlet. Wettability was
characterized using the Amott-Harvey Index, and wettability measurements were reported to
have been verified for stability and reproducibility. They observed that, though water movement
was significantly affected by the presence of fractures for strongly water-wet conditions and less
so for less water-wet conditions in “closed” fractures, fracturing of the chalk did not significantly
improve oil recovery for both strongly water-wet chalk and moderately water-wet chalk. It is
pertinent to note that the chalk permeability increased by a factor of 50 after fracturing.
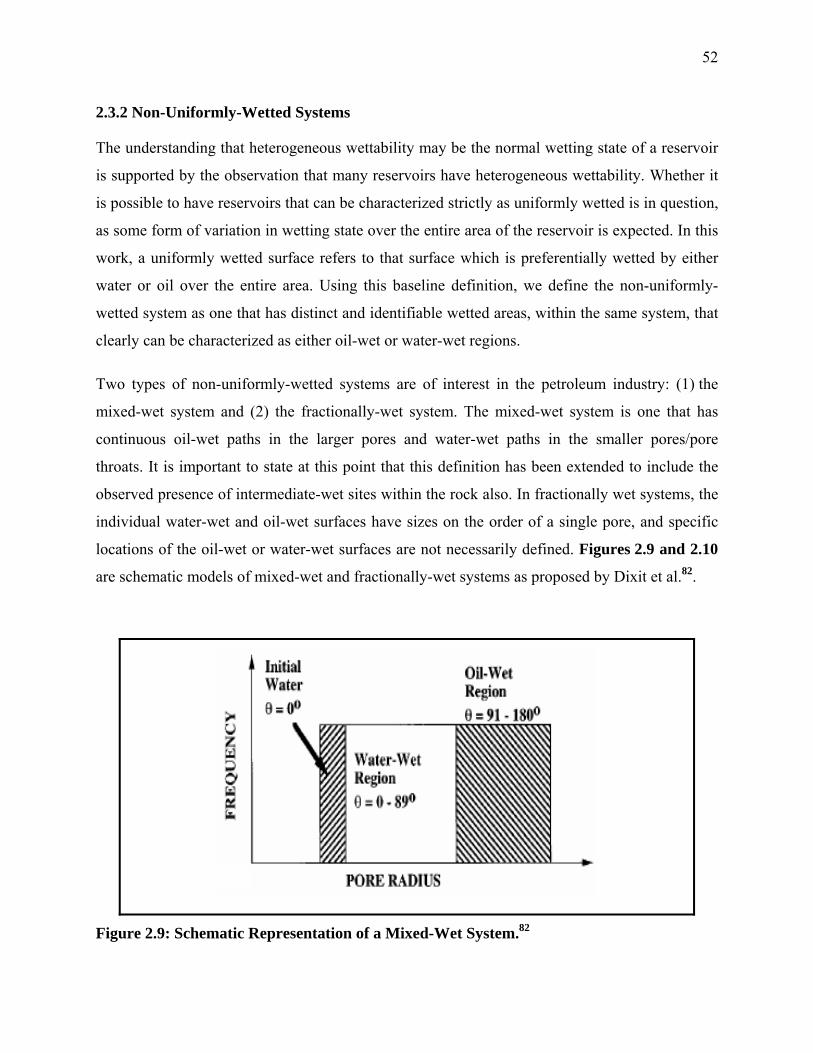
52
2.3.2 Non-Uniformly-Wetted Systems
The understanding that heterogeneous wettability may be the normal wetting state of a reservoir
is supported by the observation that many reservoirs have heterogeneous wettability. Whether it
is possible to have reservoirs that can be characterized strictly as uniformly wetted is in question,
as some form of variation in wetting state over the entire area of the reservoir is expected. In this
work, a uniformly wetted surface refers to that surface which is preferentially wetted by either
water or oil over the entire area. Using this baseline definition, we define the non-uniformly-
wetted system as one that has distinct and identifiable wetted areas, within the same system, that
clearly can be characterized as either oil-wet or water-wet regions.
Two types of non-uniformly-wetted systems are of interest in the petroleum industry: (1) the
mixed-wet system and (2) the fractionally-wet system. The mixed-wet system is one that has
continuous oil-wet paths in the larger pores and water-wet paths in the smaller pores/pore
throats. It is important to state at this point that this definition has been extended to include the
observed presence of intermediate-wet sites within the rock also. In fractionally wet systems, the
individual water-wet and oil-wet surfaces have sizes on the order of a single pore, and specific
locations of the oil-wet or water-wet surfaces are not necessarily defined. Figures 2.9 and 2.10
are schematic models of mixed-wet and fractionally-wet systems as proposed by Dixit et al.82.
Figure 2.9: Schematic Representation of a Mixed-Wet System.82

53
Figure 2.10: Schematic Representation of a Fractionally-Wet System.82
2.3.2.1 Mixed-Wet Systems
It has been shown that waterflood residual oil saturation in mixed wettability reservoirs is often a
strong function of pore volumes injected38, 83. The effect of the number of pore volumes injected
has been shown for different oil fields with mixed-wet reservoirs, for example, the East Texas
Woodbine reservoir38 and the Endicott Field Alaska83. Further decrease in the waterflood
residual oil saturation is possible in a mixed-wet reservoir where there is surface film drainage.
Surface film drainage does not act in all mixed-wet reservoirs, but has been shown to be
particularly active in mixed-wet reservoirs having high vertical permeability. Lower residual oil
saturation has been reported38 for mixed-wet reservoirs undergoing surface film drainage
compared to reservoirs without this drainage mechanism.
The Endicott Field in Alaska is an example of a mixed-wet reservoir with surface drainage
effects83. In a preserved reservoir-condition coreflood experiment, it was observed that the
waterflood residual oil saturation, Sorw, was 40% after 1 PV injection, 22% after 500 PVs, and
12% at infinite PVs. Centrifuge flooding was used to observe the effect of surface film drainage
on residual oil saturation and thus isolate oil recovery efficiency due to the waterflood. Higher
oil recoveries for the mixed-wet condition over the water-wet condition were reported. Oil
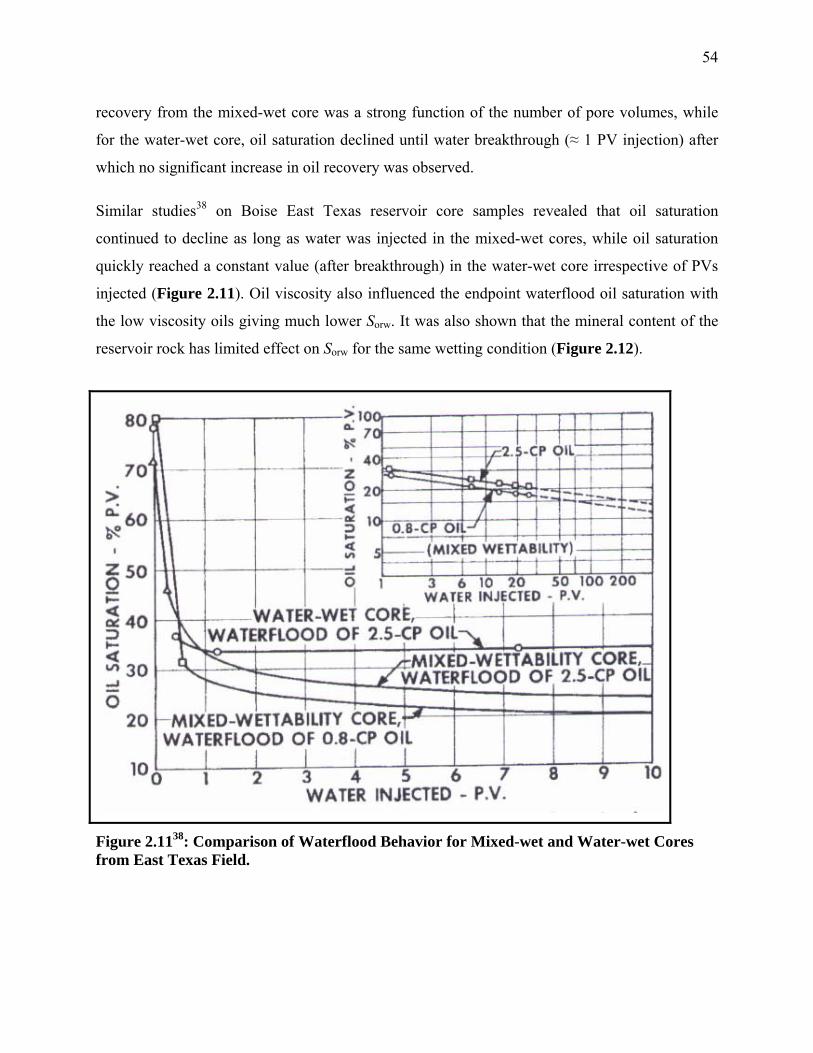
54
recovery from the mixed-wet core was a strong function of the number of pore volumes, while
for the water-wet core, oil saturation declined until water breakthrough (≈ 1 PV injection) after
which no significant increase in oil recovery was observed.
Similar studies38 on Boise East Texas reservoir core samples revealed that oil saturation
continued to decline as long as water was injected in the mixed-wet cores, while oil saturation
quickly reached a constant value (after breakthrough) in the water-wet core irrespective of PVs
injected (Figure 2.11). Oil viscosity also influenced the endpoint waterflood oil saturation with
the low viscosity oils giving much lower Sorw. It was also shown that the mineral content of the
reservoir rock has limited effect on Sorw for the same wetting condition (Figure 2.12).
Figure 2.1138: Comparison of Waterflood Behavior for Mixed-wet and Water-wet Cores from East Texas Field.

55
Figure 2.1238: Comparison of Waterfloods under Different Wetting Conditions in Several Porous Rocks.
Morrow et al.25 altered the wettability of a strongly water-wet core to some heterogeneous -wet
state through aging in brine and Moutray crude oil and observing oil recoveries for both wetting
states. Analogous displacements were also run in glass micromodels to make direct observations
of the effect of wetting state and wetting alteration on displacement efficiency and the recovery
mechanism. They observed that even though breakthrough characteristics were the same for all
cases (as oil recovery was complete within 1.5 PVs of injected water), a much lower Sorw was
observed in the aged cores compared to the strongly water-wet core. They further reported that
even though variation in oil viscosity affected the Sorw for the strongly water-wet condition
(lower oil viscosity resulted in lower Sorw), the microscopic displacement efficiency was
relatively constant, because it was observed that reducing the oil viscosity resulted in a
corresponding reduction in the initial oil saturation. The microscopic displacement efficiency is
defined as the ratio of the change in oil saturation ΔSo to the value of the initial oil saturation Soi,
that is, ( )[ ]oiorwoi SSS − . It is worthy of mention that the authors’ opinion of the actual nature of
56
the altered wetting state was largely speculative, so for the purpose of their work, they defined it
as speckled-wetting.
Wang 61 studied the effect of changes in wettability from water-wet to mixed-wet states (and vice
versa) on flowable versus bypassed crude oil saturations using Berea and Loudon cores. He
observed that strongly water-wet core ceased to produce oil at first breakthrough, while a mixed
wettability core continuously produced oil for many pore volumes resulting in very low residual-
oil saturation (this observation is consistent with the characteristic behavior of mixed-wettability
reservoirs as reported by Salathiel38 and Wood et. al.83). He further reported higher flowable oil
saturation in two-phase flow for the mixed-wet cores compared to the water-wet cores. This
observed phenomenon is explained by the fact that in a mixed-wet core, the oil-wet surface
forms a continuous film throughout the pores, while the smaller pores are occupied by water.
Thus, the fraction of oil isolated by water films during the two-phase flow was smaller in a
mixed-wet core than in a water-wet core. They also observed that the flowable water saturation is
not a function of the core wettability. The bypassed water saturations were small in all cases
irrespective of the wettability change from water-wet to mixed-wet and vice versa.
Huang et al. 84 also compared the waterflood oil recoveries between the mixed-wet and the
water-wet systems with similar conclusions as described above38,61,83. Their research focused on
sedimentary clastic rock reservoirs at the laminaset scale. They described the observed mixed-
wetting characteristic of the reservoir as Het-Wet State, an acronym for a heterogeneous-wet
system.
2.3.2.2 Fractionally-Wetted Systems
Behavior of systems that are fractionally-wetted is similar to that described for uniformly-wetted
systems. Increase in residual oil saturation was observed as the fraction of oil-wetted surface
increased37,64,65,85. Reported waterflood performance lies between the performance curves for
100% water-wet and 100% oil-wet sand packs5.
57
2.4 Effect of Brine Salinity and Valency on Wettability and Oil Recovery
It has been shown that brine mediates adsorption from crude oil onto a mineral surface86. Further
research87,88 also revealed that brine properties such as pH, ionic species and salinity affect crude
oil/brine/rock interaction and hence wettability. Consequently, the properties of the connate brine
and injection water brine should affect the rock- characteristics as well as oil recovery efficiency.
Tang and Morrow89 investigated the effect of brine composition on microscopic displacement
efficiency of oil by waterflooding and spontaneous imbibition. Their investigation, conducted at
reservoir temperature, utilized synthetic reservoir brine as the connate water. Berea sandstone
plugs were used, and the brines used were prepared from chloride salts of different cation
valency, that is, NaCl, CaCl2, and AlCl3. They reported that waterflood recovery increased and
imbibition rate decreased with increase in cation valency for 1% solutions of NaCl, CaCl2, and
AlCl3. They further reported that, with the exception of AlCl3, oil recovery generally increased
(8% to 13% of the OOIP) with decrease in salinity. This anomalous observation with the
trivalent salt was ascribed to the effect of pH. Furthermore, decrease in salinity of the injected
brine resulted in wettability transition toward water-wetness. They also observed incremental oil
recovered when the injection brine was switched at high water cut from high-salinity brine to
dilute brine. However, injection of dilute brine at the outset results in both increased
breakthrough and final oil recovered.
Tang and Morrow90 investigated the effect of temperature on oil recovery and wettability. They
also evaluated the effect of changing the salinity of the invading and connate brine on oil
recovery and compared the recovery with that obtained when the reservoir brine was used as the
invading brine. Their study was based on displacement tests in Berea sandstones with three crude
oils and three reservoir brines. They reported that oil recovery increased over that for the
reservoir brine with dilution of both initial (connate) and invading brine or dilution of either. The
mechanism of the recovery was not explained. For the three crude oils used, oil recovery and
water wetness increased with increase in displacement temperatures.
Sharma91 and Filoco and Sharma92 examined the waterflood recovery for Berea sandstones from
imbibition of brines of different salinities. They observed that decrease in imbibition brine
salinity resulted in increased oil recovery only if the invading brine and the connate brine have
58
similar salinity. They reported that no increased oil recovery was observed with decrease in
salinity when the connate brine salinity was kept constant. However, decrease in connate brine
salinity results in increased recovery irrespective of the invading brine salinity. These
observations are contrary to those reported by Tang and Morrow90. The reasons for this
discrepancy are unclear yet. Sharma speculated that the increased oil recovery observed at low
connate water salinity may be due to wettability change to a mixed-wet state.
Based on the observed impact of the benefits of low salinity in EOR, several field trials have
been carried out93,94. Four sets of single well chemical tracer tests (SWCTT) performed in Alaska
showed similar outcome as laboratory experiments93. The SWCTT results showed substantial
reduction in waterflood residual oil saturation by low-salinity water injection. The reported low
salinity EOR benefits ranged from 6% to 12% OOIP resulting in an increase in waterflood
recovery of 8% to 19%. Similar conclusions were also reached in the Middle East94 where a Log-
inject-Log test was conducted to evaluate the low-salinity benefits. The result showed a
reduction in waterflood residual oil saturation of 25% to 50%. The authors reported that these
successful field trials have led to serious evaluation of full-scale implementation of low-salinity
waterfloods.
In a related study, Webb et al. 95 carried out coreflood studies to evaluate the secondary and
tertiary oil recovery potential of low-salinity brine injection under reservoir conditions. All the
core samples used for the test were restored-state cores. The core samples were first cleaned and
aged in live crude oil to restore wettability, prior to performing waterfloods. The initial water
saturations of the cores were acquired in such a way that they matched the height above the oil-
water contact of the samples in the reservoirs. The corefloods were performed both in secondary
mode (low-salinity brine injected from initial water saturation) and tertiary mode (low-salinity
brine injected after high-salinity waterflood). The tertiary mode was designed to simulate typical
(field) application to a mature waterflood. They evaluated the waterflood recovery benefits by
(1) observing the produced oil volume as a function of produced water and (2) micro-
visualization of the residual oil saturation at the end of the corefloods. They reported that for all
the corefloods, they consistently observed improved production of oil with reduction in brine
salinity. However, they reported no recovery benefit in injecting seawater even where the salinity
of the seawater is less than the formation brine salinity. The reason for this observation was not
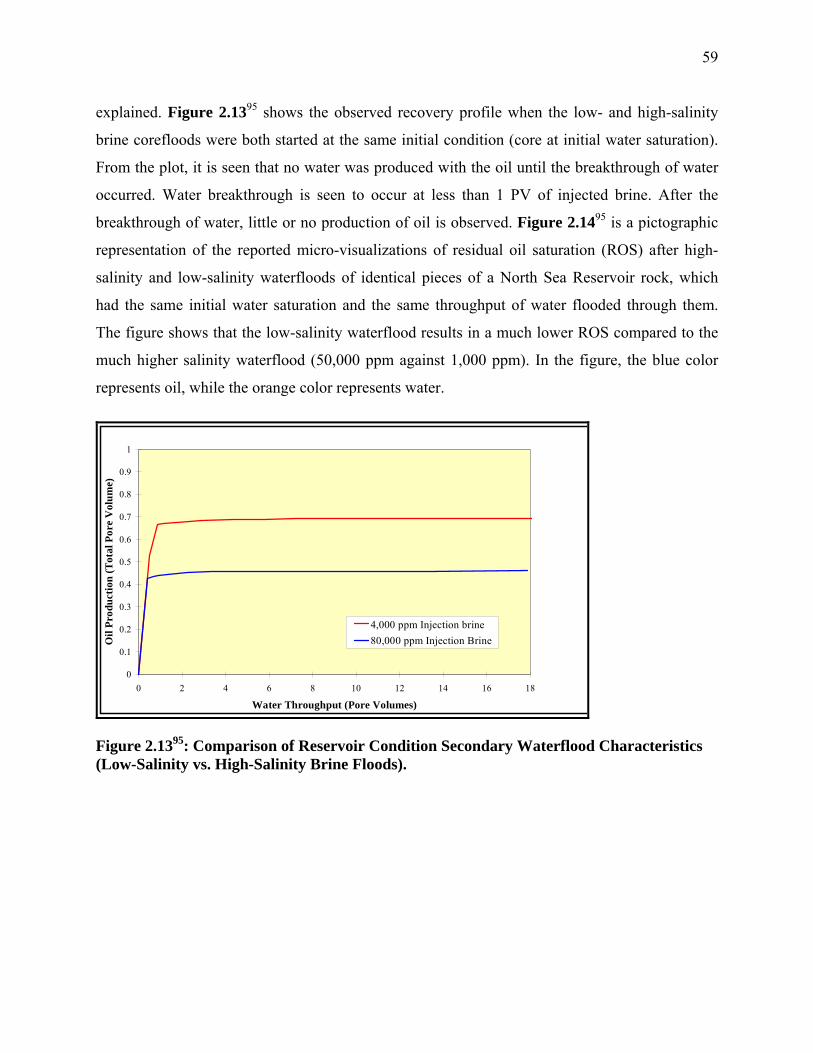
59
explained. Figure 2.1395 shows the observed recovery profile when the low- and high-salinity
brine corefloods were both started at the same initial condition (core at initial water saturation).
From the plot, it is seen that no water was produced with the oil until the breakthrough of water
occurred. Water breakthrough is seen to occur at less than 1 PV of injected brine. After the
breakthrough of water, little or no production of oil is observed. Figure 2.1495 is a pictographic
representation of the reported micro-visualizations of residual oil saturation (ROS) after high-
salinity and low-salinity waterfloods of identical pieces of a North Sea Reservoir rock, which
had the same initial water saturation and the same throughput of water flooded through them.
The figure shows that the low-salinity waterflood results in a much lower ROS compared to the
much higher salinity waterflood (50,000 ppm against 1,000 ppm). In the figure, the blue color
represents oil, while the orange color represents water.
0
0.1
0.2
0.3
0.4
0.5
0.6
0.7
0.8
0.9
1
0 2 4 6 8 10 12 14 16 18
Water Throughput (Pore Volumes)
Oil
Prod
uctio
n (T
otal
Por
e V
olum
e)
4,000 ppm Injection brine80,000 ppm Injection Brine
Figure 2.1395: Comparison of Reservoir Condition Secondary Waterflood Characteristics (Low-Salinity vs. High-Salinity Brine Floods).
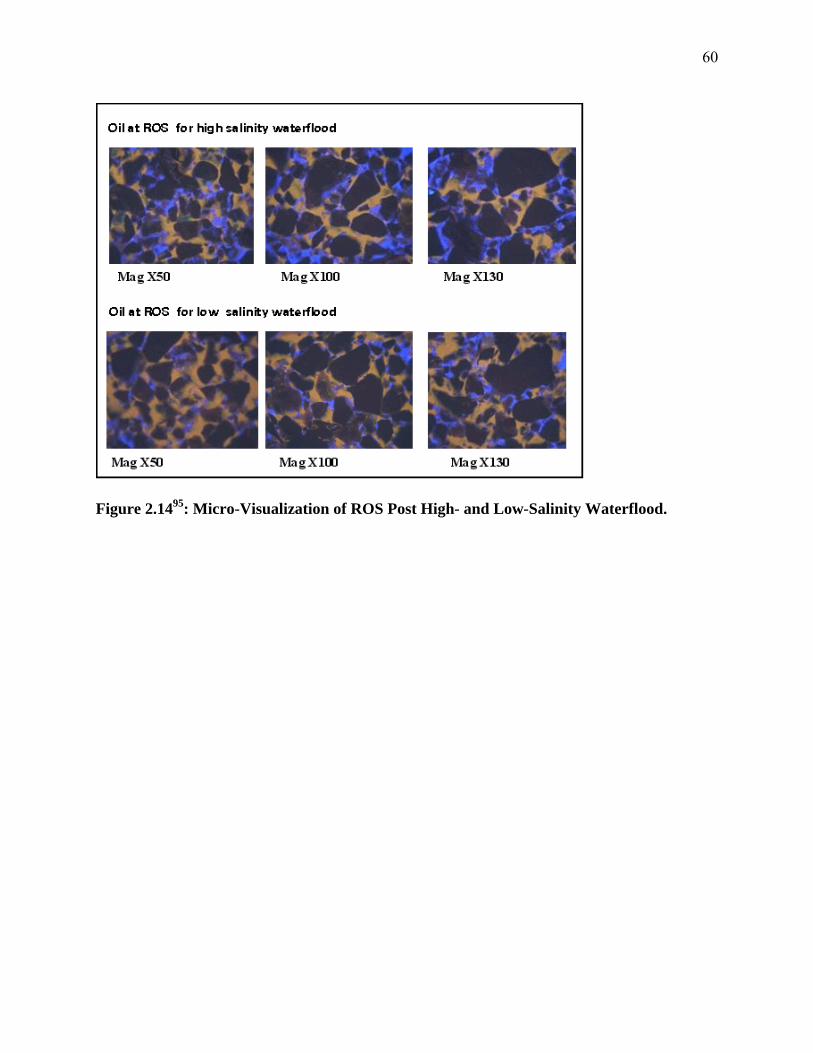
60
Figure 2.1495: Micro-Visualization of ROS Post High- and Low-Salinity Waterflood.
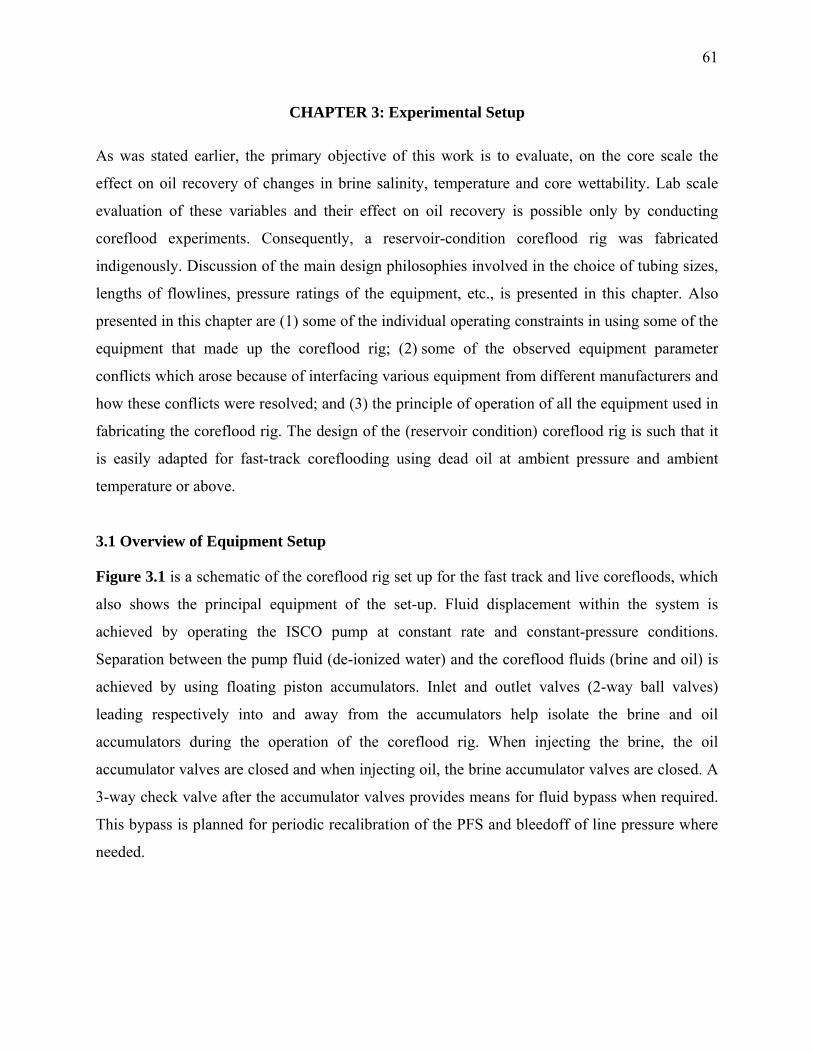
61
CHAPTER 3: Experimental Setup
As was stated earlier, the primary objective of this work is to evaluate, on the core scale the
effect on oil recovery of changes in brine salinity, temperature and core wettability. Lab scale
evaluation of these variables and their effect on oil recovery is possible only by conducting
coreflood experiments. Consequently, a reservoir-condition coreflood rig was fabricated
indigenously. Discussion of the main design philosophies involved in the choice of tubing sizes,
lengths of flowlines, pressure ratings of the equipment, etc., is presented in this chapter. Also
presented in this chapter are (1) some of the individual operating constraints in using some of the
equipment that made up the coreflood rig; (2) some of the observed equipment parameter
conflicts which arose because of interfacing various equipment from different manufacturers and
how these conflicts were resolved; and (3) the principle of operation of all the equipment used in
fabricating the coreflood rig. The design of the (reservoir condition) coreflood rig is such that it
is easily adapted for fast-track coreflooding using dead oil at ambient pressure and ambient
temperature or above.
3.1 Overview of Equipment Setup
Figure 3.1 is a schematic of the coreflood rig set up for the fast track and live corefloods, which
also shows the principal equipment of the set-up. Fluid displacement within the system is
achieved by operating the ISCO pump at constant rate and constant-pressure conditions.
Separation between the pump fluid (de-ionized water) and the coreflood fluids (brine and oil) is
achieved by using floating piston accumulators. Inlet and outlet valves (2-way ball valves)
leading respectively into and away from the accumulators help isolate the brine and oil
accumulators during the operation of the coreflood rig. When injecting the brine, the oil
accumulator valves are closed and when injecting oil, the brine accumulator valves are closed. A
3-way check valve after the accumulator valves provides means for fluid bypass when required.
This bypass is planned for periodic recalibration of the PFS and bleedoff of line pressure where
needed.
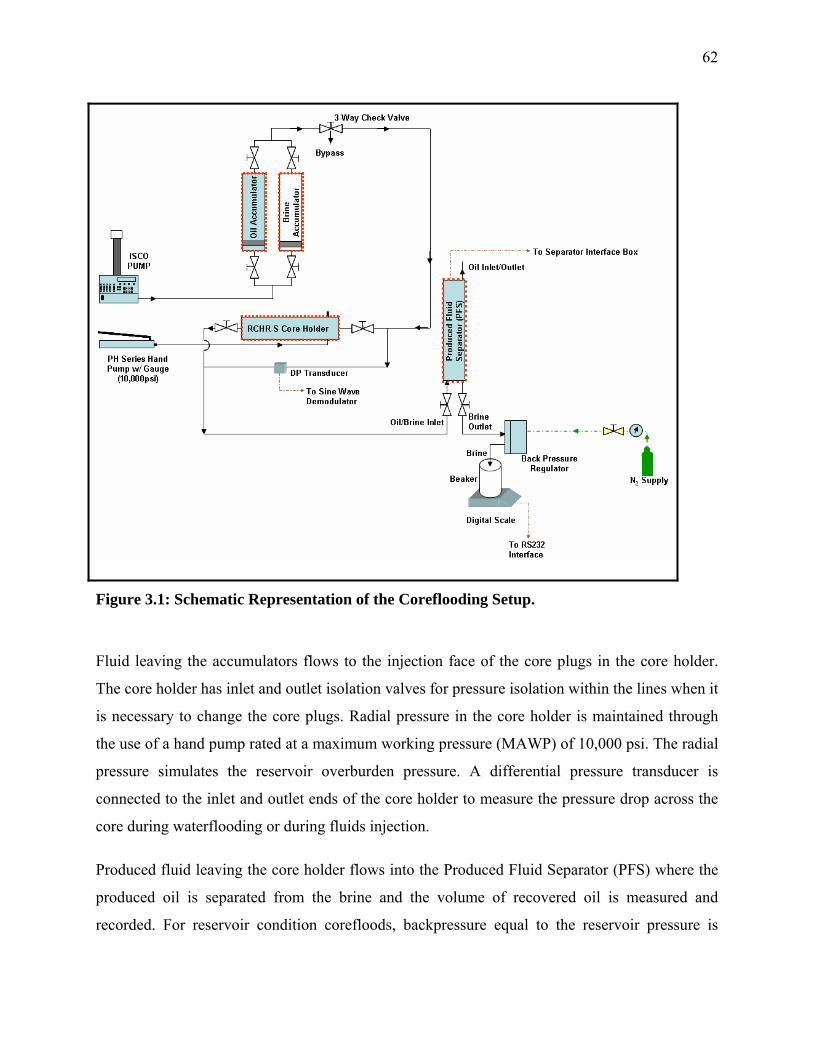
62
Figure 3.1: Schematic Representation of the Coreflooding Setup.
Fluid leaving the accumulators flows to the injection face of the core plugs in the core holder.
The core holder has inlet and outlet isolation valves for pressure isolation within the lines when it
is necessary to change the core plugs. Radial pressure in the core holder is maintained through
the use of a hand pump rated at a maximum working pressure (MAWP) of 10,000 psi. The radial
pressure simulates the reservoir overburden pressure. A differential pressure transducer is
connected to the inlet and outlet ends of the core holder to measure the pressure drop across the
core during waterflooding or during fluids injection.
Produced fluid leaving the core holder flows into the Produced Fluid Separator (PFS) where the
produced oil is separated from the brine and the volume of recovered oil is measured and
recorded. For reservoir condition corefloods, backpressure equal to the reservoir pressure is

63
maintained within the system through a backpressure regulator connected to the outlet line of the
PFS. Backpressure is maintained by compressed nitrogen. Use of the backpressure regulator also
ensures that the solution gas remains in solution. Reservoir temperature is achieved by the use of
thermal blankets capable of supplying heat within an inclusive temperature range of 75°F and
425°F.
3.2 Fluid Circulation and Pressure Maintenance Pump
The Teledyne ISCO D-Series pump (model 100DM) was utilized for the circulation of fluid
through the experimental system and for constant pressure maintenance through the entire
system. The 100DM model is a positive displacement pump that is capable of pressures up to a
maximum of 10,000 psi and flow rates range from 0.01μl/min up to 20ml/min. The pump is
capable of displacing fluid volumes up to 500 ml. De-ionized (DI) water is used as the displacing
fluid within the pump, thus preventing buildup of scale on the cylinder walls as well as the
development of rust.
The pump has four basic modes of operation: constant pressure, constant flow, refill, and
programmed gradient modes. These modes may be classified broadly into two groups: (1) three
delivery modes and (2) one refill mode. The constant-pressure mode maintains fluid delivery at a
constant pressure by varying the flow rate. Consequently, the desired pressure is achieved by
either positive or negative displacement of the piston. For the constant flow mode, the converse
to the constant-pressure mode holds. In this case, the pump delivers the displacing fluid at a
constant flow rate during the pumping operation while the delivery pressure is varied, thus
ensuring that a constant delivery rate is maintained. The refill mode allows for the (automatic)
refilling of the pump cylinder with the displacing fluid. This is achieved in either of two ways:
(1) manually setting the refill rate at any point desired during the pumping operation or (2)
setting the pump to refill automatically when a certain volume has been reached. For this work, it
was expedient to use option (1) because of the nature of the experiment. In the programmed
gradient mode, the pump is capable of providing three types of gradients: (1) two-pump
concentration gradients, (2) single-pump linear pressure gradients, and (3) single-pump flow
programs. Only the three delivery modes were used in carrying out the experiment.

64
ISCO pump 100DM also has the added functionality of remote manipulation of the pump
through the RS232 interface. A single RS232 interface can control up to four pumps. Apart from
remote control of the pump from a computer interface, the pump can also be queried for data
through the RS232 interface. This functionality can only be used either by writing specialized
programs using the Labview Programming Language Toolkit or the already packaged Teledyne
DASNET Application. This establishes a two-way information exchange, between the computer
and the pump, for data collection.

65
Figure 3.2: Photographic Representation of the Teledyne ISCO D-Series Pump (Model 100DM).
3.3 Floating Piston Fluid Accumulator
An accumulator is a transfer vessel used for displacing fluids through corefloods and similar
displacement tests. Accumulators serve a number of purposes, which include: (1) Isolating
corrosive fluids from pumping systems; (2) Dampening pulsations from pumps (3) Recombining
Inlet Fluid Line
Outlet Fluid Line
500cc Fluid Reservoir
Pump Controls
Line for Hydrogen Sparging
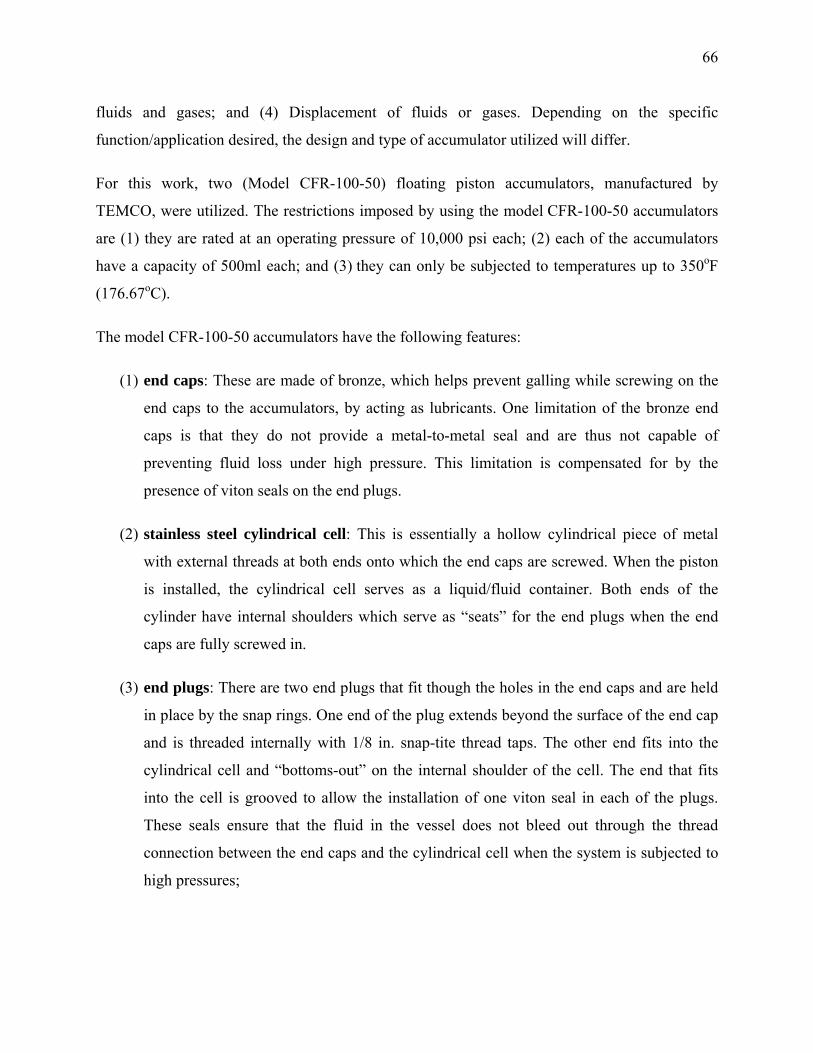
66
fluids and gases; and (4) Displacement of fluids or gases. Depending on the specific
function/application desired, the design and type of accumulator utilized will differ.
For this work, two (Model CFR-100-50) floating piston accumulators, manufactured by
TEMCO, were utilized. The restrictions imposed by using the model CFR-100-50 accumulators
are (1) they are rated at an operating pressure of 10,000 psi each; (2) each of the accumulators
have a capacity of 500ml each; and (3) they can only be subjected to temperatures up to 350oF
(176.67oC).
The model CFR-100-50 accumulators have the following features:
(1) end caps: These are made of bronze, which helps prevent galling while screwing on the
end caps to the accumulators, by acting as lubricants. One limitation of the bronze end
caps is that they do not provide a metal-to-metal seal and are thus not capable of
preventing fluid loss under high pressure. This limitation is compensated for by the
presence of viton seals on the end plugs.
(2) stainless steel cylindrical cell: This is essentially a hollow cylindrical piece of metal
with external threads at both ends onto which the end caps are screwed. When the piston
is installed, the cylindrical cell serves as a liquid/fluid container. Both ends of the
cylinder have internal shoulders which serve as “seats” for the end plugs when the end
caps are fully screwed in.
(3) end plugs: There are two end plugs that fit though the holes in the end caps and are held
in place by the snap rings. One end of the plug extends beyond the surface of the end cap
and is threaded internally with 1/8 in. snap-tite thread taps. The other end fits into the
cylindrical cell and “bottoms-out” on the internal shoulder of the cell. The end that fits
into the cell is grooved to allow the installation of one viton seal in each of the plugs.
These seals ensure that the fluid in the vessel does not bleed out through the thread
connection between the end caps and the cylindrical cell when the system is subjected to
high pressures;
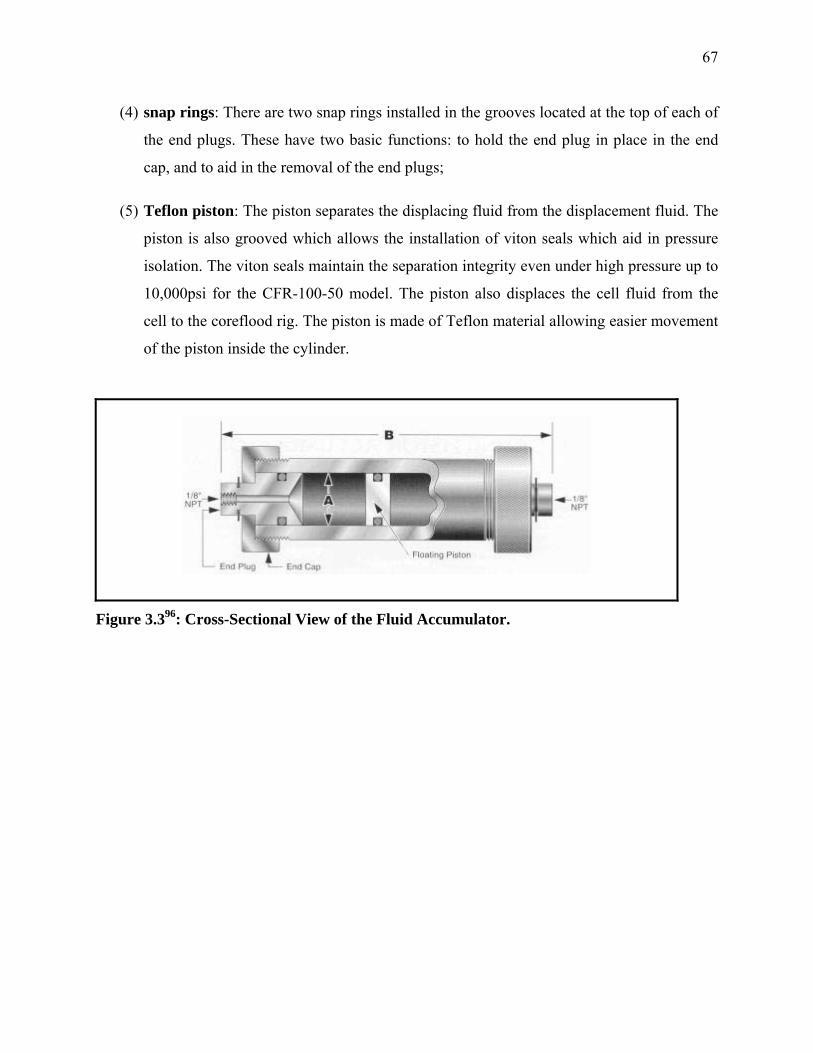
67
(4) snap rings: There are two snap rings installed in the grooves located at the top of each of
the end plugs. These have two basic functions: to hold the end plug in place in the end
cap, and to aid in the removal of the end plugs;
(5) Teflon piston: The piston separates the displacing fluid from the displacement fluid. The
piston is also grooved which allows the installation of viton seals which aid in pressure
isolation. The viton seals maintain the separation integrity even under high pressure up to
10,000psi for the CFR-100-50 model. The piston also displaces the cell fluid from the
cell to the coreflood rig. The piston is made of Teflon material allowing easier movement
of the piston inside the cylinder.
Figure 3.396: Cross-Sectional View of the Fluid Accumulator.
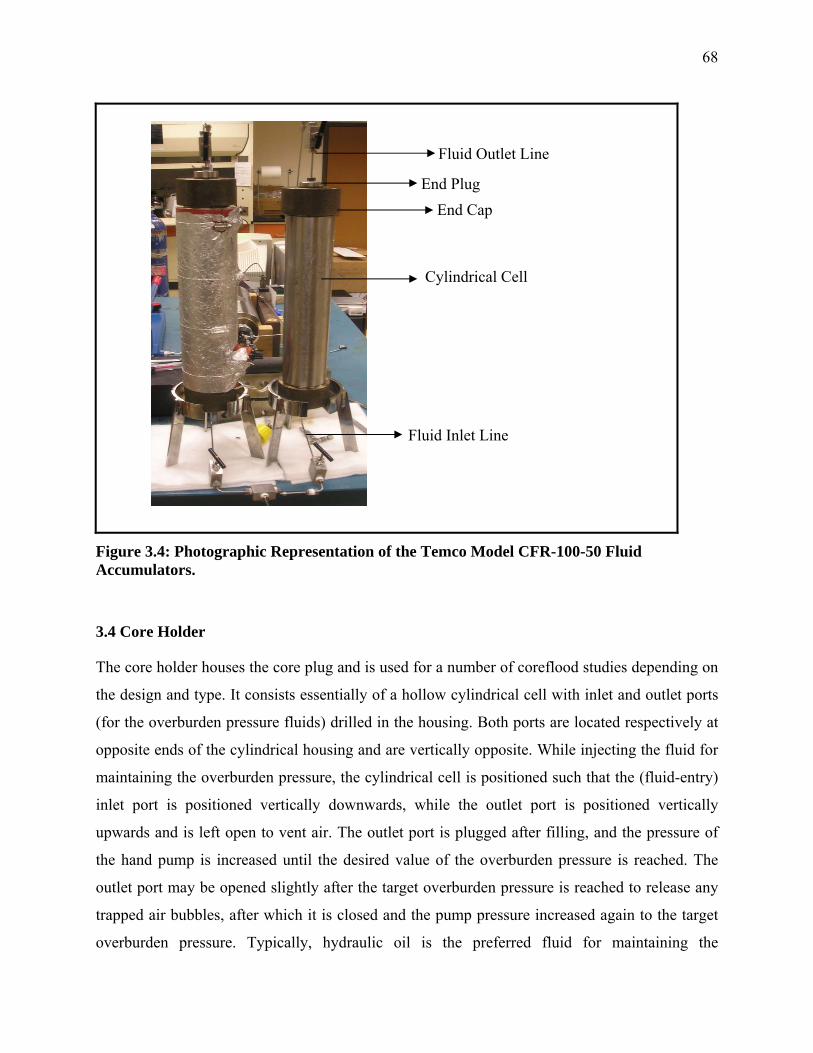
68
Figure 3.4: Photographic Representation of the Temco Model CFR-100-50 Fluid Accumulators.
3.4 Core Holder
The core holder houses the core plug and is used for a number of coreflood studies depending on
the design and type. It consists essentially of a hollow cylindrical cell with inlet and outlet ports
(for the overburden pressure fluids) drilled in the housing. Both ports are located respectively at
opposite ends of the cylindrical housing and are vertically opposite. While injecting the fluid for
maintaining the overburden pressure, the cylindrical cell is positioned such that the (fluid-entry)
inlet port is positioned vertically downwards, while the outlet port is positioned vertically
upwards and is left open to vent air. The outlet port is plugged after filling, and the pressure of
the hand pump is increased until the desired value of the overburden pressure is reached. The
outlet port may be opened slightly after the target overburden pressure is reached to release any
trapped air bubbles, after which it is closed and the pump pressure increased again to the target
overburden pressure. Typically, hydraulic oil is the preferred fluid for maintaining the
Fluid Outlet Line
Fluid Inlet Line
End Plug End Cap
Cylindrical Cell
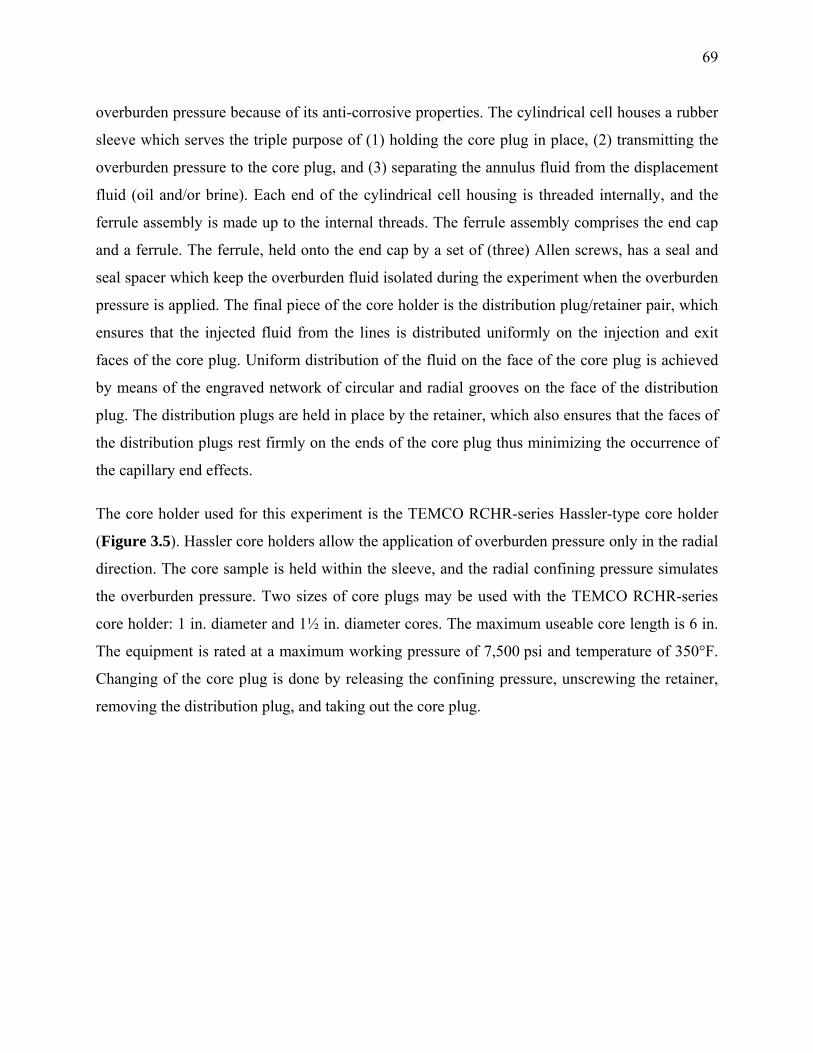
69
overburden pressure because of its anti-corrosive properties. The cylindrical cell houses a rubber
sleeve which serves the triple purpose of (1) holding the core plug in place, (2) transmitting the
overburden pressure to the core plug, and (3) separating the annulus fluid from the displacement
fluid (oil and/or brine). Each end of the cylindrical cell housing is threaded internally, and the
ferrule assembly is made up to the internal threads. The ferrule assembly comprises the end cap
and a ferrule. The ferrule, held onto the end cap by a set of (three) Allen screws, has a seal and
seal spacer which keep the overburden fluid isolated during the experiment when the overburden
pressure is applied. The final piece of the core holder is the distribution plug/retainer pair, which
ensures that the injected fluid from the lines is distributed uniformly on the injection and exit
faces of the core plug. Uniform distribution of the fluid on the face of the core plug is achieved
by means of the engraved network of circular and radial grooves on the face of the distribution
plug. The distribution plugs are held in place by the retainer, which also ensures that the faces of
the distribution plugs rest firmly on the ends of the core plug thus minimizing the occurrence of
the capillary end effects.
The core holder used for this experiment is the TEMCO RCHR-series Hassler-type core holder
(Figure 3.5). Hassler core holders allow the application of overburden pressure only in the radial
direction. The core sample is held within the sleeve, and the radial confining pressure simulates
the overburden pressure. Two sizes of core plugs may be used with the TEMCO RCHR-series
core holder: 1 in. diameter and 1½ in. diameter cores. The maximum useable core length is 6 in.
The equipment is rated at a maximum working pressure of 7,500 psi and temperature of 350°F.
Changing of the core plug is done by releasing the confining pressure, unscrewing the retainer,
removing the distribution plug, and taking out the core plug.
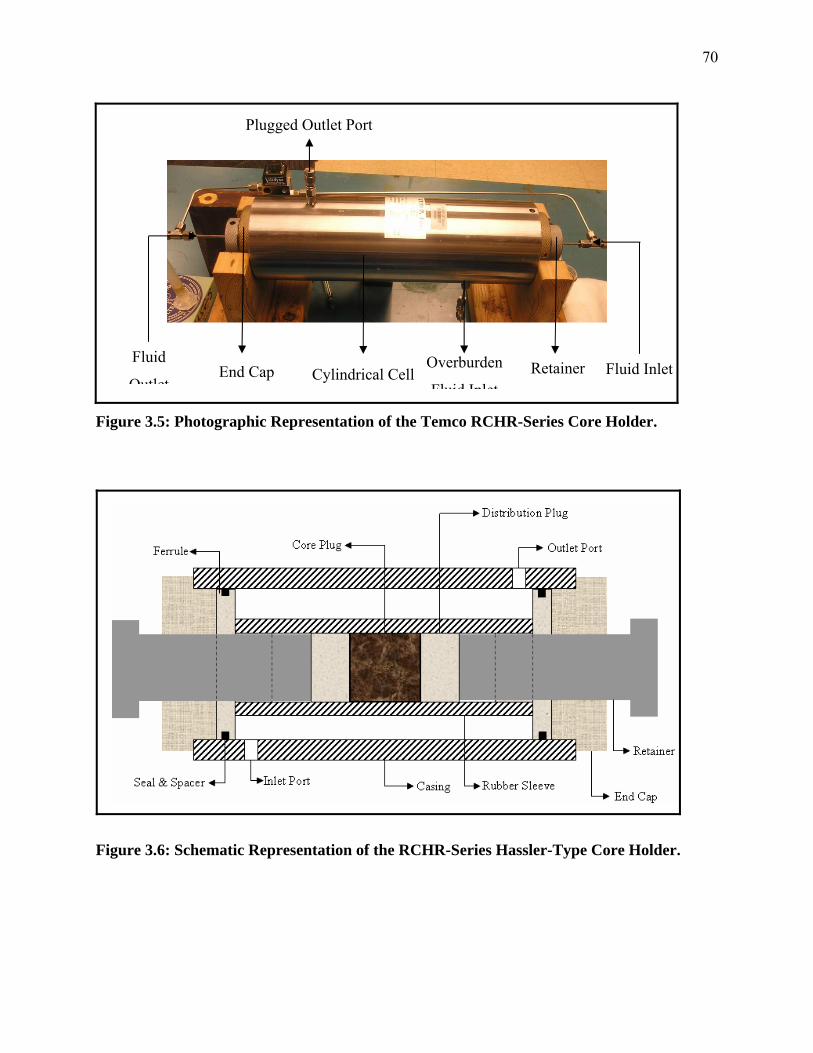
70
Figure 3.5: Photographic Representation of the Temco RCHR-Series Core Holder.
Figure 3.6: Schematic Representation of the RCHR-Series Hassler-Type Core Holder.
Cylindrical CellOverburden
Fluid InletRetainer End Cap
Fluid
Outlet
Plugged Outlet Port
Fluid Inlet

71
3.5 Overburden Pressure Pump
The radial load necessary for simulating the reservoir overburden pressure was applied using the
PH-Series (Model PH1) hand pump. The pump is rated to a maximum working pressure of
10,000 psi and has a capacity of 70 in.3 (1147 cm3) The hand pump is operated by filling the
fluid reservoir/chamber with required overburden fluid (typically hydraulic oil) and engaging the
non-return valve (NRV), by clockwise rotation of the valve screw, to ensure unidirectional flow
of fluid from the pump to core holder annulus. This allows the buildup of the required
overburden pressure within the core holder as desired. Actual fluid delivery into the annulus of
the core holder is achieved through the up-and-down stroking movement of the 18 in. lever arm.
The lever arm, which is attached to a ½ in. diameter piston, creates suction with its upward
stroke sucking the fluid into a containment chamber behind the NRV. The downward stroke of
the piston forcefully opens the NRV, and fluid is delivered to the system. Each stroke of the
piston delivers a fluid volume equal to 0.29 in3 (4.75 cm3). The overburden fluid is delivered to
the core holder through the pump 3/8 in. diameter outlet port. A 3/8 in. x 1/8 in. reducing union
was utilized to allow connection between the outlet port of the hand pump to the 1/8 in. diameter
overburden fluid inlet port of the core holder.
The pump outlet is connected to the core holder inlet port. The outlet port of the core holder is
placed vertically upwards allowing the escape of air during the filling process. When the annulus
of the core holder is completely filled, the outlet port is sealed, allowing a buildup of pressure
within the system to the predetermined value. Pressure bleedoff/reduction from the core holder
annulus is achieved by releasing the manually operated pressure release valve. This action
disengages the NRV and allows fluid flow back into the pump fluid reservoir.
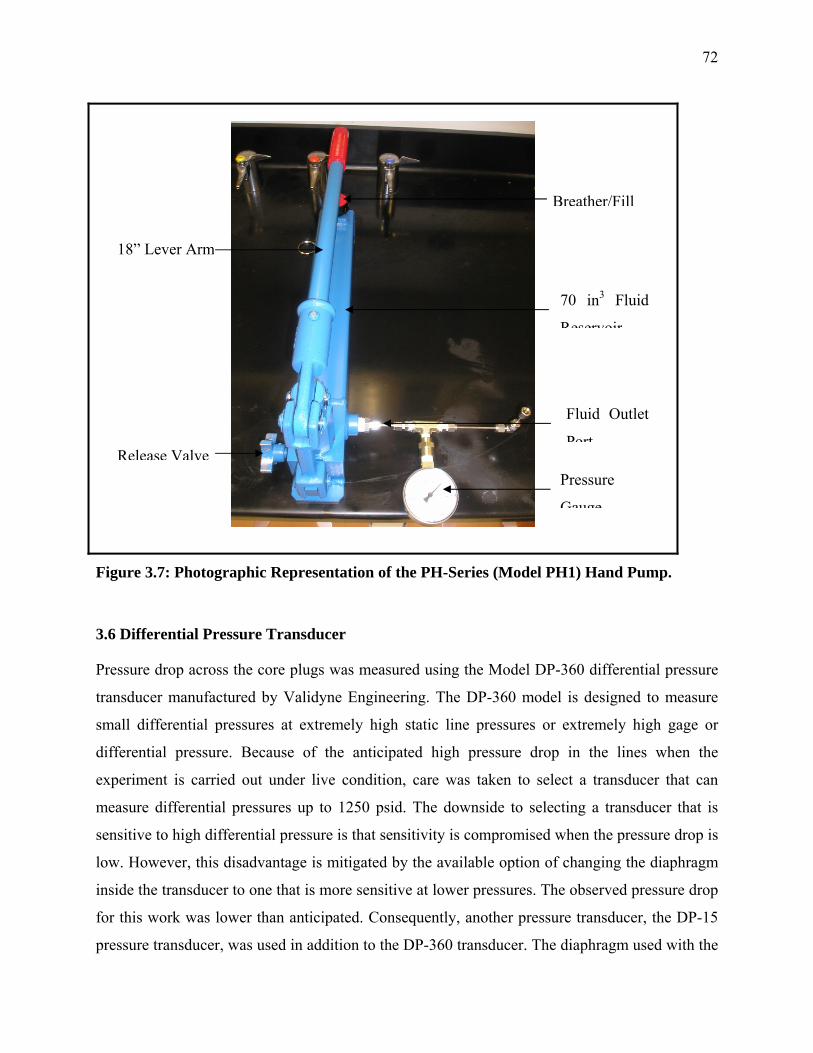
72
Figure 3.7: Photographic Representation of the PH-Series (Model PH1) Hand Pump.
3.6 Differential Pressure Transducer
Pressure drop across the core plugs was measured using the Model DP-360 differential pressure
transducer manufactured by Validyne Engineering. The DP-360 model is designed to measure
small differential pressures at extremely high static line pressures or extremely high gage or
differential pressure. Because of the anticipated high pressure drop in the lines when the
experiment is carried out under live condition, care was taken to select a transducer that can
measure differential pressures up to 1250 psid. The downside to selecting a transducer that is
sensitive to high differential pressure is that sensitivity is compromised when the pressure drop is
low. However, this disadvantage is mitigated by the available option of changing the diaphragm
inside the transducer to one that is more sensitive at lower pressures. The observed pressure drop
for this work was lower than anticipated. Consequently, another pressure transducer, the DP-15
pressure transducer, was used in addition to the DP-360 transducer. The diaphragm used with the
Pressure
Gauge
Fluid Outlet
Port
70 in3 Fluid
Reservoir
18” Lever Arm
Breather/Fill
Release Valve
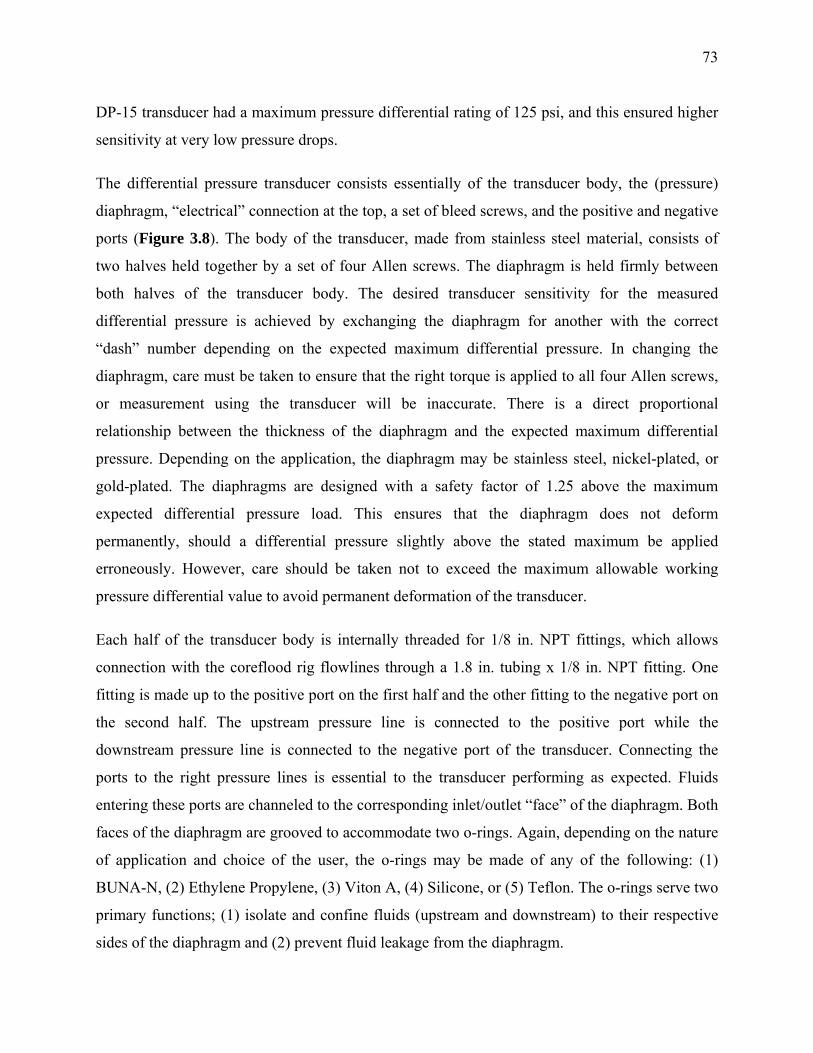
73
DP-15 transducer had a maximum pressure differential rating of 125 psi, and this ensured higher
sensitivity at very low pressure drops.
The differential pressure transducer consists essentially of the transducer body, the (pressure)
diaphragm, “electrical” connection at the top, a set of bleed screws, and the positive and negative
ports (Figure 3.8). The body of the transducer, made from stainless steel material, consists of
two halves held together by a set of four Allen screws. The diaphragm is held firmly between
both halves of the transducer body. The desired transducer sensitivity for the measured
differential pressure is achieved by exchanging the diaphragm for another with the correct
“dash” number depending on the expected maximum differential pressure. In changing the
diaphragm, care must be taken to ensure that the right torque is applied to all four Allen screws,
or measurement using the transducer will be inaccurate. There is a direct proportional
relationship between the thickness of the diaphragm and the expected maximum differential
pressure. Depending on the application, the diaphragm may be stainless steel, nickel-plated, or
gold-plated. The diaphragms are designed with a safety factor of 1.25 above the maximum
expected differential pressure load. This ensures that the diaphragm does not deform
permanently, should a differential pressure slightly above the stated maximum be applied
erroneously. However, care should be taken not to exceed the maximum allowable working
pressure differential value to avoid permanent deformation of the transducer.
Each half of the transducer body is internally threaded for 1/8 in. NPT fittings, which allows
connection with the coreflood rig flowlines through a 1.8 in. tubing x 1/8 in. NPT fitting. One
fitting is made up to the positive port on the first half and the other fitting to the negative port on
the second half. The upstream pressure line is connected to the positive port while the
downstream pressure line is connected to the negative port of the transducer. Connecting the
ports to the right pressure lines is essential to the transducer performing as expected. Fluids
entering these ports are channeled to the corresponding inlet/outlet “face” of the diaphragm. Both
faces of the diaphragm are grooved to accommodate two o-rings. Again, depending on the nature
of application and choice of the user, the o-rings may be made of any of the following: (1)
BUNA-N, (2) Ethylene Propylene, (3) Viton A, (4) Silicone, or (5) Teflon. The o-rings serve two
primary functions; (1) isolate and confine fluids (upstream and downstream) to their respective
sides of the diaphragm and (2) prevent fluid leakage from the diaphragm.
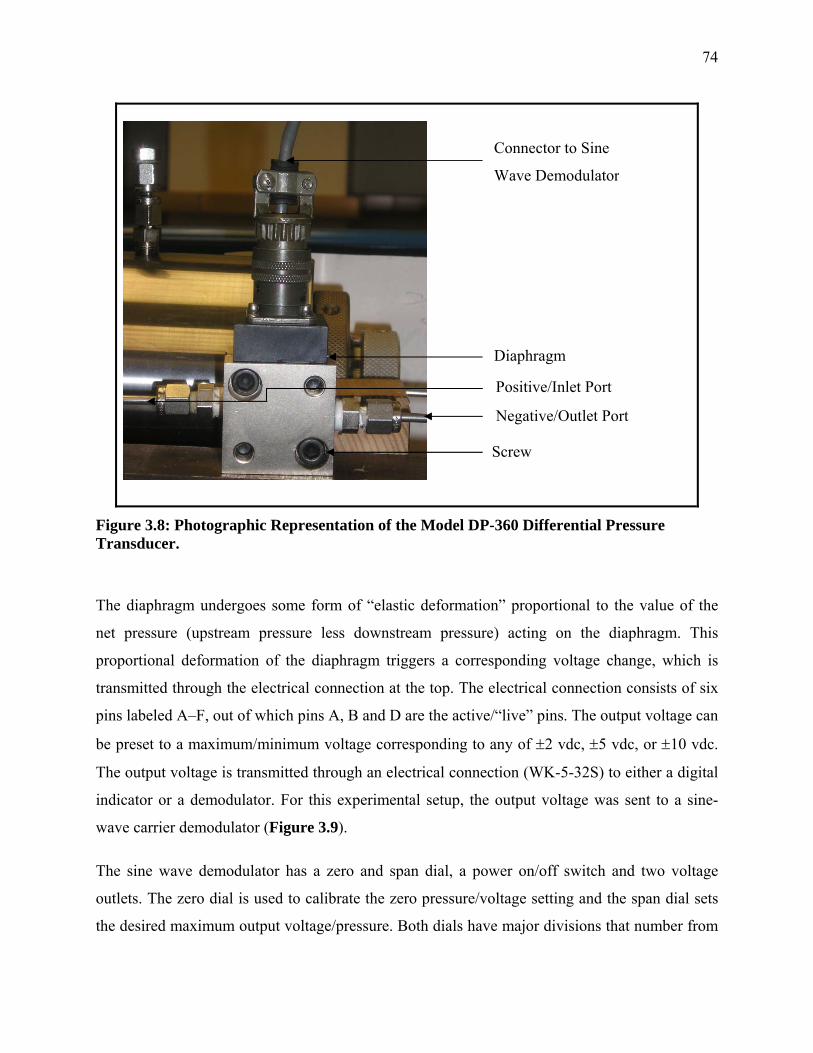
74
Figure 3.8: Photographic Representation of the Model DP-360 Differential Pressure Transducer.
The diaphragm undergoes some form of “elastic deformation” proportional to the value of the
net pressure (upstream pressure less downstream pressure) acting on the diaphragm. This
proportional deformation of the diaphragm triggers a corresponding voltage change, which is
transmitted through the electrical connection at the top. The electrical connection consists of six
pins labeled A–F, out of which pins A, B and D are the active/“live” pins. The output voltage can
be preset to a maximum/minimum voltage corresponding to any of ±2 vdc, ±5 vdc, or ±10 vdc.
The output voltage is transmitted through an electrical connection (WK-5-32S) to either a digital
indicator or a demodulator. For this experimental setup, the output voltage was sent to a sine-
wave carrier demodulator (Figure 3.9).
The sine wave demodulator has a zero and span dial, a power on/off switch and two voltage
outlets. The zero dial is used to calibrate the zero pressure/voltage setting and the span dial sets
the desired maximum output voltage/pressure. Both dials have major divisions that number from
Connector to Sine
Wave Demodulator
Diaphragm
Negative/Outlet Port
Screw
Positive/Inlet Port
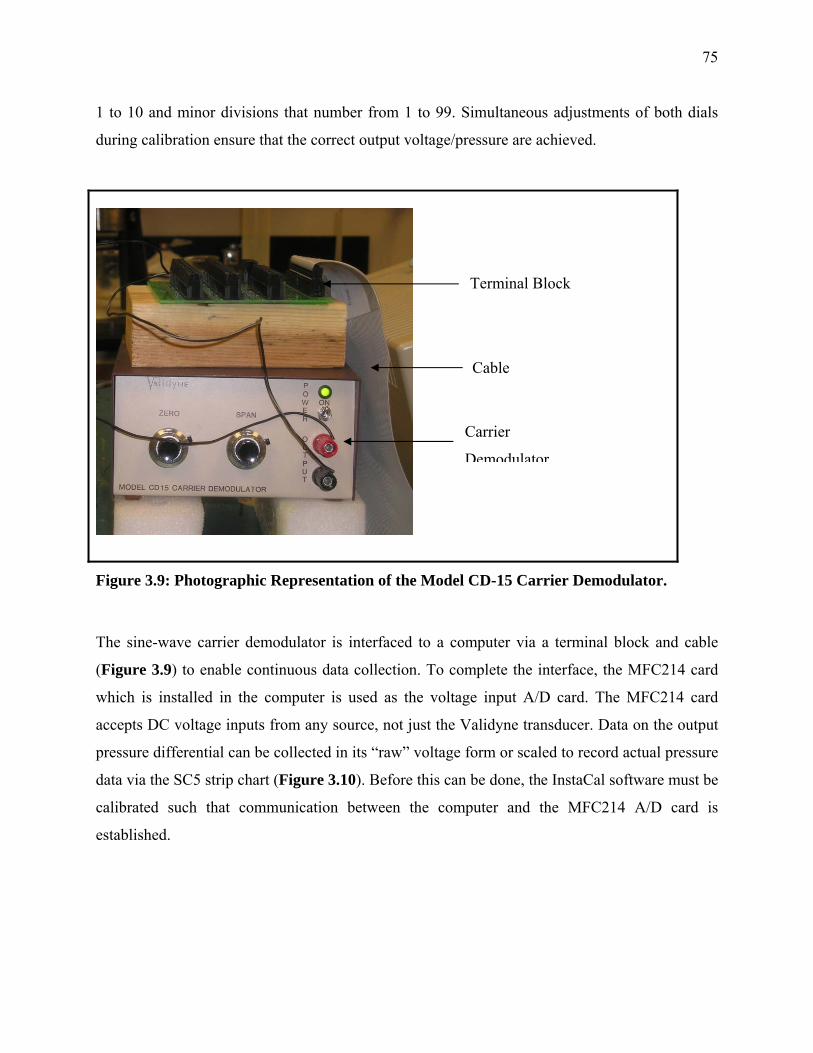
75
1 to 10 and minor divisions that number from 1 to 99. Simultaneous adjustments of both dials
during calibration ensure that the correct output voltage/pressure are achieved.
Figure 3.9: Photographic Representation of the Model CD-15 Carrier Demodulator.
The sine-wave carrier demodulator is interfaced to a computer via a terminal block and cable
(Figure 3.9) to enable continuous data collection. To complete the interface, the MFC214 card
which is installed in the computer is used as the voltage input A/D card. The MFC214 card
accepts DC voltage inputs from any source, not just the Validyne transducer. Data on the output
pressure differential can be collected in its “raw” voltage form or scaled to record actual pressure
data via the SC5 strip chart (Figure 3.10). Before this can be done, the InstaCal software must be
calibrated such that communication between the computer and the MFC214 A/D card is
established.
Carrier
Demodulator
Terminal Block
Cable
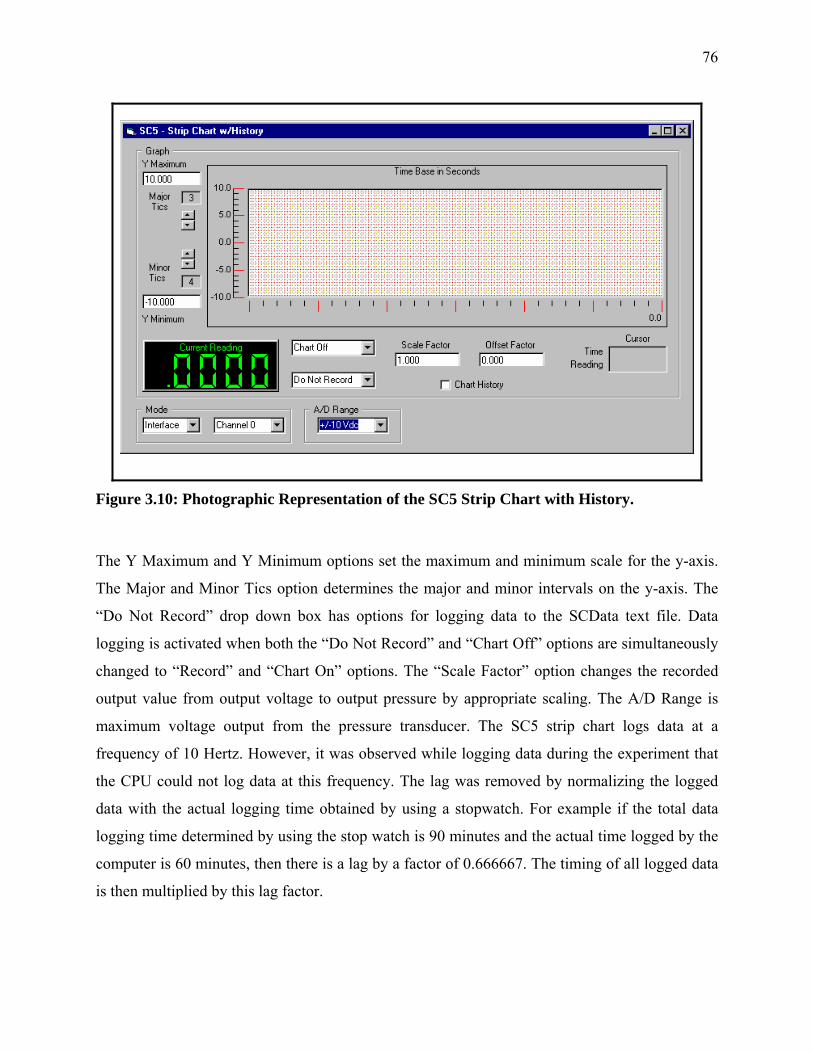
76
Figure 3.10: Photographic Representation of the SC5 Strip Chart with History.
The Y Maximum and Y Minimum options set the maximum and minimum scale for the y-axis.
The Major and Minor Tics option determines the major and minor intervals on the y-axis. The
“Do Not Record” drop down box has options for logging data to the SCData text file. Data
logging is activated when both the “Do Not Record” and “Chart Off” options are simultaneously
changed to “Record” and “Chart On” options. The “Scale Factor” option changes the recorded
output value from output voltage to output pressure by appropriate scaling. The A/D Range is
maximum voltage output from the pressure transducer. The SC5 strip chart logs data at a
frequency of 10 Hertz. However, it was observed while logging data during the experiment that
the CPU could not log data at this frequency. The lag was removed by normalizing the logged
data with the actual logging time obtained by using a stopwatch. For example if the total data
logging time determined by using the stop watch is 90 minutes and the actual time logged by the
computer is 60 minutes, then there is a lag by a factor of 0.666667. The timing of all logged data
is then multiplied by this lag factor.
77
3.7 Produced Fluid Separator
The produced fluid separator (PFS) was not used in this experiment because of some technical
difficulties encountered during the calibration of the equipment that resulted in its being sent
back to the manufacturer for further diagnostic work. The separator, manufactured by Coretest
Systems Inc., is normally used to measure the accumulation of produced oil in a brine-
displacing-oil test (waterflood). The PFS is basically a hollow cylindrical piece of steel that
houses a PVC glass tube holder. Two glass tubes are installed in the glass tube holder: one
primary separation tube and a measurement tube. The measurement glass tube is differentiated
from the separation tube by the stainless steel coiled spring wrapped around the measurement
tube. The spring is gold plated at the top. Gold is used because of its higher electrical
conductivity compared to steel. The separator has one oil/gas inlet/outlet tubing at the top and
two ports (one an outlet port and the other an inlet) at the bottom for the conductive fluid. The
fluid inlet steel tubing is connected to the port leading to the measurement glass tube (and should
extend inside the tube at least ¾ of an inch) while the fluid outlet tubing is connected to the port
leading to the separation glass tube. To allow the fluid interface level to be equal in both of the
tubes, both separation tubes are in contact at the top and bottom of the vessel in some form of u-
tube formation (Figure 3.11).
The PFS works on the principle of capacitance change based on the change in the level of the oil-
brine interface or the gas-brine interface. Data are collected from the PFS through a special
interface board that monitors the change in capacitance. The interface board is connected to the
computer, and data are logged using the supplied software. To ensure accuracy in measurement,
the TDS in the conductive fluid (brine) should be ≥ 1,000 PPM. The change in capacitance
changes primarily with the volume of the conductive fluid in the tube in a linear manner. The
PFS is capable of measuring the capacitance change up to 500 pico-farads.
Calibration of the separator involves plugging the bottom ports and applying vacuum to the
separator through the top port. While under vacuum, both glass tubes and their annuli are
allowed to self-fill from the top of the separator with the appropriate oleic phase (in our case
crude oil or decane). Alternatively, oil can be pumped from the bottom of the separator and air
displaced from the top. The glass tubes have a total volume of 200 cc, but are also available in
78
other volume sizes. After filling under vacuum, the separator is pressured to the desired pressure,
the slope is set to 1.0 in the configuration window (Figure 3.12), and the pump volume is set to
zero. Note that at this point, the separator software will display the signal value, in counts, and
not the actual volume. If the experiment is at ambient condition, the separator need not be
pressured. Brine injection into the separator is started at a rate no faster than 5 cc/min. The
volume and graphic displays are then monitored for any sudden changes in the volume reading.
Typically, it may take from 5 to 30 cc of brine injected before the separator electronics first
detect a volume change.
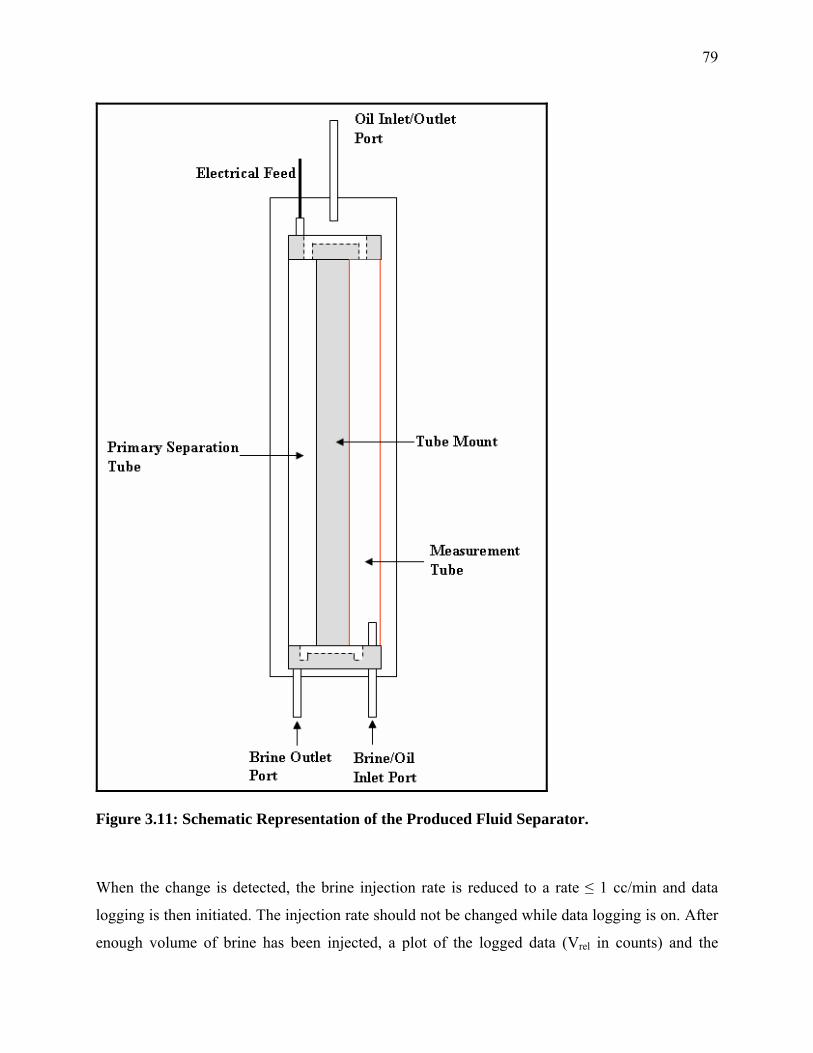
79
Figure 3.11: Schematic Representation of the Produced Fluid Separator.
When the change is detected, the brine injection rate is reduced to a rate ≤ 1 cc/min and data
logging is then initiated. The injection rate should not be changed while data logging is on. After
enough volume of brine has been injected, a plot of the logged data (Vrel in counts) and the

80
injected brine volume (in cm3) is made in Microsoft Excel and the slope noted. The slope option
in the configuration window (Figure 3.12) is then changed from 1.0 to the calculated slope. The
accuracy of the calibration is validated by injecting more brine, followed by displacing some of
the brine by oil such that the movement of the oil-brine interface in both the upwards and
downwards direction is monitored and the volume of the injected and displaced brine logged.
Ideally, the injected and displaced brine volume should correspond to the logged Vrel value. It is
reported by the manufacturers that the accuracy of the calibration coefficient of counts to volume
has a correlation factor of better than 99.9%. However, the accuracy of this correlation factor
was discovered to be << 99.9%, and a reasonable match between the injected brine volume and
the value of the logged volume based on the change in capacitance was not achieved.
During the troubleshooting process, it was suspected that the chemical composition of the
refinery blend crude oil used in the calibration process might be interfering with the calibration
process. Use of kerosene was suggested in lieu of the crude oil. However, other reported similar
complaints by other PFS users resulted in the redesign of the separator interface box by the
manufacturer, Coretest Systems Inc. Another problem encountered in using the separator is the
breaking of the glass tubes while installing them in their housing. Subsequent diagnosis showed
that some of the glass tubes were actually longer than the tube housing, resulting in glass
breakage when the glass tube bottom plate is torqued in place. Currently, the PFS and its
accessories have been sent back to CoreTest for complete diagnosis of the problems.
Figure 3.12: Photographic Representation of the PFS Configuration Window.

81
3.8 Backpressure Regulator
A backpressure regulator is used to maintain a certain desired level of constant pressure in the
system. The regulator is manufactured by Temco Inc., and there are many different models
available depending on the proposed application with respect to the experimental condition. The
regulator is made of two composite parts held together by a set of high-strength cap screws.
Between the two parts sits a diaphragm that is made from either Teflon elastomer or Buta-N
rubber depending on the type of application. For this work, the BP-series backpressure regulator
was utilized and has a maximum working pressure of 10,000 psi and temperature of 350°F. The
diaphragm type within the transducer is Teflon elastomer.
The transducer works on the principle of balanced pressure. Gas is charged into the dome side of
the transducer and pressure allowed to build up to a maximum of 500 psi after which flow is
established downstream of the transducer to build up the downstream pressure to approximately
500 psi. The gas pressure is then increased by the same maximum pressure, and this pressure is
equalized by establishing flow downstream of the separator. The stage-wise pressurization is
very important to prevent damage to the diaphragm. The design of the diaphragm is such that the
area exposed to the flowing pressure is smaller than the area exposed to the dome-side gas.
Consequently, the flowing pressure will always be higher than the dome side pressure. It is
pertinent to emphasize that only gas may be used to maintain the dome side pressure; use of
liquids is not advisable. For this work, nitrogen gas was used to maintain the backpressure. For
this experiment, the backpressure regulator is located downstream to the coreholder. This ensures
that the design pressure is maintained within the system. The application of the pressure
regulator for this experiment is to maintain/simulate the actual reservoir pressure with a view to
keeping the gas in solution when live crude oil is used. In addition, it is used to keep the
superheated steam in its liquid state during hot waterflooding, by maintaining a backpressure that
is greater than the saturated liquid pressure of the superheated steam.
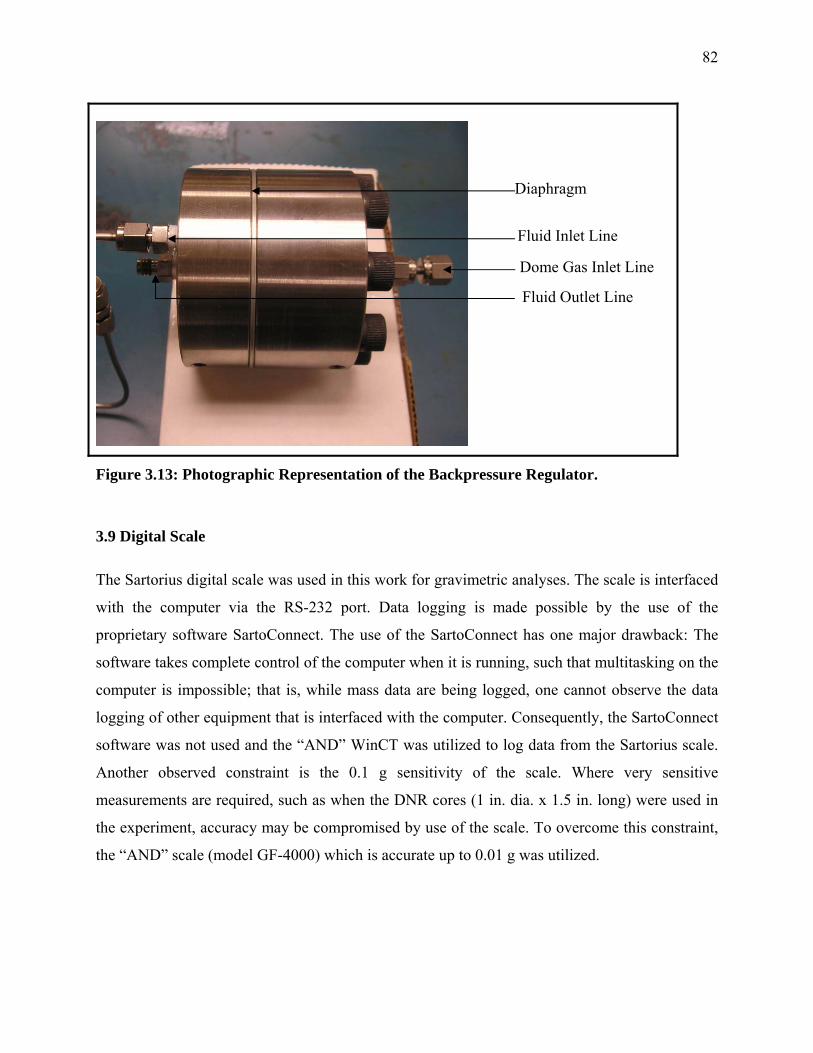
82
Figure 3.13: Photographic Representation of the Backpressure Regulator.
3.9 Digital Scale
The Sartorius digital scale was used in this work for gravimetric analyses. The scale is interfaced
with the computer via the RS-232 port. Data logging is made possible by the use of the
proprietary software SartoConnect. The use of the SartoConnect has one major drawback: The
software takes complete control of the computer when it is running, such that multitasking on the
computer is impossible; that is, while mass data are being logged, one cannot observe the data
logging of other equipment that is interfaced with the computer. Consequently, the SartoConnect
software was not used and the “AND” WinCT was utilized to log data from the Sartorius scale.
Another observed constraint is the 0.1 g sensitivity of the scale. Where very sensitive
measurements are required, such as when the DNR cores (1 in. dia. x 1.5 in. long) were used in
the experiment, accuracy may be compromised by use of the scale. To overcome this constraint,
the “AND” scale (model GF-4000) which is accurate up to 0.01 g was utilized.
Diaphragm
Fluid Inlet Line
Dome Gas Inlet Line
Fluid Outlet Line
83
3.10 Laminated Silicone Rubber Heater Blankets
Heating of the fluids, crude oil, and brine is achieved by the use of rectangular/square heater
blankets. The heater blankets consist essentially of heating coils sandwiched between two outer
rubber layers. There are several available options, such as adhesive vs. no-adhesive and fixed
temperature vs. adjustable thermostat. For this work, the “no-adhesive” and adjustable thermostat
options were chosen. The adjustable thermostat has a dial setting with numbers ranging from 1 to
10. The dial setting of “1” corresponds to the minimum temperature of 75°F and the dial setting
of 10 corresponds to the maximum temperature of 425°F. Table 3.1 shows the available dial
settings and the corresponding temperature value. Though it is reported that the blankets have a
thermostat tolerance of ± 5°F much larger fluctuations up to ± 10°F have been observed while
running the experiment. To prevent heat loss to the atmosphere from the heater blankets, the
blankets are covered with materials having low heat conductivity. The experimental design
allows for the use of four heater blankets for the following equipment: (1) oil accumulator,
(2) brine accumulator, (3) core holder, and (4) PFS. The heater blankets are held in place on the
equipment by adjustable ring clamps. Figure 3.14 is a photographic representation of one of the
heater blankets wrapped around the brine accumulator for heating the brine.
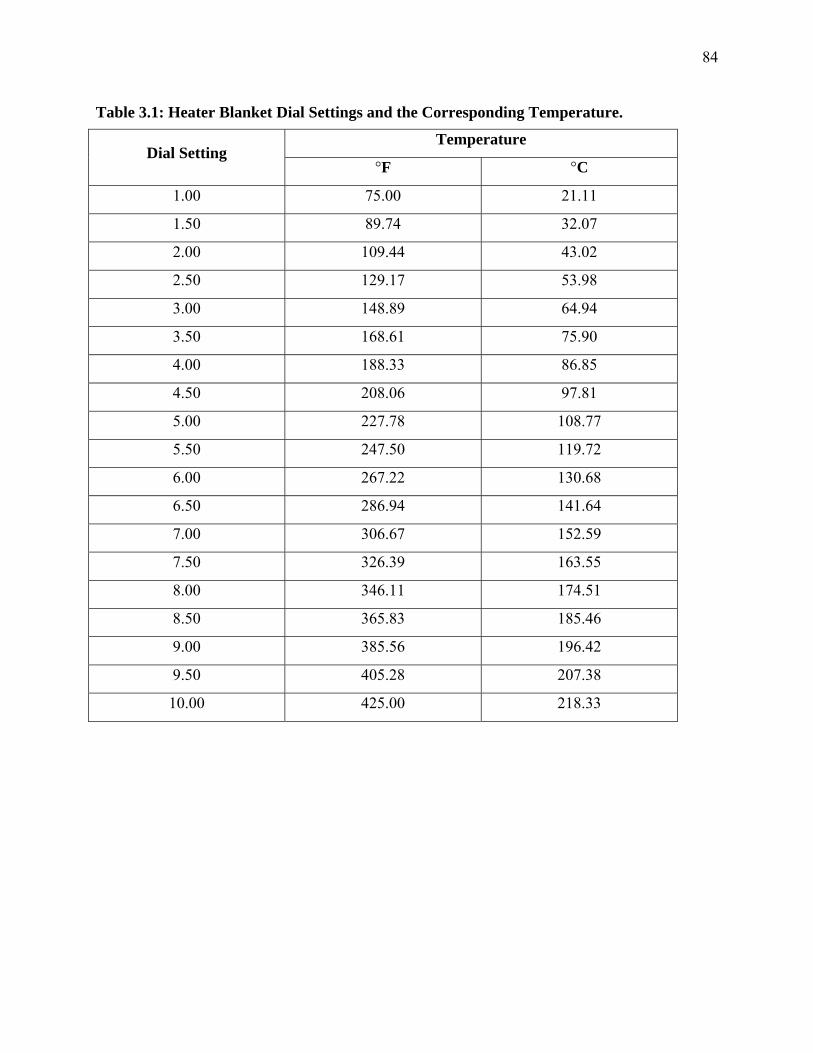
84
Table 3.1: Heater Blanket Dial Settings and the Corresponding Temperature.
Temperature Dial Setting
°F °C
1.00 75.00 21.11
1.50 89.74 32.07
2.00 109.44 43.02
2.50 129.17 53.98
3.00 148.89 64.94
3.50 168.61 75.90
4.00 188.33 86.85
4.50 208.06 97.81
5.00 227.78 108.77
5.50 247.50 119.72
6.00 267.22 130.68
6.50 286.94 141.64
7.00 306.67 152.59
7.50 326.39 163.55
8.00 346.11 174.51
8.50 365.83 185.46
9.00 385.56 196.42
9.50 405.28 207.38
10.00 425.00 218.33
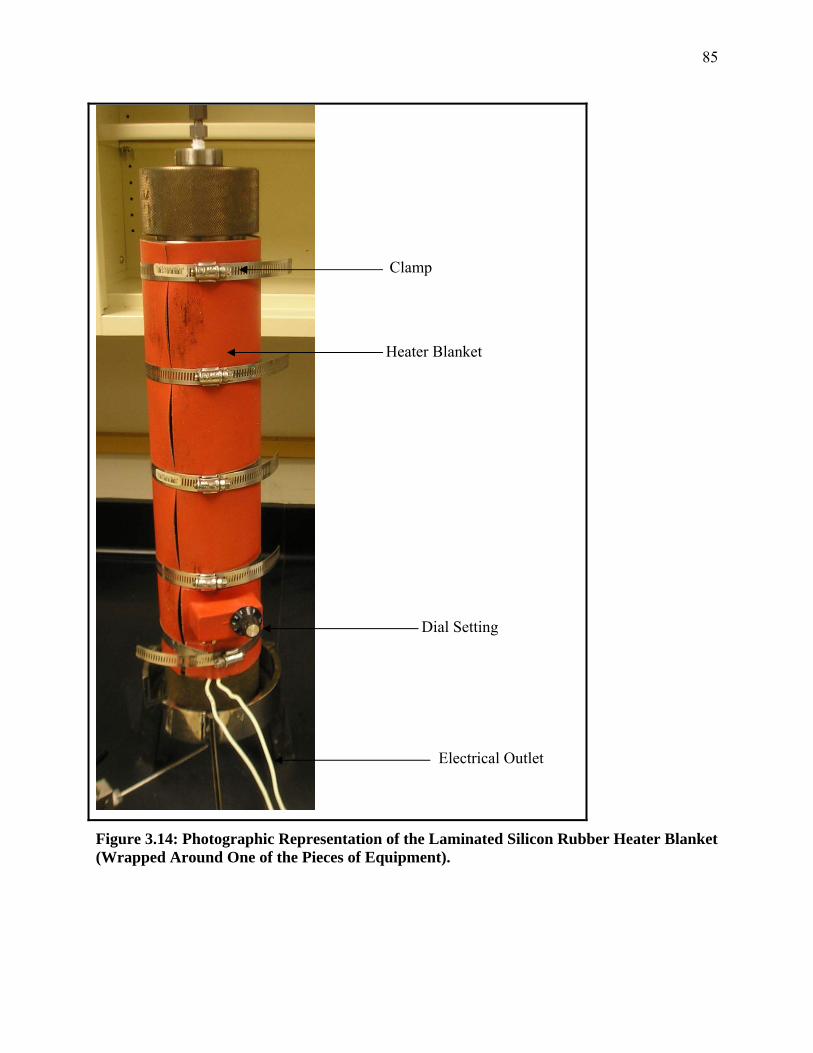
85
Figure 3.14: Photographic Representation of the Laminated Silicon Rubber Heater Blanket (Wrapped Around One of the Pieces of Equipment).
Heater Blanket
Clamp
Dial Setting
Electrical Outlet
86
3.11 Gas Supply and Regulator
The gas supply to the backpressure regulator and for the calibration of the pressure transducer is
by means of pressurized nitrogen cylinders (2,263 psi). Nitrogen is the preferred option because
of its relatively inert nature. Before these pressurized gas cylinders are put to use, a pressure
regulator is installed to ensure controlled pressure supply and buildup. The two types of available
regulators are the single- and the double-stage pressure regulators. The single-stage pressure
regulator reduces the cylinder gas pressure to the required delivery pressure in one step, while
the double-stage pressure regulator does the same in two steps. The single-stage regulator is a
preferred option if slight variations in delivery pressure are not detrimental to the application.
3.12 Fluid Lines and Fittings
The design of the experiment is such that all fluid lines are 1/8 in. tubing supplied by Swagelok
Company. The design choice of 1/8 in. tubing is based on the need to minimize dead volume
within the tubing during the coreflooding process. Using a larger tubing size will result in a
higher value of dead volume within the tubing. All the tubing fittings (union connector, elbow
connector, tee connector, etc.) were supplied by Swagelok. Both the tubing and the fittings are
rated at a maximum working pressure of 10,000 psi. The only constraint to using the 1/8 in.
tubing is that it crimps easily compared with tubing of larger diameters. Because of the expected
high-pressure requirement when “live oil” is used, the “HiP” valves were utilized. These valves
are two-way on/off valves capable of withstanding pressures up to 10,000 psi.
87
CHAPTER 4: Experimental Description and Procedure
4.1 Experimental Description – DNR and Berea Cores
The experiments, carried out as part of this research work, were designed to examine the effect
of salinity change and hot water injection on improved oil recovery and to determine if
wettability alteration is a possible mechanism for this recovery. Two sets of experiments were
carried out. The first set of experiments explored (1) the EOR potential of decrease in brine
salinity and (2) the effect of temperature on waterflood residual oil saturation. The second set of
experiments, in addition to determining the effects of the second option above, evaluated the
potential of low-salinity brine for secondary oil recovery and the associated wettability change, if
any. Reduction in salinity was achieved by reduction in the quantity of total dissolved solids
(TDS) in the brine. Berea sandstone core plugs were used in the first set of experiments. The
core plugs for the second set of experiments were loaned from the archives of the Alaska
Department of Natural Resources (DNR).
Flood rates for the first set of experiments were between 20–50 cc/hr inclusive, while the rate for
the second set of experiments was constant at 20 cc/hr. Generated pore pressures were directly
proportional to flow rates used. A 1,500 psi overburden was used for the first set of experiments.
The overburden pressures used for the second set of experiments were between 1,000 psi and
1,800 psi. This pressure range was necessitated by high pressure drop (1,700 psi) across some of
the core samples at the prevailing flow rate and the constraint imposed by the core holder
operating condition (the applied radial pressure should be several hundred psi above the flowline
pressure in order to avoid fluid leakage to the core holder annulus). It was observed that for some
of the DNR core plugs, a flow rate of 20 cc/hr resulted in pressure drops as high as 1,700 psi.
Wettability variation was not examined in the first set of experiments. However, wettability
characterization for the second set of experiments was done using the Amott-Harvey wettability
index. The choice of the Amott-Harvey wettability determination method was based on its
relative ease of application as compared with the other conventional wettability determination
methods—the USBM and contact angle methods.
88
The first step in the experiment was the preparation of the samples. The brine was reconstituted
and the core plugs prepared for use by preflushing (with toluene, followed by acetone and then
water) and/or heating. The Berea sandstone cores were only heated, while the DNR cores were
pre-flushed and heated. Preflushing of the DNR cores was necessary since the states of the cores
were unknown. The preflushing and heating treatment was followed by the determination of the
rock and fluid properties. The determined fluid properties were the viscosity and density of the
brine and the oils, while the rock properties determined were the porosities and absolute
permeabilities of the core plugs.
The core was then flooded to interstitial/initial water saturation and, for only the DNR cores, the
initial wettability of the all the cores was determined using the Amott-Harvey test. The core
sample was then waterflooded with brines of different salinity (at ambient and elevated
temperatures) and the waterflood oil recovery noted. The wettability change, if any, was
monitored at every stage of the experiment for the DNR cores when the brine salinity and/or
brine temperature were changed.
4.1.1 Core Samples
Berea sandstones were used for the first set of experiments, while cores from DNR archives were
used for the second set of experiments. Though the design of the experiment was for preserved
samples from the ANS fields, absence of these samples necessitated the use of these alternative
samples.
The DNR core plugs were from Milne Point, Kuparuk River Unit L-01. The cores, which were
all ≈ 1 in. in diameter and 1.5 in. in length, were cut from core taken from depths between 7,170
ft and 9,016 ft. Petrophysical details and storage state of the DNR cores could not be obtained
from DNR. However, the drilling schedule was obtained from the AOGCC website. The
Kuparuk River L-01 well was drilled to a total depth of 9,500 ft, completed in April 1984, and
plugged and abandoned in May 2003. Consequently, it is conceivable that the cores from
Kuparuk River L-01 have been on the DNR shelf between 15 to 20 years. Porosity values
determined in the lab for these cores ranged from 16% to 26%, while the permeability values
were between 0.93 and 194 md. Porosity was determined using the saturation method as
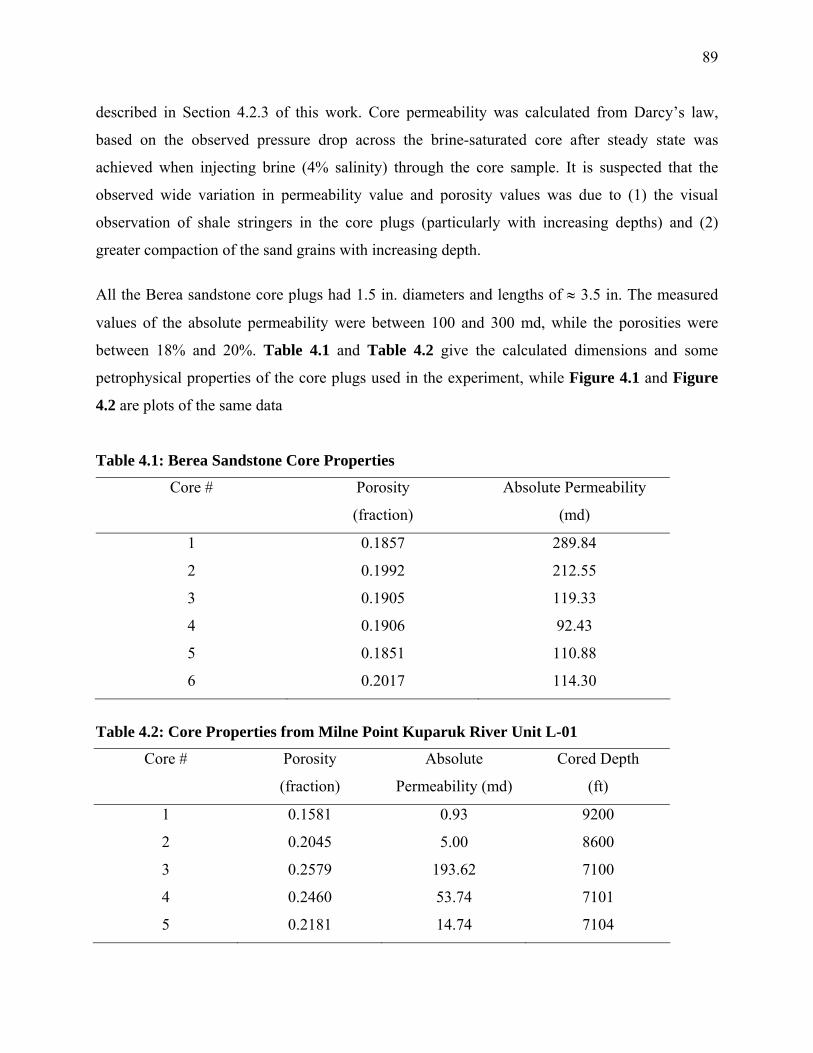
89
described in Section 4.2.3 of this work. Core permeability was calculated from Darcy’s law,
based on the observed pressure drop across the brine-saturated core after steady state was
achieved when injecting brine (4% salinity) through the core sample. It is suspected that the
observed wide variation in permeability value and porosity values was due to (1) the visual
observation of shale stringers in the core plugs (particularly with increasing depths) and (2)
greater compaction of the sand grains with increasing depth.
All the Berea sandstone core plugs had 1.5 in. diameters and lengths of ≈ 3.5 in. The measured
values of the absolute permeability were between 100 and 300 md, while the porosities were
between 18% and 20%. Table 4.1 and Table 4.2 give the calculated dimensions and some
petrophysical properties of the core plugs used in the experiment, while Figure 4.1 and Figure
4.2 are plots of the same data
Table 4.1: Berea Sandstone Core Properties
Core # Porosity
(fraction)
Absolute Permeability
(md)
1 0.1857 289.84
2 0.1992 212.55
3 0.1905 119.33
4 0.1906 92.43
5 0.1851 110.88
6 0.2017 114.30
Table 4.2: Core Properties from Milne Point Kuparuk River Unit L-01
Core # Porosity
(fraction)
Absolute
Permeability (md)
Cored Depth
(ft)
1 0.1581 0.93 9200
2 0.2045 5.00 8600
3 0.2579 193.62 7100
4 0.2460 53.74 7101
5 0.2181 14.74 7104
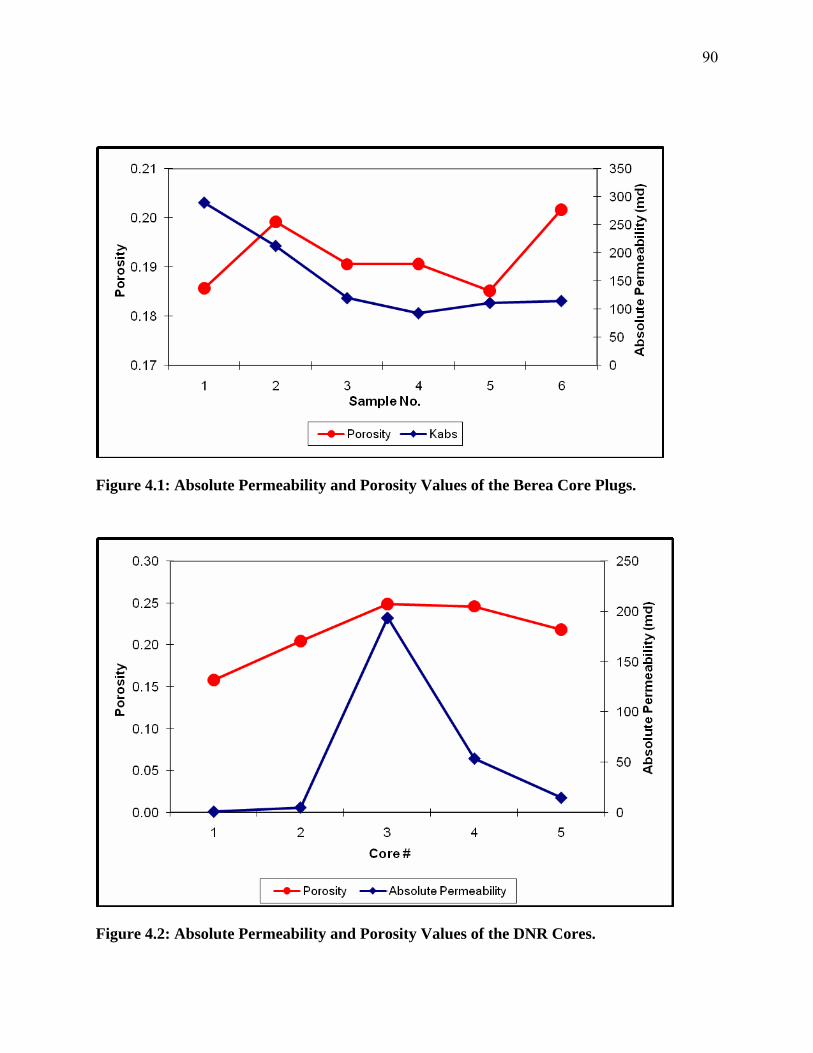
90
Figure 4.1: Absolute Permeability and Porosity Values of the Berea Core Plugs.
Figure 4.2: Absolute Permeability and Porosity Values of the DNR Cores.
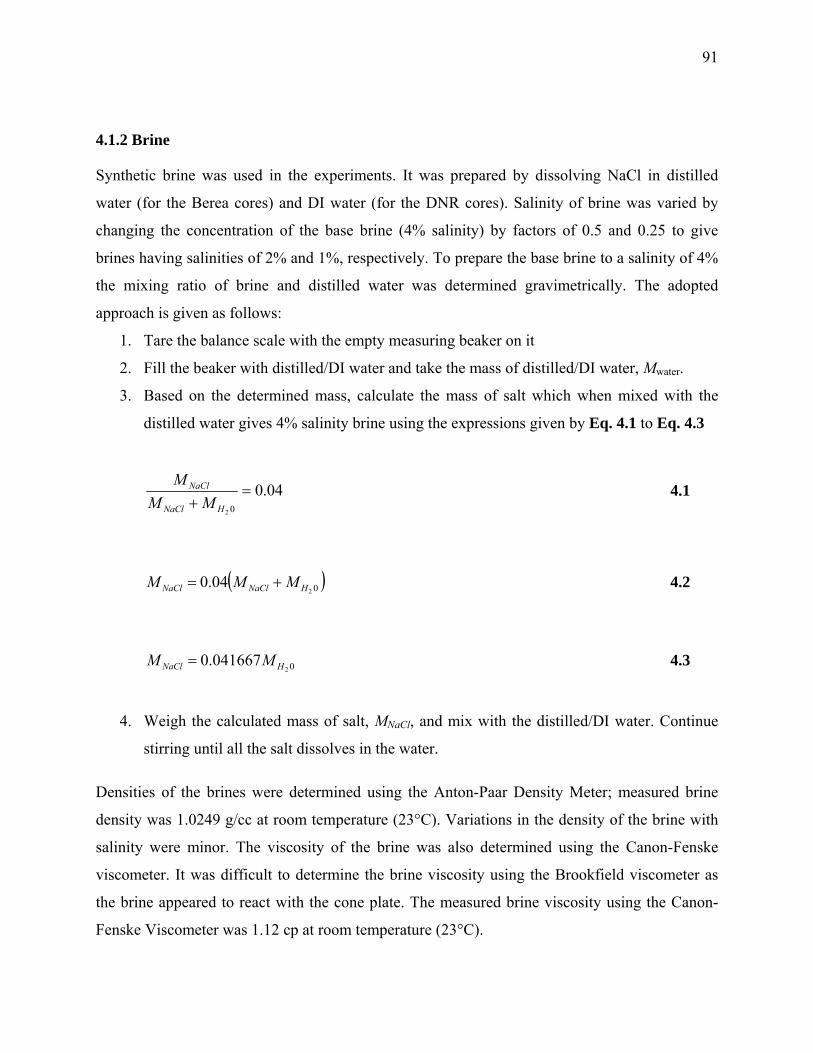
91
4.1.2 Brine
Synthetic brine was used in the experiments. It was prepared by dissolving NaCl in distilled
water (for the Berea cores) and DI water (for the DNR cores). Salinity of brine was varied by
changing the concentration of the base brine (4% salinity) by factors of 0.5 and 0.25 to give
brines having salinities of 2% and 1%, respectively. To prepare the base brine to a salinity of 4%
the mixing ratio of brine and distilled water was determined gravimetrically. The adopted
approach is given as follows:
1. Tare the balance scale with the empty measuring beaker on it
2. Fill the beaker with distilled/DI water and take the mass of distilled/DI water, Mwater.
3. Based on the determined mass, calculate the mass of salt which when mixed with the
distilled water gives 4% salinity brine using the expressions given by Eq. 4.1 to Eq. 4.3
04.002
=+ HNaCl
NaCl
MMM
4.1
( )0204.0 HNaClNaCl MMM += 4.2
02041667.0 HNaCl MM = 4.3
4. Weigh the calculated mass of salt, MNaCl, and mix with the distilled/DI water. Continue
stirring until all the salt dissolves in the water.
Densities of the brines were determined using the Anton-Paar Density Meter; measured brine
density was 1.0249 g/cc at room temperature (23°C). Variations in the density of the brine with
salinity were minor. The viscosity of the brine was also determined using the Canon-Fenske
viscometer. It was difficult to determine the brine viscosity using the Brookfield viscometer as
the brine appeared to react with the cone plate. The measured brine viscosity using the Canon-
Fenske Viscometer was 1.12 cp at room temperature (23°C).

92
4.1.3 Crude Oils
Two kinds of oils were used in this experiment: (1) a pipeline blend of various crude oils from
the ANS, that is, a flashed oil sample from TAPS collected at North Pole, designated in this work
as TAPS blend, and (2) refined oil (decane) spiked with crude oil designated as spiked decane.
The decane was spiked to differentiate visually the brine from the oil during the displacement
studies. Densities of both oils were determined by using the Anton-Paar density meter. The
measured density of TAPS blend was 0.8533 g/cc, while that of decane was 0.7260 g/cc. Both
densities were determined at room temperature of 23oC. Viscosities were determined using the
Brookfield viscometer, and the viscosities of TAPS blend and spiked decane are respectively
8.24 cp and ≈ 0.9 cp.
4.2 Experimental Description – ANS Representative Cores
The present research study was carried out on representative core samples from the Alaska North
Slope. Three sets of experiments were carried out in this research study: One set was the
observation of the effect of variation in the brine salinity on residual oil saturation and
wettability of new (clean) cores. The second set was the study of the effect of oil aging on the
core samples and consequent observation of the effect of variation in the brine salinity on
residual oil saturation and wettability of these oil aged cores. Reduction in salinity is achieved by
reduction in the quantity of TDS in the brine. Furthermore, instead of reducing quantity of TDS
in the brine, the option of using the representative low salinity ANS lake water was also
investigated. ANS lake water served the purpose of reduced salinity brine in the coreflood
studies. Hence, representative ANS lake water was also used in the experiments. Thus, the third
set of coreflood experiments were conducted using ANS lake water to evaluate its potential for
secondary oil recovery and the associated wettability change, if any.
Flood rate for all the sets of experiments was kept at 30 cc/hr. A reservoir temperature of 220°F
was maintained, and 500 psi overburden was used in the experiments. Wettability
characterization for all sets of experiments was done using the Amott-Harvey wettability index.
93
For the first two sets of experiments, the brine was reconstituted in the lab, while ANS lake
water was used for the third set of experiments. The first step in all the experiments is the
preparation of the core samples. The core plugs were prepared for use by preflushing (with
toluene, followed by acetone and then water) and/or heating. Subsequently porosities and
absolute permeabilities of all the core samples were determined.
In all three sets of experiments, the core is then flooded to interstitial/initial water saturation and
the initial wettability of the cores was determined using the Amott-Harvey test. The core sample
is then waterflooded with brines of different salinity (at reservoir temperatures and ambient
outlet pressure) and the waterflood oil recovery was noted. The wettability change, if any, is
monitored at every stage of the experiment, (i.e., when the brine salinity is changed).
Core Samples
Ten representative ANS core samples were used for the present experimental research study. The
cores were approximately 0.8 in. in length and 1.5 in. in diameter. Porosity and absolute
permeability values were determined in the lab for all the core samples. Porosity values ranged
from 19% to 32% while the permeability values were between 38 mD and 97 mD. Porosity was
determined using the saturation method. Core permeability was calculated from Darcy’s law
based on the observed pressure drop across the brine-saturated core after a steady state was
achieved when injecting brine (22,000 TDS salinity) through the core sample.
Porosity and permeability values of all the ten core samples are shown in the following Figure
4.3.
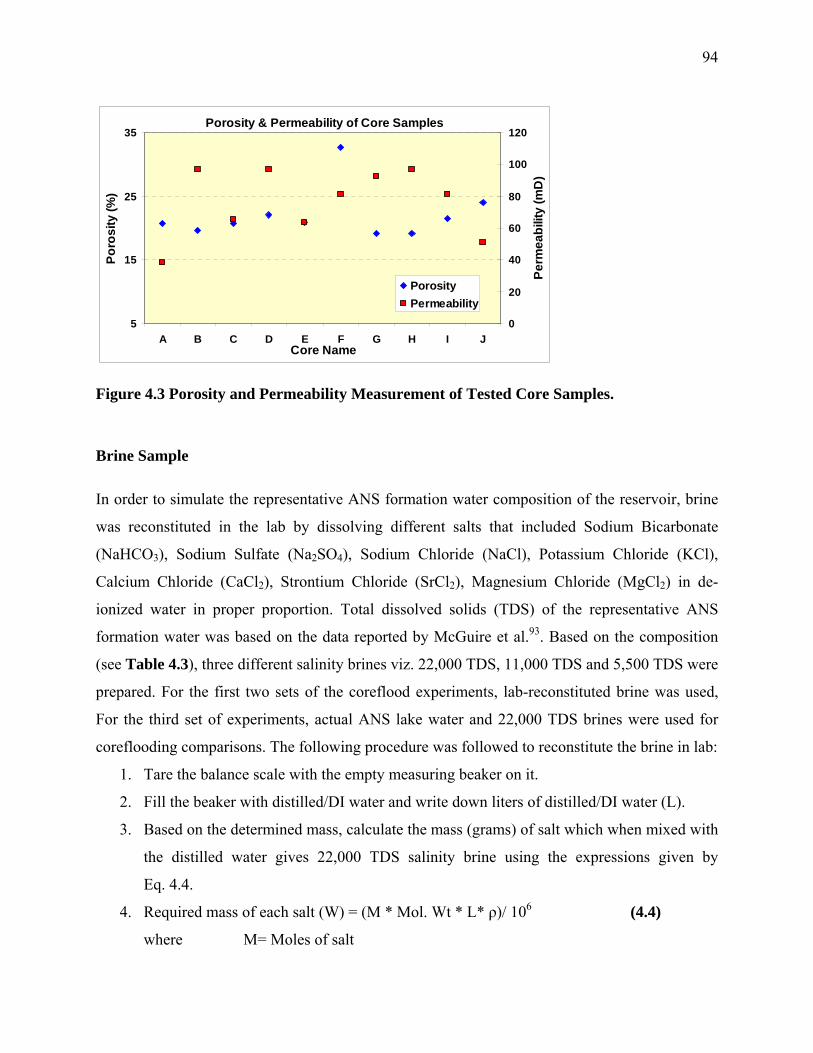
94
Porosity & Permeability of Core Samples
5
15
25
35
A B C D E F G H I JCore Name
Poro
sity
(%)
0
20
40
60
80
100
120
Perm
eabi
lity
(mD
)
PorosityPermeability
Figure 4.3 Porosity and Permeability Measurement of Tested Core Samples.
Brine Sample
In order to simulate the representative ANS formation water composition of the reservoir, brine
was reconstituted in the lab by dissolving different salts that included Sodium Bicarbonate
(NaHCO3), Sodium Sulfate (Na2SO4), Sodium Chloride (NaCl), Potassium Chloride (KCl),
Calcium Chloride (CaCl2), Strontium Chloride (SrCl2), Magnesium Chloride (MgCl2) in de-
ionized water in proper proportion. Total dissolved solids (TDS) of the representative ANS
formation water was based on the data reported by McGuire et al.93. Based on the composition
(see Table 4.3), three different salinity brines viz. 22,000 TDS, 11,000 TDS and 5,500 TDS were
prepared. For the first two sets of the coreflood experiments, lab-reconstituted brine was used,
For the third set of experiments, actual ANS lake water and 22,000 TDS brines were used for
coreflooding comparisons. The following procedure was followed to reconstitute the brine in lab:
1. Tare the balance scale with the empty measuring beaker on it.
2. Fill the beaker with distilled/DI water and write down liters of distilled/DI water (L).
3. Based on the determined mass, calculate the mass (grams) of salt which when mixed with
the distilled water gives 22,000 TDS salinity brine using the expressions given by
Eq. 4.4.
4. Required mass of each salt (W) = (M * Mol. Wt * L* ρ)/ 106 (4.4)
where M= Moles of salt
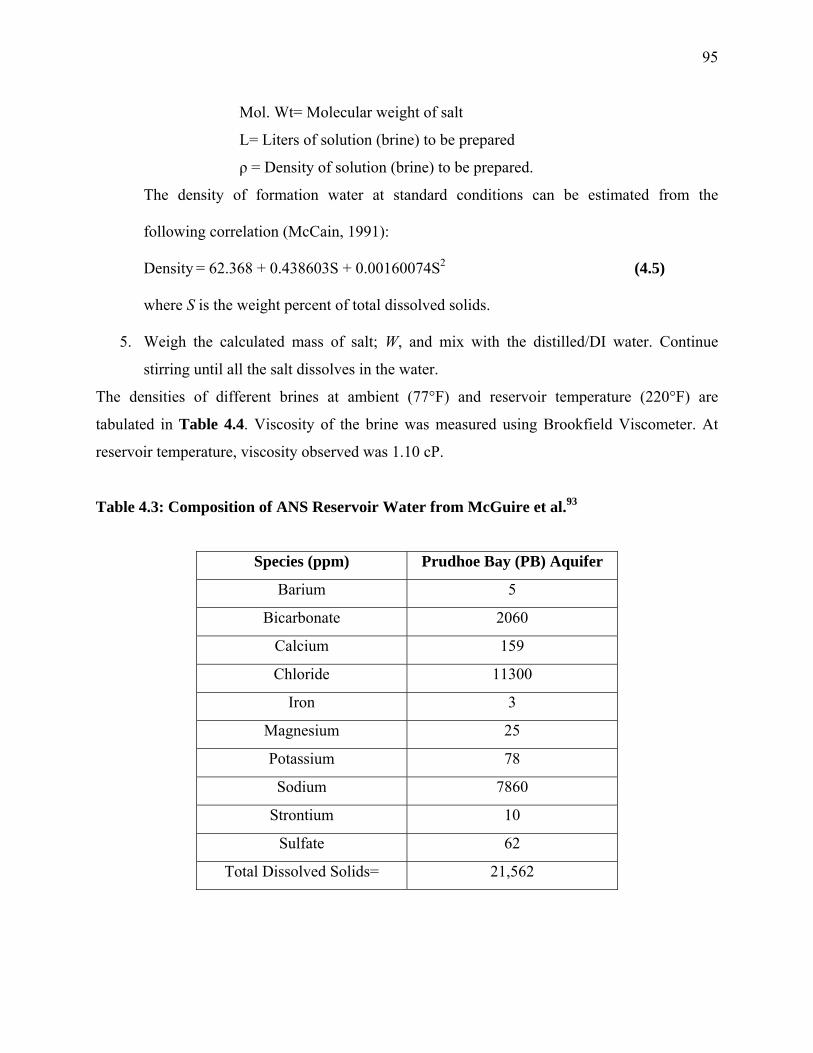
95
Mol. Wt= Molecular weight of salt
L= Liters of solution (brine) to be prepared
ρ = Density of solution (brine) to be prepared.
The density of formation water at standard conditions can be estimated from the
following correlation (McCain, 1991):
Density = 62.368 + 0.438603S + 0.00160074S2 (4.5)
where S is the weight percent of total dissolved solids.
5. Weigh the calculated mass of salt; W, and mix with the distilled/DI water. Continue
stirring until all the salt dissolves in the water.
The densities of different brines at ambient (77°F) and reservoir temperature (220°F) are
tabulated in Table 4.4. Viscosity of the brine was measured using Brookfield Viscometer. At
reservoir temperature, viscosity observed was 1.10 cP.
Table 4.3: Composition of ANS Reservoir Water from McGuire et al.93
Species (ppm) Prudhoe Bay (PB) Aquifer
Barium 5
Bicarbonate 2060
Calcium 159
Chloride 11300
Iron 3
Magnesium 25
Potassium 78
Sodium 7860
Strontium 10
Sulfate 62
Total Dissolved Solids= 21,562
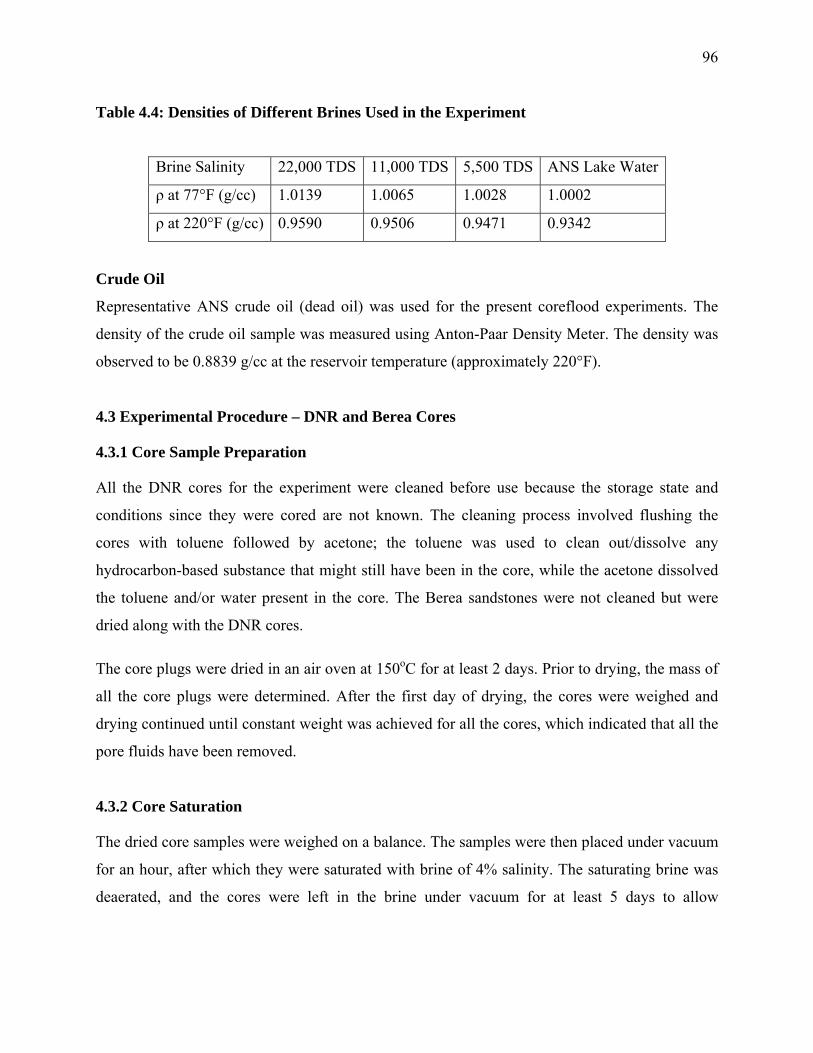
96
Table 4.4: Densities of Different Brines Used in the Experiment
Brine Salinity 22,000 TDS 11,000 TDS 5,500 TDS ANS Lake Water
ρ at 77°F (g/cc) 1.0139 1.0065 1.0028 1.0002
ρ at 220°F (g/cc) 0.9590 0.9506 0.9471 0.9342
Crude Oil
Representative ANS crude oil (dead oil) was used for the present coreflood experiments. The
density of the crude oil sample was measured using Anton-Paar Density Meter. The density was
observed to be 0.8839 g/cc at the reservoir temperature (approximately 220°F).
4.3 Experimental Procedure – DNR and Berea Cores
4.3.1 Core Sample Preparation
All the DNR cores for the experiment were cleaned before use because the storage state and
conditions since they were cored are not known. The cleaning process involved flushing the
cores with toluene followed by acetone; the toluene was used to clean out/dissolve any
hydrocarbon-based substance that might still have been in the core, while the acetone dissolved
the toluene and/or water present in the core. The Berea sandstones were not cleaned but were
dried along with the DNR cores.
The core plugs were dried in an air oven at 150oC for at least 2 days. Prior to drying, the mass of
all the core plugs were determined. After the first day of drying, the cores were weighed and
drying continued until constant weight was achieved for all the cores, which indicated that all the
pore fluids have been removed.
4.3.2 Core Saturation
The dried core samples were weighed on a balance. The samples were then placed under vacuum
for an hour, after which they were saturated with brine of 4% salinity. The saturating brine was
deaerated, and the cores were left in the brine under vacuum for at least 5 days to allow
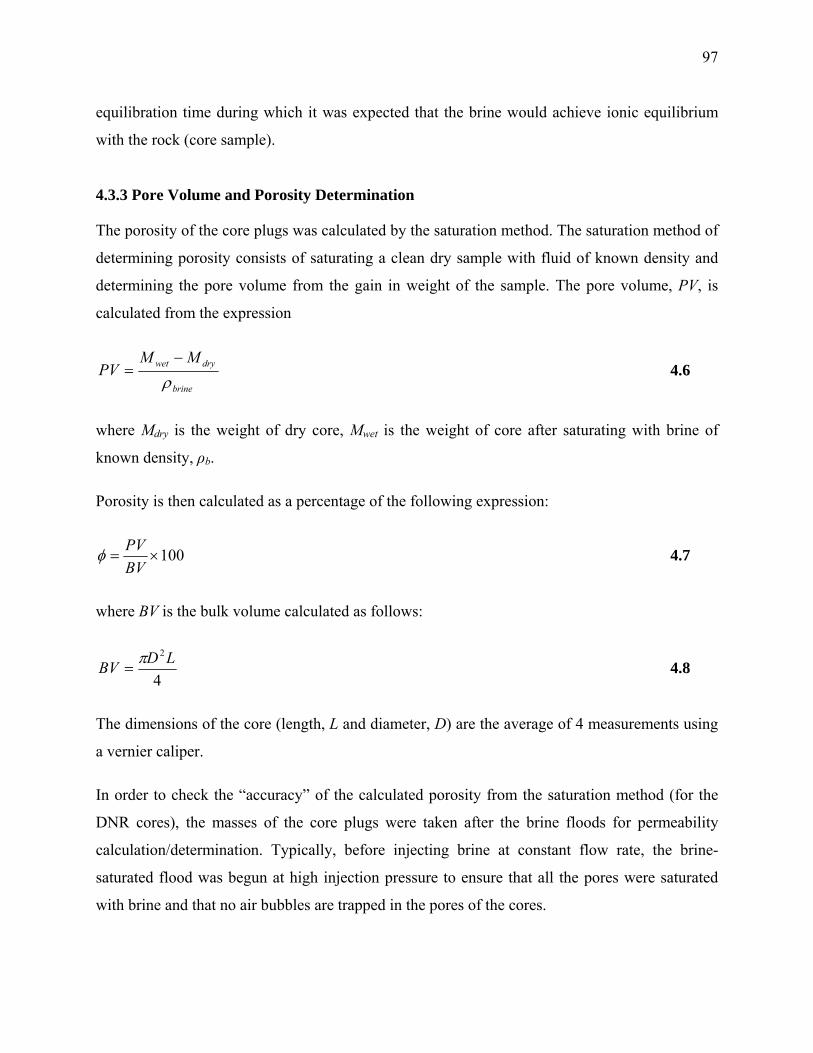
97
equilibration time during which it was expected that the brine would achieve ionic equilibrium
with the rock (core sample).
4.3.3 Pore Volume and Porosity Determination
The porosity of the core plugs was calculated by the saturation method. The saturation method of
determining porosity consists of saturating a clean dry sample with fluid of known density and
determining the pore volume from the gain in weight of the sample. The pore volume, PV, is
calculated from the expression
brine
drywet MMPV
ρ−
= 4.6
where Mdry is the weight of dry core, Mwet is the weight of core after saturating with brine of
known density, ρb.
Porosity is then calculated as a percentage of the following expression:
100×=BVPVφ 4.7
where BV is the bulk volume calculated as follows:
4
2 LDBV π= 4.8
The dimensions of the core (length, L and diameter, D) are the average of 4 measurements using
a vernier caliper.
In order to check the “accuracy” of the calculated porosity from the saturation method (for the
DNR cores), the masses of the core plugs were taken after the brine floods for permeability
calculation/determination. Typically, before injecting brine at constant flow rate, the brine-
saturated flood was begun at high injection pressure to ensure that all the pores were saturated
with brine and that no air bubbles are trapped in the pores of the cores.
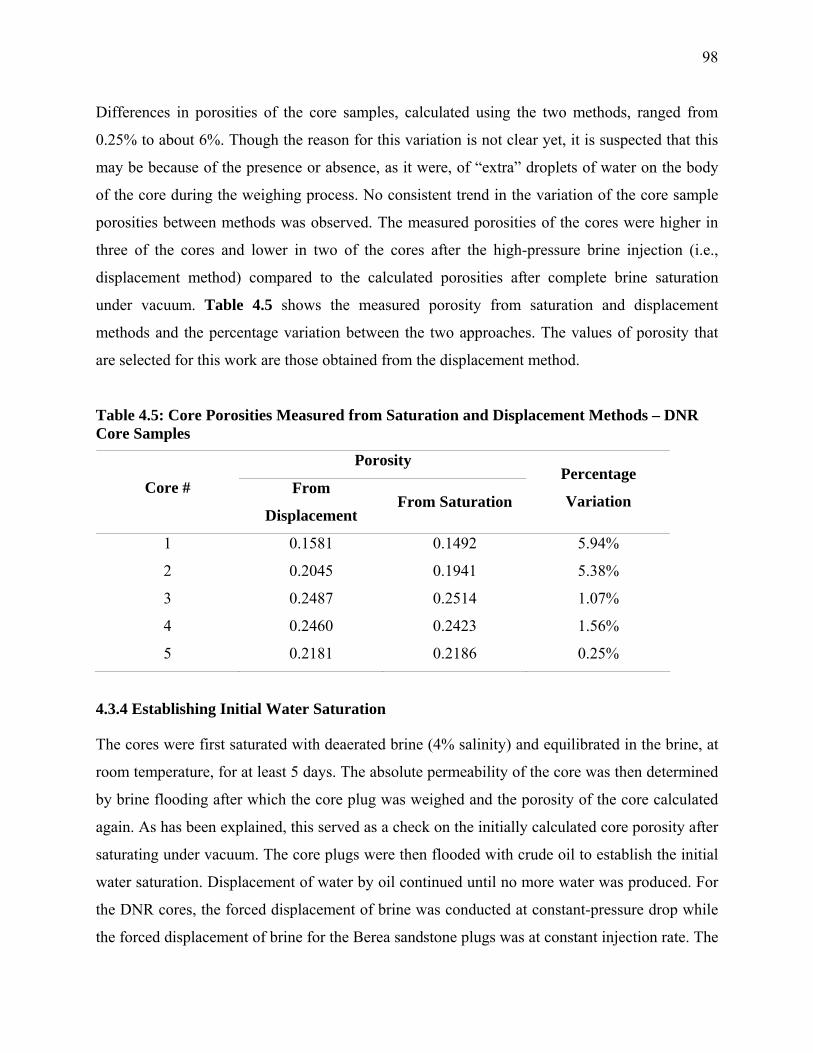
98
Differences in porosities of the core samples, calculated using the two methods, ranged from
0.25% to about 6%. Though the reason for this variation is not clear yet, it is suspected that this
may be because of the presence or absence, as it were, of “extra” droplets of water on the body
of the core during the weighing process. No consistent trend in the variation of the core sample
porosities between methods was observed. The measured porosities of the cores were higher in
three of the cores and lower in two of the cores after the high-pressure brine injection (i.e.,
displacement method) compared to the calculated porosities after complete brine saturation
under vacuum. Table 4.5 shows the measured porosity from saturation and displacement
methods and the percentage variation between the two approaches. The values of porosity that
are selected for this work are those obtained from the displacement method.
Table 4.5: Core Porosities Measured from Saturation and Displacement Methods – DNR Core Samples
Porosity
Core # From
Displacement From Saturation
Percentage
Variation
1 0.1581 0.1492 5.94%
2 0.2045 0.1941 5.38%
3 0.2487 0.2514 1.07%
4 0.2460 0.2423 1.56%
5 0.2181 0.2186 0.25%
4.3.4 Establishing Initial Water Saturation
The cores were first saturated with deaerated brine (4% salinity) and equilibrated in the brine, at
room temperature, for at least 5 days. The absolute permeability of the core was then determined
by brine flooding after which the core plug was weighed and the porosity of the core calculated
again. As has been explained, this served as a check on the initially calculated core porosity after
saturating under vacuum. The core plugs were then flooded with crude oil to establish the initial
water saturation. Displacement of water by oil continued until no more water was produced. For
the DNR cores, the forced displacement of brine was conducted at constant-pressure drop while
the forced displacement of brine for the Berea sandstone plugs was at constant injection rate. The
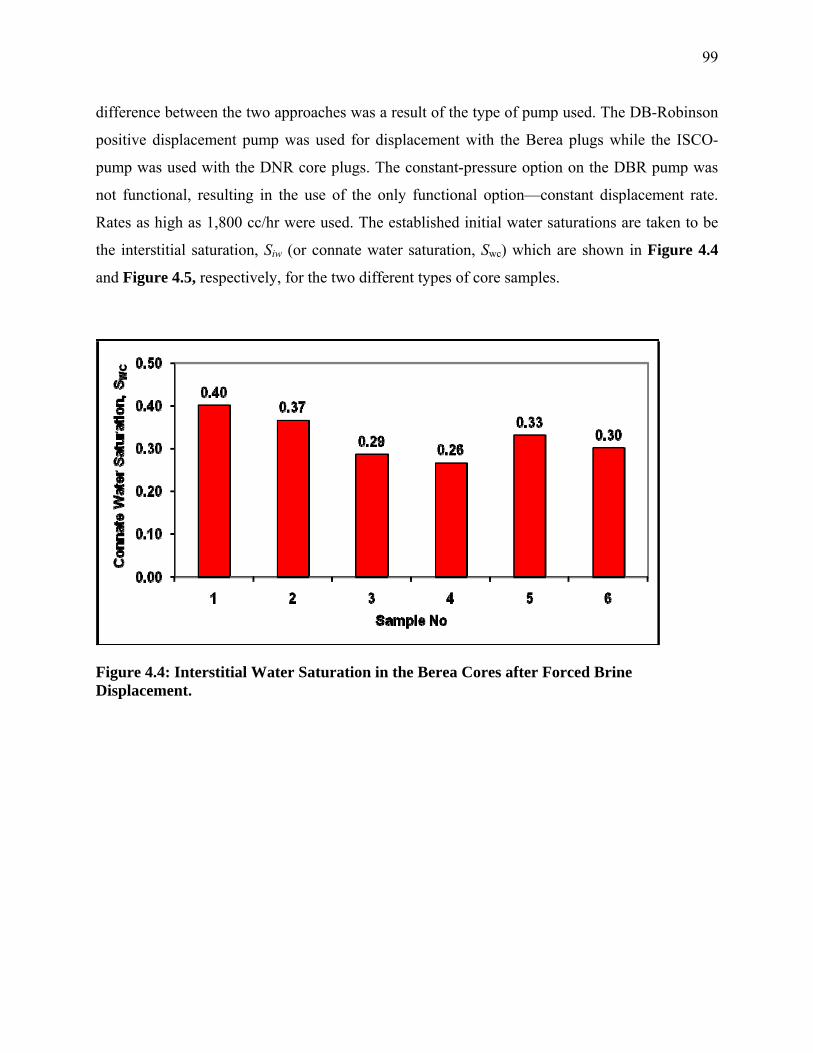
99
difference between the two approaches was a result of the type of pump used. The DB-Robinson
positive displacement pump was used for displacement with the Berea plugs while the ISCO-
pump was used with the DNR core plugs. The constant-pressure option on the DBR pump was
not functional, resulting in the use of the only functional option—constant displacement rate.
Rates as high as 1,800 cc/hr were used. The established initial water saturations are taken to be
the interstitial saturation, Siw (or connate water saturation, Swc) which are shown in Figure 4.4
and Figure 4.5, respectively, for the two different types of core samples.
Figure 4.4: Interstitial Water Saturation in the Berea Cores after Forced Brine Displacement.
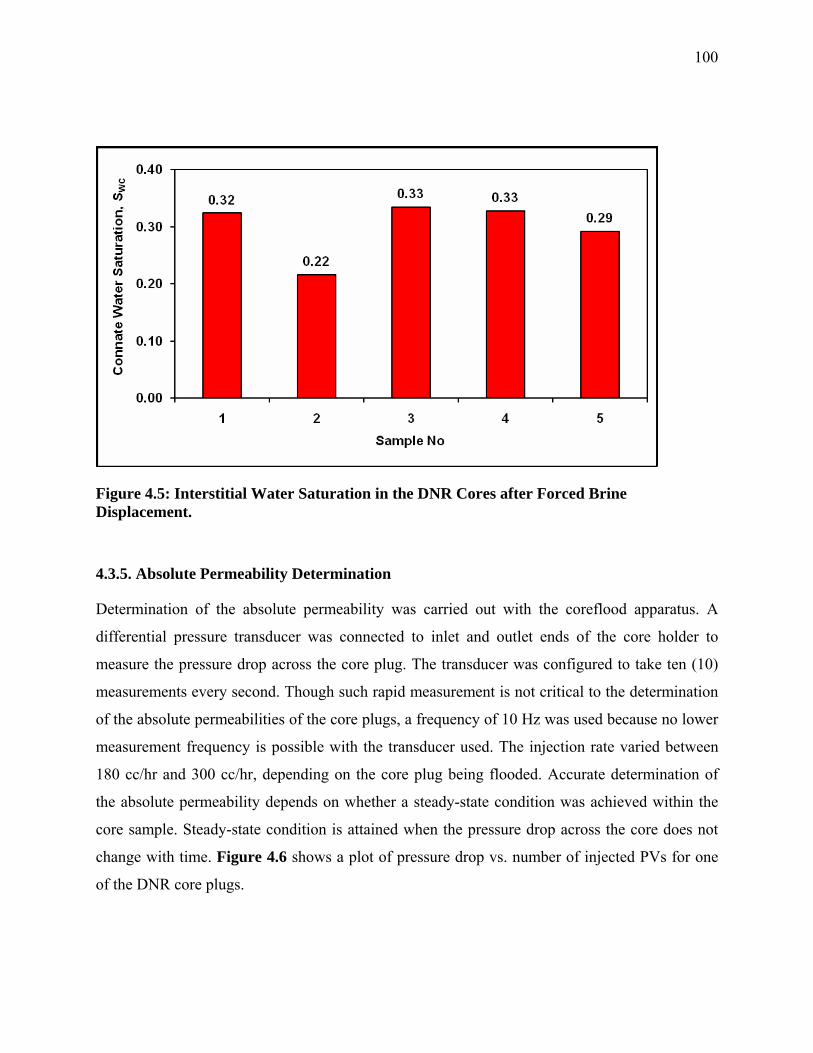
100
Figure 4.5: Interstitial Water Saturation in the DNR Cores after Forced Brine Displacement.
4.3.5. Absolute Permeability Determination
Determination of the absolute permeability was carried out with the coreflood apparatus. A
differential pressure transducer was connected to inlet and outlet ends of the core holder to
measure the pressure drop across the core plug. The transducer was configured to take ten (10)
measurements every second. Though such rapid measurement is not critical to the determination
of the absolute permeabilities of the core plugs, a frequency of 10 Hz was used because no lower
measurement frequency is possible with the transducer used. The injection rate varied between
180 cc/hr and 300 cc/hr, depending on the core plug being flooded. Accurate determination of
the absolute permeability depends on whether a steady-state condition was achieved within the
core sample. Steady-state condition is attained when the pressure drop across the core does not
change with time. Figure 4.6 shows a plot of pressure drop vs. number of injected PVs for one
of the DNR core plugs.
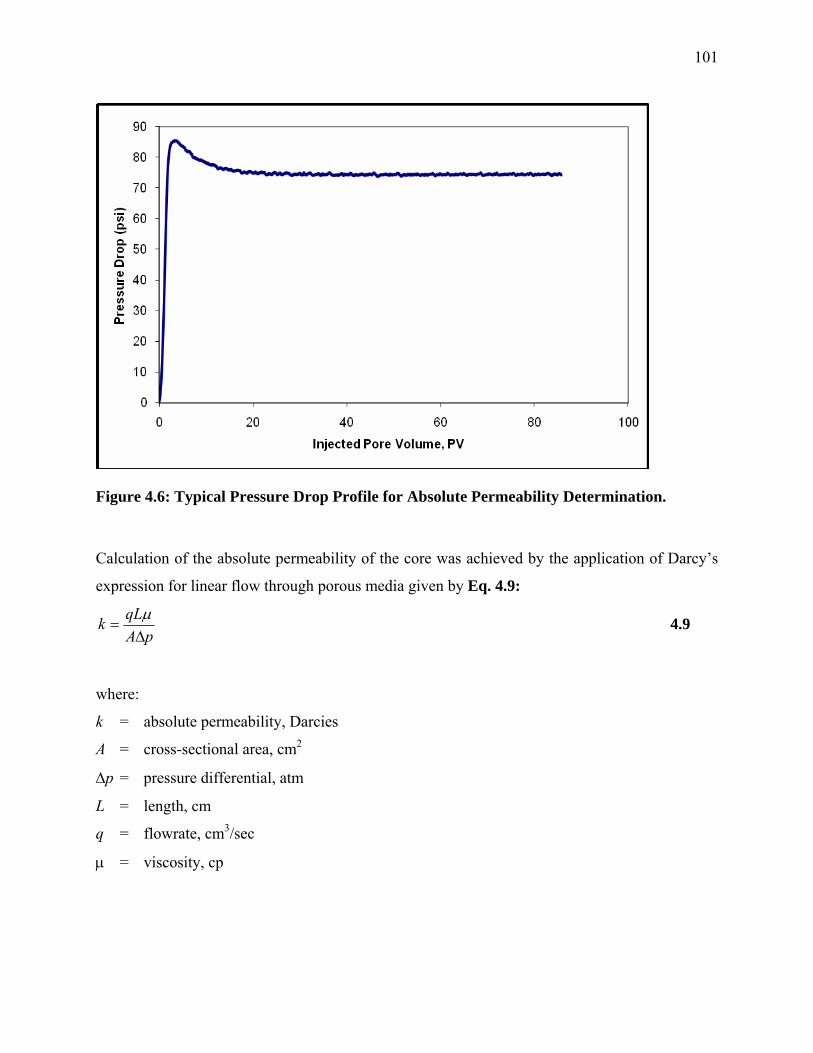
101
Figure 4.6: Typical Pressure Drop Profile for Absolute Permeability Determination.
Calculation of the absolute permeability of the core was achieved by the application of Darcy’s
expression for linear flow through porous media given by Eq. 4.9:
pAqLkΔ
=μ 4.9
where:
k = absolute permeability, Darcies
A = cross-sectional area, cm2
Δp = pressure differential, atm
L = length, cm
q = flowrate, cm3/sec
μ = viscosity, cp
102
4.3.6 Coreflooding
The saturated core was loaded into the Hassler-type core holder and overburden pressure in
applied in the radial direction. The system was left standing for some minutes to allow the sleeve
to adjust to the applied radial pressure. An overburden pressure of 1,500 psi was applied on the
Berea plugs while an overburden pressure range of 1,000 psi to 1,800 psi, depending on the
cored depth, was applied on the DNR cores. The procedure for determining the overburden
pressure is given below. Where the overburden pressure is not known, a gross overburden
pressure of 1 psia/ft is usually assumed for the ANS.
The core holder sleeve pressure is calculated as follows:
Gross Overburden = Depth (ft) x 1.0 (psia/ft) = Depth (psia)
Reservoir Pressure = pres (psia)
Net Overburden = Depth (psia) - pres (psia) = povb (psia)
Sleeve Pressure = povb (psia) x 0.62
The sleeve pressure calculated for the DNR cores using the above approach resulted in complete
fracture of some of the cores. Consequently the calculated sleeve pressure was further reduced to
the already stated pressure ranges. This allowed the coreflooding to continue without fracturing
the cores.
After allowing some time for radial uniformity of the sleeve’s grip on the core plug, the
interstitial water saturation was established by flooding with oil. For the DNR cores, this was
followed by wettability determination by Amott-Harvey wettability method. It is pertinent to
note that the Amott-Harvey wettability test was carried out only for the DNR cores. After the
test, the core was loaded into the core holder and flooded again to initial water saturation.
The core was then waterflooded by brine of 4% salinity and the recovery recorded as a function
of time at a constant rate of 20 cc/hr. After injecting 10 PVs of brine, the brine accumulator was
heated to a temperature of ≈ 200°F. While heating the brine, the core plug was flooded again
with oil to establish initial water saturation for 4% hot brine injection. The core plug was then
flooded with 4% hot brine until 10 PVs of hot brine have been injected and oil production was
monitored as a function of time. The wettability of the core plug was determined after this flood.
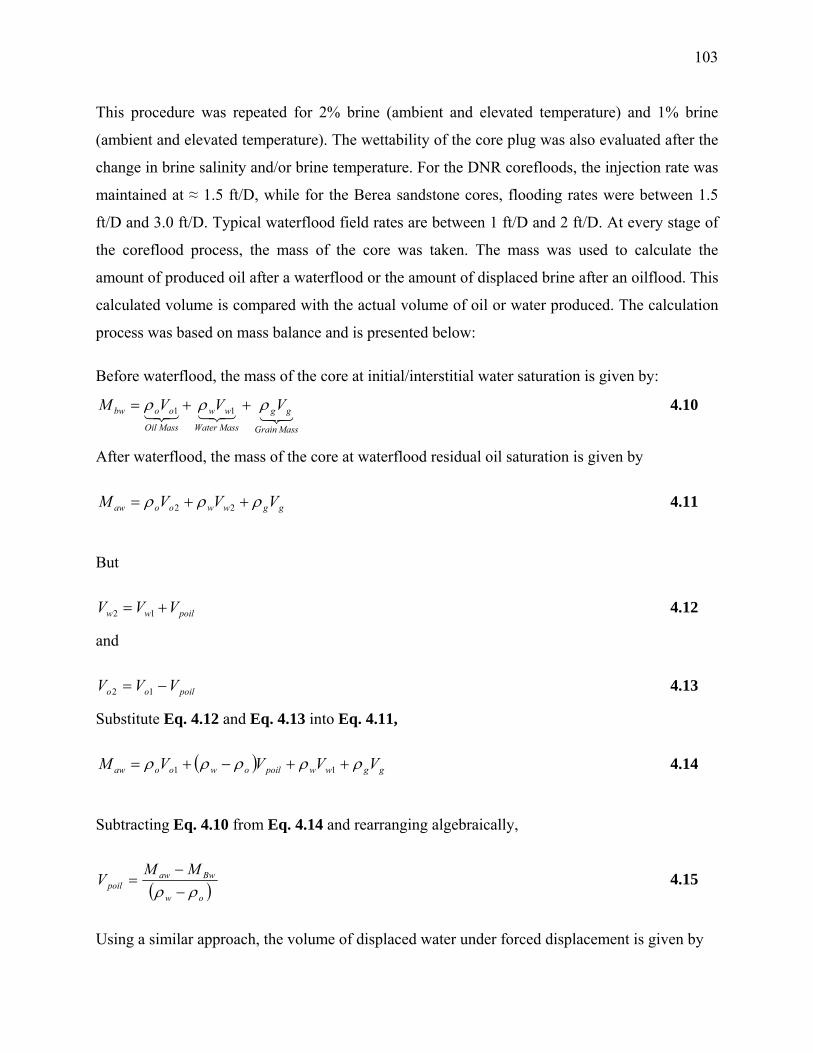
103
This procedure was repeated for 2% brine (ambient and elevated temperature) and 1% brine
(ambient and elevated temperature). The wettability of the core plug was also evaluated after the
change in brine salinity and/or brine temperature. For the DNR corefloods, the injection rate was
maintained at ≈ 1.5 ft/D, while for the Berea sandstone cores, flooding rates were between 1.5
ft/D and 3.0 ft/D. Typical waterflood field rates are between 1 ft/D and 2 ft/D. At every stage of
the coreflood process, the mass of the core was taken. The mass was used to calculate the
amount of produced oil after a waterflood or the amount of displaced brine after an oilflood. This
calculated volume is compared with the actual volume of oil or water produced. The calculation
process was based on mass balance and is presented below:
Before waterflood, the mass of the core at initial/interstitial water saturation is given by:
321321321MassGrain
gg
MassWater
ww
MassOil
oobw VVVM ρρρ ++= 11 4.10
After waterflood, the mass of the core at waterflood residual oil saturation is given by
ggwwooaw VVVM ρρρ ++= 22 4.11
But
poilww VVV += 12 4.12
and
poiloo VVV −= 12 4.13
Substitute Eq. 4.12 and Eq. 4.13 into Eq. 4.11,
( ) ggwwpoilowooaw VVVVM ρρρρρ ++−+= 11 4.14
Subtracting Eq. 4.10 from Eq. 4.14 and rearranging algebraically,
( )ow
Bwawpoil
MMV
ρρ −−
= 4.15
Using a similar approach, the volume of displaced water under forced displacement is given by
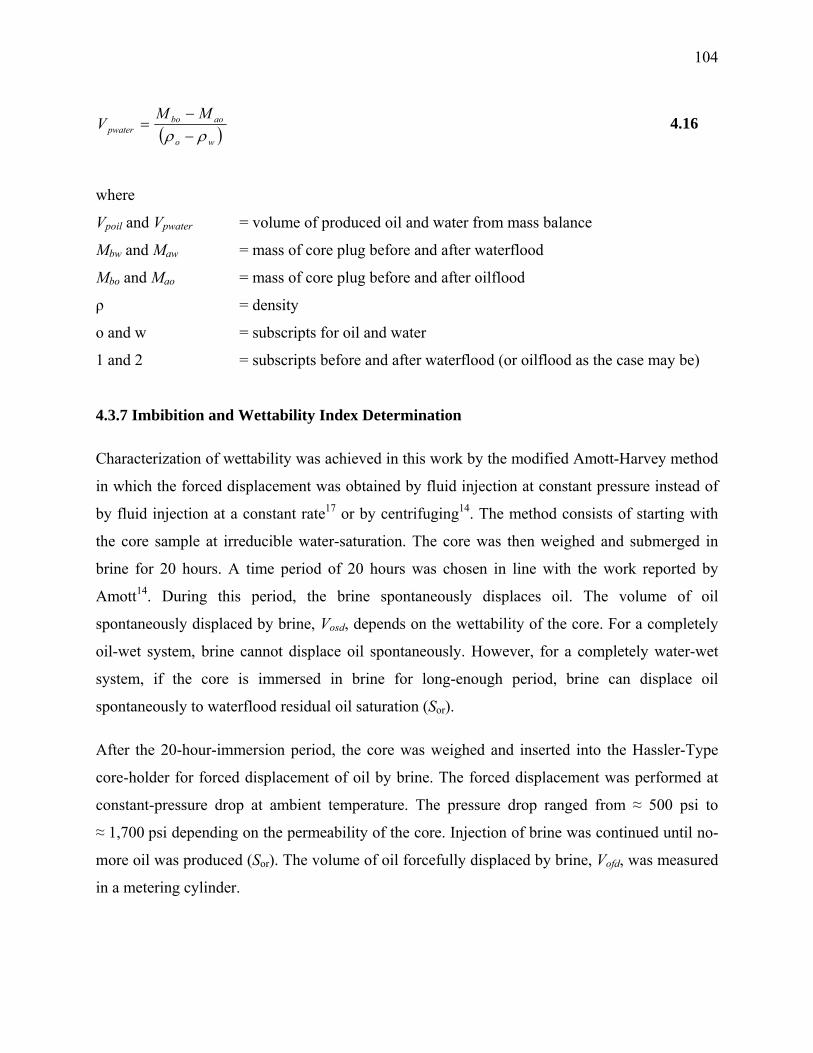
104
( )wo
aobopwater
MMV
ρρ −−
= 4.16
where
Vpoil and Vpwater = volume of produced oil and water from mass balance
Mbw and Maw = mass of core plug before and after waterflood
Mbo and Mao = mass of core plug before and after oilflood
ρ = density
o and w = subscripts for oil and water
1 and 2 = subscripts before and after waterflood (or oilflood as the case may be)
4.3.7 Imbibition and Wettability Index Determination
Characterization of wettability was achieved in this work by the modified Amott-Harvey method
in which the forced displacement was obtained by fluid injection at constant pressure instead of
by fluid injection at a constant rate17 or by centrifuging14. The method consists of starting with
the core sample at irreducible water-saturation. The core was then weighed and submerged in
brine for 20 hours. A time period of 20 hours was chosen in line with the work reported by
Amott14. During this period, the brine spontaneously displaces oil. The volume of oil
spontaneously displaced by brine, Vosd, depends on the wettability of the core. For a completely
oil-wet system, brine cannot displace oil spontaneously. However, for a completely water-wet
system, if the core is immersed in brine for long-enough period, brine can displace oil
spontaneously to waterflood residual oil saturation (Sor).
After the 20-hour-immersion period, the core was weighed and inserted into the Hassler-Type
core-holder for forced displacement of oil by brine. The forced displacement was performed at
constant-pressure drop at ambient temperature. The pressure drop ranged from ≈ 500 psi to
≈ 1,700 psi depending on the permeability of the core. Injection of brine was continued until no-
more oil was produced (Sor). The volume of oil forcefully displaced by brine, Vofd, was measured
in a metering cylinder.
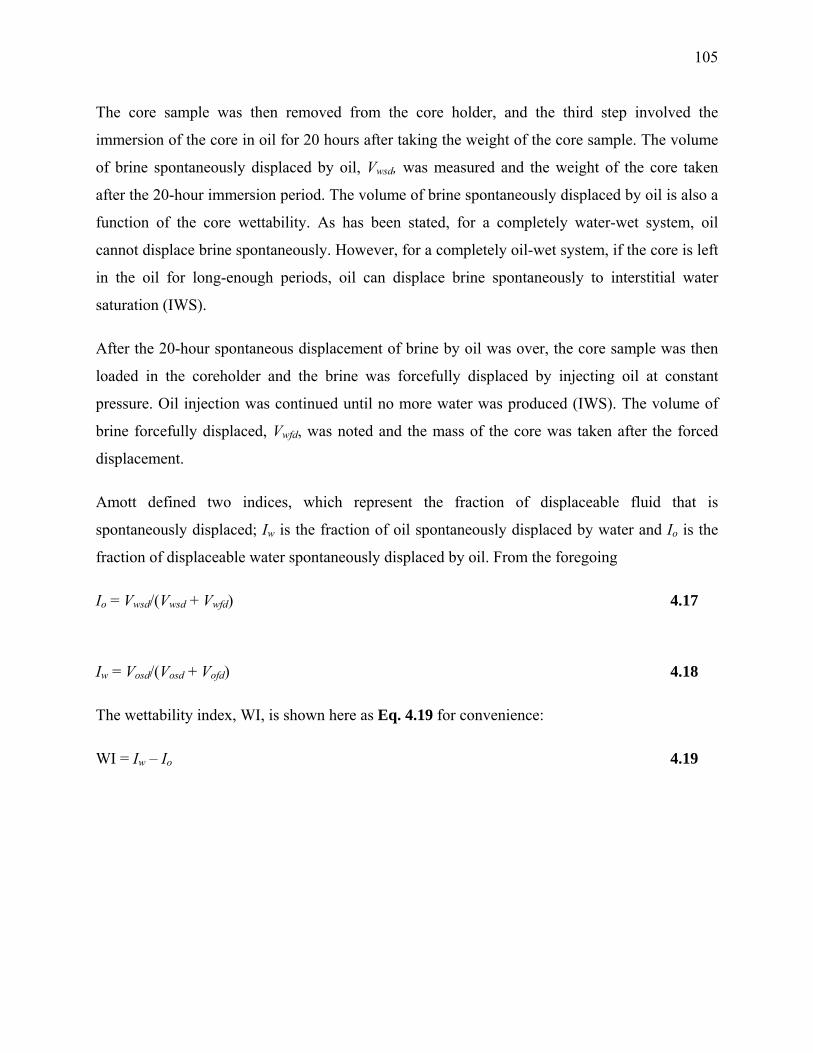
105
The core sample was then removed from the core holder, and the third step involved the
immersion of the core in oil for 20 hours after taking the weight of the core sample. The volume
of brine spontaneously displaced by oil, Vwsd, was measured and the weight of the core taken
after the 20-hour immersion period. The volume of brine spontaneously displaced by oil is also a
function of the core wettability. As has been stated, for a completely water-wet system, oil
cannot displace brine spontaneously. However, for a completely oil-wet system, if the core is left
in the oil for long-enough periods, oil can displace brine spontaneously to interstitial water
saturation (IWS).
After the 20-hour spontaneous displacement of brine by oil was over, the core sample was then
loaded in the coreholder and the brine was forcefully displaced by injecting oil at constant
pressure. Oil injection was continued until no more water was produced (IWS). The volume of
brine forcefully displaced, Vwfd, was noted and the mass of the core was taken after the forced
displacement.
Amott defined two indices, which represent the fraction of displaceable fluid that is
spontaneously displaced; Iw is the fraction of oil spontaneously displaced by water and Io is the
fraction of displaceable water spontaneously displaced by oil. From the foregoing
Io = Vwsd/(Vwsd + Vwfd) 4.17
Iw = Vosd/(Vosd + Vofd) 4.18
The wettability index, WI, is shown here as Eq. 4.19 for convenience:
WI = Iw – Io 4.19
106
4.4 Experimental Procedure – ANS Representative Cores
Core Cleaning
All the core samples for the experiment were cleaned before use. The cleaning process involved
flushing the cores with toluene followed by acetone; the toluene was used to clean out/dissolve
any hydrocarbon-based substance that may still be in the core while the acetone dissolved the
toluene and/or water present in the core. Then the core plugs were dried in an air oven at 176oF
for at least 2 -3 days. After drying, the core samples were weighed to determine if they achieved
a steady reading, indicating the removal of all native fluids.
Core Saturation
The dried core samples were weighed on a balance. The samples were then placed under vacuum
for 5–7 days in 22,000 TDS salinity to allow equilibration time during which it is expected that
the brine will achieve ionic equilibrium with the core sample.
Waterflooding
The next step in the present experiment was to carry out waterflooding on the core sample at
reservoir temperature. After carrying out Amott-Harvey index measurement, the core was
waterflooded by 22,000 TDS salinity brine and the recovery recorded as a function of time at a
constant rate of 30 cc/hr. After injecting 10 PVs of 22,000 TDS brine, residual oil saturation (Sor)
value was calculated. The wettability of the core plug is determined after this flood. This
waterflooding procedure was repeated by using 11,000 TDS brine (reservoir temperature) and
5,500 TDS brine (reservoir temperature) and the respective Sor values were calculated. After
every waterflood, the Amott-Harvey wettability index was determined. Using this procedure, the
first set of experiment was carried out on 7 clean core samples.
Steps Followed in the Second Set of Experiments
The aim of the second set of experiments was to study the effect of oil aging on the core samples
and consequently observe the effect of variation in the brine salinity on the residual oil saturation
and wettability of these oil aged cores. Hence, after finishing the first set of experiments, the
107
same core samples were used for second set of experiments. The first step in this set of
experiments was to establish initial water saturation.
Oil Aging
After establishing initial water saturation, the core samples were removed from the core holder,
immersed in steel tin containing ANS crude oil, and aged at 80°C to 90°C for 21 days. The tin
was covered with a lid and aluminum foil to preclude the oxidation of oil during the aging
period. After aging, cores were allowed to cool for a couple of hours.
Waterflooding
After oil aging for 21 days, the core samples were taken out from the tin and were brought for
waterflooding experiments. In this set of experiments, the same reconstituted brines viz. 22,000
TDS, 11,000 TDS and 5,500 TDS were used. The steps followed in this case are the same steps
followed in the new (clean) core samples. Sor values and the Amott-Harvey wettability index
were calculated after every waterflood.
Steps Followed in the Third Set of Experiments
In the previous two experiments, the brine used for the corefloods was synthetically
prepared/reconstituted brine in the laboratory. However, in this set of experiments the option of
using the representative low-salinity ANS lake water was investigated. Michael Lilly and
Amanda Blackburn (Geo-Watersheds Scientific) helped to procure the ANS lake water. Based
on personal communication with Amanda, it was learned that rainwater and melting ice are the
main contributors to water accumulation in ANS lakes. Thus, it is believed that ANS lake water
is much less saline. Total dissolved solids quantity in the water samples obtained from the ANS
was approximately 50–60 TDS. As ANS lake water is much less saline, the option of using ANS
lake water as low-saline brine was explored in the third set of experiments.
The steps followed in this set of experiments are the same as in the previous two cases. First,
porosity and permeability of the core sample was determined. Then initial water saturation was
established in the core sample followed by 22,000 TDS brine waterflood. However, afterwards in
the next steps of the experiments, instead of using 11,000 TDS and 5,500 TDS brine, ANS lake

108
water was used for waterflooding. Thus, ANS lake water serves the purpose of reduced salinity
brine in these coreflood studies. Sor values and the Amott-Harvey wettability index were
calculated after every waterflood.
109
CHAPTER 5: Salinity Influence on Oil-Water Interfacial Area, Wettability, and Oil Recovery Work Performed by PNNL
Wettability, or the tendency of surfaces to be preferentially wet by one fluid phase, has a strong
influence on the distribution and flow of immiscible fluids in oil reservoirs. The efficiency of oil
recovery processes and the displacement and production of oil by fluids injected into the
reservoir depend on the wetting properties of the rock surfaces. In strongly water-wet rocks, the
oil resides in the larger pores and flows with relative ease. However, large quantities of oil are
left, trapped in the pore space because it no longer forms a continuous pathway for flow (a
sample spanning cluster, in percolation terminology). In oil-wet rock, on the other hand, oil is
present in the small pores and its relative permeability is small. However, it can form continuous
pathways for oil flow even at small oil saturations, resulting in low trapped oil saturations. In
mixed-wet rocks, relatively low residual oil saturations may be obtained if a continuous pathway
for oil flow is available. The existence of such continuous pathways depends largely on the
fraction of rock surface rendered oil-wet, that is, on the pore level mechanisms of wettability
alteration. Therefore, understanding and characterizing reservoir wettability is crucial to
estimating relative permeabilities and ultimate oil recovery. It was indicated that the residual oil
saturation may be reduced significantly by flooding with low-salinity water instead of seawater
or brine. This study investigated the influence of salinity on the oil-water interfacial area, soil
wettability, and oil recovery.
5.1 Material and Methods
Two sets of 8 coreflooding column experiments have been completed, using decane and ANS
crude oil. Unconsolidated sand packs were used as representative porous media. Oil removal was
conducted by flushing columns at residual oil saturation using water with salinity ranging from
0% to 8% wt of NaCl. Oil saturation was determined based on mass balance of the columns, and
the oil-water interfacial area (anw, cm-1) was measured using tracers. Sodium dodecyl benzene
sulfonate (SDBS) was used as an interfacial partitioning tracer, and pentafluoro benzoic acid
(PFBA) was used as a non-reactive and non-partitioning tracer. Oil was imbibed into an initially
water-saturated column, using positive displacement methods. Oil was then flushed out using
water at certain salinity. When a column attained residual oil saturation after each water flushing
110
displacement, the partitioning and conservative tracer experiments were conducted separately to
characterize the specific oil-water interfacial areas, and the wettability status. Water with 8%,
4%, 2%, and 0% wt NaCl salinity was used to displace oil from the sand column sequentially.
The interfacial tension (IFT) between the salinity water and the ANS oil was measured.
Column Test Procedures
1. Pack a column with clean Accusand using vibration and a dry sand pack. Record the weight
of the empty column and, after packing the column, the weight of the column and sand.
Make sure that the density is 1.7 g/cm3 or better.
2. Saturate the column with DI water in an up-flow mode (to drive the air out) at a rate of 30
ml/hr (0.5 ml/min). Record the weight of the water-saturated column. Also monitor the
volume and weight of water injected into the column (record the weight and volume of water
reservoir before and after injection).
3. Replace the DIW in column with 8% NaCl solution (upward-flow) at 50 ml/hr (0.833
ml/min) flow rate.
4. Run a baseline tracer with 100 ppm PFBA (prepared using 8% NaCl solution) at a pumping
rate of 12 ml/hr (0.2 ml/min) in a down-flow mode. Allow the tracer to pump 1.08 hours (for
a total of 13.0 ml, or ~0.25 PV), depending on the column’s calculated pore volume. Collect
samples every 15 minutes. These conditions will be used for all subsequent tracer studies.
After the PFBA tracer test, conduct the same test with 100 ppm SDBS (prepared using 8%
NaCl solution).
5. Load the column with decane/ANS oil (upward flow) at flow rate of 30 ml/hr (0.50 ml/min).
Record the volume of decane/ANS oil added and the weight of the column.
6. Flood the column with 8% NaCl solution (upward flow) at flow rate of 50 ml/hr (0.833
ml/min).
7. Collect column effluent in a graduated cylinder so accurate volumes of water and
decane/ANS oil can be measured. Continue to flood the column until no visible decane/ANS
oil is collected.
8. Record the amount of decane/ANS oil recovered and the weight of the column after
waterflooding. Determine the amount of decane/ANS oil remaining in the column.
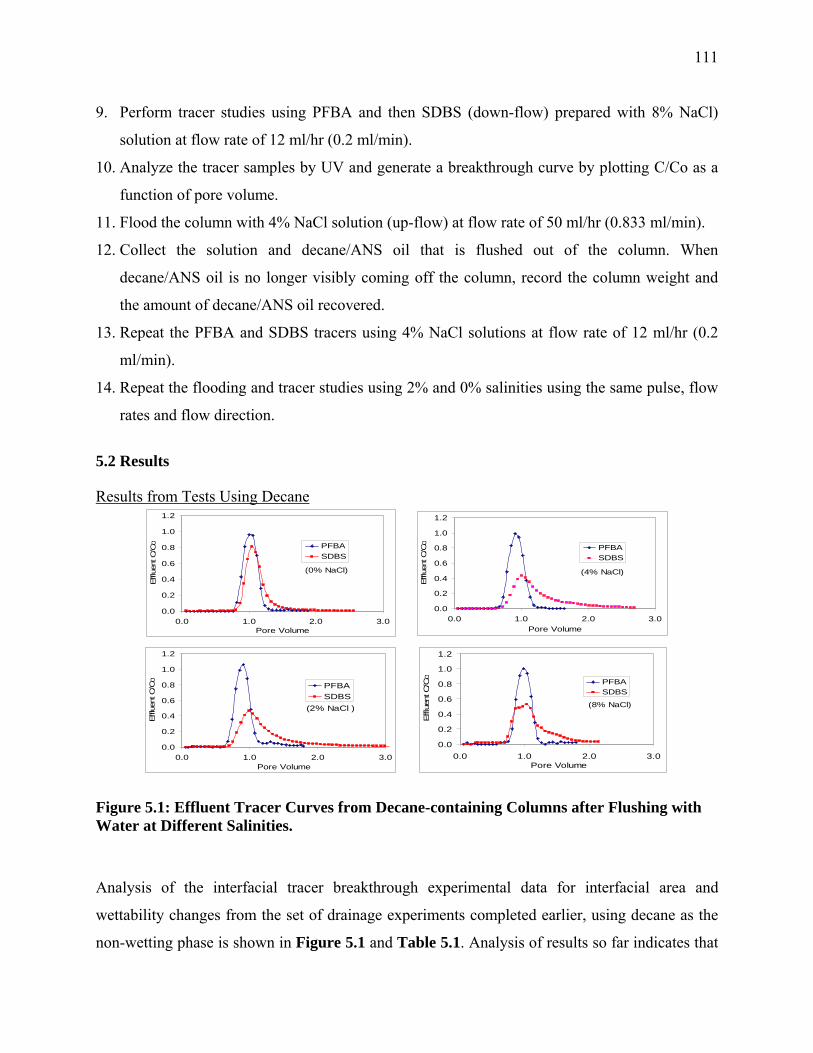
111
(0% NaCl)
0.0
0.2
0.4
0.6
0.8
1.0
1.2
0.0 1.0 2.0 3.0Pore Volume
Efflu
ent C
/Co PFBA
SDBS
(2% NaCl )
0.0
0.2
0.4
0.6
0.8
1.0
1.2
0.0 1.0 2.0 3.0Pore Volume
Efflu
ent C
/Co
PFBASDBS
(4% NaCl)
0.0
0.2
0.4
0.6
0.8
1.0
1.2
0.0 1.0 2.0 3.0Pore Volume
Efflu
ent C
/Co PFBA
SDBS
(8% NaCl)
0.0
0.2
0.4
0.6
0.8
1.0
1.2
0.0 1.0 2.0 3.0Pore Volume
Effl
uent
C/C
o PFBASDBS
9. Perform tracer studies using PFBA and then SDBS (down-flow) prepared with 8% NaCl)
solution at flow rate of 12 ml/hr (0.2 ml/min).
10. Analyze the tracer samples by UV and generate a breakthrough curve by plotting C/Co as a
function of pore volume.
11. Flood the column with 4% NaCl solution (up-flow) at flow rate of 50 ml/hr (0.833 ml/min).
12. Collect the solution and decane/ANS oil that is flushed out of the column. When
decane/ANS oil is no longer visibly coming off the column, record the column weight and
the amount of decane/ANS oil recovered.
13. Repeat the PFBA and SDBS tracers using 4% NaCl solutions at flow rate of 12 ml/hr (0.2
ml/min).
14. Repeat the flooding and tracer studies using 2% and 0% salinities using the same pulse, flow
rates and flow direction.
5.2 Results
Results from Tests Using Decane
Figure 5.1: Effluent Tracer Curves from Decane-containing Columns after Flushing with Water at Different Salinities.
Analysis of the interfacial tracer breakthrough experimental data for interfacial area and
wettability changes from the set of drainage experiments completed earlier, using decane as the
non-wetting phase is shown in Figure 5.1 and Table 5.1. Analysis of results so far indicates that

112
the oil-water interfacial area (anw, cm-1) does not show a monotonic dependence on salinity;
instead, anw shows an increasing trend with increasing salinity in the lower salinity range, and the
opposite trend at high-salinity values (Figure 5.2). This trend appears to be consistent with a
similar nonlinear dependence of interfacial tension on salinity104. Earlier, it was established that
interfacial areas are strong, inverse functions of interfacial areas1,105.
10.0
12.5
15.0
17.5
20.0
0 2 4 6 8 10
NaCl Conc. (wt %)
Sor
(%)
0
20
40
60
80
100
120
140
Anw
(cm
-1)
SorAnw
Figure 5.2: Decane Residual Saturation, Sor, and Oil/Water-specific Interfacial Area, anw, vs. Salinity. Sor Decreased with Decreasing Salinity, While the anw Reached a Maximum at Salinity of ~2%.

113
Table 5.1: Parameters for decane-containing columns tests.
Column
Test Stage
Trapped
Decane Vol
(ml)
PFBA
recovery
(%)
SDBS
recovery
(%)
Sor (%)
Kd of SDBS
anw (cm-1)
Flushed
with decane
40.73 NA NA NA NA NA
Flushed
with 8%
NaCl
9.11 113.2 114.6 18.61 1.13 25.12
Flushed
with 4%
NaCl
7.73 105.8 95.7 15.31 1.47 117.8
Flushed
with 2%
NaCl
6.19 117.0 102.0 12.26 1.55 124.9
Flushed
with 0%
NaCl
5.70 102.0 98.0 11.29 1.11 28.07
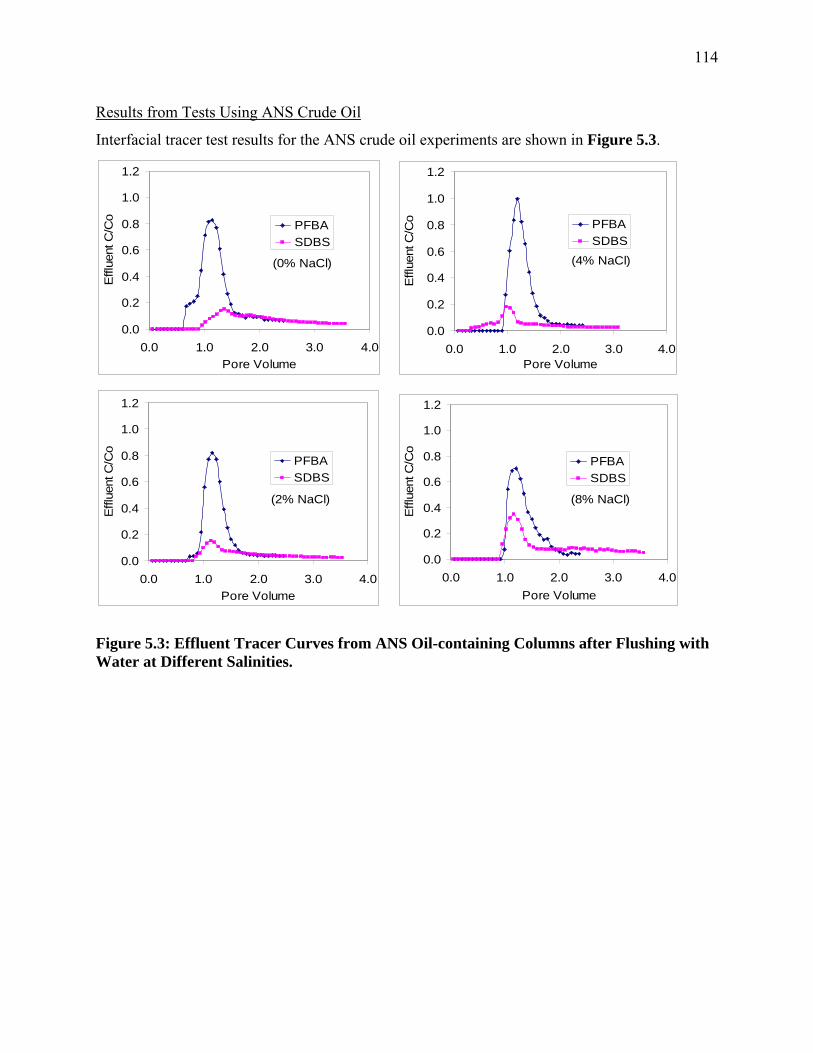
114
Results from Tests Using ANS Crude Oil
Interfacial tracer test results for the ANS crude oil experiments are shown in Figure 5.3.
Figure 5.3: Effluent Tracer Curves from ANS Oil-containing Columns after Flushing with Water at Different Salinities.
(0% NaCl)
0.0
0.2
0.4
0.6
0.8
1.0
1.2
0.0 1.0 2.0 3.0 4.0Pore Volume
Effl
uent
C/C
o
PFBASDBS
(2% NaCl)
0.0
0.2
0.4
0.6
0.8
1.0
1.2
0.0 1.0 2.0 3.0 4.0Pore Volume
Effl
uent
C/C
o
PFBASDBS
(4% NaCl)
0.0
0.2
0.4
0.6
0.8
1.0
1.2
0.0 1.0 2.0 3.0 4.0Pore Volume
Effl
uent
C/C
o PFBASDBS
(8% NaCl)
0.0
0.2
0.4
0.6
0.8
1.0
1.2
0.0 1.0 2.0 3.0 4.0Pore Volume
Effl
uent
C/C
o
PFBASDBS
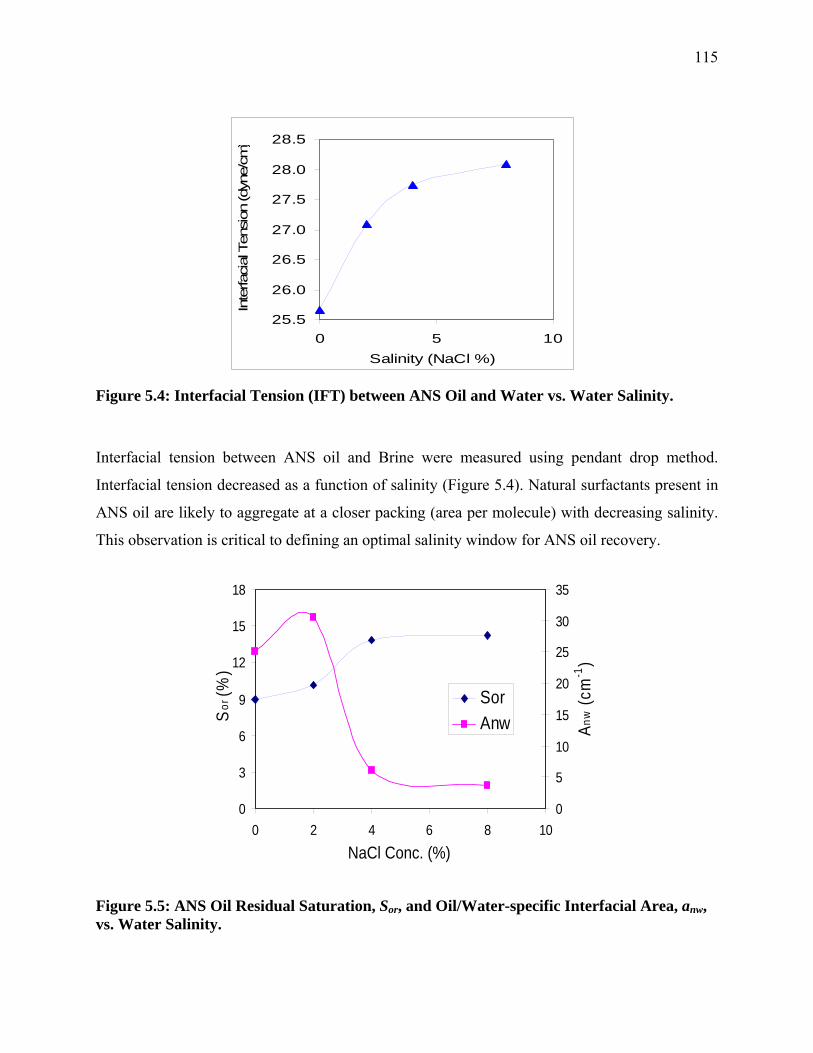
115
Figure 5.4: Interfacial Tension (IFT) between ANS Oil and Water vs. Water Salinity.
Interfacial tension between ANS oil and Brine were measured using pendant drop method.
Interfacial tension decreased as a function of salinity (Figure 5.4). Natural surfactants present in
ANS oil are likely to aggregate at a closer packing (area per molecule) with decreasing salinity.
This observation is critical to defining an optimal salinity window for ANS oil recovery.
Figure 5.5: ANS Oil Residual Saturation, Sor, and Oil/Water-specific Interfacial Area, anw, vs. Water Salinity.
25.5
26.0
26.5
27.0
27.5
28.0
28.5
0 5 10Salinity (NaCl %)
Inte
rfacial
Ten
sion
(dyn
e/cm
)
0
3
6
9
12
15
18
0 2 4 6 8 10NaCl Conc. (%)
Sor
(%)
0
5
10
15
20
25
30
35An
w (c
m-1
)
SorAnw
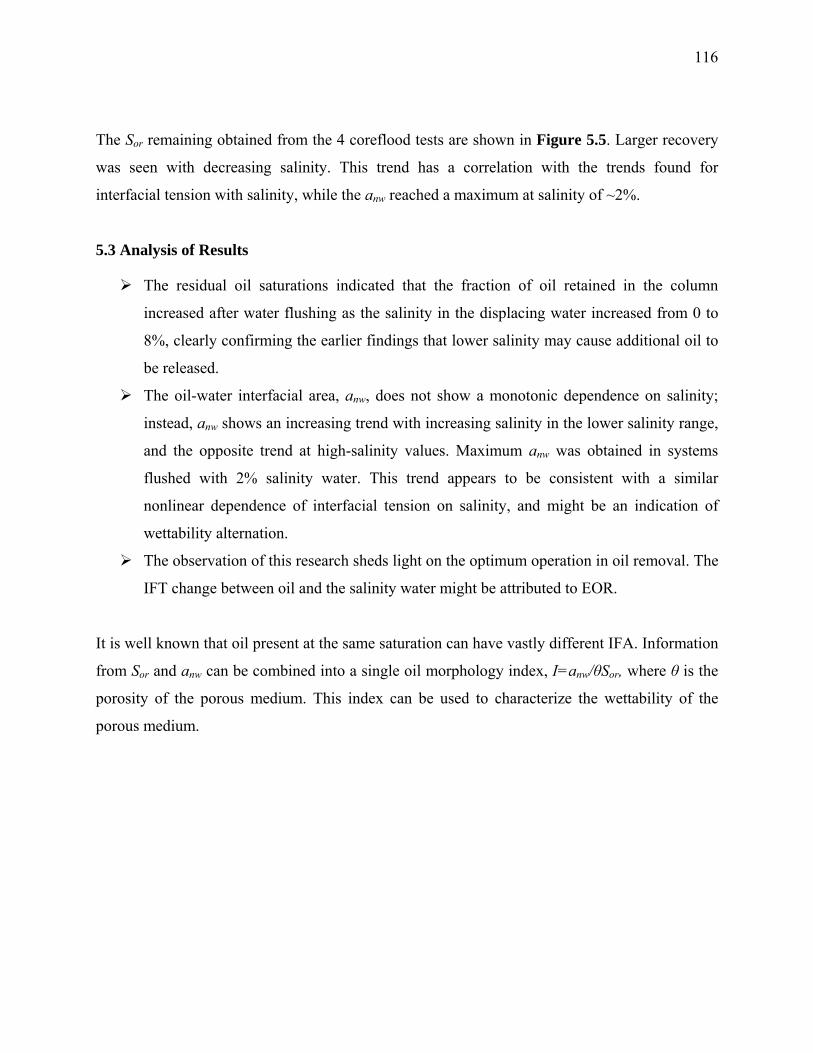
116
The Sor remaining obtained from the 4 coreflood tests are shown in Figure 5.5. Larger recovery
was seen with decreasing salinity. This trend has a correlation with the trends found for
interfacial tension with salinity, while the anw reached a maximum at salinity of ~2%.
5.3 Analysis of Results
The residual oil saturations indicated that the fraction of oil retained in the column
increased after water flushing as the salinity in the displacing water increased from 0 to
8%, clearly confirming the earlier findings that lower salinity may cause additional oil to
be released.
The oil-water interfacial area, anw, does not show a monotonic dependence on salinity;
instead, anw shows an increasing trend with increasing salinity in the lower salinity range,
and the opposite trend at high-salinity values. Maximum anw was obtained in systems
flushed with 2% salinity water. This trend appears to be consistent with a similar
nonlinear dependence of interfacial tension on salinity, and might be an indication of
wettability alternation.
The observation of this research sheds light on the optimum operation in oil removal. The
IFT change between oil and the salinity water might be attributed to EOR.
It is well known that oil present at the same saturation can have vastly different IFA. Information
from Sor and anw can be combined into a single oil morphology index, I=anw/θSor, where θ is the
porosity of the porous medium. This index can be used to characterize the wettability of the
porous medium.
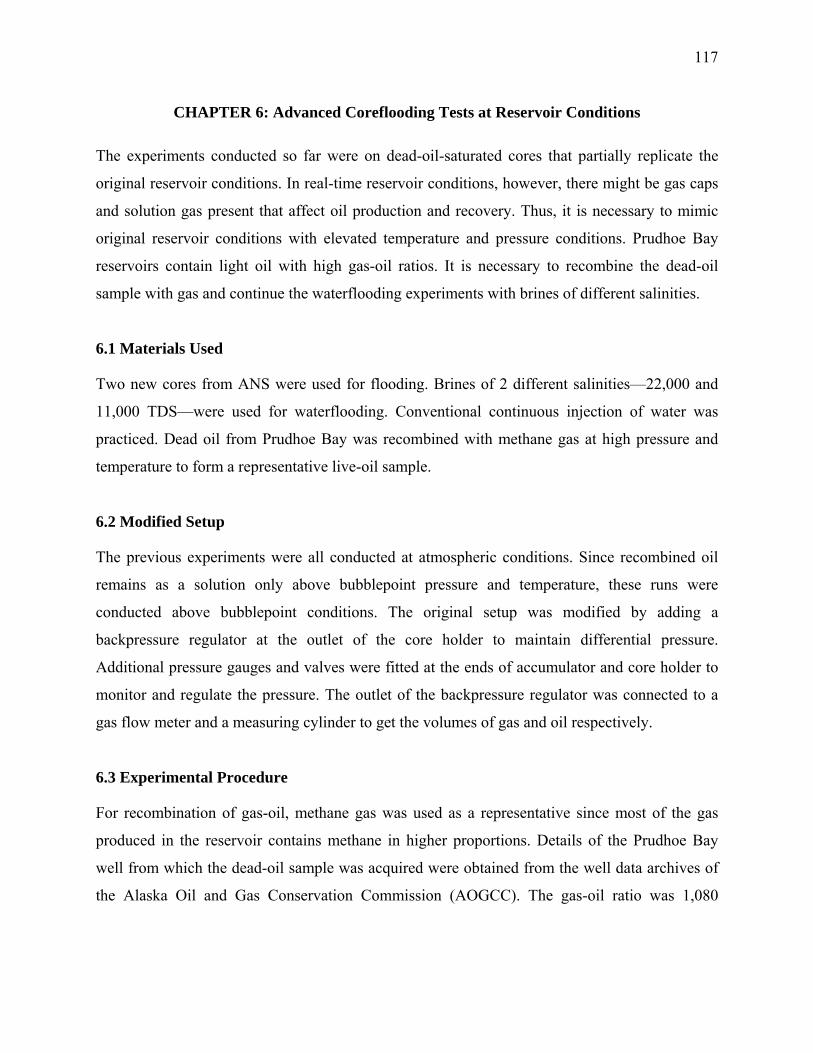
117
CHAPTER 6: Advanced Coreflooding Tests at Reservoir Conditions
The experiments conducted so far were on dead-oil-saturated cores that partially replicate the
original reservoir conditions. In real-time reservoir conditions, however, there might be gas caps
and solution gas present that affect oil production and recovery. Thus, it is necessary to mimic
original reservoir conditions with elevated temperature and pressure conditions. Prudhoe Bay
reservoirs contain light oil with high gas-oil ratios. It is necessary to recombine the dead-oil
sample with gas and continue the waterflooding experiments with brines of different salinities.
6.1 Materials Used
Two new cores from ANS were used for flooding. Brines of 2 different salinities—22,000 and
11,000 TDS—were used for waterflooding. Conventional continuous injection of water was
practiced. Dead oil from Prudhoe Bay was recombined with methane gas at high pressure and
temperature to form a representative live-oil sample.
6.2 Modified Setup
The previous experiments were all conducted at atmospheric conditions. Since recombined oil
remains as a solution only above bubblepoint pressure and temperature, these runs were
conducted above bubblepoint conditions. The original setup was modified by adding a
backpressure regulator at the outlet of the core holder to maintain differential pressure.
Additional pressure gauges and valves were fitted at the ends of accumulator and core holder to
monitor and regulate the pressure. The outlet of the backpressure regulator was connected to a
gas flow meter and a measuring cylinder to get the volumes of gas and oil respectively.
6.3 Experimental Procedure
For recombination of gas-oil, methane gas was used as a representative since most of the gas
produced in the reservoir contains methane in higher proportions. Details of the Prudhoe Bay
well from which the dead-oil sample was acquired were obtained from the well data archives of
the Alaska Oil and Gas Conservation Commission (AOGCC). The gas-oil ratio was 1,080
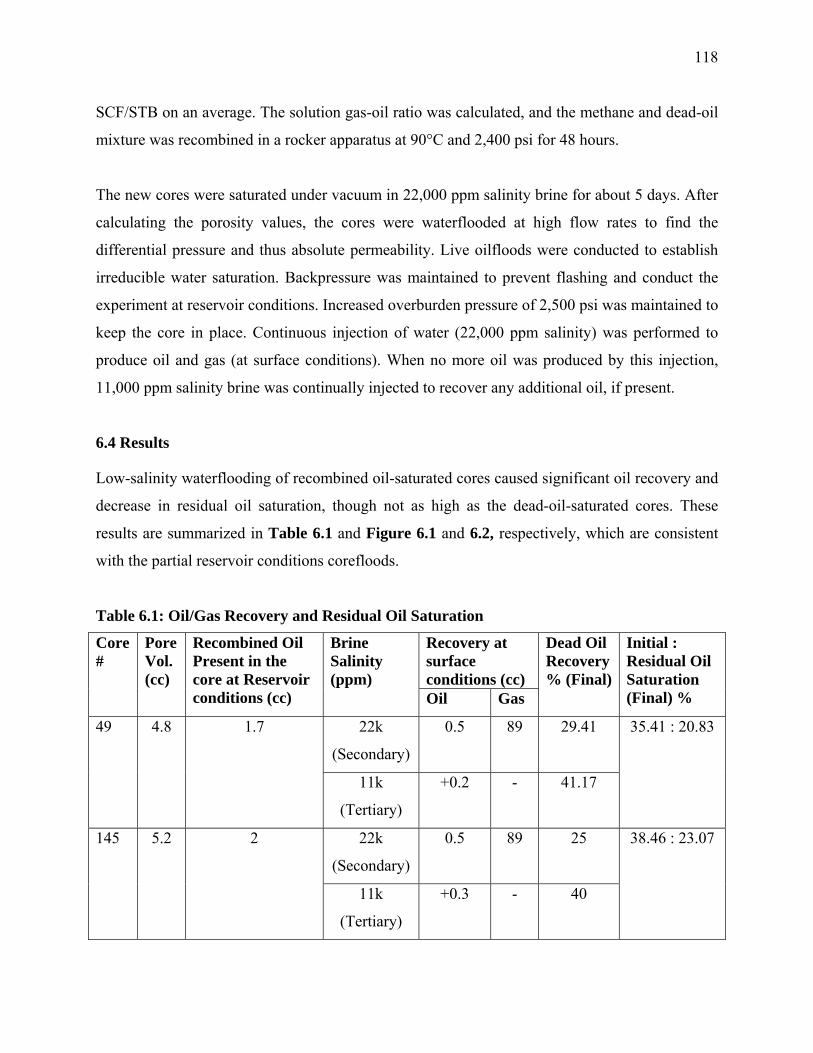
118
SCF/STB on an average. The solution gas-oil ratio was calculated, and the methane and dead-oil
mixture was recombined in a rocker apparatus at 90°C and 2,400 psi for 48 hours.
The new cores were saturated under vacuum in 22,000 ppm salinity brine for about 5 days. After
calculating the porosity values, the cores were waterflooded at high flow rates to find the
differential pressure and thus absolute permeability. Live oilfloods were conducted to establish
irreducible water saturation. Backpressure was maintained to prevent flashing and conduct the
experiment at reservoir conditions. Increased overburden pressure of 2,500 psi was maintained to
keep the core in place. Continuous injection of water (22,000 ppm salinity) was performed to
produce oil and gas (at surface conditions). When no more oil was produced by this injection,
11,000 ppm salinity brine was continually injected to recover any additional oil, if present.
6.4 Results
Low-salinity waterflooding of recombined oil-saturated cores caused significant oil recovery and
decrease in residual oil saturation, though not as high as the dead-oil-saturated cores. These
results are summarized in Table 6.1 and Figure 6.1 and 6.2, respectively, which are consistent
with the partial reservoir conditions corefloods.
Table 6.1: Oil/Gas Recovery and Residual Oil Saturation
Recovery at surface conditions (cc)
Core #
Pore Vol. (cc)
Recombined Oil Present in the core at Reservoir conditions (cc)
Brine Salinity (ppm)
Oil Gas
Dead Oil Recovery % (Final)
Initial : Residual Oil Saturation (Final) %
22k
(Secondary)
0.5 89 29.41 49 4.8 1.7
11k
(Tertiary)
+0.2 - 41.17
35.41 : 20.83
22k
(Secondary)
0.5 89 25 145 5.2 2
11k
(Tertiary)
+0.3 - 40
38.46 : 23.07
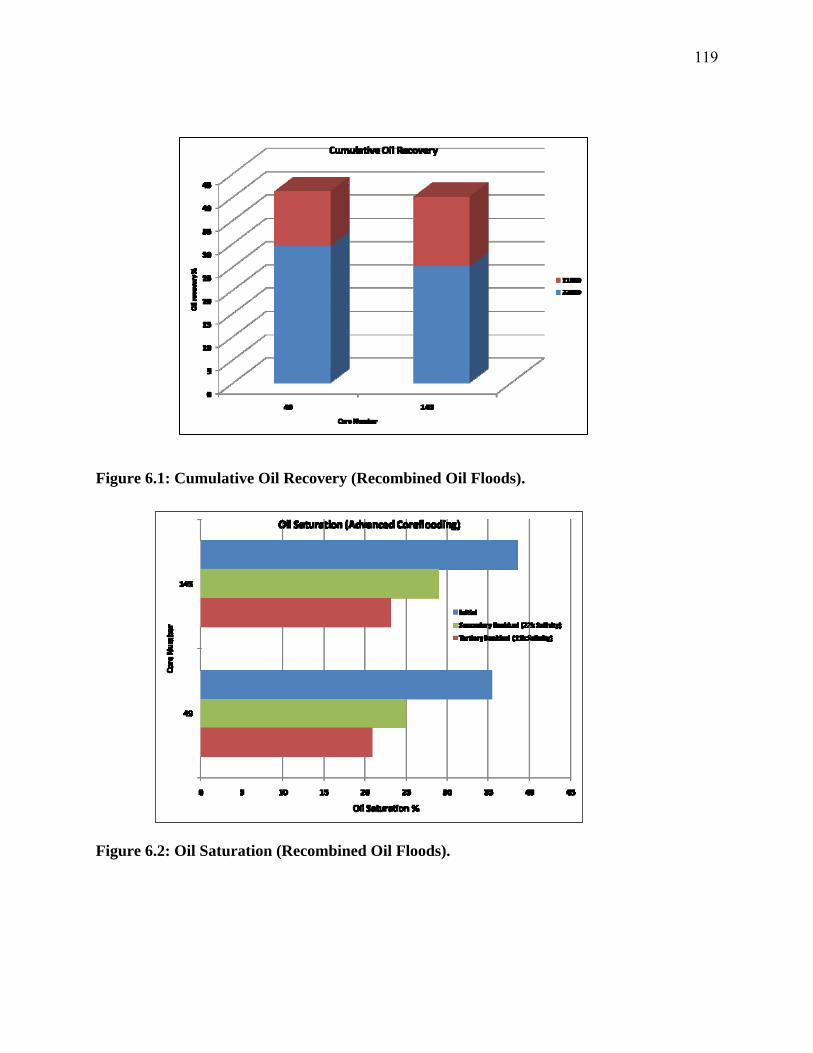
119
Figure 6.1: Cumulative Oil Recovery (Recombined Oil Floods).
Figure 6.2: Oil Saturation (Recombined Oil Floods).
120
CHAPTER 7: Results and Discussion – DNR and Berea Cores
The current industry practice, in designing most waterflood processes, requires the use of
formation water/brine, or filtered (and treated) seawater or a mixture of both (produced)
formation water and seawater. Salinity of seawater is normally between 3% and 3.5% (in terms
of the total dissolved solids). The salinity of the reservoir brine on the other hand has been
reported to be up to four times higher than that of seawater95. Consequently, most waterfloods
are carried out using high-salinity brine. Hot-water flooding is typically used for heavy oil
recovery and usually results in improved oil production over conventional (primary) or
secondary recovery techniques. However, problems of extensive heat loss through the tubing and
to the formation, cost of heating, cost of insulation, etc., make this a very expensive and energy
intensive option.
This work compares the oil recovery benefits achieved by injecting brine having different
salinities. It also evaluates the impact of wettability variation, as a result of varying the brine
salinity, on oil recovery efficiency and residual oil saturation. In this work, high-salinity
waterflood refers to the injection of brine having a salinity of 4% while low-salinity waterflood
refers to the injection of brine having salinities of 2% and 1% respectively.
Two sets of fast-track coreflood experiments were designed to achieve the objectives of this
work. Both sets experiments were conducted at ambient pressure and temperature and ambient
pressure and elevated temperature conditions. The aim of the first set of experiments was to
examine and validate published reports on the EOR potential of low-salinity brine. The impact of
injecting brine at elevated temperature on reduction in residual oil saturation was also examined.
This first set of experiments involved changing the salinity of the injected brine (to a lower
salinity) at high water cut (typically when no more oil is being produced by injecting brine of
higher salinity) and observing for the incremental volume of produced oil. Due to the design of
this experiment, the initial salinity of the connate water could not be kept constant.
Consequently, the initial salinity of the connate water for each waterflood (of a specific salinity)
was a function of the brine salinity of the preceding flood. For example, the initial connate water
salinity for the 2% salinity waterflood was 4% because the 2% salinity flood was immediately
preceded by a 4% salinity flood. However, the “initial” connate water salinity at the start of the
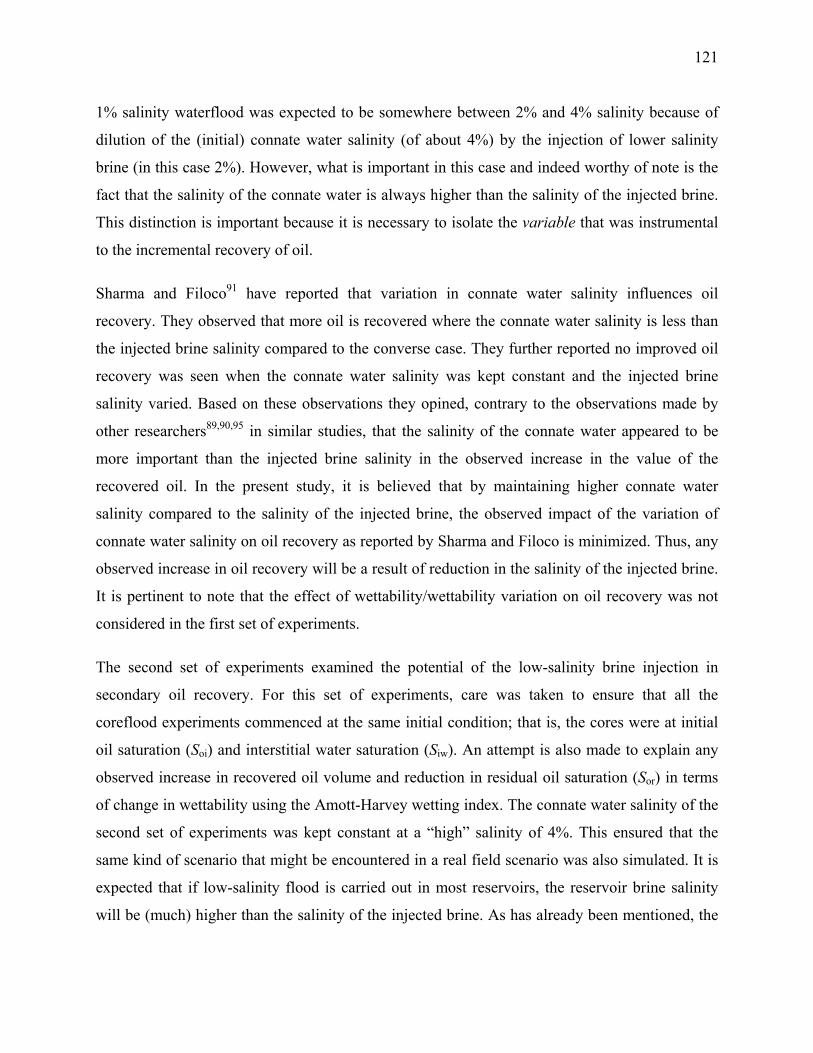
121
1% salinity waterflood was expected to be somewhere between 2% and 4% salinity because of
dilution of the (initial) connate water salinity (of about 4%) by the injection of lower salinity
brine (in this case 2%). However, what is important in this case and indeed worthy of note is the
fact that the salinity of the connate water is always higher than the salinity of the injected brine.
This distinction is important because it is necessary to isolate the variable that was instrumental
to the incremental recovery of oil.
Sharma and Filoco91 have reported that variation in connate water salinity influences oil
recovery. They observed that more oil is recovered where the connate water salinity is less than
the injected brine salinity compared to the converse case. They further reported no improved oil
recovery was seen when the connate water salinity was kept constant and the injected brine
salinity varied. Based on these observations they opined, contrary to the observations made by
other researchers89,90,95 in similar studies, that the salinity of the connate water appeared to be
more important than the injected brine salinity in the observed increase in the value of the
recovered oil. In the present study, it is believed that by maintaining higher connate water
salinity compared to the salinity of the injected brine, the observed impact of the variation of
connate water salinity on oil recovery as reported by Sharma and Filoco is minimized. Thus, any
observed increase in oil recovery will be a result of reduction in the salinity of the injected brine.
It is pertinent to note that the effect of wettability/wettability variation on oil recovery was not
considered in the first set of experiments.
The second set of experiments examined the potential of the low-salinity brine injection in
secondary oil recovery. For this set of experiments, care was taken to ensure that all the
coreflood experiments commenced at the same initial condition; that is, the cores were at initial
oil saturation (Soi) and interstitial water saturation (Siw). An attempt is also made to explain any
observed increase in recovered oil volume and reduction in residual oil saturation (Sor) in terms
of change in wettability using the Amott-Harvey wetting index. The connate water salinity of the
second set of experiments was kept constant at a “high” salinity of 4%. This ensured that the
same kind of scenario that might be encountered in a real field scenario was also simulated. It is
expected that if low-salinity flood is carried out in most reservoirs, the reservoir brine salinity
will be (much) higher than the salinity of the injected brine. As has already been mentioned, the
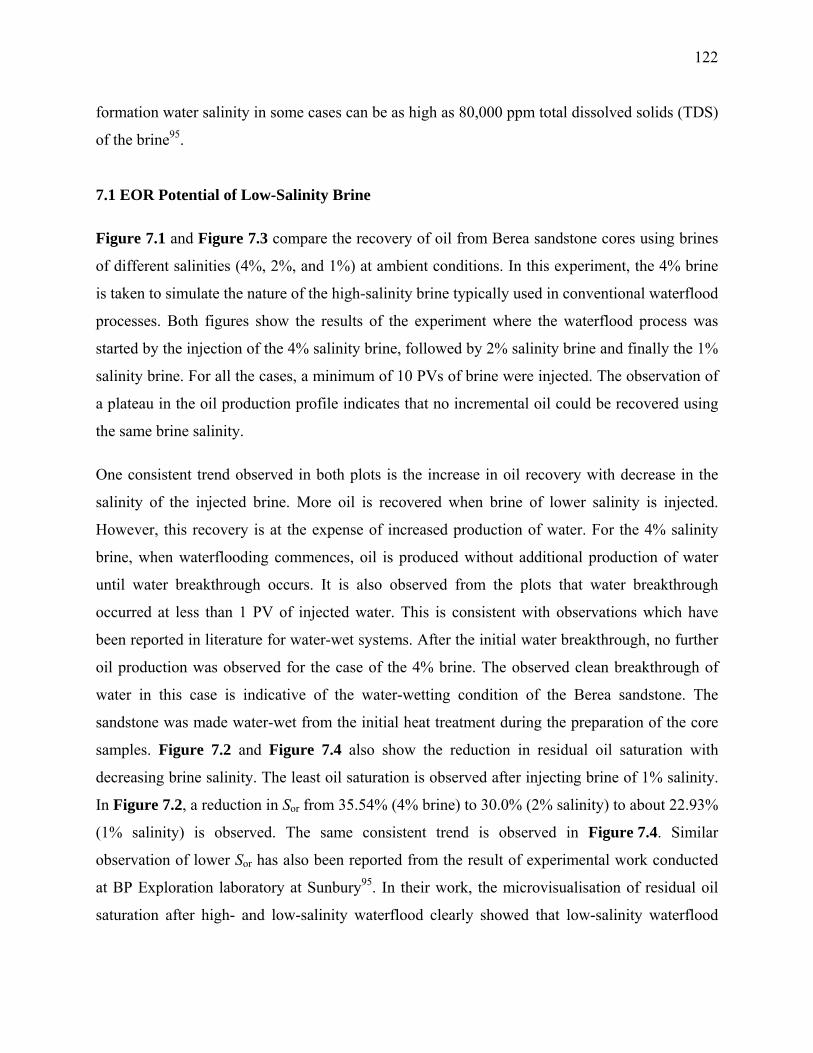
122
formation water salinity in some cases can be as high as 80,000 ppm total dissolved solids (TDS)
of the brine95.
7.1 EOR Potential of Low-Salinity Brine
Figure 7.1 and Figure 7.3 compare the recovery of oil from Berea sandstone cores using brines
of different salinities (4%, 2%, and 1%) at ambient conditions. In this experiment, the 4% brine
is taken to simulate the nature of the high-salinity brine typically used in conventional waterflood
processes. Both figures show the results of the experiment where the waterflood process was
started by the injection of the 4% salinity brine, followed by 2% salinity brine and finally the 1%
salinity brine. For all the cases, a minimum of 10 PVs of brine were injected. The observation of
a plateau in the oil production profile indicates that no incremental oil could be recovered using
the same brine salinity.
One consistent trend observed in both plots is the increase in oil recovery with decrease in the
salinity of the injected brine. More oil is recovered when brine of lower salinity is injected.
However, this recovery is at the expense of increased production of water. For the 4% salinity
brine, when waterflooding commences, oil is produced without additional production of water
until water breakthrough occurs. It is also observed from the plots that water breakthrough
occurred at less than 1 PV of injected water. This is consistent with observations which have
been reported in literature for water-wet systems. After the initial water breakthrough, no further
oil production was observed for the case of the 4% brine. The observed clean breakthrough of
water in this case is indicative of the water-wetting condition of the Berea sandstone. The
sandstone was made water-wet from the initial heat treatment during the preparation of the core
samples. Figure 7.2 and Figure 7.4 also show the reduction in residual oil saturation with
decreasing brine salinity. The least oil saturation is observed after injecting brine of 1% salinity.
In Figure 7.2, a reduction in Sor from 35.54% (4% brine) to 30.0% (2% salinity) to about 22.93%
(1% salinity) is observed. The same consistent trend is observed in Figure 7.4. Similar
observation of lower Sor has also been reported from the result of experimental work conducted
at BP Exploration laboratory at Sunbury95. In their work, the microvisualisation of residual oil
saturation after high- and low-salinity waterflood clearly showed that low-salinity waterflood
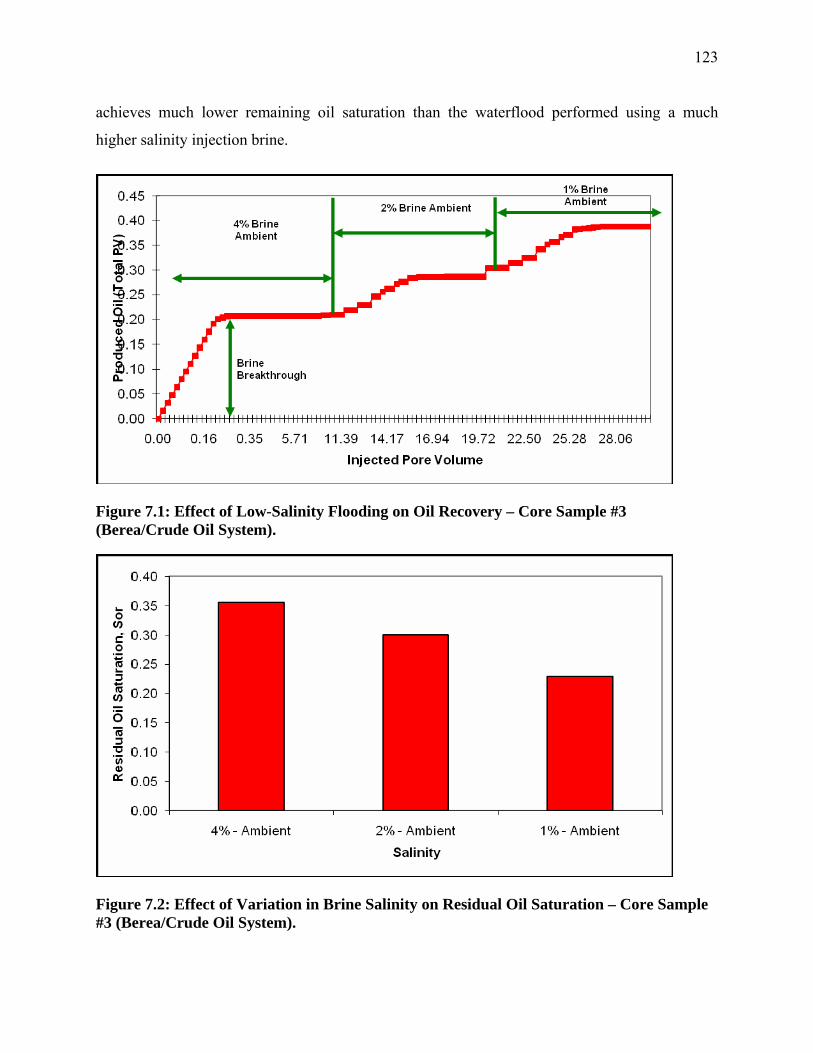
123
achieves much lower remaining oil saturation than the waterflood performed using a much
higher salinity injection brine.
Figure 7.1: Effect of Low-Salinity Flooding on Oil Recovery – Core Sample #3 (Berea/Crude Oil System).
Figure 7.2: Effect of Variation in Brine Salinity on Residual Oil Saturation – Core Sample #3 (Berea/Crude Oil System).
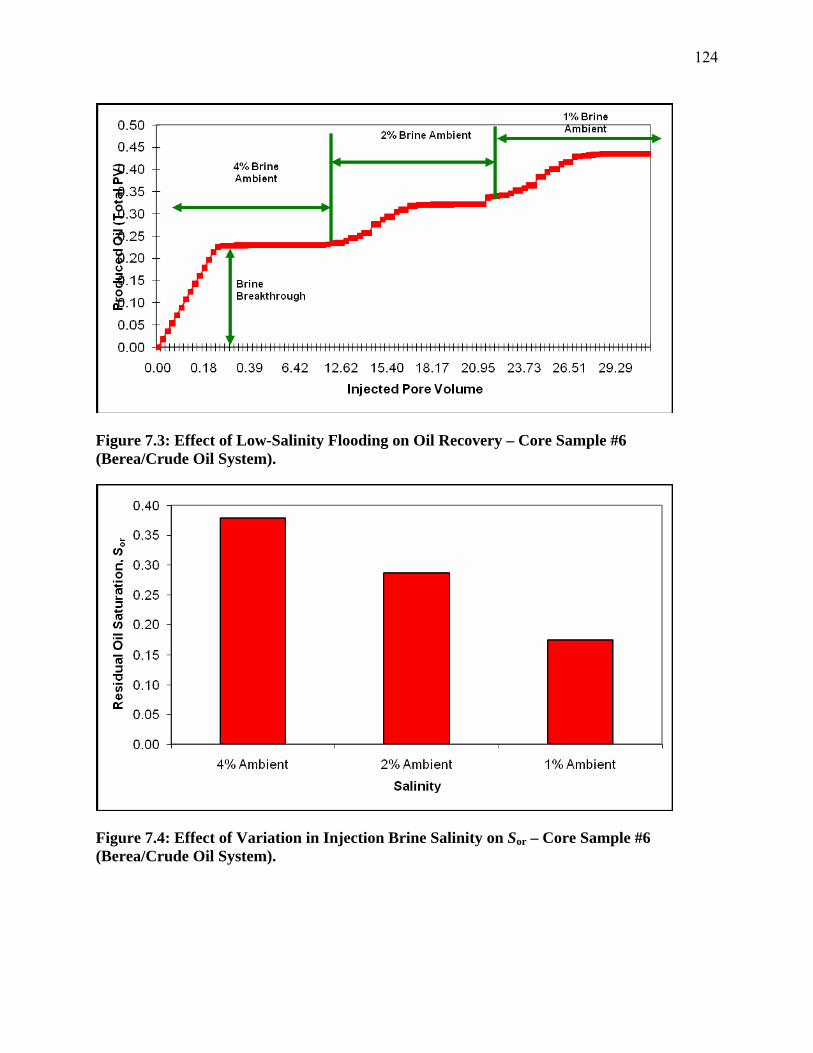
124
Figure 7.3: Effect of Low-Salinity Flooding on Oil Recovery – Core Sample #6 (Berea/Crude Oil System).
Figure 7.4: Effect of Variation in Injection Brine Salinity on Sor – Core Sample #6 (Berea/Crude Oil System).
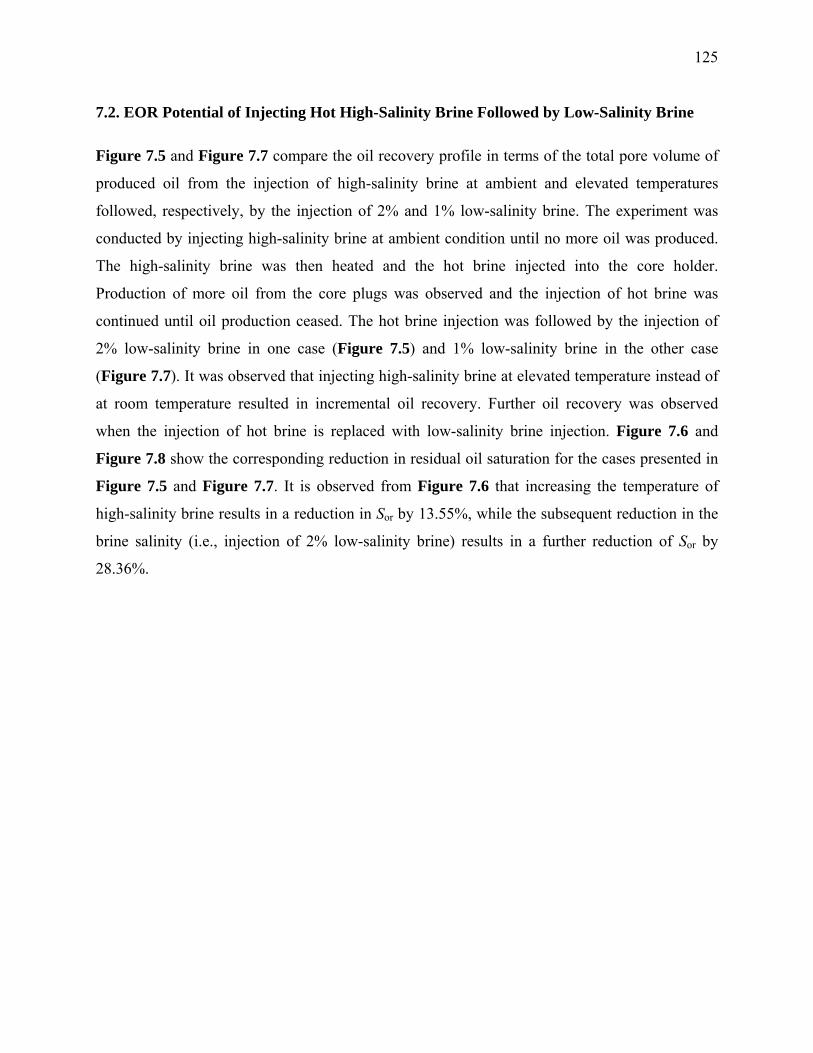
125
7.2. EOR Potential of Injecting Hot High-Salinity Brine Followed by Low-Salinity Brine
Figure 7.5 and Figure 7.7 compare the oil recovery profile in terms of the total pore volume of
produced oil from the injection of high-salinity brine at ambient and elevated temperatures
followed, respectively, by the injection of 2% and 1% low-salinity brine. The experiment was
conducted by injecting high-salinity brine at ambient condition until no more oil was produced.
The high-salinity brine was then heated and the hot brine injected into the core holder.
Production of more oil from the core plugs was observed and the injection of hot brine was
continued until oil production ceased. The hot brine injection was followed by the injection of
2% low-salinity brine in one case (Figure 7.5) and 1% low-salinity brine in the other case
(Figure 7.7). It was observed that injecting high-salinity brine at elevated temperature instead of
at room temperature resulted in incremental oil recovery. Further oil recovery was observed
when the injection of hot brine is replaced with low-salinity brine injection. Figure 7.6 and
Figure 7.8 show the corresponding reduction in residual oil saturation for the cases presented in
Figure 7.5 and Figure 7.7. It is observed from Figure 7.6 that increasing the temperature of
high-salinity brine results in a reduction in Sor by 13.55%, while the subsequent reduction in the
brine salinity (i.e., injection of 2% low-salinity brine) results in a further reduction of Sor by
28.36%.
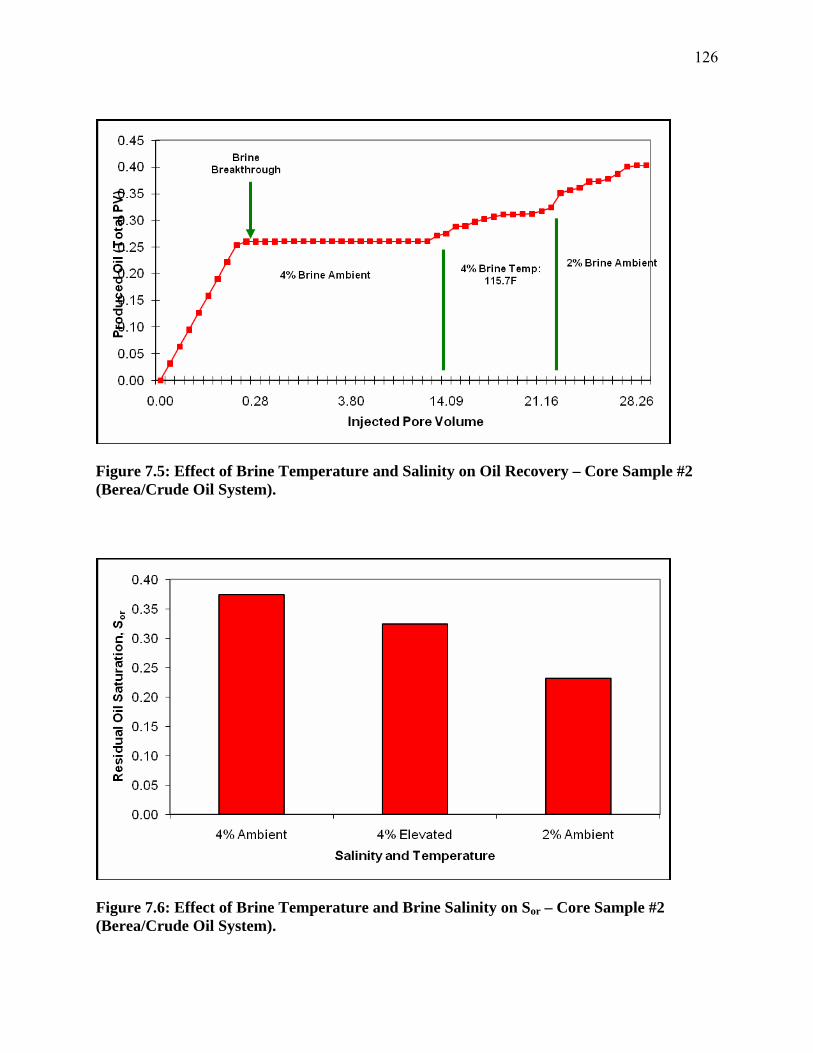
126
Figure 7.5: Effect of Brine Temperature and Salinity on Oil Recovery – Core Sample #2 (Berea/Crude Oil System).
Figure 7.6: Effect of Brine Temperature and Brine Salinity on Sor – Core Sample #2 (Berea/Crude Oil System).
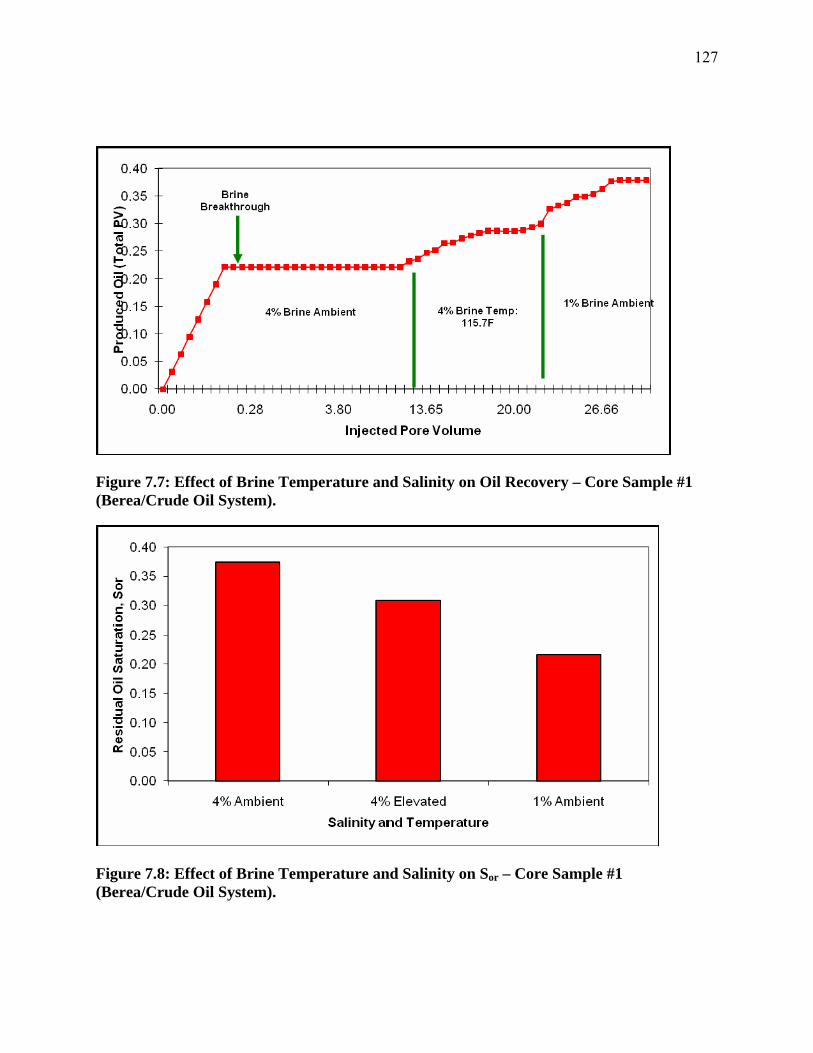
127
Figure 7.7: Effect of Brine Temperature and Salinity on Oil Recovery – Core Sample #1 (Berea/Crude Oil System).
Figure 7.8: Effect of Brine Temperature and Salinity on Sor – Core Sample #1 (Berea/Crude Oil System).

128
7.3 EOR Potential of Injecting Low-Salinity Brine at Ambient and Elevated Temperature
The first set of experiments also determined the EOR potential of injecting brine of different
salinities at ambient and elevated temperatures. The observed oil recovery profile for this
scenario is shown in Figure 7.9 and Figure 7.11. Both plots show an increase in the number of
PVs of produced oil with decrease in brine salinity and increase in the temperature of the injected
brine. Figure 7.9 shows a very significant increase in the produced oil when hot brine of 2%
salinity is injected. It is suspected that this significant increase is the combined effects of increase
in temperature and viscous forces. It was observed while running the experiment that the
pressure drop was significantly higher across the core plug due to forced fluid flow when the
brine accumulator valve was opened, as a result of pressure buildup in the accumulator while
heating the brine. This undue influence of the viscous force was removed in the next experiment
(by venting the steam and allowing the injection of hot brine at a constant flow rate) and the
result is plotted in Figure 7.11. However, irrespective of the additional viscous effect, it is
observed that further injection of low-salinity brine at ambient and elevated temperatures
resulted in the production of incremental oil. The observed increase in oil recovery is presented
in another form in Figure 7.10 and Figure 7.12 which show the reduction in residual oil
saturation with injection of low-salinity brine at ambient and elevated temperatures. One set of
experiments (Figure 7.10) resulted in a decrease in residual oil saturation from 36.84% after
injecting 4% brine at ambient condition to 9.87% after injecting low-salinity brine (1% salinity)
at elevated temperature. The other set of experiments shows a reduction in Sor from 38.91%
(high-salinity brine flood at room temperature) to 15.10% (low-salinity brine injection at
elevated temperature).
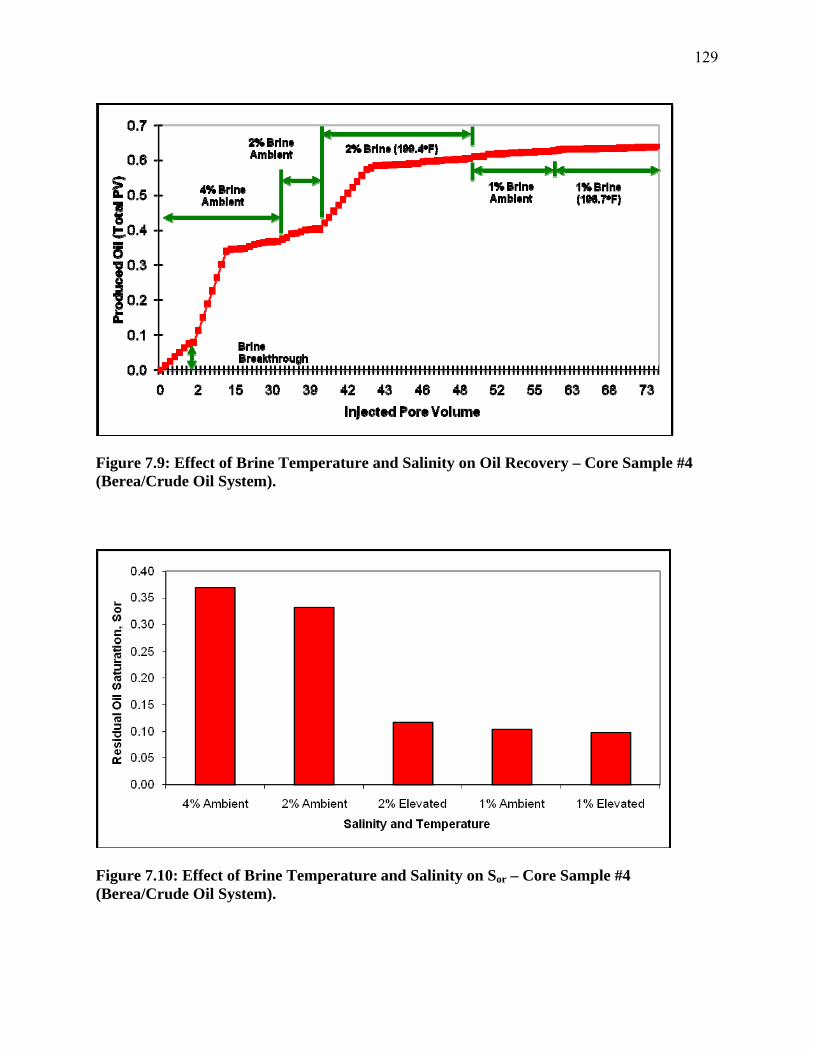
129
Figure 7.9: Effect of Brine Temperature and Salinity on Oil Recovery – Core Sample #4 (Berea/Crude Oil System).
Figure 7.10: Effect of Brine Temperature and Salinity on Sor – Core Sample #4 (Berea/Crude Oil System).
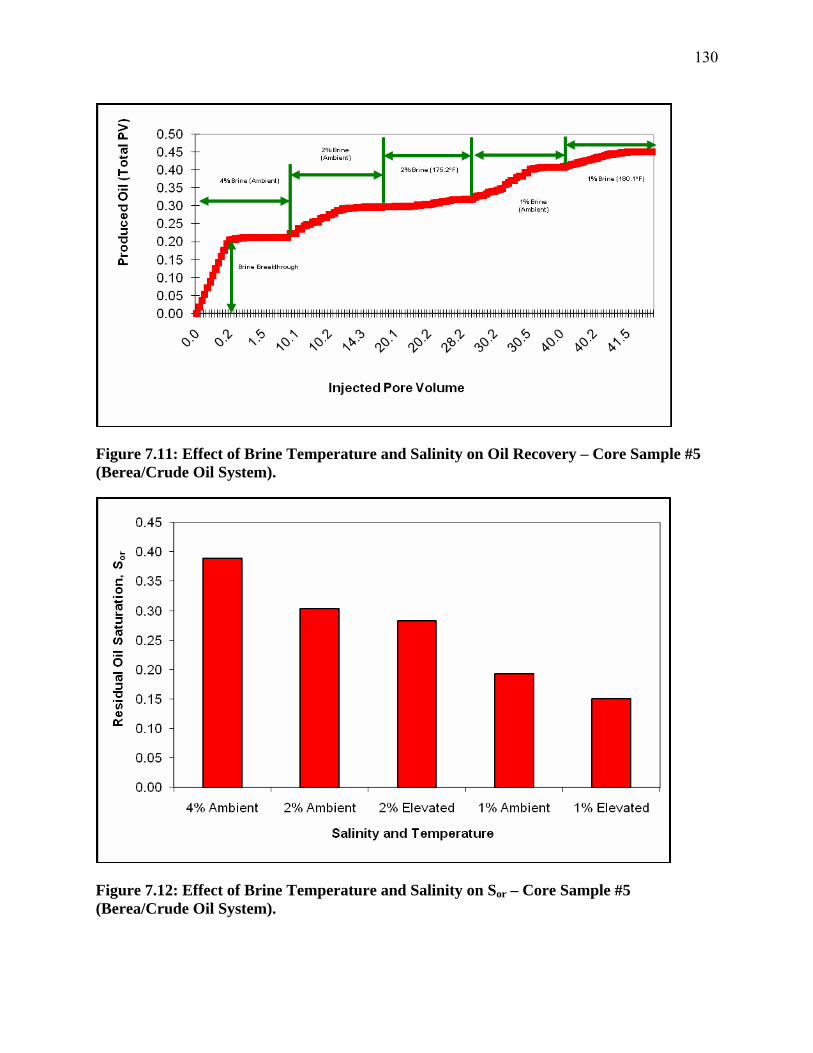
130
Figure 7.11: Effect of Brine Temperature and Salinity on Oil Recovery – Core Sample #5 (Berea/Crude Oil System).
Figure 7.12: Effect of Brine Temperature and Salinity on Sor – Core Sample #5 (Berea/Crude Oil System).

131
Numerous research studies89,90,91 have indicated that the performance of waterfloods is strongly
affected by a number of variables which include the composition of the crude oil and its ability
to wet the rock surfaces, the salinities of the connate water in the reservoir and the injected water
from waterflood, the height above the oil/water contact, OWC (typically the reservoir rock
becomes more oil-wet with increasing height above the OWC). For this first set of experiments,
it is speculated that some form of wettability alteration to a mixed-wet state occurred because of
the composition of the crude oil and the composition and salinity of the brine. Based on a static
asphaltene deposition test conducted at UAF, it has been observed that the crude oil sample used
in this first experimental study contains asphaltenes and it has been shown that the deposition of
asphaltene onto the rock results in the alteration of wettability state of the reservoir rock. Before
asphaltenes can be deposited on the rock surface, the thin stable films of water (brine) coating
the water-wet rock grains have to be ruptured. The ability of the oil to rupture this film and thus
deposit asphaltene compound on the rock surface depends on the value of the critical disjoining
pressure of the water film bounded by mineral-water and the oil-water interfaces.
It is reported that in sandstone reservoirs, diffuse electrical double layer exists at the oil/brine and
mineral/brine interfaces97. The rationale behind the formation of diffuse electrical double layers
is explained hereafter (after Hall et al.98). Typically, at an interface, a charged layer may be
formed by dissociation of ionogenic groups or by the adsorption of ions. Screening of the
resulting ions is restricted to two dimensions and very high electrostatic-potential gradients are
then established in the interfacial region. In an aqueous phase, such potentials are compensated
by a distribution of counterions usually described as an electrical double layer99. It has been
noted that in many cases, the diffuse electrical double layers will be quite similar with respect to
electric charge and potential.
Consequently, extremely thin aqueous wetting films separating such interfaces are stabilized by
electrostatic repulsive force acting between the double layers as a result of osmotic forces within
the film. It has been recognized that for these thin films, the effect of osmotic or electrostatic
forces is modified by the existence of both dispersion (or van der Waals) forces and hydration (or
adsorption) forces. Whereas the very short range hydration forces tend to also stabilize aqueous
wetting films, the dispersion forces tend to destabilize the film in question. The dispersion forces
are attractive forces while the hydration and electrostatic forces are repulsive forces. For the
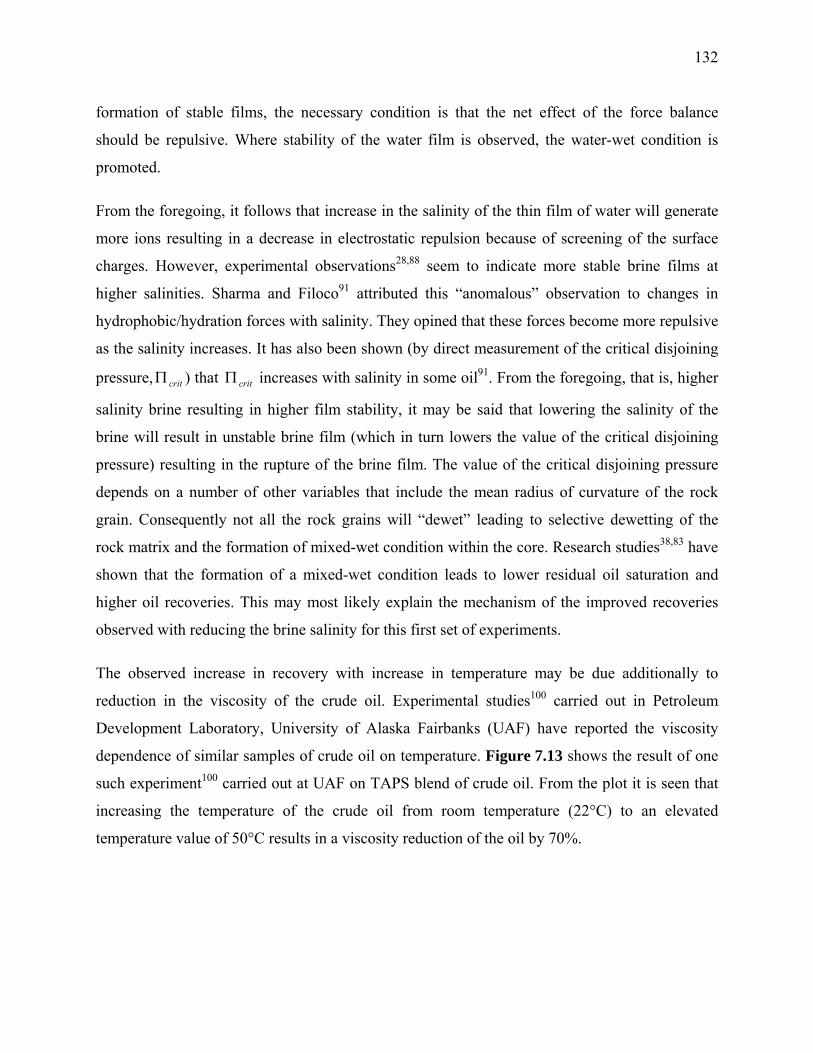
132
formation of stable films, the necessary condition is that the net effect of the force balance
should be repulsive. Where stability of the water film is observed, the water-wet condition is
promoted.
From the foregoing, it follows that increase in the salinity of the thin film of water will generate
more ions resulting in a decrease in electrostatic repulsion because of screening of the surface
charges. However, experimental observations28,88 seem to indicate more stable brine films at
higher salinities. Sharma and Filoco91 attributed this “anomalous” observation to changes in
hydrophobic/hydration forces with salinity. They opined that these forces become more repulsive
as the salinity increases. It has also been shown (by direct measurement of the critical disjoining
pressure, critΠ ) that critΠ increases with salinity in some oil91. From the foregoing, that is, higher
salinity brine resulting in higher film stability, it may be said that lowering the salinity of the
brine will result in unstable brine film (which in turn lowers the value of the critical disjoining
pressure) resulting in the rupture of the brine film. The value of the critical disjoining pressure
depends on a number of other variables that include the mean radius of curvature of the rock
grain. Consequently not all the rock grains will “dewet” leading to selective dewetting of the
rock matrix and the formation of mixed-wet condition within the core. Research studies38,83 have
shown that the formation of a mixed-wet condition leads to lower residual oil saturation and
higher oil recoveries. This may most likely explain the mechanism of the improved recoveries
observed with reducing the brine salinity for this first set of experiments.
The observed increase in recovery with increase in temperature may be due additionally to
reduction in the viscosity of the crude oil. Experimental studies100 carried out in Petroleum
Development Laboratory, University of Alaska Fairbanks (UAF) have reported the viscosity
dependence of similar samples of crude oil on temperature. Figure 7.13 shows the result of one
such experiment100 carried out at UAF on TAPS blend of crude oil. From the plot it is seen that
increasing the temperature of the crude oil from room temperature (22°C) to an elevated
temperature value of 50°C results in a viscosity reduction of the oil by 70%.
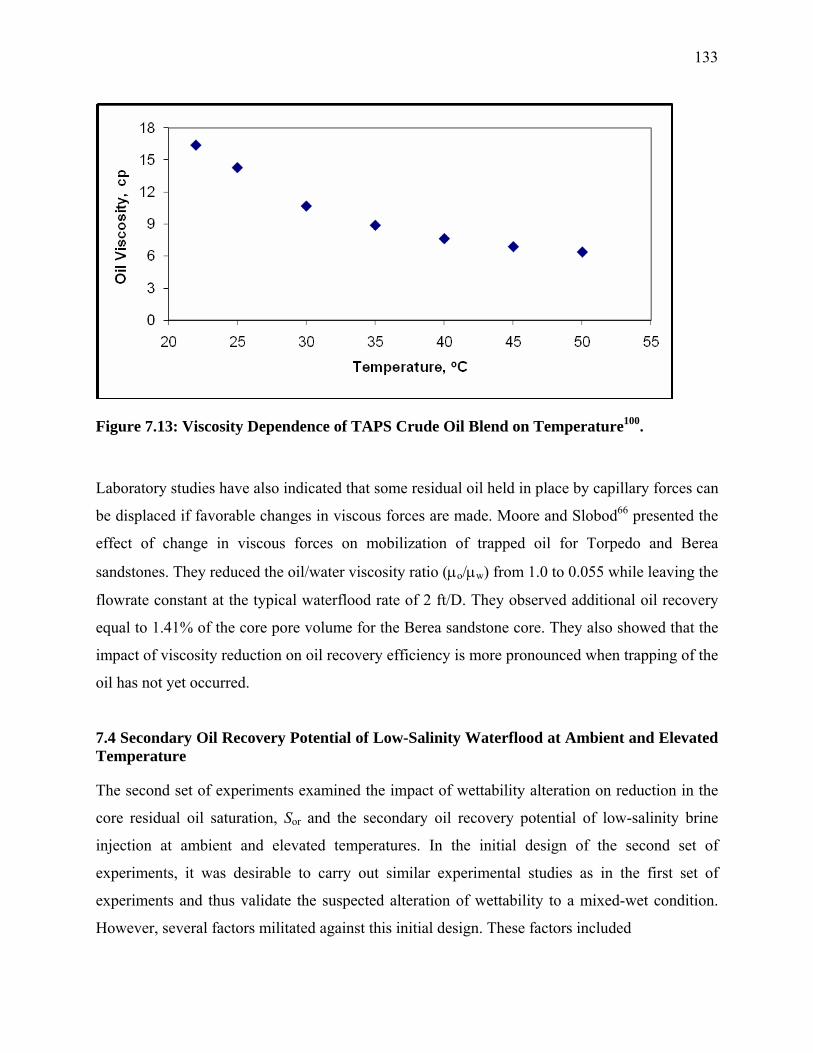
133
Figure 7.13: Viscosity Dependence of TAPS Crude Oil Blend on Temperature100.
Laboratory studies have also indicated that some residual oil held in place by capillary forces can
be displaced if favorable changes in viscous forces are made. Moore and Slobod66 presented the
effect of change in viscous forces on mobilization of trapped oil for Torpedo and Berea
sandstones. They reduced the oil/water viscosity ratio (μo/μw) from 1.0 to 0.055 while leaving the
flowrate constant at the typical waterflood rate of 2 ft/D. They observed additional oil recovery
equal to 1.41% of the core pore volume for the Berea sandstone core. They also showed that the
impact of viscosity reduction on oil recovery efficiency is more pronounced when trapping of the
oil has not yet occurred.
7.4 Secondary Oil Recovery Potential of Low-Salinity Waterflood at Ambient and Elevated Temperature
The second set of experiments examined the impact of wettability alteration on reduction in the
core residual oil saturation, Sor and the secondary oil recovery potential of low-salinity brine
injection at ambient and elevated temperatures. In the initial design of the second set of
experiments, it was desirable to carry out similar experimental studies as in the first set of
experiments and thus validate the suspected alteration of wettability to a mixed-wet condition.
However, several factors militated against this initial design. These factors included
134
1. The need to determine the wetting state of the core at the end of each coreflood (based on
varying the waterflood salinity and temperature) required that different core samples be
used for each test. Alternatively, the same core plug could be used but reconditioned to
the same initial condition at the start of each experiment.
2. The lack of “fresh” Berea core samples meant that alternative core samples had to be
obtained.
3. The high viscosity of the TAPS crude oil (8.24 cp) interfered with the accurate
measurement of wettability using the Amott-Harvey Method. The observed interference
included (1) “surface coating” of the core plug by oil (during spontaneous displacement
of water by oil) which gives erroneous mass measurement when calculating for the
volume of brine spontaneously displaced; (2) formation of crude oil “bubbles”, by the
spontaneously displaced oil, on the surface of the core (during spontaneous displacement
of oil by water). Adoption of the approach described Morrow (immersing the core in oil
and then back in the brine) resulted in “surface coating” of the core plug which appeared
to aggravate the problem of formation of crude oil “bubbles”.
Based on the forgoing the initial experimental design of the second set of experiments was
modified. The crude oil blend from TAPS was replaced with refined oil (decane). The problem
with using decane was in differentiating produced oil from produced water since both fluids are
colorless. This problem was solved by spiking decane with some TAPS oil. Initial trials at
spiking the decane with oil showed the settling of some substance, suspected to be some of the
heavier components of the TAPS blend, after the spiked decane was left standing for some time.
A further problem was observed when the spiked decane was injected through the core, which
acted as a filter resulting in the formation of a residual filter-cake of the heavier components on
the injection face of the core plug. This resulted in unexpected and erratic increase in pressure
drop across the core plug. It was initially suspected that mixing the decane with the TAPS crude
oil resulted in some form of asphaltene precipitation. However, a static asphaltene precipitation
test using decane showed no asphaltene precipitation with decane. Subsequent reduction in the
ratio of TAPS oil to decane by a trial-and-error process resulted in a significant reduction of this
problem.
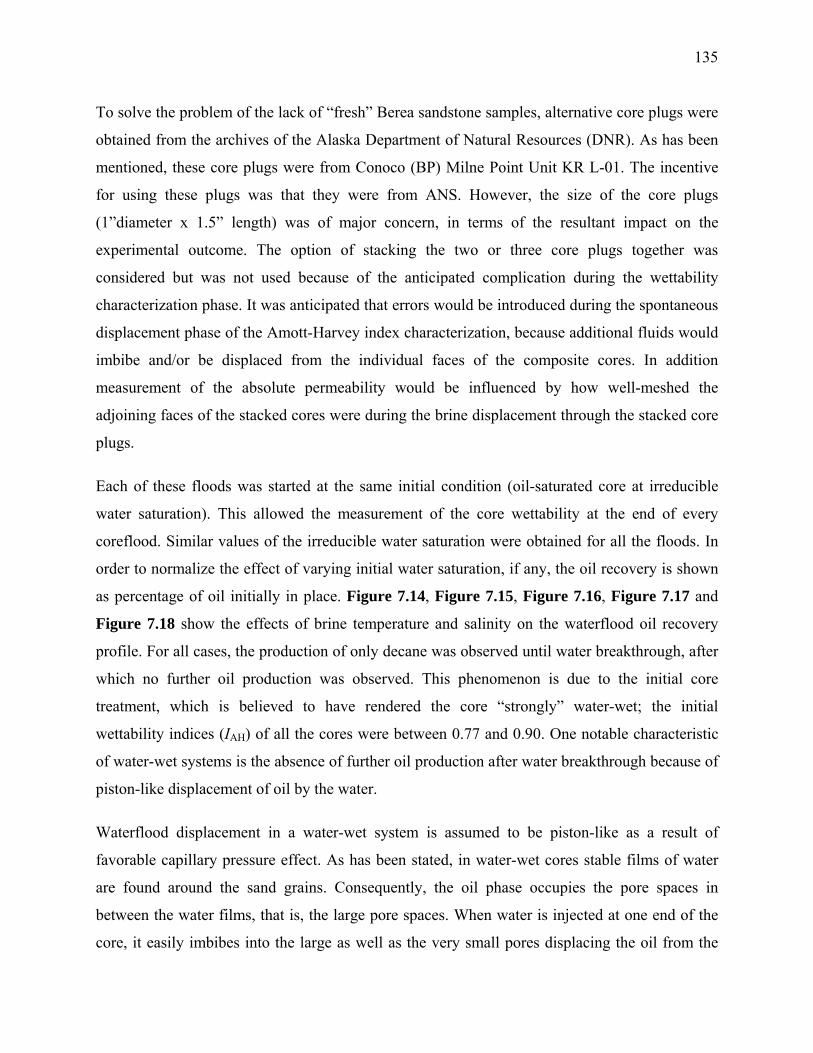
135
To solve the problem of the lack of “fresh” Berea sandstone samples, alternative core plugs were
obtained from the archives of the Alaska Department of Natural Resources (DNR). As has been
mentioned, these core plugs were from Conoco (BP) Milne Point Unit KR L-01. The incentive
for using these plugs was that they were from ANS. However, the size of the core plugs
(1”diameter x 1.5” length) was of major concern, in terms of the resultant impact on the
experimental outcome. The option of stacking the two or three core plugs together was
considered but was not used because of the anticipated complication during the wettability
characterization phase. It was anticipated that errors would be introduced during the spontaneous
displacement phase of the Amott-Harvey index characterization, because additional fluids would
imbibe and/or be displaced from the individual faces of the composite cores. In addition
measurement of the absolute permeability would be influenced by how well-meshed the
adjoining faces of the stacked cores were during the brine displacement through the stacked core
plugs.
Each of these floods was started at the same initial condition (oil-saturated core at irreducible
water saturation). This allowed the measurement of the core wettability at the end of every
coreflood. Similar values of the irreducible water saturation were obtained for all the floods. In
order to normalize the effect of varying initial water saturation, if any, the oil recovery is shown
as percentage of oil initially in place. Figure 7.14, Figure 7.15, Figure 7.16, Figure 7.17 and
Figure 7.18 show the effects of brine temperature and salinity on the waterflood oil recovery
profile. For all cases, the production of only decane was observed until water breakthrough, after
which no further oil production was observed. This phenomenon is due to the initial core
treatment, which is believed to have rendered the core “strongly” water-wet; the initial
wettability indices (IAH) of all the cores were between 0.77 and 0.90. One notable characteristic
of water-wet systems is the absence of further oil production after water breakthrough because of
piston-like displacement of oil by the water.
Waterflood displacement in a water-wet system is assumed to be piston-like as a result of
favorable capillary pressure effect. As has been stated, in water-wet cores stable films of water
are found around the sand grains. Consequently, the oil phase occupies the pore spaces in
between the water films, that is, the large pore spaces. When water is injected at one end of the
core, it easily imbibes into the large as well as the very small pores displacing the oil from the
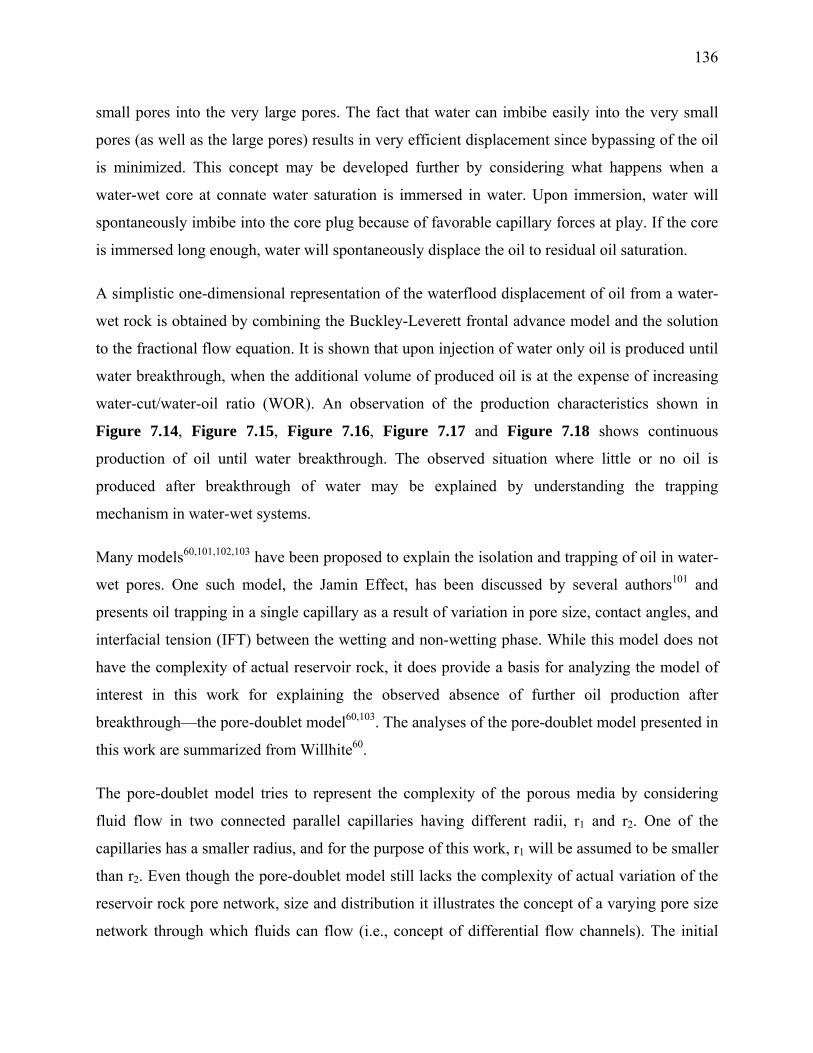
136
small pores into the very large pores. The fact that water can imbibe easily into the very small
pores (as well as the large pores) results in very efficient displacement since bypassing of the oil
is minimized. This concept may be developed further by considering what happens when a
water-wet core at connate water saturation is immersed in water. Upon immersion, water will
spontaneously imbibe into the core plug because of favorable capillary forces at play. If the core
is immersed long enough, water will spontaneously displace the oil to residual oil saturation.
A simplistic one-dimensional representation of the waterflood displacement of oil from a water-
wet rock is obtained by combining the Buckley-Leverett frontal advance model and the solution
to the fractional flow equation. It is shown that upon injection of water only oil is produced until
water breakthrough, when the additional volume of produced oil is at the expense of increasing
water-cut/water-oil ratio (WOR). An observation of the production characteristics shown in
Figure 7.14, Figure 7.15, Figure 7.16, Figure 7.17 and Figure 7.18 shows continuous
production of oil until water breakthrough. The observed situation where little or no oil is
produced after breakthrough of water may be explained by understanding the trapping
mechanism in water-wet systems.
Many models60,101,102,103 have been proposed to explain the isolation and trapping of oil in water-
wet pores. One such model, the Jamin Effect, has been discussed by several authors101 and
presents oil trapping in a single capillary as a result of variation in pore size, contact angles, and
interfacial tension (IFT) between the wetting and non-wetting phase. While this model does not
have the complexity of actual reservoir rock, it does provide a basis for analyzing the model of
interest in this work for explaining the observed absence of further oil production after
breakthrough—the pore-doublet model60,103. The analyses of the pore-doublet model presented in
this work are summarized from Willhite60.
The pore-doublet model tries to represent the complexity of the porous media by considering
fluid flow in two connected parallel capillaries having different radii, r1 and r2. One of the
capillaries has a smaller radius, and for the purpose of this work, r1 will be assumed to be smaller
than r2. Even though the pore-doublet model still lacks the complexity of actual variation of the
reservoir rock pore network, size and distribution it illustrates the concept of a varying pore size
network through which fluids can flow (i.e., concept of differential flow channels). The initial
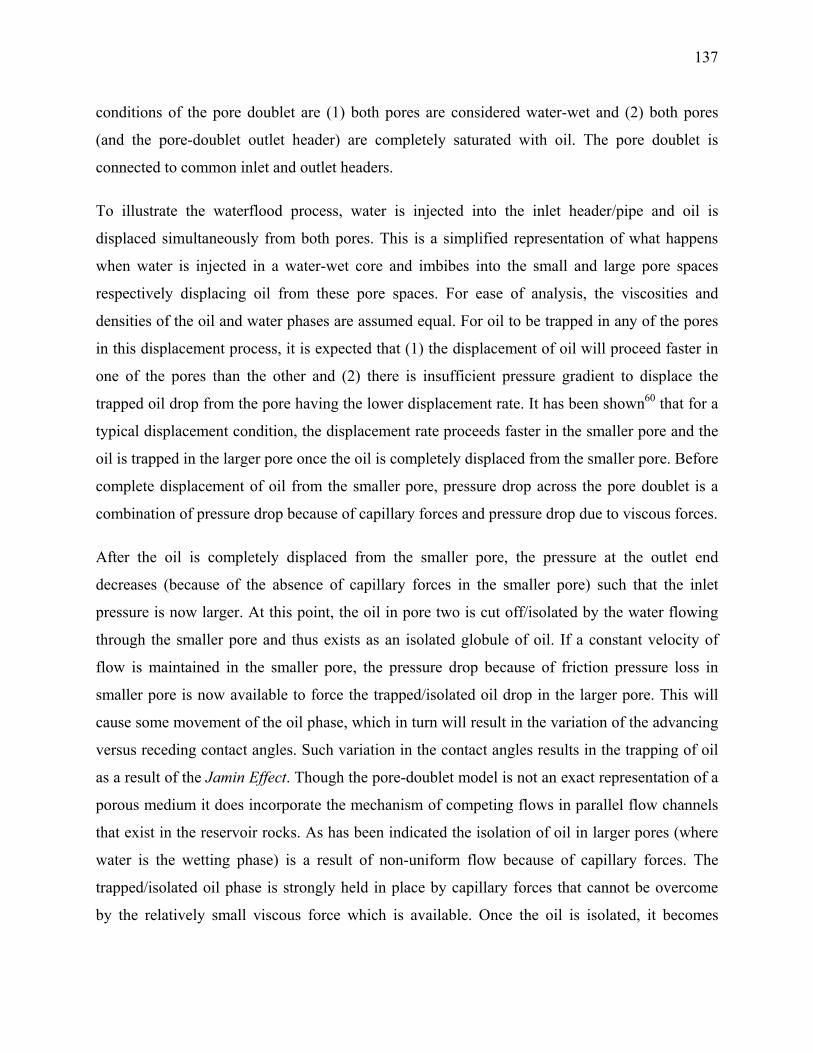
137
conditions of the pore doublet are (1) both pores are considered water-wet and (2) both pores
(and the pore-doublet outlet header) are completely saturated with oil. The pore doublet is
connected to common inlet and outlet headers.
To illustrate the waterflood process, water is injected into the inlet header/pipe and oil is
displaced simultaneously from both pores. This is a simplified representation of what happens
when water is injected in a water-wet core and imbibes into the small and large pore spaces
respectively displacing oil from these pore spaces. For ease of analysis, the viscosities and
densities of the oil and water phases are assumed equal. For oil to be trapped in any of the pores
in this displacement process, it is expected that (1) the displacement of oil will proceed faster in
one of the pores than the other and (2) there is insufficient pressure gradient to displace the
trapped oil drop from the pore having the lower displacement rate. It has been shown60 that for a
typical displacement condition, the displacement rate proceeds faster in the smaller pore and the
oil is trapped in the larger pore once the oil is completely displaced from the smaller pore. Before
complete displacement of oil from the smaller pore, pressure drop across the pore doublet is a
combination of pressure drop because of capillary forces and pressure drop due to viscous forces.
After the oil is completely displaced from the smaller pore, the pressure at the outlet end
decreases (because of the absence of capillary forces in the smaller pore) such that the inlet
pressure is now larger. At this point, the oil in pore two is cut off/isolated by the water flowing
through the smaller pore and thus exists as an isolated globule of oil. If a constant velocity of
flow is maintained in the smaller pore, the pressure drop because of friction pressure loss in
smaller pore is now available to force the trapped/isolated oil drop in the larger pore. This will
cause some movement of the oil phase, which in turn will result in the variation of the advancing
versus receding contact angles. Such variation in the contact angles results in the trapping of oil
as a result of the Jamin Effect. Though the pore-doublet model is not an exact representation of a
porous medium it does incorporate the mechanism of competing flows in parallel flow channels
that exist in the reservoir rocks. As has been indicated the isolation of oil in larger pores (where
water is the wetting phase) is a result of non-uniform flow because of capillary forces. The
trapped/isolated oil phase is strongly held in place by capillary forces that cannot be overcome
by the relatively small viscous force which is available. Once the oil is isolated, it becomes
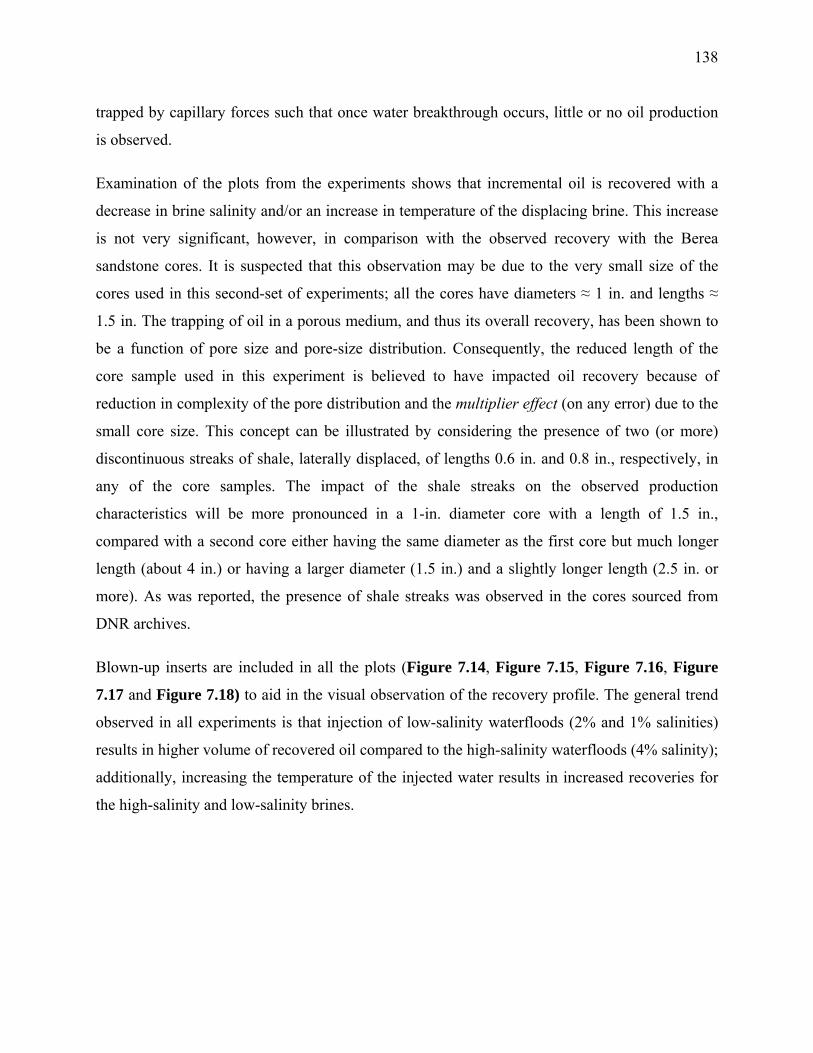
138
trapped by capillary forces such that once water breakthrough occurs, little or no oil production
is observed.
Examination of the plots from the experiments shows that incremental oil is recovered with a
decrease in brine salinity and/or an increase in temperature of the displacing brine. This increase
is not very significant, however, in comparison with the observed recovery with the Berea
sandstone cores. It is suspected that this observation may be due to the very small size of the
cores used in this second-set of experiments; all the cores have diameters ≈ 1 in. and lengths ≈
1.5 in. The trapping of oil in a porous medium, and thus its overall recovery, has been shown to
be a function of pore size and pore-size distribution. Consequently, the reduced length of the
core sample used in this experiment is believed to have impacted oil recovery because of
reduction in complexity of the pore distribution and the multiplier effect (on any error) due to the
small core size. This concept can be illustrated by considering the presence of two (or more)
discontinuous streaks of shale, laterally displaced, of lengths 0.6 in. and 0.8 in., respectively, in
any of the core samples. The impact of the shale streaks on the observed production
characteristics will be more pronounced in a 1-in. diameter core with a length of 1.5 in.,
compared with a second core either having the same diameter as the first core but much longer
length (about 4 in.) or having a larger diameter (1.5 in.) and a slightly longer length (2.5 in. or
more). As was reported, the presence of shale streaks was observed in the cores sourced from
DNR archives.
Blown-up inserts are included in all the plots (Figure 7.14, Figure 7.15, Figure 7.16, Figure
7.17 and Figure 7.18) to aid in the visual observation of the recovery profile. The general trend
observed in all experiments is that injection of low-salinity waterfloods (2% and 1% salinities)
results in higher volume of recovered oil compared to the high-salinity waterfloods (4% salinity);
additionally, increasing the temperature of the injected water results in increased recoveries for
the high-salinity and low-salinity brines.
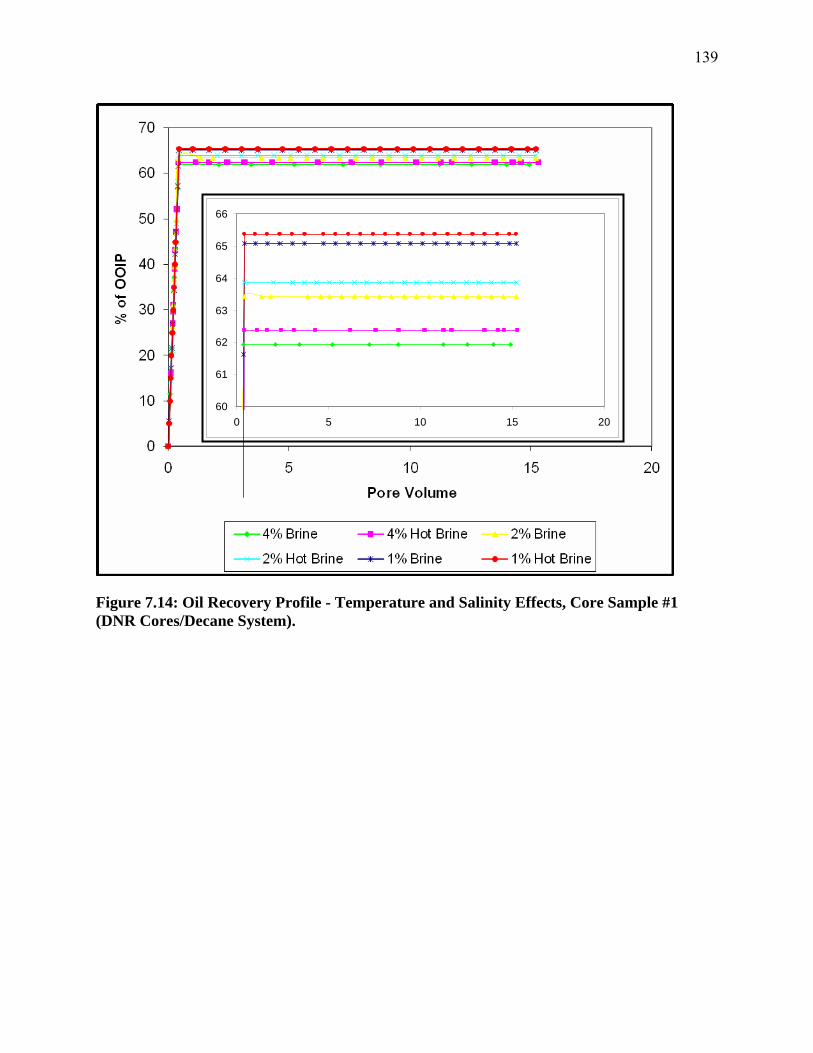
139
Figure 7.14: Oil Recovery Profile - Temperature and Salinity Effects, Core Sample #1 (DNR Cores/Decane System).
60
61
62
63
64
65
66
0 5 10 15 20

140
Figure 7.15: Oil Recovery Profile - Temperature and Salinity Effects, Core Sample #2 (DNR Core/Decane System).
64
65
66
67
68
69
0 2 4 6 8 10 12 14
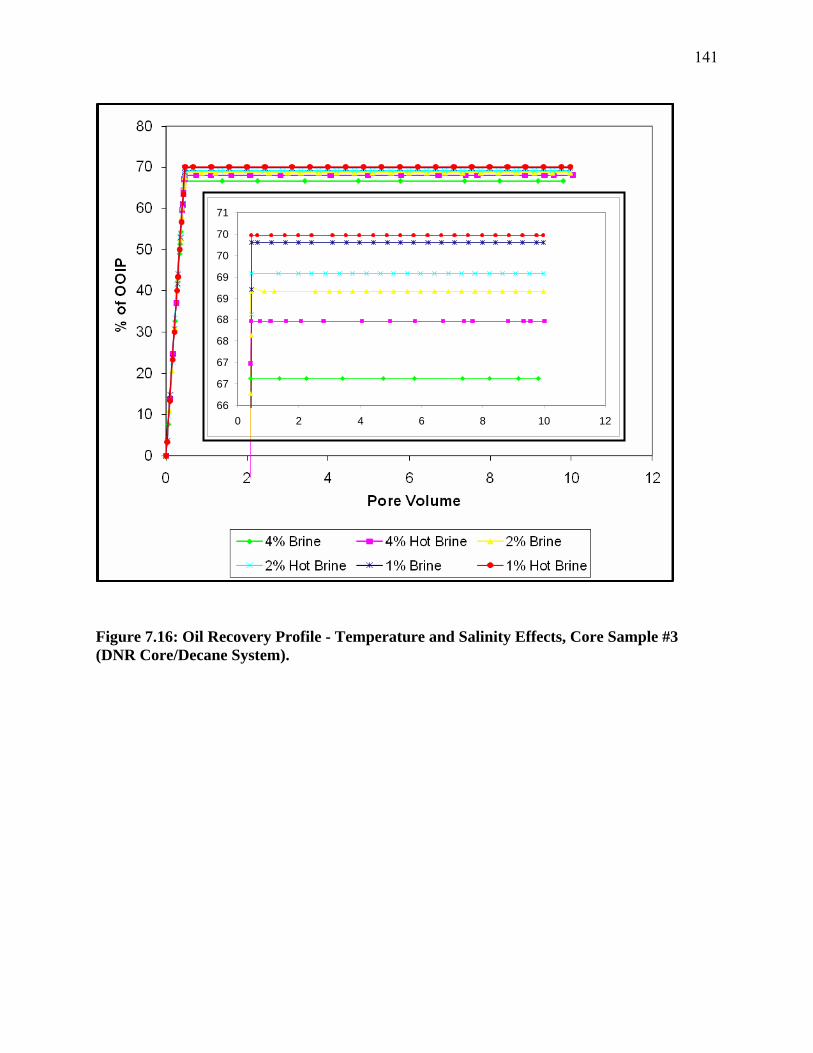
141
Figure 7.16: Oil Recovery Profile - Temperature and Salinity Effects, Core Sample #3 (DNR Core/Decane System).
66
67
67
68
68
69
69
70
70
71
0 2 4 6 8 10 12
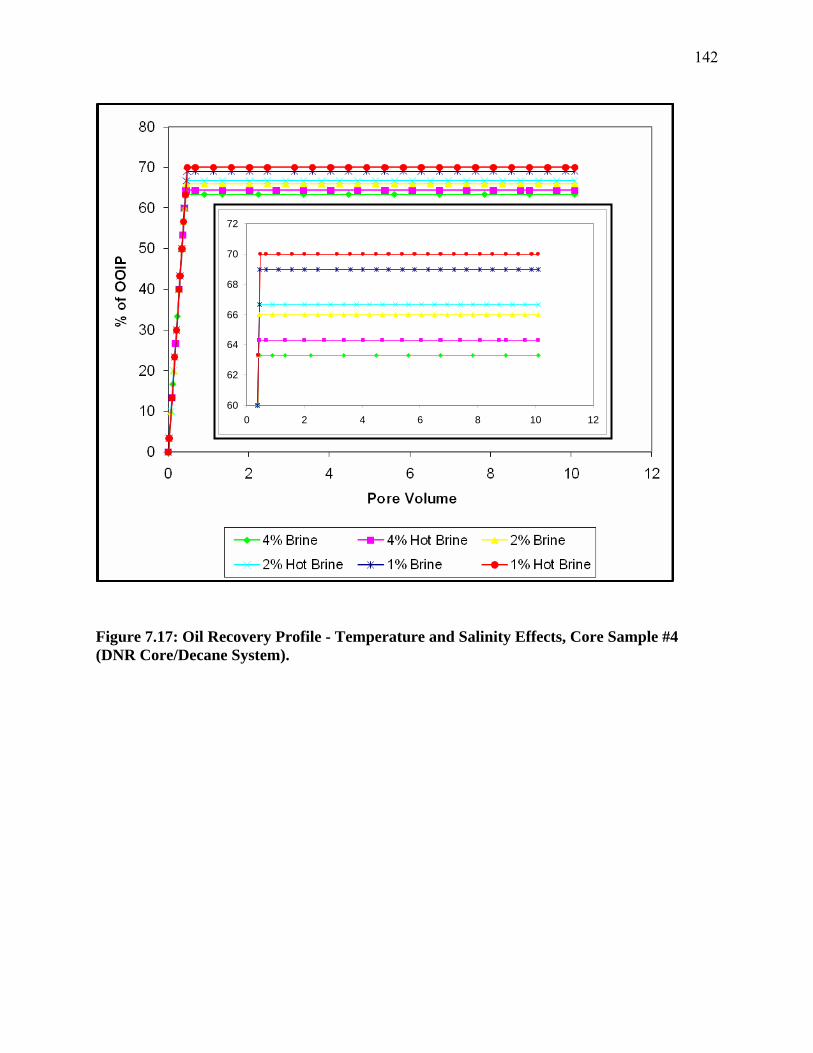
142
Figure 7.17: Oil Recovery Profile - Temperature and Salinity Effects, Core Sample #4 (DNR Core/Decane System).
60
62
64
66
68
70
72
0 2 4 6 8 10 12
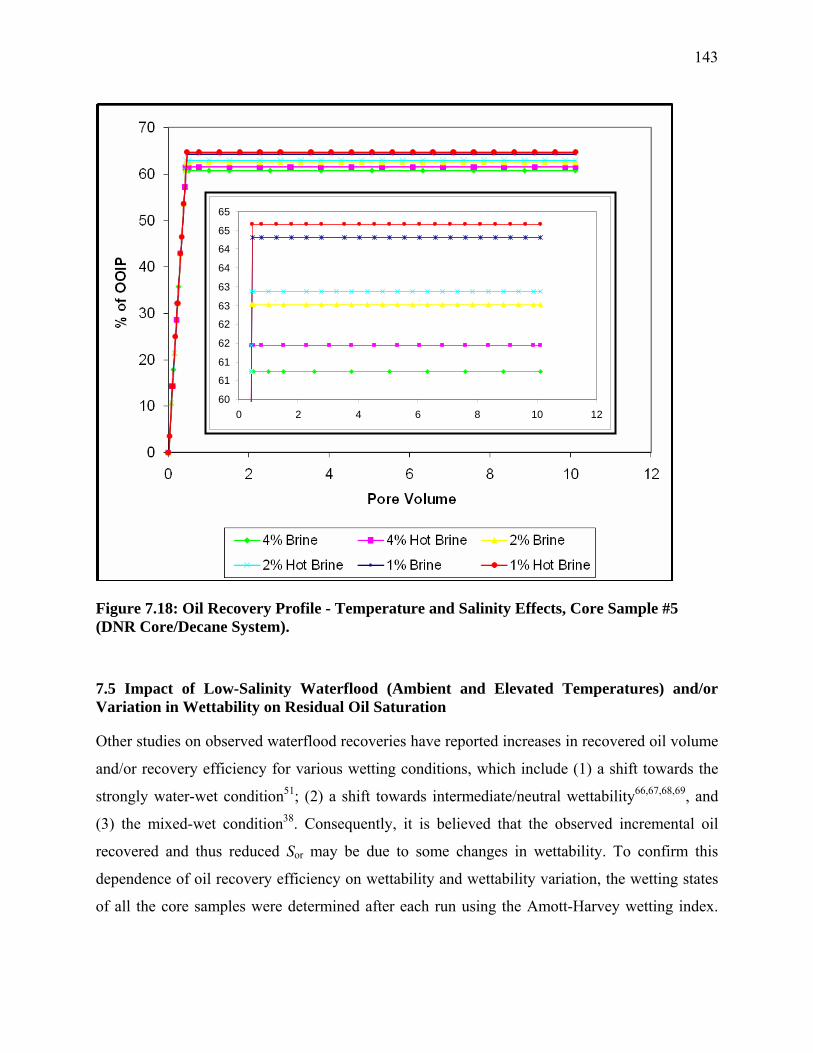
143
Figure 7.18: Oil Recovery Profile - Temperature and Salinity Effects, Core Sample #5 (DNR Core/Decane System).
7.5 Impact of Low-Salinity Waterflood (Ambient and Elevated Temperatures) and/or Variation in Wettability on Residual Oil Saturation
Other studies on observed waterflood recoveries have reported increases in recovered oil volume
and/or recovery efficiency for various wetting conditions, which include (1) a shift towards the
strongly water-wet condition51; (2) a shift towards intermediate/neutral wettability66,67,68,69, and
(3) the mixed-wet condition38. Consequently, it is believed that the observed incremental oil
recovered and thus reduced Sor may be due to some changes in wettability. To confirm this
dependence of oil recovery efficiency on wettability and wettability variation, the wetting states
of all the core samples were determined after each run using the Amott-Harvey wetting index.
60
61
61
62
62
63
63
64
64
65
65
0 2 4 6 8 10 12
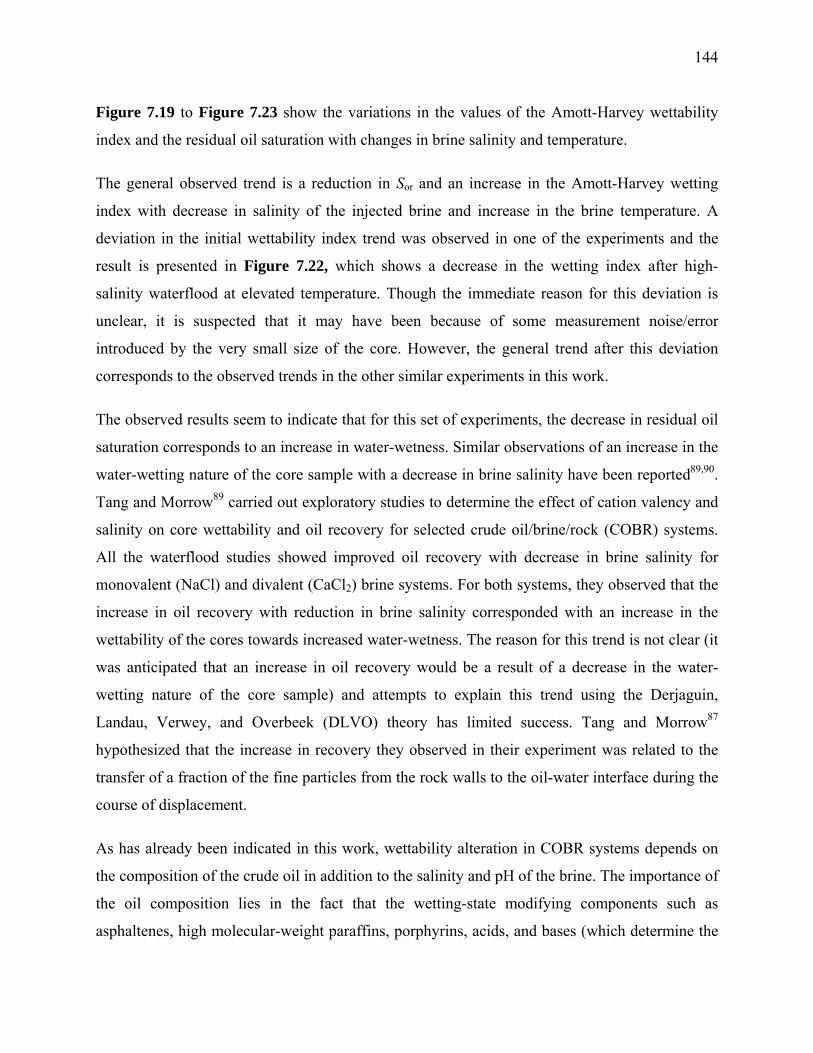
144
Figure 7.19 to Figure 7.23 show the variations in the values of the Amott-Harvey wettability
index and the residual oil saturation with changes in brine salinity and temperature.
The general observed trend is a reduction in Sor and an increase in the Amott-Harvey wetting
index with decrease in salinity of the injected brine and increase in the brine temperature. A
deviation in the initial wettability index trend was observed in one of the experiments and the
result is presented in Figure 7.22, which shows a decrease in the wetting index after high-
salinity waterflood at elevated temperature. Though the immediate reason for this deviation is
unclear, it is suspected that it may have been because of some measurement noise/error
introduced by the very small size of the core. However, the general trend after this deviation
corresponds to the observed trends in the other similar experiments in this work.
The observed results seem to indicate that for this set of experiments, the decrease in residual oil
saturation corresponds to an increase in water-wetness. Similar observations of an increase in the
water-wetting nature of the core sample with a decrease in brine salinity have been reported89,90.
Tang and Morrow89 carried out exploratory studies to determine the effect of cation valency and
salinity on core wettability and oil recovery for selected crude oil/brine/rock (COBR) systems.
All the waterflood studies showed improved oil recovery with decrease in brine salinity for
monovalent (NaCl) and divalent (CaCl2) brine systems. For both systems, they observed that the
increase in oil recovery with reduction in brine salinity corresponded with an increase in the
wettability of the cores towards increased water-wetness. The reason for this trend is not clear (it
was anticipated that an increase in oil recovery would be a result of a decrease in the water-
wetting nature of the core sample) and attempts to explain this trend using the Derjaguin,
Landau, Verwey, and Overbeek (DLVO) theory has limited success. Tang and Morrow87
hypothesized that the increase in recovery they observed in their experiment was related to the
transfer of a fraction of the fine particles from the rock walls to the oil-water interface during the
course of displacement.
As has already been indicated in this work, wettability alteration in COBR systems depends on
the composition of the crude oil in addition to the salinity and pH of the brine. The importance of
the oil composition lies in the fact that the wetting-state modifying components such as
asphaltenes, high molecular-weight paraffins, porphyrins, acids, and bases (which determine the
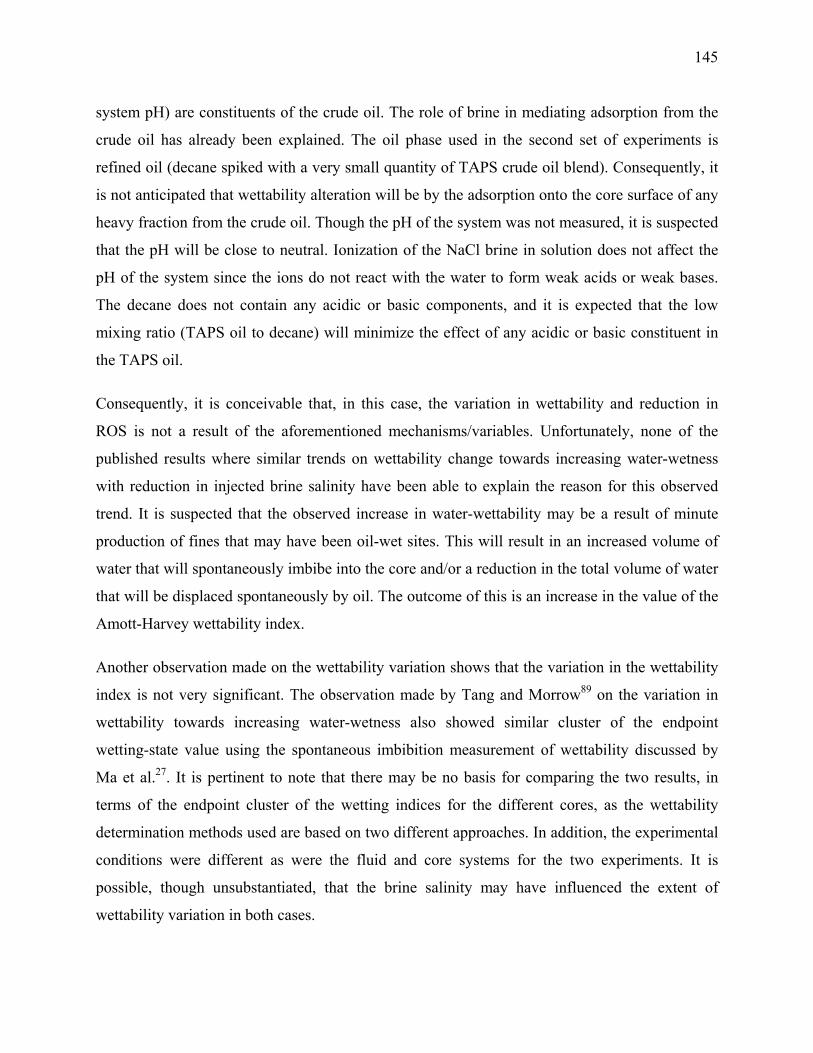
145
system pH) are constituents of the crude oil. The role of brine in mediating adsorption from the
crude oil has already been explained. The oil phase used in the second set of experiments is
refined oil (decane spiked with a very small quantity of TAPS crude oil blend). Consequently, it
is not anticipated that wettability alteration will be by the adsorption onto the core surface of any
heavy fraction from the crude oil. Though the pH of the system was not measured, it is suspected
that the pH will be close to neutral. Ionization of the NaCl brine in solution does not affect the
pH of the system since the ions do not react with the water to form weak acids or weak bases.
The decane does not contain any acidic or basic components, and it is expected that the low
mixing ratio (TAPS oil to decane) will minimize the effect of any acidic or basic constituent in
the TAPS oil.
Consequently, it is conceivable that, in this case, the variation in wettability and reduction in
ROS is not a result of the aforementioned mechanisms/variables. Unfortunately, none of the
published results where similar trends on wettability change towards increasing water-wetness
with reduction in injected brine salinity have been able to explain the reason for this observed
trend. It is suspected that the observed increase in water-wettability may be a result of minute
production of fines that may have been oil-wet sites. This will result in an increased volume of
water that will spontaneously imbibe into the core and/or a reduction in the total volume of water
that will be displaced spontaneously by oil. The outcome of this is an increase in the value of the
Amott-Harvey wettability index.
Another observation made on the wettability variation shows that the variation in the wettability
index is not very significant. The observation made by Tang and Morrow89 on the variation in
wettability towards increasing water-wetness also showed similar cluster of the endpoint
wetting-state value using the spontaneous imbibition measurement of wettability discussed by
Ma et al.27. It is pertinent to note that there may be no basis for comparing the two results, in
terms of the endpoint cluster of the wetting indices for the different cores, as the wettability
determination methods used are based on two different approaches. In addition, the experimental
conditions were different as were the fluid and core systems for the two experiments. It is
possible, though unsubstantiated, that the brine salinity may have influenced the extent of
wettability variation in both cases.
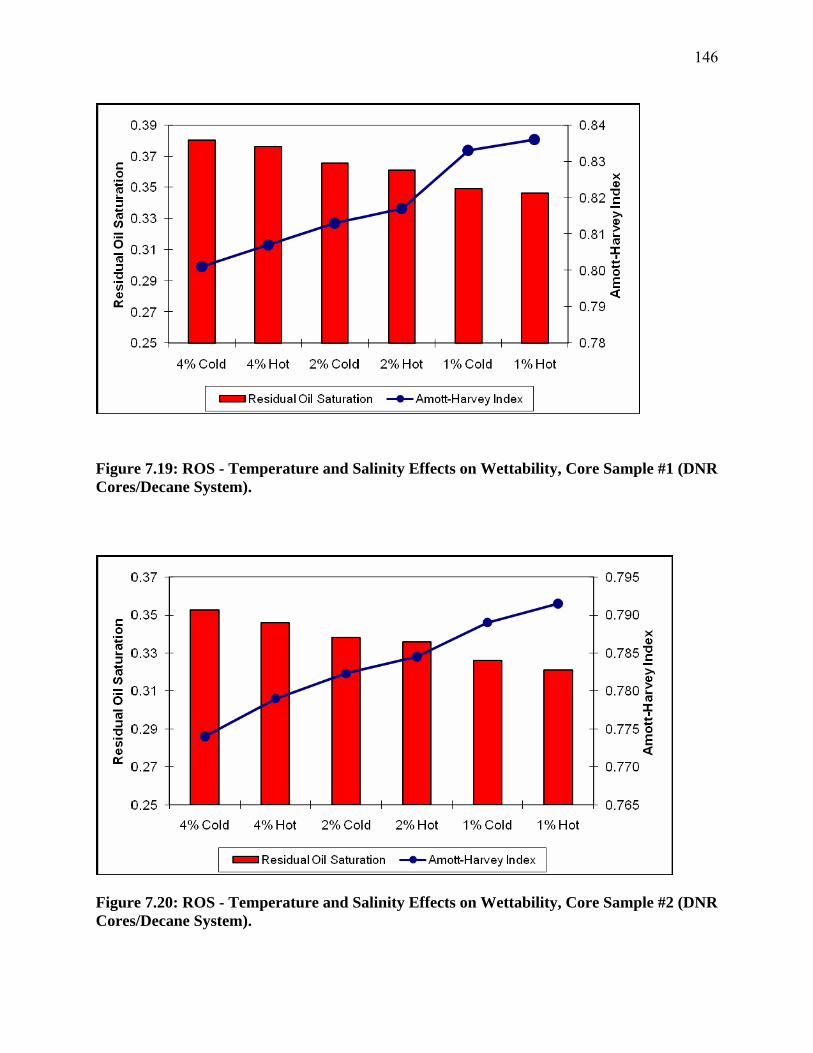
146
Figure 7.19: ROS - Temperature and Salinity Effects on Wettability, Core Sample #1 (DNR Cores/Decane System).
Figure 7.20: ROS - Temperature and Salinity Effects on Wettability, Core Sample #2 (DNR Cores/Decane System).
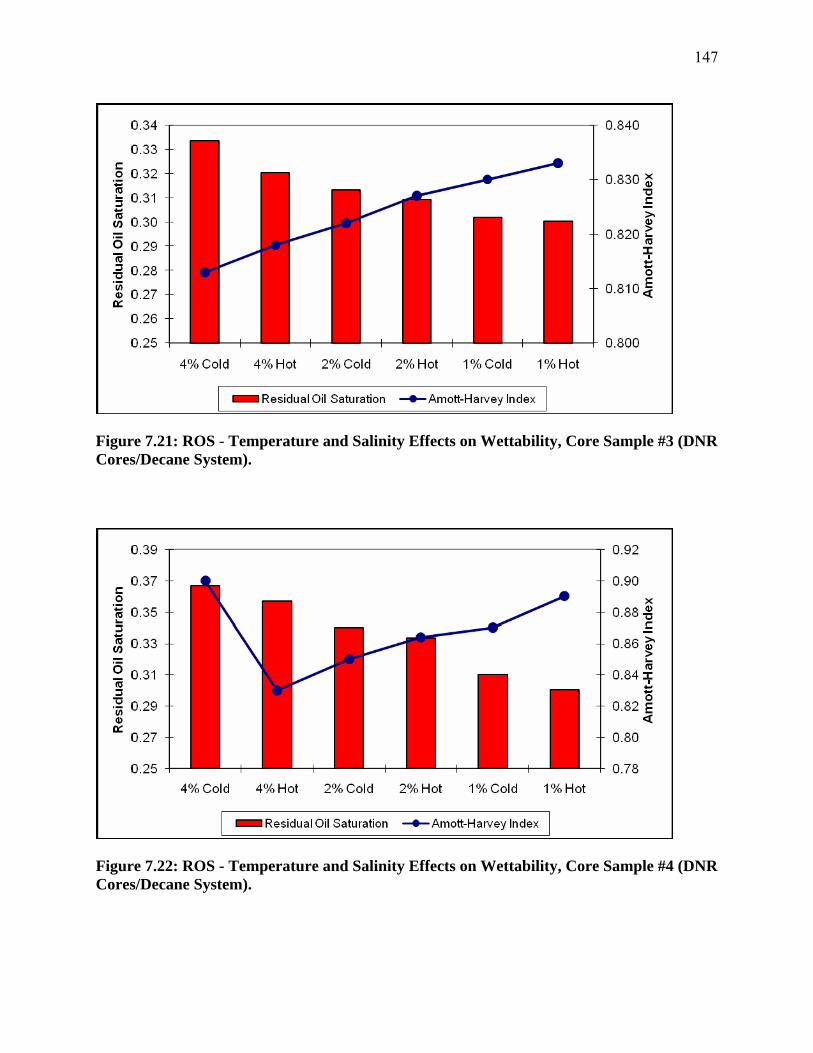
147
Figure 7.21: ROS - Temperature and Salinity Effects on Wettability, Core Sample #3 (DNR Cores/Decane System).
Figure 7.22: ROS - Temperature and Salinity Effects on Wettability, Core Sample #4 (DNR Cores/Decane System).
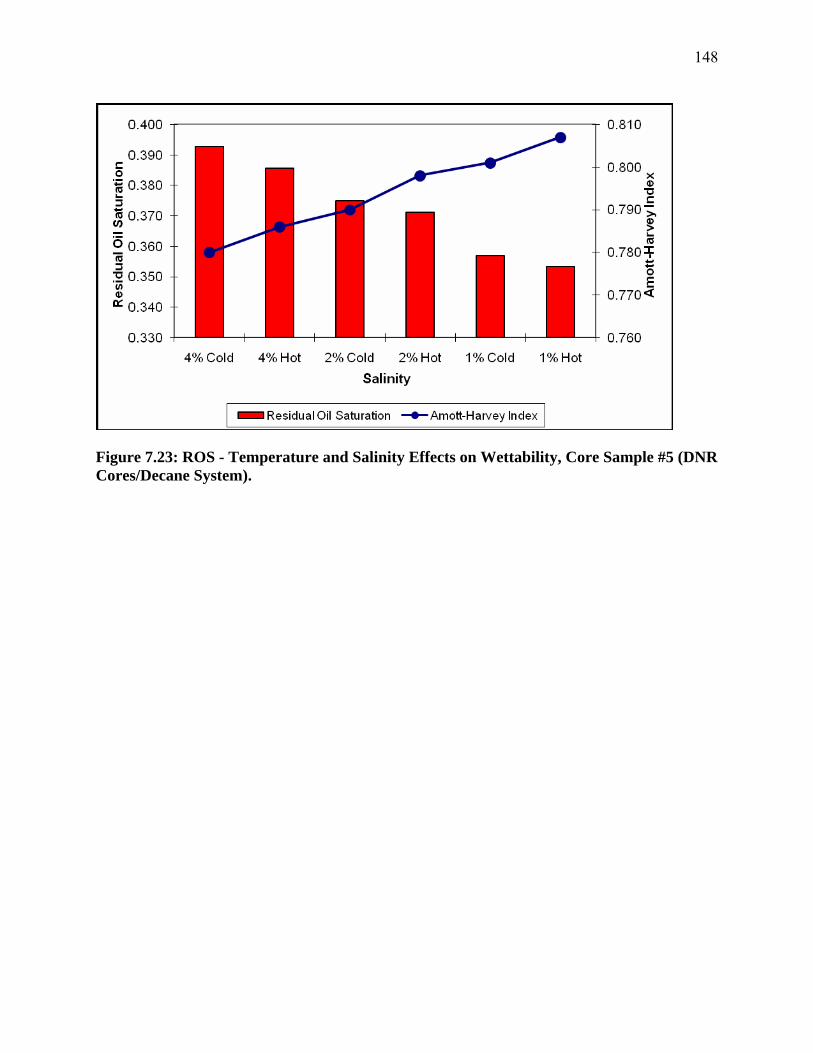
148
Figure 7.23: ROS - Temperature and Salinity Effects on Wettability, Core Sample #5 (DNR Cores/Decane System).

149
CHAPTER 8: Results and Discussion – Representative Cores
In all the three sets of experiments, the potential of the low-salinity brine injection in secondary
oil recovery was examined. For all three sets, an attempt was made to commence all the
coreflood experiments at the similar initial condition; that is, the cores were at initial oil
saturation (Soi) and interstitial/connate water saturation (Swi). An attempt is also made to explain
any observed increase in recovered oil volume and reduction in residual oil saturation (Sor) in
terms of change in wettability using the Amott-Harvey wettability index. The connate water
salinity of the all the set of experiments was kept constant at a “high” salinity of 22,000 TDS in
order to mimic the reservoir saturation conditions.
In most of the experiments, it is observed that there was an increase in oil recovery with a
decrease in the salinity of the injected brine. Thus, more oil is recovered when brine of a lower
salinity is injected. It is encouraging to observe, in most of the experiments, a more or less
consistent trend.
For the first sets of experiments, (i.e., on new [clean] cores), waterfloods were carried out using
all the three brines viz. 22,000 TDS, 11,000 TDS and 5,500 TDS. After every waterflood, the
Amott-Harvey wettability index and residual oil saturation value were calculated. For the second
set of experiments, the cores used were the same cores on which previously the first set of
experiments had been carried out. But before using these cores for the second set of experiments,
these cores were oil aged for 21 days. Similar to the first set of experiments, waterfloods were
carried out on these oil aged cores using all the three brines viz. 22,000 TDS, 11,000 TDS and
5,500 TDS. After every waterflood, the Amott-Harvey wettability index and residual oil
saturation value were calculated.
For the third set, experiments were carried out on new (clean) core samples. As stated earlier,
waterfloodings were carried out using 22,000 TDS salinity brine and ANS lake water. Similar to
the first two sets of experiments, after every waterflood the Amott-Harvey wettability index and
residual oil saturation value were calculated.
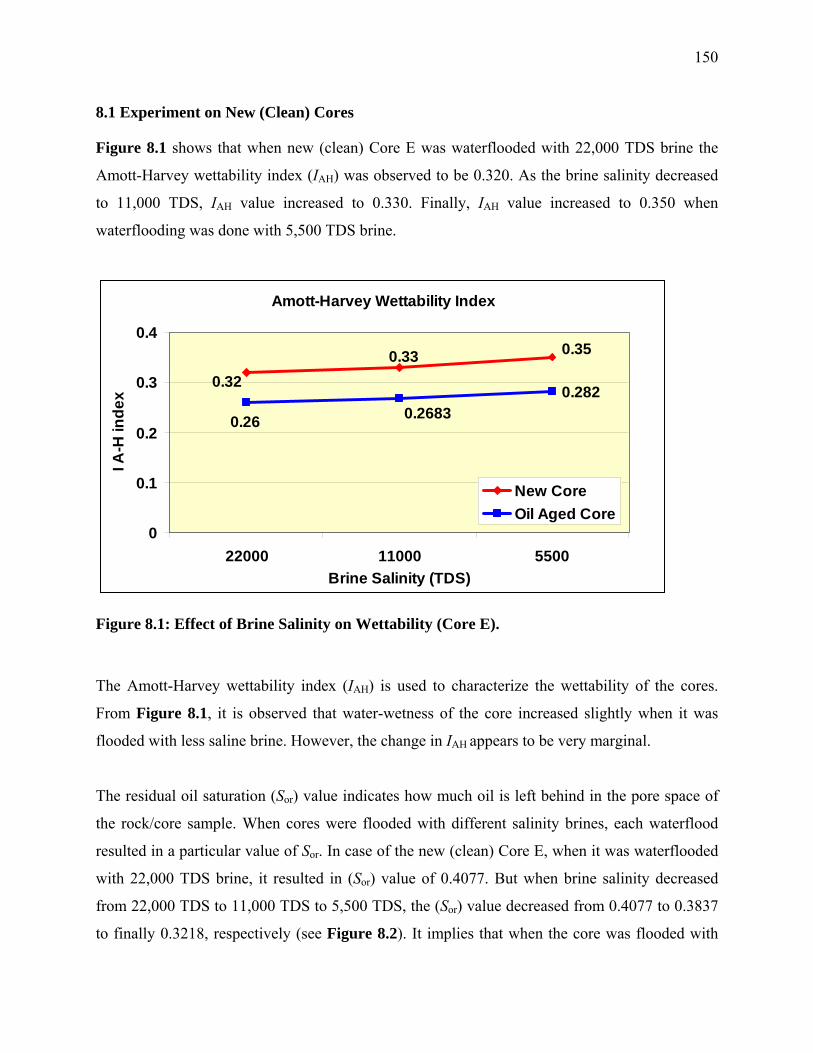
150
8.1 Experiment on New (Clean) Cores
Figure 8.1 shows that when new (clean) Core E was waterflooded with 22,000 TDS brine the
Amott-Harvey wettability index (IAH) was observed to be 0.320. As the brine salinity decreased
to 11,000 TDS, IAH value increased to 0.330. Finally, IAH value increased to 0.350 when
waterflooding was done with 5,500 TDS brine.
Amott-Harvey Wettability Index
0.2820.320.33 0.35
0.26 0.2683
0
0.1
0.2
0.3
0.4
22000 11000 5500Brine Salinity (TDS)
I A-H
inde
x
New CoreOil Aged Core
Figure 8.1: Effect of Brine Salinity on Wettability (Core E).
The Amott-Harvey wettability index (IAH) is used to characterize the wettability of the cores.
From Figure 8.1, it is observed that water-wetness of the core increased slightly when it was
flooded with less saline brine. However, the change in IAH appears to be very marginal.
The residual oil saturation (Sor) value indicates how much oil is left behind in the pore space of
the rock/core sample. When cores were flooded with different salinity brines, each waterflood
resulted in a particular value of Sor. In case of the new (clean) Core E, when it was waterflooded
with 22,000 TDS brine, it resulted in (Sor) value of 0.4077. But when brine salinity decreased
from 22,000 TDS to 11,000 TDS to 5,500 TDS, the (Sor) value decreased from 0.4077 to 0.3837
to finally 0.3218, respectively (see Figure 8.2). It implies that when the core was flooded with
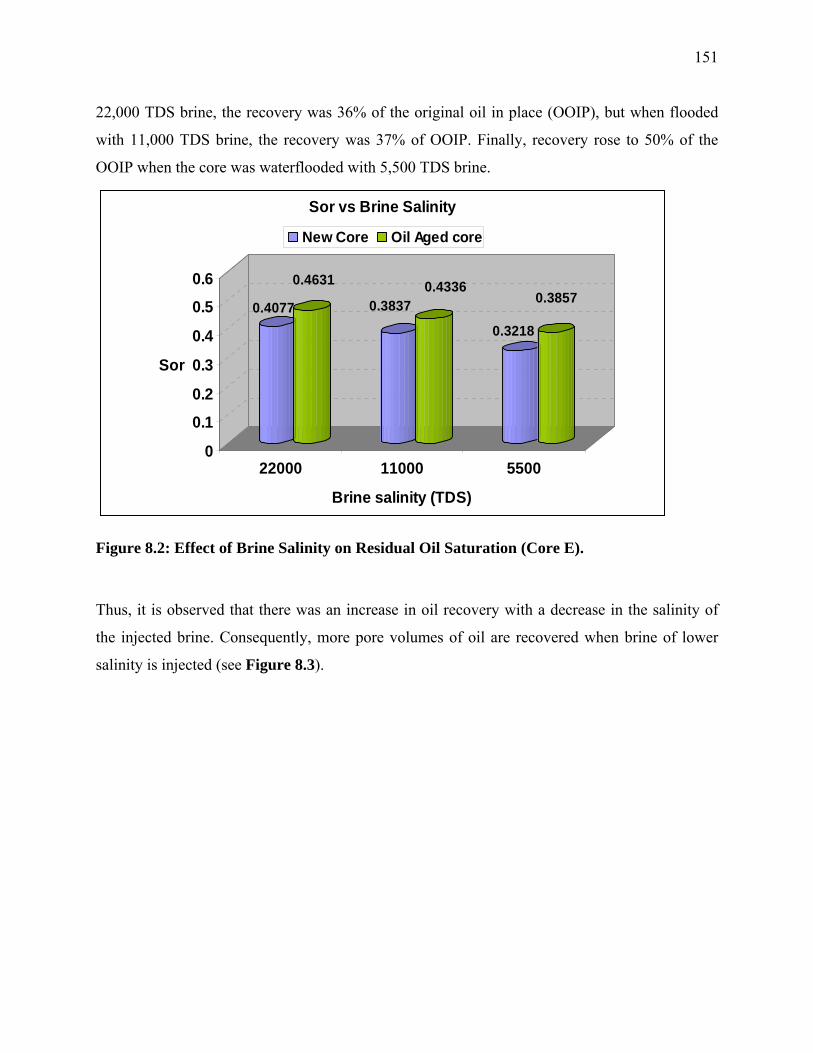
151
22,000 TDS brine, the recovery was 36% of the original oil in place (OOIP), but when flooded
with 11,000 TDS brine, the recovery was 37% of OOIP. Finally, recovery rose to 50% of the
OOIP when the core was waterflooded with 5,500 TDS brine.
0.4077
0.4631
0.38370.4336
0.3218
0.3857
0
0.1
0.2
0.3
0.4
0.5
0.6
Sor
22000 11000 5500
Brine salinity (TDS)
Sor vs Brine Salinity
New Core Oil Aged core
Figure 8.2: Effect of Brine Salinity on Residual Oil Saturation (Core E).
Thus, it is observed that there was an increase in oil recovery with a decrease in the salinity of
the injected brine. Consequently, more pore volumes of oil are recovered when brine of lower
salinity is injected (see Figure 8.3).
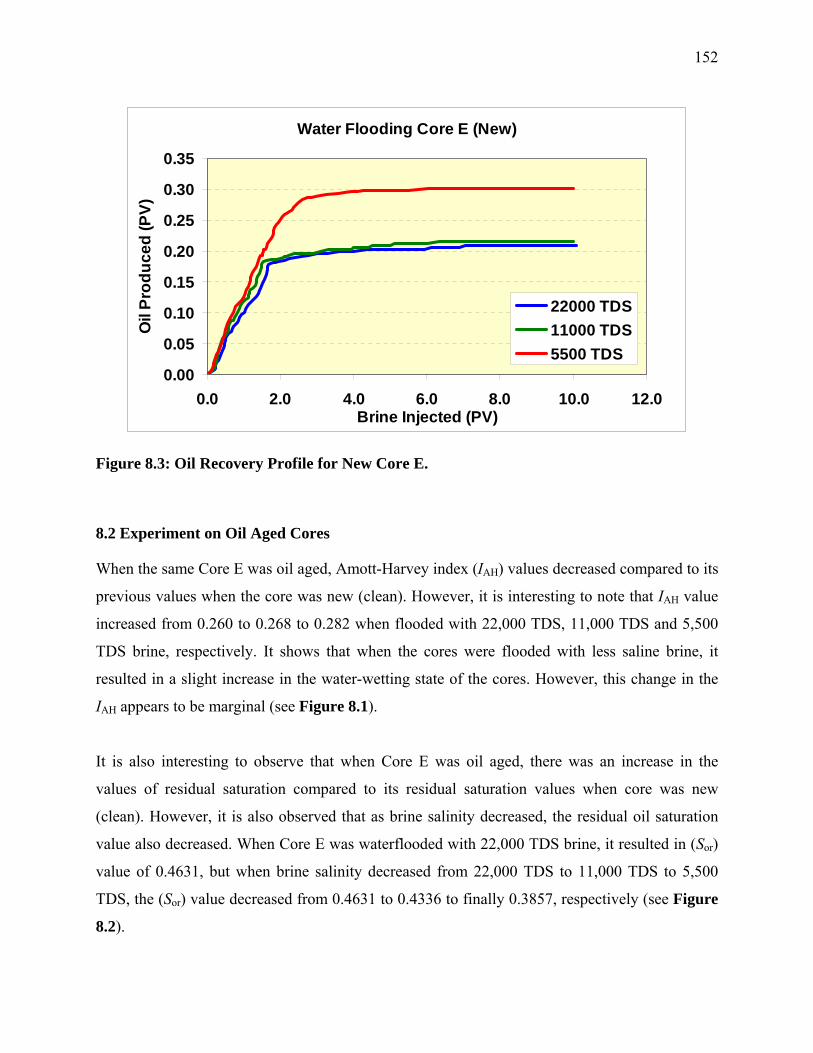
152
Water Flooding Core E (New)
0.00
0.05
0.10
0.15
0.20
0.25
0.30
0.35
0.0 2.0 4.0 6.0 8.0 10.0 12.0Brine Injected (PV)
Oil
Prod
uced
(PV)
22000 TDS11000 TDS5500 TDS
Figure 8.3: Oil Recovery Profile for New Core E.
8.2 Experiment on Oil Aged Cores
When the same Core E was oil aged, Amott-Harvey index (IAH) values decreased compared to its
previous values when the core was new (clean). However, it is interesting to note that IAH value
increased from 0.260 to 0.268 to 0.282 when flooded with 22,000 TDS, 11,000 TDS and 5,500
TDS brine, respectively. It shows that when the cores were flooded with less saline brine, it
resulted in a slight increase in the water-wetting state of the cores. However, this change in the
IAH appears to be marginal (see Figure 8.1).
It is also interesting to observe that when Core E was oil aged, there was an increase in the
values of residual saturation compared to its residual saturation values when core was new
(clean). However, it is also observed that as brine salinity decreased, the residual oil saturation
value also decreased. When Core E was waterflooded with 22,000 TDS brine, it resulted in (Sor)
value of 0.4631, but when brine salinity decreased from 22,000 TDS to 11,000 TDS to 5,500
TDS, the (Sor) value decreased from 0.4631 to 0.4336 to finally 0.3857, respectively (see Figure
8.2).
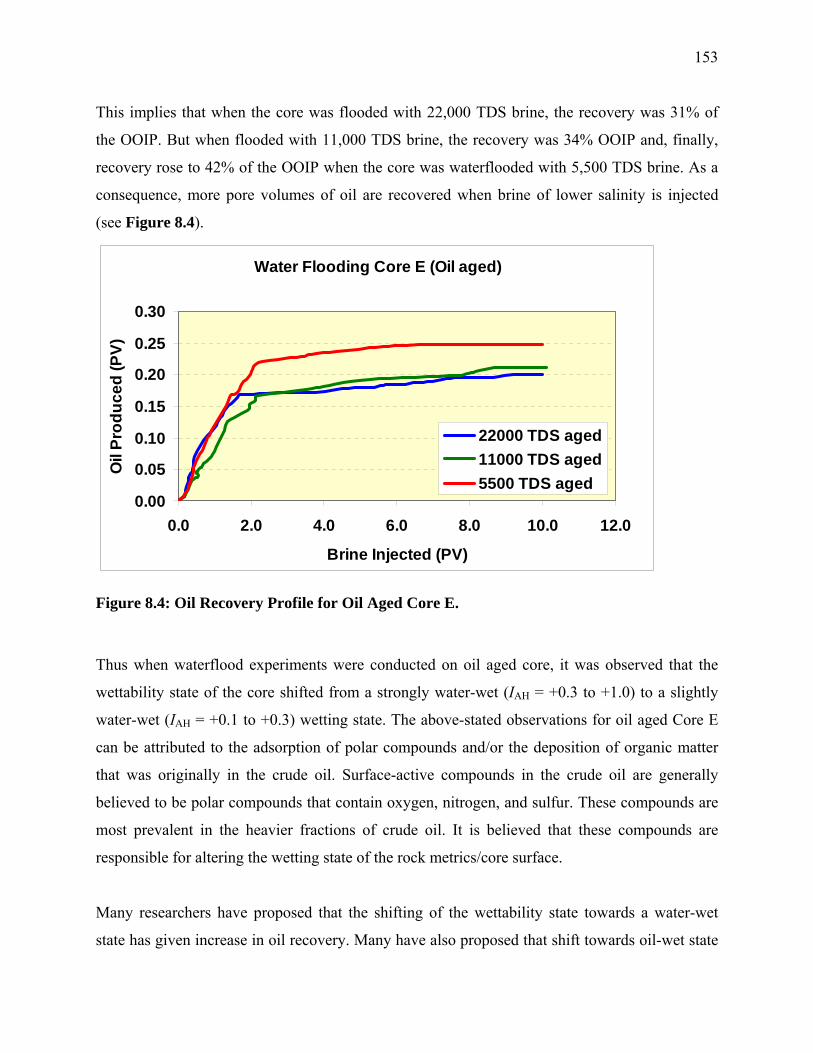
153
This implies that when the core was flooded with 22,000 TDS brine, the recovery was 31% of
the OOIP. But when flooded with 11,000 TDS brine, the recovery was 34% OOIP and, finally,
recovery rose to 42% of the OOIP when the core was waterflooded with 5,500 TDS brine. As a
consequence, more pore volumes of oil are recovered when brine of lower salinity is injected
(see Figure 8.4).
Water Flooding Core E (Oil aged)
0.00
0.05
0.10
0.15
0.20
0.25
0.30
0.0 2.0 4.0 6.0 8.0 10.0 12.0
Brine Injected (PV)
Oil
Prod
uced
(PV)
22000 TDS aged11000 TDS aged5500 TDS aged
Figure 8.4: Oil Recovery Profile for Oil Aged Core E.
Thus when waterflood experiments were conducted on oil aged core, it was observed that the
wettability state of the core shifted from a strongly water-wet (IAH = +0.3 to +1.0) to a slightly
water-wet (IAH = +0.1 to +0.3) wetting state. The above-stated observations for oil aged Core E
can be attributed to the adsorption of polar compounds and/or the deposition of organic matter
that was originally in the crude oil. Surface-active compounds in the crude oil are generally
believed to be polar compounds that contain oxygen, nitrogen, and sulfur. These compounds are
most prevalent in the heavier fractions of crude oil. It is believed that these compounds are
responsible for altering the wetting state of the rock metrics/core surface.
Many researchers have proposed that the shifting of the wettability state towards a water-wet
state has given increase in oil recovery. Many have also proposed that shift towards oil-wet state
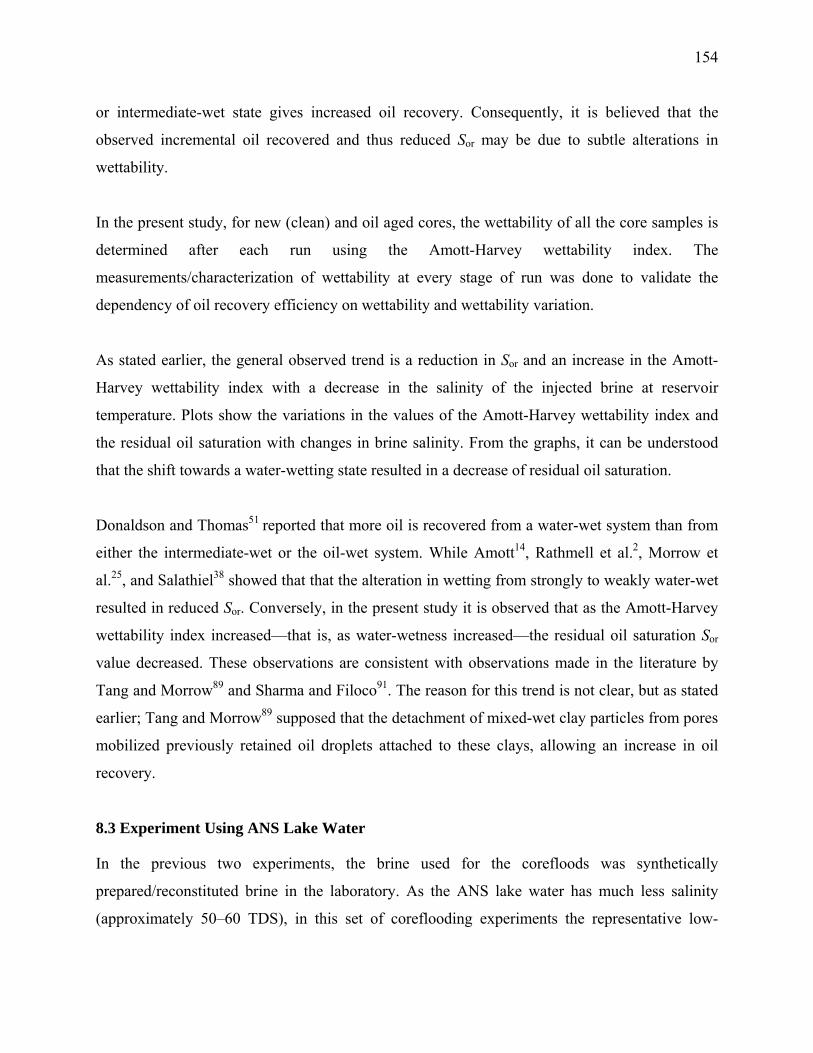
154
or intermediate-wet state gives increased oil recovery. Consequently, it is believed that the
observed incremental oil recovered and thus reduced Sor may be due to subtle alterations in
wettability.
In the present study, for new (clean) and oil aged cores, the wettability of all the core samples is
determined after each run using the Amott-Harvey wettability index. The
measurements/characterization of wettability at every stage of run was done to validate the
dependency of oil recovery efficiency on wettability and wettability variation.
As stated earlier, the general observed trend is a reduction in Sor and an increase in the Amott-
Harvey wettability index with a decrease in the salinity of the injected brine at reservoir
temperature. Plots show the variations in the values of the Amott-Harvey wettability index and
the residual oil saturation with changes in brine salinity. From the graphs, it can be understood
that the shift towards a water-wetting state resulted in a decrease of residual oil saturation.
Donaldson and Thomas51 reported that more oil is recovered from a water-wet system than from
either the intermediate-wet or the oil-wet system. While Amott14, Rathmell et al.2, Morrow et
al.25, and Salathiel38 showed that that the alteration in wetting from strongly to weakly water-wet
resulted in reduced Sor. Conversely, in the present study it is observed that as the Amott-Harvey
wettability index increased—that is, as water-wetness increased—the residual oil saturation Sor
value decreased. These observations are consistent with observations made in the literature by
Tang and Morrow89 and Sharma and Filoco91. The reason for this trend is not clear, but as stated
earlier; Tang and Morrow89 supposed that the detachment of mixed-wet clay particles from pores
mobilized previously retained oil droplets attached to these clays, allowing an increase in oil
recovery.
8.3 Experiment Using ANS Lake Water
In the previous two experiments, the brine used for the corefloods was synthetically
prepared/reconstituted brine in the laboratory. As the ANS lake water has much less salinity
(approximately 50–60 TDS), in this set of coreflooding experiments the representative low-
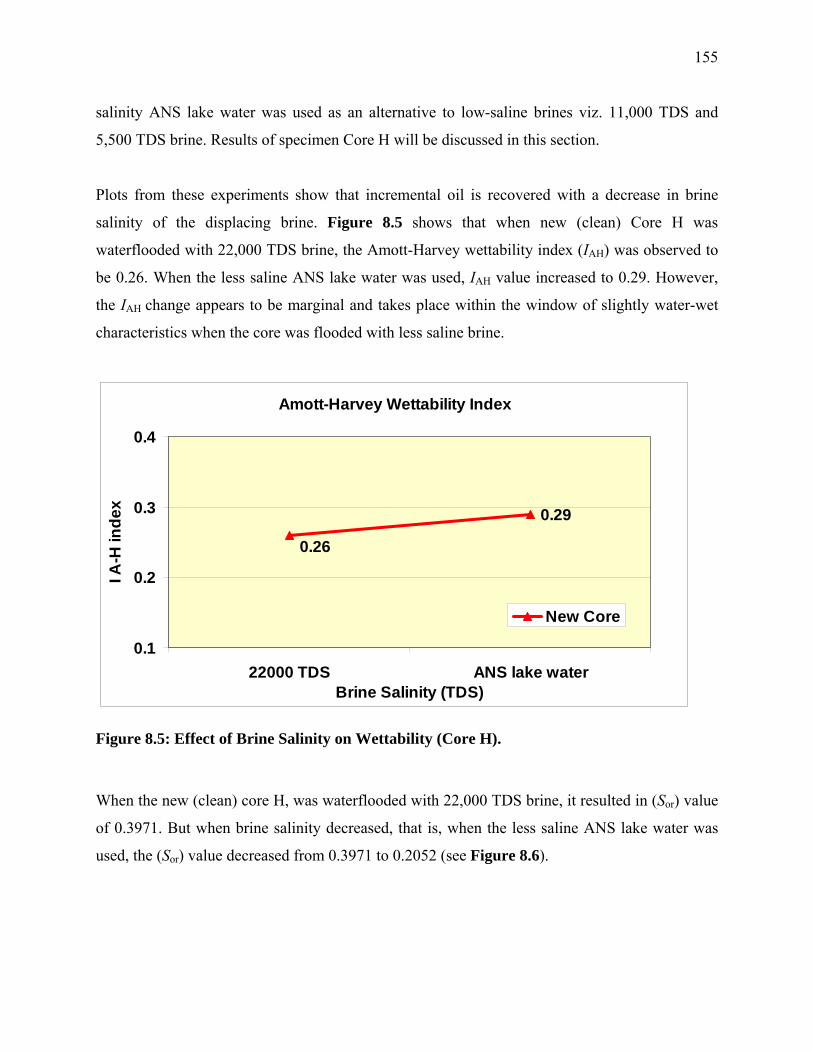
155
salinity ANS lake water was used as an alternative to low-saline brines viz. 11,000 TDS and
5,500 TDS brine. Results of specimen Core H will be discussed in this section.
Plots from these experiments show that incremental oil is recovered with a decrease in brine
salinity of the displacing brine. Figure 8.5 shows that when new (clean) Core H was
waterflooded with 22,000 TDS brine, the Amott-Harvey wettability index (IAH) was observed to
be 0.26. When the less saline ANS lake water was used, IAH value increased to 0.29. However,
the IAH change appears to be marginal and takes place within the window of slightly water-wet
characteristics when the core was flooded with less saline brine.
Amott-Harvey Wettability Index
0.29
0.26
0.1
0.2
0.3
0.4
22000 TDS ANS lake waterBrine Salinity (TDS)
I A-H
inde
x
New Core
Figure 8.5: Effect of Brine Salinity on Wettability (Core H).
When the new (clean) core H, was waterflooded with 22,000 TDS brine, it resulted in (Sor) value
of 0.3971. But when brine salinity decreased, that is, when the less saline ANS lake water was
used, the (Sor) value decreased from 0.3971 to 0.2052 (see Figure 8.6).
156
0.3971
0.2052
00.05
0.10.15
0.20.25
0.30.35
0.4
Sor
22000 TDS ANS lake water
Brine salinity
Sor vs Brine Salinity
Figure 8.6: Effect of Brine Salinity on Residual Oil Saturation (Core H).
This means that when the core was flooded with 22,000 TDS brine, the recovery was 40%, but
when flooded with ANS lake water, the recovery was 68%. Thus, more pore volumes of oil are
recovered when brine of lower salinity is injected (see Figure 8.7).
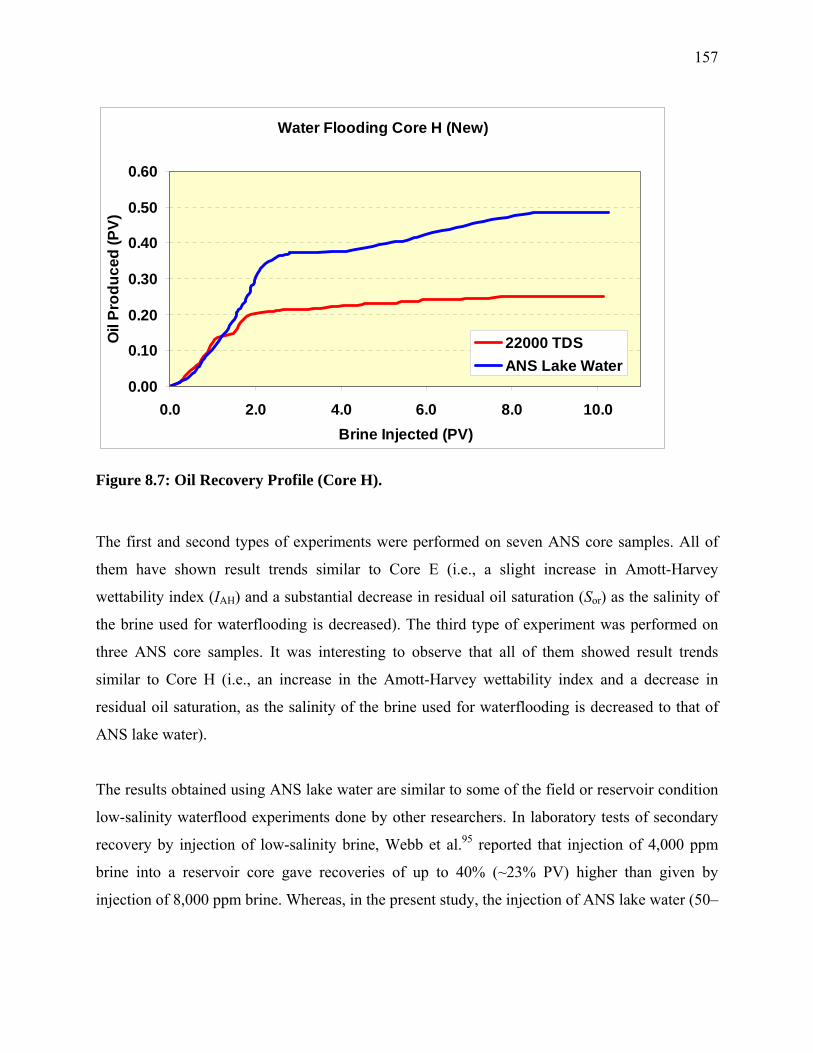
157
Water Flooding Core H (New)
0.00
0.10
0.20
0.30
0.40
0.50
0.60
0.0 2.0 4.0 6.0 8.0 10.0Brine Injected (PV)
Oil
Prod
uced
(PV)
22000 TDSANS Lake Water
Figure 8.7: Oil Recovery Profile (Core H).
The first and second types of experiments were performed on seven ANS core samples. All of
them have shown result trends similar to Core E (i.e., a slight increase in Amott-Harvey
wettability index (IAH) and a substantial decrease in residual oil saturation (Sor) as the salinity of
the brine used for waterflooding is decreased). The third type of experiment was performed on
three ANS core samples. It was interesting to observe that all of them showed result trends
similar to Core H (i.e., an increase in the Amott-Harvey wettability index and a decrease in
residual oil saturation, as the salinity of the brine used for waterflooding is decreased to that of
ANS lake water).
The results obtained using ANS lake water are similar to some of the field or reservoir condition
low-salinity waterflood experiments done by other researchers. In laboratory tests of secondary
recovery by injection of low-salinity brine, Webb et al.95 reported that injection of 4,000 ppm
brine into a reservoir core gave recoveries of up to 40% (~23% PV) higher than given by
injection of 8,000 ppm brine. Whereas, in the present study, the injection of ANS lake water (50–
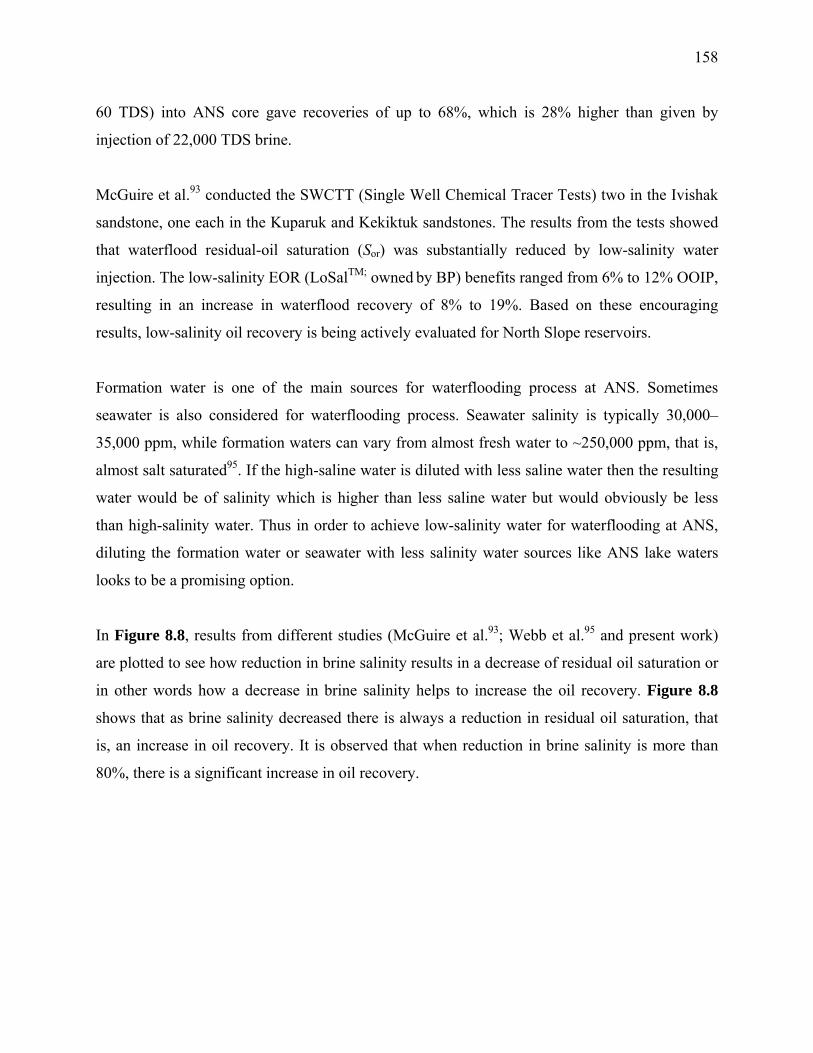
158
60 TDS) into ANS core gave recoveries of up to 68%, which is 28% higher than given by
injection of 22,000 TDS brine.
McGuire et al.93 conducted the SWCTT (Single Well Chemical Tracer Tests) two in the Ivishak
sandstone, one each in the Kuparuk and Kekiktuk sandstones. The results from the tests showed
that waterflood residual-oil saturation (Sor) was substantially reduced by low-salinity water
injection. The low-salinity EOR (LoSalTM; owned by BP) benefits ranged from 6% to 12% OOIP,
resulting in an increase in waterflood recovery of 8% to 19%. Based on these encouraging
results, low-salinity oil recovery is being actively evaluated for North Slope reservoirs.
Formation water is one of the main sources for waterflooding process at ANS. Sometimes
seawater is also considered for waterflooding process. Seawater salinity is typically 30,000–
35,000 ppm, while formation waters can vary from almost fresh water to ~250,000 ppm, that is,
almost salt saturated95. If the high-saline water is diluted with less saline water then the resulting
water would be of salinity which is higher than less saline water but would obviously be less
than high-salinity water. Thus in order to achieve low-salinity water for waterflooding at ANS,
diluting the formation water or seawater with less salinity water sources like ANS lake waters
looks to be a promising option.
In Figure 8.8, results from different studies (McGuire et al.93; Webb et al.95 and present work)
are plotted to see how reduction in brine salinity results in a decrease of residual oil saturation or
in other words how a decrease in brine salinity helps to increase the oil recovery. Figure 8.8
shows that as brine salinity decreased there is always a reduction in residual oil saturation, that
is, an increase in oil recovery. It is observed that when reduction in brine salinity is more than
80%, there is a significant increase in oil recovery.
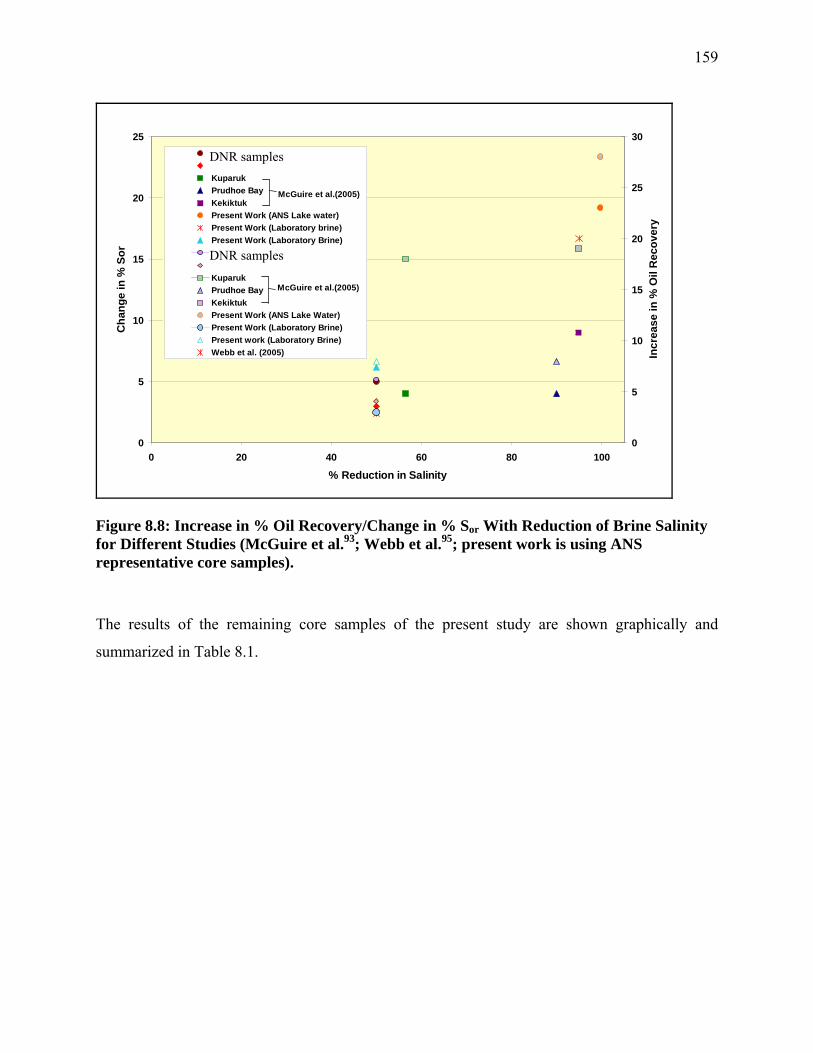
159
0
5
10
15
20
25
0 20 40 60 80 100
% Reduction in Salinity
Cha
nge
in %
Sor
0
5
10
15
20
25
30
Incr
ease
in %
Oil
Rec
over
y
Agbalaka (2006)Agbalaka (2006)KuparukPrudhoe BayKekiktukPresent Work (ANS Lake water)Present Work (Laboratory brine)Present Work (Laboratory Brine)Agbalaka (2006)Agbalaka (2006)KuparukPrudhoe BayKekiktukPresent Work (ANS Lake Water)Present Work (Laboratory Brine)Present work (Laboratory Brine)Webb et al. (2005)
McGuire et al.(2005)
McGuire et al.(2005)
Figure 8.8: Increase in % Oil Recovery/Change in % Sor With Reduction of Brine Salinity for Different Studies (McGuire et al.93; Webb et al.95; present work is using ANS representative core samples).
The results of the remaining core samples of the present study are shown graphically and
summarized in Table 8.1.
DNR samples
DNR samples
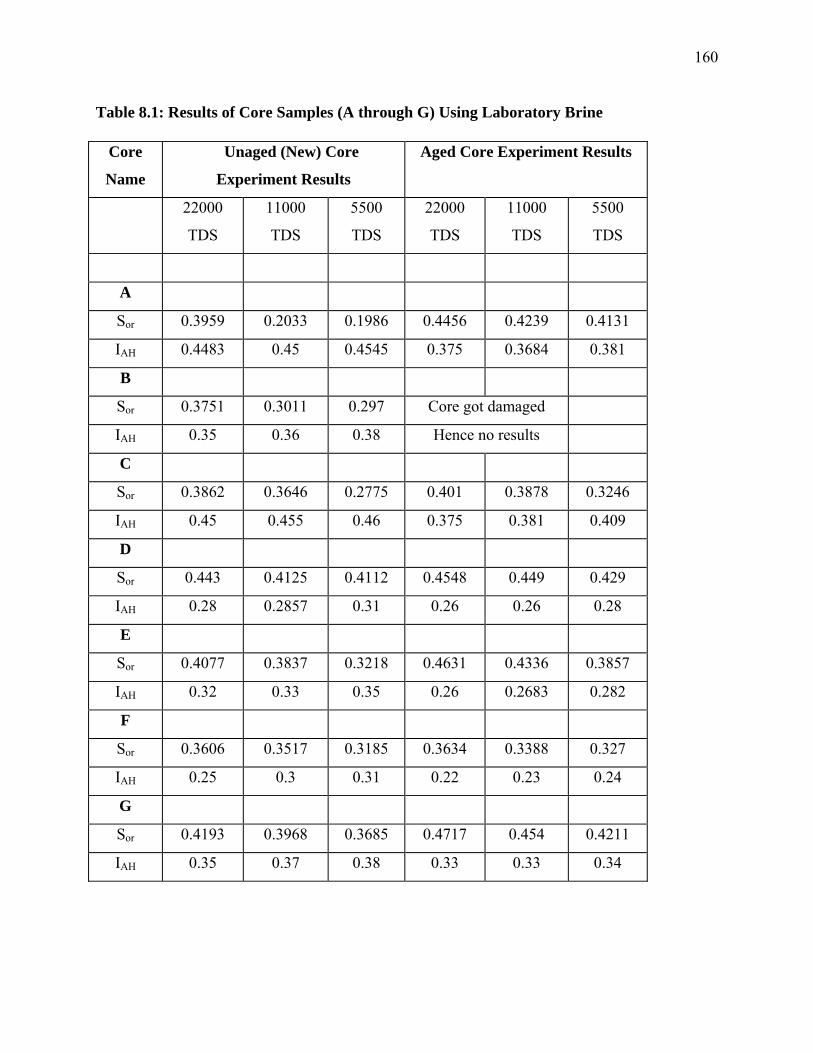
160
Table 8.1: Results of Core Samples (A through G) Using Laboratory Brine
Core
Name
Unaged (New) Core
Experiment Results
Aged Core Experiment Results
22000
TDS
11000
TDS
5500
TDS
22000
TDS
11000
TDS
5500
TDS
A
Sor 0.3959 0.2033 0.1986 0.4456 0.4239 0.4131
IAH 0.4483 0.45 0.4545 0.375 0.3684 0.381
B
Sor 0.3751 0.3011 0.297 Core got damaged
IAH 0.35 0.36 0.38 Hence no results
C
Sor 0.3862 0.3646 0.2775 0.401 0.3878 0.3246
IAH 0.45 0.455 0.46 0.375 0.381 0.409
D
Sor 0.443 0.4125 0.4112 0.4548 0.449 0.429
IAH 0.28 0.2857 0.31 0.26 0.26 0.28
E
Sor 0.4077 0.3837 0.3218 0.4631 0.4336 0.3857
IAH 0.32 0.33 0.35 0.26 0.2683 0.282
F
Sor 0.3606 0.3517 0.3185 0.3634 0.3388 0.327
IAH 0.25 0.3 0.31 0.22 0.23 0.24
G
Sor 0.4193 0.3968 0.3685 0.4717 0.454 0.4211
IAH 0.35 0.37 0.38 0.33 0.33 0.34
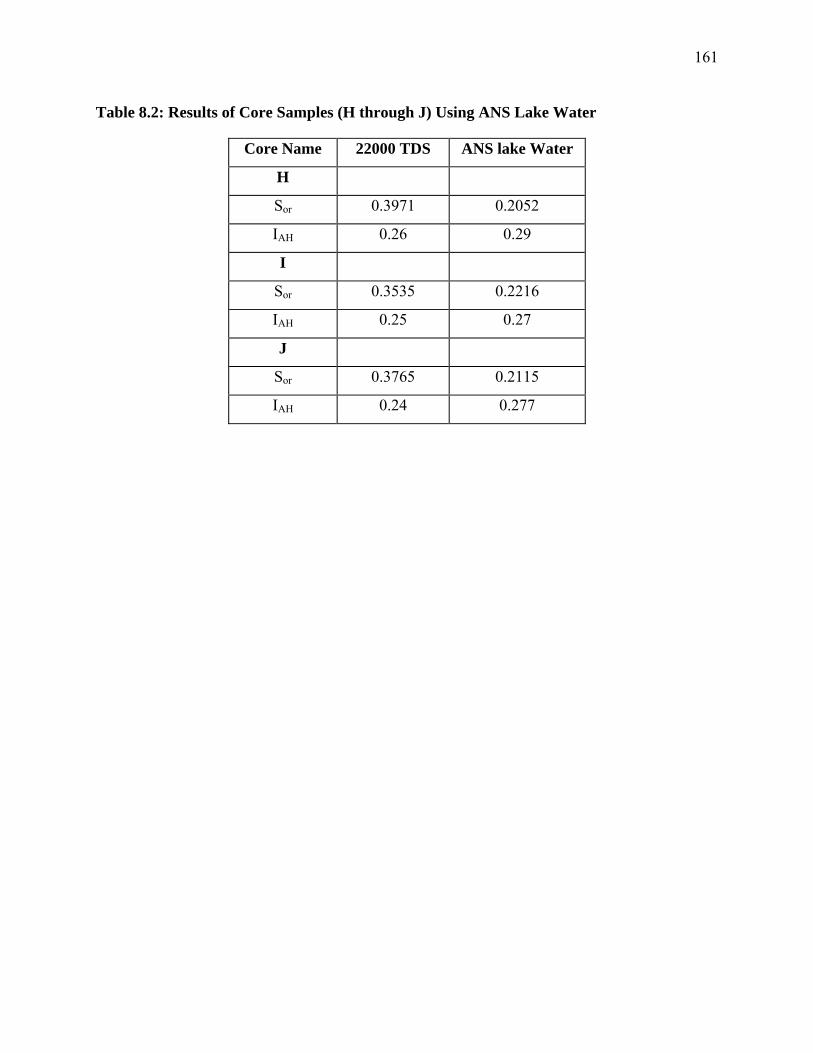
161
Table 8.2: Results of Core Samples (H through J) Using ANS Lake Water
Core Name 22000 TDS ANS lake Water
H
Sor 0.3971 0.2052
IAH 0.26 0.29
I
Sor 0.3535 0.2216
IAH 0.25 0.27
J
Sor 0.3765 0.2115
IAH 0.24 0.277
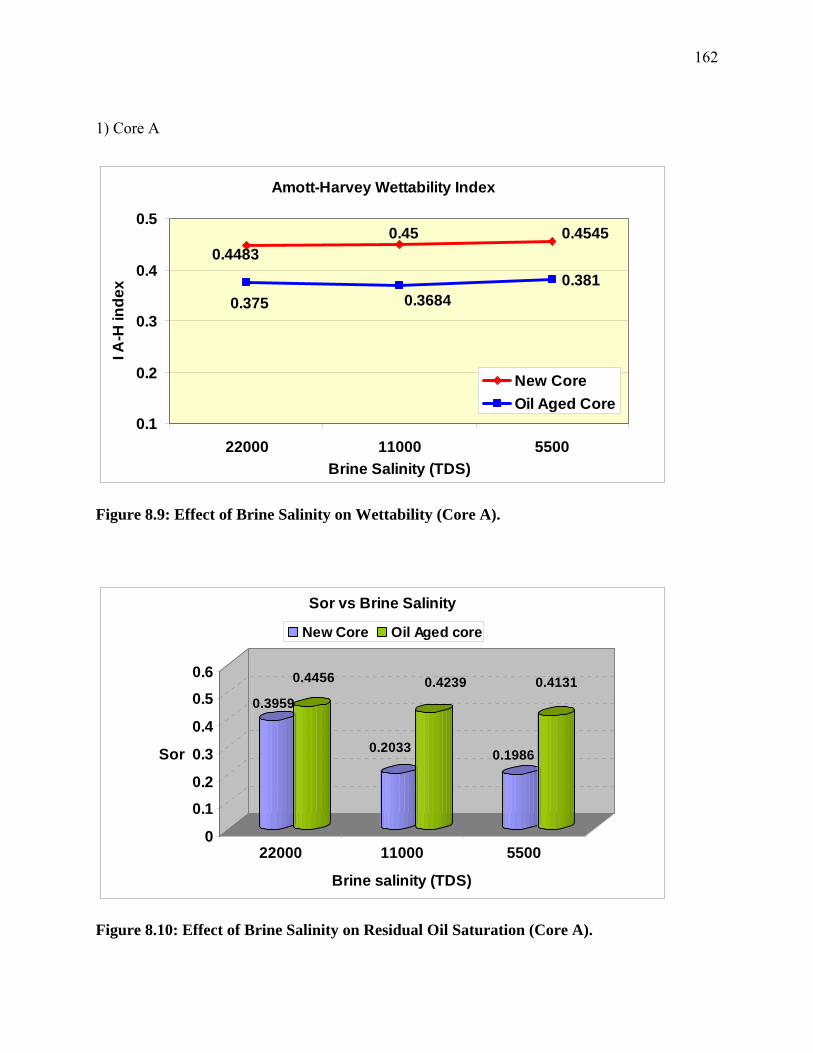
162
1) Core A
Amott-Harvey Wettability Index
0.3810.4483
0.45 0.4545
0.375 0.3684
0.1
0.2
0.3
0.4
0.5
22000 11000 5500Brine Salinity (TDS)
I A-H
inde
x
New CoreOil Aged Core
Figure 8.9: Effect of Brine Salinity on Wettability (Core A).
0.3959
0.4456
0.2033
0.4239
0.1986
0.4131
0
0.1
0.2
0.3
0.4
0.5
0.6
Sor
22000 11000 5500
Brine salinity (TDS)
Sor vs Brine Salinity
New Core Oil Aged core
Figure 8.10: Effect of Brine Salinity on Residual Oil Saturation (Core A).
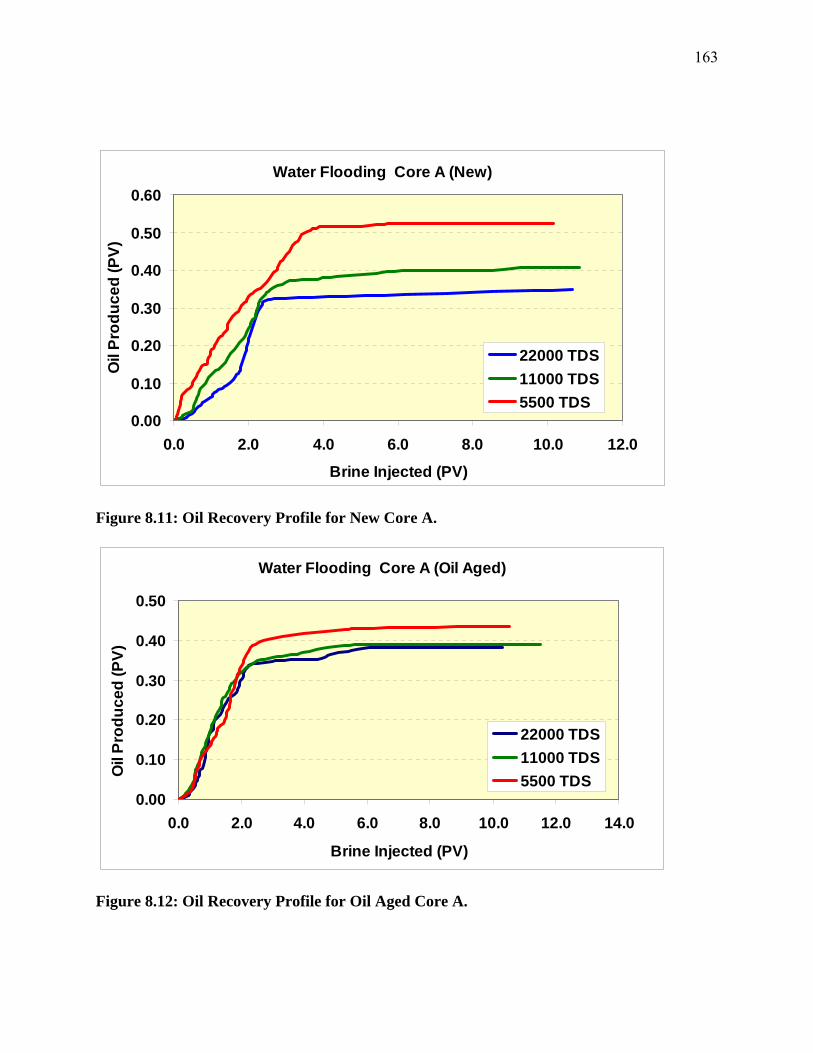
163
Water Flooding Core A (New)
0.00
0.10
0.20
0.30
0.40
0.50
0.60
0.0 2.0 4.0 6.0 8.0 10.0 12.0
Brine Injected (PV)
Oil
Prod
uced
(PV)
22000 TDS11000 TDS5500 TDS
Figure 8.11: Oil Recovery Profile for New Core A.
Water Flooding Core A (Oil Aged)
0.00
0.10
0.20
0.30
0.40
0.50
0.0 2.0 4.0 6.0 8.0 10.0 12.0 14.0
Brine Injected (PV)
Oil
Prod
uced
(PV)
22000 TDS11000 TDS5500 TDS
Figure 8.12: Oil Recovery Profile for Oil Aged Core A.
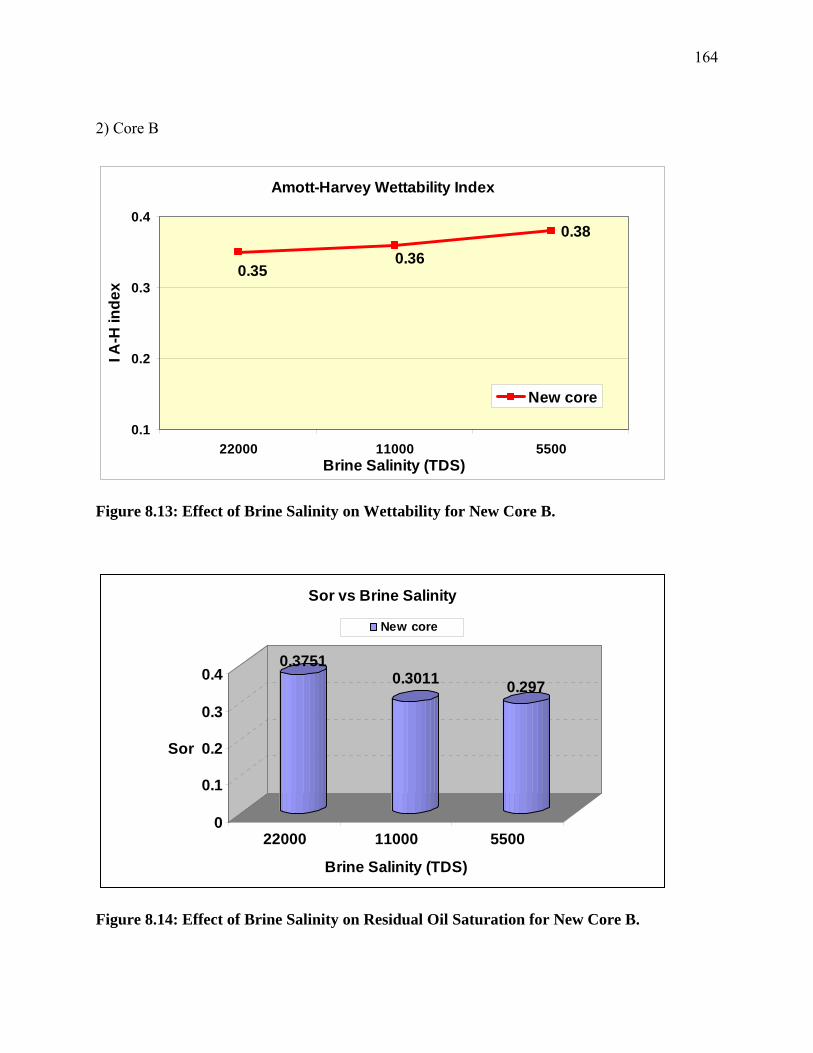
164
2) Core B
Amott-Harvey Wettability Index
0.38
0.360.35
0.1
0.2
0.3
0.4
22000 11000 5500Brine Salinity (TDS)
I A-H
inde
x
New core
Figure 8.13: Effect of Brine Salinity on Wettability for New Core B.
0.37510.3011 0.297
0
0.1
0.2
0.3
0.4
Sor
22000 11000 5500
Brine Salinity (TDS)
Sor vs Brine Salinity
New core
Figure 8.14: Effect of Brine Salinity on Residual Oil Saturation for New Core B.
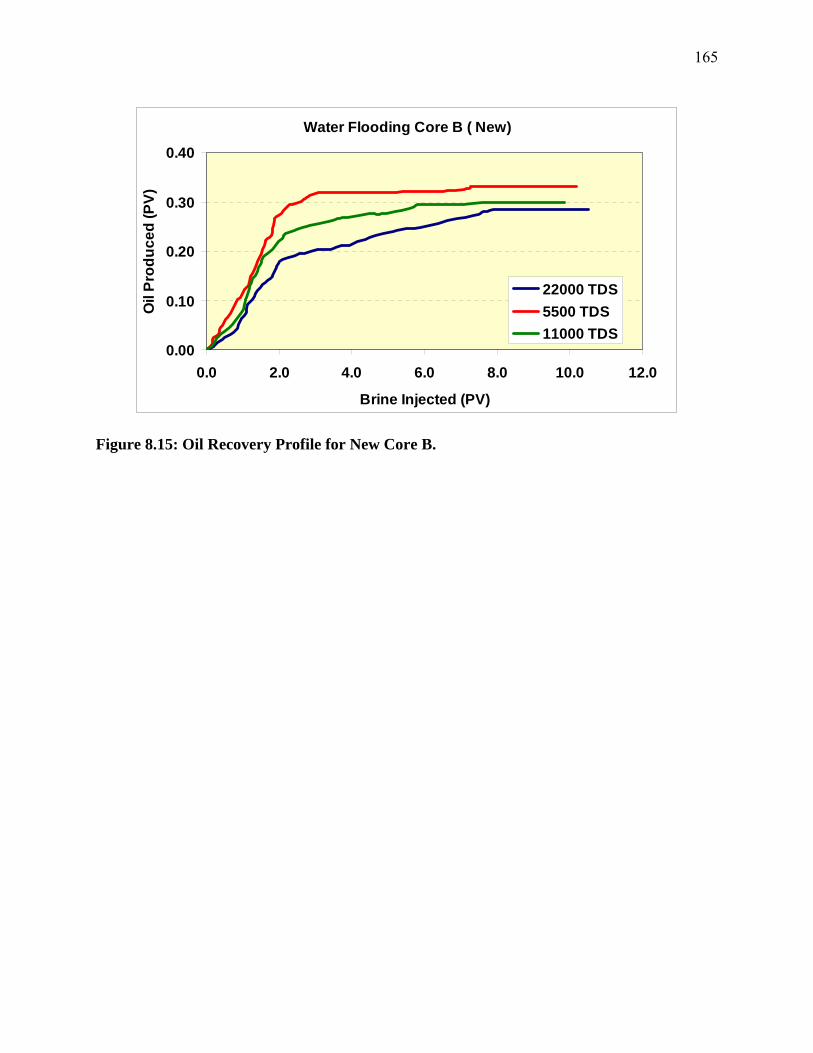
165
Water Flooding Core B ( New)
0.00
0.10
0.20
0.30
0.40
0.0 2.0 4.0 6.0 8.0 10.0 12.0
Brine Injected (PV)
Oil
Prod
uced
(PV)
22000 TDS5500 TDS11000 TDS
Figure 8.15: Oil Recovery Profile for New Core B.
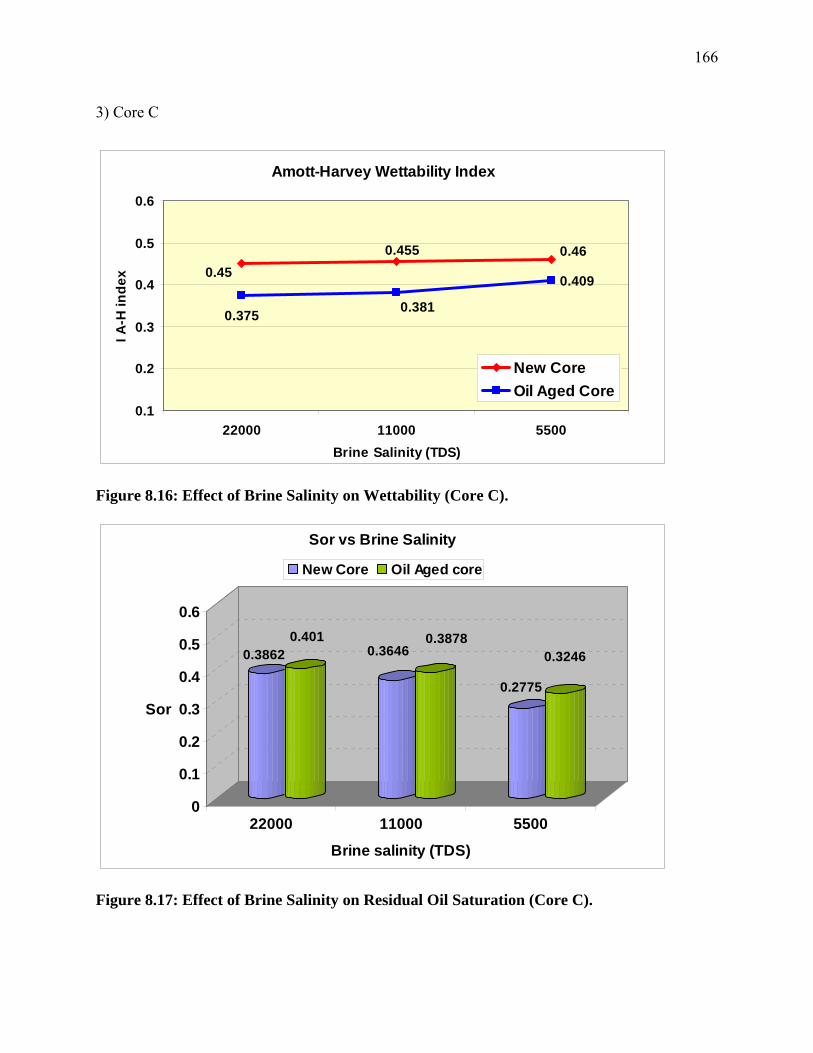
166
3) Core C
Amott-Harvey Wettability Index
0.409
0.460.4550.45
0.3810.375
0.1
0.2
0.3
0.4
0.5
0.6
22000 11000 5500Brine Salinity (TDS)
I A-H
inde
x
New CoreOil Aged Core
Figure 8.16: Effect of Brine Salinity on Wettability (Core C).
0.38620.401
0.36460.3878
0.2775
0.3246
0
0.1
0.2
0.3
0.4
0.5
0.6
Sor
22000 11000 5500
Brine salinity (TDS)
Sor vs Brine Salinity
New Core Oil Aged core
Figure 8.17: Effect of Brine Salinity on Residual Oil Saturation (Core C).
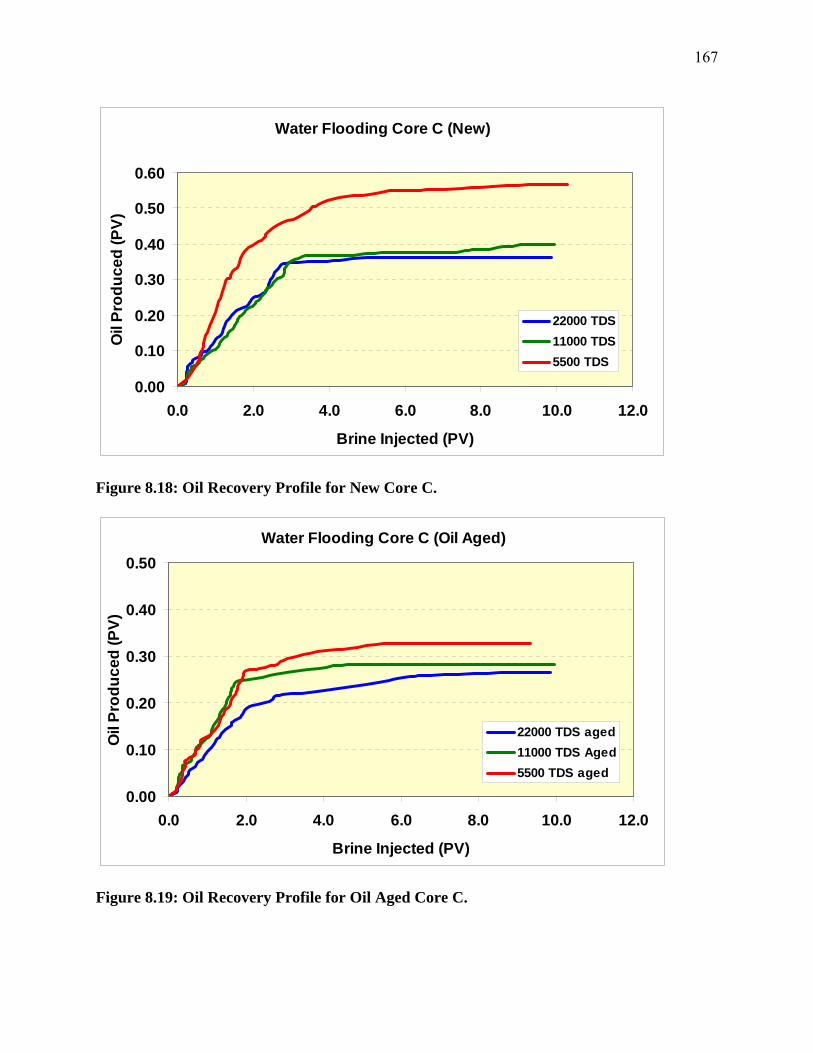
167
Water Flooding Core C (New)
0.00
0.10
0.20
0.30
0.40
0.50
0.60
0.0 2.0 4.0 6.0 8.0 10.0 12.0
Brine Injected (PV)
Oil
Prod
uced
(PV)
22000 TDS11000 TDS5500 TDS
Figure 8.18: Oil Recovery Profile for New Core C.
Water Flooding Core C (Oil Aged)
0.00
0.10
0.20
0.30
0.40
0.50
0.0 2.0 4.0 6.0 8.0 10.0 12.0
Brine Injected (PV)
Oil
Prod
uced
(PV)
22000 TDS aged11000 TDS Aged5500 TDS aged
Figure 8.19: Oil Recovery Profile for Oil Aged Core C.
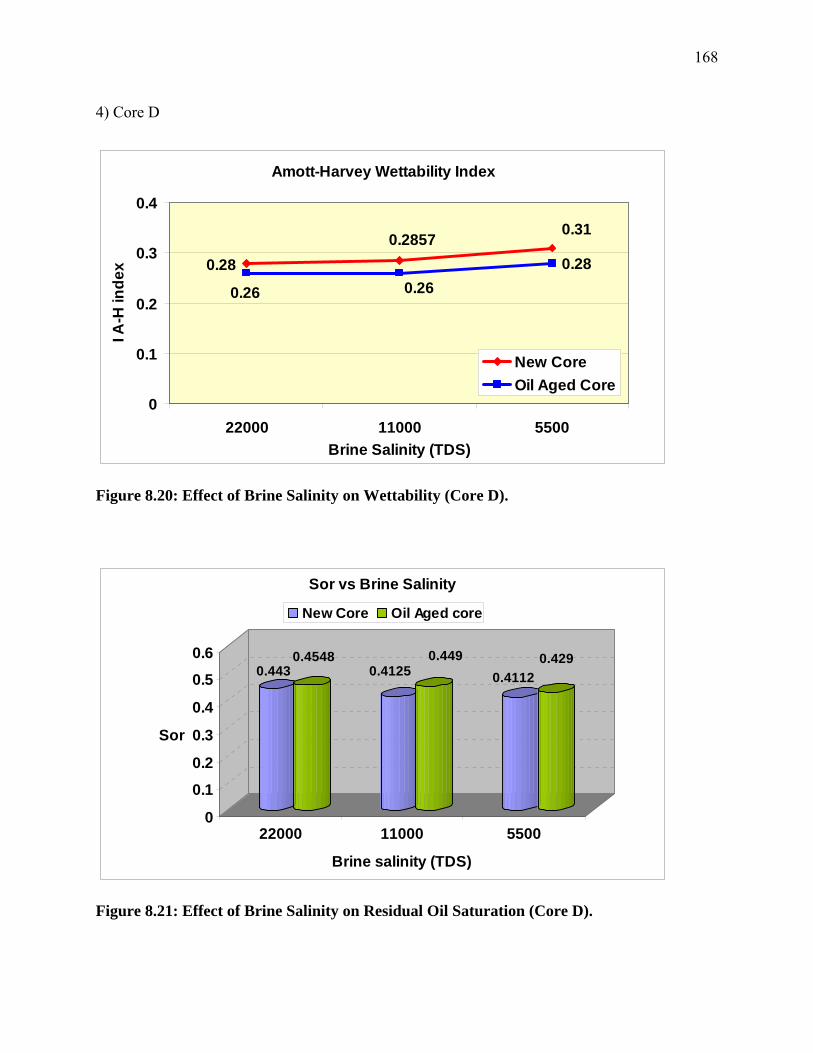
168
4) Core D
Amott-Harvey Wettability Index
0.280.280.2857 0.31
0.26 0.26
0
0.1
0.2
0.3
0.4
22000 11000 5500Brine Salinity (TDS)
I A-H
inde
x
New CoreOil Aged Core
Figure 8.20: Effect of Brine Salinity on Wettability (Core D).
0.4430.4548
0.41250.449
0.41120.429
0
0.1
0.2
0.3
0.4
0.5
0.6
Sor
22000 11000 5500
Brine salinity (TDS)
Sor vs Brine Salinity
New Core Oil Aged core
Figure 8.21: Effect of Brine Salinity on Residual Oil Saturation (Core D).
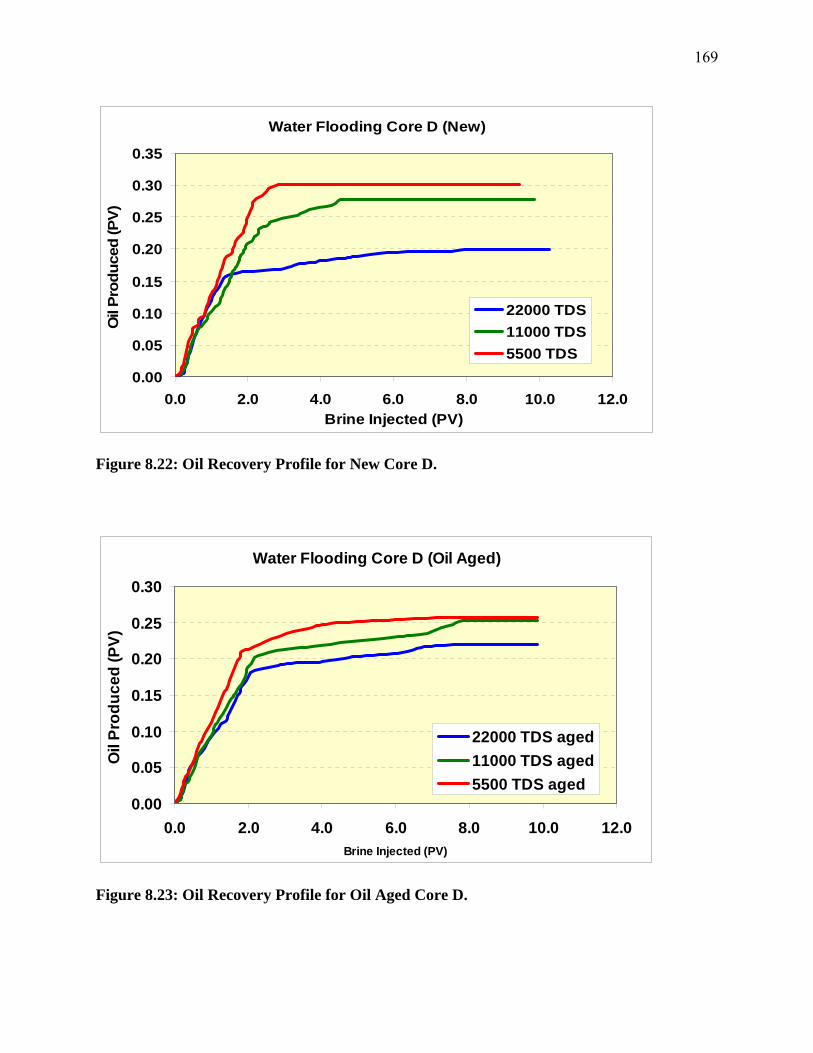
169
Water Flooding Core D (New)
0.00
0.05
0.10
0.15
0.20
0.25
0.30
0.35
0.0 2.0 4.0 6.0 8.0 10.0 12.0Brine Injected (PV)
Oil
Prod
uced
(PV)
22000 TDS11000 TDS5500 TDS
Figure 8.22: Oil Recovery Profile for New Core D.
Water Flooding Core D (Oil Aged)
0.00
0.05
0.10
0.15
0.20
0.25
0.30
0.0 2.0 4.0 6.0 8.0 10.0 12.0Brine Injected (PV)
Oil
Prod
uced
(PV)
22000 TDS aged11000 TDS aged5500 TDS aged
Figure 8.23: Oil Recovery Profile for Oil Aged Core D.
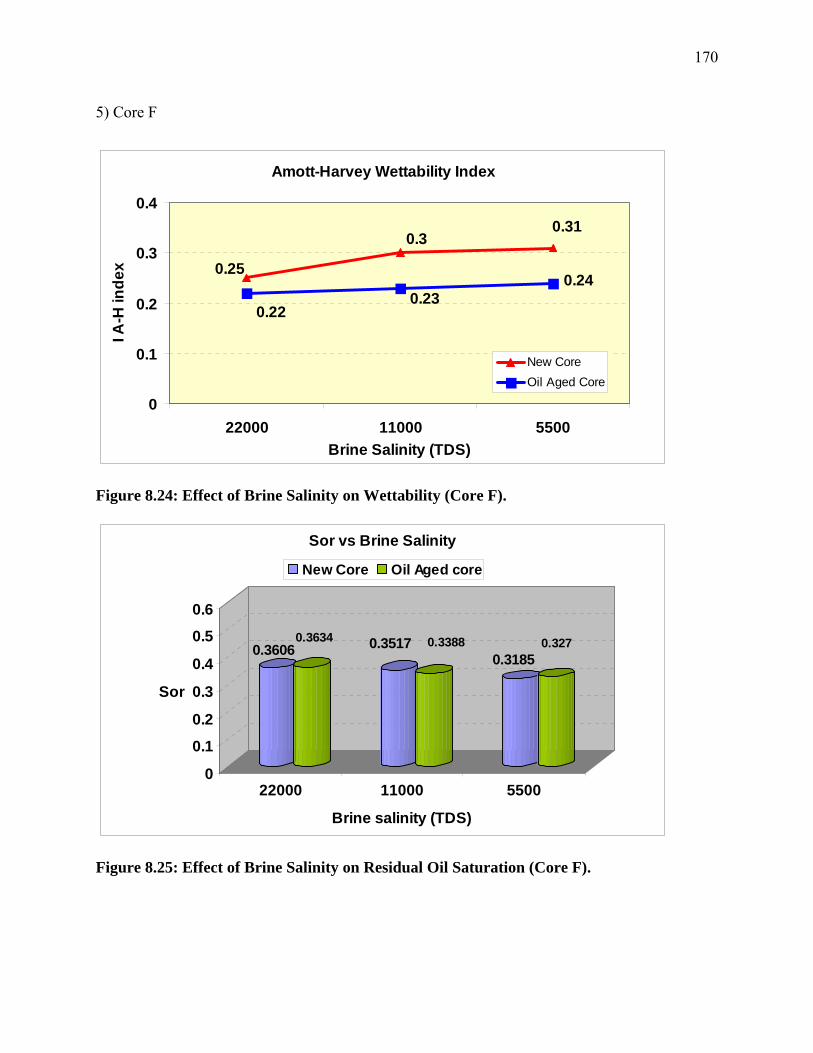
170
5) Core F
Amott-Harvey Wettability Index
0.310.3
0.250.24
0.230.22
0
0.1
0.2
0.3
0.4
22000 11000 5500Brine Salinity (TDS)
I A-H
inde
x
New CoreOil Aged Core
Figure 8.24: Effect of Brine Salinity on Wettability (Core F).
0.36060.3634 0.3517 0.3388
0.31850.327
0
0.1
0.2
0.3
0.4
0.5
0.6
Sor
22000 11000 5500
Brine salinity (TDS)
Sor vs Brine Salinity
New Core Oil Aged core
Figure 8.25: Effect of Brine Salinity on Residual Oil Saturation (Core F).
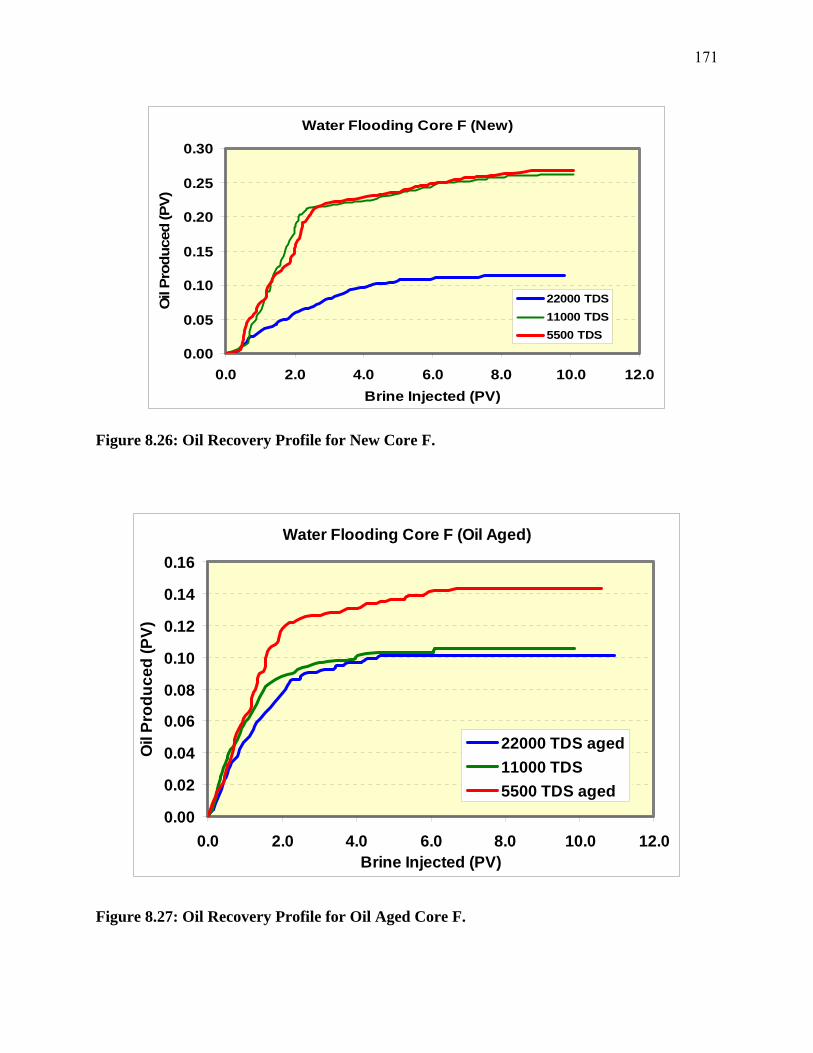
171
Water Flooding Core F (New)
0.00
0.05
0.10
0.15
0.20
0.25
0.30
0.0 2.0 4.0 6.0 8.0 10.0 12.0Brine Injected (PV)
Oil
Prod
uced
(PV)
22000 TDS11000 TDS5500 TDS
Figure 8.26: Oil Recovery Profile for New Core F.
Water Flooding Core F (Oil Aged)
0.00
0.02
0.04
0.06
0.08
0.10
0.12
0.14
0.16
0.0 2.0 4.0 6.0 8.0 10.0 12.0Brine Injected (PV)
Oil
Prod
uced
(PV)
22000 TDS aged11000 TDS5500 TDS aged
Figure 8.27: Oil Recovery Profile for Oil Aged Core F.
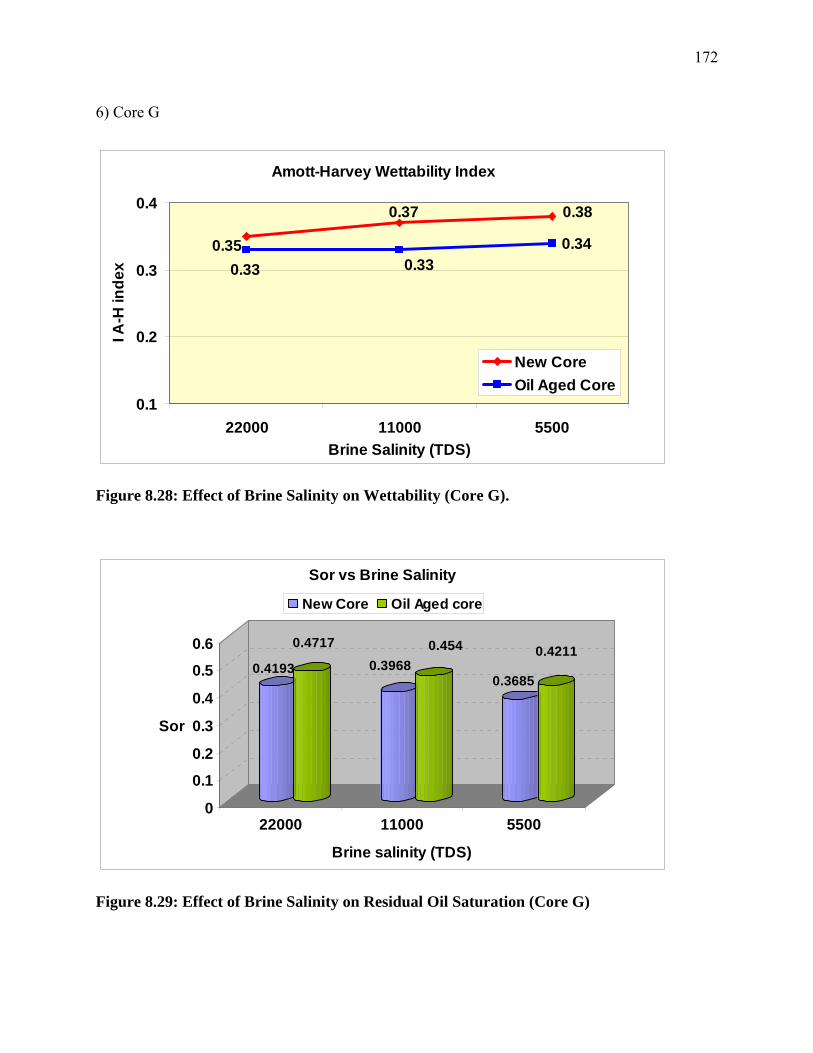
172
6) Core G
Amott-Harvey Wettability Index
0.340.35
0.37 0.38
0.33 0.33
0.1
0.2
0.3
0.4
22000 11000 5500Brine Salinity (TDS)
I A-H
inde
x
New CoreOil Aged Core
Figure 8.28: Effect of Brine Salinity on Wettability (Core G).
0.4193
0.47170.3968
0.454
0.3685
0.4211
0
0.1
0.2
0.3
0.4
0.5
0.6
Sor
22000 11000 5500
Brine salinity (TDS)
Sor vs Brine Salinity
New Core Oil Aged core
Figure 8.29: Effect of Brine Salinity on Residual Oil Saturation (Core G)
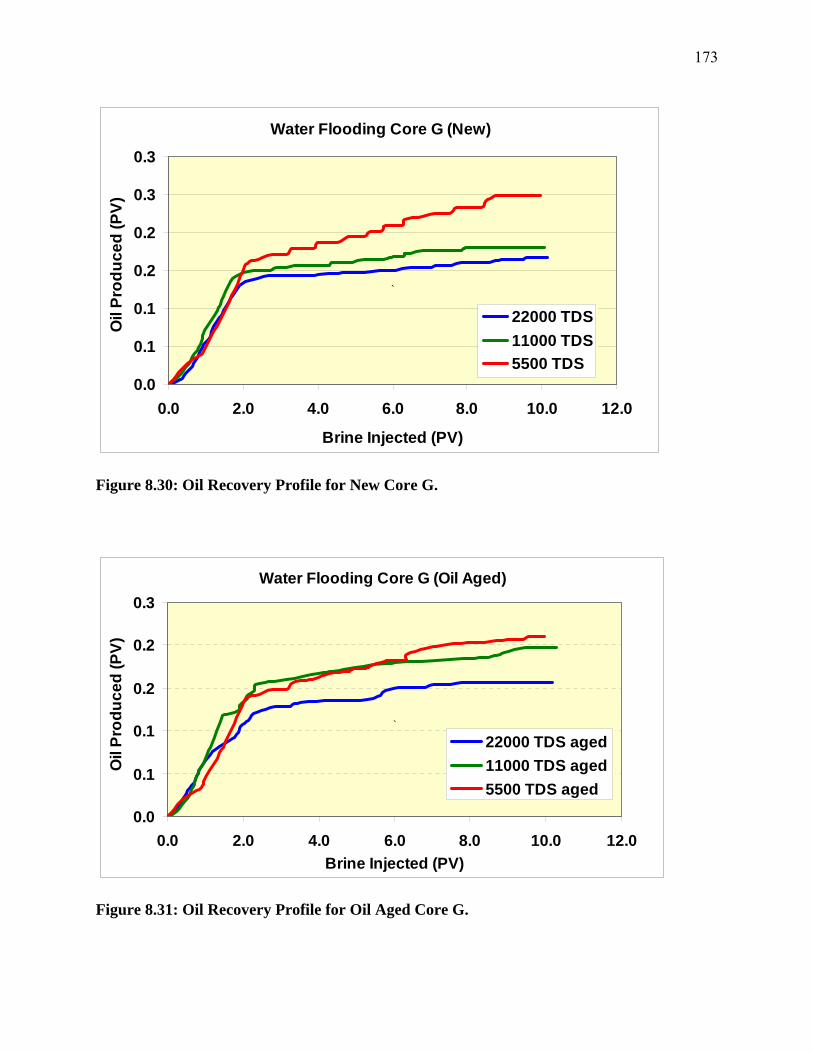
173
Water Flooding Core G (New)
0.0
0.1
0.1
0.2
0.2
0.3
0.3
0.0 2.0 4.0 6.0 8.0 10.0 12.0
Brine Injected (PV)
Oil
Prod
uced
(PV)
22000 TDS11000 TDS5500 TDS
`
Figure 8.30: Oil Recovery Profile for New Core G.
Water Flooding Core G (Oil Aged)
0.0
0.1
0.1
0.2
0.2
0.3
0.0 2.0 4.0 6.0 8.0 10.0 12.0Brine Injected (PV)
Oil
Prod
uced
(PV)
22000 TDS aged11000 TDS aged5500 TDS aged
`
Figure 8.31: Oil Recovery Profile for Oil Aged Core G.
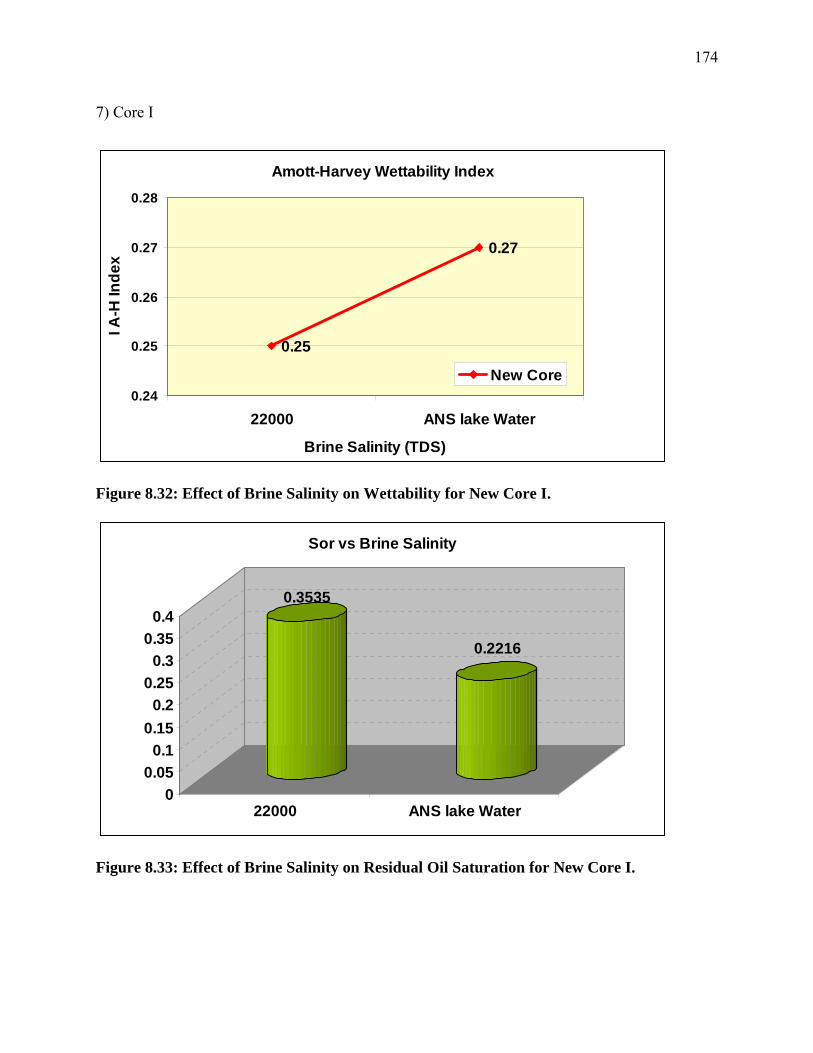
174
7) Core I
Amott-Harvey Wettability Index
0.25
0.27
0.24
0.25
0.26
0.27
0.28
22000 ANS lake Water
Brine Salinity (TDS)
I A-H
Inde
x
New Core
Figure 8.32: Effect of Brine Salinity on Wettability for New Core I.
0.3535
0.2216
00.05
0.10.15
0.20.25
0.30.35
0.4
22000 ANS lake Water
Sor vs Brine Salinity
Figure 8.33: Effect of Brine Salinity on Residual Oil Saturation for New Core I.
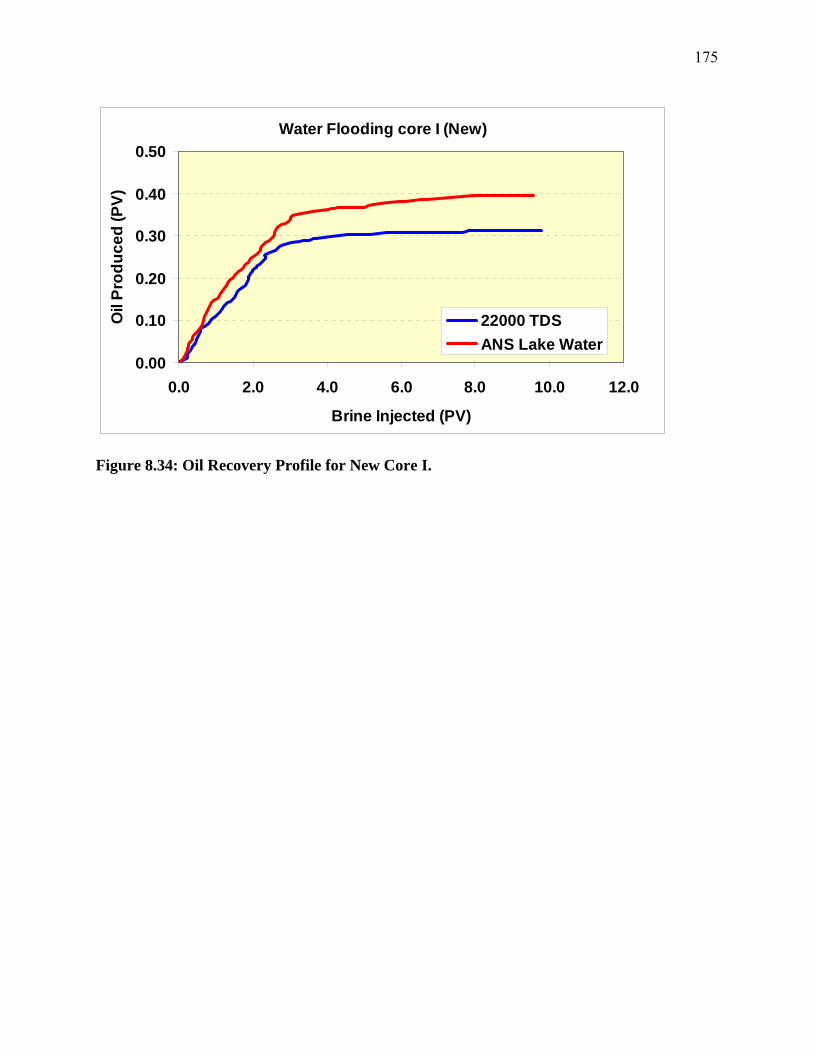
175
Water Flooding core I (New)
0.00
0.10
0.20
0.30
0.40
0.50
0.0 2.0 4.0 6.0 8.0 10.0 12.0
Brine Injected (PV)
Oil
Prod
uced
(PV)
22000 TDSANS Lake Water
Figure 8.34: Oil Recovery Profile for New Core I.
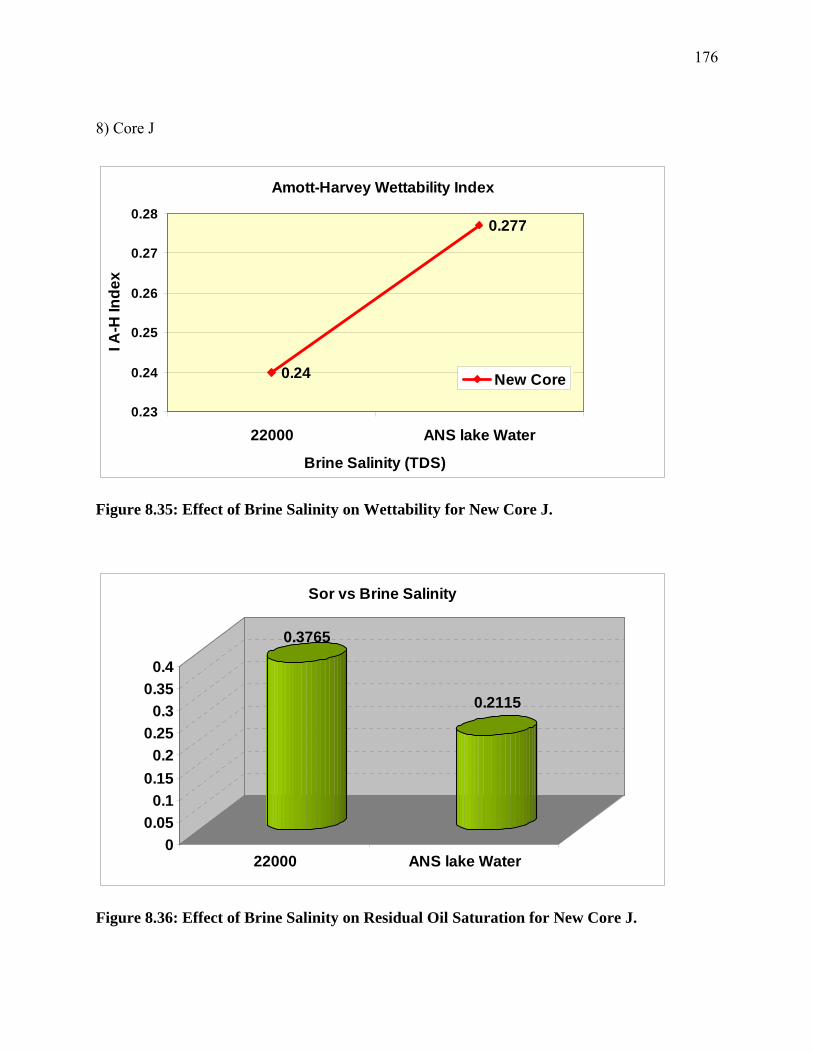
176
8) Core J
Amott-Harvey Wettability Index
0.24
0.277
0.23
0.24
0.25
0.26
0.27
0.28
22000 ANS lake Water
Brine Salinity (TDS)
I A-H
Inde
x
New Core
Figure 8.35: Effect of Brine Salinity on Wettability for New Core J.
0.3765
0.2115
00.05
0.10.15
0.20.25
0.30.35
0.4
22000 ANS lake Water
Sor vs Brine Salinity
Figure 8.36: Effect of Brine Salinity on Residual Oil Saturation for New Core J.
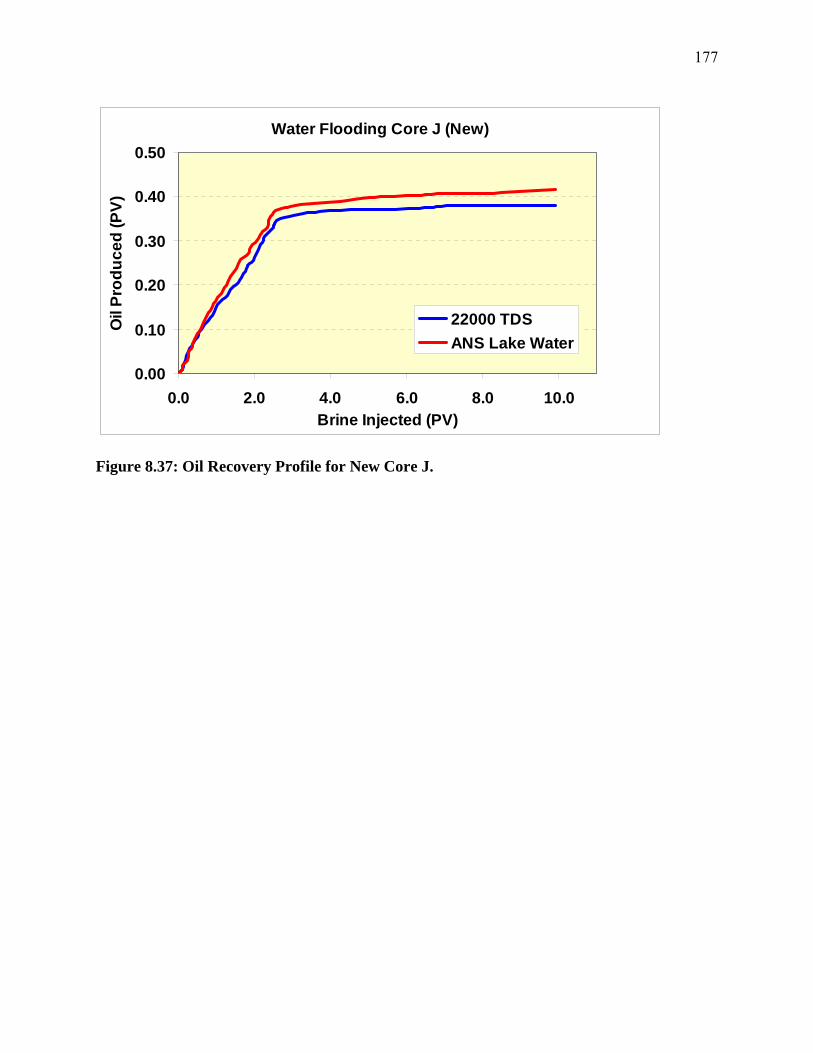
177
Water Flooding Core J (New)
0.00
0.10
0.20
0.30
0.40
0.50
0.0 2.0 4.0 6.0 8.0 10.0Brine Injected (PV)
Oil
Prod
uced
(PV)
22000 TDSANS Lake Water
Figure 8.37: Oil Recovery Profile for New Core J.
178
CHAPTER 9: Cyclic Water Injection (Within-Scope Expansion)
9.1 Introduction
All waterfloods that have been conducted so far on several core samples have indicated that
residual oil saturation is substantially reduced by lowering the salinity of the injection brine.
However, continuous injection of water (conventional waterflood) may cause
fingering/channeling of water, causing an early breakthrough of water and thus reducing oil
recovery. On the other hand, in cyclic water injection, the injection of water is not continuous; it
is switched on and off using a timing device in the pumping system. In these types of
experiments, during the off period, spontaneous fluid spreading is observed, leading to smoother
and stable displacement fronts as compared with continuous injection.
One of the major benefits in cyclic water injection is the fact that residual oil saturation is
reached relatively earlier than the continuous injection mode—obviously something that is very
attractive for field applications. For example, for recovering 60% of the oil, in continuous water
injection you may end up injecting 1.5 PVs of water, whereas in cyclic water injection one may
need only 1 PV of water—essentially more oil recovered for the same amount of water injected.
This is demonstrated in the work of Ivanov (SPE 99678; paper presented at Tulsa IOR meeting
in April 2006). Ivanov’s team conducted experiments using two-phase, immiscible, flow-through
homogeneous-packed glass bead cells. Cyclic and continuous water injection was performed.
Ivanov observed a smoother displacement of oil by water in cyclic when compared with
conventional waterflooding. Though final oil recovery was more or less the same in both
conditions, intermediate oil recovery was higher in cyclic than continuous injection, suggesting
an early achievement of residual oil saturation and thereby less expense of water. Less water is
required to recover the same amount of oil in cyclic injection. The experiments also concluded
that lesser flow rates and shorter time intervals of pulse injection resulted in better recovery.
Cyclic water injection has also been applied successfully in some reservoirs in the USA, Russia,
and China.
179
This additional work is to experimentally test if cyclic rather than continuous water injection
and/or the cyclic low-salinity water injection instead of continuous injection is successful in
reducing the residual oil saturation early enough.
9.2 Experimental Description and Setup
The setup used for low-salinity waterflooding of representative cores was used with minor
modifications. Water injection is performed at a lesser flow rate for a fixed time. The flow is
then stopped or some idle time is provided so that the already flooded water can spread within
the pores to displace oil out of the core. The flow is started again, and this sequence continues.
This method can be related to a flow switch on-off mechanism. The ISCO pump is programmed
to deliver this type of cyclic or pulse injection with a constant flow rate, alternating the idle flow
period. The ISCO pump can be programmed to deliver cyclic injection by varying the flow rate
as well as the time intervals of the pulse.
Cores used were representative cores. Some of them were new and the rest were the ones that
were used for continuous water injection. The same dead-oil sample used with representative
cores was used for the cyclic runs too. Brines of 22,000, 11,000, and 5,500 were reconstituted in
the lab, and ANS lake water was procured from Kuparuk Deadarm Lake-5 (thanks to Michael
Lilly and Dr. Horacio Toniolo). All the runs were conducted at atmospheric temperature and
overburden pressure conditions.
Three sets of experiments were performed:
1. Cyclic injection of lab-reconstituted brines of 22,000, 11,000, and 5,500 TDS salinity on
low-salinity continuous waterflooded representative cores (3 in number) saturated with
dead oil
2. Cyclic injection of lab-reconstituted brine of 22,000 TDS salinity and ANS lake water on
low-salinity continuous waterflooded representative cores (3 in number) saturated with
dead oil
3. Cyclic injection of lab-reconstituted brine of 22,000 TDS salinity on new representative
cores (5 in number) saturated with dead oil by varying the time intervals of the pulse
(through the ISCO pump).
180
9.3 Results
The effect of low-salinity brine injection was consistently pronounced in the results of all three
sets of experiments. This confirms the results obtained through low-salinity continuous
waterflooding. For all three sets, an attempt was made to commence all coreflood experiments at
the similar initial condition; that is, the cores were at initial oil saturation (Soi) and
interstitial/connate water saturation (Swi). The connate water salinity of all sets of experiments
was kept constant at a “high” salinity of 22,000 TDS in order to simulate the reservoir saturation
conditions.
For the first and second sets of experiments, cyclic injection aided in slight increase of oil
recovery as compared to continuous injection. The residual oil saturation values also were
considerably reduced. Within cyclic injection as the salinity of the brine was lowered, increased
oil recovery and reduced residual oil saturation was a very consistent trend. Oil recovery,
residual oil saturation, and Amott-Harvey wettability index were calculated after every run. Most
of the runs confirmed the shift of the wettability index towards water-wet condition after a
lowered salinity run. The best case was with ANS lake water with maximum oil recovery. It was
also observed that oil was being produced even during the idle time of injection. This suggests
that the water, which is flooded at a lower flow rate, takes its time to spread into pore capillaries
during the flow time and displaces oil during the idle time.
For the third set, experiments were conducted on new (clean) core samples. As stated earlier,
waterfloods were carried out using 22,000 TDS salinity brine. A constant flow rate of 30 cc/hr
was used. Two time intervals of the pulse were used: 1 min and 0.3 min. The results showed a
clear reduction in the residual oil saturation with 0.3-min and then 1-min pulse intervals. There
was a slight increase in oil recovery with the lesser time interval pulse.
All the results are displayed in graphs and tables.
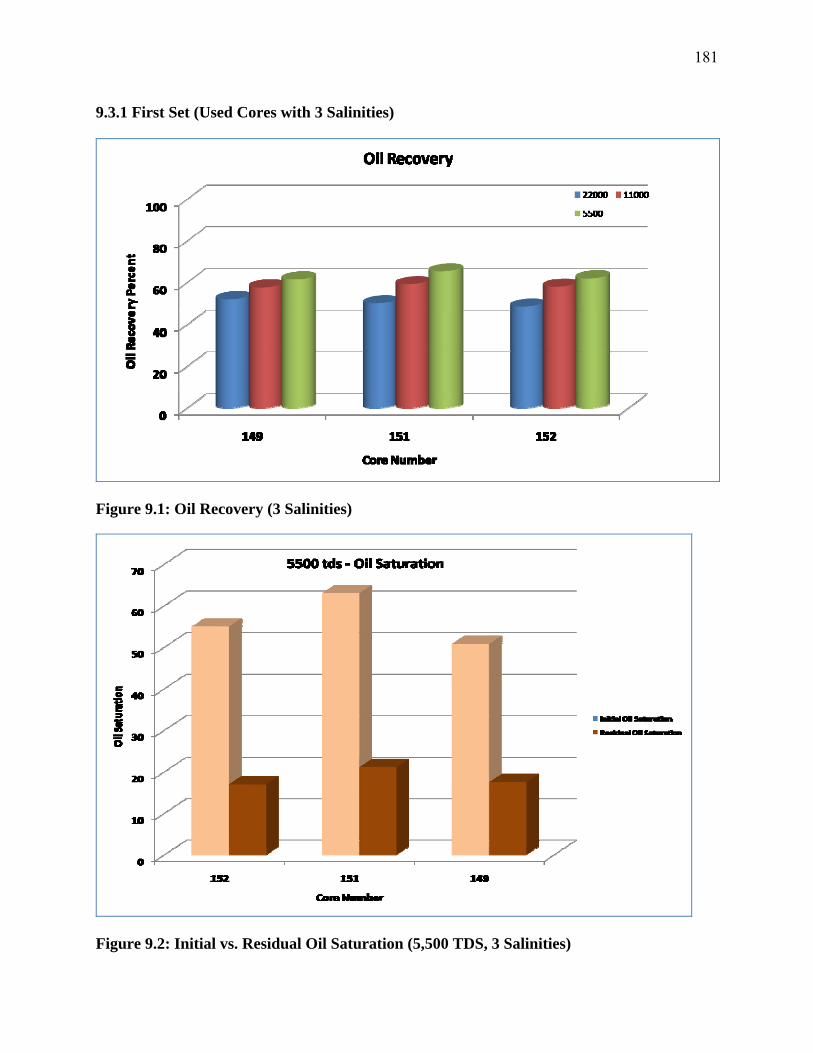
181
9.3.1 First Set (Used Cores with 3 Salinities)
Figure 9.1: Oil Recovery (3 Salinities)
Figure 9.2: Initial vs. Residual Oil Saturation (5,500 TDS, 3 Salinities)
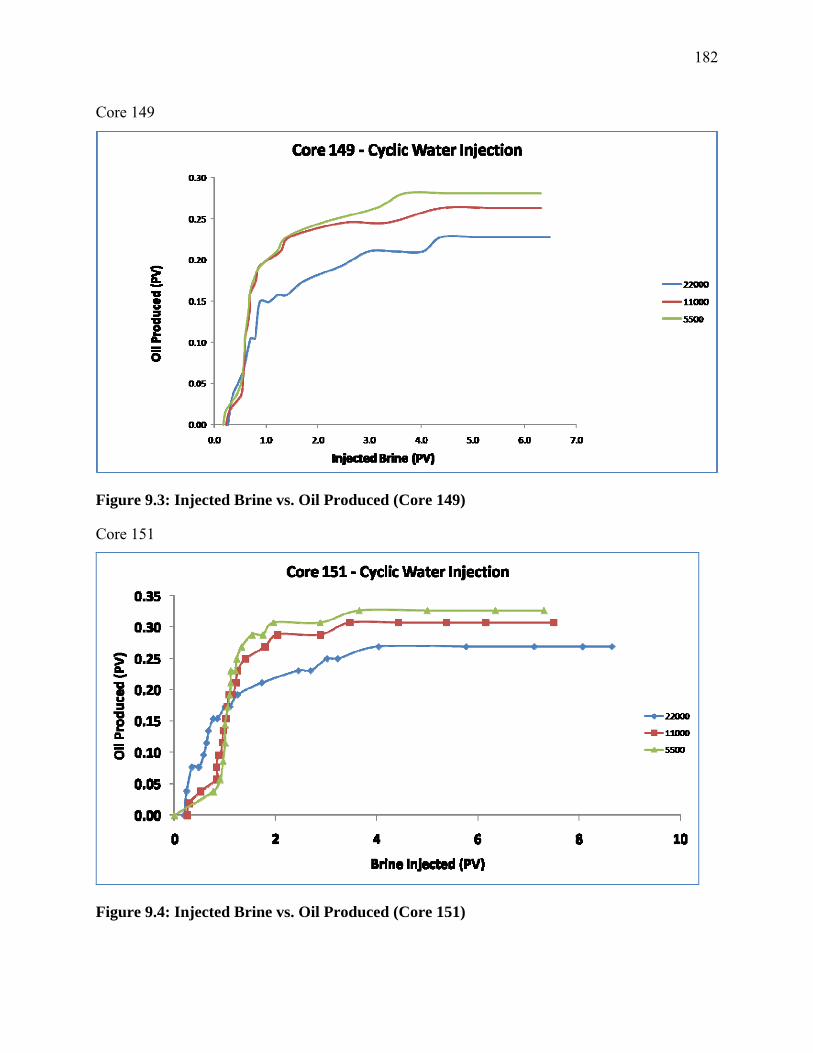
182
Core 149
Figure 9.3: Injected Brine vs. Oil Produced (Core 149)
Core 151
Figure 9.4: Injected Brine vs. Oil Produced (Core 151)
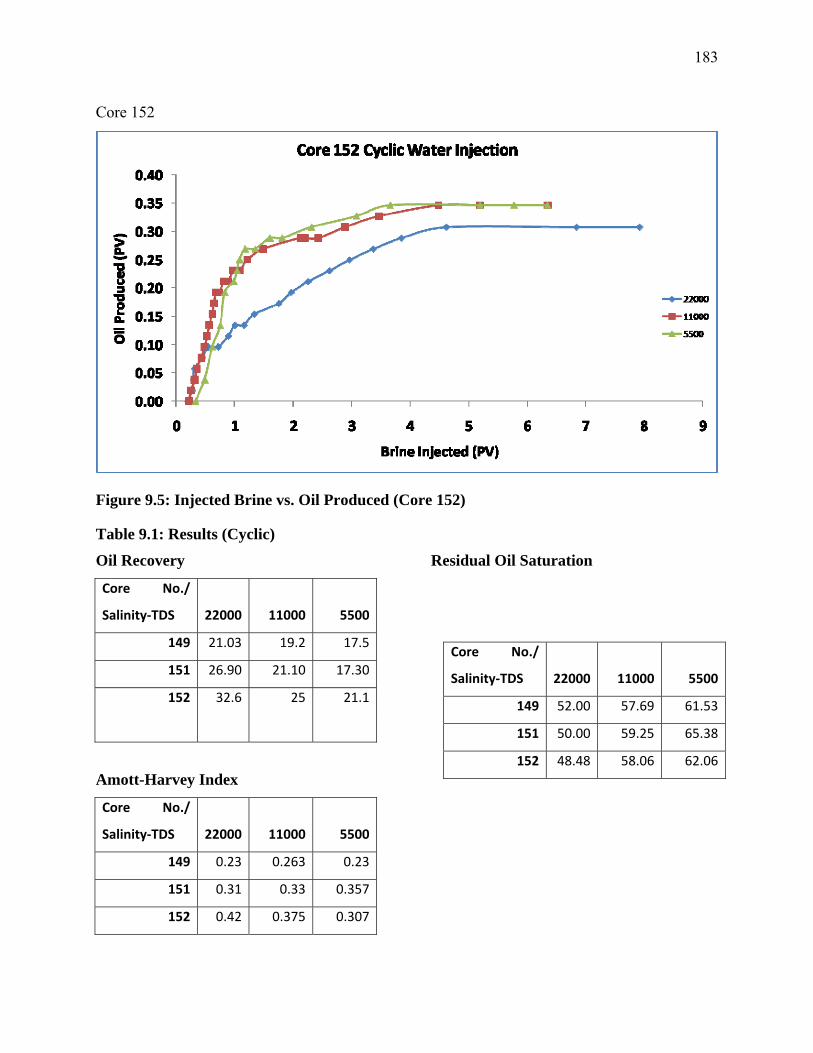
183
Core 152
Figure 9.5: Injected Brine vs. Oil Produced (Core 152)
Table 9.1: Results (Cyclic)
Oil Recovery Residual Oil Saturation
Core No./
Salinity‐TDS 22000 11000 5500
149 21.03 19.2 17.5
151 26.90 21.10 17.30
152 32.6 25 21.1
Amott-Harvey Index
Core No./
Salinity‐TDS 22000 11000 5500
149 0.23 0.263 0.23
151 0.31 0.33 0.357
152 0.42 0.375 0.307
Core No./
Salinity‐TDS 22000 11000 5500
149 52.00 57.69 61.53
151 50.00 59.25 65.38
152 48.48 58.06 62.06
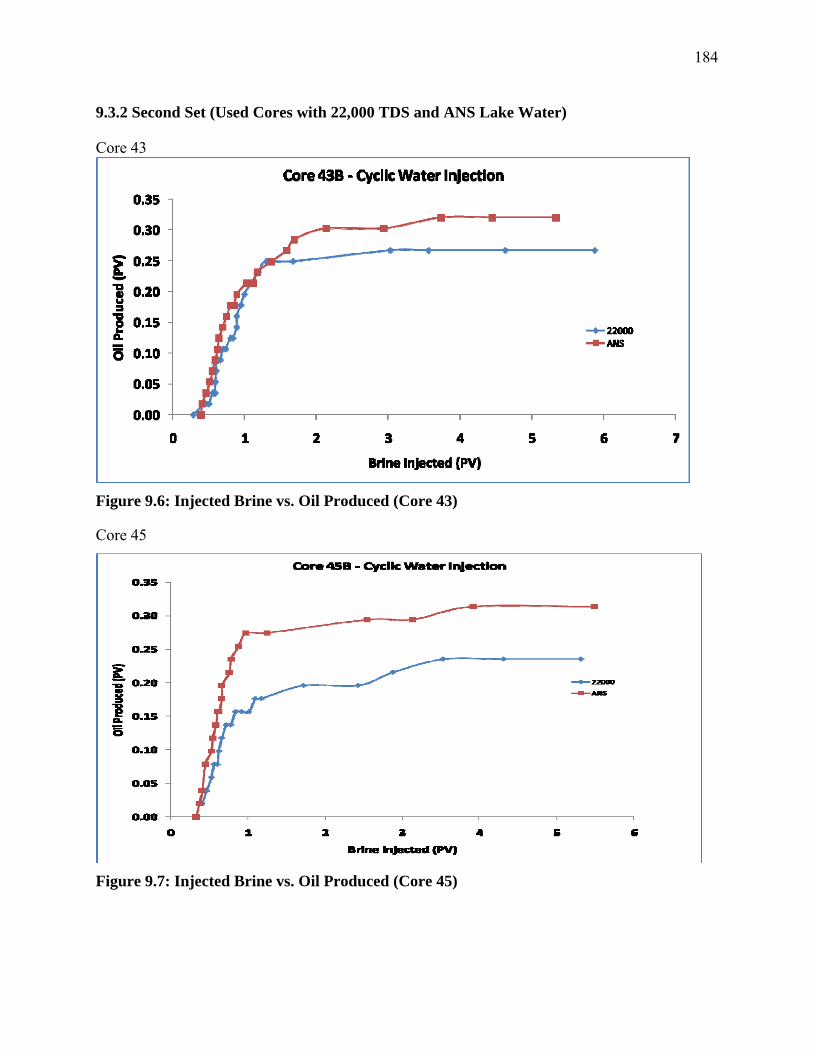
184
9.3.2 Second Set (Used Cores with 22,000 TDS and ANS Lake Water)
Core 43
Figure 9.6: Injected Brine vs. Oil Produced (Core 43)
Core 45
Figure 9.7: Injected Brine vs. Oil Produced (Core 45)
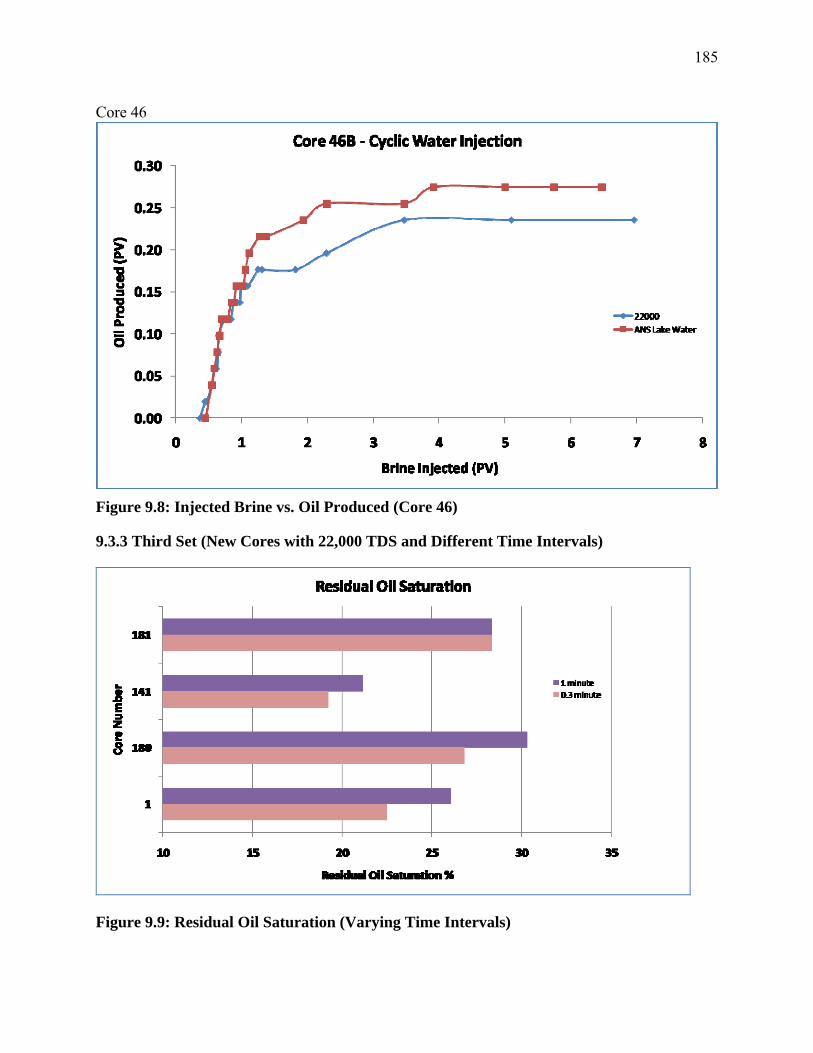
185
Core 46
Figure 9.8: Injected Brine vs. Oil Produced (Core 46)
9.3.3 Third Set (New Cores with 22,000 TDS and Different Time Intervals)
Figure 9.9: Residual Oil Saturation (Varying Time Intervals)
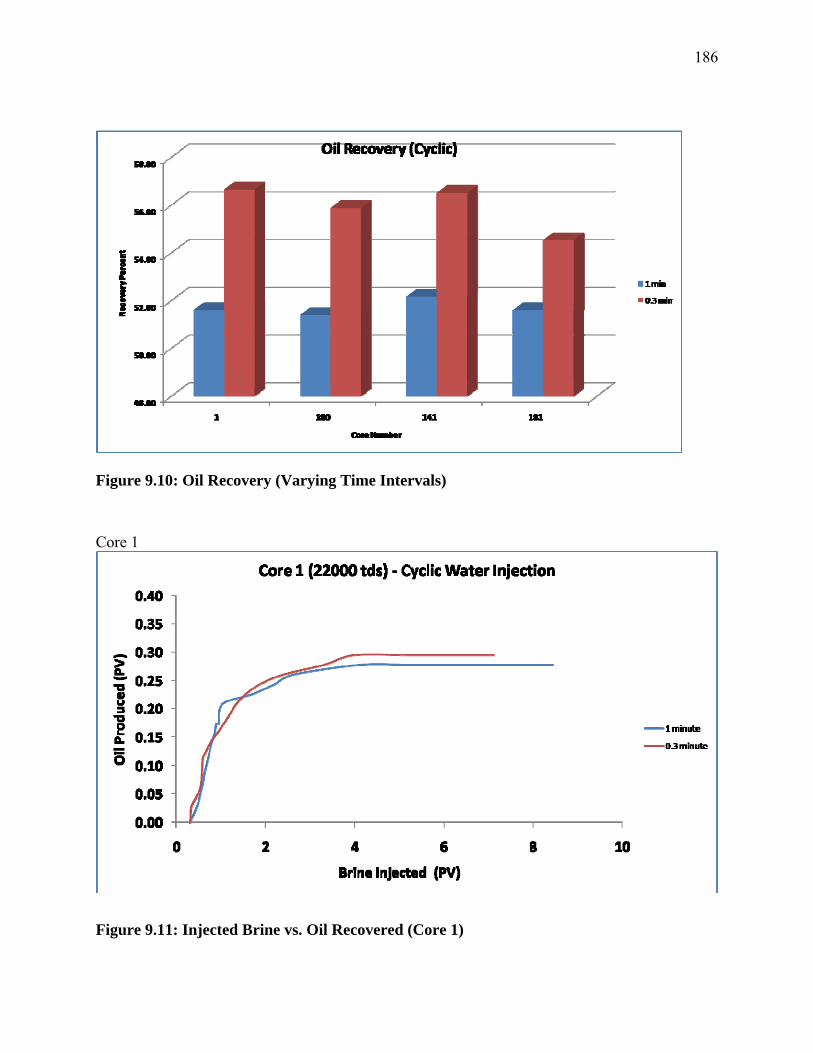
186
Figure 9.10: Oil Recovery (Varying Time Intervals)
Core 1
Figure 9.11: Injected Brine vs. Oil Recovered (Core 1)
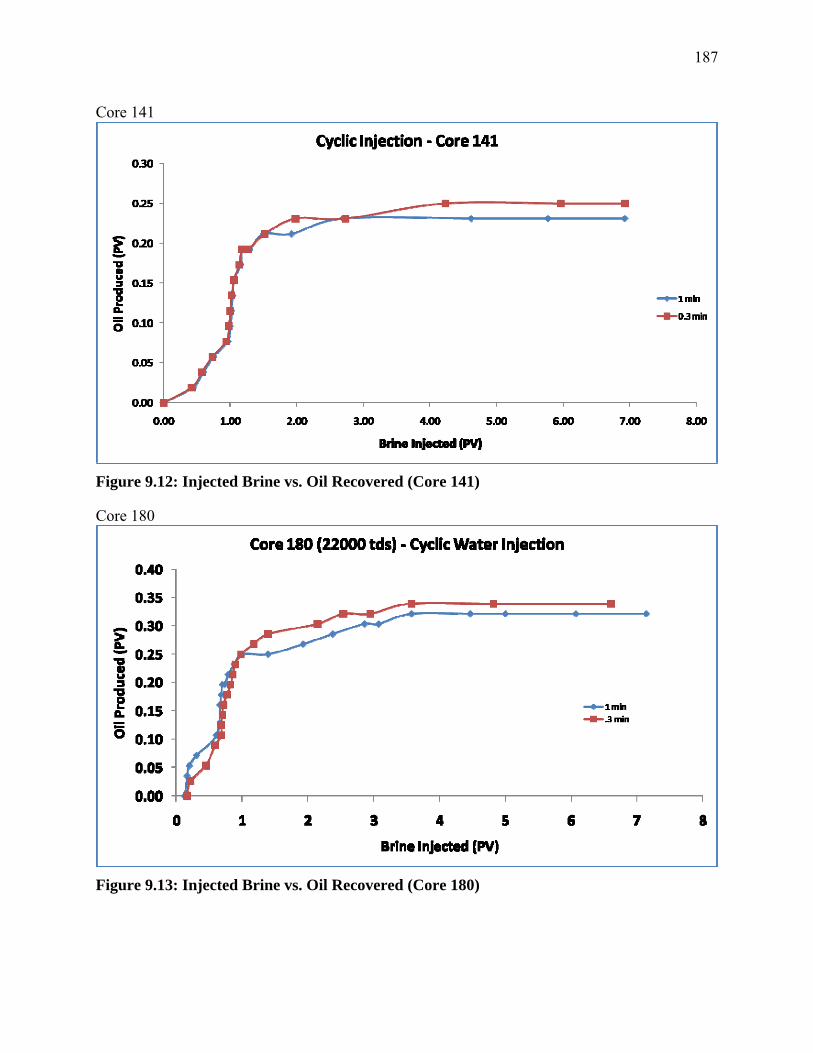
187
Core 141
Figure 9.12: Injected Brine vs. Oil Recovered (Core 141)
Core 180
Figure 9.13: Injected Brine vs. Oil Recovered (Core 180)
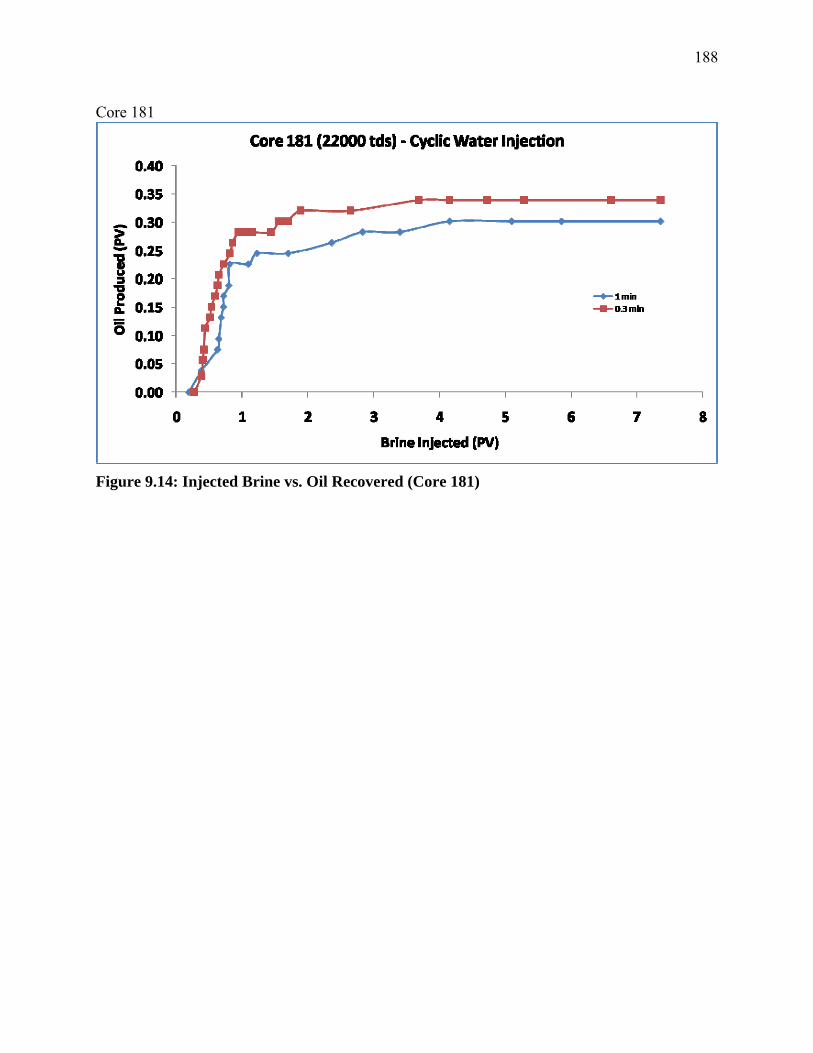
188
Core 181
Figure 9.14: Injected Brine vs. Oil Recovered (Core 181)
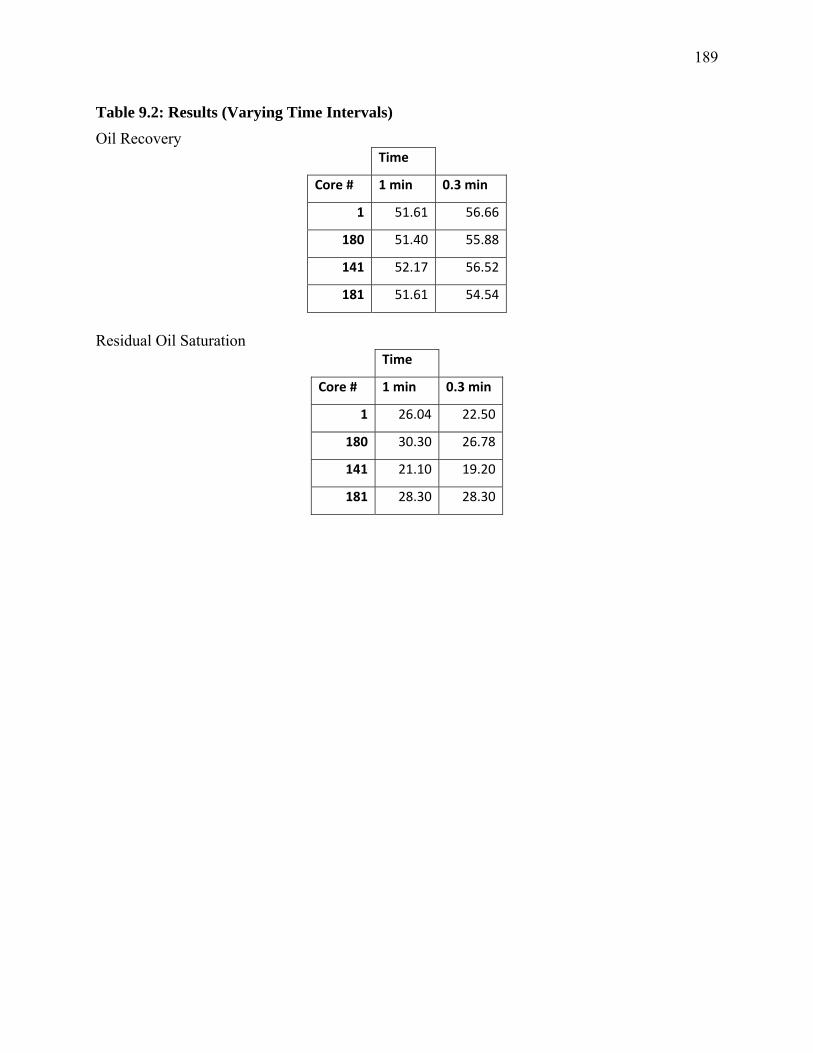
189
Table 9.2: Results (Varying Time Intervals) Oil Recovery
Time
Core # 1 min 0.3 min
1 51.61 56.66
180 51.40 55.88
141 52.17 56.52
181 51.61 54.54
Residual Oil Saturation
Time
Core # 1 min 0.3 min
1 26.04 22.50
180 30.30 26.78
141 21.10 19.20
181 28.30 28.30
190
CHAPTER 10: Conclusions and Recommendations
10.1 Conclusions
1. Extensive literature review on the effect of wettability on oil recovery has been done and
presented. Reported cases of improved oil recovery for water-wet, intermediate-wet,
mixed-wet, and oil-wet conditions have been reported. While there is no consensus on the
wetting state for optimal oil recovery, more research findings seem to indicate that some
form of intermediate wetting condition leads to optimal oil recovery. It is pertinent to
note that characterizing a mixed-wet state using the Amott-Harvey method results in an
index value that is typically classified as intermediate-wet.
2. The coreflood rig used for the all coreflood studies was developed indigenously. The
development process ranged from baseline design on paper, to equipment ordering, to
interfacing different parts of the equipment from different manufacturers and finally
running the coreflood rig. The rig performed as anticipated and all operational issues that
arose while running the rig were addressed.
3. Low-salinity waterfloods performed on two different types of core samples and oil
samples (TAPS crude oil and decane) showed improvement in waterflood characteristics
with observed reduction in residual oil saturation and improvement in the oil recovery
efficiency. Incremental oil was recovered when the salinity of the brine was reduced from
4% to 2% to 1%.
4. Low-salinity waterfloods have the potential for improved oil recovery for either the
tertiary recovery or secondary recovery process. When low-salinity brine is used for the
tertiary oil recovery, simultaneous production of oil and water is observed. The tertiary
process was carried out by injecting the high-salinity brine followed immediately by the
low-salinity brines. For the secondary recovery process, production of only the oil phase
was observed until water breakthrough with no further oil production observed after the
breakthrough of water. For the secondary recovery process, all the corefloods
commenced at the same initial condition where the core is at the connate water saturation.
The observed increase in recovery with low-salinity corefloods is consistent with
experimental results reported by other researchers. However, some researchers have
191
reported that no improved oil recovery was observed for low-salinity waterflood in the
secondary recovery process.
5. When the injected brine was heated, it is observed that more oil is recovered compared to
injecting brine of similar salinity at ambient temperature. It is suspected that, in addition
to other mechanisms, the improved recovery of oil at elevated temperature may be due to
viscosity reduction of the TAPS crude oil. Published research studies on the effect of
change in oil viscosity in mobilization of the trapped-oil phase during waterflooding
indicate that some reduction in residual oil saturation was observed.
6. The injection of low-salinity brine (at ambient and elevated temperature), for the
decane/DNR core system resulted in an increase in the Amott-Harvey index and thus
water-wetness of the core samples. This observed trend in wettability variation with
reduction in brine salinity agreed with some of the published results of similar
experimental studies, but is incongruent with other published results that indicated a
decrease in water-wetness. Currently, published reports that explain the mechanism of
COBR interaction that results in increase in water-wetness of core samples with decrease
in brine salinity are few. One such report has indicated the influence of brine pH in
wettability change, with high pH brine resulting in a more water-wet condition and lower
pH brine resulting in a less water-wet condition.
7. Results from this study indicate that there is potential for increasing ANS oil production
and thus increasing the throughput of TAPS by improving oil recovery in matured ANS
oil reservoirs through low-salinity brine injection. Currently waterflooding at ANS is
done using formation water and formation water typically has high salinity. Research
suggests that a cost-effective means of achieving low-salinity brine injection is by
diluting the formation water by mixing with seawater. However, further research has
indicated no benefits in terms of incremental oil recovery based on mixing formation
brine and seawater. Two plausible options for ANS would be to use the low-salinity
water reservoir, Prince Creek reservoir, located at the ANS or to set up a brine
desalination plant.
8. The injection of low-salinity brine at reservoir temperature, for the ANS crude oil/ANS
new (clean) core system resulted in an increase in the Amott-Harvey wettability index
and thus water-wetness of the core samples. This observed trend in wettability variation
192
with reduction in brine salinity agreed with some of the published results of similar
experimental studies.
9. The low-salinity waterflood also resulted in an increase in the water-wetting state of ANS
crude oil/oil aged ANS core system.
10. The water-wetness of the ANS core samples decreased when the cores were aged with
ANS crude oil. Thus, the Amott-Harvey wettability index (IAH) shifted from strongly
water-wet to slightly water-wet condition. However, the injection of low-salinity brine
resulted in a slight increase in the water-wetness of the cores.
11. The low-salinity waterflood resulted in a reduction in residual oil saturation (Sor) as the
brine salinity decreased (from 22,000 TDS to 11,000 TDS and 5,500 TDS) for new
(clean) as well as oil aged ANS core samples. Thus, more pore volumes of oil are
recovered when brine of lower salinity is injected.
12. Experiments performed using ANS lake water (50–60 TDS), which serves the purpose of
less salinity brine, resulted in an increase of oil recovery. Hence, ANS lake water could
be considered as a potential option of water supply for the waterflooding process
employed on North Slope. Alternatively, ANS lake water can be considered for dilution
of the high-salinity ANS reservoir brine.
13. Low-salinity waterfloods have the potential for improved oil recovery in the secondary
recovery process. This could be concluded on the basis of experimental results obtained
from three sets of low-salinity waterflood experiments (partial as well as complete
reservoir condition corefloods), performed on ANS core samples, carried out as part of
the present study.
14. Cyclic water injection contributes to further reduction of residual oil saturation and this
has been consistently proved by all the runs conducted on both used and new
representative cores.
15. Significant increase in oil recovery is also observed in cyclic injection as compared to
continuous waterflooding and this can be groomed as a potential option for EOR.
16. Oil is produced even during the idle time of the injection and thus more oil has been
recovered with less usage of water. Lesser flow rates and lesser time pulse intervals is an
interesting option for secondary oil recovery.
193
10.2 Recommendations
1. There is need to conduct detailed economic evaluation of the logistics of transporting and
storing low-salinity brine from the Prince Creek formation to some of the distant ANS
fields, as well as the option of desalination of formation water. It is believed that the
gains as a result of improved oil recovery may more than offset the cost of transportation
and storage of the low-salinity brine or the desalination of the formation water.
2. Imaging technology such as X-ray, CT scanning could be considered for detailed
visualization of the pore space, especially at the residual oil saturation condition to
determine the location of remaining oil. This will also help in better understanding of the
relationship between wettability and residual oil saturation as much information can be
obtained by visualization of the pore space.
3. Since low-salinity ANS lake water floods showed promising results in terms of
significantly reduced residual oil saturation, this water can be considered as a potential
source for either direct injection or dilution of high-salinity reservoir water to reap the
benefits of low-salinity waterfloods. However, a detailed study on the economics of these
two options is worth considering for future work.
194
REFERENCES
1 Buckley, S.E. and Leverett, M.C.: “Mechanism of Fluid Displacement in Sands,” Trans.,
AIME (1942) 146, 187–196. 2 Rathmell, J.J., Braun, P.H. and Perkins, T.K.: “Reservoir Waterflood Residual Oil
Saturation from Laboratory Tests,” JPT (February1973) 25, 175–185. 3 Jerauld, G.R. and Rathmell, J.J.: “Wettability and Relative Permeability of Prudhoe Bay: A
Case Study in Mixed-Wet Reservoirs,” paper SPE 28576 presented at the 1994 SPE Annual
Technical Conference and Exhibition, New Orleans, Louisiana, 25–28 September. 4 Morrow N.R., Cram, P.J. and McCaffrey, F.G.: “Displacement Studies in Dolomite with
Wettability Control by Octanoic Acid,” SPEJ (August 1973); Trans., AIME, 255, 221–232. 5 Anderson, W.G.: “Wettability Literature Survey-Part 6: The Effects of Wettability on
Waterflooding,” JPT (December 1987) 39, 1605–1622. 6 Li K. and Firoozabadi, A.: “Experimental Study of Wettability Alteration to Preferential
Gas-Wetness in Porous Media and it Effects,” SPEREE (April 2000) 139–149. 7 Morrow N.R.: “Wettability and Its Effect on Oil Recovery,” JPT (December 1990) 1476–
1484. 8 Denekas, M.O, Mattax, C.C. and Davis, G.T.: “Effect of Crude Oil Components on Rock
Wettability,” JPT (November 1959); Trans., AIME, 216, 330–333. 9 Brown, R.J. and Fatt, I.: “Measurements of Fractional Wettability of Oilfield Rocks by
Nuclear Magnetic Relaxation Method,” Trans., AIME (1956) 207, 262–264. 10 Jones, S.C. and Roszelle, W.O.: “Graphical Techniques for Determining Relative
Permeability from Displacement Experiments,” JPT (May 1978) 807–817. 11 Owens, W.W. and Archer, D.L.: “The Effect of Rock Wettability on Oil-Water Relative
Permeability Relationships,” JPT (July 1971); Trans., AIME, 251, 873–878. 12 Anderson, W.G.: “Wettability Literature Survey – Part 2: Wettability measurement,” JPT
(Nov 1987), 1246–1262. 13 Treiber, L.E., Archer, D.L. and Owens, W.W.: “A Laboratory Evaluation of the Wettability
of Fifty Oil-Producing Reservoirs,” SPEJ (December 1972); Trans., AIME, 253, 531–540.
195
14 Amott, E.: “Observations Relating to the Wettability of Porous Rock,” Trans., AIME (1959)
216, 156-192. 15 Cuiec, L.E.: “Wettability and Oil Reservoirs,” Proc., North Sea Oil and Gas Reservoirs
Seminar, Trondheim, Norway, (December 1985), Graham and Trotman (eds.), London,
193–207. 16 Boneau, D.F. and Clampitt, R.L.: “A Surfactant System for the Oil-Wet Sandstone of the
North Burbank Unit,” JPT (May1977) 501–506. 17 Robin, M.: “Interfacial Phenomena: Reservoir Wettability in Oil Recovery,” Oil and Gas J.
(2001) 56, No. 1, 55–62. 18 Cuiec, L.E.: “Rock/Crude Oil Interactions and Wettability: An Attempt to Understand Their
Interrelation,” paper SPE 13211 presented at the 1984 SPE Annual Technical Conference
and Exhibition, Houston, Texas, September 16–19. 19 Adamson, A.W.: Physical Chemistry of Surfaces, Fourth Edition, John Wiley and Sons Inc.,
New York City (1982) 332–368. 20 Melrose J.C.: “Wettability as Related to Capillary Action in Porous Media,” SPEJ
(September 1965) 259–271. 21 Morrow, N.R.: “Capillary Pressure Correlations for Uniformly Wetted Porous Media,” J.
Cdn. Pet Tech. (October-December 1976) 15, No. 4, 49–69. 22 Donaldson, E.C., Thomas, R.D. and Lorenz, P.B.: “Wettability Determination and its Effect
on Recovery Efficiency,” SPEJ (March 1969) 13–20. 23 Leverett, M.C.: “Capillary Behavior in Porous Solids,” Trans., AIME (1941) 142, 152–169. 24 Morrow, N.R.: “Physics and Thermodynamics of Capillary Action in Porous Media,” Ind.
Eng. Chem. (June 1970) 62, No. 6, 32–56. 25 Morrow, N.R., Lim, H.T. and Ward, J.S.: “Effect of Crude-Oil-Induced Wettability Changes
on Oil Recovery,” paper SPE 13215; SPEFE, (February 1986), 89–103. 26 Sharma, M.M. and Wunderlich, R.W.: “The Alteration of Rock Properties due to
Interactions with Drilling Fluid Components,” paper SPE 14302 presented at the 1985 SPE
Annual Technical Conference and Exhibition, Las Vegas, Nevada, September 22–25. 27 Ma, S.M., Zhang, X., Morrow, N.R and Zhou, X.: “Characterization of Wettability from
Spontaneous Imbibition Measurements,” J. Cdn. Pet. Tech. (1999) 38, No. 13, 1 – 8.
196
28 Basu S. and Sharma, M.M.: “Characterization of Mixed-Wettability States in Oil Reservoirs
by Atomic Force Microscopy,” SPEJ (December 1997) 2, 427–435. 29 Strand, S., Standnes, D.C. and Austad, T.: “New Wettability Test for Chalk,” paper
presented at the 2004, 8th International Symposium on Reservoir Wettability and its Effect
on Oil Recovery, Houston, Texas, 16–18 May. 30 Looyestijn, W. and Hofman, J.: “Wettability Index Determination by Nuclear Magnetic
Resonance,” paper SPE 93624 presented at the 2005, 14th SPE Middle East Oil and Gas
Show and Conference, Bahrain, 12–15 March. 31 Li, K. and Horne, R.N.: “A Wettability Evaluation Method for Both Gas-Liquid-Rock and
Liquid-Liquid-Rock Systems,” paper SPE 80233 presented at the 2003 SPE International
Symposium on Oilfield Chemistry, Houston, Texas, February 5–8. 32 Li, K. and Horne, R.N.: “Wettability of Steam-Water-Rock Systems,” Proc. Seventh
International Symposium on Reservoir Wettability, Freycinet, Tasmania, Australia, (March
12–15, 2002). 33 Kyte, J.R., Naumann, V.O. and Mattax, C.C.: “Effect of Reservoir Environment on Water-
Oil Displacements,” JPT (June 1961) 579–582. 34 Cuiec, L.: in Interfacial Phenomena in Petroleum Recovery, N. Morrow (ed.) Marcel
Dekker, New York, New York (1991). 35 Schmid C.: “The Wettability of Petroleum Rocks and the Results of Experiments to Study
Effects of Variations in Wettability of Core Samples,” Erdoel Kohle (August 1964) 17, No.
8, 605–609. 36 Holbrook, O.C. and Bernard, G.C.: “Determination of Wettability by Dye Adsorption,”
Trans. AIME (1955) 204, 86–91. 37 Iwankow, E.N.: “A Correlation of Interstitial Water Saturation and Heterogeneous
Wettability,” Prod. Monthly (October 1960) 24, 18. 38 Salathiel, R.A.: “Oil Recovery by Surface Film Drainage in Mixed-Wettability Rocks,” JPT
(October 1973) 1216–1224. 39 Trantham, J.C and Clampitt, R.L.: “Determination of Oil Saturation after Waterflooding in
an Oil-Wet Reservoir – The North Burbank Unit Track 97 Project,” JPT (May 1977) 491–
500.

197
40 Reisberg, J. and Doscher, T. M.: “Interfacial Phenomena in Crude-Oil-Water Systems,”
Prod. Monthly (Nov. 1956) 20, 43–50. 41 Johansen, R.T. and Dunning, H.N.: “Relative Wetting Tendencies of Crude Oils by
Capillarimetric Method,” Prod Monthly (September 1959) 23, 20.
42 Mungan, N.: “Relative Permeability Measurements Using Reservoir Fluids,” SPEJ (October
1972) 398–402. 43 Hirasaki, G.J.: “Wettability: Fundamentals and Surface Forces,” SPEFE (1991) 6, 217–226. 44 Kaminsky, R. and Radke C.J.: “Water Films, Asphaltenes, and Wettability Alteration,”
paper SPE 39087 presented at the 1998 SPE/DOE Symposium on IOR, Tulsa, Oklahoma,
19–22 April. 45 Bobek, J.E., Mattax, C.C. and Denekas, M.O.: “Reservoir Rock Wettability – Its
Significance and Evaluation,” Trans. AIME (1958) 213, 155–160. 46 Wunderlich, R.W.: “Obtaining Samples with Preserved Wettability,” Interfacial Phenomena
in Oil Recovery, N.R. Morrow (ed.), Marcell Dekker, New York City (1990), 289–318. 47 Morgan, J.T. and Gordon, G.T.: “Influence of Pore Geometry on Water-Oil Relative
Permeability,” JPT (October 1970), 199–208. 48 Craig, F.F., Jr.: The Reservoir Engineering Aspects of Waterflooding, Monograph Series 3,
SPE-AIME, Dallas, Texas (1971). 49 Raza, S.H., Treiber, L.E. and Archer, D.L.: “Wettability of Reservoir Rocks and its
Evaluation,” Prod. Monthly (April 1968) 32, No. 4, 2–7. 50 Donaldson, E.C., Chilingarian, G.V. and Yen, T.F.: “Enhanced Oil Recovery, I–
Fundamentals and Analyses,” Developments in Petroleum Science, 17A, Elsevier 1985. 51 Donaldson, E.C. and Thomas, R.D.: “Microscopic Observations of Oil Displacement in
Water-Wet and Oil-Wet Systems,” paper SPE 3555 Presented at the 1971 SPE Annual
Meeting, New Orleans, Louisiana. 52 Anderson, W.G.: “Wettability Literature Survey – Part 5: The Effects of Wettability on
Relative Permeability,” JPT (November 1987) 1453–1468. 53 Mungan, N.: “Interfacial Effects in Immiscible Liquid-Liquid Displacement in Porous
Media,” SPEJ (September 1966); Trans., AIME, 237, 247–253.
198
54 McCaffery, F.G.: “The Effect of Wettability on Relative Permeability and Imbibition in
Porous Media,” PhD dissertation, U. of Calgary, Calgary, Alberta (1973). 55 McCaffery, F.G. and Bennion, D.W.: “The Effect of Wettability on Two-Phase Relative
Permeabilities,” J Cdn. Pet. Tech. (October–December 1974) 13, No. 4, 42-53. 56 Morrow N.R. and Mungan, N.: “Wettability and Capillarity in Porous Media,” Report RR-7,
Petroleum Recovery Research Institute, Calgary, Alberta (January 1971). 57 Morrow N.R. and McCaffery, F.G.: Displacement Performance in Uniformly Wetted Porous
Media, Wetting, Spreading, and Adhesion, G.F. Padday (ed.) Academic Press, New York
City (1978). 58 Morgan, J.T. and Gordon, D.T.: “Influence of Pore Geometry on Water-Oil Relative
Permeabilities,” JPT (Oct. 1970) 1199–1208. 59 Caudle, B.H., Slobod, R.L. and Brownscombe, E.R.: “Further Developments in the
Laboratory Determination of Relative Permeability,” Trans., AIME (1951) 192, 145–150. 60 Willhite, G.P.: Waterflooding, SPE Textbook Series, Richardson, TX (1996) 3. 61 Wang F.H.L.: “Effect of Wettability Variation on Water/Oil Relative Permeability,
Dispersion, and Flowable Saturation in Porous Media,” paper SPE 15019 presented at the
1986 Permian Basin Oil and Gas Recovery Conference of the SPE, Midland, Texas, 13–14
March. 62 Braun, E.M. and Blackwell, R.J.: “A Steady-State Technique for Measuring Oil-Water
Relative Permeability Curves at Reservoir Conditions,” paper SPE 10155 presented at the
56th Annual Fall Technical Conference and Exhibition of the SPE AIME, San Antonio,
Texas, (1981), October 5–7. 63 Richardson, J.G., Perkins, F.M., and Osoba, J.S.: “Differences in the Behavior of Fresh and
Aged East Texas Woodbine Cores,” Trans., AIME (1955) 204, 86–91. 64 Singhal, A.K., Mukherjee, D.P., and Somerton, W.H.: “Effect of Heterogeneous Wettability
on Flow of Fluids through Porous Media,” J. Cdn. Pet. Tech. (July–September 1976) 15,
No. 3, 63–70. 65 Fatt, I. and Klikoff, W.A.: “Effect of Fractional Wettability on Multiphase Flow through
Porous Media,” Trans., AIME (1959) 216, 426–432.

199
66 Moore, T.F. and Slobod, R.L.: “The Effect of Viscosity and Capillarity on the Displacement
of Oil by Water,” Prod. Monthly (August 1956) 20–30. 67 Kennedy, H.T., Burja, E.O. and Boykin, R.S.: “An Investigation of the Effects of
Wettability on the Recovery of Oil by Water Flooding,” J. Phys. Chem. (1955) 59, 867. 68 Li, K., Lenormand, R., Robin, M. and Codreanu, B.D.: “Numerical Evaluation of the
Combined Effect of Wettability and Heterogeneity on Waterflood Performance,” Proc.
Ninth European Symposium on Improved Oil Recovery, EAGE, Hague, Netherland, (1997)
October 20–22. 69 Jadhunandan, P.P. and Morrow, N.R.: “Effect of Wettability on Waterflood Recovery for
Crude-Oil/Brine/Rock Systems,” paper SPE 22597, presented at the 66th Annual Technical
Conference and Exhibition, Dallas, Texas, (1991) October 6-9. 70 Tweheyo, M.T., Holt, T. and Torsæter, O.: “An Experimental Study of the Relationship
between Wettability and Oil Production Characteristics,” J. Cdn. Pet. Tech. (1999) 24, 179–
188. 71 Kinney, P.T. and Nielsen, R.F.: “Wettability in Oil Recovery,” World Oil (April, 1951) 145. 72 Coley, L.H., Marsden, S.S. and Calhoun, J.C., Jr.: “A Study of the Effect of Wettability on
the Behavior of Fluids in Synthetic Porous Media,” Prod. Monthly (June 1956) 20, 29–45. 73 Newcombe, J., McGhee, J. and Rzasa, M.J.: “Wettability Versus Displacement in Water
Flooding in Unconsolidated Sand Columns,” Trans., AIME (1955) 204, 227–232. 74 Kyte, J.R., Naumann, V.O. and Mattax, C.C.: “Effect of Reservoir Environment on Water-
Oil Displacement,” SPEJ (July 1961); Trans., AIME, 222, 579–582 75 Mungan, N.: “Interfacial Effects in Immiscible Liquid-Liquid Displacement in Porous
Media,” SPEJ (September 1966); Trans., AIME, 137, 247–253. 76 Zhang, P. and Austad, T.: “The Relative Effects of Acid Number and Temperature on Chalk
Wettability,” paper SPE 92999 presented at the 2005 SPE International Symposium on
Oilfield Chemistry, Houston, Texas, 2–4 February. 77 Tang, G.Q. and Firoozabadi, A.: “Effect of Viscous Force and Initial Water Saturation on
Water Injection in Water-Wet and Mixed-Wet Fractured Porous Media” paper SPE 59291
presented at the 2000 SPE/DOE Improved Oil Recovery Symposium, Tulsa, Oklahoma, 3–5
April.
200
78 Høgnesen, E.J., Strand, S. and Austad, T.: “Waterflooding of Preferential Oil-Wet
Carbonates: Oil Recover Related to Reservoir Temperature and Brine Composition,” paper
SPE 94166 presented at the 2005 SPE Europe/EAGE Annual Conference, Madrid, Spain,
13–16 June. 79 Zhang, P. and Austad, T.: “Waterflooding in Chalk: Relationship Between Oil Recovery,
New Wettability Index, Brine Composition and Cationic Wettability Modifier,” paper SPE
94209 presented at the 2005 SPE Europe/EAGE Annual Conference, Madrid, Spain, 13–16
June. 80 Al-Hadhrami, H.S. and Blunt, M.J.: “Thermally Induced Wettability Alteration to Improve
Oil Recovery in Fractured Reservoirs,” paper SPE 71866, presented at the 2000 SPE/DOE
Improved Oil Recovery Symposium, Tulsa, Oklahoma, 3–5 April. 81 Graue, A. and Bognø T.: “Wettability Effects on Oil Recovery Mechanisms in Fractured
Reservoirs,” paper SPE 56672, presented at the 1999 SPE Annual Technical Conference and
Exhibition, Houston, Texas, 3–6 October. 82 Dixit, A.B., McDougall, S.R., Sorbie, K.S. and Buckley, J.S.: “Pore-Scale Modeling of
Wettability Effects and Their Influence on Oil Recovery,” paper SPE 54454; SPEREE
(February 1999) 25–36. 83 Wood A.R., Wilco, T.C., MacDonald, D.G., Flynn, J.J. and Angert, P.F.: “Determining
Effective Residual Oil Saturation for Mixed Wettability Reservoirs: Endicott Field, Alaska,”
paper SPE 22903 presented at the 1991 Annual Technical Conference and Exhibition of
SPE, Dallas, Texas, 6–9 October. 84 Huang,Y., Ringrose, P.S., Sorbie, K.S. and Larter, S.R.: “The Effects of Heterogeneity and
Wettability on Oil Recovery from Laminated Sedimentary Structures,” paper SPE 30781
presented at the 1995 SPE Annual Technical Conference and Exhibition, Dallas, Texas, 22–
25 October. 85 Talash, A.W. and Crawford, P.B.: “Experimental Flooding Characteristics of 75% Water-
Wet Sands,” Prod. Monthly (February 1961) 25, No. 2, 24–26. 86 Buckley, J.S. and Morrow, N.R.: An Overview of Crude Oil Adhesion Phenomena, Physical
Chemistry of Colloids and Interfaces in Oil Production, H.Toulhout, J. Lecourtier (Editors),
Editions Technip, Paris (1991).
201
87 Tang, G. and Morrow, N.R.: “Influence of Brine Composition and Fines Migration on Crude
Oil/Brine/Rock Interactions on Oil Recovery,” Proc. 5th International Symposium on
Evaluation of Reservoir Wettability and Its Effects on Oil Recovery, Trondheim, Norway,
(June 1998). 88 Buckley, J.S., Liu, Y. and Monsterlee, S.: “Mechanism of Wettability Alteration by Crude
Oils,” SPEJ (March 1998), 3, 54–61. 89 Tang, G. and Morrow, N.R.: “Oil Recovery by Waterflooding and Imbibition–Invading
Brine Cation Valency and Salinity,” Proc. International Symposium of the Society of Core
Analysts, Golden, Colorado, August 1999. 90 Tang, G. and Morrow, N.R.: “Salinity, Temperature, Oil Composition, and Oil Recovery by
Waterflooding,” paper SPE 36680 presented at the 1996 SPE Annual Technical Conference
and Exhibition, Denver, Colorado, 6–9 October. 91 Sharma, M.M. and Filoco, P.R.: “Effect of Brine Salinity and Crude-Oil Properties on Oil
Recovery and Residual Oil Saturations,” SPEJ (September 2000) 5, No 3, 293–300. 92 Filoco, P.R. and Sharma, M.M.: “Effect of Brine Salinity and Crude-Oil Properties on
Relative Permeabilities and Residual Saturations,” paper SPE 49320 presented at the 1998
SPE Annual Meeting, New Orleans, Louisiana, 27–30 September. 93 McGuire, P.L., Chatham, J.R., Paskvan, F.K., Sommer, D.M. and Carini, F.H.: “Low
Salinity Oil Recovery: An Exciting EOR Opportunity for Alaska’s North Slope,” paper SPE
93903 presented at the 2005 SPE Western Regional Meeting, Irvine, California, 30 March–1
April. 94 Webb, K.J., Black, C.J.J. and Al-Ajeel, H.: “Low Salinity Oil Recovery – Log-Inject-Log,”
paper SPE 89379, 2004 SPE/DOE Fourteenth Symposium on Improved Oil Recovery,
Tulsa, Oklahoma, 17–21 April. 95 Webb, K.J., Black, C.J.J. and Edmonds, I.J.: “Low Salinity Oil Recovery: The Role of
Reservoir Condition Corefloods,” 13th European Symposium on Improved Oil Recovery,
Budapest, Hungary, (2005) 25–27 April. 96 http://www.temco.com/tempstuff/cfr10.htm.
202
97 Melrose, J.C.: “Interpretation of Mixed Wettability States in Reservoir Rocks,” paper SPE
10971 presented at the 1982 SPE Annual Technical Conference and Exhibition, New
Orleans, Louisiana, 26–29 September. 98 Hall, A.C., Collins, S.H. and Melrose, J.C.: “Stability of Aqueous Wetting Films in
Athabasca Tar Sands,” paper SPE 10626 presented at the 1982 SPE Int’l Symposium on
Oilfield and Geothermal Chemistry, Dallas, Texas, 25–27 January. 99 Verwey, E.J.W. and Overbeek, J.T.G.: Theory of the Stability of Lyophobic Colloids,
Elsevier Scientific Publishing Co. Inc., New York City (1948) 66–105, 135–163. 100 Sharma, A.: “Phase Behavior Analysis of Gas-To-Liquid (GTL) Products for Transportation
through Trans-Alaskan Pipeline System,” MS Thesis, University of Alaska Fairbanks,
Alaska (August 2003). 101 Mohanty, K.K., Davis, H.T. and Scriven, L.E.: “Physics of Oil Entrapment in Water-Wet
Rock,” SPERE (February 1987) 113–128. 102 Taber J.J: “Dynamic and Static Forces Required to Remove a Discontinuous Oil Phase From
Porous Media Containing Both Oil and Water,” SPEJ (March 1969) 3–12. 103 Stegemeier, G.L.: Mechanism of Entrapment and Mobilization of Oil in Porous Media,
Improved Oil Recovery by Surfactant and Polymer Flooding, Academic Press, New York
City (1977) 55–91.
104 Saripalli, K. P., H. Kim, PSC Rao and M. D. Annable, 1997. “Use of Interfacial Tracers to
Measure Immiscible Fluid Interfacial Areas in Porous Media”, Env. Sci. and Tech., 31(3):
932-936.
105 Vijapurapu, S. and R. Dandina. Effect of brine dilution and surfactant concentration on
spreading and wettability, SPE 80273.

203
NOMENCLATURE
1. Vosp – Volume of spontaneous oil displacement
2. Vofd – Volume of forced oil displacement
3. Vwsp – Volume of spontaneous water displacement
4. Vwfd – Volume of forced water displacement
5. Iw – Displacement by water ratio
6. Io – Displacement by oil ratio
7. EOR – Enhanced Oil Recovery
8. ANS – Alaska North Slope
9. IOR – Improved Oil Recovery
10. AETDL – Arctic Energy Technology Development Laboratory
11. DNR – Department of Natural Resources
12. KR – Kuparuk River
13. IWS – Interstitial Water Saturation
14. PV – Pore Volume
15. ROS, SOR – Residual Oil Saturation
16. OOIP – Original Oil in Place
17. ppm – Parts per million
18. PFS – Produced Fluid Separator
19. DP – Differential Pressure
20. TDS – Total Dissolved Solids
21. DI – de-ionized
22. Swc – Connate Water Saturation
23. IFT – Interfacial tension
24. OWC – Oil/Water Contact
25. IAH – Amott Harvey Wettability Index
204
APPENDIX
Citations of papers published based on the work conducted in this project:
1. Agbalaka, C.C., Dandekar, A.Y., Patil, S.L., Khataniar, S. and Hemsath, J.R.:
Coreflooding Studies To Evaluate The Impact Of Salinity And Wettability On Oil
Recovery Efficiency. Transport in Porous Media; DOI 10.1007/s11242-008-9235-7, web
release May 6, 2008. (Corresponding Author)
2. Patil, S.B., Dandekar, A.Y., Patil, S.L., Khataniar, S.: “Low Salinity Brine Injection for
EOR on Alaska North Slope (ANS)”. Accepted for presentation at the International
Petroleum technology Conference, 3-5 December 2008, Kuala Lumpur, Malaysia.
3. Agbalaka, C.C., Dandekar, A.Y., Patil, S.L., Khataniar, S. and Hemsath, J.R.: “The
Effect of Wettability on Oil Recovery: A Review”. Accepted for presentation as alternate
paper or poster at the SPE Asia Pacific Oil & Gas Conference and Exhibition
(APOGCE), October 2008 in Perth, Australia.
4. Kulathu, S., Dandekar, A., Patil, S., Khataniar, S. and Chukwu, G.A.: “Low salinity
cyclic water floods for enhanced oil recovery in Alaska North Slope”. Presented at the
2008 Arctic Science Conference, September 2008.

National Energy Technology Laboratory 626 Cochrans Mill Road P.O. Box 10940 Pittsburgh, PA 15236-0940 3610 Collins Ferry Road P.O. Box 880 Morgantown, WV 26507-0880 One West Third Street, Suite 1400 Tulsa, OK 74103-3519 1450 Queen Avenue SW Albany, OR 97321-2198 539 Duckering Bldg./UAF Campus P.O. Box 750172 Fairbanks, AK 99775-0172 Visit the NETL website at: www.netl.doe.gov Customer Service: 1-800-553-7681