Characterization of Microbiota in Bronchiectasis Patients ...
10
Journal of Clinical Medicine Article Characterization of Microbiota in Bronchiectasis Patients with Different Disease Severities Sang Hoon Lee 1 , YeonJoo Lee 2 , Jong Sun Park 2 , Young-Jae Cho 2 , Ho Il Yoon 2 , Choon-Taek Lee 2 and Jae Ho Lee 2, * 1 Division of Pulmonology, Department of Internal Medicine, Severance Hospital, Institute of Chest Diseases, Yonsei University College of Medicine, Seoul 120-752, Korea; [email protected] 2 Division of Pulmonary and Critical Care Medicine, Department of Internal Medicine Seoul National University Bundang Hospital, 82 Gumi-ro, 173 Beon-gil, Bundang-gu, Seongnam-si, Gyeonggi-do 463-707, Korea; [email protected] (Y.L.); [email protected] (J.S.P.); [email protected] (Y.-J.C.); [email protected] (H.I.Y.); [email protected] (C.-T.L.) * Correspondence: [email protected]; Tel.: +82-317-877-054 Received: 10 October 2018; Accepted: 6 November 2018; Published: 9 November 2018 Abstract: The applications of the 16S rRNA gene pyrosequencing has expanded our knowledge of the respiratory tract microbiome originally obtained using conventional, culture-based methods. In this study, we employed DNA-based molecular techniques for examining the sputum microbiome in bronchiectasis patients, in relation to disease severity. Of the sixty-three study subjects, forty-two had mild and twenty-one had moderate or severe bronchiectasis, which was classified by calculating the FACED score, based on the FEV 1 (forced expiratory volume in 1 s, %) (F, 0–2 points), age (A, 0–2 points), chronic colonization by Pseudomonas aeruginosa (C, 0–1 point), radiographic extension (E, 0–1 point), and dyspnoea (D, 0–1 point). Bronchiectasis was defined as mild, at 0–2 points, moderate at 3–4 points, and severe at 5–7 points. The mean age was 68.0 ± 9.3 years; thirty-three patients were women. Haemophilus (p = 0.005) and Rothia (p = 0.043) were significantly more abundant in the mild bronchiectasis group, whereas Pseudomonas (p = 0.031) was significantly more abundant in the moderate or severe group. However, in terms of the alpha and beta diversity, the sputum microbiota of the two groups did not significantly differ, i.e., the same dominant genera were found in all samples. Further large-scale studies are needed to investigate the sputum microbiome in bronchiectasis. Keywords: bronchiectasis; FACED score; microbiome 1. Introduction Bronchiectasis is a chronic, irreversible airway disease with abnormal dilatation of one or more bronchi, causing chronic cough and purulent sputum production. Impaired mucociliary clearance in bronchiectasis patients is associated with continuous or repeated respiratory infection, inducing a vicious cycle of blockage, inflammation, exacerbation, and damage in the affected bronchi [1]. Bronchiectasis is associated with extended hospitalizations and high mortality, causing a significant economic burden [2,3]. Prevention of exacerbation, reduction of respiratory symptoms, and stopping the progression of the disease are important for the management of bronchiectasis [4]. By improving the bronchial hygiene and decreasing bronchial inflammation, recurrent infection and frequent exacerbation can be prevented [5]. Therefore, the ability to precisely identify colonizing bacterial species, including potential pathogens, is important for clinicians who treat bronchiectasis patients. Conventional, culture-based microbiological analyses identified multiple bacterial pathogens in bronchiectasis patients, such as Pseudomonas aeruginosa, Haemophilus influenzae, Streptococcus J. Clin. Med. 2018, 7, 429; doi:10.3390/jcm7110429 www.mdpi.com/journal/jcm
Transcript of Characterization of Microbiota in Bronchiectasis Patients ...

Journal of
Clinical Medicine
Article
Characterization of Microbiota in BronchiectasisPatients with Different Disease Severities
Sang Hoon Lee 1 , YeonJoo Lee 2, Jong Sun Park 2, Young-Jae Cho 2, Ho Il Yoon 2,Choon-Taek Lee 2 and Jae Ho Lee 2,*
1 Division of Pulmonology, Department of Internal Medicine, Severance Hospital, Institute of Chest Diseases,Yonsei University College of Medicine, Seoul 120-752, Korea; [email protected]
2 Division of Pulmonary and Critical Care Medicine, Department of Internal Medicine Seoul NationalUniversity Bundang Hospital, 82 Gumi-ro, 173 Beon-gil, Bundang-gu, Seongnam-si,Gyeonggi-do 463-707, Korea; [email protected] (Y.L.); [email protected] (J.S.P.);[email protected] (Y.-J.C.); [email protected] (H.I.Y.); [email protected] (C.-T.L.)
* Correspondence: [email protected]; Tel.: +82-317-877-054
Received: 10 October 2018; Accepted: 6 November 2018; Published: 9 November 2018�����������������
Abstract: The applications of the 16S rRNA gene pyrosequencing has expanded our knowledge ofthe respiratory tract microbiome originally obtained using conventional, culture-based methods.In this study, we employed DNA-based molecular techniques for examining the sputum microbiomein bronchiectasis patients, in relation to disease severity. Of the sixty-three study subjects,forty-two had mild and twenty-one had moderate or severe bronchiectasis, which was classified bycalculating the FACED score, based on the FEV1 (forced expiratory volume in 1 s, %) (F, 0–2 points),age (A, 0–2 points), chronic colonization by Pseudomonas aeruginosa (C, 0–1 point), radiographicextension (E, 0–1 point), and dyspnoea (D, 0–1 point). Bronchiectasis was defined as mild,at 0–2 points, moderate at 3–4 points, and severe at 5–7 points. The mean age was 68.0 ± 9.3 years;thirty-three patients were women. Haemophilus (p = 0.005) and Rothia (p = 0.043) were significantlymore abundant in the mild bronchiectasis group, whereas Pseudomonas (p = 0.031) was significantlymore abundant in the moderate or severe group. However, in terms of the alpha and beta diversity,the sputum microbiota of the two groups did not significantly differ, i.e., the same dominantgenera were found in all samples. Further large-scale studies are needed to investigate the sputummicrobiome in bronchiectasis.
Keywords: bronchiectasis; FACED score; microbiome
1. Introduction
Bronchiectasis is a chronic, irreversible airway disease with abnormal dilatation of one or morebronchi, causing chronic cough and purulent sputum production. Impaired mucociliary clearancein bronchiectasis patients is associated with continuous or repeated respiratory infection, inducinga vicious cycle of blockage, inflammation, exacerbation, and damage in the affected bronchi [1].Bronchiectasis is associated with extended hospitalizations and high mortality, causing a significanteconomic burden [2,3].
Prevention of exacerbation, reduction of respiratory symptoms, and stopping the progressionof the disease are important for the management of bronchiectasis [4]. By improving the bronchialhygiene and decreasing bronchial inflammation, recurrent infection and frequent exacerbation canbe prevented [5]. Therefore, the ability to precisely identify colonizing bacterial species, includingpotential pathogens, is important for clinicians who treat bronchiectasis patients.
Conventional, culture-based microbiological analyses identified multiple bacterial pathogensin bronchiectasis patients, such as Pseudomonas aeruginosa, Haemophilus influenzae, Streptococcus
J. Clin. Med. 2018, 7, 429; doi:10.3390/jcm7110429 www.mdpi.com/journal/jcm

J. Clin. Med. 2018, 7, 429 2 of 10
pneumoniae, Staphylococcus aureus, and Moraxella catarrhalis. Importantly, previous studies showed thatthe P. aeruginosa colonization in bronchiectasis was linked to clinical, functional, and radiographicdeterioration. Although standard culture-based diagnostic methods are widely used, chronic infectionscaused by anaerobes or certain bacterial species that barely grow under standard conditions are difficultto diagnose using these methods [6]. The application of next generation sequencing (NGS), using16S rRNA gene pyrosequencing has expanded our understanding of the pathogenesis of bronchiectasisand is helping physicians to select appropriate antibiotic treatments [7].
Martínez-García et al. used five dichotomized variables to develop a scoring system for non-cysticfibrosis bronchiectasis, known as the “FACED score”, which considers lung function, age, colonizationby P. aeruginosa, radiographic extension, and dyspnoea [8]. The authors conducted a multicenter,observational study, with eight hundred and nineteen bronchiectasis patients who were classifiedaccording to disease severity, in relation to the five-year all-cause mortality.
In this study, we employed culture-independent, DNA-based molecular techniques for examiningthe composition of the bacterial microbiota in sputum samples, in relation to disease severity, whichwe derived using the FACED scoring system.
2. Experimental Section
2.1. Study Population
Bronchiectasis was diagnosed by high-resolution computed tomography (HRCT). Patients whohad active tuberculosis or trauma/tuberculosis-related destroyed lungs, were excluded from the study.Figure 1 shows the patient flow chart. Initially, from 1 April 2017 to 31 August 2017, a total of seventypatients with bronchiectasis agreed to participate in this prospective study, but seven patients wereexcluded from the study because of incomplete data (n = 6), or a low quantity of DNA extracted forthe analysis (n = 1). Therefore, a total of sixty-three patients with bronchiectasis were investigated inthis study.
J. Clin. Med. 2018, 7, x FOR PEER REVIEW 2 of 10
Conventional, culture-based microbiological analyses identified multiple bacterial pathogens in bronchiectasis patients, such as Pseudomonas aeruginosa, Haemophilus influenzae, Streptococcus pneumoniae, Staphylococcus aureus, and Moraxella catarrhalis. Importantly, previous studies showed that the P. aeruginosa colonization in bronchiectasis was linked to clinical, functional, and radiographic deterioration. Although standard culture-based diagnostic methods are widely used, chronic infections caused by anaerobes or certain bacterial species that barely grow under standard conditions are difficult to diagnose using these methods [6]. The application of next generation sequencing (NGS), using 16S rRNA gene pyrosequencing has expanded our understanding of the pathogenesis of bronchiectasis and is helping physicians to select appropriate antibiotic treatments [7].
Martínez-García et al. used five dichotomized variables to develop a scoring system for non-cystic fibrosis bronchiectasis, known as the “FACED score”, which considers lung function, age, colonization by P. aeruginosa, radiographic extension, and dyspnoea [8]. The authors conducted a multicenter, observational study, with eight hundred and nineteen bronchiectasis patients who were classified according to disease severity, in relation to the five-year all-cause mortality.
In this study, we employed culture-independent, DNA-based molecular techniques for examining the composition of the bacterial microbiota in sputum samples, in relation to disease severity, which we derived using the FACED scoring system.
2. Experimental Section
2.1. Study Population
Bronchiectasis was diagnosed by high-resolution computed tomography (HRCT). Patients who had active tuberculosis or trauma/tuberculosis-related destroyed lungs, were excluded from the study. Figure 1 shows the patient flow chart. Initially, from 1 April 2017 to 31 August 2017, a total of seventy patients with bronchiectasis agreed to participate in this prospective study, but seven patients were excluded from the study because of incomplete data (n = 6), or a low quantity of DNA extracted for the analysis (n = 1). Therefore, a total of sixty-three patients with bronchiectasis were investigated in this study.
Figure 1. Patient flow chart. From 1 April 2017 to 31 August 2017, a total of seventy patients with bronchiectasis agreed to participate in this prospective study, but seven patients were excluded from this study because of incomplete data (n = 6) or an insufficient quantity of DNA extracted for the analysis (n = 1). PFT, pulmonary function test.
Figure 1. Patient flow chart. From 1 April 2017 to 31 August 2017, a total of seventy patients withbronchiectasis agreed to participate in this prospective study, but seven patients were excluded fromthis study because of incomplete data (n = 6) or an insufficient quantity of DNA extracted for theanalysis (n = 1). PFT, pulmonary function test.

J. Clin. Med. 2018, 7, 429 3 of 10
The severity of bronchiectasis was classified using the FACED score as follows; percentage ofpredicted forced expiratory volume in 1 s (FEV1 in %) (F, cut-off 50%, 0–2 points); age (A, cut-off70 years, 0–2 points); presence of chronic colonization by P. aeruginosa (C, dichotomic, 0–1 point);radiographic extension (E, number of lobes affected, cut-off two lobes, 0–1 point); and dyspnoea(D, cut-off grade II on the Medical Research Council scale, 0–1 point). Mild bronchiectasis wasdefined as 0–2 points, moderate was 3–4 points, and severe was 5–7 points [8]. Out of the sixty-threepatients, forty-two had mild bronchiectasis, and twenty-one had moderate (n = 15) or severe (n = 6)bronchiectasis. Demographic data and clinical measurements were collected, including age, sex, bodymass index (BMI), smoking status and amount, respiratory symptoms, pulmonary function test (PFT),chest CT findings, sputum culture study, and comorbidities.
2.2. Sputum Sample Acquisition Method
Before the sputum acquisition, all patients were asked to rinse their mouth with sterile saline andto breathe deeply five times. Patients then, immediately, produced the sputum (≥1mL) by repeateddeep breaths and coughing into a sterile container. In patients with no sputum, 5 cc of 3% NaCl wasinhaled using a nebulizer and the induced sputum was collected for the study [9]. Acquired sputumsamples were stored at −70 ◦C, in a freezer, and the DNA extraction was performed within 24 h,after the sputum acquisition. DNA extraction was performed with a commercial DNA extraction kit(PowerSoil DNA isolation kit, Mo Bio Laboratories, Inc. Carlsbad, CA, USA). Extracted DNA sampleswere stored at −20 ◦C, in a freezer, before the analysis by a polymerase chain reaction (PCR).
2.3. PCR Amplification and Sequencing
Purified DNA was used as a template for the PCR amplification with primerstargeting the V3 and V4 regions of the 16S rRNA gene. The primers were 341F(5′-TCGTCGGCAGCGTC-AGATGTGTATAAGAGACAG-CCTACGGGNGGCWGCAG-3′) and805R (5′-GTCTCGTGGGCTCGG-AGATGTGTATAAGAGACAG-GACTACHVGGGTATCTAATCC-3′).The amplification program was as follows. First, denaturation at 95 ◦C for 3 min was done,followed by 25 cycles of denaturation at 95 ◦C for 30 s. Primers were annealed at 55 ◦C for30 s and extended at 72 ◦C for 30 s, using a final elongation at 72 ◦C for 5 min. To attach theIllumina NexTera barcode, a secondary amplification was carried out with the i5 forward primer(5′-AATGATACGGCGACCACCGAGATCTACAC-XXXXXXXX-TCGTCGGCAGCGTC-3′; X indicatesthe barcode region) and the i7 reverse primer (5′-CAAGCAGAAGACGGCATACGAGAT-XXXXXXXX-AGTCTCGTGGGCTCGG-3′). The program for the secondary amplification was the same as describedabove, except that the amplification cycle was set to eight.
Using 2% agarose gel electrophoresis and a Gel Doc system (BioRad, Hercules, CA, USA), the PCRamplification products were confirmed and then purified using the QIAquick PCR purification kit(Qiagen, Valencia, CA, USA). Short fragments (non-target products) were removed using the Ampurebeads kit (Agencourt Bioscience, Waltham, MA, USA). The products were assessed on a Bioanalyzer2100 (Agilent, Palo Alto, CA, USA) for quality and size, using a DNA 7500 chip.
Mixed amplicons were pooled and an Illumina MiSeq Sequencing system (Illumina, San Diego,CA, USA) was used for sequencing, which was performed at the Chun Lab, Inc. (Seoul, Korea),according to the manufacturer’s instructions [10].
2.4. Miseq Pipeline Method
To remove the low-quality reads, quality checks and the filtering of raw reads were performed byTrimmomatic 0.32 [11]. After the quality control, PANDAseq was used for merging the paired-endsequence data. With the help of the ChunLab’s program, primers were trimmed (cut off value: 0.8).Using the HMMER’s hmmsearch program, non-specific amplicons, which do not encode the 16S rRNA,were detected. The process of denoising the sequences was performed with the DUDE-Seq, and the
J. Clin. Med. 2018, 7, 429 4 of 10
non-redundant reads were extracted through UCLUST-clustering. Taxonomic assignments wereobtained using USEARCH (8.1.1861_i86linux32), as implemented in the EzBioCloud database.
UCHIME7 and the non-chimeric 16S rRNA database from the EzBioCloud were used to findidentify chimeras in the reads, with a best hit similarity rate of less than 97%. Sequence data wereclustered using the CD-HIT8 and the UCLUST5. The alpha diversity indices and rarefaction curveswere estimated using an in-house code.
2.5. Ethics Statement
The Institutional Review Board (IRB) of Seoul National University Bundang Hospital reviewedand approved this prospective study protocol (IRB approval number: B-1703/386-301). Informedwritten consent was obtained from the all patients on the day of sputum collection. All procedureswere performed in accordance with the Declaration of Helsinki.
3. Results
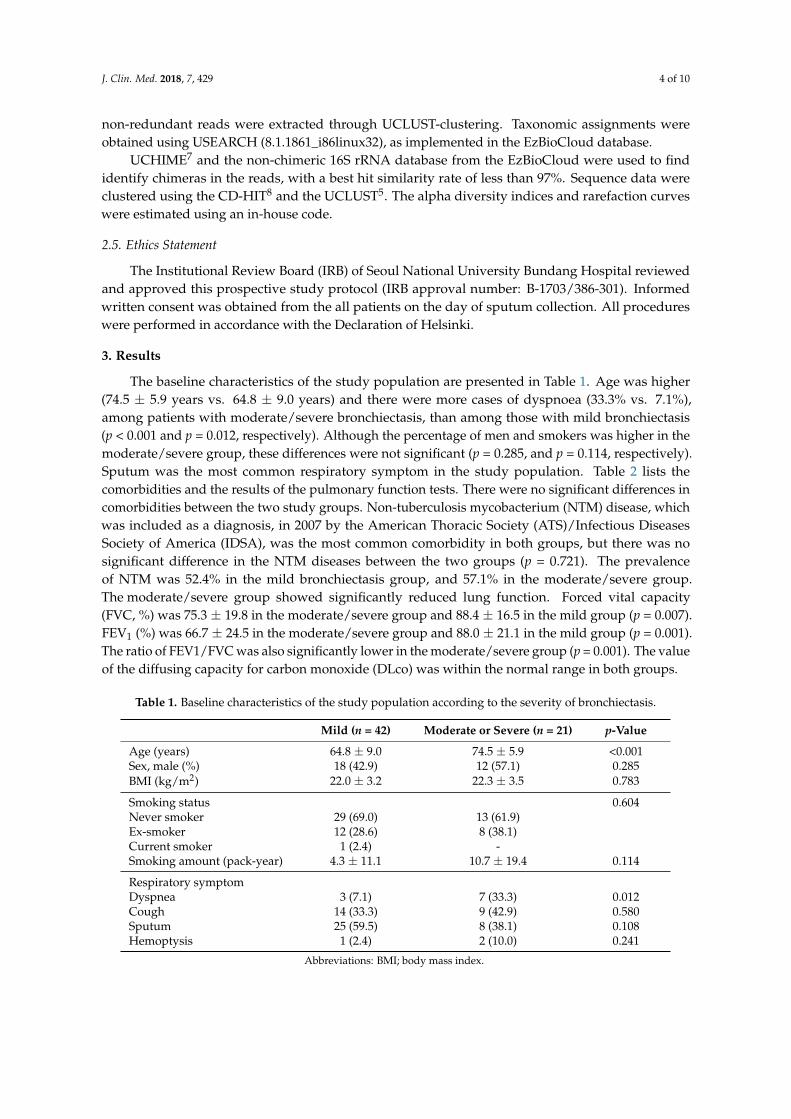
The baseline characteristics of the study population are presented in Table 1. Age was higher(74.5 ± 5.9 years vs. 64.8 ± 9.0 years) and there were more cases of dyspnoea (33.3% vs. 7.1%),among patients with moderate/severe bronchiectasis, than among those with mild bronchiectasis(p < 0.001 and p = 0.012, respectively). Although the percentage of men and smokers was higher in themoderate/severe group, these differences were not significant (p = 0.285, and p = 0.114, respectively).Sputum was the most common respiratory symptom in the study population. Table 2 lists thecomorbidities and the results of the pulmonary function tests. There were no significant differences incomorbidities between the two study groups. Non-tuberculosis mycobacterium (NTM) disease, whichwas included as a diagnosis, in 2007 by the American Thoracic Society (ATS)/Infectious DiseasesSociety of America (IDSA), was the most common comorbidity in both groups, but there was nosignificant difference in the NTM diseases between the two groups (p = 0.721). The prevalenceof NTM was 52.4% in the mild bronchiectasis group, and 57.1% in the moderate/severe group.The moderate/severe group showed significantly reduced lung function. Forced vital capacity(FVC, %) was 75.3 ± 19.8 in the moderate/severe group and 88.4 ± 16.5 in the mild group (p = 0.007).FEV1 (%) was 66.7 ± 24.5 in the moderate/severe group and 88.0 ± 21.1 in the mild group (p = 0.001).The ratio of FEV1/FVC was also significantly lower in the moderate/severe group (p = 0.001). The valueof the diffusing capacity for carbon monoxide (DLco) was within the normal range in both groups.
Table 1. Baseline characteristics of the study population according to the severity of bronchiectasis.
Mild (n = 42) Moderate or Severe (n = 21) p-Value
Age (years) 64.8 ± 9.0 74.5 ± 5.9 <0.001Sex, male (%) 18 (42.9) 12 (57.1) 0.285BMI (kg/m2) 22.0 ± 3.2 22.3 ± 3.5 0.783
Smoking status 0.604Never smoker 29 (69.0) 13 (61.9)Ex-smoker 12 (28.6) 8 (38.1)Current smoker 1 (2.4) -Smoking amount (pack-year) 4.3 ± 11.1 10.7 ± 19.4 0.114
Respiratory symptomDyspnea 3 (7.1) 7 (33.3) 0.012Cough 14 (33.3) 9 (42.9) 0.580Sputum 25 (59.5) 8 (38.1) 0.108Hemoptysis 1 (2.4) 2 (10.0) 0.241
Abbreviations: BMI; body mass index.
J. Clin. Med. 2018, 7, 429 5 of 10
Table 2. Comorbidities and clinical data according to the severity of bronchiectasis.
Mild (n = 42) Moderate or Severe (n = 21) p-Value
ComorbiditiesDiabetes mellitus 1 (2.4) 3 (14.3) 0.104Hypertension 10 (23.8) 6 (28.6) 0.682Gastroesophageal reflux disease 8 (19.0) 4 (19.0) 1.000Sinusitis 5 (11.9) 2 (9.5) 1.000Cardiovascular disease 1 (2.4) 1 (4.8) 1.000Stroke 3 (7.1) 0 (0.0) 0.545Liver disease 2 (4.8) 2 (9.5) 0.595Renal disease 1 (2.4) 1 (4.8) 1.000Non-tuberculosis mycobacterium 22 (52.4) 12 (57.1) 0.721
Pulmonary functionFVC (%) 88.4 ± 16.5 75.3 ± 19.8 0.007FEV1 (%) 88.0 ± 21.1 66.7 ± 24.5 0.001FEV1/FVC ratio 0.71 ± 0.09 0.60 ± 0.16 0.001DLCO (%) 103.3 ± 22.9 92.8 ± 21.7 0.170
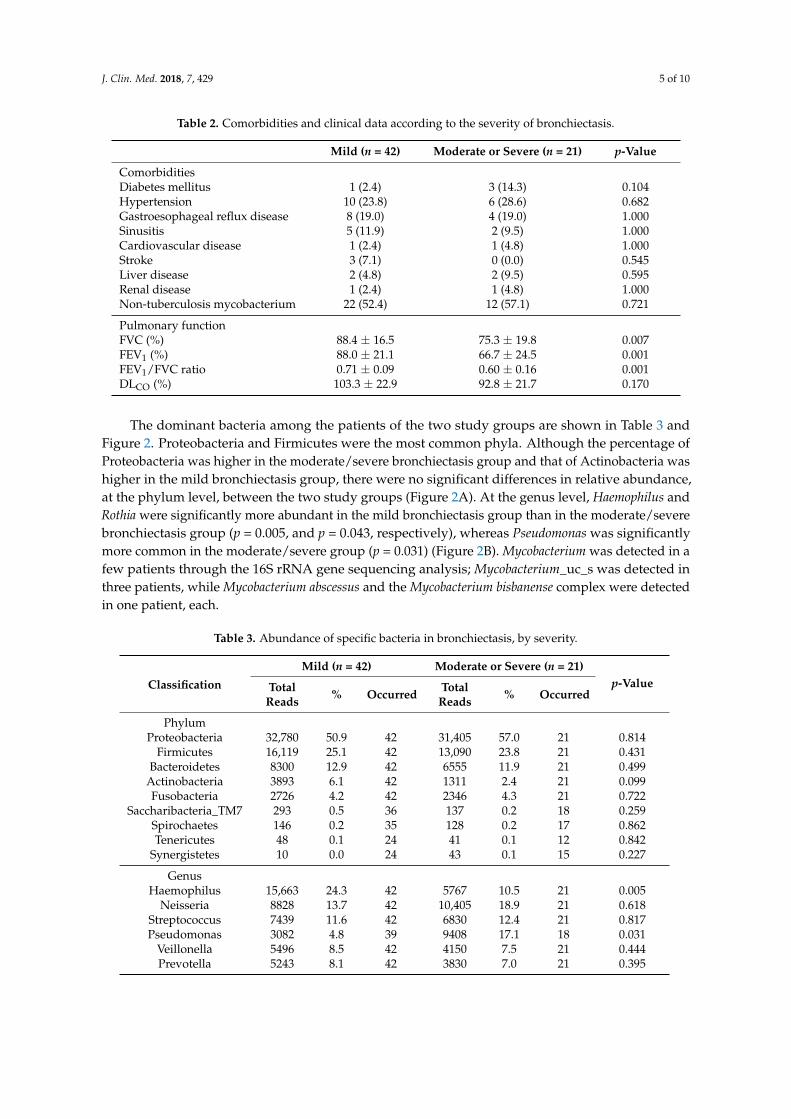
The dominant bacteria among the patients of the two study groups are shown in Table 3 andFigure 2. Proteobacteria and Firmicutes were the most common phyla. Although the percentage ofProteobacteria was higher in the moderate/severe bronchiectasis group and that of Actinobacteria washigher in the mild bronchiectasis group, there were no significant differences in relative abundance,at the phylum level, between the two study groups (Figure 2A). At the genus level, Haemophilus andRothia were significantly more abundant in the mild bronchiectasis group than in the moderate/severebronchiectasis group (p = 0.005, and p = 0.043, respectively), whereas Pseudomonas was significantlymore common in the moderate/severe group (p = 0.031) (Figure 2B). Mycobacterium was detected in afew patients through the 16S rRNA gene sequencing analysis; Mycobacterium_uc_s was detected inthree patients, while Mycobacterium abscessus and the Mycobacterium bisbanense complex were detectedin one patient, each.
Table 3. Abundance of specific bacteria in bronchiectasis, by severity.
Classification
Mild (n = 42) Moderate or Severe (n = 21)p-ValueTotal
Reads % Occurred TotalReads % Occurred
PhylumProteobacteria 32,780 50.9 42 31,405 57.0 21 0.814
Firmicutes 16,119 25.1 42 13,090 23.8 21 0.431Bacteroidetes 8300 12.9 42 6555 11.9 21 0.499
Actinobacteria 3893 6.1 42 1311 2.4 21 0.099Fusobacteria 2726 4.2 42 2346 4.3 21 0.722
Saccharibacteria_TM7 293 0.5 36 137 0.2 18 0.259Spirochaetes 146 0.2 35 128 0.2 17 0.862Tenericutes 48 0.1 24 41 0.1 12 0.842
Synergistetes 10 0.0 24 43 0.1 15 0.227
GenusHaemophilus 15,663 24.3 42 5767 10.5 21 0.005
Neisseria 8828 13.7 42 10,405 18.9 21 0.618Streptococcus 7439 11.6 42 6830 12.4 21 0.817Pseudomonas 3082 4.8 39 9408 17.1 18 0.031
Veillonella 5496 8.5 42 4150 7.5 21 0.444Prevotella 5243 8.1 42 3830 7.0 21 0.395

J. Clin. Med. 2018, 7, 429 6 of 10
Table 3. Cont.
Classification
Mild (n = 42) Moderate or Severe (n = 21)p-ValueTotal
Reads % Occurred TotalReads % Occurred
Rothia 3181 4.9 42 1089 2.0 21 0.043Klebsiella 3279 5.1 28 933 1.7 11 0.386
Fusobacterium 1865 2.9 42 1928 3.5 21 0.950Porphyromonas 1744 2.7 41 1640 3.0 20 0.926Actinobacillus 544 0.8 34 1265 2.3 19 0.441Staphylococcus 766 1.2 26 1077 2.0 15 0.810
Leptotrichia 798 1.2 39 404 0.7 19 0.079AF366267_g 12 0.0 27 1736 3.2 13 0.325
J. Clin. Med. 2018, 7, x FOR PEER REVIEW 6 of 10
Rothia 3181 4.9 42 1089 2.0 21 0.043 Klebsiella 3279 5.1 28 933 1.7 11 0.386
Fusobacterium 1865 2.9 42 1928 3.5 21 0.950 Porphyromonas 1744 2.7 41 1640 3.0 20 0.926 Actinobacillus 544 0.8 34 1265 2.3 19 0.441 Staphylococcus 766 1.2 26 1077 2.0 15 0.810
Leptotrichia 798 1.2 39 404 0.7 19 0.079 AF366267_g 12 0.0 27 1736 3.2 13 0.325
Figure 2. Abundance of the dominant bacteria in patients with bronchiectasis according to disease severity: (A) Phylum level, and (B) genus level. Haemophilus and Rothia were significantly more abundant in the mild bronchiectasis group than in the moderate/severe bronchiectasis group (p = 0.005, and p = 0.043, respectively), and Pseudomonas was significantly more common in the moderate/severe group (p = 0.031).
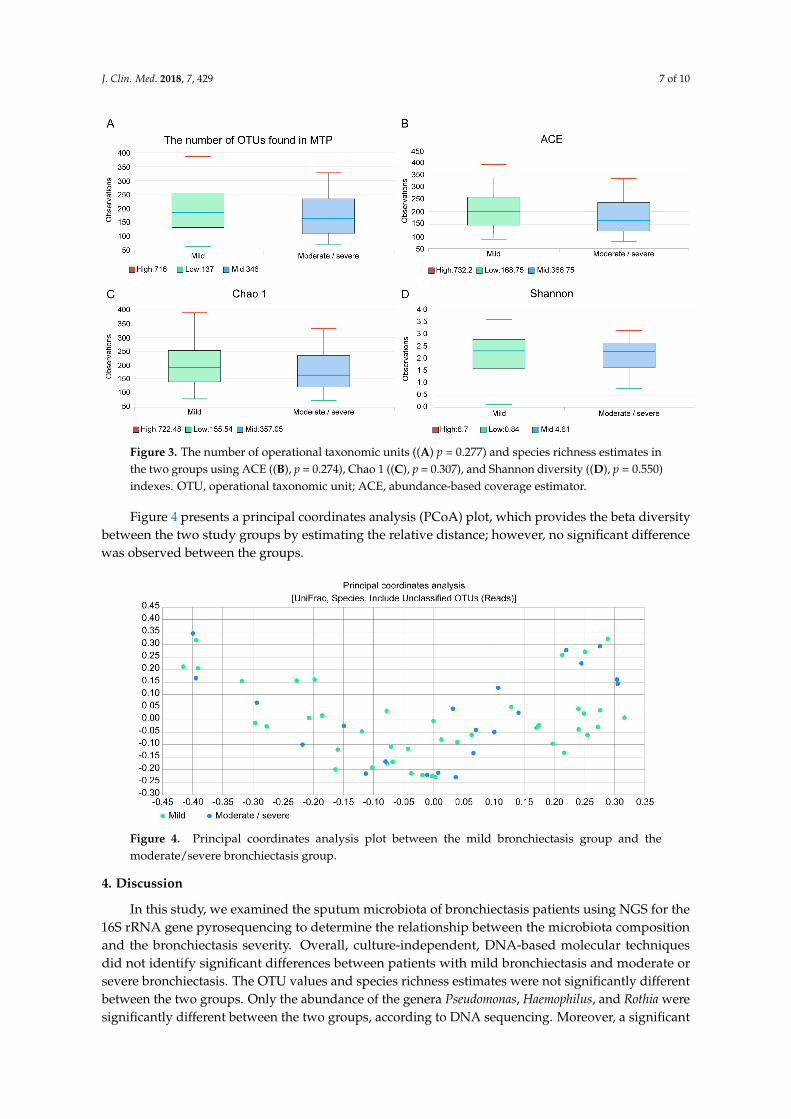
The median number of operational taxonomic unit (OTU) was 189 (Q1: 132, Q3: 252), in the mild bronchiectasis group, and 157 (112, Q1; 234, Q3) in the moderate/severe group; this difference was not significant (p = 0.277) (Figure 3A). Species richness estimates were not significantly different between the two groups, as demonstrated by the abundance-based coverage estimator (ACE, Figure 3B, p = 0.274) and Chao 1 index (Figure 3C, p = 0.307). The Shannon diversity index was also not significantly different (Figure 3D, p = 0.550).
Figure 2. Abundance of the dominant bacteria in patients with bronchiectasis according to diseaseseverity: (A) Phylum level, and (B) genus level. Haemophilus and Rothia were significantly moreabundant in the mild bronchiectasis group than in the moderate/severe bronchiectasis group (p = 0.005,and p = 0.043, respectively), and Pseudomonas was significantly more common in the moderate/severegroup (p = 0.031).
The median number of operational taxonomic unit (OTU) was 189 (Q1: 132, Q3: 252), in themild bronchiectasis group, and 157 (112, Q1; 234, Q3) in the moderate/severe group; this differencewas not significant (p = 0.277) (Figure 3A). Species richness estimates were not significantly differentbetween the two groups, as demonstrated by the abundance-based coverage estimator (ACE, Figure 3B,p = 0.274) and Chao 1 index (Figure 3C, p = 0.307). The Shannon diversity index was also notsignificantly different (Figure 3D, p = 0.550).
J. Clin. Med. 2018, 7, 429 7 of 10J. Clin. Med. 2018, 7, x FOR PEER REVIEW 7 of 10
Figure 3. The number of operational taxonomic units (p = 0.277) and species richness estimates in the two groups using ACE (B, p = 0.274), Chao 1 (C, p = 0.307), and Shannon diversity (D, p = 0.550) indexes. OTU, operational taxonomic unit; ACE, abundance-based coverage estimator.
Figure 4 presents a principal coordinates analysis (PCoA) plot, which provides the beta diversity between the two study groups by estimating the relative distance; however, no significant difference was observed between the groups.
Figure 4. Principal coordinates analysis plot between the mild bronchiectasis group and the moderate/severe bronchiectasis group.
4. Discussion
In this study, we examined the sputum microbiota of bronchiectasis patients using NGS for the 16S rRNA gene pyrosequencing to determine the relationship between the microbiota composition and the bronchiectasis severity. Overall, culture-independent, DNA-based molecular techniques did not identify significant differences between patients with mild bronchiectasis and moderate or severe bronchiectasis. The OTU values and species richness estimates were not significantly different between the two groups. Only the abundance of the genera Pseudomonas, Haemophilus, and Rothia were significantly different between the two groups, according to DNA sequencing.
Figure 3. The number of operational taxonomic units ((A) p = 0.277) and species richness estimates inthe two groups using ACE ((B), p = 0.274), Chao 1 ((C), p = 0.307), and Shannon diversity ((D), p = 0.550)indexes. OTU, operational taxonomic unit; ACE, abundance-based coverage estimator.
Figure 4 presents a principal coordinates analysis (PCoA) plot, which provides the beta diversitybetween the two study groups by estimating the relative distance; however, no significant differencewas observed between the groups.
J. Clin. Med. 2018, 7, x FOR PEER REVIEW 7 of 10
Figure 3. The number of operational taxonomic units (p = 0.277) and species richness estimates in the two groups using ACE (B, p = 0.274), Chao 1 (C, p = 0.307), and Shannon diversity (D, p = 0.550) indexes. OTU, operational taxonomic unit; ACE, abundance-based coverage estimator.
Figure 4 presents a principal coordinates analysis (PCoA) plot, which provides the beta diversity between the two study groups by estimating the relative distance; however, no significant difference was observed between the groups.
Figure 4. Principal coordinates analysis plot between the mild bronchiectasis group and the moderate/severe bronchiectasis group.
4. Discussion
In this study, we examined the sputum microbiota of bronchiectasis patients using NGS for the 16S rRNA gene pyrosequencing to determine the relationship between the microbiota composition and the bronchiectasis severity. Overall, culture-independent, DNA-based molecular techniques did not identify significant differences between patients with mild bronchiectasis and moderate or severe bronchiectasis. The OTU values and species richness estimates were not significantly different between the two groups. Only the abundance of the genera Pseudomonas, Haemophilus, and Rothia were significantly different between the two groups, according to DNA sequencing.
Figure 4. Principal coordinates analysis plot between the mild bronchiectasis group and themoderate/severe bronchiectasis group.
4. Discussion
In this study, we examined the sputum microbiota of bronchiectasis patients using NGS for the16S rRNA gene pyrosequencing to determine the relationship between the microbiota compositionand the bronchiectasis severity. Overall, culture-independent, DNA-based molecular techniquesdid not identify significant differences between patients with mild bronchiectasis and moderate orsevere bronchiectasis. The OTU values and species richness estimates were not significantly differentbetween the two groups. Only the abundance of the genera Pseudomonas, Haemophilus, and Rothia weresignificantly different between the two groups, according to DNA sequencing. Moreover, a significant

J. Clin. Med. 2018, 7, 429 8 of 10
difference was found in the detection of NTM, using either NGS-based analysis or culture growth-basedmethods. However, neither Rothia nor NTM affected the severity of bronchiectasis.
P. aeruginosa is the most common pathogen in patients with NTM disease [12]. In our study,the relative abundance of the genus Pseudomonas was significantly different between the mild andthe moderate/severe bronchiectasis group. Therefore, we hypothesized that the proportion of NTMcases would be significantly higher in the moderate/severe bronchiectasis group than in the mildbronchiectasis group, but this was not confirmed by our data. This observation suggests that whilebronchiectasis severity and progression are affected by the presence of P. aeruginosa, NTM itselfmay not have an effect on the bronchiectasis severity. Faverio et al. [13] compared bronchiectasispatients with pulmonary NTM and those with chronic P. aeruginosa infection, in a prospective study.Patients with bronchiectasis and pulmonary NTM tended to have cylindrical bronchiectasis and a lowdisease severity. Another study investigated the US Bronchiectasis Research Registry and showedthat Pseudomonas was isolated more often from the NTM-uninfected patients with bronchiectasis [14].These studies demonstrated that NTM is not directly related to the severity of the bronchiectasis.Interestingly, NTM strains were rarely found using the NGS-based analysis, in our study. This mighthave been due to the sensitivity of the method for detecting NTM; the NGS-based analysis mightnot yet be optimized for NTM detection, whereas in the acid-fast bacilli (AFB) tests, microbiologistsare trained to identify NTM or tuberculosis, using the optimized growth conditions. This lack ofoptimization for NTM detection might be responsible for the difference in detection rates between theconventional culture method and the NGS-based analysis. Further large-scaled studies are needed toinvestigate the optimal method of NTM detection.
Haemophilus was the most common genus in our study, and its relative abundance was significantlyhigher in the mild bronchiectasis group, whereas that of Pseudomonas was significantly higher in themoderate/severe bronchiectasis group. King et al. [15] studied the longitudinal change in microbialorganisms in right-nine patients with bronchiectasis, over 5.7 years. In their study, the relativeabundance of the H. influenza was initially 47%, but this decreased to 40%, during the follow-upexamination, whereas that of P. aeruginosa increased from 12% to 18%. In addition, the authors showedthat the clinical severity of bronchiectasis was higher in patients with P. aeruginosa than in patientswith H. influenza. The authors suggested that the disease progresses from no pathogen to Haemophilusto Pseudomonas.
Rothia was originally proposed and classified as a member of the Micrococcaceae family, byGeorg & Bronwn in 1967 [16]. Lim et al. [17] found that Rothia mucilaginosa was prevalent inpatients with cystic fibrosis that carried P. aeruginosa. Interestingly, there is no obvious patternof synergy or competition between the two organisms. Previous studies have shown that R.mucilaginosa maybe a lower respiratory pathogen in both immunocompetent and immunocompromisedpatients [18–20]. Rothia, mostly R. mucilaginosa, was also a predominant organism in bronchiectasis, inour study. Although the proportion of Rothia was significantly higher in the mild bronchiectasis group,the abundance of R. mucilanginosa was not significantly different between the two groups (p = 0.064),similar to the findings of Lim et al.
Recently, Byun et al. [5] reported the characterization of the lung microbiome in stableor exacerbated bronchiectasis, using the bronchoalveolar fluid samples from fourteen patients.The authors found that H. influenza, P. aeruginosa, M. catarrhalis, and Prevotella spp. were common.Specifically, they suggested that Prevotella and Veillonella could be potent anaerobic pathogens. In ourstudy, although Prevotella and Veillonella were common in both the mild and the moderate/severebronchiectasis groups, the abundances of the two pathogens were not significantly different betweenthe groups. This may indicate that Prevotella and Veillonella are risk factors for the exacerbation ofbronchiectasis, but are not significantly associated with bronchiectasis severity. The authors alsoshowed that the species richness, as estimated by the Simpson’s, and Shannon’s indices did notdiffer at the genus or the family level, between the clinically stable bronchiectasis group and theexacerbated bronchiectasis group. Similar to our study results, the number of OTUs, the ACE, Chao

J. Clin. Med. 2018, 7, 429 9 of 10
1, and Shannon’s indices, and PCoA plot did not indicate significant differences between the mildbronchiectasis group and the moderate/severe bronchiectasis group.
There were some limitations to our study. First, although we used a previously validated methodto acquire the high-quality samples, any sample could have become contaminated while passingthrough the oral space. Second, although the DNA sequencing 16S rRNA analysis is sensitive andmore informative than the conventional, culture-based methods, it is limited with regards to theamplification primer. Only well-known binding sites can be used for the pyrosequencing platforms.Third, daily diet and antibiotic use of patients was not investigated in this study. If this informationwould be available, results of this study would be more informative, with respect to patient historyand the dynamics of the lung microbiome [21].
5. Conclusions
In conclusion, although the abundance of Haemophilus and Rothia differed, significantly,in relation to the severity of bronchiectasis, the NGS-based technique did not identify significantdifferences between the alpha diversity and the beta diversity of the lung microbiomes of the mildbronchiectasis group and the moderate/severe bronchiectasis group. Respiratory microbial communityin bronchiectasis consisted of several abundant genera that did not significantly differ in relation todisease severity. Further prospective large-scale studies are needed to investigate the microbiomein bronchiectasis.
Author Contributions: S.H.L. and J.H.L. drafted the manuscript and revised it critically for important intellectualcontent. All authors made substantial contributions to the conception and design of the study, as well as theacquisition or analysis, and the interpretation of the data. The authors agreed to be accountable for all aspects ofthe work, ensuring that questions related to the accuracy or integrity of any part of the work are appropriatelyinvestigated and resolved. All authors approved the final version of the manuscript.
Funding: This work was supported by a grant (B-1703/386-301) from the Division of Pulmonary and CriticalCare Medicine, Department of Internal Medicine, Seoul National University Bundang Hospital.
Conflicts of Interest: The authors declare no conflict of interest.
References
1. Khoo, J.K.; Venning, V.; Wong, C.; Jayaram, L. Bronchiectasis in the last five years: New developments.J. Clin. Med. 2016, 5, 115. [CrossRef] [PubMed]
2. Ringshausen, F.C.; de Roux, A.; Pletz, M.W.; Hamalainen, N.; Welte, T.; Rademacher, J.Bronchiectasis-associated hospitalizations in germany, 2005–2011: A population-based study of diseaseburden and trends. PLoS ONE 2013, 8, e71109. [CrossRef] [PubMed]
3. Seitz, A.E.; Olivier, K.N.; Steiner, C.A.; Montes de Oca, R.; Holland, S.M.; Prevots, D.R. Trends and burdenof bronchiectasis-associated hospitalizations in the united states, 1993–2006. Chest 2010, 138, 944–949.[CrossRef] [PubMed]
4. Polverino, E.; Goeminne, P.C.; McDonnell, M.J.; Aliberti, S.; Marshall, S.E.; Loebinger, M.R.; Murris, M.;Canton, R.; Torres, A.; Dimakou, K.; et al. European respiratory society guidelines for the management ofadult bronchiectasis. Eur. Respir. J. 2017, 50, 1700629. [CrossRef] [PubMed]
5. Byun, M.K.; Chang, J.; Kim, H.J.; Jeong, S.H. Differences of lung microbiome in patients with clinically stableand exacerbated bronchiectasis. PLoS ONE 2017, 12, e0183553. [CrossRef] [PubMed]
6. Aliberti, S.; Lonni, S.; Dore, S.; McDonnell, M.J.; Goeminne, P.C.; Dimakou, K.; Fardon, T.C.; Rutherford, R.;Pesci, A.; Restrepo, M.I.; et al. Clinical phenotypes in adult patients with bronchiectasis. Eur. Respir. J. 2016,47, 1113–1122. [CrossRef] [PubMed]
7. Lee, S.H.; Sung, J.Y.; Yong, D.; Chun, J.; Kim, S.Y.; Song, J.H.; Chung, K.S.; Kim, E.Y.; Jung, J.Y.; Kang, Y.A.;et al. Characterization of microbiome in bronchoalveolar lavage fluid of patients with lung cancer comparingwith benign mass like lesions. Lung Cancer 2016, 102, 89–95. [CrossRef] [PubMed]
8. Martinez-Garcia, M.A.; de Gracia, J.; Vendrell Relat, M.; Giron, R.M.; Maiz Carro, L.; de la Rosa Carrillo, D.;Olveira, C. Multidimensional approach to non-cystic fibrosis bronchiectasis: The faced score. Eur. Respir. J.2014, 43, 1357–1367. [CrossRef] [PubMed]

J. Clin. Med. 2018, 7, 429 10 of 10
9. Feigelman, R.; Kahlert, C.R.; Baty, F.; Rassouli, F.; Kleiner, R.L.; Kohler, P.; Brutsche, M.H.; von Mering, C.Sputum DNA sequencing in cystic fibrosis: Non-invasive access to the lung microbiome and to pathogendetails. Microbiome 2017, 5, 20. [CrossRef] [PubMed]
10. Fadrosh, D.W.; Ma, B.; Gajer, P.; Sengamalay, N.; Ott, S.; Brotman, R.M.; Ravel, J. An improved dual-indexingapproach for multiplexed 16s rrna gene sequencing on the illumina miseq platform. Microbiome 2014, 2, 6.[CrossRef] [PubMed]
11. Bolger, A.M.; Lohse, M.; Usadel, B. Trimmomatic: A flexible trimmer for illumina sequence data.Bioinformatics 2014, 30, 2114–2120. [CrossRef] [PubMed]
12. Bonaiti, G.; Pesci, A.; Marruchella, A.; Lapadula, G.; Gori, A.; Aliberti, S. Nontuberculous mycobacteria innoncystic fibrosis bronchiectasis. Biomed. Res. Int. 2015, 2015, 197950. [CrossRef] [PubMed]
13. Faverio, P.; Stainer, A.; Bonaiti, G.; Zucchetti, S.C.; Simonetta, E.; Lapadula, G.; Marruchella, A.; Gori, A.;Blasi, F.; Codecasa, L.; et al. Characterizing non-tuberculous mycobacteria infection in bronchiectasis. Int. J.Mol. Sci. 2016, 17, 1913. [CrossRef] [PubMed]
14. Aksamit, T.R.; O’Donnell, A.E.; Barker, A.; Olivier, K.N.; Winthrop, K.L.; Daniels, M.L.A.; Johnson, M.;Eden, E.; Griffith, D.; Knowles, M.; et al. Adult patients with bronchiectasis: A first look at the usbronchiectasis research registry. Chest 2017, 151, 982–992. [CrossRef] [PubMed]
15. King, P.T.; Holdsworth, S.R.; Freezer, N.J.; Villanueva, E.; Holmes, P.W. Microbiologic follow-up study inadult bronchiectasis. Resp. Med. 2007, 101, 1633–1638. [CrossRef] [PubMed]
16. Fan, Y.; Jin, Z.; Tong, J.; Li, W.; Pasciak, M.; Gamian, A.; Liu, Z.; Huang, Y. Rothia amarae sp. Nov., fromsludge of a foul water sewer. Int. J. Syst. Evol. Microbiol. 2002, 52, 2257–2260. [PubMed]
17. Lim, Y.W.; Schmieder, R.; Haynes, M.; Furlan, M.; Matthews, T.D.; Whiteson, K.; Poole, S.J.; Hayes, C.S.;Low, D.A.; Maughan, H.; et al. Mechanistic model of rothia mucilaginosa adaptation toward persistence inthe cf lung, based on a genome reconstructed from metagenomic data. PLoS ONE 2013, 8, e64285. [CrossRef][PubMed]
18. Baeza Martinez, C.; Zamora Molina, L.; Garcia Sevila, R.; Gil Carbonell, J.; Ramos Rincon, J.M.; MartinSerrano, C. Rothia mucilaginosa pneumonia in an immunocompetent patient. Arch. Bronconeumol. 2014, 50,493–495. [CrossRef] [PubMed]
19. Ubeda-Iglesias, A.; Sanchez-Porto, A.; Alonso-Romero, L.; Casas-Ciria, J.; Eiros, J.M. Severe community-acquiredpneumonia caused by rothia mucilaginosa in an immunocompetent patient. Rev. Esp. Quimioter. 2017, 30, 136–137.[PubMed]
20. Maraki, S.; Papadakis, I.S. Rothia mucilaginosa pneumonia: A literature review. Infect. Dis. 2015, 47, 125–129.[CrossRef] [PubMed]
21. Marsland, B.J.; Trompette, A.; Gollwitzer, E.S. The gut-lung axis in respiratory disease. Ann. Am. Thorac. Soc.2015, 12, S150–S156. [PubMed]
© 2018 by the authors. Licensee MDPI, Basel, Switzerland. This article is an open accessarticle distributed under the terms and conditions of the Creative Commons Attribution(CC BY) license (http://creativecommons.org/licenses/by/4.0/).