Characterization of Biomolecular Interactions Using a ...164847/FULLTEXT01.pdf · Comprehensive...
68
Comprehensive Summaries of Uppsala Dissertations from the Faculty of Medicine 1363 Characterization of Biomolecular Interactions Using a Multivariate Approach BY KARL ANDERSSON ACTA UNIVERSITATIS UPSALIENSIS UPPSALA 2004
Transcript of Characterization of Biomolecular Interactions Using a ...164847/FULLTEXT01.pdf · Comprehensive...

Comprehensive Summaries of Uppsala Dissertationsfrom the Faculty of Medicine 1363
Characterization of BiomolecularInteractions Using a Multivariate
Approach
BY
KARL ANDERSSON
ACTA UNIVERSITATIS UPSALIENSISUPPSALA 2004

List of papers
This thesis is based on the following papers, which are referred to in the textby their Roman numerals.
I Identification and optimization of regeneration conditions for affinity-based biosensor assays. A multivariate cocktail approach, [AnderssonK., Hämäläinen M. D., Malmqvist M., Analytical Chemistry 71: 2475-2481, 1999].Here, a method for identification of regeneration solutions is described.In this work, a rough chemical sensitivity fingerprint was discovered.
II Kinetic characterization of the interaction of the Z-fragment of protein Awith mouse-IgG3 in a volume in chemical space, [Andersson K., GülichS., Hämäläinen M. D., Nygren P-Å., Hober S and Malmqvist M.,Proteins: Structure, Function, and Genetics 37: 494-498, 1999].This paper describes a systematic, multivariate study of how chemicalenvironment affects the interaction between two biomolecules.
III Predicting the kinetics of peptide-antibody interactions using amultivariate experimental design of sequence and chemical space,[Andersson K., Choulier L., Hämäläinen M. D., van Regenmortel M. H.V., Altschuh D. Malmqvist M., Journal of Molecular Recognition 14:62-71, 2001].Here, the concept of chemical sensitivity fingerprints is introduced. Theinteraction of 18 similar peptides with an antibody was characterized in20 buffers, making it possible to compare chemical sensitivityfingerprints of similar binders. The paper also describes a method forrelating amino acid sequence to the measured binding properties.
IV Kinetic and affinity predictions of a protein-protein interaction usingmultivariate experimental design, [De Genst E., Areskoug D.,Decanniere K., Muyldermans S., Andersson K., Journal of BiologicalChemistry 277(33):29897-907, 2002].The experiment in paper III was refined and performed on full-sizeproteins.

V Structural modeling extends QSAR analysis of antibody-lysozymeinteractions to 3D-QSAR, [Freyhult E. K., Andersson K., Gustafsson M.G., Biophysical Journal 84: 2264-2272, 2003].In this work, the QSAR part of the results obtained in IV was reanalyzedusing a 3D approach.
Related work (not included in the thesis):
� Surface regeneration of biosensors, [Hämäläinen M., Andersson K.,Roos H., Malmqvist M., Patent number US6289286, 1999].
� Exploring buffer space for molecular interactions, [Andersson K.,Areskoug D., Hardenborg E., J. Mol. Recognit, 12(5):310-5, 1999].
� Biosensor analysis of the interaction between immobilized human serumalbumin and drug compounds for prediction of human serum albuminbinding levels, [Frostell-Karlsson A., Remaeus A., Roos H., AnderssonK., Borg P., Hämäläinen M. D., Karlsson R., J. Med. Chem, 43(10):1986-92, 2000].
� Biosensor analysis of drug-target interactions: direct and competitivebinding assays for investigation of interactions between thrombin andthrombin inhibitors, [Karlsson R., Kullman-Magnusson M., HämäläinenM. D., Remaeus A., Andersson K., Borg P., Gyzander E., Deinum J.,Anal. Biochem, 278(1):1-13, 2000].
� QSAR studies applied to the prediction of antigen-antibody interactionkinetics as measured by BIACORE, [Choulier L., Andersson K.,Hämäläinen M. D., van Regenmortel M. H. V., Malmqvist M., AltschuhD., Protein Eng, 15(5):373-82, 2002].
Reprints were made with permission from the American Chemical Society(I), John Wiley & Sons (II, III), the American Society for Biochemistry andMolecular Biology, Inc. (IV) and the Biophysical Society (V).

Abbreviations
DNA DeoxyriboNucleic AcidRNA RiboNucleic AcidRO protocol Regeneration Optimization protocolQBKR Quantitative Buffer-Kinetic RelationshipQSKR Quantitative Sequence-Kinetic RelationshipQSAR Quantitative Structure-Activity RelationshipSPR Surface Plasmon ResonanceCoMFA Comparative Molecular Field AnalysisPLS Partial Least Squares3D Three-DimensionalSMILES Simplified Molecular Input Line Entry SystemIFC Integrated Microfluidic CartridgeRU Resonance UnitA Acidic stock solutionB Basic stock solutionU Nonpolar stock solutionC Chelating stock solutionD Detergent stock solutionI Ionic/chaotropic stock solutionEDTA EthyleneDiamineTetraacetic AcidIgG Immunoglobulin type GDMSO DiMethyl SulfOxideHFT Helix Forming TendencyTMVP Tobacco Mosaic Virus ProteinCDR3 Complementarity Determining Region 3QSPR Quantitative Sequence-Perturbation Relationship

Contents
Popular summary – Populärvetenskaplig sammanfattning.............................1
Introduction.....................................................................................................7
Background...................................................................................................12Biomolecular interactions ........................................................................12
Buffer sensitivity .................................................................................13QSAR ..................................................................................................14
Selection of molecules ....................................................................15Characterization of activity.............................................................15Description of molecular structure..................................................16Identification of a mathematical model ..........................................17QSAR examples..............................................................................19
Chemometrics ..........................................................................................20SPR biosensors.........................................................................................22
Scientific objectives......................................................................................26
The bio-chemometric approach ....................................................................27Application 1: the RO protocol ................................................................28Application 2: the chemical sensitivity fingerprint ..................................31
Generation of a chemical sensitivity fingerprint .................................32Chemical sensitivity fingerprints for TMVP peptides.........................33Chemical sensitivity fingerprints for camel antibodies .......................34Comparison of chemical sensitivity fingerprints.................................35
Application 3: QSKR/QSAR ...................................................................36TMVP peptides interacting with an antibody......................................38Single domain camel antibodies interacting with lysozyme................39
Summary of key contributions......................................................................42
Discussion.....................................................................................................43Benefits of the bio-chemometric approach ..............................................43QBKR and chemical sensitivity fingerprints ...........................................44QSKR and QSAR.....................................................................................44Future perspectives...................................................................................46

Standardization ....................................................................................46Use of the bio-chemometric approach in biosensor assays .................46Possible use beyond biosensor assays .................................................47
Acknowledgements.......................................................................................48
Appendix A: Robust regression....................................................................49
Appendix B: Experimental designs ..............................................................53The RO protocol.......................................................................................53QBKR.......................................................................................................54QSKR .......................................................................................................54
References.....................................................................................................57
1
Popular summary – Populärvetenskapligsammanfattning
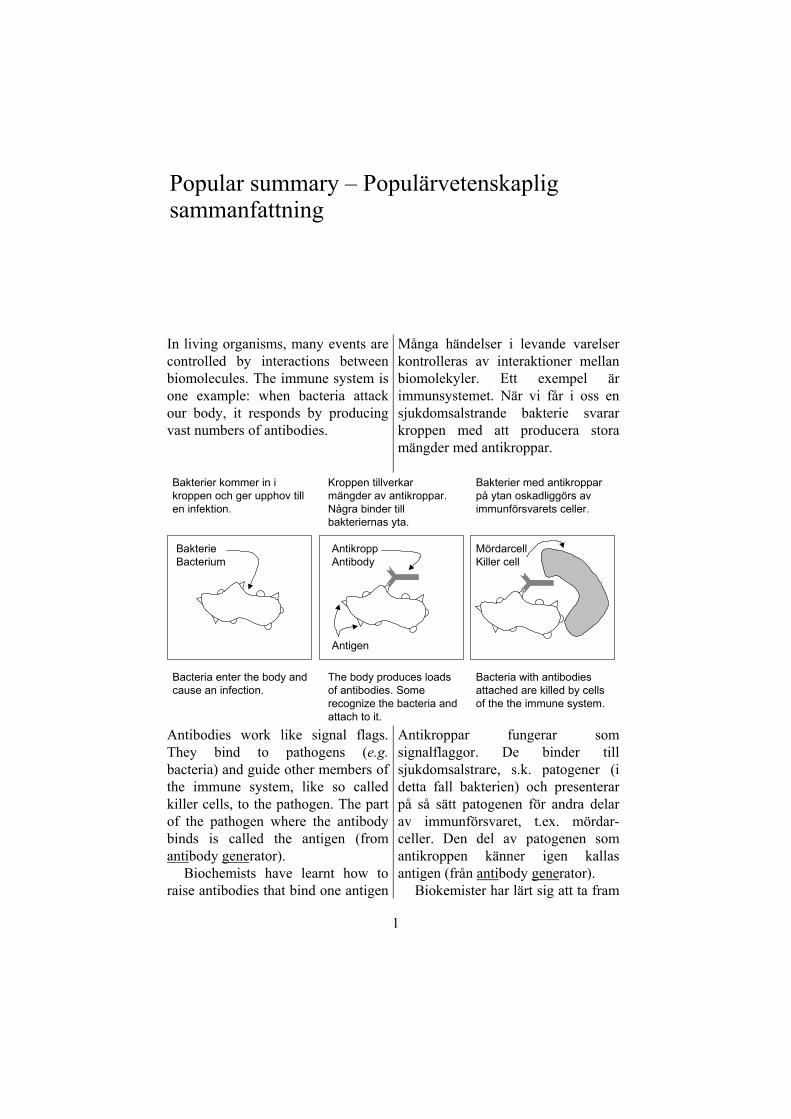
In living organisms, many events arecontrolled by interactions betweenbiomolecules. The immune system isone example: when bacteria attackour body, it responds by producingvast numbers of antibodies.
Många händelser i levande varelserkontrolleras av interaktioner mellanbiomolekyler. Ett exempel ärimmunsystemet. När vi får i oss ensjukdomsalstrande bakterie svararkroppen med att producera storamängder med antikroppar.
Bacteria enter the body andcause an infection.
The body produces loadsof antibodies. Somerecognize the bacteria andattach to it.
Bacteria with antibodiesattached are killed by cellsof the the immune system.
Bakterier kommer in ikroppen och ger upphov tillen infektion.
Kroppen tillverkarmängder av antikroppar.Några binder tillbakteriernas yta.
Bakterier med antikropparpå ytan oskadliggörs avimmunförsvarets celler.
BakterieBacterium
AntikroppAntibody
MördarcellKiller cell
Antigen
Antibodies work like signal flags.They bind to pathogens (e.g.bacteria) and guide other members ofthe immune system, like so calledkiller cells, to the pathogen. The partof the pathogen where the antibodybinds is called the antigen (fromantibody generator).
Biochemists have learnt how toraise antibodies that bind one antigen
Antikroppar fungerar somsignalflaggor. De binder tillsjukdomsalstrare, s.k. patogener (idetta fall bakterien) och presenterarpå så sätt patogenen för andra delarav immunförsvaret, t.ex. mördar-celler. Den del av patogenen somantikroppen känner igen kallasantigen (från antibody generator).
Biokemister har lärt sig att ta fram

2
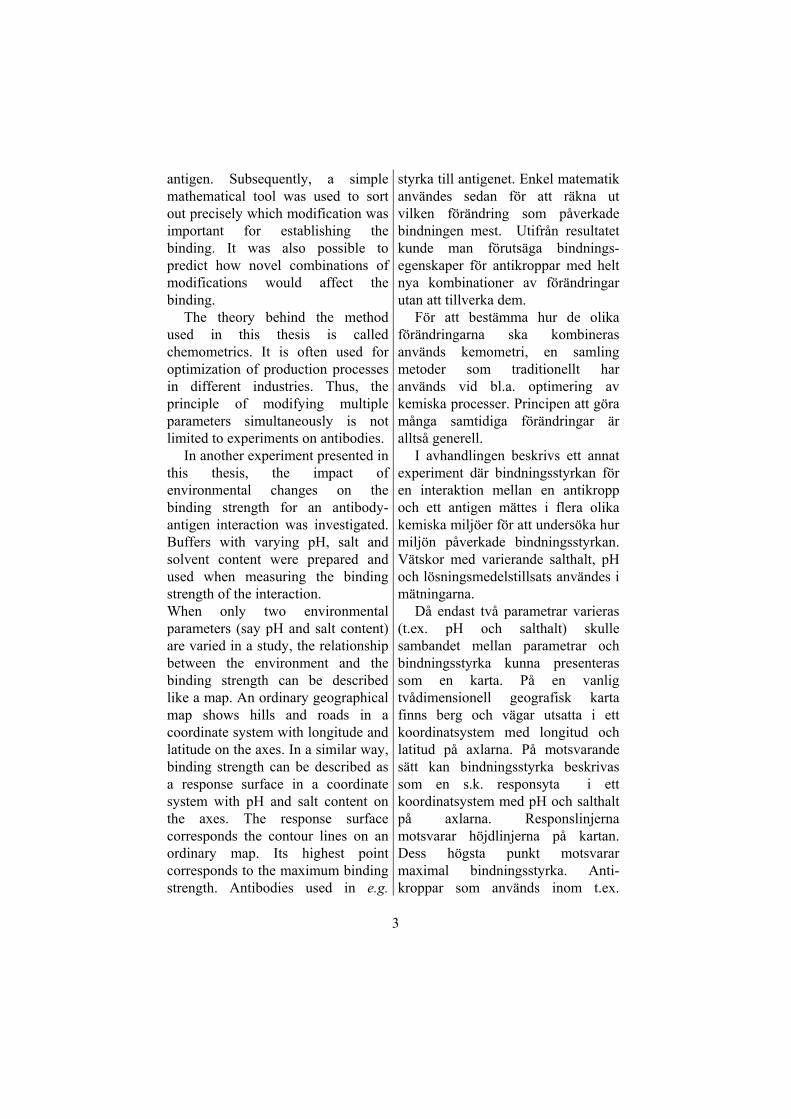
of choice. Today, methods for raisingand producing antibodies are oftenbased on gene technology. Suchmethods make it possible tointroduce subtle changes in themolecular structure of the antibody.
Many research groups havestudied how and where a givenantibody binds to an antigen. Onecommon procedure is to investigate apoint mutant of the antibody, whichhas a slightly different molecularstructure. If an important part of theantibody was mutated, the mutatedantibody will bind more strongly orweakly to the antigen than theoriginal antibody does.
antikroppar som binder till ettspecifikt antigen som kan väljasnästan helt fritt. Ofta använder mansig av genteknik, bland annateftersom det då är lätt att införa småmodifieringar i antikroppensmolekylstruktur.
Många forskargrupper har studeratvar och hur en antikropp binder tillett antigen. Ett vanligt tillväga-gångssätt är att punktmutera enantikropp, d.v.s. införa en enstakaförändring i dess molekylstruktur.Om punktmutationen görs på ettställe som medverkar i bindningen,kommer den muterade antikroppensbindingsstyrka till antigenet att skiljasig från den omuterade antikroppens.
Kritisk position på antikroppenmuterad. Bindning förhindras.Antibody mutated in crucialposition. Binding blocked.
Viktig position på antikroppenmuterad. Bindning påverkas.Antibody mutated in importantposition. Binding affected.
Antikropp muterad i betydeleselösposition. Bindning påverkas ej.Antibody mutated in unimportantposition. Binding not affected.
Ursprunglig antikropp.Original antibody.
This thesis describes a differentstrategy for such mutationexperiments. Instead of mutatingeach antibody at one position only,several modifications are made in thesame antibody. First, 15-20 differentantibodies, each kind having a uniquecombination of modifications, weremade and tested for binding to an
Denna avhandling beskriver enannorlunda strategi för mutations-experiment. Istället för att göramutationer en i taget, införs fleraförändringar i samma antikropp. I ettförsök tillverkades 15-20 olika typerav antikroppar som hade olikakombinationer av förändringar.Därefter mättes deras bindnings-
3
antigen. Subsequently, a simplemathematical tool was used to sortout precisely which modification wasimportant for establishing thebinding. It was also possible topredict how novel combinations ofmodifications would affect thebinding.
The theory behind the methodused in this thesis is calledchemometrics. It is often used foroptimization of production processesin different industries. Thus, theprinciple of modifying multipleparameters simultaneously is notlimited to experiments on antibodies.
In another experiment presented inthis thesis, the impact ofenvironmental changes on thebinding strength for an antibody-antigen interaction was investigated.Buffers with varying pH, salt andsolvent content were prepared andused when measuring the bindingstrength of the interaction.When only two environmentalparameters (say pH and salt content)are varied in a study, the relationshipbetween the environment and thebinding strength can be describedlike a map. An ordinary geographicalmap shows hills and roads in acoordinate system with longitude andlatitude on the axes. In a similar way,binding strength can be described asa response surface in a coordinatesystem with pH and salt content onthe axes. The response surfacecorresponds the contour lines on anordinary map. Its highest pointcorresponds to the maximum bindingstrength. Antibodies used in e.g.
styrka till antigenet. Enkel matematikanvändes sedan för att räkna utvilken förändring som påverkadebindningen mest. Utifrån resultatetkunde man förutsäga bindnings-egenskaper för antikroppar med heltnya kombinationer av förändringarutan att tillverka dem.
För att bestämma hur de olikaförändringarna ska kombinerasanvänds kemometri, en samlingmetoder som traditionellt haranvänds vid bl.a. optimering avkemiska processer. Principen att göramånga samtidiga förändringar äralltså generell.
I avhandlingen beskrivs ett annatexperiment där bindningsstyrkan fören interaktion mellan en antikroppoch ett antigen mättes i flera olikakemiska miljöer för att undersöka hurmiljön påverkade bindningsstyrkan.Vätskor med varierande salthalt, pHoch lösningsmedelstillsats användes imätningarna.
Då endast två parametrar varieras(t.ex. pH och salthalt) skullesambandet mellan parametrar ochbindningsstyrka kunna presenterassom en karta. På en vanligtvådimensionell geografisk kartafinns berg och vägar utsatta i ettkoordinatsystem med longitud ochlatitud på axlarna. På motsvarandesätt kan bindningsstyrka beskrivassom en s.k. responsyta i ettkoordinatsystem med pH och salthaltpå axlarna. Responslinjernamotsvarar höjdlinjerna på kartan.Dess högsta punkt motsvararmaximal bindningsstyrka. Anti-kroppar som används inom t.ex.

4
diagnostic tests for cancer have tobind strongly to a protein present inblood only in patients suffering fromcancer. The cancer test will havehighest sensitivity if themeasurement is performed in theenvironment that gives the highestbinding strength.
cancerdiagnostik måste binda starkttill ett protein som finns i blodetendast om man har cancer.Cancertestet blir känsligast ommätningen utförs vid den betingelsesom ger högsta bindingsstyrka.
N
S
EW
Long
itud
/ lon
gitu
de
Latitud / latitude
Response surface
Karta Responsyta
Map
Salthalt / salt content
pH
-20%
0%
20%
Fingerprints
Fingeravtryck
Salt
pH
-20%
0%
20%
Latit
ud(e
)
Long
itud(
e)
When more than two parameters arevaried in an experiment a two-dimensional response surface is notsufficient to describe the results. Ife.g. five parameters are varied, theresponse surface is no longer anordinary surface but a five-dimensional surface, which is hard toimagine. Therefore, in this thesiswork, the information in a multi-
Då fler än två parametrar varierasräcker inte en vanlig tvådimensionellresponsyta till för att beskrivaresultaten. Om t.ex. fem parametrarvarieras, blir responsytan ingenvanlig yta, utan en femdimensionell”yta”, vilket är svårt att föreställa sig.I denna avhandling sammanfattadesdärför informationen i en mång-dimensionell responsyta till ett s.k.

5
dimensional response surface wassummarized into a so-called chemicalsensitivity fingerprint. By selecting areference point (the cross) anddescribing the “slope” of themultidimensional response surface atthis point, the impact of all variedparameters could be presented in asingle fingerprint.
fingeravtryck som innehållerinformation om hur känsligbindningen var för varje parametersom varierades. Genom att utgå frånen viss kemisk miljö (krysset) ochbeskriva hur den mångdimensionellaresponsytan ”lutar” i den punkten,kunde inverkan av allamiljöparametrar beskrivas i ett endafingeravtryck.
Presentation of resultsResultatpresentation
param1
para
m2
FingerprintsFingeravtryck
-20%
0%
20%pa
ram
1
para
m2
-20%
0%
20%
para
m1
param1
resu
ltat /
resu
lt
Resultat somresponsyta.
Results as aresponse surface.
Resultat somy-axel.
Results as y-axis.
-20%
0%
20%
para
m1
para
m2
para
m3
para
m4
para
m5
Resultat somfemdimensionellresponsyta.
Results as a five-dimensionalresponse surface.
?5D
2D
1D
A large bar in the fingerprint meansthat the result (the binding strength)is highly dependant on thecorresponding parameter (saltcontent). A positive bar means thatan increasing salt content givesincreasing binding strength. A similarsummary of an ordinary two-
En hög stapel betyder att resultatet(bindningsstyrkan) påverkas mycketav motsvarande parameter (salthalt).En uppåtriktad stapel betyder attökad salthalt ger ökadbindingsstyrka. En sammanfattningav en vanlig tvådimensionell kartaskulle bli ”ökad longitud (=norrut)

6
dimensional map would be“increasing longitude (=north) givesa slight uphill slope, increasinglatitude (=east) gives a steepdownhill slope”.In summary, this thesis shows that itis beneficial to vary severalparameters simultaneously whenperforming biochemical experiments.By using chemometric methods,novel information in the form ofchemical sensitivity fingerprints canbe obtained. Furthermore, predictionsof antibody binding strength toantigens can be made. The methodspresented in the thesis can be usedfor different purposes. The chemicalsensitivity fingerprint could giveimproved quality control of proteins.Predictions of binding strength cansimplify the development of proteinsfor therapeutic use.
ger lite uppförsbacke, ökad latitud(=österut) ger kraftig nedförsbacke”.
Sammanfattningsvis visar dennaavhandling att det finns mycket attvinna på att samtidigt variera fleraparametrar när biokemiskaexperiment genomförs. Kemo-metriska metoder kan ge nyinformation (fingeravtryck) ochförutsäga bindingsstyrkor mellanantikropp och antigen. De metodersom beskrivs i avhandlingen kananvändas för många ändamål.Fingeravtrycken kan användas vidkvalitetskontroll av proteiner eller föratt närmare undersöka hur eninteraktion mellan två biomolekylerär uppbyggd. Metoder för attförutsäga hur antikroppar (och andrabiomolekyler) binder till olikaantigen kan underlätta framtagningav proteinläkemedel.
7
Introduction
In a living cell, non-covalent interactions between biomolecules areimportant in many key processes, such as cell proliferation, cell signaling,and apoptosis. Over the years, the analytical equipment for characterizationof biomolecular interactions has improved dramatically. Today, extremelysensitive methods capable of detecting one single molecule binding to atarget exist [Camacho, 2004; Haupts, 2003; Bieschke, 2000]. Massivelyparallel methods are available for e.g. DNA microarray analysis of completetranscriptomes [DeRisi, 1997]. Furthermore, there are methods available forhigh-precision descriptions of the real-time progress of a biomolecularinteraction [Rich, 2003; Jönsson, 1991]. However, although the experimentalperformance has improved, the bioinformatic methodologies and toolsneeded to benefit maximally from these developments have lagged behind.In the case of DNA microarray experiments, the data analysis has oftenreceived less attention than the data generation. The available analysismethods have been used without a basic understanding of how the methodswork leading to a considerable uncertainty regarding the interpretation ofresults [Quackenbush, 2001]. This often leads to inefficient use of powerfulanalytical equipment. In this thesis, it is demonstrated that conventionalchemometrics can be successfully applied to the study of biomolecularinteractions. Thereby, the information obtained from existing analyticalequipment can be extended and refined. The methodology developed in thisthesis is denoted the bio-chemometric approach and it has been applied inthree different applications.
The core idea of the bio-chemometric approach is to employ acombination of multivariate perturbation and multivariate regression whencharacterizing biomolecular interactions. By introducing multivariateperturbations (small simultaneous variations) of e.g. the chemicalenvironment or the molecular structure of one binding partner, information isobtained about how easily the interaction characteristics can be modified byeach experimental parameter. The results from the measurements inperturbed experimental conditions are summarized into a vector called asensitivity fingerprint. Multivariate regression tools are used to fit amathematical model to the results obtained in a multivariate perturbationexperiment. The model makes it possible to predict how the interaction will
8
behave in a novel chemical environment or after a structural change of abinding partner. Thus, application of the bio-chemometric approach on thecharacterization of biomolecular interactions gives a sensitivity fingerprintand means for predicting interaction characteristics for novel settings of theexperimental parameters.
Using common methodology, a biomolecular interaction is characterizedin one chemical environment and without inclusion of structuralmodifications. In comparison, the bio-chemometric approach requires 5-10times more material (i.e. buffers and biomolecules) but gives results that aremore reliable and contain useful information. Common methodology forassessing the sensitivity of an interaction to changes of e.g. pH typicallyincludes repetitions of the experiment in a number of buffers with differentpH values. Using the same number of experiments, the bio-chemometricapproach offers information about the sensitivity of the interaction forseveral environmental parameters. Furthermore, non-additive effects (i.e.cooperativity) of the environmental parameters can be detected andquantified.
The bio-chemometric approach was developed using ideas fromchemometrics, a field focused on statistical design and analysis of chemicalexperiments. Early papers described successful application of chemometricsto the optimization of gas chromatography performance [Wold, 1973] aswell as certain chemical synthesis steps [Lundstedt, 1986]. The practicalvalue of carefully designed experiments in combination with robustmultivariate data analysis was soon acknowledged by the chemical industryand is by now well established [Nortvedt, 1996]. Despite the name,chemometric tools are not specific for the field of chemistry; the name ismerely a reminder of where the tools were first used. The use ofchemometrics has spread into related fields (see e.g. the table of contents inthe book edited by Nortvedt [1996]) but within fields like biochemistry andmicrobiology its use has so far been limited. The optimization ofbiomolecular structure to achieve more potent molecules has been addressed[Hellberg, 1987; Jonsson 1993; Mee, 1997] but these ideas have not beenapplied broadly to design, characterize and modulate biomolecularinteractions until recently [Linusson, 2001; Andersson, 2000]. In particular,buffer sensitivity of the kinetics of biomolecular interactions have neverbeen characterized with chemometric methods.
During the 1990’s, the development of chemometric and bioinformatictools for analysis of biomolecular interactions progressed relatively slowly.One of the most important reasons for this was the need for complementarycompetence in systematic protein design and for high precisionmeasurements of kinetic and affinity constants. In this thesis, systematicdesign of interaction environments, proteins and peptides is combined with

9
powerful biosensor instruments for interaction monitoring. The success ofthe combination is evident from the valuable results obtained.
Since many problems within biochemistry are of multivariate nature, thebio-chemometric approach is well suited for experiments in this field. Inparticular, biomolecular interactions are mediated by a number of differentforces, e.g. electrostatic forces, van der Waals forces, and hydrogen bondsand are influenced by molecular conformation. This means that sensitivityfingerprints may reveal novel, important information about the interaction.The sensitivity fingerprint could also be used for quality control purposes.For example, different batches of a biomolecule can be required to not onlyhave the same binding characteristics but also the same sensitivity tochanges in the experimental conditions. Furthermore, since the chemicalenvironment in a cell and in an analytical instrument may differsignificantly, results obtained in an instrument may not be adequate in thecellular environment. Thus, knowledge about interaction sensitivity toenvironmental changes could be helpful when estimating the validity ofextrapolations of the instrument results to the native chemical environments.
The predictive ability of results obtained according to the bio-chemometric approach can be highly valuable when a particular bindingprofile (i.e. particular values of the kinetic constants) for the interaction isdesired. In the search for therapeutic agents, e.g. molecules blocking acellular receptor, predictions of what structural changes might be beneficialfor obtaining better binders can decrease the time required for developingtherapeutic agents considerably.
Another benefit with the bio-chemometric approach is that theexperimental control is increased. Since the experiment is repeated inslightly different conditions, a good measure of robustness of the bindingcharacteristics is obtained. Furthermore, the number of possible noisesources is reduced by identification of what experimental conditions need tobe carefully controlled in order not to affect the experimental outcome.
In this thesis, three different applications have been used to test the powerof the bio-chemometric approach:
� Identification of regeneration solutions. Regeneration is a specificprocess aiming at re-establishing a functional biosensor surface after eachmeasurement. Regeneration is normally required when designing andrunning assays in commercially available affinity biosensors. This workresulted in the regeneration optimization (RO) protocol, a method forrapid identification of regeneration solutions.
� Analysis of the sensitivity of a biomolecular interaction to changes inchemical environment by use of a model called quantitative buffer-

10
kinetic relationship (QBKR). This gives a unique chemical sensitivityfingerprint for an interaction.
� Analysis of how the amino acid sequence of one of two binding partnersinfluences their interaction. A model called quantitative sequence-kineticrelationship (QSKR) was used. This analysis is closely related (or evensynonymous) to quantitative structure-activity relationships (QSAR).
These applications are outlined in Figure 1. They have in common that adefined reference “state” is perturbed by simultaneous variation of a numberof parameters that are believed to influence the experimental outcome. Usingthe RO protocol, the reference state was an established complex betweentwo biomolecules. When several environmental parameters (like pH,addition of solvents etc.) were varied, the degree of complex dissociationwas measured. In the case of the quantitative buffer-kinetic and sequence-kinetic relationships, the reference state was the interaction between twobiomolecules in one buffer. The buffer composition (for QBKR) or themolecular structure of one of the binding partners (for QSKR) was altered ina number of ways and changes in kinetic constants were measured andanalyzed.
1. Identify regenerationsolutionsRemove by changing thechemical environment.
2. Obtain a chemical sensitivityfingerprintMeasure binding kinetics for theinteraction in many buffers withdifferent NaCl concentrations, pHvalues, solvents additives, etc.Use results for calculation of achemical sensitivity fingerprint forthe interaction.
Decrease
pH to 2.0
Buffer 2
Buffer 3
Buffer 1
... ...
-30%
-20%
-10%
0%
10%
20%
pH Salt
EDTA
KSC
N
DM
SO
Chemical sensitivity fingerprint
Modification 1Some binding
QSKR enablesprediction of howa very good binderlook:
3. Obtain a QSKR modelMeasure binding kinetics for theinteraction where one of thebinding partners is present inseveral versions, each slightlymodified in multiple positions.Use the results to calculate howmolecular structure is related tobinding kinetics.
... ...
Modification 2Good binding
Modification 3No binding
For a biomolecular interaction between and :
Figure 1. Outline of the three applications described in this thesis.
11
The development of the bio-chemometric approach presented in this thesiswas initially performed as an industrial research project at Biacore AB(Uppsala, Sweden), aiming at providing examples for a patent application[Hämäläinen, 1999]. The project initially focused on a practical problem,namely the identification of regeneration solutions for affinity basedbiosensor surfaces. During the development of the RO protocol, it soonbecame clear that the methodology behind it could be refined andreformulated (into the bio-chemometric approach) and used for completelydifferent purposes.
This thesis describes the development of the bio-chemometric approach inapproximately chronological order. First, there is a short review of commonpractice for experiments on biomolecular interactions where chemicalenvironment or molecular structure is modified. A description of the toolsrequired for the three different applications follows. Finally, the bio-chemometric approach is described, both alone and in the context of thethree different applications.

12
Background
Tools and ideas from different areas are merged in this thesis, in particularfrom chemometrics, surface plasmon resonance (SPR) biosensor technology,and biochemistry. The bio-chemometric approach developed here issuggested to be generally applicable in biochemistry. However, it wasoriginally developed for use within biomolecular interaction experiments.Therefore, knowledge about how biomolecular interactions are characterizedis essential for understanding the development of the bio-chemometricapproach. This section is devoted to a presentation of biomolecularinteractions, chemometrics and SPR biosensors.
Biomolecular interactionsThere are at least three application areas where detailed studies ofbiomolecular interactions are essential.
� The first application area is the identification of which interactions thattrigger a particular cellular function. This kind of research often aims atfinding causes for malfunctions in cells and developing methods for re-establishing the original function, e.g. find the cause of and a cure for adisease.
� The second area is the follow-up of such an investigation, namely thedevelopment of a drug. This development involves a large number ofexperiments and put stringent requirements on drug candidate molecules.They must have adequate therapeutic performance, they have to bereadily absorbed in the body, serious side-effects must be avoided, etc.
� The third area is the use of interactions for detection and quantification,often for diagnostic or quality control purposes. Many detection andquantification assays rely on antibodies that specifically recognize atarget molecule. Tools for selecting antibodies during development ofsuch assays are therefore highly desirable.
Within these three application areas, it is common to perturb thebiomolecular interaction to learn how e.g. temperature, molecular structure,
13
pH or salt concentration influences the interaction. The three applicationsdescribed in this thesis deal with perturbations of environment or structure.A selection of related reports is reviewed below.
Buffer sensitivityThe classical methodology for buffer sensitivity studies is straightforward:repeat the experiment in different buffers and identify possible correlationsbetween the results and the environmental changes made. This strategy wasused for the experiments in this thesis. There is however a general lack ofreports on how to select the different chemical environments. In most cases,one parameter (typically salt concentration or pH) is varied a few times.Common objectives for such experiments include identification of elutionconditions for chromatography systems [Oda, 1994; Walhagen, 2001;Marengo, 1999], induction of conformational change in proteins [Taylor,2003; Blondine, 2002], and estimation of electrostatic contribution to aprotein-protein interaction [Faiman, 1996]. By restricting the variation to oneparameter only the experiment is easily evaluated. For example, two reportsdescribe that the composition and the pH of the eluent influenced theretention times of peptides in a capillary electrochromatography set-up[Walhagen, 2001; Oda 1994]. Evaluation of different eluents has also beenreported for affinity chromatography systems. One report [Tsang, 1991]describes how a set of potential eluents were designed to perturb thedifferent forces that make up the interaction. A mixture of MgCl2 andethylene glycol was found to be gentle and highly efficient in dissociatingantibodies present in goat serum from an affinity chromatography column.Brigham-Burke and O’Shannesy [1993] showed that certain acidic solutionscould elute reactants in a binding assay prior to construction of the actualaffinity chromatography column. From the same investigation, the importantconclusion could be drawn, that the choice of acid is sometimes moreimportant than the choice of pH.
The influence of electrostatic contributions on biomolecular interactionshas been assessed by shielding charged residues by use of high saltconcentration. Faiman et al. [1996] compared the binding of a positivelycharged peptide and a few less charged mutant peptides to an antibody withand without addition of 1 M NaCl. Although such high salt concentrationsaffect hydrophobic interactions as well, the importance for binding of eachcharged residue could be determined by comparing how the differentpeptides lost binding strength upon NaCl addition.
Other reports have focused on how variations in chemical environmentaffect or allow a biological mechanism. The internalization mechanism ofthe diphtheria toxin was studied using a binding assay with different buffers

14
[Brooke, 1998]. This toxin is a protein that has two domains. One domain istoxic and the other mediates toxin transport across the cell membrane. Whenthe diphtheria toxin gets in contact with a cell it binds strongly to amembrane-anchored receptor. The toxin follows the receptor through themembrane to the interior of the cell. Due to the lower pH inside the cell(compared to the outside) the toxin is released from the receptor. Inconclusion, the internalization mechanism involves changes in localenvironment.
Xie et al. [1998] showed that proteins belonging to the Bcl-2 family formion channels in membranes better at low pH (~4) than at physiological pH(7.4). The ion channels are dimers. At low pH, the dimer dissociation ismuch slower than at physiological pH. Within the cytosol of a cell, the pH isnever as low as 4. However, local acidic environments with pH 6-6.5 doexist in the mitochondrial intermembrane. The slightly lower pH in themitochondrial intermembrane cannot alone explain why the Bcl-2 type ionchannels prefer certain intermembranes, but it highlights the biological useof local environments for establishing function.
All the above investigations have in common that they change oneenvironmental parameter at a time and aim at finding a maximum among thesolutions used in the experiments. Furthermore, in many of the cases above,the chemical space is rather limited. In general, if multivariate experimentaldesign had been used, the results of most of the reports found above couldhave been obtained from fewer experiments. Alternatively, more informationcould have been obtained using the same experimental resources.
Few attempts have been made to perform buffer sensitivity experimentsfor predictive purposes. One such experiment was reported by Marengo etal. [1999] where multivariate experimental designs were used for theoptimization of a chromatography set-up. The composition of the mobilephase for maximum separation of nine chloroaniline isomers was optimizedin three successive experiments, all according to multivariate design. Apartfrom two parameters known to influence peak separation (the concentrationof organic modifier and the flow rate), the effect of pH turned out to besignificant. The multivariate optimization made it possible to readilyseparate the peaks of the nine isomers.
QSARThe goal with quantitative structure-activity relationship (QSAR) studies isto identify a mathematical relationship between molecular structure andbiological activity, e.g. antibacterial potency or binding strength to a cellularreceptor. Since the advent of QSAR methodology in 1964 [Hansch, 1964]this approach has developed enormously. Currently, there are mainly two

15
classes of methods for performing QSAR experiments. One class relies onthe ability of modern computers to handle large matrices. Comparativemolecular field analysis (CoMFA) [Kubinyi, 1998] belongs to this class.Such methods use techniques that involve a huge number of descriptors fordescribing the structure of one of the interacting molecules. A multivariateregression algorithm is then used to sort out which ones of all descriptorshave something to do with activity. Partial least squares (PLS) regression[Geladi, 1986] is a commonly used algorithm for this purpose. The secondclass of QSAR methods relies on compact descriptors of molecular structure.This means that a relationship between a few, information dense descriptorsand activity will be derived. QSAR studies performed according to the bio-chemometric approach belong to this class. The derivation of the relationshipwill be less complicated than for the first class of QSAR methods, providedthat proper molecular descriptors are chosen.
All QSAR methods have four basic steps in common:
� Selection of a set of molecules� Characterization of the biological activity of the molecules� Mathematical description of the molecular structure� Identification of a mathematical model that relates molecular structure to
activity
Selection of moleculesEarly QSAR reports were mainly retrospective studies on already publisheddata, and therefore the molecules could not be selected. Still today, manyreports are based on analysis of data found in the literature. In such cases,the selection of compounds is instead performed from a chemical synthesispoint of view, which seldom gives a set of compounds suitable for QSARanalysis. The need for a statistically sound selection of molecules has beenshown to be a key issue for the success of QSAR analysis [Pötter, 1998;Kubinuyi, 1998; Andersson, 2000]. As previously described, using amultivariate selection strategy is one possibility to obtain a set of moleculeswith good properties for QSAR [Hellberg, 1987; Mee, 1996; Linusson,2001].
Characterization of activityTypically, the characterization of activity is the measurement of an entityrelated to the desired biological activity. For a drug that inhibits an enzyme,one possible activity estimate is enzyme efficiency measured in a cell-basedassay. Another possibility is to use a binding assay where the affinity andkinetics of the interaction of the drug with the enzyme are measured in astandard buffer. Activity estimates not only need to be accurate and precise
16
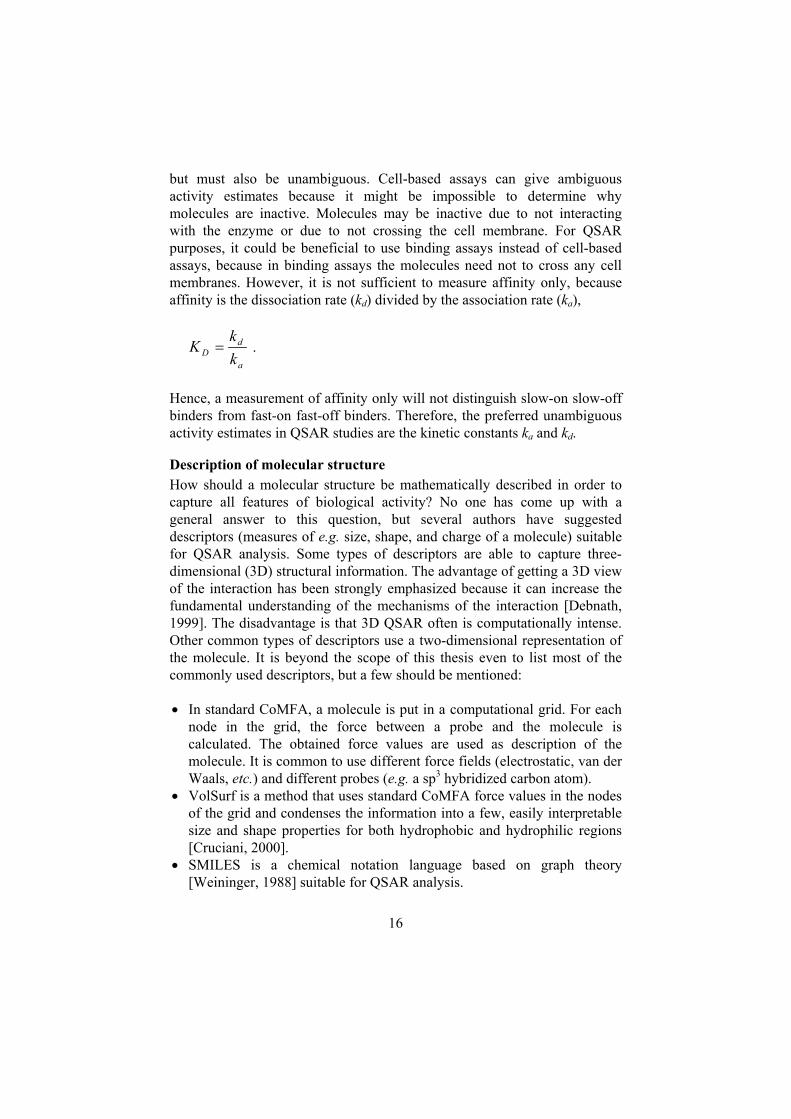
but must also be unambiguous. Cell-based assays can give ambiguousactivity estimates because it might be impossible to determine whymolecules are inactive. Molecules may be inactive due to not interactingwith the enzyme or due to not crossing the cell membrane. For QSARpurposes, it could be beneficial to use binding assays instead of cell-basedassays, because in binding assays the molecules need not to cross any cellmembranes. However, it is not sufficient to measure affinity only, becauseaffinity is the dissociation rate (kd) divided by the association rate (ka),
a
dD k
kK � .
Hence, a measurement of affinity only will not distinguish slow-on slow-offbinders from fast-on fast-off binders. Therefore, the preferred unambiguousactivity estimates in QSAR studies are the kinetic constants ka and kd.
Description of molecular structureHow should a molecular structure be mathematically described in order tocapture all features of biological activity? No one has come up with ageneral answer to this question, but several authors have suggesteddescriptors (measures of e.g. size, shape, and charge of a molecule) suitablefor QSAR analysis. Some types of descriptors are able to capture three-dimensional (3D) structural information. The advantage of getting a 3D viewof the interaction has been strongly emphasized because it can increase thefundamental understanding of the mechanisms of the interaction [Debnath,1999]. The disadvantage is that 3D QSAR often is computationally intense.Other common types of descriptors use a two-dimensional representation ofthe molecule. It is beyond the scope of this thesis even to list most of thecommonly used descriptors, but a few should be mentioned:
� In standard CoMFA, a molecule is put in a computational grid. For eachnode in the grid, the force between a probe and the molecule iscalculated. The obtained force values are used as description of themolecule. It is common to use different force fields (electrostatic, van derWaals, etc.) and different probes (e.g. a sp3 hybridized carbon atom).
� VolSurf is a method that uses standard CoMFA force values in the nodesof the grid and condenses the information into a few, easily interpretablesize and shape properties for both hydrophobic and hydrophilic regions[Cruciani, 2000].
� SMILES is a chemical notation language based on graph theory[Weininger, 1988] suitable for QSAR analysis.

17
� Principal property scales for amino acids have been used in QSARanalyses of peptides. One collection of property scales, the ZZ-scales,describes e.g. hydrophobicity, size, and electronic properties of aminoacids [Hellberg, 1987]. A peptide or a protein can be described as avector of such property values.
Of these descriptors, force field values and VolSurf provide 3D informationwhile SMILES and principal property scales for amino acid do not.
Identification of a mathematical modelThe methods typically used for deriving and validating mathematical modelsin QSAR differ slightly from the methods frequently used in statistics. Thebasic problem is regression, namely how to fit a given model to themeasured activities.
In QSAR, y is a vector with numbers representing the measured activityof all molecules in the study, and X is a matrix with numbers containing thestructure description. In X, there is one row per molecule, and one columnper structural descriptor.
y=f(X)
The function f is often a linear function of the elements of X. A simpleexample is the prediction of the activity y using a set of structure descriptorscontaining information on the number of aromatic rings (#AR) and on thenumber of carboxyl groups (#COOH) in a molecule. Given n molecules, thefunction f becomes
�
�
�
�
�
�
�
�
�
�
�
�
�
�
�
�
�
�
�
�
�
��
�
�
�
�
�
�
�
�
�
�
��
�
�
�
�
�
�
�
�
�
�
�
�
�
�
�
�
�
�
�
�
�
nnnn COOH
COOHc
AR
ARccXfy
y
y
�
�
...#
...#
#...
#
1...1
)(...11
2
1
10
1
.
The values of the scalar coefficients c0, c1 and c2 are obtained by regressionand the vector is the residual error. In this example, there are threeunknown coefficients. Thus, activity has to be measured for at least threemolecules to make it possible to estimate the values of the coefficients. Amore common situation is that the number of structure descriptors exceedsthe number of molecules. In such cases, an ordinary least-square fit will notwork. A variety of robust regression algorithms have been developed for thispurpose [see e.g. Frank, 1993]. In QSAR studies, partial least squares (PLS)regression tends to be the most frequently used method. A more detaileddiscussion on regression algorithms is given in Appendix A.

18
A QSAR model has to be validated. One way to achieve this is tocalculate R2 for molecules with measured activity,
� �
� ��
�
�
�
�
�
�� n
ii
n
iii
yy
yyR
1
2
1
2
2ˆ
1 .
Here i is the estimate of yi using the model, y is the average of all yi, and nis the number of molecules used. However, R2 is typically calculated for themolecules used for the derivation of the model, and can thereforeoverestimate the predictive power of the model. If the set of molecules withknown activity is large, it is normally divided into a training set and a testset. The training set is used for derivation of the model and the test set isused for estimation the validity of the model. In many cases, the set ofmolecules with known activities is not large enough for allowing a split intotwo sets. In those cases, an estimate, Q2, of R2 based on leave-one-out cross-validation has traditionally been considered sufficient for validationpurposes. Leave-one-out cross-validation is a procedure where onemeasurement is temporarily excluded from the data set, the regression modelis built using the reduced data set and is employed to predict the left-outmeasurement. This is repeated for all measurements, and the sum of theprediction errors is used to calculate Q2, which is an estimate of R2:
� �
� ��
�
�
�
�
�
�� n
ii
n
iiCVi
yy
yyQ
1
2
1
2
2ˆ
1 .
Here, iCV is the estimate of yi using a model based on a reduced data set. InQSAR papers, models with Q2>0.5 have been published and Q2~0.7 havebeen considered good (see paper III for references). Recently, it has beenshown that a high Q2 is a necessary but not sufficient condition for a trulypredictive model. As shown by Golbraikh and Tropsha [2002], selecting amodel structure for maximization of Q2 will not necessarily give a modelwith good predictive properties (as assessed using an external test set ofmolecules with known activities). Thus, there is a need for more reliableestimates of the predictive properties of QSAR models. Golbraikh andTropsha [2002] concluded that external validation is the only way toestablish a reliable QSAR model. Unfortunately, external validation is not
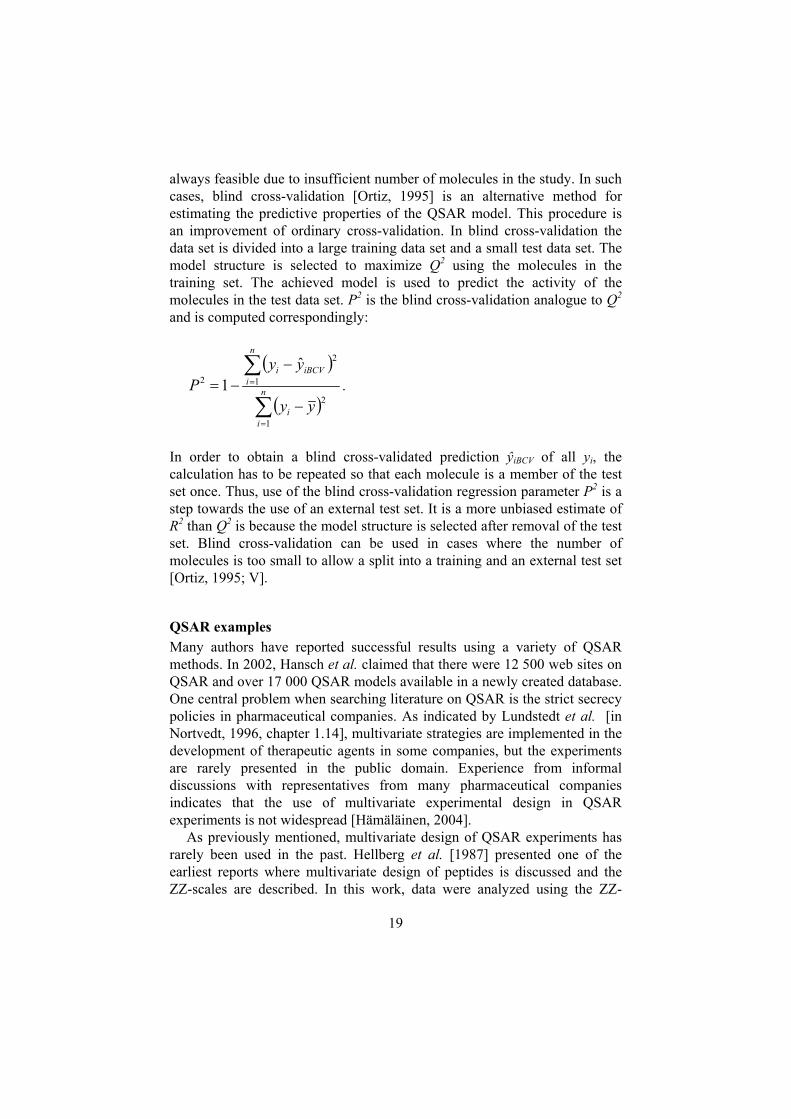
19
always feasible due to insufficient number of molecules in the study. In suchcases, blind cross-validation [Ortiz, 1995] is an alternative method forestimating the predictive properties of the QSAR model. This procedure isan improvement of ordinary cross-validation. In blind cross-validation thedata set is divided into a large training data set and a small test data set. Themodel structure is selected to maximize Q2 using the molecules in thetraining set. The achieved model is used to predict the activity of themolecules in the test data set. P2 is the blind cross-validation analogue to Q2
and is computed correspondingly:
� �
� ��
�
�
�
�
�
�� n
ii
n
iiBCVi
yy
yyP
1
2
1
2
2ˆ
1 .
In order to obtain a blind cross-validated prediction iBCV of all yi, thecalculation has to be repeated so that each molecule is a member of the testset once. Thus, use of the blind cross-validation regression parameter P2 is astep towards the use of an external test set. It is a more unbiased estimate ofR2 than Q2 is because the model structure is selected after removal of the testset. Blind cross-validation can be used in cases where the number ofmolecules is too small to allow a split into a training and an external test set[Ortiz, 1995; V].
QSAR examplesMany authors have reported successful results using a variety of QSARmethods. In 2002, Hansch et al. claimed that there were 12 500 web sites onQSAR and over 17 000 QSAR models available in a newly created database.One central problem when searching literature on QSAR is the strict secrecypolicies in pharmaceutical companies. As indicated by Lundstedt et al. [inNortvedt, 1996, chapter 1.14], multivariate strategies are implemented in thedevelopment of therapeutic agents in some companies, but the experimentsare rarely presented in the public domain. Experience from informaldiscussions with representatives from many pharmaceutical companiesindicates that the use of multivariate experimental design in QSARexperiments is not widespread [Hämäläinen, 2004].
As previously mentioned, multivariate design of QSAR experiments hasrarely been used in the past. Hellberg et al. [1987] presented one of theearliest reports where multivariate design of peptides is discussed and theZZ-scales are described. In this work, data were analyzed using the ZZ-

20
scales but no peptides were designed. Later, Mee et al. [1997] used theapproach described by Hellberg et al. [1987] to design a set of 99 peptides,and assessed their antibacterial activity. The QSAR models obtained hadacceptable predictive power and the antibacterial potency was increased by afactor of 2.
In a more recent report, Linusson et al. [2001] describe a thrombininhibitor QSAR experiment. The authors had access to a historic data setconsisting of approximately 100 molecules for which a QSAR model wasdeveloped. Information from this historic QSAR was used to guide theselection of 3 structural positions to be modified and to indicate which typeof modification could be made at each position. A multivariate designsuggested that 18 molecules should be sufficient to span the desiredstructural space. The 18 molecules were synthesized, characterized in termsof thrombin inhibition potency and a new QSAR model was designed usingonly these 18 molecules. This second QSAR model gave importantinformation on co-operativity between two of the modified positions,something that the historic QSAR model could not detect even thoughfivefold more molecules had been used when constructing it.
A paper by Debnath [1999] can serve as an example of a moremainstream CoMFA QSAR experiment. In this report, the HIV-1 proteaseinhibition potency of a series of 118 cyclic urea derivatives was explored.This was a retrospective analysis of data extracted from three independentreports. QSAR models with Q2~0.7 were obtained. This report, incombination with a review by Kubinyi [1998], gives a good overview ofhow CoMFA can be used.
In a recent qualitative structure-kinetic relationship study on HIV-1protease inhibitors, the authors report and discuss differences in the kineticsfor groups of compounds with different scaffolds [Markgren, 2002]. Forexample, cyclic compounds often have high affinities and high dissociationrates, whereas symmetric linear compounds often have high affinity and lowdissociation rates. Apart from the papers included in this thesis, this paper isone of the first where kinetics have been related to molecular structure.
ChemometricsThe bio-chemometric approach uses common chemometric tools fordesigning experiments, selecting a mathematical model that describes theexperimental outcome, and fitting the model to experimental outcome. Thesechemometric tools are described in this section.
A main component in the bio-chemometric approach is multivariateexperimental design. Multivariate designs differ from classical experimental
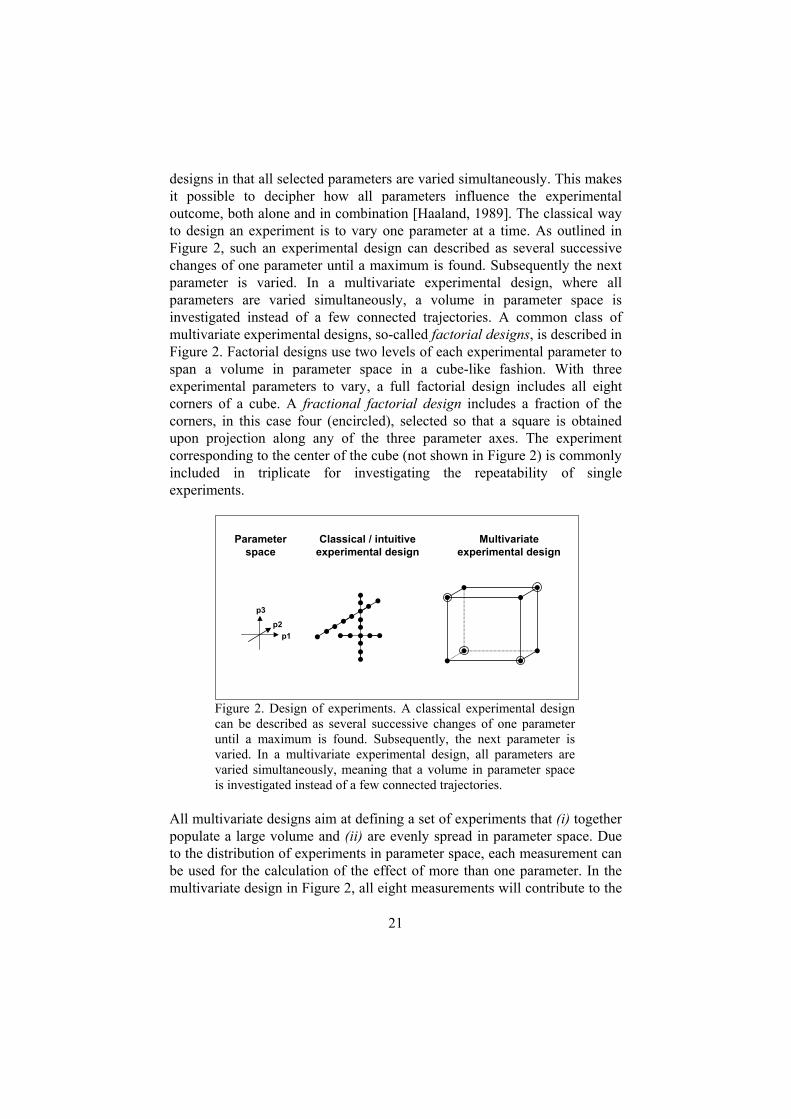
21
designs in that all selected parameters are varied simultaneously. This makesit possible to decipher how all parameters influence the experimentaloutcome, both alone and in combination [Haaland, 1989]. The classical wayto design an experiment is to vary one parameter at a time. As outlined inFigure 2, such an experimental design can described as several successivechanges of one parameter until a maximum is found. Subsequently the nextparameter is varied. In a multivariate experimental design, where allparameters are varied simultaneously, a volume in parameter space isinvestigated instead of a few connected trajectories. A common class ofmultivariate experimental designs, so-called factorial designs, is described inFigure 2. Factorial designs use two levels of each experimental parameter tospan a volume in parameter space in a cube-like fashion. With threeexperimental parameters to vary, a full factorial design includes all eightcorners of a cube. A fractional factorial design includes a fraction of thecorners, in this case four (encircled), selected so that a square is obtainedupon projection along any of the three parameter axes. The experimentcorresponding to the center of the cube (not shown in Figure 2) is commonlyincluded in triplicate for investigating the repeatability of singleexperiments.
Classical / intuitiveexperimental design
Multivariateexperimental design
p1p2
p3
Parameterspace
Figure 2. Design of experiments. A classical experimental designcan be described as several successive changes of one parameteruntil a maximum is found. Subsequently, the next parameter isvaried. In a multivariate experimental design, all parameters arevaried simultaneously, meaning that a volume in parameter spaceis investigated instead of a few connected trajectories.
All multivariate designs aim at defining a set of experiments that (i) togetherpopulate a large volume and (ii) are evenly spread in parameter space. Dueto the distribution of experiments in parameter space, each measurement canbe used for the calculation of the effect of more than one parameter. In themultivariate design in Figure 2, all eight measurements will contribute to the

22
calculation of the effect of parameter p1. This is made possible bysubtraction of the average of the results of the four corners to the left fromthe results of the four corners to the right. The impact of parameters 2 and 3can be calculated analogously. This means that each measurement is usedthree times. Designs of this type typically give information on bothindividual parameter impact and parameter co-operativity with significantlyfewer experiments than with classical designs [Haaland, 1989]. Furthermore,iterative use of multivariate design has been shown to be very efficient inoptimization experiments [I; Marengo, 1999]. The designs used in theexperiments in this thesis are described in Appendix B.
Analysis of results from multivariate experimental designed experimentstypically requires knowledge in mathematics and statistics or access todedicated evaluation software. The complexity in transferring the measuredresults into understandable results is the main hurdle to overcome when firstusing multivariate experimental designs, even though the mathematics usedoften resemble an ordinary linear fit.
When all experiments have been performed, a mathematical model has tobe selected and fitted to the data. The procedure for model identificationdescribed in the QSAR section is valid also here. If the experimental domainis small, a quite simple model will suffice. It is important to remember thatthe model is phenomenological, i.e. it is a description of how the results varywithin the experimental domain, not an attempt to find the reasons for theobserved variations. Furthermore, the model needs to be validated. The samemethods as those described in the QSAR section are used for this purpose.
SPR biosensorsBiosensors based on surface plasmon resonance (SPR) detectors have gainedin importance during recent years. Such biosensors are typically designed todetect the course of a molecular interaction in real-time [Jönsson, 1991].Currently, the main supplier of SPR biosensors is Biacore AB (Uppsala,Sweden). The work described in this thesis was partly performed as anindustrial research project at Biacore AB, and therefore the choice ofinstrument was obvious. Most experiments presented here were performedusing Biacore®3000. SPR biosensors from other suppliers could have beenused during the development, albeit with severe limitations on the choice ofwhat molecular interactions to study.
A brief description of the Biacore instrument is needed for explaining thedevelopment of the bio-chemometric approach. The main parts of theinstrument are an optical detection system, a disposable sensor chip, and anintegrated microfluidic cartridge (IFC), as outlined in Figure 3.

23
The IFC has channels, valves and flowcells. Liquid is distributed to the sensorchip as indicated by the arrows.
The sensor chip is a glass slide coveredwith a thin gold film to which dextran isattached. The ligands are covalently boundto the dextran.
In the optical detection system, the sensorchip is illuminated with a fan-shaped beam.In the reflected beam, there will be anintensity minimum with angular positiondepending on the refractive index close tothe sensor chip.
When put together, a system able tomonitor biomolecular interactions in real-time is obtained.
Inte
nsity
Lightsource
Prism
Glass slide
LigandDextran
Channel
Flow cell
Valve
Gold film
Detector
Angle
Figure 3. Schematic of an SPR biosensor.
The SPR detector is used to monitor changes in refractive index in thevicinity of a thin gold film in real-time. The sensor chip is a glass slidecovered with a thin gold film to which dextran molecules are covalentlyattached. The IFC has flow cells which are connected to the sensor chip andchannels with valves for the distribution of liquid to the flow cells. Whensetting up the system for interaction analysis, molecules of one type (ligand)are covalently bound to the dextran on the sensor chip. This first step isreferred to as immobilization. Next, molecules in solution (analyte) areinjected through the IFC to the sensor chip. If an analyte interacts with theimmobilized ligand, analyte accumulate close to the sensor surface. For thevast majority of possible analytes, this accumulation leads to an increase inthe refractive index at the sensor surface, and the SPR detector will registerthe progress of the interaction as a continuous change in the signal. After theanalyte injection, ordinary buffer is flown over the sensor surface, and theanalyte will spontaneously dissociate. For stable interactions where a longtime is needed for spontaneous dissociation of all bound analyte molecules, aregeneration step is required to force all of them to dissociate. The aim of theregeneration is to maximize dissociation by changing the chemicalenvironment in a way that does not destroy the immobilized ligand. Acommon regeneration solution is glycine buffer at pH 2.0-3.0. When allanalyte molecules have dissociated from the ligand, the system is ready forinjection of a new analyte.
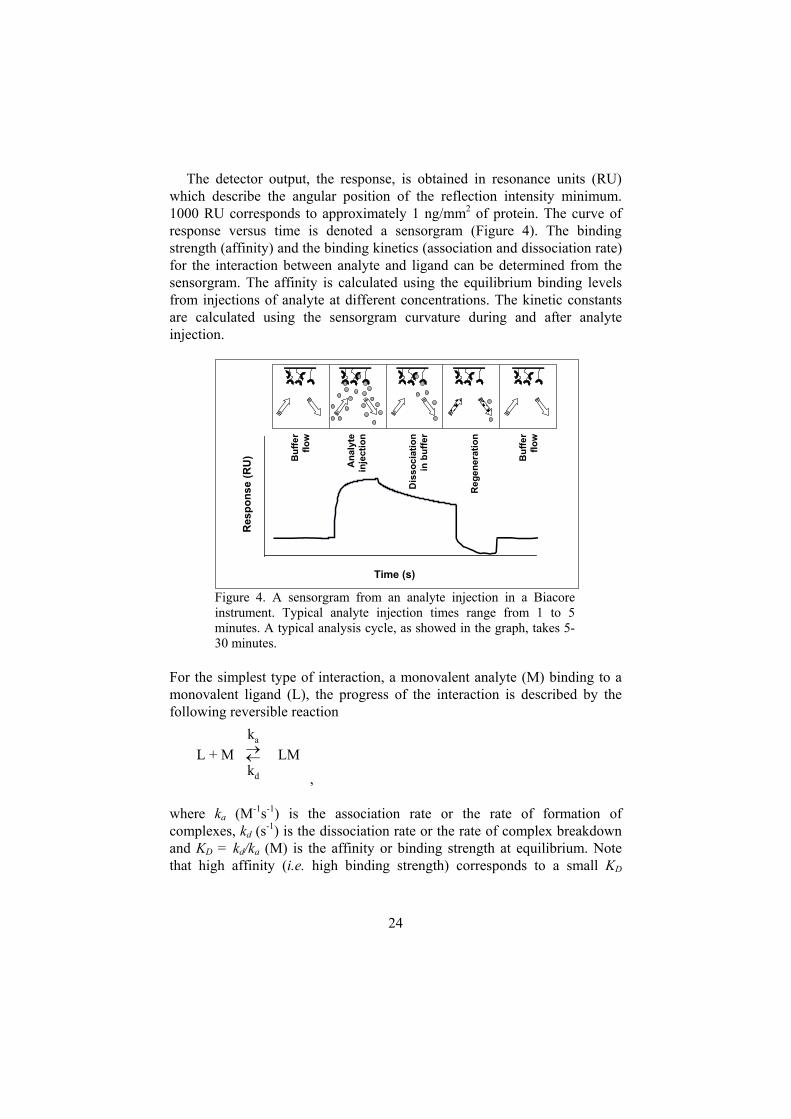
24
The detector output, the response, is obtained in resonance units (RU)which describe the angular position of the reflection intensity minimum.1000 RU corresponds to approximately 1 ng/mm2 of protein. The curve ofresponse versus time is denoted a sensorgram (Figure 4). The bindingstrength (affinity) and the binding kinetics (association and dissociation rate)for the interaction between analyte and ligand can be determined from thesensorgram. The affinity is calculated using the equilibrium binding levelsfrom injections of analyte at different concentrations. The kinetic constantsare calculated using the sensorgram curvature during and after analyteinjection.
Time (s)
Res
pons
e (R
U)
Ana
lyte
inje
ctio
n
Dis
soci
atio
nin
buf
fer
Reg
ener
atio
n
Buf
fer
flow
Buf
fer
flow
Figure 4. A sensorgram from an analyte injection in a Biacoreinstrument. Typical analyte injection times range from 1 to 5minutes. A typical analysis cycle, as showed in the graph, takes 5-30 minutes.
For the simplest type of interaction, a monovalent analyte (M) binding to amonovalent ligand (L), the progress of the interaction is described by thefollowing reversible reaction
L + M LM�
�
ka
kd ,
where ka (M-1s-1) is the association rate or the rate of formation ofcomplexes, kd (s-1) is the dissociation rate or the rate of complex breakdownand KD = kd/ka (M) is the affinity or binding strength at equilibrium. Notethat high affinity (i.e. high binding strength) corresponds to a small KD

25
value. Analytes with identical affinities can have different association anddissociation rates, as exemplified in Figure 5.
0
20
40
60
80
100
0 1000200 400 600 800Time (s)
Res
pons
e (R
U)
A
B
C
Figure 5. Simulated sensorgrams for three molecules interactingwith the same affinity but with different kinetic properties. Theslow-on, slow-off curve (A) corresponds to ka=104 M-1s-1, kd=10-4 s-
1, the medium-on medium-off (B) to ka=105 M-1s-1, kd=10-3 s-1 andthe fast-on fast-off (C) to ka=106 M-1s-1, kd=10-2 s-1. All threeinteractions have affinity KD=10 nM. Simulations were performedfor injection of 100 nM analyte onto a surface with 100 RUmaximum binding capacity.
SPR biosensors can also be used to determine the concentration of ananalyte. Furthermore, by combining information from different ligands ordifferent analytes, the degree of cross-reactivity can be determined.Currently available SPR biosensors are easy to use, provide results withintens of minutes and can be used for both low and high affinity interactions(mM to pM). Possible ligands and analytes include drugs, peptides, DNA,RNA, proteins, viruses (as reviewed by Rich and Myszka [2002]), and wholecells [Gestwicki, 2002].

26
Scientific objectives
The work described in this thesis had three goals:
� To develop a useful description of biomolecular interactions. Abiomolecular interaction can be affected by many different parametersincluding molecular structure, chemical environment, light, andtemperature. However, the characterization of a biomolecular interactionis typically performed at one single set-up of parameters only (e.g. in onechemical environment and at one temperature). Investigation of a seriesof experiments with simultaneous changes in several parameters couldconstitute a reliable and possibly more information rich description of abiomolecular interaction than what is typically used.
� To investigate to what extent such an information rich descriptioncan be used for predictive purposes. In many applications, one of thebinding partners is given and a desired binding profile for the secondbinding partner can be defined. For example, when designing an assay forquantification, the molecule to be quantified is given, and the moleculeused for its detection is optimized. The time required to identify thedetection molecule could be substantially decreased if prediction of thebinding properties for novel chemical structures and in novel chemicalenvironments was possible.
� To suggest a standard for reporting the characterization of abiomolecular interaction. The buffer conditions and the temperaturesused for biomolecular interaction analysis vary significantly betweenlaboratories. This makes it difficult to compare published results obtainedfor the same interaction by different research groups. By standardizingthe format for how the characterization of a biomolecular interactionshould be performed and reported, comparisons would become morereliable.
27
The bio-chemometric approach
The bio-chemometric approach developed within this thesis work is generaland can be applied to most types of biochemical experiments. This sectionwill first describe the methodology in general terms. Next, the threeapplications that have been used to test the methodology are presented inmore detail.
The aim of the bio-chemometric approach is to describe a reference stateof an interaction. “Reference state” is used to denote one special setting ofexperimental parameters, e.g. pH, solvent content and salt concentration inthe buffer. The description of the reference state can e.g. reflect binding sitecomposition. The bio-chemometric approach is carried out by performing anexperiment repeatedly during which several experimental parameters aresimultaneously varied around their starting point values. A statisticalexperimental design is used which leads to efficient use of experimetnalresources. A mathematical model that describes the relationship between theparameter settings and the experimental outcome is then developed and usedas a description of the starting point.
There is a slight difference between the standard chemometric approachand the bio-chemometric approach. In standard chemometric experiments,the goal is often to optimize the experimental outcome. In contrast, the bio-chemometric approach focuses more on the starting point parameter values.The starting point, or reference state, is described using the coefficients ofthe mathematical model. This difference has consequences for the design ofthe experimental procedures. When optimizing the experimental outcome,the variation of the parameters should be quite large in order to find the bestsettings of the parameters sooner. In the bio-chemometric approach, theparameter variations can be kept small because a slight change in theexperimental outcome is enough for stating the importance of a certainparameter. Although the main goal is not result optimization, the bio-chemometric approach gives data that are suitable for optimization ofexperimental outcome.
In practice, applying the bio-chemometric approach is straightforward:
1. Define a reference state (parameter settings) where the intendedexperiment is known to work.

28
2. Select a number of experimental parameters whose influence on theexperimental outcome is to be investigated. For each parameter, define alower and a higher setting believed to give a small but clearlymeasurable change in experimental outcome.
3. Use a multivariate experimental design to decide upon differentparameter settings for the experiments to be performed. Since manypowerful designs have been published as collections of tables (see e.g.Haaland [1989]), this is usually a simple task.
4. Perform all the experiments.5. Fit a mathematical model that uses parameter settings as input and
returns an estimate of experimental outcome. In many cases, a linearmodel will suffice, since small variations in parameters tend to beselected. There are many different commercially available softwarepackages that support this kind of modeling (see e.g. www.umetrics.comor www.camo.com).
6. Investigate the validity of the mathematical model.7. Consider the coefficients of the mathematical model as a
characterization of the reference state. This description is the goal of thebio-chemometric approach.
By repeating the experiment with different molecules, cell-lines or otherbiological entities, changes in sensitivity patterns can be compared betweenrelated species. Furthermore, the mathematical model can be used forprediction of experimental outcome for novel combinations of parametersettings.
The bio-chemometric approach was used on three types of applicationsthat will be described in detail below.
Application 1: the RO protocolThe RO protocol is described in detail in paper I.
The objective for developing the Regeneration Optimization protocol wasto simplify the sometimes tedious process of identifying a suitableregeneration solution for SPR biosensors. The RO protocol is based on apredefined set of stock solutions. These are selected and named according tocommonly used chemical properties for regeneration: Acids, bases, nonpolarsolvents, chelating agents, detergents and ions/chaotrops (abbreviated A, B,U, C, D and I, respectively). Each stock solution contains several chemicalswith the same main property, but with differences in molecular structure,pKa, etc. For example, the acidic stock solution contains phosphoric acid(inorganic), formic acid (one carboxyl group), oxalic acid (two carboxyl

29
groups, small) and malonic acid (two carboxyl groups, larger). The stocksolution with chelating agents is an exception, it only contained EDTA. Thestock solutions are mixed into a first set of cocktails according to a simplemultivariate experimental design which is described in Appendix B. Thisfirst cocktail set is sequentially tested for regeneration efficiency by firstinjecting analyte followed by a series of short cocktail injections (Figure 6).
200 400 600 800 1000 1200 1400 1600
1.7
1.71
1.72
1.73
1.74
1.75
1.76
1.77
1.78
1.79x 10⁴
Res
pons
e (R
U)
Time (s)
1
23
4
5
6
Figure 6. Typical sensorgram obtained when running the ROprotocol. Analyte was injected (1) followed by a number ofdifferent cocktail injections (2-5). Cocktail 3 and 5 had someregeneration effect and cocktail 2 and 4 had no regeneration effect.More analyte was then added (6), followed by further cocktail andanalyte injections.
In many cases one of the cocktails has sufficiently good regenerationproperties. Alternatively, the results from the screen of the initial cocktail setprovide information on what chemical properties should be used whendesigning the second cocktail set. The protocol was tested on about 30different molecular interactions, and for most of them a suitable regenerationsolution was identified. The conclusion of this work was that it is usuallybeneficial to mix chemicals that affect different intermolecular forces forachieving good regeneration solutions. A tentative explanation of thisfinding is that by simultaneously affecting several different forces thatmaintain the interaction, the likelihood to break the bond increases. Sincemany different forces were affected simultaneously, a lower concentration ofeach chemical was required compared to the concentration needed if a singlechemical affecting only one type of force had been used for regeneration.

30
A first primitive chemical sensitivity fingerprint was discovered duringthe development of the RO protocol. Retrospectively, two points werecrucial for this finding. One was that the RO protocol always started with thesame initial set of regeneration cocktails. Thus, the results from the first stepcould always be compared. The second point was that ten of the investigatedbiomolecular interactions had one binding partner in common.Staphyllococcus protein A is known to bind to most subclasses of mouse IgGantibodies. Since there were many different antibodies available in thelaboratory, protein A was immobilized onto a sensor chip and the protocolwas run 10 times using different antibodies as binding partner. Interestingly,the regeneration efficiency pattern for the cocktails in the first set differedbetween different subclasses of antibodies. In Figure 7, the regenerationefficiency patterns for six different IgGs are shown. The three antibodies ofsubclass IgG1 all had similar patterns. Antibodies of subclass IgG2 also hadsimilar patterns. Since the IgG1 pattern is different from the IgG2 pattern,the RO protocol gave subclass specific information. Thus, the RO protocolviewed as a fingerprint could in some respect be used for determining thesubclass of an IgG antibody (Figure 7).
IgG1_459
IgG2a_clone3IgG2b_clone3
IgG1_r154
IgG2b_clone2
IgG1_r200
BwwAww
IwwDwwUww
CwwBDw
BCwAIw
ADwAUw
ACwIDwICwDUw
DCwUCw
ABw
100%
0%
Figure 7. Regeneration efficiency for the first set of cocktails in theRO protocol for six different antibodies binding to Staphyllococcusprotein A. For each antibody, the regeneration efficiency of eachcocktail is indicated as a peak in a certain direction. The innercircle corresponds to 0% efficiency and the outer circlecorresponds to 100%. The cocktails were composed of three equalvolumes of stock solutions (A, B, U, C, D, I) and water (w). ForIgG1_459, the cocktails Iww and AIw have regenerationefficiencies of 60% and 95%, respectively.

31
Application 2: the chemical sensitivity fingerprintChemical sensitivity fingerprints are discussed in papers II, III and IV. In II,there is a discussion about the “Sbuf-model” which is a quantitative buffer-kinetic relationship (QBKR). In paper III, the chemical sensitivity fingerprintis defined as the normalized coefficients in a QBKR model. Paper IV usesthe same nomenclature as paper III but the QBKR models are differentlyscaled.
The RO protocol was not designed to provide analytical informationabout the interaction of two interacting molecules. In contrast, the measuredentity in the RO protocol is the regeneration effect, i.e. what fraction of thebound sample molecules dissociate due to cocktail injection. Figure 7 showsthe results of harsh chemical disturbance of interacting molecules.Alternatively, the changes in chemical environment can be applied when theinteraction is initiated. In this case, the concentrations of chemical additivescan possibly be significantly lower but still have a detectable influence onbinding characteristics. Therefore, a new study was designed to explore indetail how an interaction is affected by changes in chemical environment.This is described in Figure 8.
The goal of the RO protocolexperiments was to optimizeregeneration conditions byvarying the chemicalenvironment after sampleinjection. This experimentwas not expected to givequantitative information.
RO protocol
QBKR For QBKR, the focus wasshifted to the sampleinjection. By varying thechemical environmentalready during sampleinjection, quantitativeinformation about thesensitivity of the interactioncould readily be obtained.
Figure 8. A sensorgram view of the RO protocol and QBKRregions of interests.

32
Generation of a chemical sensitivity fingerprintAn experimental set-up designed to give a QBKR model was used forinvestigation of the interaction of the Z-fragment of protein A with mouseIgG [II]. A set of 16 interaction buffers with slightly different chemicalcompositions was selected according to a multivariate experimental design.Five different chemical properties were varied in the buffers: the pH valueand the concentrations of NaCl, KSCN, EDTA and DMSO. The chemicalproperties were chosen to selectively target the different forces contributingto the molecular interaction. Electrostatic interactions between the Z-fragment and the mouse IgG should be disturbed by changes in the NaClconcentration whereas KSCN is known to affect the 3D structure of proteins,etc. In this study, it was found that small differences in bindingcharacteristics could be correlated to the variation of the chemicalcomposition of the buffer using a linear model:
� � � � � � � � � �EDTAcpHcDMSOcKSCNcNaClccy ����������� 543210 , (1)
where y is association rate ka, dissociation rate kd or affinity KD. The entity inbrackets (e.g. [pH]) is the setting of each parameter, scaled so that -1corresponds to the low level in the design and +1 corresponds to the highlevel.
Equation 1 is the general form of a QBKR. Figure 9 shows a bar graphwith the coefficients (i.e. c0, c1, … c5 in Equation 1) of the model for thedissociation rate for the Z-fragment - IgG interaction. The pH was theparameter that turned out to have the strongest influence on the dissociationrate: a pH increase from 7.2 to 7.6 decreased the dissociation rate from~0.027 s-1 to ~0.019 s-1 corresponding to a 25% change. The concentrationof NaCl was the second most influential parameter. The interaction wassignificantly more stable in 550 than in 150 mM NaCl. The remaining threechemical properties did not influence the binding characteristics, at least notwithin the concentration ranges used. It was also possible to reliably predictthe binding characteristics in new buffers having untested concentrations ofthe investigated chemical additives.
In three different follow-up studies, the sensitivity to changes in chemicalenvironment was tested for a number of biomolecular interactions[Andersson, 1999; Hämäläinen, 1999; III; IV]. For all the interactions, acorrelation between variations in chemical additives and differences inbinding characteristics was established.

33
NaC
l
KSC
N
DM
SO pH
EDTA
QBKR model coefficients for the dissociation rate of the Z-fragment - IgG interaction
0.0020
0.0000
-0.0020
-0.0040
Constant 0.023NaCl 0.0022KSCN 0.00019DMSO 3.8e-005pH -0.0038EDTA -0.00075
Q2 = 0.935R2 = 0.974
s-1
Figure 9. Scaled and centered coefficients for the QBKR model ofthe dissociation rate for Z-fragment binding to mouse-IgG.Parameters were scaled to [-1,1] (e.g. pH 7.6 1 and pH 7.2 -1).Measured dissociation rates were centered by subtraction of theaverage dissociation rate (0.023 s-1).
The chemical sensitivity fingerprint is closely related to a QBKR. Given thecoefficients in Equation 1, a chemical sensitivity fingerprint is defined as thevector
{c1/c0 , c2/c0 , c3/c0 , c4/c0 , c5/c0} .
This operation converts the coefficients from absolute numbers to relativenumbers. The constant term c0 in Equation 1 is the average magnitude of thedescribed binding constant (ka, kd, or KD). Thus, by using c0 as denominatorin the chemical sensitivity fingerprint, the effect of each additive is given asa fraction of the typical binding constant magnitude. If using the chemicaladditives used in Equation 1, c4/c0 is the expected relative change of y due toincrease of pH from the average pH level to the high pH level. Chemicalsensitivity fingerprints of different interactions can be compared, providedthat the chosen chemical additives and all concentrations defining high andlow levels are the same. Affinity and kinetic constants for differentinteractions can vary by orders of magnitudes even if the interactingmolecules are quite similar. Therefore, the chemical sensitivity fingerprints(with the coefficients expressed as relative numbers) are more easilycompared than the absolute values of the coefficients.
Chemical sensitivity fingerprints for TMVP peptidesIn paper III, the interaction of 18 similar peptides with a fragment of therecombinant antibody 57P (Fab 57P) was characterized in detail. Thepeptides were 16 or 19 residues long, as indicated in figure 10. One of the 18
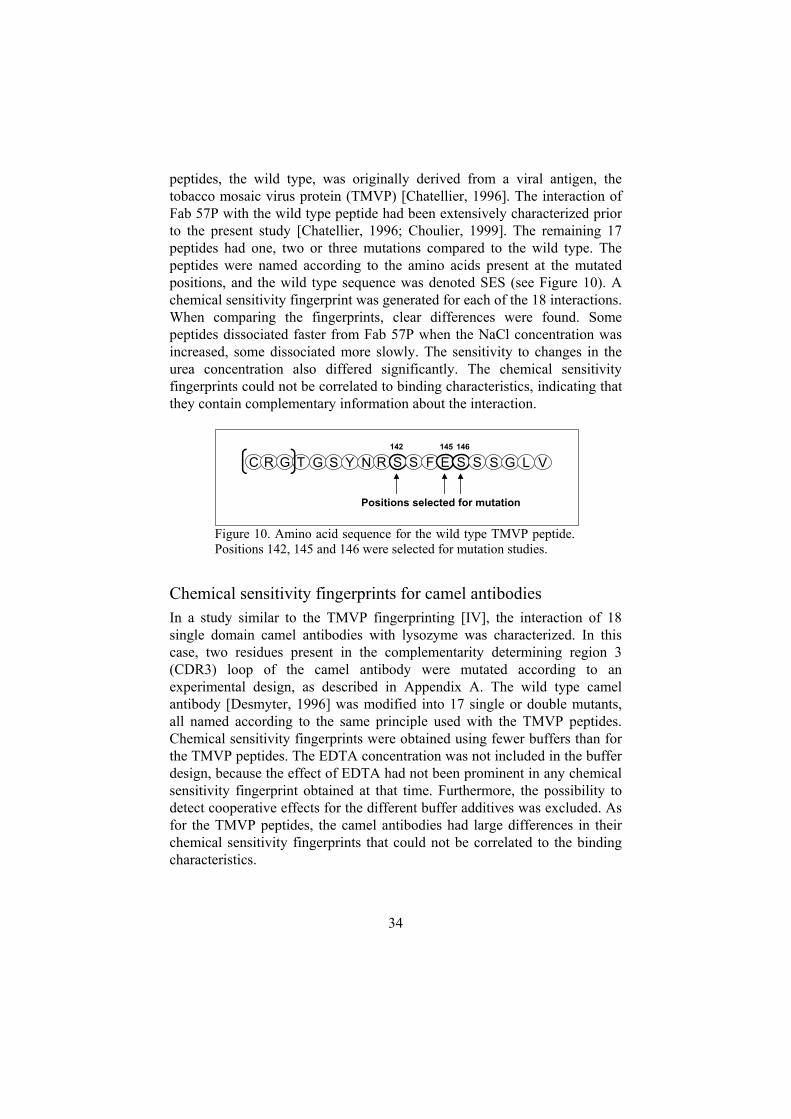
34
peptides, the wild type, was originally derived from a viral antigen, thetobacco mosaic virus protein (TMVP) [Chatellier, 1996]. The interaction ofFab 57P with the wild type peptide had been extensively characterized priorto the present study [Chatellier, 1996; Choulier, 1999]. The remaining 17peptides had one, two or three mutations compared to the wild type. Thepeptides were named according to the amino acids present at the mutatedpositions, and the wild type sequence was denoted SES (see Figure 10). Achemical sensitivity fingerprint was generated for each of the 18 interactions.When comparing the fingerprints, clear differences were found. Somepeptides dissociated faster from Fab 57P when the NaCl concentration wasincreased, some dissociated more slowly. The sensitivity to changes in theurea concentration also differed significantly. The chemical sensitivityfingerprints could not be correlated to binding characteristics, indicating thatthey contain complementary information about the interaction.
Positions selected for mutation
C R G T G S Y N R S S F E S S142 145 146
S G L V
Figure 10. Amino acid sequence for the wild type TMVP peptide.Positions 142, 145 and 146 were selected for mutation studies.
Chemical sensitivity fingerprints for camel antibodiesIn a study similar to the TMVP fingerprinting [IV], the interaction of 18single domain camel antibodies with lysozyme was characterized. In thiscase, two residues present in the complementarity determining region 3(CDR3) loop of the camel antibody were mutated according to anexperimental design, as described in Appendix A. The wild type camelantibody [Desmyter, 1996] was modified into 17 single or double mutants,all named according to the same principle used with the TMVP peptides.Chemical sensitivity fingerprints were obtained using fewer buffers than forthe TMVP peptides. The EDTA concentration was not included in the bufferdesign, because the effect of EDTA had not been prominent in any chemicalsensitivity fingerprint obtained at that time. Furthermore, the possibility todetect cooperative effects for the different buffer additives was excluded. Asfor the TMVP peptides, the camel antibodies had large differences in theirchemical sensitivity fingerprints that could not be correlated to the bindingcharacteristics.

35
Comparison of chemical sensitivity fingerprintsIn Figure 11, a collection of chemical sensitivity fingerprints for differentmolecular interactions are shown. Note that the presentation of the results inthe figure differs from the presentation in the respective original articles [III;IV; Hämäläinen, 1999]. The most obvious difference is that the fingerprintsin Figure 11 were all calculated with log(kd) as y-variable. In paper III, kdvalues were used untransformed. Furthermore, there are differences in thebuffer design: EDTA was not included in the buffers in paper IV.
Although all chemical sensitivity fingerprints in Figure 11 are not trulycomparable there are clear differences between the interactions. Theantibody-myoglobin interaction was very sensitive to buffer changes but theinteractions of TMVP peptides with Fab 57P were not. Three TMVPpeptides (DYD, SAS and QDF) [III] behaved differently when binding toFab 57P. When the NaCl concentration was increased, the dissociation ratedecreased for DYD and increased for SAS and QDF. The single domaincamel antibodies HD and VN differ at only two positions, but showed largedifferences in the fingerprint. The chemical sensitivity fingerprints seem tobe a unique characteristic for interactions. In Figure 11, bar graphs withdouble bars represent two individual measurements of the chemicalsensitivity fingerprint, showing that the repeatability was good.
A possible explanation for the observed differences among fingerprints isthat the fingerprint contains information on which forces contribute to theinteraction. In fact, the chemical additives were chosen to impact mainly oneforce each, as described in paper II. If this hypothesis is correct, theinteractions represented in Figure 11 are mediated by significantly differentforces. Using the same model system as in paper III, Choulier et al. [2002]showed that the binding of a peptide containing a histidine in the binding sitehad significantly larger pH sensitivity compared to the peptides lacking ahistidine. Since the histidine had a pKa in the range of the pH variation, theresults support the hypothesis that the chemical sensitivity fingerprintcontains information about the composition of the binding site.

36
DMSO KSCN NaCl Urea pH EDTA
-0.1
-0.05
0
0.05
0.1
huMYO – Ab 22:3 Fab57P-tmvpQDF
Lysozyme-cabHD
DMSO KSCN NaCl Urea pH
-0.1
-0.05
0
0.05
0.1
DMSO KSCN NaCl Urea pH
-0.1
-0.05
0
0.05
0.1
Lysozyme-cabVN
DMSO KSCN NaCl Urea pH EDTA
-0.1
-0.05
0
0.05
0.1
DMSO KSCN NaCl Urea pH EDTA
-0.1
-0.05
0
0.05
0.1
Fab57P-tmvpDYD
Fab57P-tmvpSAS
DMSO KSCN NaCl Urea pH EDTA
-0.1
-0.05
0
0.05
0.1
DMSO KSCN NaCl Urea pH EDTA
-0.1
-0.05
0
0.05
0.1
DMSO KSCN NaCl Urea pH EDTA
-0.1
-0.05
0
0.05
0.1
huMYO – Ab 22:3 Fab57P-tmvpQDF
Lysozyme-cabHD
DMSO KSCN NaCl Urea pH
-0.1
-0.05
0
0.05
0.1
DMSO KSCN NaCl Urea pH
-0.1
-0.05
0
0.05
0.1
DMSO KSCN NaCl Urea pH
-0.1
-0.05
0
0.05
0.1
DMSO KSCN NaCl Urea pH
-0.1
-0.05
0
0.05
0.1
Lysozyme-cabVN
DMSO KSCN NaCl Urea pH EDTA
-0.1
-0.05
0
0.05
0.1
DMSO KSCN NaCl Urea pH EDTA
-0.1
-0.05
0
0.05
0.1
DMSO KSCN NaCl Urea pH EDTA
-0.1
-0.05
0
0.05
0.1
DMSO KSCN NaCl Urea pH EDTA
-0.1
-0.05
0
0.05
0.1
Fab57P-tmvpDYD
Fab57P-tmvpSAS
DMSO KSCN NaCl Urea pH EDTA
-0.1
-0.05
0
0.05
0.1
DMSO KSCN NaCl Urea pH EDTA
-0.1
-0.05
0
0.05
0.1
Figure 11. Chemical sensitivity fingerprints for dissociation rate fordifferent interactions (Fab57P: [III], cAb: [IV], huMYO:[Hämäläinen, 1999]). All fingerprints were derived from a QBKRwith log(kd) as y-variable. The y-scale in the graphs corresponds tochange of log(kd) due to change of a buffer additive concentrationfrom average level to high level. For example, for humanmyoglobin binding to monoclonal antibody 22:3 (huMYO – Ab22:3), increase of NaCl concentration from 350 mM to 550 mMwill increase log(kd) with 13%. Double bars represent replicatemeasurements.
Application 3: QSKR/QSARQuantitative structure-activity relationships (QSAR) are presented in papersIII, IV and V. In paper III and IV, the models are denoted quantitativesequence-kinetic relationships (QSKR) to emphasize two importantdifferences to common QSAR models: (i) the description of the structure ofthe molecules was based on amino acid sequence, not on 3D molecular

37
structure and (ii) the activity of the peptides was represented by kineticconstants (i.e. ka and kd) and affinity instead of only affinity. Paper V is acontinuation of paper IV. Here, the 3D structure of mutated antibodies wasused for structure description.
One of the simplest descriptions of a QSAR experiment is the four stepprocess outlined in the background section. The QSKR experimentspresented here (i.e. papers III and IV) included these steps in the followingorder.
� Selection of a set of molecules. In both cases (papers III and IV), thesequence of a polypeptide was modified. Two or three positions in thepolypeptide were mutated simultaneously. In order to achieve maximalspan in sequence space, the replacing amino acids were chosen tomaximize the spread of three tabulated amino acid properties:hydrophilicity (ZZ1), size (ZZ2) and electronic properties (ZZ3)[Hellberg, 1987]. The method used for designing the polypeptides isdescribed in Appendix B.
� Characterization of the activity of the molecules. Since the affinity KDis the ratio of dissociation rate kd to association rate ka, use of affinity asactivity measure will suffer from ambiguity. A change in affinity couldoriginate from changes in dissociation rate, association rate, or both.Therefore, the binding kinetics for the interaction with the targetmolecule was selected as activity measure in both paper III and IV. Thisresulted in separate models for association and dissociation rate.
� Mathematical description of the molecules. The same tabulated valuesof amino acid properties used during the design of the mutatedpolypeptides were used as description. In paper III, a fourth descriptor,helix forming tendency (HFT) [Deleage, 1987] was also included.
� Identification of a mathematical model that relates the description tothe characterization. The design of the polypeptides was statisticallysound, Therefore, the modeling part became simple. A linear modelprovided accurate predictions.
From a mathematical point of view, these two QSKR experiments closelyresemble the chemical sensitivity fingerprint experiments. In both cases, thestarting point was a molecular interaction between two biomolecules. In theQSKR case, a number of sequence modifications in one of the two bindingpartners was designed using mathematical tools. On the other hand, in orderto obtain a chemical sensitivity fingerprint, the environment where theinteraction took place was modified. In both cases, the modifications wereselected using multivariate experimental design to ensure that the set ofmodifications gave an even spread in sequential or environmental space.
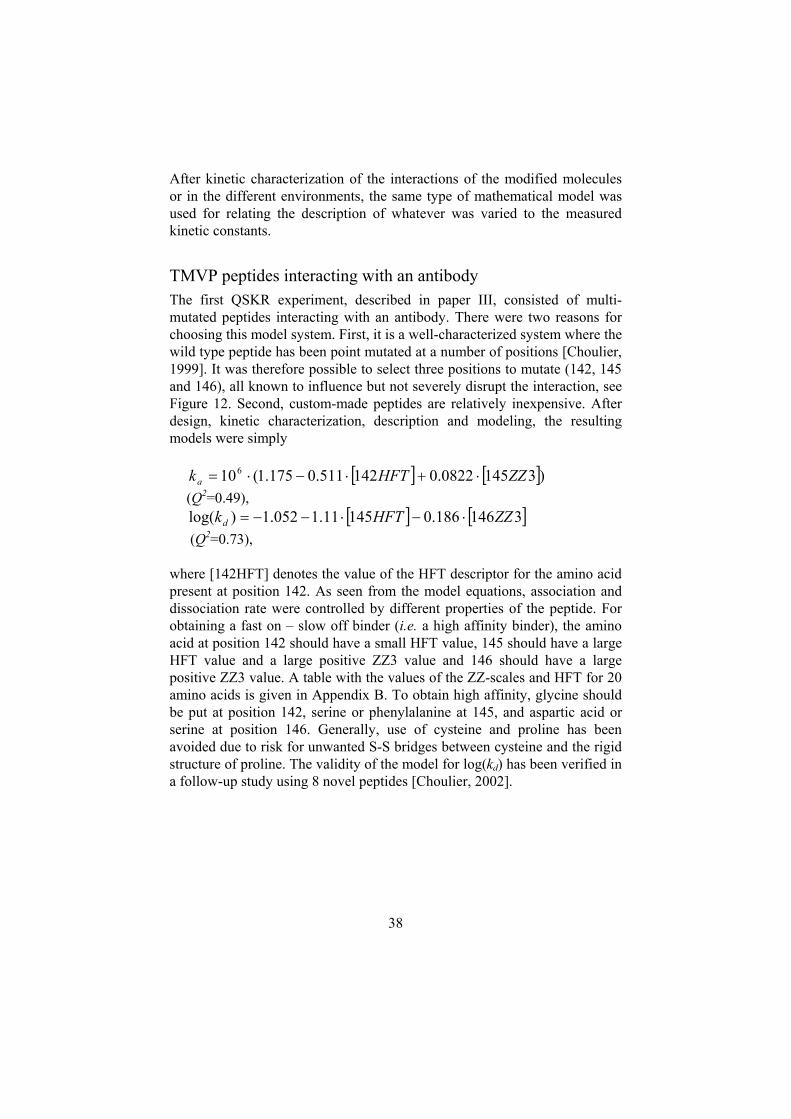
38
After kinetic characterization of the interactions of the modified moleculesor in the different environments, the same type of mathematical model wasused for relating the description of whatever was varied to the measuredkinetic constants.
TMVP peptides interacting with an antibodyThe first QSKR experiment, described in paper III, consisted of multi-mutated peptides interacting with an antibody. There were two reasons forchoosing this model system. First, it is a well-characterized system where thewild type peptide has been point mutated at a number of positions [Choulier,1999]. It was therefore possible to select three positions to mutate (142, 145and 146), all known to influence but not severely disrupt the interaction, seeFigure 12. Second, custom-made peptides are relatively inexpensive. Afterdesign, kinetic characterization, description and modeling, the resultingmodels were simply
� � � �)31450822.0142511.0175.1(106 ZZHFTka ������
(Q2=0.49),� � � �3146186.014511.1052.1)log( ZZHFTkd ������
(Q2=0.73),
where [142HFT] denotes the value of the HFT descriptor for the amino acidpresent at position 142. As seen from the model equations, association anddissociation rate were controlled by different properties of the peptide. Forobtaining a fast on – slow off binder (i.e. a high affinity binder), the aminoacid at position 142 should have a small HFT value, 145 should have a largeHFT value and a large positive ZZ3 value and 146 should have a largepositive ZZ3 value. A table with the values of the ZZ-scales and HFT for 20amino acids is given in Appendix B. To obtain high affinity, glycine shouldbe put at position 142, serine or phenylalanine at 145, and aspartic acid orserine at position 146. Generally, use of cysteine and proline has beenavoided due to risk for unwanted S-S bridges between cysteine and the rigidstructure of proline. The validity of the model for log(kd) has been verified ina follow-up study using 8 novel peptides [Choulier, 2002].
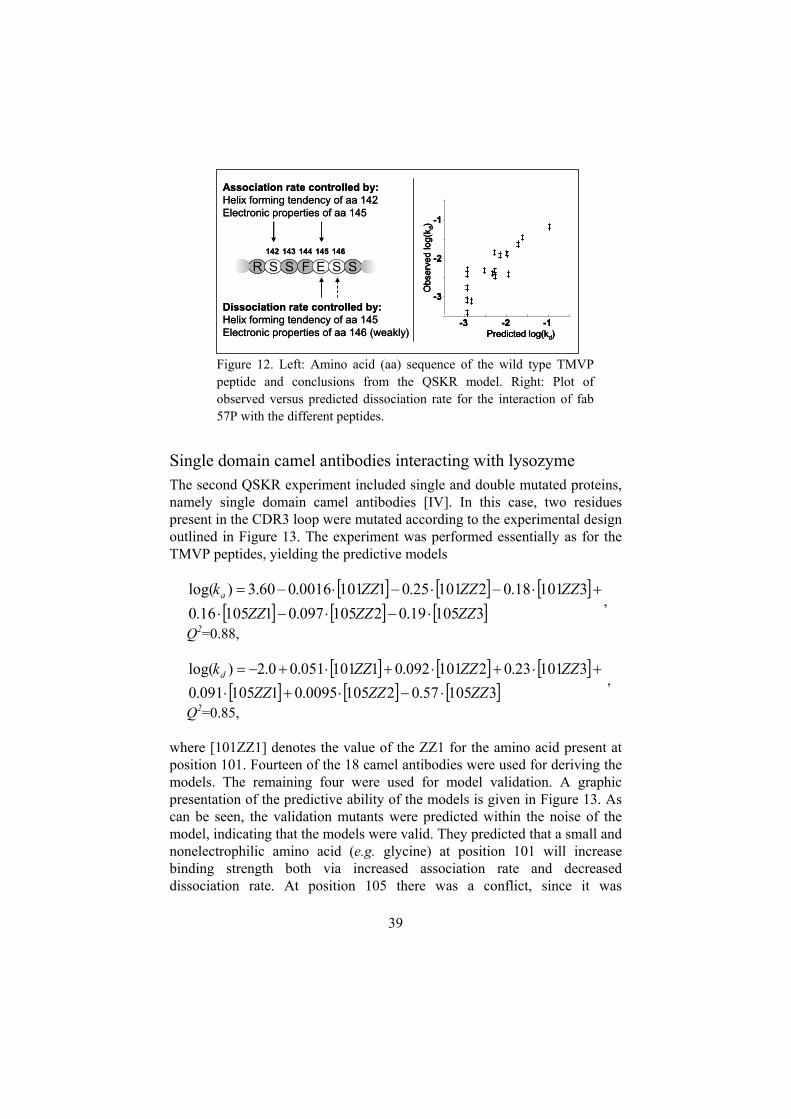
39
-3 -2 -1
-3
-2
-1
Obs
erve
d lo
g(k d
)
Predicted log(kd)
Dissociation rate controlled by:Helix forming tendency of aa 145Electronic properties of aa 146 (weakly)
Association rate controlled by:Helix forming tendency of aa 142Electronic properties of aa 145
R S S F E S S142 143 144 145 146
-3 -2 -1
-3
-2
-1
Obs
erve
d lo
g(k d
)
Predicted log(kd)-3 -2 -1
-3
-2
-1
Obs
erve
d lo
g(k d
)
Predicted log(kd)
Dissociation rate controlled by:Helix forming tendency of aa 145Electronic properties of aa 146 (weakly)
Association rate controlled by:Helix forming tendency of aa 142Electronic properties of aa 145
R S S F E S S142 143 144 145 146
Figure 12. Left: Amino acid (aa) sequence of the wild type TMVPpeptide and conclusions from the QSKR model. Right: Plot ofobserved versus predicted dissociation rate for the interaction of fab57P with the different peptides.
Single domain camel antibodies interacting with lysozymeThe second QSKR experiment included single and double mutated proteins,namely single domain camel antibodies [IV]. In this case, two residuespresent in the CDR3 loop were mutated according to the experimental designoutlined in Figure 13. The experiment was performed essentially as for theTMVP peptides, yielding the predictive models
� � � � � �
� � � � � �310519.02105097.0110516.0310118.0210125.011010016.060.3)log(
ZZZZZZZZZZZZka
�����
��������
,
Q2=0.88,
� � � � � �
� � � � � �310557.021050095.01105091.0310123.02101092.01101051.00.2)log(
ZZZZZZZZZZZZkd
�����
���������
,
Q2=0.85,
where [101ZZ1] denotes the value of the ZZ1 for the amino acid present atposition 101. Fourteen of the 18 camel antibodies were used for deriving themodels. The remaining four were used for model validation. A graphicpresentation of the predictive ability of the models is given in Figure 13. Ascan be seen, the validation mutants were predicted within the noise of themodel, indicating that the models were valid. They predicted that a small andnonelectrophilic amino acid (e.g. glycine) at position 101 will increasebinding strength both via increased association rate and decreaseddissociation rate. At position 105 there was a conflict, since it was
40
impossible to find an amino acid giving both high association rate and lowdissociation rate. If the highest possible affinity is required, the bestcompromise was predicted to be aspartic acid, serine, glycine or proline.
TS = THR@101, SER@105
Available mutants:TS TH TQ TA TG TPVN RT PG LS SQ HDQP MV TM SS PS TN
Obs
erve
d k d
(s-1
)
Predicted kd (s-1)
Obs
erve
d k a
(M-1
s-1 )
Predicted ka (M-1s-1)1000 10000 100000
1000
10000
100000
TM
SS
PS
TS(WT)
1E-4 1E-3 0.01 0.1
1E-4
1E-3
0.01
0.1
TM SS
PS
TS(WT)
Figure 13. Left: CDR3 loop structure (for the wild type antibodyTS) and list of mutant single domain camel antibodies available forthe study. Right: Plots of observed versus predicted kineticconstants. Mutants used for deriving model are depicted as circles,mutants used for validation as plus signs. The upper plot describespredictive ability for association rate and the lower plot predictiveability for dissociation rate.
In paper V, a completely different strategy for describing the mutated singledomain antibodies was tested in a 3D-QSAR analysis. Using themeasurements in paper IV and the 3D structure of the wild type camelantibody [Desmyter, 1996], a detailed 3D-QSAR model was derived.Estimated structures of the mutated antibodies were obtained by using acommercial molecular modeling software. The amino acids at positions 101and 105 in the wild-type antibody were replaced in silico according to themutation scheme. For each mutant, the software calculated the 3D structurewith lowest energy. These 3D structure estimates were then used fordeveloping a QSAR model. The spatial co-ordinates for backbone and side-chain for all amino acids in the CDR3 loop and the 3 ZZ-scales for each ofthe two mutated positions were used as structure description of the antibody.
This evaluation put new demands on the regression algorithm. In papersIII and IV, the number of experiments always exceeded the number of
41
coefficients in the model. This is a favorable situation for fitting a model todata, in particular when the experiments have been designed withmultivariate tools. When using the 3D structure as descriptor of the antibody,the number of coefficients in the model became large. In total, 90 descriptorswere used: 3 ZZ-scale values for each of the positions 101 and 105, plus 6co-ordinates ({x,y,z} backbone + {x,y,z} side-chain) for each of the 14 aminoacids in the CDR3 loop. Since the number of antibodies was smaller than thenumber of descriptors, PLS regression was used to fit the model to the data(see Appendix A).
At this point in time, the use of Q2 for validation of QSAR models wasquestioned [Golbraikh, 2002]. Therefore, blind cross validation [Ortiz,1995], was used in parallel with Q2 for model validation. Since the P2 valuesfor the models were high (~0.6), the models were considered valid.
Interestingly, co-ordinate changes for amino acids that were not mutatedcorrelated with changes in binding characteristics. Thus, if the 3D structureof a protein is available, not all positions in the binding site region need to bemutated to get information about how each position near the binding siteinfluences the interaction. The information on non-mutated amino acidmovements was not as detailed as the information available for the mutatedamino acids. However, enough information was obtained for detecting whichamino acids were contributing to the binding. These could be used forguidance of what residues to mutate in follow-up studies.
For both the TMVP peptides [Hämäläinen, 1999] and for the camelantibodies [IV], attempts were made at identifying a relationship between thesequence description and the chemical sensitivity fingerprints. Developingsuch a quantitative sequence-perturbation relationship (QSPR) turned to be adifficult task. Weak relationships between the amino acid sequence and thesensitivity to NaCl concentration were identified for both TMVP peptidesand camel antibodies. The QSPR models were obtained in two steps. First,chemical sensitivity fingerprints for all peptides or camel antibodies weregenerated. Next, a QSPR model relating the sequence descriptors (i.e. thevector of ZZ-scales) to the fingerprints was developed. This means that they-variables in the QSPR model were in fact coefficients in QBKR models. Itis possible that this two-step, or hierarchical, regression complicates themodelling step. An alternative modelling strategy would be to include bothstructure descriptors and environmental descriptors in a single model.

42
Summary of key contributions
The work described in this thesis aims at providing a bioinformaticmethodology capable of giving useful descriptions and accurate predictionsof biomolecular interactions. The bio-chemometric approach was definedand used for this purpose. The scientific objectives were addressed in thefollowing manner:
� The bio-chemometric approach can be used for characterization ofbiomolecular interactions. It consists of the concept of chemicalsensitivity fingerprints and sequence-kinetic relationship models. Thechemical sensitivity fingerprint is a novel, useful, and reproducibledescription of interactions. Furthermore, the quantitative sequence-kineticrelationship (QSKR) models provide a useful description of howstructural features influence the binding characteristics.
� The bio-chemometric approach is useful for obtaining results withpredictive capabilities. As shown by the quantitative buffer-kineticrelationship (QBKR) and QSKR studies for both proteins and peptides, itis clearly possible to use experiments performed according to theapproach for predictions of binding kinetics. In addition, the use ofkinetic constants as activity measures in a QSKR or QSAR experimenthas never been reported previously. It has the potential to simplify theinterpretation of QSAR models.
� The use of the bio-chemometric approach is not yet standardized. Duringthe development of the chemical sensitivity fingerprint, more efforts havebeen put on improving the fingerprint as such rather than on keeping thebuffer additives and their ranges fixed.
The bio-chemometric approach presented here is general and can be used inmany biochemical investigations. The RO protocol, the chemical sensitivityfingerprint and QSKR are all original concepts presented for the first time inpapers I-V.

43
Discussion
Benefits of the bio-chemometric approachWhy should one bother to perform experiments according to the bio-chemometric approach? There are at least three reasons.
� Experimental control. Common practice today is to repeat theexperiment a number of times to test if the results are reproducible. Abetter but slightly more labor intense method to obtain experimentalcontrol is to apply the bio-chemometric approach. Information on howrobust the results are can be obtained by repeating the experiment indifferent environments or with different molecules. Such information canprevent erroneous conclusions and conflicting results originating frompoor control of reagents and analytical equipment.
� Useful information. As shown by the generation of unique, reproduciblechemical sensitivity fingerprints, the bio-chemometric approach canconstitute a useful description of an interaction. The comparison offingerprints shows that similar peptides binding to a Fab often havedifferent fingerprints. This indicates that the fingerprint can provideinformation on minor changes in peptide properties that can not be seenin the binding characteristics.
� Predictions and optimization. Experiments performed according to thebio-chemometric approach have a detailed description as their primarygoal, but they qualify for prediction and optimization purposes as well.Predictions of binding kinetics in novel chemical environments couldsupport extrapolations of results obtained in one artificial laboratoryenvironment to conditions where the interaction actually takes place i.e.in a cell. Today, the validity of such extrapolations is often taken forgranted. That is risky, because as shown in figure 11, interactions canhave large differences in the sensitivity to changes in environment.Predictions of which molecular structure gives a particular bindingkinetics can also be beneficial for the development of drugs anddiagnostic reagents.
44
Biochemists are often reluctant to use mixtures of chemicals for perturbing abiochemical system. This is sad, since the use of chemometric tools can leadto considerable savings and help to elucidate the many factors that contributeto biochemical processes. If a process, like a biomolecular interaction, issubjected to analysis, it is advantageous to investigate all the factors that caninfluence it simultaneously. The cocktail approach for regenerationoptimization, the chemical sensitivity fingerprints for environmentalsensitivity, and the multivariate mutation strategy for QSAR all stem fromthe bio-chemometric approach. They have been shown to give useful,important information about the analyzed interactions. It seems likely thatthe bio-chemometric approach will also give greater experimental controland increased information content when applied to other commonexperiments within biochemistry.
QBKR and chemical sensitivity fingerprintsThe chemical sensitivity fingerprints may contain information on bindingsite composition. The fingerprints obtained for two sets of similar binders(18 TMVP peptides in paper III and 18 camel antibodies in paper IV) werereliably measured and the changes in the fingerprints could not be correlatedto affinity or kinetic constants. The attempts to find a relationship betweensequence and chemical sensitivity fingerprint were successful in a few cases[IV; Hämäläinen, 1999]. They constitute a first step towards exploringchemical sensitivity fingerprints as indicators of the molecular properties ofbinding sites. In a follow-up study to paper III, a comparison of thefingerprints from 26 similar TMVP peptides showed that one peptide wasclearly more sensitive to changes in pH than the others. This deviatingpeptide had one extra histidine in the binding site with a pKa within therange of buffer variations [Choulier, 2002]. Thus, the chemical sensitivityfingerprint was able to accurately detect a specific change in the binding site.In summary, the results presented in this thesis indicate that the chemicalsensitivity fingerprints contain new information on binding site composition.
QSKR and QSARThe benefit of using kinetic constants as activity measure in QSKR/QSARmodeling is a major finding of this thesis work. The finding is not related toperturbations or chemometrics. Kinetic constants are unambiguous activitymeasures.

45
Affinity (binding strength) is frequently reported as characteristic forbiomolecular interactions and used as activity measure in QSAR studies.However, since affinity KD is dependant on both association and dissociationrates (KD=kd/ka), it is an ambiguous entity. Within this work, separateQSKR/QSAR models for association and dissociation rates were developedfor the TMVP peptides and the camel antibodies. In both cases, differentmolecular properties controlled association rate and dissociation rate. Thisindicates that molecular recognition (i.e. association rate) and complexstability (i.e. dissociation rate) are two different mechanisms that can becontrolled separately. It is likely that it would be generally beneficial to usetwo models in QSAR experiments, one for association rate and one fordissociation rate. This would be an advantage also when the goal is highaffinity, because simultaneous increase of association rate and decrease ofdissociation rate will give high affinity (as indicated by decreasing KDvalue).
The QSKR models developed in this thesis have shown that (i) withrelatively modest experimental resources, it is possible to obtain a smalllibrary of peptides/proteins suitable for QSKR analysis, (ii) the modelsprovide detailed information on how different residues contribute to thebiomolecular interaction, and (iii) the models can have predictive abilities.The designed set of camel antibody mutants [IV] included antibodies withboth higher and lower association and dissociation rates than the wild type.Thus, there is a good probability that the model can predict which changes inthe sequence of the wild type antibody will lead to a higher affinity forlysozyme. Models with such capabilities would be helpful when workingwith affinity-matured peptides or antibodies (e.g. obtained in a panningprocess). It is common that the affinity-matured binders do not have thedesired binding kinetics or high enough affinity to the target. In such cases, aQSKR study would result in a prediction of how the peptide or antibodyshould be modified in order to get the desired binding kinetics or higheraffinity.
This thesis has shown that it is possible to extend a sequence descriptionof a protein into a 3D description for subsequent use in 3D-QSAR [V].Information was obtained about which amino acids remote from thepositions of mutagenesis that should be altered in order to change associationor dissociation rate. If this extension proves to be generally applicable, it willhave a major impact on the degree of information that can be extracted froma limited set of experiments. Given the 3D structure of a biomolecularcomplex and a series of mutants of one binding partner (or possibly both),work presented here shows that important information on how the differentresidues influence the interaction can be obtained. The amino acids

46
identified as important for modulating the interaction can then be mutatedfor obtaining a higher resolution QSKR or 3D-QSAR model.
Future perspectives
StandardizationIn retrospective QSAR studies, where data from different studies are used,authors have commented on the large variability of results obtained for thesame compounds [Moss, 2002; Cheng, 2001]. The reliability whencommunicating results on biomolecular interactions would be improved ifthere was a standardized way of performing and reporting experiments. Sucha standardization could include a number of measurements in perturbedenvironments. The benefits of standardization would also include simplifiedcommunication and storage of results. Furthermore, collection of results indatabases would become straightforward. The question is where and when toinitiate such a standardization.
Use of the bio-chemometric approach in biosensor assaysIn a short-term perspective, standard operating procedures for experimentson biomolecular interactions will more often include some kind ofrobustness test. One possible way to perform a robustness test is to include afew environmental changes according to the bio-chemometric approach.This would increase awareness of the environmental sensitivity ofbiomolecular interactions and would make comparisons of results morereliable. For QSAR studies, the use of kinetics as activity estimate is likelyto increase as well as the use of multivariate selection of compounds. Theoccurrence of QSKR/QSAR studies on peptides is also likely to increase.
In a longer term perspective, two distinct developments can be expected.First, there will be a trend towards standardization of biochemicalcharacterizations, mainly driven by the desire to communicate resultsthrough public databases. Second, chemical sensitivity fingerprints will becollected in an attempt to correlate them with the chemical composition ofthe binding site. Given such correlations, the fingerprint could predictbinding site composition for untested interactions which would be indeedbeneficial when combined with 3D structures of binding sites.
47
Possible use beyond biosensor assaysApplying the bio-chemometric approach in experiments on e.g. enzymaticactivity would be very interesting. In this way, useful information could beobtained by analyzing enzyme function in novel chemical environments,similar to in a QBKR experiment. First, the fingerprint could revealfunctional aspects not apparent in classical experiments, e.g. how catalysis isdependant on environment. Second, since many enzymes are in fact used forapplied purposes where the buffer need not mimic physiological conditions,an environmental optimization may improve performance significantly.
Considerable resources have been put on the prediction of proteinfunction from protein structure, and on protein structure from gene sequence[Fradera, 2004; Schafferhans, 2001; Baker, 2001]. Although the methodshave improved, the predictions are still limited to qualitative statements.Refinement of such predictive methods would most likely gain from accessto accurate and detailed functional characterization of a set of similarproteins, like QSKR and QBKR experiments for biomolecular interactions.As shown in paper V, merging structural and functional data is clearlyfeasible and can give novel insight into which residues are important for theinteraction.
During cancer therapy, ionizing radiation and toxic drugs are frequentlyused to stop the cancer cells from dividing. Combination of differenttherapies for cancer patients is common in the clinic today. However, theclinical protocols have mainly been obtained empirically [Zoli, 2001].Furthermore, non-additive effects on cell-line growth of combined use ofdrugs and radiation have been reported [Sundberg, 2003]. However, thereseem to be a lack of systematic research on efficient drug cocktails forcancer therapy. In analogy with the ideas behind the RO protocol, a cocktailof drugs could simultaneously affect many different parameters influencingcell division. Using the bio-chemometric approach in the search for effectivecombination therapies would therefore be beneficial, both due to the detaileddescription obtained and to the predictive abilities.
To summarize, methods for both description and prediction of biochemicalprocesses have been developed and tested for characterization ofbiomolecular interactions. The chemical sensitivity fingerprint proved to bea useful description of biomolecular interactions. Predictive models forbinding kinetics have been developed for both buffer and structuralvariations. The successful application of the bio-chemometric approach forcharacterizing biomolecular interactions suggests that the approach will alsobe valuable in many other areas of biochemistry.

48
Acknowledgements
The work presented in this thesis was performed at Biacore AB (Uppsala,Sweden) (1997-2001) and at the unit of Biomedical Radiation Sciences atUppsala University with financial support from the Linnaeus Centre forBioinformatics (2001-2004). Many people have been supportive during theyears required to finish this work. I would in particular like to express myappreciation to:
� Markku Hämäläinen, my mentor, colleague, and friend, for once upon atime accepting me as your apprentice and generously sharing ideas andperspectives on all experiments (ranging from medicinal chemistry toreal-estate construction) we have been involved in;
� Magnus Malmqvist, for always using your solid knowledge in appliedbiochemistry to put ideas in a sound context;
� Mats Gustafsson, for fruitful and vivid discussions on the academic andmathematical sides of my projects;
� Jörgen Carlsson, for letting me join your group at Uppsala University;� Marc van Regenmortel, for your genuine and active support of my
projects;� My colleague and friend Laurence Choulier for your commitment to our
TMVP project and your hospitality during my stays in Strasbourg;� All my coauthors;� My colleagues at Biacore AB, in particular all members of the former
BIAtechnology and present Systems department, for creating the joyfuland inspiring environment in the R&D laboratory;
� My colleagues at the unit of Biomedical Radiation Sciences, for yourendurance when I attack you with strange questions and for all the fungoing on at the department;
� Family and friends, for always being there, and;� Carolina, for invaluable help with proofreading and for making life worth
living. I love you!
49
Appendix A: Robust regression
In linear regression, the goal is to find a linear model
y=b0 + b1x1 + b2x2 + b3x3 + ... + bnxn + e ,
that relates the descriptors x = [x1 x2 x3 ... xn ]T to the correspondingobservations or measurements y. The coefficients bi are obtained byminimizing the 2-norm of the residual error e. In a matrix form, assumingthat several measurements have been made for each set of descriptors andthat the mean of each column in Y and X is zero, the linear relationship canbe written
Y=XB + E .
Here, the matrix Y contains the measurements, X contains the descriptors, Bcontains coefficients and E is the residual error.
Since the linear regression algorithms minimize the 2-norm of E, B ischosen so that XB becomes the best approximation of Y. A common specialcase is when only one measurement has been performed, i.e. Y is no longer amatrix but a vector denoted y. The coefficients B and the errors E becomevectors as well,
y = Xb + e . A1
This appendix will limit the discussion to the case described in Equation A1,i.e. a vector y having average zero and a matrix X for which each column hasaverage zero. The columns of X represent different descriptors of theexperimental system, the rows of X represent each experiment, and theelements in the column vector y represent the measured value for thecorresponding experiment in X.
There are two cases that are handled differently when solving EquationA1 for b and e. The simple case is when X has more rows than columns andhas full rank, i.e. the variation of the descriptors are independent. Thenumber of coefficients in the vector b is then less than the number of
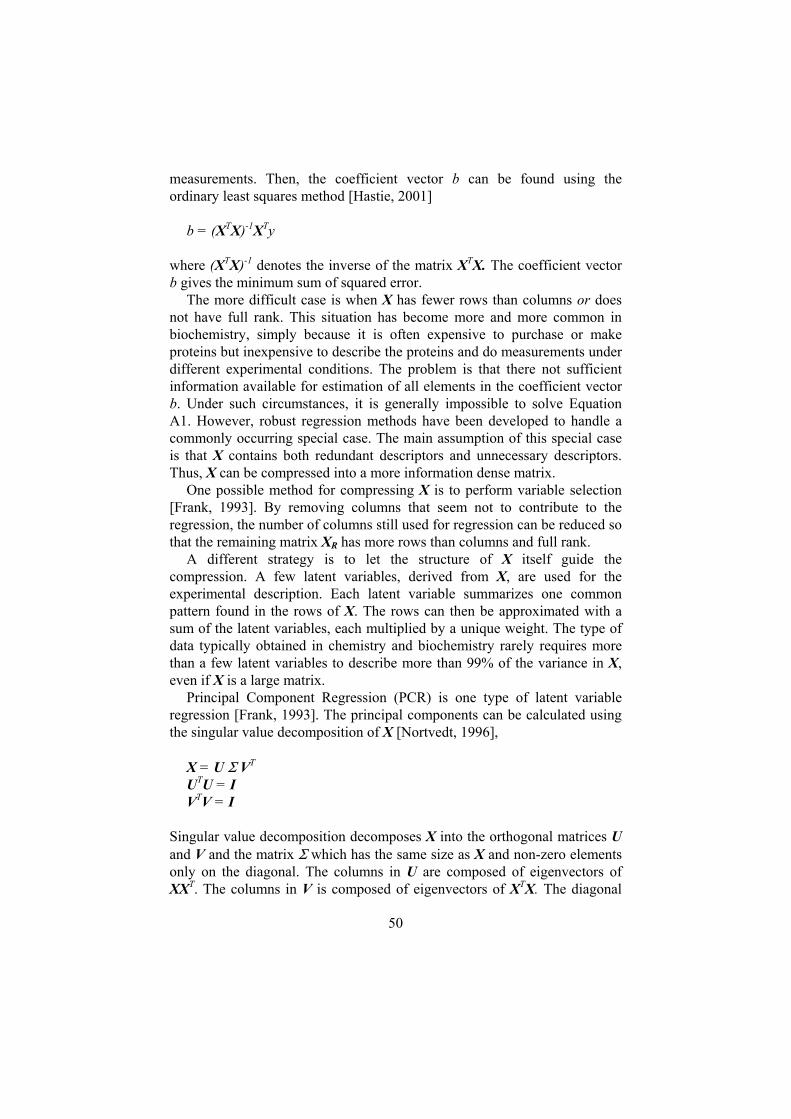
50
measurements. Then, the coefficient vector b can be found using theordinary least squares method [Hastie, 2001]
b = (XTX)-1XTy
where (XTX)-1 denotes the inverse of the matrix XTX. The coefficient vectorb gives the minimum sum of squared error.
The more difficult case is when X has fewer rows than columns or doesnot have full rank. This situation has become more and more common inbiochemistry, simply because it is often expensive to purchase or makeproteins but inexpensive to describe the proteins and do measurements underdifferent experimental conditions. The problem is that there not sufficientinformation available for estimation of all elements in the coefficient vectorb. Under such circumstances, it is generally impossible to solve EquationA1. However, robust regression methods have been developed to handle acommonly occurring special case. The main assumption of this special caseis that X contains both redundant descriptors and unnecessary descriptors.Thus, X can be compressed into a more information dense matrix.
One possible method for compressing X is to perform variable selection[Frank, 1993]. By removing columns that seem not to contribute to theregression, the number of columns still used for regression can be reduced sothat the remaining matrix XR has more rows than columns and full rank.
A different strategy is to let the structure of X itself guide thecompression. A few latent variables, derived from X, are used for theexperimental description. Each latent variable summarizes one commonpattern found in the rows of X. The rows can then be approximated with asum of the latent variables, each multiplied by a unique weight. The type ofdata typically obtained in chemistry and biochemistry rarely requires morethan a few latent variables to describe more than 99% of the variance in X,even if X is a large matrix.
Principal Component Regression (PCR) is one type of latent variableregression [Frank, 1993]. The principal components can be calculated usingthe singular value decomposition of X [Nortvedt, 1996],
X = U � VT
UTU = IVTV = I
Singular value decomposition decomposes X into the orthogonal matrices Uand V and the matrix � which has the same size as X and non-zero elementsonly on the diagonal. The columns in U are composed of eigenvectors ofXXT. The columns in V is composed of eigenvectors of XTX. The diagonal

51
elements in � are the square roots of the eigenvalues of XXT sorted indescending order. Thus, the decomposition of X can be expressed as:
X = U(:,1)�(1,1)V(:,1)T + U(:,2)�(2,2)V(:,2)T +...... +U(:,m)�(m,m)V(:,m)T , A2
where m is the number of rows in X, U(:,1) is the first column in U, U(:,2)is the second column U etc. Each term in A2 is a matrix of the same size asX. The matrices U and V are orthogonal so the magnitude of each term isdictated by the corresponding diagonal element �(i,i) in �. Since thedecomposition is sorted (�(i,i) ��(k,k), i<k) the first term in A2 willreconstitute most of X and the last term will reconstitute least. The columnsof V can be used as latent variables. In the first term in the sum, U(:,1) has asmany rows as there are experiments and V(:,1) has as many rows as there aredescriptors. �(1,1)U(:,1) is often called the score vector of the first principalcomponent, V(:,1)T is denoted the loading vector of the first principalcomponent. By using the scores as new descriptors of the experiment and theloadings for explaining what combination of old descriptors the scoresrepresent, a compressed version of X is obtained. The degree of compressioncan be controlled by deciding how many principal components to keep:
y = V(:,1:k) * bPCR + e , A3
where V(:,1:k) is a matrix consisting of the first k columns of V, and bPCR isthe coefficient vector. If k is less than the number of experiments, EquationA3 is well-posed and can be solved using ordinary least squares.
Another method based on latent variables is Partial Least Squares (PLS)regression [Geladi, 1986; Frank, 1993; Gustafson, 2001]. PLS regressiondiffers from PCR in that the latent variables are selected for obtaining goodprediction of y and not for obtaining a good description of X. The rational isthat the main variations in X may not have anything to do with theexperimental observations in y. Therefore, the latent variables are defined toreflect both the structure in X and the correlation of the latent variables withy. One method for obtaining the latent variables in PLS is the NIPALSalgorithm [Frank, 1993]. Using this algorithm, the first latent variable isobtained according to the following.
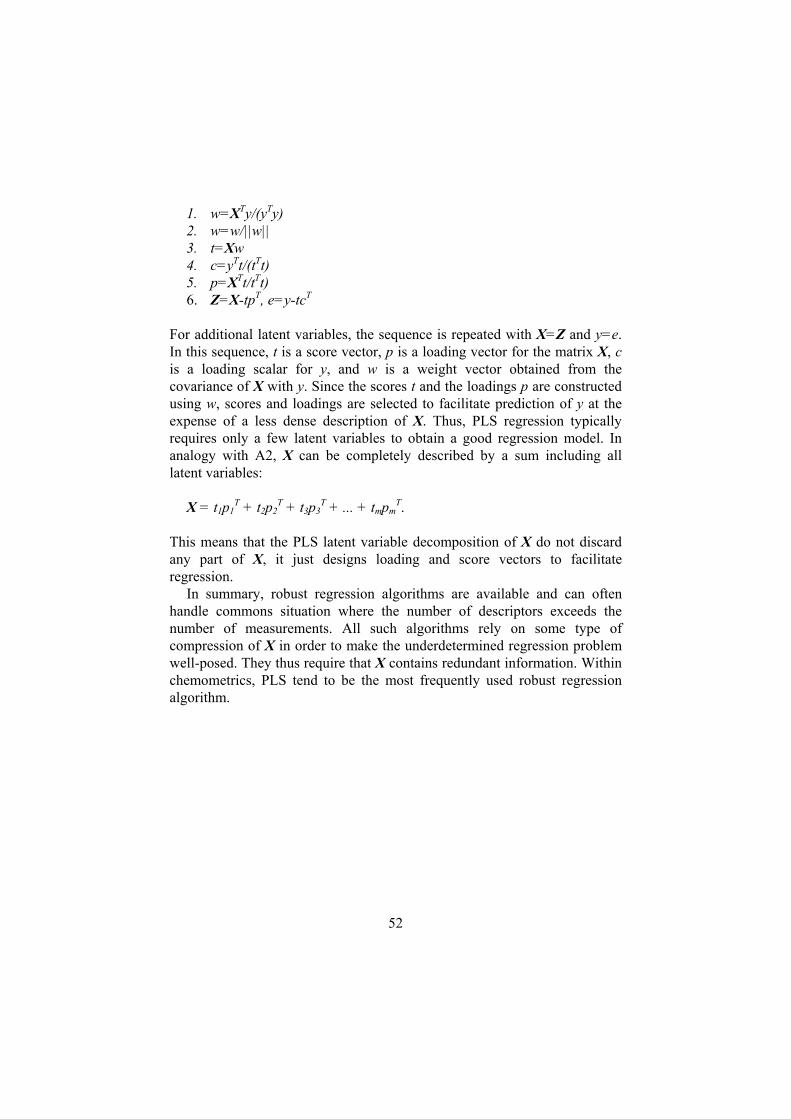
52
1. w=XTy/(yTy)2. w=w/||w||3. t=Xw4. c=yTt/(tTt)5. p=XTt/tTt)6. Z=X-tpT, e=y-tcT
For additional latent variables, the sequence is repeated with X=Z and y=e.In this sequence, t is a score vector, p is a loading vector for the matrix X, cis a loading scalar for y, and w is a weight vector obtained from thecovariance of X with y. Since the scores t and the loadings p are constructedusing w, scores and loadings are selected to facilitate prediction of y at theexpense of a less dense description of X. Thus, PLS regression typicallyrequires only a few latent variables to obtain a good regression model. Inanalogy with A2, X can be completely described by a sum including alllatent variables:
X = t1p1T + t2p2
T + t3p3T + ... + tmpm
T.
This means that the PLS latent variable decomposition of X do not discardany part of X, it just designs loading and score vectors to facilitateregression.
In summary, robust regression algorithms are available and can oftenhandle commons situation where the number of descriptors exceeds thenumber of measurements. All such algorithms rely on some type ofcompression of X in order to make the underdetermined regression problemwell-posed. They thus require that X contains redundant information. Withinchemometrics, PLS tend to be the most frequently used robust regressionalgorithm.
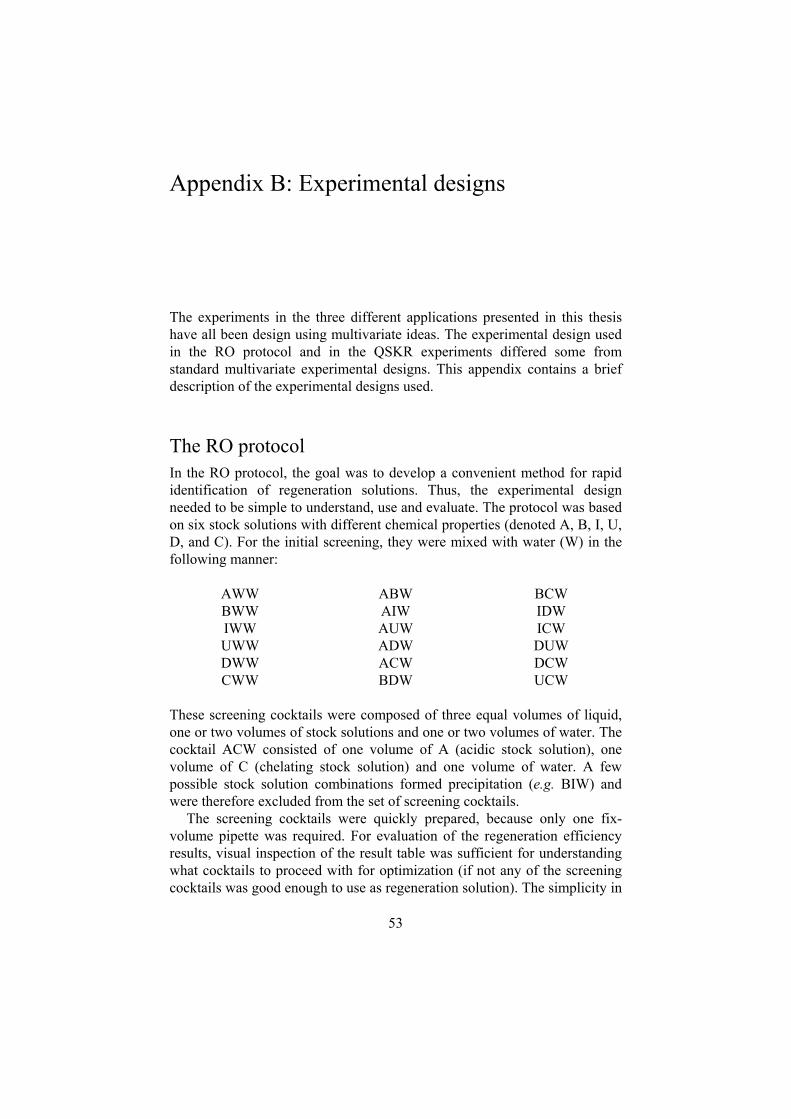
53
Appendix B: Experimental designs
The experiments in the three different applications presented in this thesishave all been design using multivariate ideas. The experimental design usedin the RO protocol and in the QSKR experiments differed some fromstandard multivariate experimental designs. This appendix contains a briefdescription of the experimental designs used.
The RO protocolIn the RO protocol, the goal was to develop a convenient method for rapididentification of regeneration solutions. Thus, the experimental designneeded to be simple to understand, use and evaluate. The protocol was basedon six stock solutions with different chemical properties (denoted A, B, I, U,D, and C). For the initial screening, they were mixed with water (W) in thefollowing manner:
AWWBWWIWWUWWDWWCWW
ABWAIWAUWADWACWBDW
BCWIDWICWDUWDCWUCW
These screening cocktails were composed of three equal volumes of liquid,one or two volumes of stock solutions and one or two volumes of water. Thecocktail ACW consisted of one volume of A (acidic stock solution), onevolume of C (chelating stock solution) and one volume of water. A fewpossible stock solution combinations formed precipitation (e.g. BIW) andwere therefore excluded from the set of screening cocktails.
The screening cocktails were quickly prepared, because only one fix-volume pipette was required. For evaluation of the regeneration efficiencyresults, visual inspection of the result table was sufficient for understandingwhat cocktails to proceed with for optimization (if not any of the screeningcocktails was good enough to use as regeneration solution). The simplicity in
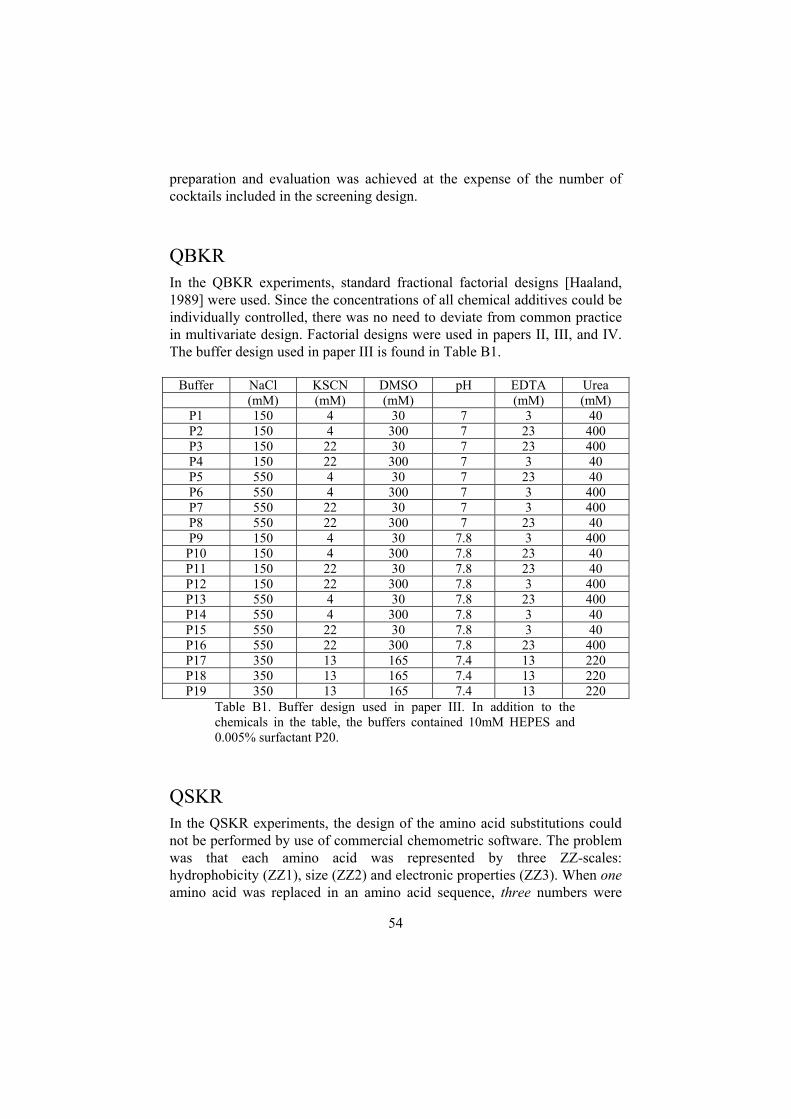
54
preparation and evaluation was achieved at the expense of the number ofcocktails included in the screening design.
QBKRIn the QBKR experiments, standard fractional factorial designs [Haaland,1989] were used. Since the concentrations of all chemical additives could beindividually controlled, there was no need to deviate from common practicein multivariate design. Factorial designs were used in papers II, III, and IV.The buffer design used in paper III is found in Table B1.
Buffer NaCl KSCN DMSO pH EDTA Urea(mM) (mM) (mM) (mM) (mM)
P1 150 4 30 7 3 40P2 150 4 300 7 23 400P3 150 22 30 7 23 400P4 150 22 300 7 3 40P5 550 4 30 7 23 40P6 550 4 300 7 3 400P7 550 22 30 7 3 400P8 550 22 300 7 23 40P9 150 4 30 7.8 3 400P10 150 4 300 7.8 23 40P11 150 22 30 7.8 23 40P12 150 22 300 7.8 3 400P13 550 4 30 7.8 23 400P14 550 4 300 7.8 3 40P15 550 22 30 7.8 3 40P16 550 22 300 7.8 23 400P17 350 13 165 7.4 13 220P18 350 13 165 7.4 13 220P19 350 13 165 7.4 13 220
Table B1. Buffer design used in paper III. In addition to thechemicals in the table, the buffers contained 10mM HEPES and0.005% surfactant P20.
QSKRIn the QSKR experiments, the design of the amino acid substitutions couldnot be performed by use of commercial chemometric software. The problemwas that each amino acid was represented by three ZZ-scales:hydrophobicity (ZZ1), size (ZZ2) and electronic properties (ZZ3). When oneamino acid was replaced in an amino acid sequence, three numbers were

55
changed in the descriptor matrix as shown in Figure B1. The ZZ-scale valuesfor all amino acids are found in table B2.
POS1 POS1 POS1 POS2 POS2 POS2ZZ1 ZZ2 ZZ3 ZZ1 ZZ2 ZZ3
RT 3.52 2.5 -3.5 0.75 -2.18 -1.12HQ 2.47 1.95 0.26 1.75 0.5 -1.44RA 3.52 2.5 -3.5 0.24 -2.32 0.6
RT 3.52 2.5 -3.5 0.75 -2.18 -1.12HQ 2.47 1.95 0.26 1.75 0.5 -1.44RE 3.52 2.5 -3.5 3.11 0.26 -0.11
Figure B1. Illustration of how one amino acid replacement causeschanges in three positions in the descriptor matrix. Given apolypeptide with mutations at two positions, the sequence can bedescribed using three ZZ-scale values for each mutated position.When comparing the rows corresponding to the amino acidsequences arginine – alanine (RA) with arginine – glutamic acid(RE), three ZZ-scale values differ.
Therefore, the design of the amino acid replacements was constructed “byhand”. To start with, the descriptor matrix for a set of randomly selectedamino acid replacements was created, and the condition number of thematrix was calculated. The condition number is a measure of the degree oflinear dependency between the rows (or columns) in a matrix. An orthogonalmatrix has condition number 1 and if the condition number of the descriptionmatrix is low (around 5 or less), the design is acceptable [III]. The initialrandom set of amino acid replacements was iteratively improved bymanually changing the amino acid replacement design, updating thedescriptor matrix, and calculating the condition number. When the conditionnumber was well below 5, the design was accepted.

56
Amino acid ZZ1 ZZ2 ZZ3 HFTA 0.24 -2.32 0.6 1.49R 3.52 2.5 -3.5 1.22N 3.05 1.62 1.04 0.77D 3.98 0.93 1.93 0.92C 0.84 -1.67 3.71 0.97Q 1.75 0.5 -1.44 1.16E 3.11 0.26 -0.11 1.5G 2.05 -4.06 0.36 0.51H 2.47 1.95 0.26 1.00I -3.89 -1.73 -1.71 1.00L -4.28 -1.3 -1.49 1.24K 2.29 0.89 -2.49 1.17M -2.85 -0.22 0.47 1.36F -4.22 1.94 1.06 1.2P -1.66 0.27 1.84 0.49S 2.39 -1.07 1.15 0.74T 0.75 -2.18 -1.12 0.79W -4.36 3.94 0.59 1.09Y -2.54 2.44 0.43 0.79V -2.59 -2.64 -1.54 0.99
Table B2. Amino acid property scales used in paper III. ZZ1, ZZ2,and ZZ3 were used during design of the peptides. Helix formingtendency was included during QSKR model derivation.
57
References
Andersson K., Areskoug D., Hardenborg E., Exploring buffer space for molecularinteractions, J. Mol. Recognit, 12(5):310-5, 1999
Andersson P., Multivariate methods in combinatorial chemistry, Thesis, UmeåUniversity, ISBN 91-7191-868-X, 2000
Baker D., Sali A., Protein structure prediction and structural genomics, Science,294(5540):93-6, 2001
Bieschke J., Giese A., Schulz-Schaeffer W., Zerr I., Poser S., Eigen M.,Kretzschmar H., Ultrasensitive detection of pathological prion proteinaggregates by dual-color scanning for intensely fluorescent targets. PNAS,97(10):5468-73, 2000
Blondine L., Sapountzi V., Maciver S. K., Lagarrigue E., Benyamin Y., Roustan C.,A structural basis for the pH dependence of cofilin F-actin interactions, Eur. J.Biochem, 269:4194-4201, 2002
Brigham-Burke M., O’Shannesy D. J., Micro-scale method employing surfaceplasmon resonance detection for the determination of conditions forimmunoaffinity chromatography of proteins, Chromatographia 35(2):45-49,1993
Brooke J. S., Cha J-H., Eidels L., Diphtheria toxin: Receptor interaction:Association, dissociation and effect of pH, Biochemical and biophysicalresearch communications, 248:297-302, 1998
Camacho A., Korn K., Damond M., Cajot J. F., Litborn E., Liao B., Thyberg P.,Winter H., Honegger A., Gardellin P., Rigler R., Direct quantification of mRNAexpression levels using single molecule detection, J. Biotechnol, 107(2):107-14,2004
Chatellier J., Rauffer-Bruyère N., Van Regenmortel M.H.V., Altschuh D. Weiss E.,Comparative interaction kinetics of two recombinant Fabs and of thecorresponding antibodies directed to the coat protein of tobacco mosaic virus, J.Mol. Recogn, 9:39-51, 1996
Cheng A., Diller D. J., Dixon S. L., Egan W. L., Lauri G., Merz Jr K. M.,Computation of the physio-chemical properties and data mining of largemolecular collections, J. Comp. Chem, 23(1):172 – 183, 2001
Choulier L., Rauffer-Bruyere N., Ben Khalifa M., Martin F., Vernet T., Altschuh D.,Kinetic analysis of the effect on Fab binding of identical substitutions in apeptide and its parent protein, Biochemistry, 38(12):3530-7, 1999
Choulier L., Andersson K., Hämäläinen M. D., van Regenmortel M. H. V.,Malmqvist M., Altschuh D., QSAR studies applied to the prediction of antigen-antibody interaction kinetics as measured by BIACORE, Protein Eng,15(5):373-82, 2002
58
Cruciani G., Pastor M., Guba W., VolSurf: a new tool for the pharmacokineticoptimization of lead compounds, European Journal of Pharmaceutical Sciences11 Suppl. 2:S29-S39, 2000
Debnath A. K., Three-dimensitional quantitative structure-activity relationshipstudy on cycleic urean derivatives as HIV-1 protease inhibitors: application ofcomparative molecular field analysis, J. Med. Chem, 42:249-259, 1999
Deleage G., Roux B., An algorithm for protein secondary structure based on classprediction, Protein engineering 1:289-294, 1987
DeRisi J. L., Vishwanath R. I. ,Brown P. O., Exploring the metabolic and geneticcontrol of gene expression on a genomic scale, Science, 278:680-686, 1997
Desmyter A., Transue T. R., Ghahroudi M. A., Thi M-H. D., Poortmans F., HamersR. , Muyldermans S., Wyns L., Crystal structure of a camel single-domain VHantibody fragment in complex with lysozyme, Nature structural biology,3(9):803-811, 1996
Faiman G. A., Levy R., Anglister J., Horovitz A., Contribution of arginine residuesin the RP135 peptide derived from the V3 loop of gp120 to its interaction withthe Fv fragment of the 0.5� HIV-1 neutralizing antibody, JBC, 271(23):13829-13833, 1996
Fradera X., Mestres J., Guided docking approaches to structure-based design andscreening, Curr. Top. Med. Chem, 4(7):687-700, 2004
Frank I. E., Friedman J. H., A statistical view on some chemometric regression tools,Technometrics, 35(2):109-148, 1993
Geladi P., Kowalski B., Partial least-squares regression: A tutorial. Anal. Chim.Acta, 185:1–17, 1986
Gestwicki J. E., Cairo C. W., Mann D. A., Owen R. M., Kiessling L. L., Selectiveimmobilization of multivalent ligands for surface plasmon resonance andfluorescence microscopy, Anal. Biochem, 305:149-155, 2002
Golbraikh A., Tropsha A., Beware of Q2!, Journal of Molecular Graphics andModelling, 20:269-276, 2002
Gustafsson M. G., A probabilistic derivation of the partial least squares algorithm,J. Chem. Inf. Comput. Sci, 41:288-294, 2001
Haaland P. D., Experimental design in biotechnology, Marcel Dekker: New York,1989
Hansch C., Fujita T., - - analysis. A method for the correlation of biologicalactivity and chemical structure. J. Am. Chem. Soc, 86:1616-1626, 1964.
Hansch C., Hoekman D.,Leo A.,Weininger D.,Selassie C. D., Chem-Bioinformatics:Comparative QSAR at the interface between chemistry and biology, Chem. Rev,102:783-812, 2002
Hastie T., Tibshirani R., Friedman J., The elements of statistical learning, Springer-Verlag, New York, 2001
Haupts U., Rudiger M., Ashman S., Turconi S., Bingham R., Wharton C.,Hutchinson J., Carey C., Moore K. J., Pope A. J., Single-molecule detectiontechnologies in miniaturized high-throughput screening: fluorescence intensitydistribution analysis, J Biomol. Screen, 8(1):19-33, 2003
Hellberg S., Sjöström M., Skagerberg B., Wold S., Peptide quantitative structure-activity relationships, a multivariate approach, J. Med. Chem, 30:1126-1135,1987
Hämäläinen M. D., Andersson K., Roos H., Malmqvist M., Surface regeneration ofbiosensors, Patent number US6289286, 1999
Hämäläinen M. D., Personal communication, April 2004
59
Jonsson J., Norberg T., Carlsson L., Gustafsson C., Wold S., Quantitative sequence-activity models (QSAM)–tools for sequence design, Nucleic Acid Research,21(3):733-739, 1993
Jönsson U., Fägestam L., Ivarsson B., Johnsson B, Karlsson R., Lundh K., Löfås S.,Persson B., Roos H., Rönnberg I., Sjölander S., Stenberg E., Ståhlberg R.,Urbaniczky S., Östlin H., Malmqvist M., Real-time biospecific interactionanalysis using surface plasmon resonance and a sensor chip technology,BioTechniques, 11:620-627, 1991
Kubinyi H., Comparative Molecular Field Analysis (CoMFA), in: The Encyclopediaof Computational Chemistry, Vol. 1, Schleyer, P. v. R., Allinger, N. L., Clark,T., Gasteiger, J., Kollman, P. A., Schaefer III, H. F., and Schreiner, P. R., Eds.;John Wiley & Sons, Chichester, 1998, pp. 448-460
Linusson A., Gottfries J., Olsson T., Örnskov E., Folestad S., Nordén B., Wold S.,Statistical molecular design, parallel synthesis, and biological evaluation of alibrary of thrombin inhibitors, J. Med. Chem, 44:3424-3439, 2001
Lundstedt Torbjörn, The Willgerodt-Kindler reaction. A Multivariate Approach,Thesis, Umeå university, ISBN: 91-7174-248-4, 1986
Marengo E., Gennaro M.C., Gianotti V., Prenesti E., Optimization of the separationof mono- and dichloroanilines in ion interaction high-performance liquidchromatography, J Chromatogr A, 863(1):1-11, 1999
Markgren P-O, Schaal W., Hämäläinen M. D., Karlén A., Hallberg A., SamuelssonB., Danielsson U. H., Relationships between structure and interaction kineticsfor HIV-1 protease inhibitors, J Med Chem, 45(25):5430-5439, 2002
Mee R. P., Auton T. R., Morgan P. J., Design of active analogues of a 15-residuepeptide using a D-optimal design, QSAR and a combinatorial search algorithm,J. Peptide Research, 49:89-102, 1997
Moss G. P., Dearden J. C., Patel H., Cronin M. T. D., Quantitative structure–permeability relationships (QSPRs) for percutaneous absorption, Toxicology inVitro, 16(3):299-317, 2002
Nortvedt R., Brakstad F., Kvalheim O. M., Lundstedt T., Anvendelse av kjemometriinnen forskning og industri, ISBN 82-91294-01-1, 1996
Oda R. P., Madden B. J., Morris J. C., Spelsberg T. C., Landers, J. P., Multiple-buffer-additive strategies for enhanced capillary electrophoretic separation ofpeptides. Journal of Chromatography A, 680:341-351, 1994
Oritz A. R., Pisabarro M. T., Gago F., Wade R. C., Prediction of binding affinitiesby comparative binding energy analysis, J. Med. Chem,38:2681-2691, 1995
Pötter T., Matter H., Random or rational design? Evaluation of diverse compoundsubsets from chemical structure databases, J. Med. Chem, 41-478-488, 1998
Quackenbush J., Computational analysis of microarray data., Nat. Rev. Genet,2(6):418-27, 2001
Rich R. L., Myszka D. G., Survey of the year 2001 commercial optical biosensorliterature, J. Mol. Recognit, 15:352-376, 2002
Rich R. L., Myszka D. G., Spying on HIV with SPR, Trends in Microbiology,11(3):124-133, 2003
Schafferhans A., Klebe G., Docking ligands onto binding site representationsderived from proteins built by homology modeling, J. Mol. Biol. 307:407-427,2001
Sundberg A.L., Almqvist Y., Orlova A., Blomquist E., Jensen H. J., Gedda L.,Tolmachev V., Carlsson J., Combined effect of gefitinib ('Iressa', ZD1839) and

60
targeted radiotherapy with 211At-EGF, Eur. J. Nucl. Med. Mol. Imaging.30(10):1348-56, 2003
Taylor D. J., Wang Q., Bothner B., Natarajan P., Finn M. G., Johnson J.E.,Correlation of chemical reactivity of Nudaurelia capensis omega virus with apH-induced conformational change, Chem. Commun. (Camb), 22:2770-1, 2003
Tsang V., Wilkins P. P., Optimum dissociation condition for immunoaffinity andpreferential isolation of antibodies with high specific activity, Journal ofImmunological Methods, 138:291-299, 1991
Walhagen K.,Unger K. U.,Hearn M. T. W., Capillary electrochromatographyanalysis of hormonal cyclic and linear peptides, Anal. Chem, 73:4924-4936,2001
Weiniger D., SMILES, a chemical language and information system. 1. Introductionto methodology and encoding rules, J. Comp. Inf. Sci, 28:31-36, 1988
Wold S, Sjöström M., Use of principal components models for analysis of chemicaldata, European Fed. Chem. Engn, 4, 1973
Xie Z., Schendel S, Matsuyama S., Reed J.C., Acidic pH promotes dimerization ofBcl-2 family proteins, Biochemistry, 37:6410-6418, 1998
Zoli W, Ricotti L, Tesei A, Barzanti F, Amadori D., In vitro preclinical models for arational design of chemotherapy combinations in human tumors, Crit. Rev.Oncol. Hematol, 37(1):69-82, 2001

Acta Universitatis UpsaliensisComprehensive Summaries of Uppsala Dissertations
from the Faculty of MedicineEditor: The Dean of the Faculty of Medicine
Distribution:Uppsala University Library
Box 510, SE-751 20 Uppsala, Swedenwww.uu.se, [email protected]
ISSN 0282-7476ISBN 91-554-5999-4
A doctoral dissertation from the Faculty of Medicine, Uppsala University,is usually a summary of a number of papers. A few copies of the completedissertation are kept at major Swedish research libraries, while the sum-mary alone is distributed internationally through the series Comprehen-sive Summaries of Uppsala Dissertations from the Faculty of Medicine.(Prior to October, 1985, the series was published under the title “Abstracts ofUppsala Dissertations from the Faculty of Medicine”.)


![[Frontiers in Bioscience S3, 1363-1389, June 1, 2011 ... · [Frontiers in Bioscience S3, 1363-1389, June 1, 2011] 1363 Advances in homeopathy and immunology: a review of clinical](https://static.fdocuments.us/doc/165x107/5f7b6db8a1e23576bf17bdb4/frontiers-in-bioscience-s3-1363-1389-june-1-2011-frontiers-in-bioscience.jpg)