CHARACTERISTICS OF CHILDLESS UNEMPLOYED ADULT AND ...
49
Contract No.: 53-3198-6-017 MPR Reference No.: 8370-003 CHARACTERISTICS OF CHILDLESS UNEMPLOYED ADULT AND LEGAL IMMIGRANT FOOD STAMP PARTICIPANTS: FISCAL YEAR 1995 FEBRUARY 13, 1997 Authors: Mike Stavrianos Scott Cody Kimball Lewis Submitted to: Submitted by: U.S. Department of Agriculture Mathematica Policy Research, Inc. Food and Consumer Services 600 Maryland Avenue, SW 3101 Park Center Drive Suite 550 2nd Floor Washington, DC 20024-2512 Alexandria, VA 22302 (202) 484-9220 Project Officer: Project Director: Jenny Genser Carole Trippe
Transcript of CHARACTERISTICS OF CHILDLESS UNEMPLOYED ADULT AND ...

Contract No.: 53-3198-6-017MPR Reference No.: 8370-003
CHARACTERISTICS OF CHILDLESS UNEMPLOYED
ADULT AND LEGAL IMMIGRANT
FOOD STAMP PARTICIPANTS:FISCAL YEAR 1995
FEBRUARY 13, 1997
Authors:
Mike StavrianosScott Cody
Kimball Lewis
Submitted to: Submitted by:
U.S. Department of Agriculture Mathematica Policy Research, Inc.Food and Consumer Services 600 Maryland Avenue, SW3101 Park Center Drive Suite 5502nd Floor Washington, DC 20024-2512Alexandria, VA 22302 (202) 484-9220
Project Officer: Project Director:Jenny Genser Carole Trippe

iii
CONTENTS
Page
I INTRODUCTION . . . . . . . . . . . . . . . . . . . . . . . . . . . . . . . . . . . . . . . . . . . . . . . . . . . . . 1
II PROFILE OF ABLE-BODIED FOOD STAMP RECIPIENTS . . . . . . . . . . . . . . . . . 3
A. TIME LIMIT PROVISIONS . . . . . . . . . . . . . . . . . . . . . . . . . . . . . . . . . . . . . . . . . 3
B. IDENTIFYING PERSONS SUBJECT TO THE TIME LIMIT . . . . . . . . . . . . . . 4
C. CHARACTERISTICS OF ABLE-BODIED, NON-WORKING, CHILDLESS ADULTS . . . . . . . . . . . . . . . . . . . . . . . . . . . . . . . . . . . . . . . . . . . . . 7
1. Demographic Characteristics . . . . . . . . . . . . . . . . . . . . . . . . . . . . . . . . . . . . 72. Income Sources and Amounts . . . . . . . . . . . . . . . . . . . . . . . . . . . . . . . . . . . 123. Economic and Employment Characteristics . . . . . . . . . . . . . . . . . . . . . . . . 124. Work Registration Status/Participation in Employment and
Training Programs . . . . . . . . . . . . . . . . . . . . . . . . . . . . . . . . . . . . . . . . . . . . 165. Distribution by State . . . . . . . . . . . . . . . . . . . . . . . . . . . . . . . . . . . . . . . . . . 166. Number of Consecutive Months Receiving FSP Benefits . . . . . . . . . . . . . 19
III PROFILE OF PERMANENT RESIDENT ALIEN FOOD STAMP RECIPIENTS . . . . . . . . . . . . . . . . . . . . . . . . . . . . . . . . . . . . . . . . . . . . . . . . . . . . . . . . 23
A. ALIEN PROVISIONS . . . . . . . . . . . . . . . . . . . . . . . . . . . . . . . . . . . . . . . . . . . . . 24
B. DATA SOURCE . . . . . . . . . . . . . . . . . . . . . . . . . . . . . . . . . . . . . . . . . . . . . . . . . 26
C. THE NUMBER OF PERMANENT RESIDENT ALIENS AND THEIR UNITS . . . . . . . . . . . . . . . . . . . . . . . . . . . . . . . . . . . . . . . . . . . . . . . . . . . 28
D. CHARACTERISTICS OF PERMANENT RESIDENT ALIENS AND THEIR UNITS . . . . . . . . . . . . . . . . . . . . . . . . . . . . . . . . . . . . . . . . . . . . . . 37
1. Demographic Characteristics . . . . . . . . . . . . . . . . . . . . . . . . . . . . . . . . . . . 372. Unit Composition . . . . . . . . . . . . . . . . . . . . . . . . . . . . . . . . . . . . . . . . . . . . 373. Income Characteristics . . . . . . . . . . . . . . . . . . . . . . . . . . . . . . . . . . . . . . . . 41
v
TABLES
Page
II.1 PEOPLE WITH CHARACTERISTICS RELATED TO ABLE-BODIED STATUS . . . . . 8
II.2 AGE, UNIT SIZE, RACE/ETHNICITY, CITIZENSHIP STATUS AND EDUCATION LEVEL OF ALL FSP PARTICIPANTS, ADULT FSP PARTICIPANTS, AND ABLE-BODIED FSP PARTICIPANTS . . . . . . . . . . . . . . . . . . . . 9
II.3 DISTRIBUTION OF FSP ADULTS AND ABLE-BODIED ADULTS BY UNIT SIZE AND GENDER . . . . . . . . . . . . . . . . . . . . . . . . . . . . . . . . . . . . . . . . . . . . . 11
II.4 DISTRIBUTION OF FSP ADULTS AND ABLE-BODIED ADULTS BY EDUCATIONAL ATTAINMENT . . . . . . . . . . . . . . . . . . . . . . . . . . . . . . . . . . . . . . . . 11
II.5 INCOME SOURCE FOR ALL FSP PARTICIPANTS, ADULT FSP PARTICIPANTS AND ABLE-BODIED FSP PARTICIPANTS . . . . . . . . . . . . . . . . . . . . 13
II.6 INCOME, BENEFIT LEVEL, ASSETS, AND EMPLOYMENT STATUS OF ALL FSP PARTICIPANTS, ADULT PARTICIPANTS, AND ABLE-BODIED FSP PARTICIPANTS . . . . . . . . . . . . . . . . . . . . . . . . . . . . . . . . . . . . . . . . 14
II.7 WORK REGISTRATION STATUS OF ALL FSP PARTICIPANTS, ADULT FSP PARTICIPANTS, AND ABLE-BODIED FSP PARTICIPANTS . . . . . . . . 17
II.8 DISTRIBUTION OF ALL FSP PARTICIPANTS, ADULT FSP PARTICIPANTS, AND ABLE-BODIED FSP PARTICIPANTS, BY STATE . . . . . . . . . 18
II.9 GEOGRAPHIC LOCATION OF ALL FSP PARTICIPANTS, ADULT FSP PARTICIPANTS, AND ABLE-BODIED FSP PARTICIPANTS . . . . . . . . . . . . . . . . . . . 20
II.10 DISTRIBUTION OF FSP ADULTS AND ABLE-BODIED ADULTS BY NUMBER OF CONSECUTIVE MONTHS PARTICIPATING IN THE FOOD STAMP PROGRAM . . . . . . . . . . . . . . . . . . . . . . . . . . . . . . . . . . . . . . . . . . . . 21
III.1 DISTRIBUTION OF FSP PARTICIPANTS AND UNITS BY CITIZENSHIP STATUS . . . . . . . . . . . . . . . . . . . . . . . . . . . . . . . . . . . . . . . . . . . . . . . . . . . . . . . . . . . . . . . . 29
III.2 DISTRIBUTION OF BENEFITS TO FSP UNITS BY CITIZENSHIP STATUS . . . . . . . 30
III.3 DISTRIBUTION OF ALL ALIEN FSP PARTICIPANTS, UNITS BY STATE . . . . . . . . 32
III.4 DISTRIBUTION OF BENEFITS TO ALL ALIEN FSP UNITS BY STATE . . . . . . . . . . 33
TABLES (continued)
Page
vi
III.5 DISTRIBUTION OF PERMANENT RESIDENT ALIEN FSP PARTICIPANTS, UNITS BY STATE . . . . . . . . . . . . . . . . . . . . . . . . . . . . . . . . . . . . . . . . . . . . . . . . . . . . . . . . 34
III.6 DISTRIBUTION OF BENEFITS TO PERMANENT RESIDENT ALIEN UNITS BY STATE . . . . . . . . . . . . . . . . . . . . . . . . . . . . . . . . . . . . . . . . . . . . . . . . . . . . . . . . 35
III.7 AVERAGE BENEFITS AND CERTIFICATION PERIOD FOR UNITSWITH PERMANENT RESIDENT ALIENS FOR SELECTED STATES . . . . . . . . . . . . 36
III.8 DISTRIBUTION OF FSP PARTICIPANTS AND UNITS WITH PERMANENT RESIDENT ALIENS BY WHETHER THEY ARE NEW APPLICANTS, LENGTH OF CERTIFICATION PERIOD, AND MONTHS LEFT IN CERTIFICATION PERIOD . . . . . . . . . . . . . . . . . . . . . . . . . . . 38
III.9 AGE, GENDER AND RACE OF PERMANENT RESIDENT ALIEN FSP PARTICIPANTS . . . . . . . . . . . . . . . . . . . . . . . . . . . . . . . . . . . . . . . . . . . . . . . . . . . . . . 39
III.10 DISTRIBUTION OF PERMANENT RESIDENT ALIEN FSP UNITS BY WHETHER THE UNIT IS COMPOSED ENTIRELY OF PERMANENT RESIDENT ALIENS (“PURE”) OR A MIX OF PERMANENT RESIDENT ALIENS AND OTHERS (“MIXED”) . . . . . . . . . . . . . . . . . . 40
III.11 SIZE AND COMPOSITION OF FSP UNITS WITH PERMANENT RESIDENT ALIENS AND DISTRIBUTION OF PERMANENT RESIDENT ALIEN FSP PARTICIPANTS BY EDUCATION LEVEL AND EMPLOYMENT STATUS . . . . . . . . . . . . . . . . . . . . . . . . . . . . . . . . . . . . . . 42
III.12 AVERAGE MONTHLY INCOME CHARACTERISTICS OF FSP UNITS WITH PERMANENT RESIDENT ALIENS . . . . . . . . . . . . . . . . . . . . . . . . . . . . . 43
III.13 DISTRIBUTION OF PERMANENT ALIEN UNITS WITH INCOME FROM AFDC, INCOME FROM SSI, AND EARNED INCOME BY SELECTED STATES . . . . . . . . . . . . . . . . . . . . . . . . . . . . . . . . . . . . . . . . . . . . . . . . . . . . . . 45
III.14 DISTRIBUTION OF UNITS BY GROSS INCOME AS A PERCENT OF POVERTY FOR ALL UNITS AND UNITS WITH PERMANENT RESIDENT ALIENS . . . . . . . . . . . . . . . . . . . . . . . . . . . . . . . . . . . . . . . . . . . . . . . . . . . . . . 46
III.15 DISTRIBUTION OF UNITS BY VALUE OF UNIT ASSETS FOR ALL UNITS AND UNITS WITH PERMANENT RESIDENT ALIENS . . . . . . . . . . . . . 47

1
I. INTRODUCTION
The Personal Responsibility and Work Opportunity Reconciliation Act of 1996 (PRWORA) made
many changes to the Food Stamp Program (FSP). Of these changes, only two are expected to have a
significant effect on eligibility--the time limits on able-bodied, unemployed adults without children
and the restriction on participation by legal immigrants. This report provides a baseline snapshot of
FSP participants who may be affected by the work requirements and restrictions on benefits to legal
immigrants. It provides counts of individuals potentially affected by the reforms as well as detailed
descriptions of their demographic and economic characteristics. This report is a useful first step for
those interested in better understanding the circumstances of the populations affected by these
changes. It also provides a baseline for future comparisons.
The source of the data is the Fiscal Year 1995 Integrated Quality Control System sample, based
on a sample of FSP households. It is the most recent data that identifies able-bodied, childless adults
and legal immigrants and provides detailed information about their demographic and economic
characteristics.
It should be cautioned that the data do not contain all of the information needed to determine
whether an individual loses eligibility under the new law. The data are from fiscal year 1995 and do
not capture the substantial decline in overall food stamp participation since then. Furthermore, they
do not identify some of those exempted from the time limit or immigrant provisions. Thus, the figures
in the attached report somewhat overstate the number of people who lose eligibility under the new
law.

Participation in a job search program or job search training program does not count towards1
PRWORA’s 20 hour work requirement.
3
II. PROFILE OF ABLE-BODIED FOOD STAMP RECIPIENTS
With the passage of PRWORA, adults between the ages of 18 and 50 (inclusive) who are
childless, fit for employment, and neither working nor participating in a workfare program, can receive
food stamps for no more than three months in any 36 month period. This chapter is an extract from
a forthcoming report, commissioned by the U.S. Department of Agriculture’s Food and Consumer
Service, that will provide a profile of the population subject to this time limit. This chapter describes
the able-bodied provisions of the new law, then draws on FSP Quality Control data to describe the
size and characteristics of the population affected.
A. TIME LIMIT PROVISIONS
PRWORA states that no individual shall be eligible to participate in the FSP if, during the
preceding 36-month period, the individual received food stamps for three or more months
(consecutive or otherwise) during which the individual did not do one of the following: (1) work 20
or more hours per week (averaged monthly), (2) participate in a workfare program, or (3) participate
in a work program for 20 or more hours per week. 1
The act exempts from this provision any individual who is under age 18 or over age 50, medically
certified as physically or mentally unfit for employment, a pregnant woman, or a parent or other
member of a household with responsibility for a dependent child. The act further exempts any person
who is exempt from FSP work registration under subsection (d)(2) of 7 U.S.C. 2015. This includes
any person who is:
C responsible for the care of a dependent child under age 6 or an incapacitated person

Either under Title IV of the Social Security Act or under the federal-state unemployment2
compensation system.
4
C a student who meets FSP eligibility requirements
C a regular participant in a drug addiction or alcoholic treatment and rehabilitationprogram
C working at least 30 hours per week or earning at least 30 times the minimum wage, or
C subject to and complying with a work registration requirement under another program2
Finally, on a state’s request, the USDA may waive application of the new work requirement to
any group of individuals if the Secretary determines that the area where they reside has an
unemployment rate higher than 10 percent or does not have a sufficient number of jobs to provide
them employment.
An individual who loses eligibility under the work requirement of PRWORA can regain eligibility
by working or participating in a work program for 80 or more hours in a 30-day period or by
complying with a workfare program for 30 days. An individual who regains eligibility in this way
remains eligible as long as he or she continues to meet the 20-hour-per-week work requirement. If,
after regaining eligibility, an individual fails to meet the 20-hour work requirement, he or she remains
eligible for a consecutive three month period starting on the date the individual notifies the state
agency that he or she no longer meets the work requirement. An individual may only receive these
three additional months for a single three-month period in any 36-month period.
B. IDENTIFYING PERSONS SUBJECT TO THE TIME LIMIT
The estimates presented in this chapter are derived from a nationally representative sample of
food stamp households selected for review in fiscal year 1995 as part of the Integrated Quality Control

The IQCS is an ongoing review of food stamp household circumstances designed to determine,3
(1) if households are eligible to participate or are receiving the correct benefit amount, and (2) ifhousehold participation is correctly denied or terminated.
It is not clear who states will exempt as, “medically certified as physically or mentally unfit for4
employment.” In this analysis, a person is exempt only if he or she is disabled, defined as: (1) underage 65 and receiving SSI, or (2) between the ages of 18 and 61 and receiving Social Security, veteransbenefits, or other government benefits as a result of a disability.
5
System (IQCS). The Quality Control (QC) database, constructed from extracts of the IQCS, provides3
detailed information on the characteristics of food stamp participants. This information can be used
to identify which participants are subject to PRWORA’s time limit. A person on the QC database is
assumed to be subject to the time limit if he or she is able-bodied, not working, and has no children
(as defined below).
Able-Bodied. A person is considered able-bodied if he or she is between the ages of 18 and 50,
not disabled, and not exempt from work registration for any of the following reasons:4
C pregnant
C needed in the home to care for an ill or incapacitated person
C relative or other caretaker of a dependent child
C student meeting FSP eligibility requirements
C receiving or have applied for unemployment compensation
C subject to/complying with work requirements under other programs
C participating in a drug or alcohol rehabilitation program
C participating in Community Work Experience Program or other work experienceprogram
$368.33 is the federal minimum wage in fiscal year 1995 ($4.25) times 20 hours per week times5
4.33 weeks per month.
It is not clear who states will exempt as a “parent or other member of a household with6
responsibility for a dependent child.” In this analysis, a person is exempt if he or she lives in a foodstamp unit that contains a child.
For example, faced with a three-month time limit, some adults may begin to comply with the7
act’s work requirements (i.e., work or participate in a work program for 20 or more hours a week) andthus remain eligible for the FSP. The QC-based analysis presented in this chapter assumes that thisdoes not occur.
6
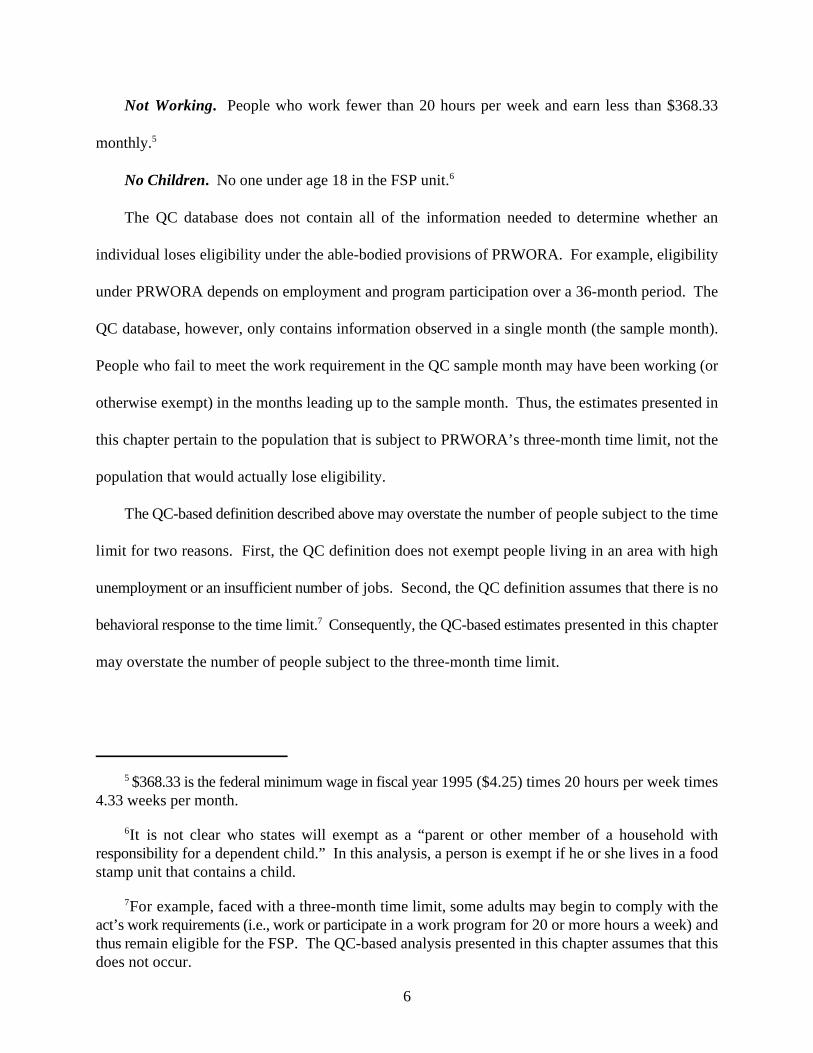
Not Working. People who work fewer than 20 hours per week and earn less than $368.33
monthly.5
No Children. No one under age 18 in the FSP unit.6
The QC database does not contain all of the information needed to determine whether an
individual loses eligibility under the able-bodied provisions of PRWORA. For example, eligibility
under PRWORA depends on employment and program participation over a 36-month period. The
QC database, however, only contains information observed in a single month (the sample month).
People who fail to meet the work requirement in the QC sample month may have been working (or
otherwise exempt) in the months leading up to the sample month. Thus, the estimates presented in
this chapter pertain to the population that is subject to PRWORA’s three-month time limit, not the
population that would actually lose eligibility.
The QC-based definition described above may overstate the number of people subject to the time
limit for two reasons. First, the QC definition does not exempt people living in an area with high
unemployment or an insufficient number of jobs. Second, the QC definition assumes that there is no
behavioral response to the time limit. Consequently, the QC-based estimates presented in this chapter7
may overstate the number of people subject to the three-month time limit.
The term “food stamp unit” refers to the persons in a household who together are certified for8
and receive food stamps.
7
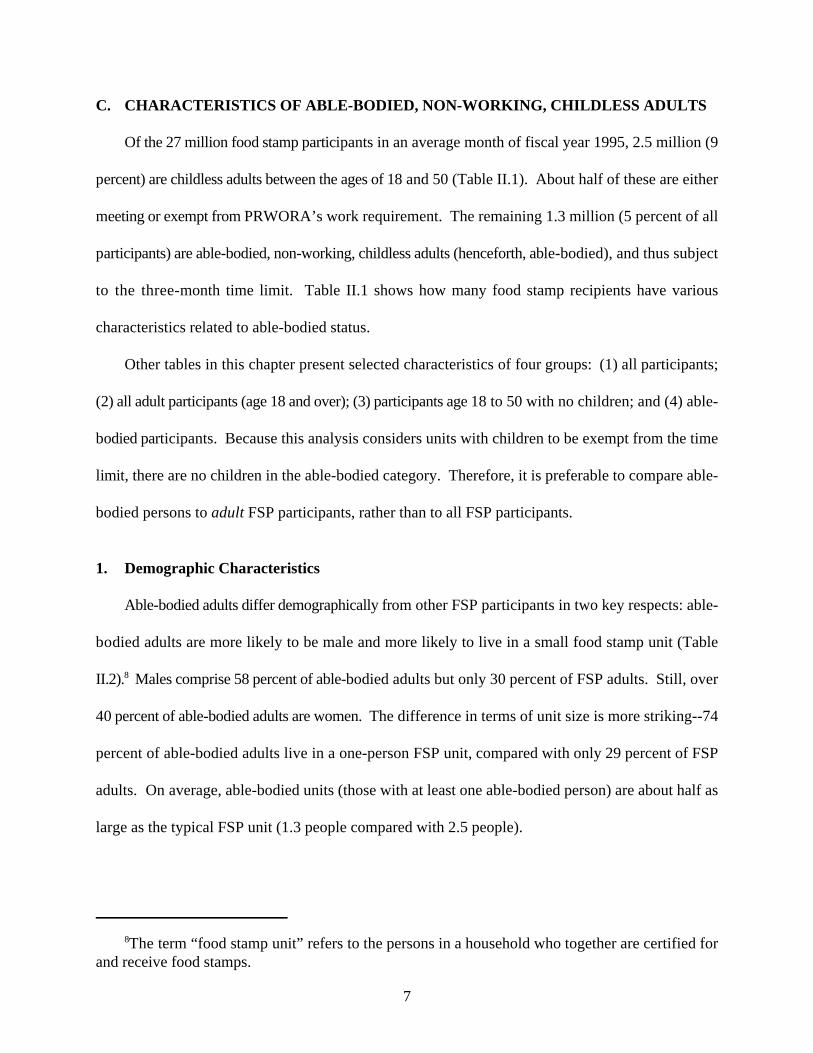
C. CHARACTERISTICS OF ABLE-BODIED, NON-WORKING, CHILDLESS ADULTS
Of the 27 million food stamp participants in an average month of fiscal year 1995, 2.5 million (9
percent) are childless adults between the ages of 18 and 50 (Table II.1). About half of these are either
meeting or exempt from PRWORA’s work requirement. The remaining 1.3 million (5 percent of all
participants) are able-bodied, non-working, childless adults (henceforth, able-bodied), and thus subject
to the three-month time limit. Table II.1 shows how many food stamp recipients have various
characteristics related to able-bodied status.
Other tables in this chapter present selected characteristics of four groups: (1) all participants;
(2) all adult participants (age 18 and over); (3) participants age 18 to 50 with no children; and (4) able-
bodied participants. Because this analysis considers units with children to be exempt from the time
limit, there are no children in the able-bodied category. Therefore, it is preferable to compare able-
bodied persons to adult FSP participants, rather than to all FSP participants.
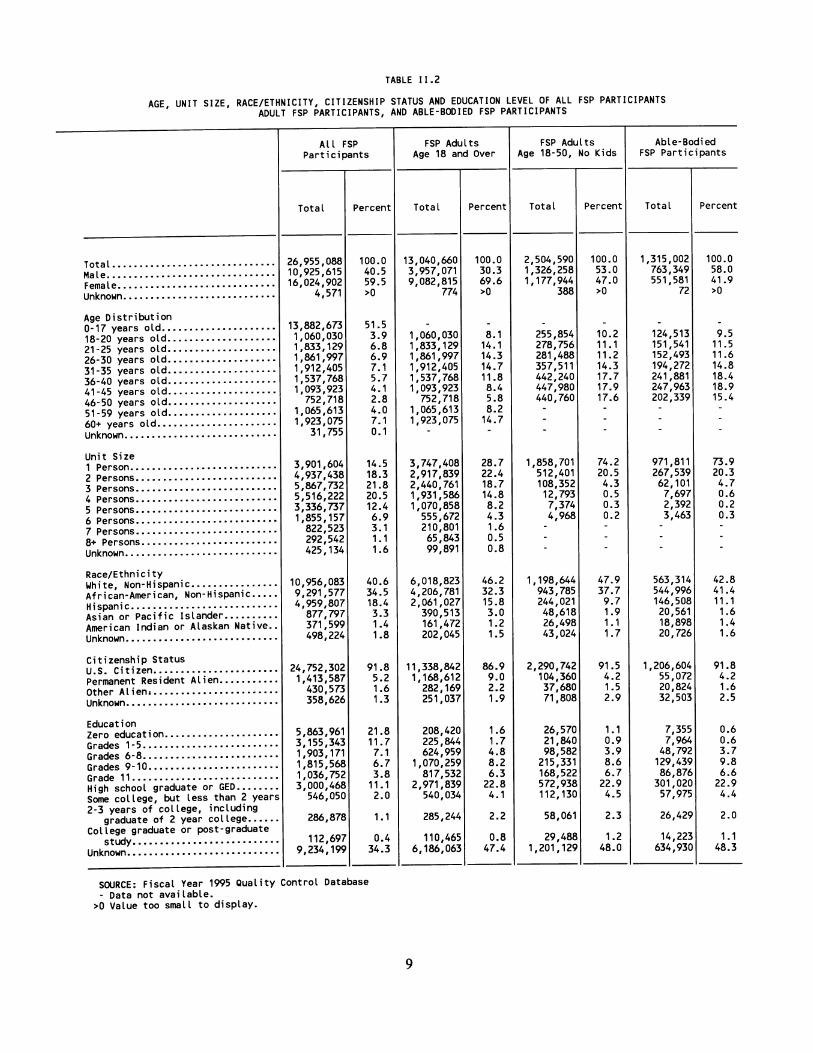
1. Demographic Characteristics
Able-bodied adults differ demographically from other FSP participants in two key respects: able-
bodied adults are more likely to be male and more likely to live in a small food stamp unit (Table
II.2). Males comprise 58 percent of able-bodied adults but only 30 percent of FSP adults. Still, over8
40 percent of able-bodied adults are women. The difference in terms of unit size is more striking--74
percent of able-bodied adults live in a one-person FSP unit, compared with only 29 percent of FSP
adults. On average, able-bodied units (those with at least one able-bodied person) are about half as
large as the typical FSP unit (1.3 people compared with 2.5 people).

TABLE II.1
PEOPLE WITH CHARACTERISTICS RELATED TO ABLE-BODIED STATUS
FSP Participants
Percent Percent
(000s) of Total of Subgroup
All FSP Participants 26,955 100.0 100.0
Under Age 18 13,883 51.5 51.5
Over Age 50 2,989 11.1 11.1
Age 18 to 50 10,052 37.3 37.3
Age 18 to 50 10,052 37.3 100.0
Disabled 1,204 4.5 12.0
Non-Disabled 8,848 32.8 88.0
Children in unit 7,547 28.0 75.1
No children in unit 2,505 9.3 24.9
Working 20+ hours per week 2,051 7.6 20.4
Not working 20+ hours per week 8,001 29.7 79.6
Not disabled, no children,
not working 20+ hours per week 1,562 5.8 15.5
Age 18 to 50, non-disabled, no children,
not working 20+ hours per week 1,562 5.8 100.0
Exempt from work registration because:
Student meeting FSP eligibility criteria 52 0.2 3.3
Receiving unemployment compensation 21 0.1 1.3
Pregnant 14 0.1 0.9
Caring for ill or incapacitated person 61 0.2 3.9
Caring for a dependent child 28 0.1 1.8
Meeting work requirement in other program 36 0.1 2.3
In drug or alcohol rehabilitation program 50 0.2 3.2
In CWEP / other work experience program 6 0.0 0.4
Able-Bodied based on QC definition* 1,315 4.9 84.2
SOURCE: Fiscal Year 1995 Quality Control Database
* Not exempt from work registration for any of the reasons listed

This assumes that the education of adults with missing information does not differ systematically9
from that of adults whose information is reported. Tabulations based on data from the SIPP suggestthat this assumption is valid. In a January 1992 SIPP sample, high school graduates comprise 56percent of able-bodied adults--similar to the QC-based estimate of 59 percent. Able-bodied adults inthe SIPP sample were identified using a definition largely analogous to the QC-based definition.
10
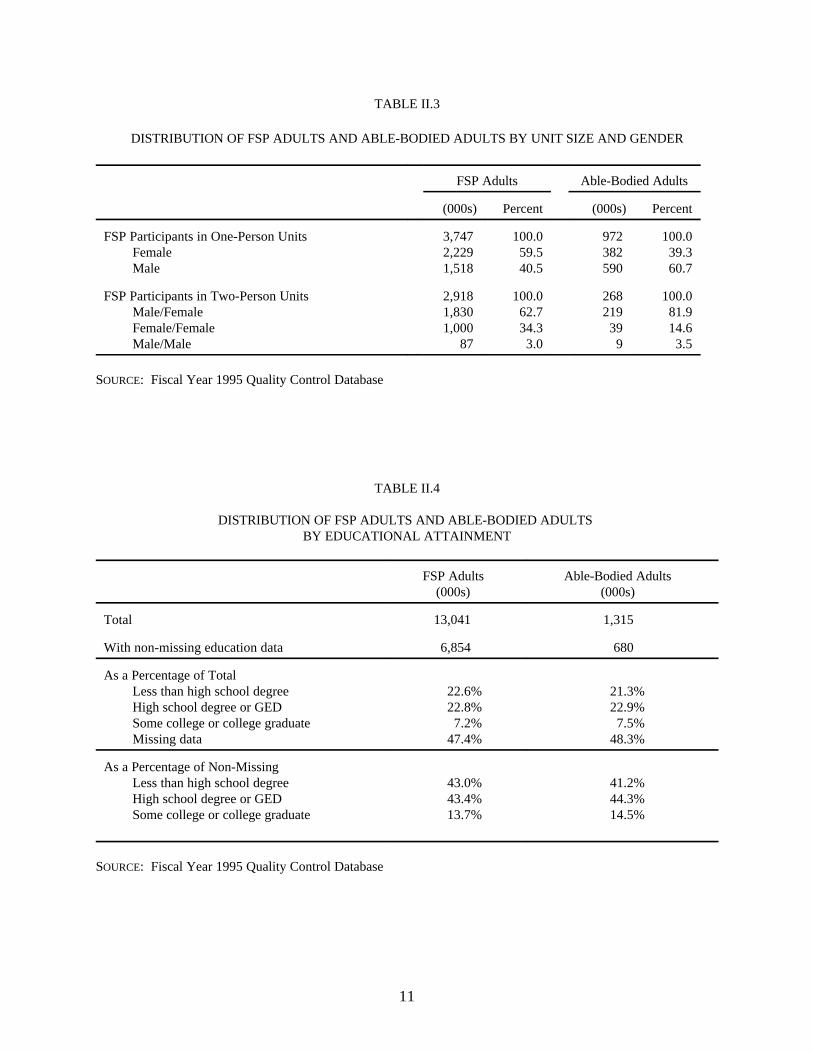
Of the 972 thousand able-bodied adults that file for food stamps by themselves (i.e., one-person
food stamp units), 590 thousand (61 percent) are male (Table II.3). In contrast, only 41 percent of FSP
adults in one-person units are male. Of the 268 thousand able-bodied adults that are in a two-person
unit, 219 thousand (82 percent) are in a unit containing one male and one female. FSP adults in two-
person units also tend to be in male/female units (63 percent), though units containing two women
(34 percent) are also common. By definition, able-bodied persons are between the ages of 18 and 50.
Just over half (53 percent) are between the ages of 36 and 50, and the average age is 35.
Whites represent the largest share of both groups (43 percent of able-bodied adults, 46 percent
of FSP adults), though African Americans represent a larger share of able-bodied adults (41 percent)
than of FSP adults (31 percent). Compared to FSP adults, able-bodied adults are less likely to be
Hispanic (11 percent compared with 18 percent) and more likely to be U.S. citizens (92 percent
compared with 87 percent) (Table II.2).
The education level of able-bodied adults is nearly identical to that of other FSP adults: 30
percent of both groups have at least a high school degree (Table II.2). Note, however, that half of the
adults on the QC database have unknown education status. A more meaningful measure of
educational attainment may be derived by computing percentages based on the population of adults
with non-missing data. As shown in Table II.4, when persons with missing data are removed from9
the denominator, 57 percent of FSP adults and 59 percent of able-bodied adults have at least a high
school degree. Just over 40 percent of both groups lack a high school diploma.
11
TABLE II.3
DISTRIBUTION OF FSP ADULTS AND ABLE-BODIED ADULTS BY UNIT SIZE AND GENDER
FSP Adults Able-Bodied Adults
(000s) Percent (000s) Percent
FSP Participants in One-Person Units 3,747 100.0 972 100.0Female 2,229 59.5 382 39.3Male 1,518 40.5 590 60.7
FSP Participants in Two-Person Units 2,918 100.0 268 100.0Male/Female 1,830 62.7 219 81.9Female/Female 1,000 34.3 39 14.6Male/Male 87 3.0 9 3.5
SOURCE: Fiscal Year 1995 Quality Control Database
TABLE II.4
DISTRIBUTION OF FSP ADULTS AND ABLE-BODIED ADULTS BY EDUCATIONAL ATTAINMENT
FSP Adults Able-Bodied Adults(000s) (000s)
Total 13,041 1,315
With non-missing education data 6,854 680
As a Percentage of TotalLess than high school degree 22.6% 21.3%High school degree or GED 22.8% 22.9%Some college or college graduate 7.2% 7.5%Missing data 47.4% 48.3%
As a Percentage of Non-MissingLess than high school degree 43.0% 41.2%High school degree or GED 43.4% 44.3%Some college or college graduate 13.7% 14.5%
SOURCE: Fiscal Year 1995 Quality Control Database

12
2. Income Sources and Amounts
Compared to FSP adults, able-bodied adults are much less likely to have income, and if they do
have income, it is likely to be of a smaller amount (Table II.5). Only 41 percent of able-bodied adults
have any income at all, and those that do have an average monthly income of $225. The average FSP
adult is twice as likely to have income (80 percent have non-zero income) and those that do have an
average monthly income of $504.
This income disparity between able-bodied adults and FSP adults is observed in comparisons of
both earned and unearned income. Some 18 percent of FSP adults have earned income ($660 per
month on average), compared with only 6 percent of able-bodied adults ($150 per month). Similarly,
73 percent of FSP adults have unearned income ($388 per month), compared with 38 percent of able-
bodied adults ($220 per month).
The bulk of FSP adults’ unearned income comes through AFDC, SSI, and Social Security. Most
able-bodied adults do not qualify for these programs, as they have no children and are neither elderly
nor disabled. Not surprisingly, the most common source of unearned income for able-bodied adults
is General Assistance, which typically provides aid to needy persons who are ineligible for federally
subsidized programs.
3. Economic and Employment Characteristics
Over three-quarters of able-bodied adults (79 percent) are in a food stamp unit whose gross
income is below half the poverty level, and almost half (45 percent) live in a unit with no income at
all (Table II.6). By comparison, 40 percent of FSP adults live in a unit whose income is below half
the poverty level, and only 9 percent have zero gross income. The average able-bodied adult’s unit-
level gross income is 24 percent of the poverty level, while the average FSP adult’s is 58 percent of
the poverty level.


Asset information on the QC database pertains to the food stamp unit. To construct a person-10
level measure of assets, each person was assigned the asset amount of his or her food stamp unit.
15
Because of their low income, the average able-bodied adult receives more in food stamp benefits
($104) than does the average FSP adult ($70). Most able-bodied adults (79 percent) receive over $100
in per capita FSP benefits and very few (5 percent) receive less than $50 (Table II.6). By comparison,
only 23 percent of FSP adults receive as much as $100 and 30 percent receive less than $50. In fiscal
year 1995, the maximum food stamp benefit for a one-person unit in the contiguous United States was
$115.
Only 13 percent of able-bodied adults have any financial assets and, of those that do, only about
one-third (37 percent) have assets in excess of $100 (Table II.6). The average FSP adult is twice as10
likely to have financial assets (26 percent have non-zero assets), and more than half (54 percent) have
assets in excess of $100.
By definition, very few able-bodied adults (4 percent) are employed. The few that do have jobs
work fewer than 20 hours per week or, if they do not report hours worked, have an income below 20
times the minimum wage. By comparison, 16 percent of all FSP adults are employed and 10 percent
are working at least 30 hours per week.
The majority of both groups (76 percent of able-bodied adults and 71 percent of FSP adults) are
not in the labor force. A person is “not in the labor force” if he or she is neither working nor actively
looking for work. Compared to FSP adults, however, able-bodied adults are much more likely to be
unemployed (i.e., not working but looking for work)--20 percent of able-bodied adults fall into this
category, compared with only 9 percent of FSP adults. Just under half of the unemployed adults in
both groups have been unemployed for less than one year.

Persons over age 60 and most persons under age 18 over are not required to register for work.11
According to Table II.8, a small number of able-bodied persons are exempt because they are12
under or over the required age or because they are employed full time. These anomalies representcoding errors on the QC database. For example, the QC database indicates that 0.3 percent of able-bodied adults are exempt because they are under or over the required age. The same data, however,indicate that these individuals are between the ages of 18 and 50.
16
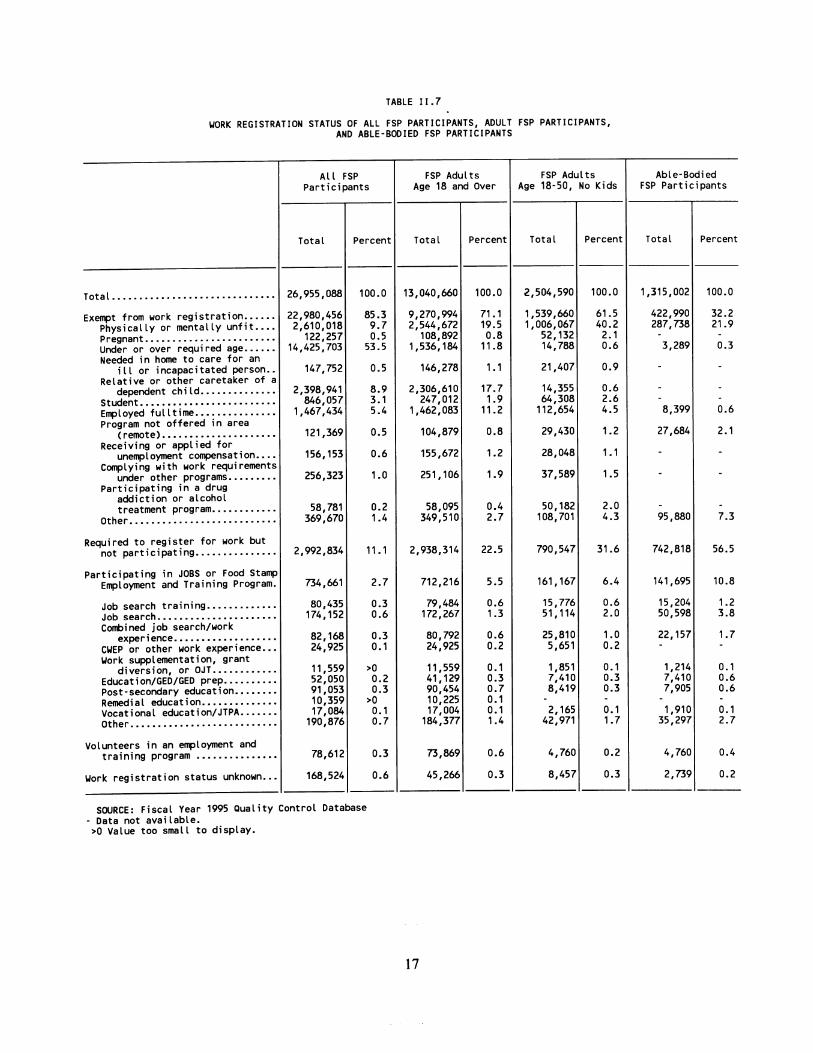
4. Work Registration Status/Participation in Employment and Training Programs
Of the 13.0 million FSP adults, 9.3 million (71 percent) are exempt from the FSP’s work
registration requirement (Table II.7). Most are exempt because they are physically or mentally unfit
(20 percent), a relative or caretaker of a dependent child (18 percent), over the required age (12
percent), or employed full time (11 percent). By definition, able-bodied persons are not eligible for11
most work registration exemptions. But nearly 22 percent of able-bodied adults are exempt from12
work registration because they are physically or mentally unfit. This seemingly anomalous finding
occurs because this analysis considers a person to be physically fit unless he or she receives disability
income. Exemptions from work registration are granted based on a less stringent test: a person may
be exempt if he or she has a statement from a physician or from a licensed or certified psychologist.
Able-bodied adults are nearly twice as likely as FSP adults to participate in an employment and
training (E&T) program--11 percent compared with 6 percent (Table II.8). Of the able-bodied adults
who participate in an E&T program, 46 percent are in job search or job search training (activities that
do not count towards PRWORA’s work requirement), 16 percent are in job search combined with
work experience, and about 12 percent are in an education related activity.
5. Distribution by State
Not surprisingly, the states that contain the most FSP participants also contain the most able-
bodied adults. More than half of all food stamp participants (52 percent) reside in eight states:

19
California, Florida, Illinois, Michigan, New York, Ohio, Pennsylvania, and Texas (Table II.8). Those
same states contain 56 percent of all able-bodied adults. Able-bodied adults represent a
disproportionately large share of the food stamp population (6.5 percent or more) in the District of
Columbia, Michigan, New York, Pennsylvania, and West Virginia; they represent a disproportionately
small share (3.0 percent or less) in Idaho, Nebraska, North Dakota, South Dakota, Utah, Wisconsin,
Wyoming, and Guam. Looking at the regional distribution, able-bodied adults comprise more than
5.5 percent of the food stamp population in the Northeast, Mid-Atlantic, and Midwest regions, but less
than 4.5 percent in the West, Southwest, Southeast, and Mountain Plains regions (Table II.9).
6. Number of Consecutive Months Receiving FSP Benefits
Although the QC database does not indicate how many months an individual has received food
stamps in the preceding 36 months, it does indicate how long an individual has participated in the FSP
during the current uninterrupted period of participation. Table II.10 shows the distribution of FSP
adults and able-bodied adults by the number of consecutive months they have participated.
On average, able-bodied adults participate in the FSP for fewer consecutive months than other
FSP adults. About a third of able-bodied adults (32 percent) have participated for three months or
fewer, compared with only 17 percent of FSP adults. And only 30 percent of able-bodied adults are
in the midst of a participation spell of longer than a year, compared with 49 percent of FSP adults.
As shown in Table II.10, 23 percent of able-bodied adults have participated for less than 3
consecutive months, and thus may not have used up their three months of FSP eligibility. However,
some of these short-term recipients may have received food stamp benefits prior to the current
participation spell but within the 36 month window imposed by PRWORA. Thus, the 23 percent
figure is an upper bound estimate of the proportion of able-bodied adults that have not yet hit
PRWORA’s time limit.


21
TABLE II.10
DISTRIBUTION OF FSP ADULTS AND ABLE-BODIED ADULTSBY NUMBER OF CONSECUTIVE MONTHS PARTICIPATING
IN THE FOOD STAMP PROGRAM
FSP Adults Able-Bodied Adults
(000s) Percent (000s) Percent
Total 13,041 100.0 1,315 100.0
Consecutive Months of Participation1 575 4.4 143 10.92 800 6.1 155 11.83 804 6.2 118 9.04-6 1,949 14.9 256 19.57-9 1,285 9.9 136 10.310-12 1,057 8.1 97 7.413 or more 6,446 49.4 400 30.4
Missing Data 126 1.0 10 0.8
SOURCE: Fiscal Year 1995 Quality Control Database
In fiscal year 1995, the FSP paid out $22.8 billion in food stamps.1
23
III. PROFILE OF PERMANENT RESIDENT ALIEN FOOD STAMP RECIPIENTS
PRWORA redirected the course of federally funded public assistance programs in the United
States. The changes created by PRWORA are intended, in part, to encourage successful transition
from public assistance to self sufficiency and to reduce the overall caseloads of public assistance
programs. PRWORA has numerous implications for the FSP, the biggest of which is the
reclassification from eligible to ineligible of most legal aliens currently participating in the FSP. The
Congressional Budget Office (CBO) estimates that the elimination of these aliens from the FSP
caseload will translate to about $600 million to $700 million a year in savings to the FSP. 1
This chapter examines the demographic and economic characteristics of aliens currently
participating in the FSP who may lose eligibility under PRWORA. We examine the characteristics
of both the aliens and the FSP units in which they participate. This information can be used to
describe how many aliens will potentially become ineligible, how much these aliens currently receive
from the FSP, and what these aliens look like in terms of their economic, demographic and household
characteristics. This study first explains the alien provisions in PRWORA and discusses the source
of the data for the study. Next, the study examines the number of people and units affected by the new
restrictions across different classes of citizenship and across different states. We then discuss the
characteristics of the people and units affected by the new restrictions. The study examines
demographic characteristics, household composition, and income characteristics. Tables III.1 and III.2
examine the distributions of all FSP participants and units, including all aliens and permanent resident
aliens only. Tables III.3 and III.4 examine all aliens, including but not limited to permanent resident
aliens. Tables III.5 through III.15 only examine the characteristics of permanent resident aliens.

24
A. ALIEN PROVISIONS
Prior to PRWORA, most legal aliens were eligible to participate in the FSP. Illegal aliens and
non-immigrants (students, tourists, visitors and people with work visas) have never been eligible for
benefits. The classes of legal aliens that were eligible for food stamps included the following:
immigrants accorded permanent resident status; aliens accorded refugee status; aliens granted political
asylum; and aliens granted a stay of deportation. Title IV of the PRWORA makes most of the first
class, aliens accorded permanent resident status, ineligible for the FSP. Exceptions are made for the
following: 1) permanent resident aliens that have a solid work history in the United States (as
evidenced by 40 or more quarters of employment), as well as their spouses and unmarried dependent
children; and 2) permanent resident aliens that are veterans or active duty members of the U.S.
military, as well as their spouses and unmarried dependent children. All other FSP permanent resident
aliens are classified as ineligible for food stamps as a result of PRWORA.
The remaining three classes of aliens--refugees, asylees and deportees--are exempt from the alien
provision of PRWORA for a period of five years after they enter the country. At that point, if these
aliens have not become naturalized, they will be subject to the restrictions facing permanent resident
aliens.
Beginning in September 1996, new applicants to the FSP were subject to the new restrictions.
Permanent resident aliens already receiving food stamps are not subject to the restrictions until their
first recertification after March 31, 1997, or one year after the date of enactment of PRWORA (the law
was enacted on August 22, 1996), whichever is first.
If an alien becomes a naturalized citizen, he or she becomes eligible for benefits on the same basis
as other citizens. To be eligible for naturalization, an alien must meet the following criteria:

Most children can not apply for naturalization on their own. To become naturalized, a child2
under 18 must have an application filed on their behalf by a parent that is a United States citizen.Children applying for naturalization are not required to meet the residency requirements that adultsface.
The green card replacement program required long-term permanent resident aliens with old green3
cards to apply for new, more secured green cards. Many aliens chose to apply for citizenship ratherthan to replace their green cards.
25
C Must be at least 18 years old2
C Must be lawfully admitted as a permanent resident of the United States
C Must continuously reside in the United States for at least five years after being accordedpermanent resident status (spouses of United States citizens must continuously residein the United States for at least three years)
C Must have been physically present in the United States for at least 30 months of the fiveyears preceding the date of application
C Must live in the state or service district in which the alien seeks to apply for at leastthree months immediately preceding application
C Must reside continuously within the United States from the date of application fornaturalization up to the time of admission to citizenship
C Must be a person of good character
The number of people applying for naturalization has increased significantly in recent years.
Applications increased from 206,000 in 1991 to 543,000 in 1994. Applications then jumped to
960,000 in 1995 and 1.3 million in 1996. Naturalization rates (the number of naturalizations per
eligible aliens) have increased among all aliens in recent years. The U.S. Immigration and
Naturalization Service’s (INS) green card replacement program and recent legislation passed in3
several states are credited with encouraging permanent resident aliens to apply for and subsequently
be granted naturalization. However, INS is unable to determine exactly how much of the growth in
both applications and naturalizations is attributable to any of these laws.

26
The total number of people naturalized increased from 240,000 in 1992 to 407,000 in 1994. In
1995, the number increased to 460,000, and in 1996 the number of naturalizations increased to 1.1
million. While some of the increase may be due to the effects of legislation, it should be noted that
some of the increase is the result of increases in INS’ ability to process the backlog in applications.
PRWORA is expected to cause additional increases in naturalization applications and in naturalization
rates. While anecdotal evidence is already revealing a substantial increase in naturalization
applications as a result of PRWORA, the exact size of the increases that will be caused by PRWORA
is not known.
B. DATA SOURCE
The estimates in this study are derived from a sample of households selected for review as part
of the 1995 IQCS. This system is an ongoing review of food stamp household circumstances designed
to determine if households are eligible to participate or are receiving the correct benefit amount and
if household participation is correctly denied or terminated. The IQCS is based on a national
probability sample of approximately 60,000 participating food stamp households, and on a somewhat
smaller number of denials and terminations. These samples are weighted to reflect the total number
of households actually participating in the FSP.
Throughout this study, we refer to the legal aliens that may lose eligibility as permanent resident
aliens. Permanent resident aliens are defined as either immigrants accorded permanent resident status
or temporary and permanent resident aliens residing legally under the Immigration Reform and
Control Act (IRCA). We include temporary residents under IRCA in our definition because it is likely
that they became permanent residents before PRWORA was enacted.
We make two important assumptions in the calculation of the estimates in this report. The first
is that we assume no additional alien FSP participants will become naturalized so as not to lose their
There is some concern that aliens who were refugees, asylees, or deportees at the time of their4
initial certification for food stamps but who subsequently became permanent residents may still becoded as refugees, asylees, or deportees in the IQCS data. Reviewers and caseworkers may haveoverlooked such changes in citizenship status because, prior to PRWORA, such changes would nothave affected FSP eligibility. The existence of such errors would understate the true number of
(continued...)
27
FSP benefits under PRWORA when, in fact, it is likely that naturalization rates will increase.
Therefore, the estimates in this report are an upper-bound estimate of the number of alien FSP
participants that will lose eligibility due to PRWORA. To obtain a lower-bound estimate of the
number of aliens that will lose eligibility under PRWORA, we would need to assume that all
permanent resident alien FSP participants eligible for naturalization actually apply for and are granted
naturalization before losing their FSP benefits. How many permanent resident alien FSP participants,
then, are eligible for naturalization? According to the INS, 55 percent of all permanent resident aliens
were eligible for naturalization in April 1996. We could, therefore, obtain a lower-bound estimate of
the number of aliens participating in the FSP that will lose eligibility under PRWORA by reducing
our upper-bound estimates by 55 percent. Note, though, that this lower-bound estimate assumes that
the percentage of permanent resident alien FSP participants eligible for naturalization is the same as
that for all permanent resident aliens.
The second assumption we make in the calculation of the estimates in this report is that no
refugees, asylees or deportees will lose eligibility under PRWORA. Recall that refugees, asylees and
deportees are exempt from the alien provisions of PRWORA for five years after they enter the country.
After five years, though, they become ineligible for the FSP. Unfortunately, the IQCS data on which
we based our estimates for this report do not include information on how long an alien has been in the
country. Regardless, we do not believe that assuming no refugees, asylees or deportees will lose
eligibility affects our estimates substantially because, according to INS, most of these aliens become
permanent resident aliens within five years after entering the country.4

(...continued)4
permanent resident aliens subject to the restrictions.
28
C. THE NUMBER OF PERMANENT RESIDENT ALIENS AND THEIR UNITS
The aliens made ineligible through PRWORA--permanent resident aliens--are currently the
largest class of alien FSP participants (Table III.1). The 1.4 million permanent resident aliens make
up 77 percent of current alien FSP participants and 5 percent of total FSP participants. The 958,000
units with at least one permanent resident alien make up 83 percent of current FSP units with any
aliens and 9 percent of total FSP units. The non-permanent resident aliens--those that will not be
affected by PRWORA--represent 1.6 percent of total participants and 1.9 percent of total units.
Units with permanent resident aliens receive an average of $188 million per month in FSP
benefits, accounting for 83 percent of all benefits to units with any aliens, and 10 percent of total FSP
benefits (Table III.2). Units with at least one non-permanent resident alien receive an average of $39
million per month, or 2 percent of all FSP benefits.
Some units contain a mix of permanent resident aliens and other participants. As a result, some
of the $188 million in benefits going to units with at least one permanent resident alien are intended
for non-permanent resident aliens or U.S. citizens. To estimate how much in benefits goes to just
permanent resident aliens, we pro-rated benefits by household composition. Pro-rated benefits are
determined by multiplying each unit’s benefit level by the ratio of the number of unit members with
a specific citizenship status to the total unit size. For example, the pro-rated benefits estimate for
permanent resident aliens is derived by multiplying the benefits received in a given unit by the ratio
of the number of permanent resident alien unit members to the total number of unit members.
Although 10 percent of all benefits go to units with permanent resident aliens, only 5.2 percent of all

TABLE III.1
DISTRIBUTION OF FSP PARTICIPANTS AND UNITS BY CITIZENSHIP STATUS
Units PersonsNumber Percent of Percent of Number Percent of Percent of
Citizenship Status* (000s) Subtotal Total (000s) Subtotal Total
AliensPermanent Residents 958 82.5 8.8 1,414 76.7 5.2Alien Accorded Refugee Status 163 14.1 1.5 376 20.4 1.4Alien Granted Political Asylum 4 0.4 0.0 5 0.3 0.0Alien Granted Stay of Deportation 3 0.3 0.0 3 0.2 0.0Other Aliens 41 3.6 0.4 46 2.5 0.2Subtotal 1,161 100.0 10.7 1,844 100.0 6.8
US CitizensBorn in US 10,107 98.9 92.9 24,508 99.0 90.9Naturalized 217 2.1 2.0 243 1.0 0.9Subtotal 10,216 100.0 93.9 24,752 100.0 91.8
Unknown 233 100.0 2.1 359 100.0 1.3
Total 10,883 100.0 100.0 26,955 100.0 100.0
Average Permanent Resident Unit Size = 3.0Average FSP Unit Size = 2.5
SOURCE: Fiscal Year 1995 QC DatabaseNOTE: All estimates reflect an average month in 1995.
* For units, citizenship status categories are not mutually exclusive; thus the sum of the subtotals will exceed 100 percent.n.a. = not applicable

TABLE III.2
DISTRIBUTION OF BENEFITS TO FSP UNITS BY CITIZENSHIP STATUS
Benefits to Units Pro-Rated** BenefitsDollars Percent of Percent of Dollars Percent of Percent of
Citizenship Status* (000s) Subtotal Total (000s) Subtotal Total
AliensPermanent Residents 187,626 83.3 10.0 96,600 76.4 5.2Alien Accorded Refugee Status 32,389 14.4 1.7 25,998 20.6 1.4Alien Granted Political Asylum 699 0.3 0.0 356 0.3 0.0Alien Granted Stay of Deportation 696 0.3 0.0 279 0.2 0.0Other Aliens 5,635 2.5 0.3 3,241 2.6 0.2Subtotal 225,257 100.0 12.0 126,473 100.0 6.8
US CitizensBorn in US 1,777,235 99.5 95.0 1,701,620 99.0 91.0Naturalized 37,175 2.1 2.0 16,845 1.0 0.9Subtotal 1,786,875 100.0 95.6 1,718,465 100.0 91.9
Unknown 34,434 100.0 25,101 100.0 1.3
Total 1,870,039 100.0 100.0 1,870,039 100.0 100.0
Average Permanent Resident Unit Size = 3.0Average FSP Unit Size = 2.5
SOURCE: Fiscal Year 1995 QC DatabaseNOTE: All estimates reflect an average month in 1995.
* For units, citizenship status categories are not mutually exclusive; thus the sum of the subtotals will exceed 100 percent.** Pro-rated benefits paid to persons in a given FSP unit equals the unit's total FSP benefits multiplied by the ratio of the number of persons in the unit who meet row description to total unit size.n.a. = not applicable
31
pro-rated benefits go to permanent resident aliens. This is because many units have both permanent
resident aliens and members with other citizenship statuses.
Alien FSP participants are concentrated in a small number of states. Approximately 70 percent
of the aliens can be found in four states: California, Florida, New York, and Texas (Table III.3).
Within each of these states, aliens make up a relatively high proportion of total FSP participants. The
distribution of FSP benefits to aliens reflects the distribution of alien participants, with the bulk of
benefits to units with aliens going to the same four states (Table III.4). California, Florida, New York,
and Texas account for 72 percent of all benefits to aliens.
The distribution of permanent resident aliens by state (Table III.5) follows a similar pattern to the
distribution of total aliens. The four states of California, Florida, New York, and Texas account for
74 percent of all permanent resident aliens in the program (these states account for 75 percent of all
units with permanent resident aliens).
Benefits to permanent resident aliens in the four states of California, Florida, New York and
Texas account for 76 percent of all benefits to permanent resident aliens (Table III.6). Within each
of these states, permanent resident aliens account for relatively high proportions of all food stamp
benefits (more than 20 percent in New York and California). Benefits to permanent resident aliens
account for more than 10 percent of the state’s food stamp benefits in 12 states: Arizona, California,
Florida, Hawaii, Massachusetts, New Jersey, New York, New Mexico, Rhode Island, Texas, Guam
and the Virgin Islands.
The average benefit to a food stamp unit with a permanent resident alien is $196 per month (Table
III.7). In California, the state with the most permanent resident aliens, the average benefit to
permanent resident alien units is $200 per month. Texas, with the second-largest number of
permanent resident aliens, has an average food stamp benefit to permanent resident alien units of $228
per month. New York and Florida have average benefits of $179 and $166 respectively.

TABLE III.3
DISTRIBUTION OF ALL ALIEN FSP PARTICIPANTS, UNITS BY STATE
Units with Aliens Alien ParticipantsPercent of Percent of Percent of Percent of
All Units All Participants Number All National Number All State National Alien(000s) (000s) (000s) State Units Alien Units (000s) Participants Participants
Alabama 209 542 0.6 0.3 0.1 1.9 0.3 0.1Alaska 15 45 0.5 3.2 0.0 0.7 1.6 0.0Arizona 178 508 24.5 13.7 2.1 36.3 7.1 2.0Arkansas 107 271 0.8 0.7 0.1 1.4 0.5 0.1California 1,176 3,266 331.2 28.2 28.5 554.3 17.0 30.1Colorado 103 248 8.0 7.8 0.7 13.4 5.4 0.7Connecticut 100 238 7.2 7.2 0.6 11.7 4.9 0.6Delaware 21 52 0.5 2.4 0.0 1.0 1.9 0.1Dist. of Col. 43 98 1.8 4.1 0.2 2.2 2.2 0.1Florida 588 1,425 107.9 18.3 9.3 147.5 10.3 8.0Georgia 329 809 6.1 1.9 0.5 8.8 1.1 0.5Hawaii 55 130 8.3 15.1 0.7 12.9 9.9 0.7Idaho 30 79 1.9 6.2 0.2 3.2 4.1 0.2Illinois 488 1,130 32.9 6.8 2.8 49.6 4.4 2.7Indiana 183 464 3.6 2.0 0.3 4.2 0.9 0.2Iowa 75 187 1.2 1.6 0.1 3.1 1.7 0.2Kansas 75 192 3.3 4.5 0.3 6.7 3.5 0.4Kentucky 187 488 0.9 0.5 0.1 1.2 0.2 0.1Louisiana 267 724 4.4 1.7 0.4 6.4 0.9 0.3Maine 60 129 0.8 1.3 0.1 0.9 0.7 0.0Maryland 169 410 9.9 5.8 0.9 16.8 4.1 0.9Massachusetts 178 429 23.8 13.4 2.1 38.7 9.0 2.1Michigan 418 985 12.6 3.0 1.1 22.6 2.3 1.2Minnesota 131 316 12.2 9.3 1.0 30.1 9.5 1.6Mississippi 185 489 0.6 0.3 0.1 0.9 0.2 0.1Missouri 237 592 2.8 1.2 0.2 5.4 0.9 0.3Montana 28 71 0.3 1.1 0.0 0.6 0.9 0.0Nebraska 43 106 1.5 3.4 0.1 3.1 2.9 0.2Nevada 46 109 3.3 7.2 0.3 4.7 4.3 0.3New Hampshire 25 58 0.7 2.6 0.1 0.8 1.3 0.0New Jersey 234 557 30.3 12.9 2.6 48.4 8.7 2.6New Mexico 87 241 11.0 12.7 0.9 17.4 7.2 0.9New York 1,027 2,137 243.7 23.7 21.0 336.9 15.8 18.3North Carolina 258 614 3.5 1.4 0.3 4.8 0.8 0.3North Dakota 17 41 0.4 2.1 0.0 0.6 1.4 0.0Ohio 506 1,170 8.7 1.7 0.7 15.4 1.3 0.8Oklahoma 153 384 3.0 2.0 0.3 4.5 1.2 0.2Oregon 132 298 10.4 7.9 0.9 19.3 6.5 1.0Pennsylvania 516 1,172 18.6 3.6 1.6 37.1 3.2 2.0Rhode Island 40 94 5.3 13.1 0.5 8.1 8.6 0.4South Carolina 140 376 0.5 0.4 0.0 1.1 0.3 0.1South Dakota 19 52 0.2 0.8 0.0 0.3 0.6 0.0Tennessee 281 669 1.8 0.6 0.2 3.6 0.5 0.2Texas 948 2,610 162.6 17.2 14.0 256.6 9.8 13.9Utah 44 122 2.4 5.4 0.2 3.3 2.7 0.2Vermont 27 63 0.3 1.2 0.0 0.3 0.5 0.0Virginia 235 562 8.1 3.4 0.7 13.9 2.5 0.8Washington 204 497 27.3 13.4 2.4 58.2 11.7 3.2West Virginia 123 302 0.6 0.5 0.1 0.7 0.2 0.0Wisconsin 119 329 5.5 4.7 0.5 18.1 5.5 1.0Wyoming 13 35 0.3 2.5 0.0 0.4 1.2 0.0Guam 5 16 0.7 13.7 0.1 0.8 5.2 0.0Virgin Islands 7 24 2.2 30.1 0.2 3.5 14.5 0.2
Total 10,883 26,955 1,161 - 100.0 1,844 - 100.0
Average Permanent Resident Unit Size = 3.0Average FSP Unit Size = 2.5
SOURCE: Fiscal Year 1995 QC DatabaseNOTE: All estimates reflect an average month in 1995.
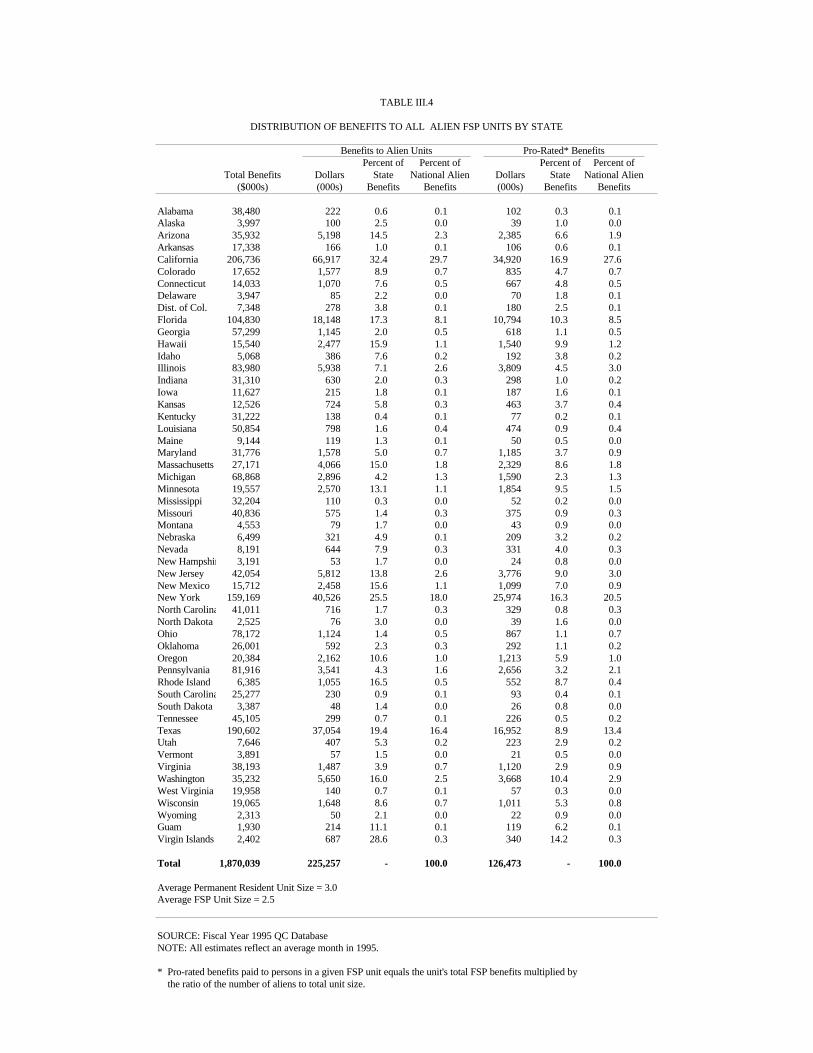
TABLE III.4
DISTRIBUTION OF BENEFITS TO ALL ALIEN FSP UNITS BY STATE
Benefits to Alien Units Pro-Rated* BenefitsPercent of Percent of Percent of Percent of
Total Benefits Dollars State National Alien Dollars State National Alien($000s) (000s) Benefits Benefits (000s) Benefits Benefits
Alabama 38,480 222 0.6 0.1 102 0.3 0.1Alaska 3,997 100 2.5 0.0 39 1.0 0.0Arizona 35,932 5,198 14.5 2.3 2,385 6.6 1.9Arkansas 17,338 166 1.0 0.1 106 0.6 0.1California 206,736 66,917 32.4 29.7 34,920 16.9 27.6Colorado 17,652 1,577 8.9 0.7 835 4.7 0.7Connecticut 14,033 1,070 7.6 0.5 667 4.8 0.5Delaware 3,947 85 2.2 0.0 70 1.8 0.1Dist. of Col. 7,348 278 3.8 0.1 180 2.5 0.1Florida 104,830 18,148 17.3 8.1 10,794 10.3 8.5Georgia 57,299 1,145 2.0 0.5 618 1.1 0.5Hawaii 15,540 2,477 15.9 1.1 1,540 9.9 1.2Idaho 5,068 386 7.6 0.2 192 3.8 0.2Illinois 83,980 5,938 7.1 2.6 3,809 4.5 3.0Indiana 31,310 630 2.0 0.3 298 1.0 0.2Iowa 11,627 215 1.8 0.1 187 1.6 0.1Kansas 12,526 724 5.8 0.3 463 3.7 0.4Kentucky 31,222 138 0.4 0.1 77 0.2 0.1Louisiana 50,854 798 1.6 0.4 474 0.9 0.4Maine 9,144 119 1.3 0.1 50 0.5 0.0Maryland 31,776 1,578 5.0 0.7 1,185 3.7 0.9Massachusetts 27,171 4,066 15.0 1.8 2,329 8.6 1.8Michigan 68,868 2,896 4.2 1.3 1,590 2.3 1.3Minnesota 19,557 2,570 13.1 1.1 1,854 9.5 1.5Mississippi 32,204 110 0.3 0.0 52 0.2 0.0Missouri 40,836 575 1.4 0.3 375 0.9 0.3Montana 4,553 79 1.7 0.0 43 0.9 0.0Nebraska 6,499 321 4.9 0.1 209 3.2 0.2Nevada 8,191 644 7.9 0.3 331 4.0 0.3New Hampshire 3,191 53 1.7 0.0 24 0.8 0.0New Jersey 42,054 5,812 13.8 2.6 3,776 9.0 3.0New Mexico 15,712 2,458 15.6 1.1 1,099 7.0 0.9New York 159,169 40,526 25.5 18.0 25,974 16.3 20.5North Carolina 41,011 716 1.7 0.3 329 0.8 0.3North Dakota 2,525 76 3.0 0.0 39 1.6 0.0Ohio 78,172 1,124 1.4 0.5 867 1.1 0.7Oklahoma 26,001 592 2.3 0.3 292 1.1 0.2Oregon 20,384 2,162 10.6 1.0 1,213 5.9 1.0Pennsylvania 81,916 3,541 4.3 1.6 2,656 3.2 2.1Rhode Island 6,385 1,055 16.5 0.5 552 8.7 0.4South Carolina 25,277 230 0.9 0.1 93 0.4 0.1South Dakota 3,387 48 1.4 0.0 26 0.8 0.0Tennessee 45,105 299 0.7 0.1 226 0.5 0.2Texas 190,602 37,054 19.4 16.4 16,952 8.9 13.4Utah 7,646 407 5.3 0.2 223 2.9 0.2Vermont 3,891 57 1.5 0.0 21 0.5 0.0Virginia 38,193 1,487 3.9 0.7 1,120 2.9 0.9Washington 35,232 5,650 16.0 2.5 3,668 10.4 2.9West Virginia 19,958 140 0.7 0.1 57 0.3 0.0Wisconsin 19,065 1,648 8.6 0.7 1,011 5.3 0.8Wyoming 2,313 50 2.1 0.0 22 0.9 0.0Guam 1,930 214 11.1 0.1 119 6.2 0.1Virgin Islands 2,402 687 28.6 0.3 340 14.2 0.3
Total 1,870,039 225,257 - 100.0 126,473 - 100.0
Average Permanent Resident Unit Size = 3.0Average FSP Unit Size = 2.5
SOURCE: Fiscal Year 1995 QC DatabaseNOTE: All estimates reflect an average month in 1995.
* Pro-rated benefits paid to persons in a given FSP unit equals the unit's total FSP benefits multiplied by the ratio of the number of aliens to total unit size.

TABLE III.5
DISTRIBUTION OF PERMANENT RESIDENT ALIEN FSP PARTICIPANTS , UNITS BY STATE
Units with Aliens Alien ParticipantsPercent of Percent of Percent of Percent of
All Units All Participants Number All National Number All State National Alien(000s) (000s) (000s) State Units Alien Units (000s) Participants Participants
Alabama 209 542 0.4 0.2 0.0 0.8 0.1 0.1Alaska 15 45 0.4 2.6 0.0 0.5 1.1 0.0Arizona 178 508 23.7 13.3 2.5 34.7 6.8 2.5Arkansas 107 271 0.5 0.5 0.1 0.7 0.3 0.1California 1,176 3,266 284.0 24.2 29.6 426.9 13.1 30.2Colorado 103 248 6.6 6.4 0.7 10.5 4.3 0.7Connecticut 100 238 5.8 5.8 0.6 8.7 3.7 0.6Delaware 21 52 0.3 1.6 0.0 0.5 1.0 0.0Dist. of Col. 43 98 1.5 3.5 0.2 1.9 2.0 0.1Florida 588 1,425 94.0 16.0 9.8 125.6 8.8 8.9Georgia 329 809 4.3 1.3 0.4 5.6 0.7 0.4Hawaii 55 130 7.1 12.9 0.7 10.6 8.1 0.7Idaho 30 79 1.6 5.2 0.2 2.3 2.9 0.2Illinois 488 1,130 26.2 5.4 2.7 38.0 3.4 2.7Indiana 183 464 2.0 1.1 0.2 2.2 0.5 0.2Iowa 75 187 0.7 1.0 0.1 1.5 0.8 0.1Kansas 75 192 2.2 3.0 0.2 3.9 2.0 0.3Kentucky 187 488 0.6 0.3 0.1 0.8 0.2 0.1Louisiana 267 724 3.3 1.3 0.3 5.4 0.7 0.4Maine 60 129 0.5 0.9 0.1 0.6 0.4 0.0Maryland 169 410 8.0 4.7 0.8 12.8 3.1 0.9Massachusetts 178 429 19.5 10.9 2.0 29.9 7.0 2.1Michigan 418 985 8.6 2.1 0.9 13.4 1.4 1.0Minnesota 131 316 3.5 2.7 0.4 5.3 1.7 0.4Mississippi 185 489 0.3 0.2 0.0 0.3 0.1 0.0Missouri 237 592 2.6 1.1 0.3 4.6 0.8 0.3Montana 28 71 0.3 0.9 0.0 0.4 0.5 0.0Nebraska 43 106 0.6 1.4 0.1 0.9 0.8 0.1Nevada 46 109 3.0 6.4 0.3 3.9 3.5 0.3New Hampshire 25 58 0.5 1.8 0.0 0.6 1.0 0.0New Jersey 234 557 26.5 11.3 2.8 41.4 7.4 2.9New Mexico 87 241 9.8 11.3 1.0 15.2 6.3 1.1New York 1,027 2,137 188.1 18.3 19.6 251.0 11.7 17.8North Carolina 258 614 2.5 1.0 0.3 3.8 0.6 0.3North Dakota 17 41 0.1 0.9 0.0 0.2 0.5 0.0Ohio 506 1,170 6.7 1.3 0.7 11.9 1.0 0.8Oklahoma 153 384 2.4 1.6 0.2 3.6 0.9 0.3Oregon 132 298 7.1 5.4 0.7 11.7 3.9 0.8Pennsylvania 516 1,172 10.4 2.0 1.1 22.9 2.0 1.6Rhode Island 40 94 4.6 11.4 0.5 6.9 7.3 0.5South Carolina 140 376 0.4 0.3 0.0 0.6 0.2 0.0South Dakota 19 52 0.1 0.5 0.0 0.3 0.5 0.0Tennessee 281 669 0.9 0.3 0.1 1.5 0.2 0.1Texas 948 2,610 156.9 16.6 16.4 245.2 9.4 17.3Utah 44 122 1.9 4.2 0.2 2.4 2.0 0.2Vermont 27 63 0.2 0.8 0.0 0.2 0.4 0.0Virginia 235 562 6.4 2.7 0.7 9.2 1.6 0.7Washington 204 497 13.5 6.6 1.4 19.0 3.8 1.3West Virginia 123 302 0.5 0.4 0.0 0.6 0.2 0.0Wisconsin 119 329 2.9 2.4 0.3 7.4 2.3 0.5Wyoming 13 35 0.3 2.3 0.0 0.4 1.1 0.0Guam 5 16 0.7 13.7 0.1 0.8 5.2 0.1Virgin Islands 7 24 2.2 30.1 0.2 3.5 14.6 0.2
Total 10,883 26,955 958 - 100.0 1,414 - 100.0
Average Permanent Resident Unit Size = 3.0Average FSP Unit Size = 2.5
SOURCE: Fiscal Year 1995 QC DatabaseNOTE: All estimates reflect an average month in 1995.
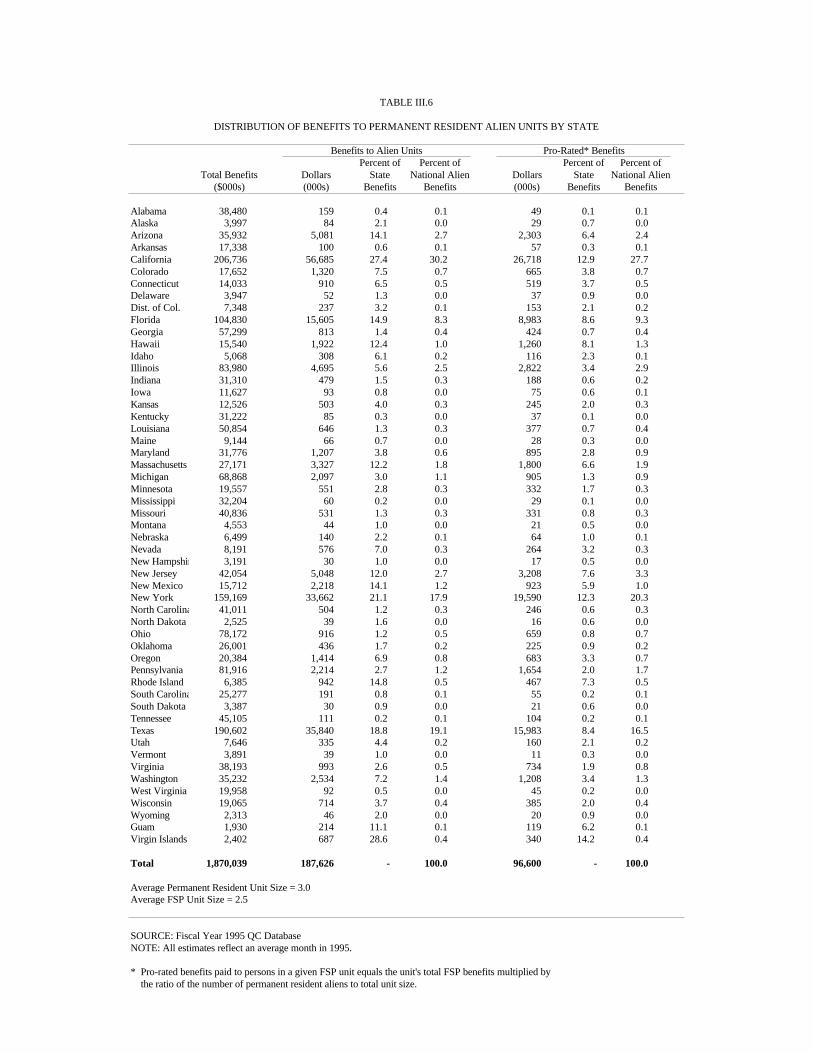
TABLE III.6
DISTRIBUTION OF BENEFITS TO PERMANENT RESIDENT ALIEN UNITS BY STATE
Benefits to Alien Units Pro-Rated* BenefitsPercent of Percent of Percent of Percent of
Total Benefits Dollars State National Alien Dollars State National Alien($000s) (000s) Benefits Benefits (000s) Benefits Benefits
Alabama 38,480 159 0.4 0.1 49 0.1 0.1Alaska 3,997 84 2.1 0.0 29 0.7 0.0Arizona 35,932 5,081 14.1 2.7 2,303 6.4 2.4Arkansas 17,338 100 0.6 0.1 57 0.3 0.1California 206,736 56,685 27.4 30.2 26,718 12.9 27.7Colorado 17,652 1,320 7.5 0.7 665 3.8 0.7Connecticut 14,033 910 6.5 0.5 519 3.7 0.5Delaware 3,947 52 1.3 0.0 37 0.9 0.0Dist. of Col. 7,348 237 3.2 0.1 153 2.1 0.2Florida 104,830 15,605 14.9 8.3 8,983 8.6 9.3Georgia 57,299 813 1.4 0.4 424 0.7 0.4Hawaii 15,540 1,922 12.4 1.0 1,260 8.1 1.3Idaho 5,068 308 6.1 0.2 116 2.3 0.1Illinois 83,980 4,695 5.6 2.5 2,822 3.4 2.9Indiana 31,310 479 1.5 0.3 188 0.6 0.2Iowa 11,627 93 0.8 0.0 75 0.6 0.1Kansas 12,526 503 4.0 0.3 245 2.0 0.3Kentucky 31,222 85 0.3 0.0 37 0.1 0.0Louisiana 50,854 646 1.3 0.3 377 0.7 0.4Maine 9,144 66 0.7 0.0 28 0.3 0.0Maryland 31,776 1,207 3.8 0.6 895 2.8 0.9Massachusetts 27,171 3,327 12.2 1.8 1,800 6.6 1.9Michigan 68,868 2,097 3.0 1.1 905 1.3 0.9Minnesota 19,557 551 2.8 0.3 332 1.7 0.3Mississippi 32,204 60 0.2 0.0 29 0.1 0.0Missouri 40,836 531 1.3 0.3 331 0.8 0.3Montana 4,553 44 1.0 0.0 21 0.5 0.0Nebraska 6,499 140 2.2 0.1 64 1.0 0.1Nevada 8,191 576 7.0 0.3 264 3.2 0.3New Hampshire 3,191 30 1.0 0.0 17 0.5 0.0New Jersey 42,054 5,048 12.0 2.7 3,208 7.6 3.3New Mexico 15,712 2,218 14.1 1.2 923 5.9 1.0New York 159,169 33,662 21.1 17.9 19,590 12.3 20.3North Carolina 41,011 504 1.2 0.3 246 0.6 0.3North Dakota 2,525 39 1.6 0.0 16 0.6 0.0Ohio 78,172 916 1.2 0.5 659 0.8 0.7Oklahoma 26,001 436 1.7 0.2 225 0.9 0.2Oregon 20,384 1,414 6.9 0.8 683 3.3 0.7Pennsylvania 81,916 2,214 2.7 1.2 1,654 2.0 1.7Rhode Island 6,385 942 14.8 0.5 467 7.3 0.5South Carolina 25,277 191 0.8 0.1 55 0.2 0.1South Dakota 3,387 30 0.9 0.0 21 0.6 0.0Tennessee 45,105 111 0.2 0.1 104 0.2 0.1Texas 190,602 35,840 18.8 19.1 15,983 8.4 16.5Utah 7,646 335 4.4 0.2 160 2.1 0.2Vermont 3,891 39 1.0 0.0 11 0.3 0.0Virginia 38,193 993 2.6 0.5 734 1.9 0.8Washington 35,232 2,534 7.2 1.4 1,208 3.4 1.3West Virginia 19,958 92 0.5 0.0 45 0.2 0.0Wisconsin 19,065 714 3.7 0.4 385 2.0 0.4Wyoming 2,313 46 2.0 0.0 20 0.9 0.0Guam 1,930 214 11.1 0.1 119 6.2 0.1Virgin Islands 2,402 687 28.6 0.4 340 14.2 0.4
Total 1,870,039 187,626 - 100.0 96,600 - 100.0
Average Permanent Resident Unit Size = 3.0Average FSP Unit Size = 2.5
SOURCE: Fiscal Year 1995 QC DatabaseNOTE: All estimates reflect an average month in 1995.
* Pro-rated benefits paid to persons in a given FSP unit equals the unit's total FSP benefits multiplied by the ratio of the number of permanent resident aliens to total unit size.

TABLE III.7
AVERAGE BENEFITS AND CERTIFICATION PERIOD FOR UNITS WITHPERMANENT RESIDENT ALIENS FOR SELECTED STATES
AverageAverage Benefit Certification
State Per Unit ($) Period (Months)
California 200 12Florida 166 8New York 179 10Texas 228 7All Other States 195 10
Total, All States 196 10
Average Permanent Resident Unit Size = 3.0
SOURCE: Fiscal Year 1995 QC DatabaseNOTE: All estimates reflect an average month in 1995.

37
Under PRWORA, permanent resident aliens become ineligible either at their recertification or
one year after the date of enactment of PRWORA, whichever is first. On average, units with
permanent resident aliens have 10 month certification periods (Table III.8). Fifty-five percent of units
with permanent resident aliens have certification periods that are between 10 and 12 months long; 22
percent have certification periods that are between four and six months long. Also, units with
permanent resident aliens have, on average, about five months left in their certification period. About
3.5 percent (33 million) of all units with aliens are new applicants to the FSP.
D. CHARACTERISTICS OF PERMANENT RESIDENT ALIENS AND THEIR UNITS
This section describes the characteristics of the aliens made ineligible for the FSP by PRWORA.
It examines demographic, unit composition and income characteristics.
1. Demographic Characteristics
The majority (64 percent) of permanent resident aliens receiving food stamps are female. The
average age of permanent resident alien FSP participants is 36. Seventeen percent of all permanent
resident aliens are children (younger than 18), one percent are younger than five, and another 17
percent are elderly (60 or older). The majority (54 percent) of permanent resident aliens are Hispanic,
and another 20 percent are Asian (Table III.9). Fourteen percent of permanent resident aliens are
white and eight percent are African-American.
2. Unit Composition
The majority (64 percent) of units with permanent resident aliens contain a mix of both
permanent resident aliens and U.S. citizens (Table III.10). Of these “mixed” units, 58 percent contain
a single adult with children. Multiple adults with children account for another 36 percent of mixed
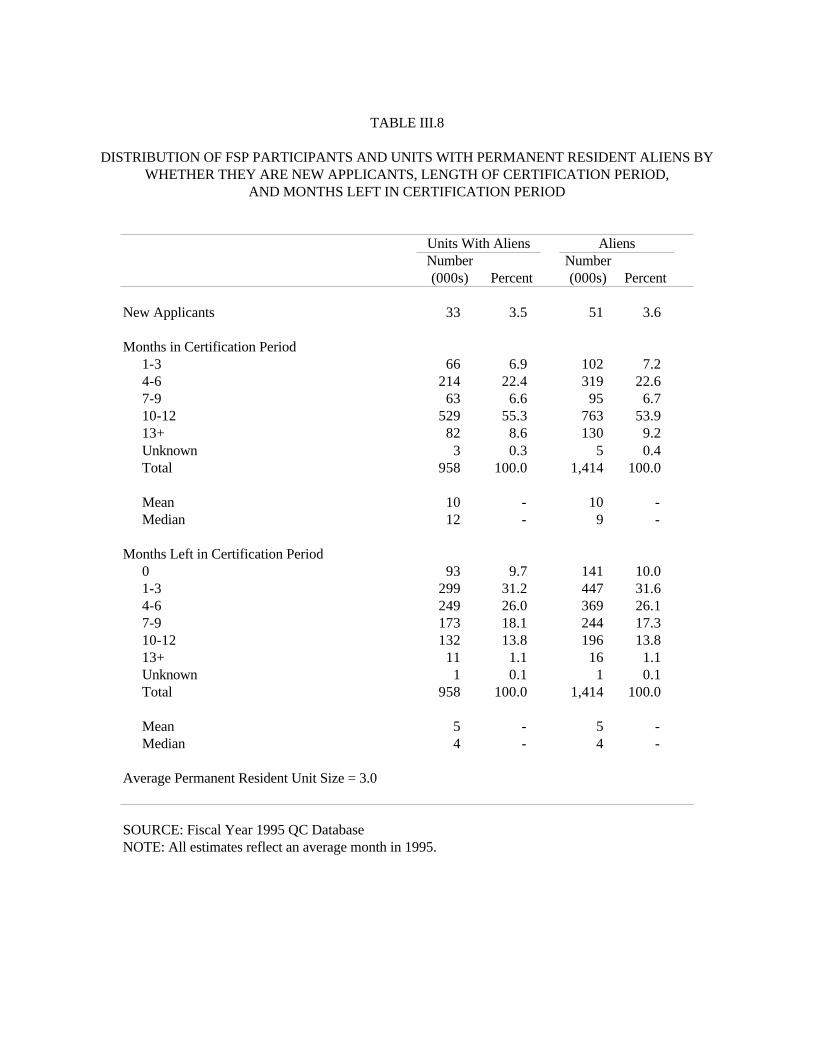
TABLE III.8
DISTRIBUTION OF FSP PARTICIPANTS AND UNITS WITH PERMANENT RESIDENT ALIENS BYWHETHER THEY ARE NEW APPLICANTS, LENGTH OF CERTIFICATION PERIOD,
AND MONTHS LEFT IN CERTIFICATION PERIOD
Units With Aliens AliensNumber Number(000s) Percent (000s) Percent
New Applicants 33 3.5 51 3.6
Months in Certification Period1-3 66 6.9 102 7.24-6 214 22.4 319 22.67-9 63 6.6 95 6.710-12 529 55.3 763 53.913+ 82 8.6 130 9.2Unknown 3 0.3 5 0.4Total 958 100.0 1,414 100.0
Mean 10 - 10 -Median 12 - 9 -
Months Left in Certification Period0 93 9.7 141 10.01-3 299 31.2 447 31.64-6 249 26.0 369 26.17-9 173 18.1 244 17.310-12 132 13.8 196 13.813+ 11 1.1 16 1.1Unknown 1 0.1 1 0.1Total 958 100.0 1,414 100.0
Mean 5 - 5 -Median 4 - 4 -
Average Permanent Resident Unit Size = 3.0
SOURCE: Fiscal Year 1995 QC DatabaseNOTE: All estimates reflect an average month in 1995.

TABLE III.9
AGE, GENDER AND RACE OF PERMANENT RESIDENT ALIEN FSP PARTICIPANTS
Demographic CharacteristicNumber(000s) Percent
Age0 - 4 15 1.15 - 17 230 16.318 - 59 934 66.060+ 235 16.6Total 1,414 100.0Average Age 36 -
GenderMale 515 36.4Female 899 63.6Total 1,414 100.0
Race/EthnicityWhite 196 13.8African-American 117 8.3Hispanic 767 54.3Asian 280 19.8Unknown Ethnicity 54 3.8Total 1,414 100.0
SOURCE: Fiscal Year 1995 QC DatabaseNOTE: All estimates reflect an average month in 1995.

TABLE III.10
DISTRIBUTION OF PERMANENT RESIDENT ALIEN FSP UNITS BY WHETHER THE UNIT IS COMPOSED ENTIRELY OF PERMANENT RESIDENT ALIENS ("PURE") OR A MIX OF PERMANENT RESIDENT
ALIENS AND OTHERS ("MIXED")
All FSP Units Permanent Resident Alien UnitsNumber Number Percent of Percent of
Unit Composition (000s) Percent (000s) Subtotal Total
All Units
Single Adult, No Children 3,748 34.4 227 - 23.7Multiple Adults, No Children 643 5.9 94 - 9.9Single Adult, with Children 4,532 41.6 372 - 38.8Multiple Adults, with Children 1,629 15.0 257 - 26.8Children Only 331 3.0 7 - 0.8Total 10,883 100.0 958 - 100.0
Pure PR Units 346 - 36.1Mixed PR Units 612 - 63.9Total 958 - 100.0
Pure Permanent Resident Alien Units
Single Adult, No Children 227 - 65.8Multiple Adults, No Children 62 - 18.1Single Adult, with Children 18 - 5.1Multiple Adults, with Children 34 - 9.8Children Only 4 - 1.2Total 346 - 100.0
Mixed Permanent Resident Alien Units
Single Adult, No Children 0 0.0 0.0
Multiple Adults, No ChildrenMarried couple 20 62.6 3.3PR head with citizen adult child 5 15.5 0.8Citizen head with PR adult child 1 4.6 0.2Other 6 17.3 0.9Subtotal 32 100.0 5.2
Single Adult, with ChildrenPR head with citizen child 308 86.9 50.3PR head with citizen child and PR child 34 9.6 5.6Other 12 3.4 2.0Subtotal 354 100.0 57.9
Multiple Adults, with Children, No Other RelativesMarried couple (citizen and PR) with citizen child 85 39.2 13.8Married couple (both PRs) with citizen child 64 29.8 10.5Married couple (both PRs) with citizen child and PR child 31 14.4 5.1Other 36 16.5 5.8Subtotal 216 100.0 35.2
Multiple Adults, with Children, Other Relatives PresentMarried couple (both PRs) with citizen child, other relative 2 29.0 0.3Citizen head, citizen child, PR other relative 2 27.0 0.3PR head, citizen child, PR other relative 1 15.9 0.2Other 2 28.0 0.3Subtotal 7 100.0 1.1
Children Only 3 - 0.6
Total 612 - 100.0
Average Permanent Resident Unit Size = 3.0
SOURCE: Fiscal Year 1995 QC DatabaseNOTE: PR = permanent resident alien All estimates reflect an average month in 1995.
41
units. Half of all mixed units are a single permanent resident alien parent living with a citizen child.
Only 1 percent of permanent resident alien units with children contain other relatives. Fifty-five
percent of all units with permanent resident aliens contain children that are U.S. citizens. Thirty-six
percent of all units with permanent resident aliens contain only permanent resident aliens (Table
III.10). Of these “pure” units, 66 percent contain a single adult with no children. Approximately 84
percent of pure units have no children in the unit.
The average size of units with permanent resident aliens is 3.0. Twenty-six percent of all units
with permanent resident aliens contain a married couple with children, while 41 percent contain a
single parent with children. Sixty-six percent of all units with permanent resident aliens have children
in the unit and 38 percent have pre-school age children (Table III.11).
Twenty-two percent of units with permanent resident aliens have an elderly member, nine percent
have a disabled member, and 24 percent have either an elderly or a disabled member (Table III.11).
Most (71 percent) adult permanent resident aliens are not employed; six percent are classified as
unemployed; and 19 percent are employed.
3. Income Characteristics
Almost one-third (30 percent) of all permanent resident alien units have earned income (Table
III.12). The average monthly value of the earned income is $747. Eighty-eight percent of all
permanent resident alien units have unearned income. The average monthly value of the unearned
income to these units is $457. Forty percent of permanent resident alien units receive AFDC income,
and 49 percent receive either AFDC or General Assistance (GA) income. The average monthly AFDC
benefit received is $513. SSI income is received in 21 percent of the units with permanent resident
aliens. The average monthly SSI benefit is $432.

TABLE III.11
SIZE AND COMPOSITION OF FSP UNITS WITH PERMANENT RESIDENT ALIENS AND DISTRIBUTION OF PERMANENTRESIDENT ALIEN FSP PARTICIPANTS BY EDUCATION LEVEL AND EMPLOYMENT STATUS
AverageGross Income
Number Gross Monthly as a Percent Net Monthly Monthly FSPDemographic Characteristic (000s) Percent Income ($) of Poverty Income ($) Benefit
Unit Size1 230 24.0 406 66.0 179 872 209 21.9 551 67.1 308 1393 184 19.2 632 61.4 353 2154 167 17.4 811 65.7 482 2555 83 8.7 929 64.5 576 2976+ 85 8.9 1,086 61.6 792 374Total 958 100.0 662 61.9 353 172
Unit CompositionUnits with Preschool-Aged Children (Age 0-4) 362 37.8 617 53.9 385 243Units with Children Age 5 to 17 485 50.6 679 57.6 435 247Total Units with Children 636 66.4 628 56.2 394 233Units with Elderly 212 22.1 558 81.5 327 68Units with Disabled 87 9.1 655 78.3 421 105Units with Elderly or Disabled 226 23.6 585 78.7 350 87
Education Level of All Adult (Age>=18) Permanent Resident AliensNone 36 3.1 727 59.1 444 229Grades 1-8 112 9.5 751 64.5 463 202Grades 9-11 65 5.5 679 57.3 376 244HS Graduate or GED 79 6.7 659 58.5 368 222Some College, Incl. Graduate of 2 Year College 29 2.5 500 47.2 246 198College Graduate 9 0.8 820 75.4 400 197Unknown 839 71.8 645 62.6 340 200Total 1,169 100.0 689 61.4 384 222
Employment Status of All Adult (Age>=18) Permanent Resident AliensEmployed, Full Time 83 7.1 1,142 86.1 702 217Employed, Part Time 104 8.9 785 70.1 431 201Employed, Hours Unspecified 22 1.9 678 62.8 313 233Primarily Self Employed, Non Farming 12 1.0 705 61.2 339 260Employed, Other 1 0.1 1,050 74.9 706 258Unemployed 73 6.2 553 49.5 319 227Not Employed 824 70.5 608 59.2 326 203Unknown 3 0.3 415 45.1 117 195Missing 45 3.9 538 65.3 217 156Total 1,169 100.0 689 61.4 384 222
Average Permanent Resident Unit Size = 3.0
SOURCE: Fiscal Year 1995 QC DatabaseNOTE: All estimates reflect an average month in 1995.
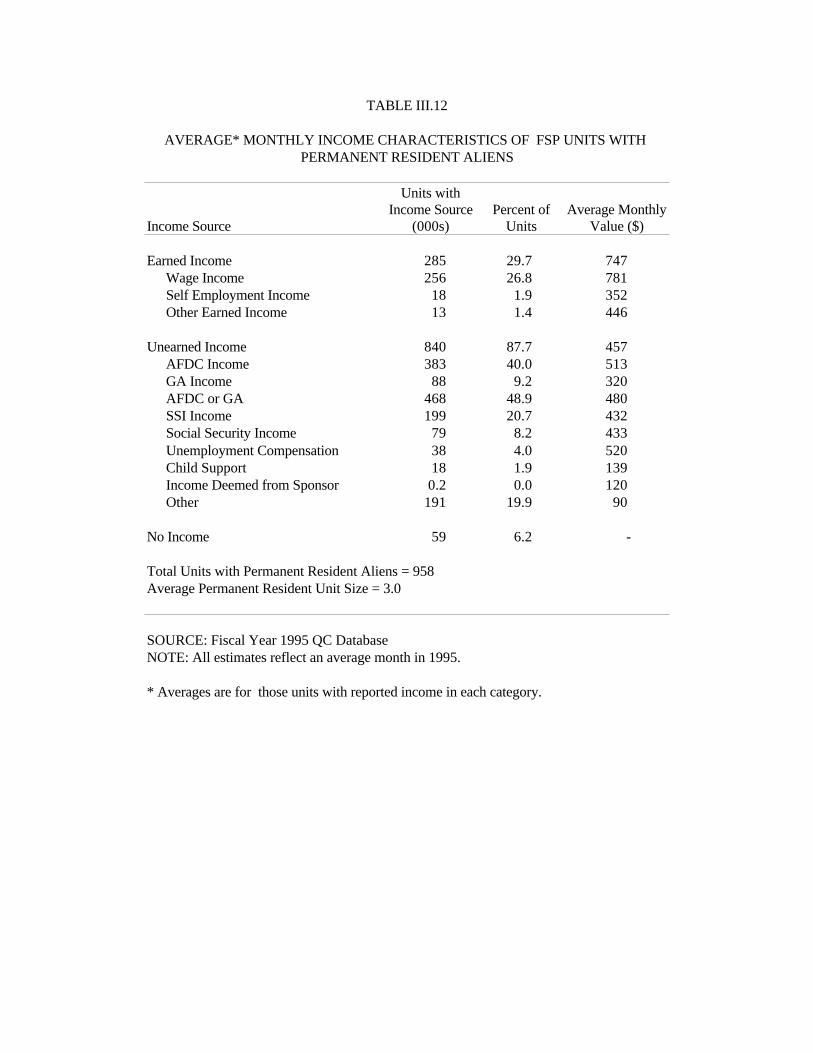
TABLE III.12
AVERAGE* MONTHLY INCOME CHARACTERISTICS OF FSP UNITS WITH PERMANENT RESIDENT ALIENS
Income Source
Units withIncome Source
(000s)Percent of
UnitsAverage Monthly
Value ($)
Earned Income 285 29.7 747Wage Income 256 26.8 781Self Employment Income 18 1.9 352Other Earned Income 13 1.4 446
Unearned Income 840 87.7 457AFDC Income 383 40.0 513GA Income 88 9.2 320AFDC or GA 468 48.9 480SSI Income 199 20.7 432Social Security Income 79 8.2 433Unemployment Compensation 38 4.0 520Child Support 18 1.9 139Income Deemed from Sponsor 0.2 0.0 120Other 191 19.9 90
No Income 59 6.2 -
Total Units with Permanent Resident Aliens = 958Average Permanent Resident Unit Size = 3.0
SOURCE: Fiscal Year 1995 QC DatabaseNOTE: All estimates reflect an average month in 1995.
* Averages are for those units with reported income in each category.
44
In California, a state with 30 percent of the permanent resident alien FSP units, 65 percent of
permanent resident alien units have AFDC income (Table III.13). This compares with 42 percent in
New York, 23 percent in Florida and 12 percent in Texas. In Texas, 57 percent of the permanent
resident aliens have some earned income, compared with 30 percent for the nation as a whole.
The majority (71 percent) of units with permanent resident aliens have gross income under 75
percent of the poverty level (Table III.14). Ninety-two percent of permanent resident alien units have
gross income under 100 percent of the poverty level. A substantial number of permanent resident
alien units (78 percent) have no reported assets (Table III.15). This is consistent with all food stamp
units; 76 percent of all units have no reported assets. Of the permanent resident alien units with
reported assets, 72 percent have assets of $500 or less.

TABLE III.13
DISTRIBUTION OF PERMANENT RESIDENT ALIEN UNITS WITH INCOME FROM AFDC,INCOME FROM SSI, AND EARNED INCOME BY SELECTED STATES
AFDC Income SSI Income Earned IncomePercent of Percent of State Percent of Percent of State Percent of Percent of State
Number Units with Perm. Res. Number Units with Perm. Res. Number Units with Perm. Res.State (000s) AFDC Income Alien Units (000s) SSI Income Alien Units (000s) Earned Income Alien Units
California 186 48.4 65.4 0 0.0 0.0 92 32.4 32.4Florida 22 5.7 23.2 46 23.3 49.3 19 6.8 20.7New York 79 20.5 41.8 53 26.4 27.9 27 9.5 14.3Texas 19 5.0 12.2 26 12.9 16.3 89 31.4 57.0All Other States 78 20.4 15.1 74 37.4 14.3 57 19.9 10.9
Total 383 100.0 40.0 199 100.0 20.7 285 100.0 29.7
Average Permanent Resident Unit Size = 3.0
SOURCE: Fiscal Year 1995 QC DatabaseNOTE: All estimates reflect an average month in 1995.

TABLE III.14
DISTRIBUTION OF UNITS BY GROSS INCOME AS A PERCENT OF POVERTY FOR ALL UNITS AND UNITS WITH PERMANENT RESIDENT ALIENS
All FSP Units Units with AliensGross Income as a Cumulative CumulativePercent of Poverty Number Percent Percent Number Percent Percent
0-10 1,176 10.8 10.8 63 6.6 6.611-25 789 7.3 18.1 37 3.9 10.526-50 2,613 24.0 42.1 181 18.9 29.451-75 2,952 27.1 69.2 395 41.2 70.676-100 2,426 22.3 91.5 202 21.1 91.8101-115 587 5.4 96.9 45 4.7 96.4116-130 286 2.6 99.5 29 3.0 99.5>130 54 0.5 100.0 5 0.5 100.0
Total 10,883 100.0 - 958 100.0 -
Average Permanent Resident Unit Size = 3.0
SOURCE: Fiscal Year 1995 QC DatabaseNOTE: All estimates reflect an average month in 1995.
* Poverty equals FSP net income screen.

TABLE III.15
DISTRIBUTION OF UNITS BY VALUE OF UNIT ASSETS FOR ALL UNITSAND UNITS WITH PERMANENT RESIDENT ALIENS
All FSP Units Units with AliensCumulative Cumulative
Unit Assets Number Percent Percent Number Percent Percent
0 8,295 76.2 76.2 745 77.8 77.81-100 1,173 10.8 87.0 79 8.2 86.0101-200 294 2.7 89.7 25 2.6 88.6201-300 200 1.8 91.5 21 2.2 90.7301-400 152 1.4 92.9 18 1.8 92.6401-500 144 1.3 94.3 10 1.1 93.6501-1,000 340 3.1 97.4 36 3.7 97.41,001-1,500 137 1.3 98.6 10 1.1 98.41,501-2,000 86 0.8 99.4 11 1.1 99.62,001-3,000 29 0.3 99.7 1 0.1 99.73,001+ 4 0.0 99.7 0 0.0 99.7Missing 28 0.3 100.0 3 0.3 100.0
Total 10,883 100.0 - 958 100.0 -
Average Permanent Resident Unit Size = 3.0
SOURCE: Fiscal Year 1995 QC DatabaseNOTE: All estimates reflect an average month in 1995.