
Characterising group-cycling journeys using interactive...
24
This is a repository copy of Characterising group-cycling journeys using interactive graphics. White Rose Research Online URL for this paper: http://eprints.whiterose.ac.uk/123933/ Version: Accepted Version Article: Beecham, R orcid.org/0000-0001-8563-7251 and Wood, J (2014) Characterising group-cycling journeys using interactive graphics. Transportation Research Part C: Emerging Technologies, 47 (P2). P2. pp. 194-206. ISSN 0968-090X https://doi.org/10.1016/j.trc.2014.03.007 (c) 2014 Elsevier Ltd. Licensed under the Creative Commons Attribution-Non Commercial No Derivatives 4.0 International License (https://creativecommons.org/licenses/by-nc-nd/4.0/). [email protected] https://eprints.whiterose.ac.uk/ Reuse This article is distributed under the terms of the Creative Commons Attribution-NonCommercial-NoDerivs (CC BY-NC-ND) licence. This licence only allows you to download this work and share it with others as long as you credit the authors, but you can’t change the article in any way or use it commercially. More information and the full terms of the licence here: https://creativecommons.org/licenses/ Takedown If you consider content in White Rose Research Online to be in breach of UK law, please notify us by emailing [email protected] including the URL of the record and the reason for the withdrawal request.
Transcript of Characterising group-cycling journeys using interactive...
This is a repository copy of Characterising group-cycling journeys using interactive graphics.
White Rose Research Online URL for this paper:http://eprints.whiterose.ac.uk/123933/
Version: Accepted Version
Article:
Beecham, R orcid.org/0000-0001-8563-7251 and Wood, J (2014) Characterising group-cycling journeys using interactive graphics. Transportation Research Part C: Emerging Technologies, 47 (P2). P2. pp. 194-206. ISSN 0968-090X
https://doi.org/10.1016/j.trc.2014.03.007
(c) 2014 Elsevier Ltd. Licensed under the Creative Commons Attribution-Non Commercial No Derivatives 4.0 International License (https://creativecommons.org/licenses/by-nc-nd/4.0/).
[email protected]://eprints.whiterose.ac.uk/
Reuse
This article is distributed under the terms of the Creative Commons Attribution-NonCommercial-NoDerivs (CC BY-NC-ND) licence. This licence only allows you to download this work and share it with others as long as you credit the authors, but you can’t change the article in any way or use it commercially. More information and the full terms of the licence here: https://creativecommons.org/licenses/
Takedown
If you consider content in White Rose Research Online to be in breach of UK law, please notify us by emailing [email protected] including the URL of the record and the reason for the withdrawal request.

Characterising group-cycling journeys using interactive graphics
Beecham, Roger
Wood, Jo
Date accepted in Transport Research Part C: 11th March 2014
Abstract
The group-cycling behaviours of over 16,000 members of the London Cycle Hire Scheme (LCHS), a
large public bikeshare system, are identified and analysed. Group journeys are defined as trips made
by two or more cyclists together in space and time. Detailed insights into group-cycling behaviour
are generated using specifically designed visualization software. We find that in many respects
group-cycle journeys fit an expected pattern of discretionary activity: group journeys are more
likely at weekends, late evenings and lunchtimes; they generally take place within more pleasant
parts of the city; and between individuals apparently known to each other. A separate set of group
activity is found, however, that coincides with commuting peaks and that appears to be imposed
onto LCHS users by the scheme’s design. Studying the characteristics of individuals making group
journeys, we identify a group of less experienced LCHS cyclists that appear to make more spatially
extensive journeys than they would do normally while cycling with others; and that female cyclists
are more likely to make late evening journeys when cycling in groups. For 20% of group cyclists,
the first journey ever made through the LCHS was a group journey; this is particularly surprising
since just 9% of all group cyclists’ journeys are group journeys. Moreover, we find that women
are very significantly (p<0.001) overrepresented amongst these ‘first time group cyclists’. Studying
the bikeshare cyclists, or bikeshare ‘friends’, that individuals make ‘first time group journeys’ with,
we find a significantly high incidence (p<0.001) of group journeys being made with friends of the
opposite gender, and for a very large proportion (55%) of members these first ever journeys are
made with a friend that shares the same postcode. A substantial insight, then, is that group cycling
appears to be a means through which early LCHS usage is initiated.
Keywords: bikeshare schemes; bicycling behaviour; visual analytics.
1
1 Introduction
The many economic, health-related and environmental benefits of cycling have precipitated a grow-
ing academic interest in understanding cycling behaviour, and particularly the factors that moti-
vate and discourage cycling within cities (Pucher & Buehler 2012). Here, researchers have identi-
fied distinct cycling behaviours related to factors such as gender and social demographics (Anable
et al. 2010, Heesch et al. 2012), individuals’ life stages (Bonham & Wilson 2012, Pooley et al. 2011),
more obvious weather-related variables (Thomas et al. 2008) and the nature and provision of cy-
cling infrastructure (Garrard et al. 2008, Dill & Gliebe 2008, Tilahun et al. 2007). Relatively little
research, either observational or attitudinal, has been published on the subject of group cycling’ –
cycling involving more than one person within a limited space and time. Two studies that briefly
discuss the subject found that group cycling might be a means through which to overcome barriers
around safety (Aldred 2012) or to reintroduce adults to cycling after not having cycled since child-
hood (Bonham & Wilson 2012). Both suggest that group cycling might be important, as it is seen
as a means of enabling and motivating cycle behaviour.
In this study, we implement an approach to deriving group-cycling journeys from a comparatively
large behavioural dataset: journeys made by members of the London Cycle Hire Scheme (LCHS),
a large public bikeshare system. Our ambition is to systematically describe group journeys taken
through the LCHS – their nature and spatial-temporal extent. A significant contribution will be to
determine whether certain types of LCHS cyclists are more predisposed to group cycling than oth-
ers, and importantly whether group journeys are different from the journeys those cyclists typically
make. In order to meet these aims, it is necessary to simultaneously consider the spatial, temporal
and demographic circumstances that underpin group-cycling journeys. Following approaches taken
within information visualization, which attempt to identify space-time patterns of group interac-
tions derived from mobile phone logs (Shen & Ma 2008, Eccles et al. 2008, Slingsby et al. 2013),
we develop interactive exploratory interfaces to explore the space-time structure of group-cycling
journeys. A secondary contribution is the application of such techniques to this novel research area.
In the first half of the paper we explain the dataset, our approach to processing group journeys and
our design and use of exploratory visualization software. In the second, a discussion of findings is
structured around four research questions:
1. Where are group-cycling journeys, when are they made and who makes them?
2. Are there different types of group-cycling journeys and cyclists?
3. To what extent are group journeys different from the journeys that cyclists typically make?
4. To what extent is group cycling a means through which individuals are introduced to the LCHS?
To our knowledge this is the first large-scale study of group-cycle behaviours, either observational
or survey based. It should be noted, however, that we only make inferences about group-cycling
behaviour through mining LCHS usage records. In addition, our analysis misses a particular type of
LCHS usage. To access LCHS bicycles, it is possible to either join the scheme as a formal member,
2

or to pay on the day of travel as a ‘casual’ user. Casual users generally make around 35% of all
LCHS journeys. We have a limited set of information on casual users and we do not identify their
group behaviours, or group journeys made between members and casual users. Nor do we examine
the group-cycling behaviour of LCHS cyclists and ‘regular’, non-bikeshare cyclists .
2 Related work
2.1 Group or social cycling research
As yet there is very little academic research that focuses substantively on group cycling. Two small-
scale case studies that briefly discuss the subject found that respondents reported greater feelings
of safety when cycling within groups (Aldred 2012), and that for a small sample of female cyclists,
group or social cycling was a motivation for returning to cycling (Bonham & Wilson 2012). Whilst
it would be possible to study group-cycling behaviour in more detail using travel surveys, one
reason for the lack of large-scale observational research into the subject may be data availability.
Typically in data-driven studies, cycle behaviours are observed by recruiting a small number of
self-selected participants and monitoring their travel behaviours over a determinate period of time
using GPS (Dill & Gliebe 2008). In order for group-cycling behaviours to be measured using such
means, entire social networks would need to be recruited, which would likely be problematic.
Despite the lack of existing research, there is a growing sub-discipline of work focussing particularly
on urban cycling that is of relevance to this study. For example, a well-documented barrier to
cycling within cities is that of personal safety (Jacobsen 2003). In his 2003 study, titled ‘Safety
in Numbers’, Jacobsen (2003) finds that collision rates involving walkers and cyclists actually
decline as the number of people walking and cycling in an area increases. It is unlikely that those
walking or cycling exercise greater caution towards motor vehicles when there are many other
walkers or cyclists in an area, and Jacobsen (2003) argues that it is motorists’ behaviours that are
moderated by the increased number of pedestrians or cyclists. It is perhaps reasonable to assume
that Jacobsen’s (2003) ‘Safety in Numbers’ thesis also applies to group cycling: group journeys are
likely to be more visible than journeys made independently, and by extension group journeys may
be materially safer than non-group journeys. That the bicycles available through the LCHS are
arguably iconic and conspicuous, it might be argued that groups of LCHS bikes moving around
London simultaneously may represent a special case of the ‘Safety in Numbers’ thesis.
Whilst the real safety of cyclists is clearly important, fears about personal safety and cycling
actively affect decision-making processes. Importantly, these fears are not experienced evenly across
demographic groups (Garrard et al. 2012). Concerns about cycling safety have been found to be
a greater constraint for women than men (Garrard et al. 2012). In the context of the LCHS,
existing research into male and female scheme usage has found that women are underrepresented
amongst LCHS members, and that those women that do make journeys tend to preferentially
select parts of the city generally associated with greater levels of safety (Beecham & Wood 2014).
3
Following (Aldred 2012), we speculate that group cycling may positively influence the perceptions
of individual LCHS members, and subsequently their cycling behaviours. Although it is difficult to
make strong inferences about group cycling’s impact, it will certainly be important to distinguish
between the group journeys and non-group journeys of male and female LCHS members, as well as
members who are typically less extensive scheme users.
2.2 Data-driven approaches to analysing group relationships
The term ‘reality mining’ has been used to describe a growing class of work whereby sensor data
are used to research how humans interact with each other and their environment. Our approach to
inferring group-cycling behaviours from a large observational dataset shares some similarities with
this work. Studying detailed data collected from mobile phone logs, for instance, Min et al. (2013)
derive and separate social contact behaviours that are between family, colleagues and friends, and
Do & Gartica-Perez (2013) propose a model that aims to uncover interaction types based on known
individuals’ proximity, phone and e-mail contacts. Of greater relevance to this study, Ythier et al.
(2013) analyse a comprehensive set of smartphone data to extract information on the travel, activity
locations, personal characteristics and social communication behaviours of study participants. The
authors find that an individual’s social network, socio-economic characteristics and communication
activities may influence their travel behaviour. For instance, study participants who contacted each
other before or whilst travelling share similar travel behaviours, and there is an association between
contact intensity and travel intensity (Ythier et al. 2013).
Since it is group-cycle journeys that are the focus of this study, we are interested in the ways in
which group behaviours are expressed spatially and temporally. Studies with such a focus have
used techniques from information visualization to explore and describe space-time patterns of so-
cial interaction. GeoTime is a visual analysis tool which aims to track events, objects, activities
and interactions of individuals (Kapler & Wright 2005). The software combines highly interactive
spatial and temporal views, with further drill-down information, as well as thematic summaries.
Mobivis (Shen & Ma 2008) uses mobile phone data collected from a small, known network of uni-
versity staff and students with the aim of discovering social-spatial information exchanges. Spatial
interactions between indviduals are partially represented using node-link diagrams and a temporal
view is designed such that the cyclical nature of interactions is emphasised (Shen & Ma 2008).
Also, Slingsby et al. (2013) use linked temporal, spatial, demographic and social matrix views to
discover and characterise communication behaviours from the smartphone logs of a small sample
of participants. Slingsby et al.’s (2013) work enables a study-wide view of contact behaviours to
be summarised within a social network matrix. Through interaction, these behaviours are located
over space-time and linked to known demographic characteristics of individuals. As well as a global
view of social interctions, then, relationships between individuals are explored in detail.
The principal objective of our study is a global view of group-cycling behaviours: to describe where
and when distinct group-cycling behaviours take place and who makes these various journeys. This
4
objective is expressed in RQ1, RQ2, RQ4, and partially in RQ3. In RQ3, we consider the extent to
which group-cycling behaviours are different from the journeys a member typically makes. Whilst
we propose a technique for systematically identifying these differences, we also aim to qualitatively
evaluate the nature of individual members’ group-cycling journeys and relationships with other
bikeshare members. In terms of visualization design, and following Slingsby et al. (2013), this
means creating a system that can support the identification of global patterns of group-cycling
behaviour, as well as the querying of individual cyclists.
3 Dataset, data processing and (visual) analysis
3.1 Dataset
Two datasets from the LCHS have been supplied for use in this research. The first is a full customer
database where, for every customer registering with the LCHS, their gender, full postcode and date
they registered are stored. The second is a full set of journey records. Here, for every journey
made, the docking station that journey started and finished at, along with associated timestamps
is recorded. The two datasets can be linked, and therefore individual members linked to their
journeys, with a unique customer identifier that appears in both datasets.
The LCHS launched on 30th June 2010 and we have obtained usage data running from this date
through to 14th September 2012. This amounts to over 11 million member journeys. In identifying
group-cycle journeys we consider the complete history of members’ journeys over this period. How-
ever, when presenting findings, we only discuss the ca.83,000 valid members who made journeys
within the most recent 12 months between 14th September 2011 and 14th September 2012.
3.2 Geodemographic and behavioural variables
Our aim is to describe in detail group cyclists and their journeys. Although the two usage datasets
available to us are comprehensive, we create a set of derived and precomputed variables that usefully
augment the LCHS datasets, and which are crucial to the group-cycling behaviours elicited in
section 4. Some are relatively straight-forward and entail leveraging external datasets, others are
more analytically involved, requiring mining of the LCHS usage data.
Firstly, the postcode variable in the customer database represents the address members’ payment
cards are registered to, and is the address to which access keys are mailed when members initially
register. We speculate that this address is a member’s home, but recognise that in some cases
individuals may pay with a work card and address, or that their card may be registered to an
address where they no longer live permanently. Assuming that it does represent a current home
address, we link the postcode variable to two freely available geo-demographic classifiers: the 2001
Census Output Area Classification (Vickers & Rees 2006) and the Indices of Multiple Deprivation
(IMD) (Department for Communities and Local Government 2011). As well as their gender, we
5
therefore have some indication of the types of communities members apparently live in.
Previous analysis of LCHS usage data has found very distinct spatial usage behaviours associated
with specific times of day and days of the week (Lathia et al. 2012, Wood et al. 2011). These usage
behaviours have also been found to be specific to particular types of LCHS members (Beecham
& Wood 2014). Our behavioural classification therefore attempts to automatically identify and
summarise groups of members who use the LCHS in particular ways – at particular times of day.
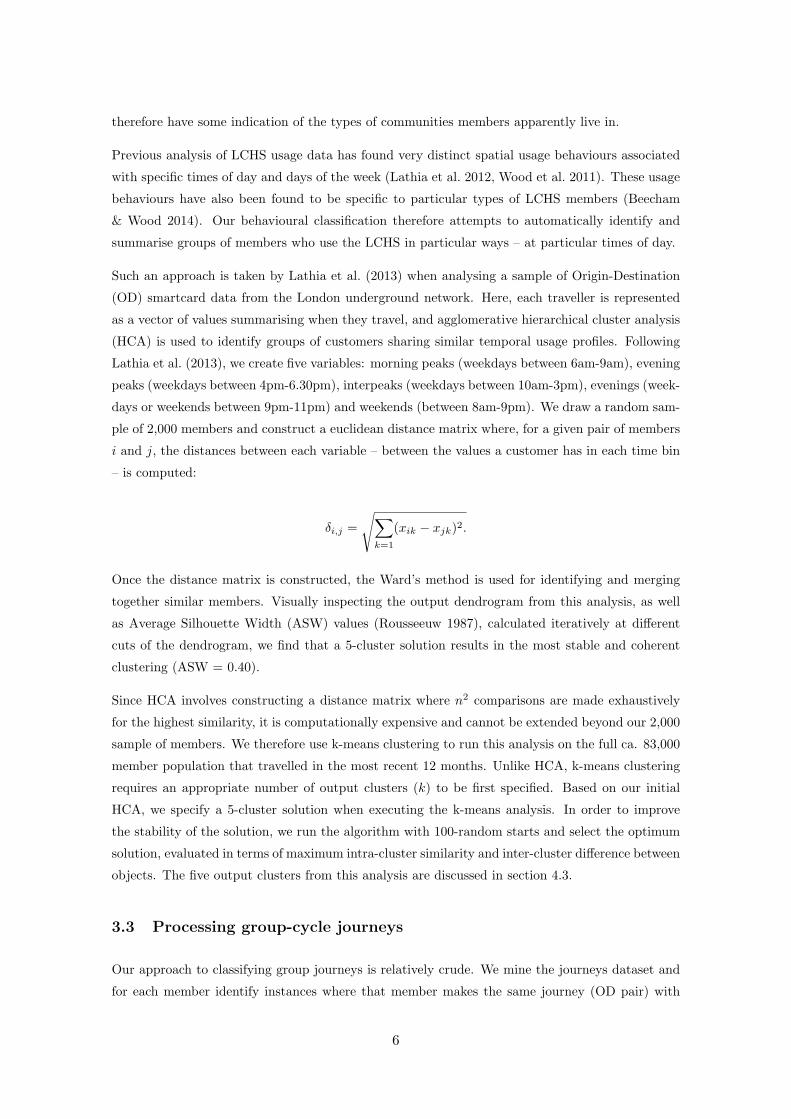
Such an approach is taken by Lathia et al. (2013) when analysing a sample of Origin-Destination
(OD) smartcard data from the London underground network. Here, each traveller is represented
as a vector of values summarising when they travel, and agglomerative hierarchical cluster analysis
(HCA) is used to identify groups of customers sharing similar temporal usage profiles. Following
Lathia et al. (2013), we create five variables: morning peaks (weekdays between 6am-9am), evening
peaks (weekdays between 4pm-6.30pm), interpeaks (weekdays between 10am-3pm), evenings (week-
days or weekends between 9pm-11pm) and weekends (between 8am-9pm). We draw a random sam-
ple of 2,000 members and construct a euclidean distance matrix where, for a given pair of members
i and j, the distances between each variable – between the values a customer has in each time bin
– is computed:
δi,j =
s
X
k=1
(xik − xjk)2.
Once the distance matrix is constructed, the Ward’s method is used for identifying and merging
together similar members. Visually inspecting the output dendrogram from this analysis, as well
as Average Silhouette Width (ASW) values (Rousseeuw 1987), calculated iteratively at different
cuts of the dendrogram, we find that a 5-cluster solution results in the most stable and coherent
clustering (ASW = 0.40).
Since HCA involves constructing a distance matrix where n2 comparisons are made exhaustively
for the highest similarity, it is computationally expensive and cannot be extended beyond our 2,000
sample of members. We therefore use k-means clustering to run this analysis on the full ca. 83,000
member population that travelled in the most recent 12 months. Unlike HCA, k-means clustering
requires an appropriate number of output clusters (k) to be first specified. Based on our initial
HCA, we specify a 5-cluster solution when executing the k-means analysis. In order to improve
the stability of the solution, we run the algorithm with 100-random starts and select the optimum
solution, evaluated in terms of maximum intra-cluster similarity and inter-cluster difference between
objects. The five output clusters from this analysis are discussed in section 4.3.
3.3 Processing group-cycle journeys
Our approach to classifying group journeys is relatively crude. We mine the journeys dataset and
for each member identify instances where that member makes the same journey (OD pair) with
6

another member at the same time. We use a two-minute window to allow for slight variations
in both releasing and docking bikes at a journey’s origin and destination. If this ‘same journey’
happens with a pair of members on more than one occasion, we define those members as bikeshare
‘friends’ and all same journeys that occur between the two members as group journeys.
There are problems associated with this approach. By imposing an exact match on origin and
destination, we necessarily exclude occasions where members cycle with other members for a section
of their journey. Whilst it might be possible to relax this rule and test only for matching origin
station and time, this would lead to greater uncertainty around whether or not journeys are indeed
made together, and we would perhaps need to impose firmer rules on the frequency of these events
happening between pairs of members. Similarly, a fixed two-minute window may exclude group
journeys where, for various reasons, one member takes substantially longer to dock or undock their
bike. Clearly the reverse may also be true: that even with relatively strict rules for defining group
journeys, two individuals making exactly the same journey on more than one occasion may not be
known to one another. We certainly expect this to be the case to some extent. However, since
in our classification a pair of members must make exactly the same journey (within a two-minute
window), we might assume they take the same route, and therefore cycle together.
Running this analysis on the ca.83,000 members that made journeys in our 12-month study period,
we find that just under 20% make group journeys, and that group journeys represent 3% of all 5.05
million journeys. For most members, there is relatively little variation in the size of their group-
cycling networks, or the amount of group cycling that members engage in. Ordering members
according to the number of bikeshare ‘friends’ they have (blue), and group journeys they make
(grey), reveals a power-law distribution that commonly exists in social networks (Barabsi & Albert
1999). The majority of cyclists (80%) making group journeys do so with just one other friend, and
74% make less than 10 group journeys. Calculating the scale-free exponent (γ) from the two curves
using the maximum likelihood method, the resulting γ for the number of group journeys made per
member is 2.4, and for the number of friends group-cycling members have is 2.0. A high value for
γ, as we find here, suggests a very concentrated network. The probability of finding members with
a large number of ‘friends’ or making a large number of group journeys is small.
7

Figure 1: Members are ranked according to the number of bikeshare friends they have and group journeys theyhave made.
Clearly the group-cycling behaviours that we explore in this study are only inferred through
analysing LCHS journeys, and the possible explanations behind behaviours are informed specu-
lations. One means of validating the group-cycling classification, and any hypotheses about mo-
tivations behind group cycling, might be to recruit a sample of LCHS cyclists and ask them to
recall their usage of the scheme. Aside from the fact that such travel surveys would be difficult to
administer, with recall bias perhaps the greatest concern, at present it would not be possible to
link surveyed customers with their LCHS usage records for reasons of data privacy.
3.4 Visualization design
A substantive element of this work is a description of group-cycle behaviours that is both detailed
and large-scale. In RQ1 and RQ2 we wish to characterise various types of group-cycling journeys.
An important component is also to explore whether particular types of members are predisposed
to group cycling, or predisposed to making particular group-cycle journeys. As discussed in section
2.2, these aims are analogous to earlier work by Slingsby et al. (2013). Here the authors develop
visualization software that enables social communications to be explored spatially, temporally and
by demographic and behavioural category.
The first set of software we use to analyse group-cycle behaviours is pre-existing (Figure 2), and
was developed for early exploratory analysis (Beecham & Wood 2014). As with Slingsby et al.
(2013), we create three fully linked views. In the map view, the spatial structure of journeys is
depicted by drawing lines between origin-destination pairs. Following (Wood et al. 2011), we use
Bezier curves that are asymmetric; the straight end represents journey origin and the curved end,
journey destination. The most common flows are made more salient by weighting journey lines
8
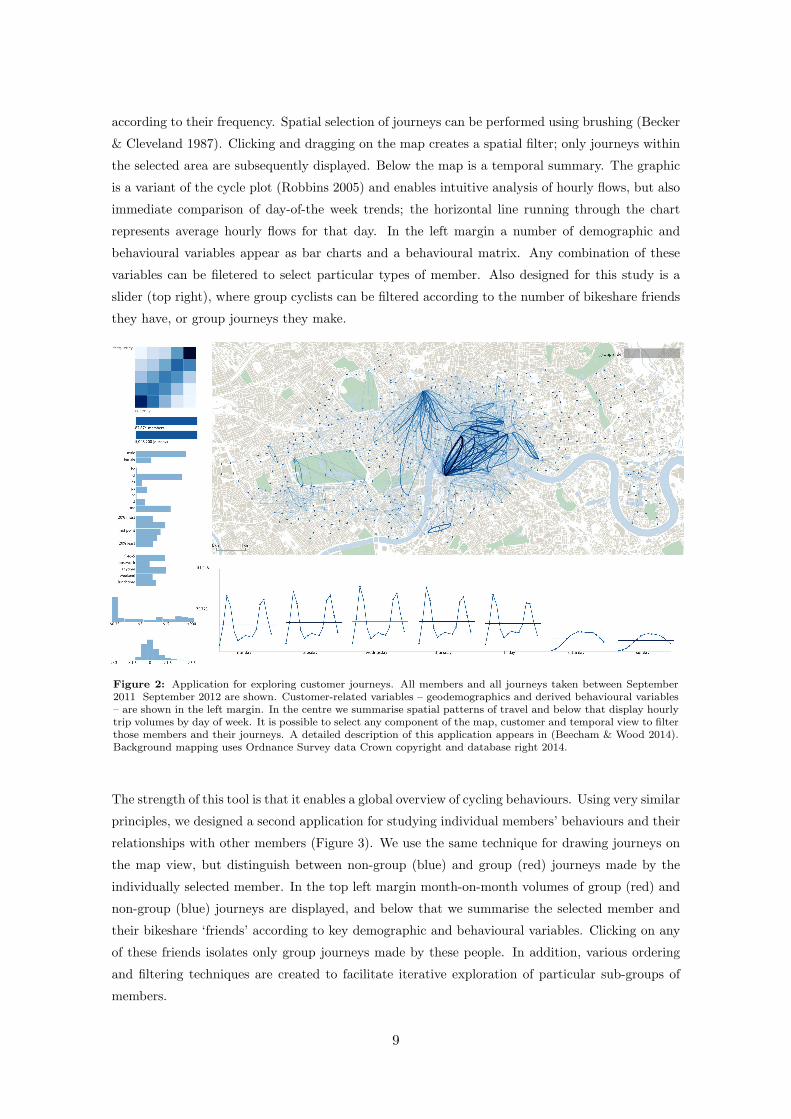
according to their frequency. Spatial selection of journeys can be performed using brushing (Becker
& Cleveland 1987). Clicking and dragging on the map creates a spatial filter; only journeys within
the selected area are subsequently displayed. Below the map is a temporal summary. The graphic
is a variant of the cycle plot (Robbins 2005) and enables intuitive analysis of hourly flows, but also
immediate comparison of day-of-the week trends; the horizontal line running through the chart
represents average hourly flows for that day. In the left margin a number of demographic and
behavioural variables appear as bar charts and a behavioural matrix. Any combination of these
variables can be filetered to select particular types of member. Also designed for this study is a
slider (top right), where group cyclists can be filtered according to the number of bikeshare friends
they have, or group journeys they make.
Figure 2: Application for exploring customer journeys. All members and all journeys taken between September2011 September 2012 are shown. Customer-related variables – geodemographics and derived behavioural variables– are shown in the left margin. In the centre we summarise spatial patterns of travel and below that display hourlytrip volumes by day of week. It is possible to select any component of the map, customer and temporal view to filterthose members and their journeys. A detailed description of this application appears in (Beecham & Wood 2014).Background mapping uses Ordnance Survey data Crown copyright and database right 2014.
The strength of this tool is that it enables a global overview of cycling behaviours. Using very similar
principles, we designed a second application for studying individual members’ behaviours and their
relationships with other members (Figure 3). We use the same technique for drawing journeys on
the map view, but distinguish between non-group (blue) and group (red) journeys made by the
individually selected member. In the top left margin month-on-month volumes of group (red) and
non-group (blue) journeys are displayed, and below that we summarise the selected member and
their bikeshare ‘friends’ according to key demographic and behavioural variables. Clicking on any
of these friends isolates only group journeys made by these people. In addition, various ordering
and filtering techniques are created to facilitate iterative exploration of particular sub-groups of
members.
9

Figure 3: A single member is selected and their group and non-group journeys summarised. To preserve customers’anonymity, data for a fictional member and their (bikeshare) social network are generated and displayed here.Background mapping uses Ordnance Survey data Crown copyright and database right 2014.
4 Findings
Figure 4 is a summary of the spatial and temporal structure of group-cycling journeys. Displayed in
grey is the relative number of journeys by hour and day of week made in the period 14th September
2011 – 14th September 2012. In blue is the same summary showing only group journeys. Studying
the timeline view we immediately find that the temporal profile of group journeys is very distinct.
Compared to total LCHS usage, where 16% of journeys take place at weekends, weekends account for
a very large portion (48%) of group-cycling journeys. In addition, a significantly greater proportion
(p<0.001) of journeys take place late during Friday and Saturday evenings (between 8pm and 2am):
6% of group journeys happen during Friday and Saturday evening, whilst this figure for all journeys
is 2%. The corollary is that significantly fewer (p<0.001) journeys take place during commuting
peaks: 58% for all journeys and 32% for group journeys.
Studying the spatial structure of group journeys, London’s parks appear to be a focus of group-
cycling activity. A number of journeys can also be found south of the River Thames, within central
London and extending east. A very dominant spatial pattern is of journeys between Waterloo
rail station and Holborn in central London (labelled in Figure 4), where many workplaces, rather
than shops and other facilities in London, are located. Selecting these journeys by performing
a spatial filter on the map, a large number coincide with particularly weekday morning peaks.
Half of all group-cycling journeys within this region take place between 6am-10am on weekday
mornings, whilst this figure for all journeys is just 32%. The reverse is true when only journeys
within London’s parks are selected: the weekends become especially dominant. Selecting on group
10

journeys that take place within central London itself, we find peaks that coincide with commuting
hours, but also that lunchtime journeys become particularly prominent towards the end of the
working week.
Figure 4: Map view: journey lines are weighted according to number of members making journeys. The LCHS’sthree hub stations, two of which located at major rail terminals (King’s Cross and Waterloo), but also in centralLondon (Holborn), are labelled. Temporal view: group journeys appear in blue; all journeys made by the memberpopulation are grey. Background mapping uses Ordnance Survey data Crown copyright and database right 2014.
In Figure 5, a demographic and behavioural summary of group cyclists is provided. Compared with
the total member population, women, frequent and recent scheme users and members living in City
Living communities, generally affluent inner-city areas, are significantly overrepresented (p<0.001)
amongst group cyclists. Given the spatio-temporal pattern of group-cycle journeys in the previous
figure it is not surprising that the cluster group weekenders are overrepresented (p<0.001). We also
find, however, that a large portion of group cyclists (29%) are 9-to-5 ers, a group that typically
uses the scheme for commuting purposes.
11

Figure 5: Demographic and behavioural profile of group cyclists. From the left: gender, level of usage based on aRecency-Frequency analysis (Beecham & Wood 2014), Output Area Classification groupings (Vickers & Rees 2006)and temporal cluster membership (section 3.2). Significance testing: contingency tables using the Pearson’s chi-square test statistic are used to test for equality of proportions between group cyclists and all members. Standardizedresiduals are used to identify the specific categories – for example, individual OAC groupings – that contribute mostto the overall chi-square model. They are effectively z-scores, and can be used to assess category-level significance(Field 2009). Significant differences are reported at p<0.01 (z-score = +/-2.58) and p <0.001 (z-score = +/-3.29).
4.1 RQ2 Are there different types of group-cycling journeys and mem-
bers?
In some respects, the spatial and temporal structure of group-cycle journeys meets our expectations:
the weekends, parks and lunchtimes are a focus of group-cycling activity. However, there is evidence
suggesting a variety of group-cycling behaviours. For example, almost a third of all group journeys
still coincide with commuting peaks, and the main commuter cluster group, 9-to-5 ers, make up a
large portion of group cyclists. Studying these cluster groupings, and the spatial-temporal structure
of their journeys, is a useful means of characterising such varying behaviours.
Weekenders are a relatively small group of members (15% of the total member population) typically
living within the London area, but who use the LCHS infrequently. Over a quarter of weekenders
(26%) are group cyclists, significantly greater (p<0.001) than for the total member population
(20%). Perhaps as expected, weekenders’ group-cycling journeys are very concentrated within
weekend times (Figure 6) and spatially within London’s parks and along the River Thames. A
noticeable difference between all journeys made by weekenders and those journeys that are group
journeys, however, is that group journeys appear more spatially extensive. Significant numbers
extend east, as well as along the north and south sides of the river. When selecting non-group
journeys made by weekenders, however, an extremely dominant pattern is of journeys within Hyde
Park (labelled in Figure 4). This suggests that, when cycling in groups, weekenders generally make
a more diverse set of journeys. One way of partially testing this finding quantitatively is to calculate
the number of unique journeys, unique OD pair combinations, taken by weekenders. We find that
whilst 32% of non-group journeys taken by weekenders are unique, this figure for group journeys
12

is 55%, perhaps suggesting that group journeys for weekenders are indeed more diverse than their
typical journeys. In terms of demographics, women are significantly overrepresented (p< 0.001)
amongst the weekenders who are also group cyclists; they constitute 31% of all weekenders, but
45% of group-cycling weekenders.
9-to-5 ers and postworkers together constitute 40% of the total member population. The groups
consist of heavy (in the case of 9-to-5 ers) and occasional (in the case of postworkers) commuters,
often living outside of London. Comparing group journeys with all journeys that these groups
typically make, we find that a significantly greater number (p<0.001) of group journeys coincide
with weekends (Figure 6). At the same time, however, group journeys for these people do take
place during commuting peaks. In fact group-cycle journeys are even more concentrated within
commuting times for post-workers than all journeys taken by these members (Figure 6). Studying
the spatial patterns of these journeys, the hub stations tend to occupy a large proportion of peak-
time group-cycling activity. Journeys either starting or finishing at hub stations comprise 49% of all
peak-time group journeys made by 9-to-5 ers, whereas for all 9-to5 ers, hub stations only account
for 14% of these journeys. Hubs are generally larger docking stations located at areas associated
with high volumes of commuting activity. They are placed at two major rail terminals, Kings
Cross and Waterloo, and at the intersection of the City of London and central London (Holborn)
(labelled in Figure 4). In order to cope with very high demand at peak times, bikes are continually
replenished at, or withdrawn from, these hub stations.
Anytime users are a large group of members who apparently use the scheme for a variety of purposes.
Over a third (36%) of anytime users are group cyclists. Studying their group journeys, we find
that weekends become particularly prominent, but so too do journeys taken later in the evening
on Fridays and Saturdays (Figure 6). In fact anytime users comprise 60% of all members making
group journeys between 8pm-2am on Fridays and Saturdays. Anytime members are generally more
active scheme users living relatively close to a LCHS docking station, and it perhaps makes sense
that those making group journeys later in the evening fit this profile. We also find, however, that
women are significantly overrepresented (p<0.001) amongst the group members who make these
late evening journeys. Whilst 28% of all group cyclists are women, 33% of group cyclists making late
evening group journeys are women. This is particularly surprising as when we look at all journeys
(both group and non-group) taking place at these times, women are significantly underrepresented
(p<0.001); just 21% of members using the scheme in the late evening are women.
Finally, lunchtime users, who represent 19% of the member population, consist of generally male,
occasional scheme users who live outside the London area. A relatively small proportion (10%)
of these members are group cyclists. Their group journeys coincide with lunchtime hours, but
compared to all journeys taken by this group we observe a noticeable peak on Fridays.
13

Figure 6: Temporal and spatial views of group journeys by cluster membership. Temporal view: all journeys ingrey, group journeys in blue. Map view: non-group journeys are blue, group journeys are red. Journey lines areweighted by the number of members making journeys. Since group cyclists represent just 20% of LCHS members, ifwe were to use the same colour scale to weight group journeys as non-group journeys it would be very difficult makea comparison; non-group journeys would appear very light and transparent in colour. To enable better comparison,colour weightings for group and non-group journeys are therefore scaled independently. Background mapping usesOrdnance Survey data Crown copyright and database right 2014.
14

4.2 RQ3 Are group journeys different from the journeys a member typ-
ically makes?
In the previous section, the cluster groupings served as useful descriptors for identifying different
types of group journeys. This analysis and the temporal profiles displayed in Figure 6 suggest that
differences do exist between the journeys a member typically makes and those that member makes
within a group. Visually exploring members’ group journeys at an individual level enables a detailed
evaluation of these differences. Here we attempt to study the extent to which group journeys differ
at this individual level more systematically by repeating the same clustering procedure used to
define our initial cluster groupings (described in section 3.2), but for group members, only consider
their group-cycling journeys.
Although 20% of members are group cyclists, and therefore a number of objects in this second
cluster analysis were altered, we still find that, when run on a 2,000 sample of members (with a
representative number of group cyclists), a 5-cluster solution produces a relatively well-defined set
of clusters (ASW = 0.42). Inspecting the temporal profile of these cluster groupings (Figure 7), the
same set of labels can be used to describe the output groupings from this ‘clustering with group
cycle replacement’ as with our original cluster analysis. Moreover, of those members who are not
group cyclists, only 2% have switched cluster groupings from the original analysis. This suggests
that a comparison between these two independent analyses can reasonably be made.
15

Figure 7: Box plots summarising the temporal profile of members in each cluster grouping from the two independentanalyses. For each member we express the number of journeys made in each time bin as a percentage of a member’stotal journeys.
Studying the extent to which group journeys are measurably different, then, we find that 48% of
group-cycling members are now in a different cluster grouping than in the original analysis. The
largest shift in membership is in the anytime user group. Sixty-seven percent of anytime users
switched cluster grouping, with 51% now classed as weekenders. We also find a smaller shift with
9-to-5 ers, 23% of which are now classed as weekenders. These differences make intuitive sense, as it
is reasonable to assume that members who use the scheme regularly and for commuting travel would
tend to make a larger proportion of their group-cycling journeys at weekends. It is also logical that
14% of 9-to-5 ers are now classed as postworkers. One might expect work-related group journeys to
take place during the evening rather than the morning peaks, and therefore for a number of 9-to-5
ers to switch in this direction when we filter only their group journeys. Although this analysis
may miss more subtle differences in behaviours, it does provide evidence of the extent to which
individuals’ group-cycling behaviours are measurably different from non-group behaviours.
16
4.3 RQ4 To what extent is group cycling a means through which mem-
bers are introduced to the scheme?
In their study of gender and cycling through the life course, (Bonham & Wilson 2012) find that
group or social cycling is a means through which adult women are reintroduced to cycling. We
speculate that the same might be true of LCHS usage: that members are introduced to the scheme
first through cycling with others. We attempt to find instances where the first ever journey a
member makes is a group journey, and study whether particular types of members are predisposed
to this behaviour. In practice, mining the historical journeys dataset we cannot be absolutely certain
that the first journey appearing in a member’s records is in fact their first ever LCHS journey. As
discussed, in addition to registering as a formal member, cyclists can hire bikes as ‘casual’ users.
Tracking returning casual users is problematic, and we do not identify casual journeys that a
member may have made before formally registering. It should be noted, then, that when we refer
to the first time a member has used the scheme, we only consider the first journey they made as a
member.
In total, this applies to around 20% of all group cyclists. An additional 15% of members made a
group-cycling journey within a week of their first ever journey. A significant finding is that women
are very significantly overrepresented (p<0.001) amongst members whose first journey was a group
journey. Whilst 29% of group cyclists are women, female members represent 48% of all ‘first time
group cyclists’. The scheme’s least active members, those who use the LCHS rarely and who have
not used it recently, are also overrepresented amongst members whose first ever journey was a
group journey (11% of all group cyclists, but 25% of first time group cyclists).
These findings perhaps suggest that, for a particular type of member, group cycling is indeed a
means through which cyclists are introduced to the LCHS. Studying members’ bikeshare ‘friends’
provides further context to these relationships. For each group-cycling member, we identify the
individual they cycle with the most – their ‘best friend’ – and analyse all journeys made with this
best friend. For 87% of members, the first group journey they made, not their first ever journey
as a member, was with this best friend. Since 80% of members have just one bikeshare friend,
we would expect this proportion to be large. However, we find that this is particularly true of
female group cyclists: 85% of male cyclists’ first group journeys were with a best friend, whereas
for women, this proportion is 92% – a significant difference (p<0.001). Returning to our idea of
‘first time group cyclists’, this significant difference (p<0.001) also exists for those members whose
first ever journey is a group journey: 93% of first-time group cyclists’ first journeys were taken with
their best friend, whilst this was the case for 86% of non first-time group cyclists.
Further analysing these best friend relationships, we find that 34% of male group cyclists’ best
friends are women and 84% of female group cyclists’ best friends are men. The relative proba-
bilities of these two events happening, essentially the female-male split of group cyclists, is 29%
and 71% respectively. Since pairs of best friends are not mutually exclusive – a single member has
only one best friend, but that member can be the best friend of any number of other members –
17
we can compare the differences between our observed and these expected values against a bino-
mial distribution. We find that in both cases the difference between the observed and expected
proportions of members having best friends of the opposite gender are very significant (p<0.001,
99% confidence intervals: p(f|m) 82%-85%; p(m|f) 33%-35%). In other words, female members are
more likely to have best friends that are men; and men are more likely to have best friends that
are women. These differences again exist when studying first time group cyclists: 89% of female
first time group cyclists made their first ever journey with a man; and 44% of male first time group
cyclists made their first ever journey with a woman. An additional but relevant point is that a
large proportion (37%) of group cyclists share exactly the same full postcode as their best friend.
Again, this is especially true of first time group cyclists, 55% of which made their first ever journey
with a friend sharing the same postcode.
5 Discussion
Several insights into the group-cycling behaviour of LCHS members should be highlighted from
this analysis. Firstly, group journeys do appear to fit an expected pattern of ‘leisurely’ activity. A
large proportion of group journeys take place at weekends, within London’s parks and along the
banks of the River Thames, and analysing the group journeys of lunchtime users, Friday lunchtimes
are a particular focus of group-cycling activity. In many cases these group journeys are different
from the journeys members typically make, and often these differences meet our expectations. For
51% of anytime users, 23% of 9-to-5 ers and 19% of members originally classified as postworkers,
their group journeys typically fit the profile of the weekenders cluster group. Such findings perhaps
reinforce the idea that group cycling is discretionary: a planned, leisure-oriented activity taken
between members that are likely to be known to each other.
At the same time, however, a different type of group-cycling activity can also be identified that
is perhaps more serendipitous. Studying peak-time group journeys, we find hub stations to be
extremely dominant. It is reasonable to question whether, given the prominence of these hub
stations and the times at which these journeys are made, we are genuinely measuring planned
group behaviour. For instance, it could be the case that two individuals do not know each other,
but cycle the same route at the same time on more than one occasion merely through chance.
Since group journeys are almost identical, having started and ended at the same docking station
within a two-minute window, however, one might assume that these two individuals have taken
the same route, and the benefits associated with group cycling discussed in section 2.1 – increased
visibility and increased perceived safety from being surrounded by other cyclists – would still apply.
These instances, then, perhaps represent a separate category of group activity; one that is partially
imposed onto members due to the way the LCHS hub stations are organised. For example, since
two of the three hubs are located at major rail stations, we might expect a situation where a
large commuter train arrives causing a surge of competition for bikes at the hub docking station.
LCHS operators then manually replenish this station with bikes, before bikes are immediately
18

withdrawn by a group of waiting members. It is difficult to formally quantify that extent of this
‘imposed’ group-cycling behaviour. However, in total 11% of group cyclists have made group
journeys involving hub stations during the weekday peaks, suggesting that this ‘imposed’ group
cycling behaviour may be relatively substantial.
An important motivation for studying group cycling, particularly within an urban context, relates
to safety. That existing research into the LCHS found female members preferentially select parts
of the city generally associated with greater levels of safety (Beecham & Wood 2014), we were
particularly interested in identifying women’s group-cycling behaviours. It is therefore instructive
that women are significantly overrepresented (p<0.001) amongst group cyclists. In addition, this
significant relationship (p<0.001) is true of the weekenders cluster group: a collection of members
typically living within the London area, but who are generally inexperienced or infrequent users
of the LCHS. There is both visual and quantitative evidence to suggest that weekenders’ group
journeys are more spatially diverse than their non-group journeys, and it might be argued that
for these people group cycling enables more extensive cycling activity. The same might apply to
women who use the scheme late in the evening: women are significantly overrepresented (p<0.001)
amongst late evening group-cycle journeys, but significantly underrepresented (p<0.001) amongst
non-group journeys made at this time.
This final point, of group cycling perhaps enabling scheme usage, is addressed more directly in
section 4.4. We find that for a large proportion of members (20%) the first journey they made as a
member was indeed a group journey. This is surprising since group journeys constitute just 9% of
all journeys made by group cyclists. The important aspects of this analysis relate to demographics.
Women are very significantly overrepresented amongst ‘first time group’ members and are also more
likely to make these first time group journeys with their bikeshare best friend – the person they
subsequently cycle with the most. Studying ‘best friends’ in more detail, we find a very significantly
high incidence (p<0.001) of best friends of the opposite gender and sharing the same postcode; and
that this is also true for the friends first time group cyclists make their first journey with. We argue
that especially for women, group cycling may help initiate usage of the LCHS, and that close or
immediate friendships may be particularly important to motivating this early scheme usage.
6 Conclusion
We describe in detail a set of techniques and associated findings from studying group-cycling be-
haviours within the LCHS. Our approach to analysis – developing a set of behavioural variables and
building interactive visualization software to support spatiotemporal analysis – enables relatively
sophisticated descriptions of group-cycling activity, as well as distinct categories of group-cycling
behaviour. Whilst in many cases group cycling does appear to be a leisure-oriented, planned activ-
ity, there are also instances of more serendipitous behaviour that is perhaps imposed onto members
through the system’s design. Importantly, given the growing academic interest in researching moti-
vations behind urban cycling (Buehler & Pucher 2012), we provide quantitative evidence to suggest
19

that group cycling may both encourage more diverse cycling behaviours than certain members might
normally make, and that group cycling may be a way of enabling early scheme usage. There are
limitations to our approach. Group-cycling activity is inferred purely through mining observed OD
data, our analysis misses group journeys made by causal LCHS users and group cycling within a
bikeshare scheme may be very different to other forms of group cycling. However, to our knowledge
this is the first large-scale, observational study of its kind, and we provide empirical evidence that
group cycling may be associated with more extensive cycling behaviours in both space and time,
and that it may help initiate cycling behaviour.
20
7 References
Aldred, R. (2012), Cycling cultures: summary of key findings and recommendations, Technical
report, University of East London, London.
Anable, J., Schuitema, S., Susilo, Y. & Aditjandra, P. (2010), Walking and cycling in Scotland:
analysis of statistical data and rapid review of the literature, Technical report, NHS Health
Scotland.
Barabsi, A.-L. & Albert, R. (1999), ‘Emergence of scaling in random networks’, Science
286(5439), 509–512.
Becker, R. A. & Cleveland, W. S. (1987), ‘Brushing scatterplots’, Technometrics 29(2), 127–142.
Beecham, R. & Wood, J. (2014), ‘Exploring gendered cycling behaviours within a large-scale
behavioural data-set’, Transportation Planning and Technology 37(1), 83–97.
Bonham, J. & Wilson, A. (2012), ‘Bicycling and the life course: The start-stop-start experiences
of women cycling’, International Journal of Sustainable Transportation 6(4), 195–213.
Buehler, R. & Pucher, J. (2012), ‘Walking and cycling in Western Europe and the United States:
Trends, policies, and lessons’, TR News (280).
Department for Communities and Local Government (2011), The English indices of deprivation
2010: Technical report, Technical report, Department for Communities and Local
Government.
Dill, J. & Gliebe, J. (2008), ‘Understanding and measuring bicycling behavior: A focus on travel
time and route choice’, Bicycling 29(December), 1 – 70.
Do, T. & Gartica-Perez, D. (2013), ‘Human interaction discovery in smartphone proximity
networks’, Personal and Ubiquitous Computing 17(3), 413–431.
Eccles, R., Kapler, T., Harper, R. & Wright, W. (2008), ‘Stories in GeoTime’, Information
Visualization 7(1), 3–17.
Field, A. (2009), Discovering Statistics Using SPSS, third edition edn, Sage, London.
Garrard, J., Handy, S. & Dill, J. (2012), Women and cycling, in J. Pucher & R. Buehler, eds,
‘City Cycling’, MIT Press, London, pp. 211–235.
Garrard, J., Rose, G. & Lo, S. K. (2008), ‘Promoting transportation cycling for women: the role
of bicycle infrastructure’, Preventive medicine 46(1), 55–59.
Heesch, K. C., Sahlqvist, S. & Garrard, J. (2012), ‘Gender differences in recreational and
transport cycling: a cross-sectional mixed-methods comparison of cycling patterns,
motivators, and constraints’, International Journal of Behavioral Nutrition and Physical
Activity 9(1), 106.
21
Jacobsen, P. L. (2003), ‘Safety in numbers: more walkers and bicyclists, safer walking and
bicycling’, Injury Prevention 9(3), 205–209.
Kapler, T. & Wright, W. (2005), ‘Geotime information visualization’, Information Visualization
4(3), 136–146.
Lathia, N., Ahmed, S. & Capra, L. (2012), ‘Measuring the impact of opening the London shared
bicycle scheme to casual users’, Transportation Research Part C: Emerging Technologies
22, 88–102.
Lathia, N., Smith, C., Froehlich, J. & Capra, L. (2013), ‘Individuals among commuters: Building
personalised transport information services from fare collection systems’, Pervasive and
Mobile Computing 9, 643–664.
Min, J.-K., Wiese, J., Hong, J. I. & Zimmerman, K. (2013), Mining smartphone data to classify
life-facets of social relationships, in ‘Proceedings of the 2013 Conference on Computer
Supported Cooperative Work, CSCW13’, New York, USA, pp. 285–294.
Pooley, C., Tight, M., Horton, D., Scheldeman, G., Jopson, A., Mullen, C. & Chrisholm, A.
(2011), Understanding walking and cycling: summary of key findings and recommendations,
Technical report, Lancaster University Environment Centre, Lancaster University.
Pucher, J. & Buehler, R. (2012), City Cycling, MIT Press, London.
Robbins, N. B. (2005), Creating More Effective Graphs, Wiley-Blackwell, New Jersey, USA.
Rousseeuw, P. J. (1987), ‘Silhouettes: A graphical aid to the interpretation and validation of
cluster analysis’, Journal of Computational and Applied Mathematics 20, 53–65.
Shen, Z. & Ma, K.-L. (2008), MobiVis: a visualization system for exploring mobile data, in
‘Visualization Symposium, 2008. PacificVIS 2008. IEEE Pacific’, pp. 175–182.
Slingsby, A., Beecham, R. & Wood, J. (2013), ‘Visual analysis of social networks in space and
time using smartphone logs’, Pervasive and Mobile Computing 9(6), 848–864.
Thomas, T., Jaarsma, R. & Bas, T. (2008), Temporal variations of bicyle demand in the
Netherlands, Technical report, Transport Research Board.
Tilahun, N. Y., Levinson, D. M. & Krizek, K. J. (2007), ‘Trails, lanes, or traffic: Valuing bicycle
facilities with an adaptive stated preference survey’, Transportation Research Part A: Policy
and Practice 41(4), 287–301.
Vickers, D. & Rees, P. (2006), ‘Introducing the area classification of output areas’, Population
trends (125), 15–29.
Wood, J., Slingsby, A. & Dykes, J. (2011), ‘Visualizing the dynamics of London’s bicycle hire
scheme’, Cartographica 46(4), 239 – 251.
22

Ythier, J., Walker, J. & Bierlaire, M. (2013), The influence of social contacts and communication
use on travel behavior: a smartphone-based study, in ‘ransportation Research Board 92nd
Annual Meeting.’, Washington DC, USA.
23