Chapter4 - Chocolate Industry
19
College : SNJB’s COE, Chandwad. Class : MBA 1 st year. Guidance By : Hon. Prof. Mr. U. S. Kasar Sir. Industry : Chocolate Industry. Presenters : Gaziyani Md. Hasnain Rahul O. Bhandari Khushbu Mutha Bhagyashree Mankar Abu Swaleh
Transcript of Chapter4 - Chocolate Industry

College : SNJB’s COE, Chandwad.
Class : MBA 1st year.
Guidance By : Hon. Prof. Mr. U. S. Kasar Sir.
Industry : Chocolate Industry.
Presenters : Gaziyani Md. Hasnain
Rahul O. Bhandari
Khushbu Mutha
Bhagyashree Mankar
Abu Swaleh

Chapter - 4
Financials

Dec ' 09 Dec ' 08 Dec ' 07 Dec ' 06 Dec ' 05
Sources of funds
Owner's fund
Equity share capital 31.07 32.18 33.20 34.36 35.71
Share application money - - - - -
Preference share capital - - - - -
Reserves & surplus 499.73 432.22 372.94 357.73 398.10
Loan funds
Secured loans 2.28 32.02 1.28 3.26 3.71
Unsecured loans 9.89 9.68 7.48 6.75 4.51
Total 542.96 506.11 414.90 402.10 442.03
Uses of funds
Fixed assets
Gross block 724.75 586.94 544.77 430.21 395.50
Less : revaluation
reserve - - - - -
Less : accumulated
depreciation 372.09 335.55 299.18 265.13 234.88
Net block 352.66 251.39 245.59 165.08 160.62
Capital work-in-progress 152.53 123.86 25.58 82.18 29.55
Investments 18.01 2.92 298.49 253.42 258.21
Net current assets
Current assets, loans &
advances 576.62 581.89 246.03 189.55 184.80
Less : current liabilities &
provisions 556.85 453.96 400.79 301.81 218.50
Total net current assets 19.77 127.93 -154.77 -112.26 -33.70
Miscellaneous expenses
not written - - - 13.68 27.35
Total 542.96 506.11 414.90 402.10 442.03
Financial Statement Of Cadbury

Dec ' 12 Dec ' 11 Dec ' 10 Dec ' 09 Dec ' 13
Sources of funds
Owner's fund
Equity share capital 96.42 96.42 96.42 96.42 96.42
Share application money - - - - -
Preference share capital - - - - -
Reserves & surplus 2,272.33 1,701.99 1,177.54 759.00 484.85
Loan funds
Secured loans 0.01 0.24 0.84 - -
Unsecured loans 1,189.48 1,049.95 970.03 - -
Total 3,558.24 2,848.60 2,244.82 855.41 581.27
Uses of funds
Fixed assets
Gross block 4,844.28 4,368.68 2,552.21 1,854.70 1,640.79
Less : revaluation
reserve - - - - -
Less : accumulated
depreciation 1,474.97 1,164.41 976.46 841.96 744.59
Net block 3,369.31 3,204.27 1,575.75 1,012.74 896.20
Capital work-in-progress 294.71 344.08 1,418.64 348.91 79.63
Investments 851.08 364.86 134.37 150.68 203.26
Net current assets
Current assets, loans &
advances 1,799.17 1,250.71 1,333.03 1,094.70 903.36
Less : current liabilities &
provisions 2,756.03 2,315.32 2,216.96 1,751.61 1,501.18
Total net current assets -956.86 -1,064.61 -883.93 -656.91 -597.82
Miscellaneous expenses
not written - - - - -
Total 3,558.24 2,848.60 2,244.82 855.41 581.27
Financial Statement Of Nestle
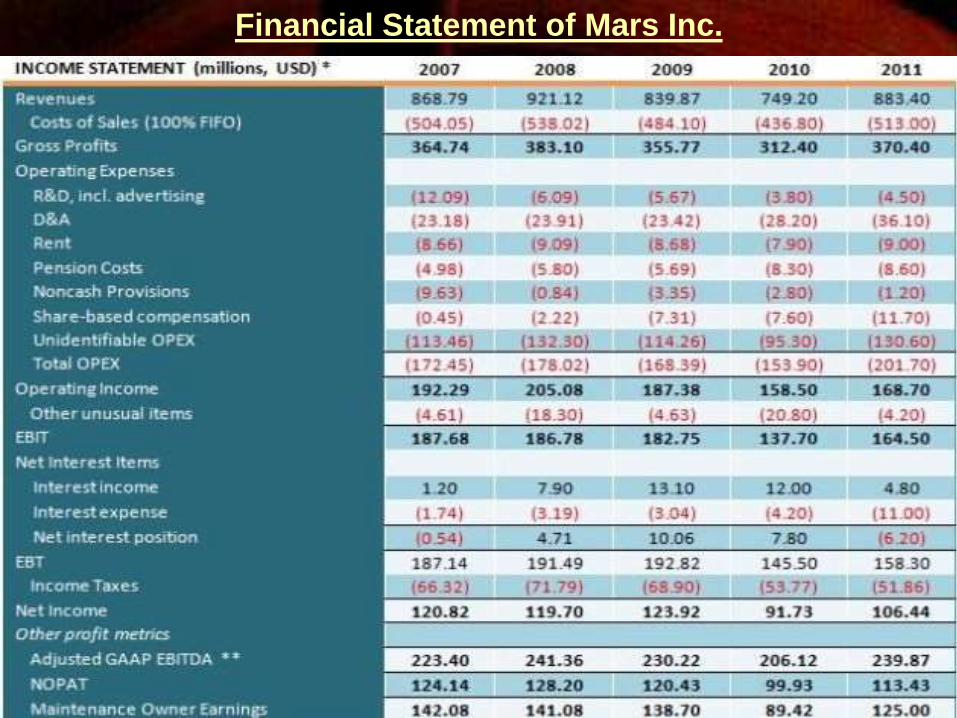
Financial Statement of Mars Inc.

Financial Statement of Kraft's Food

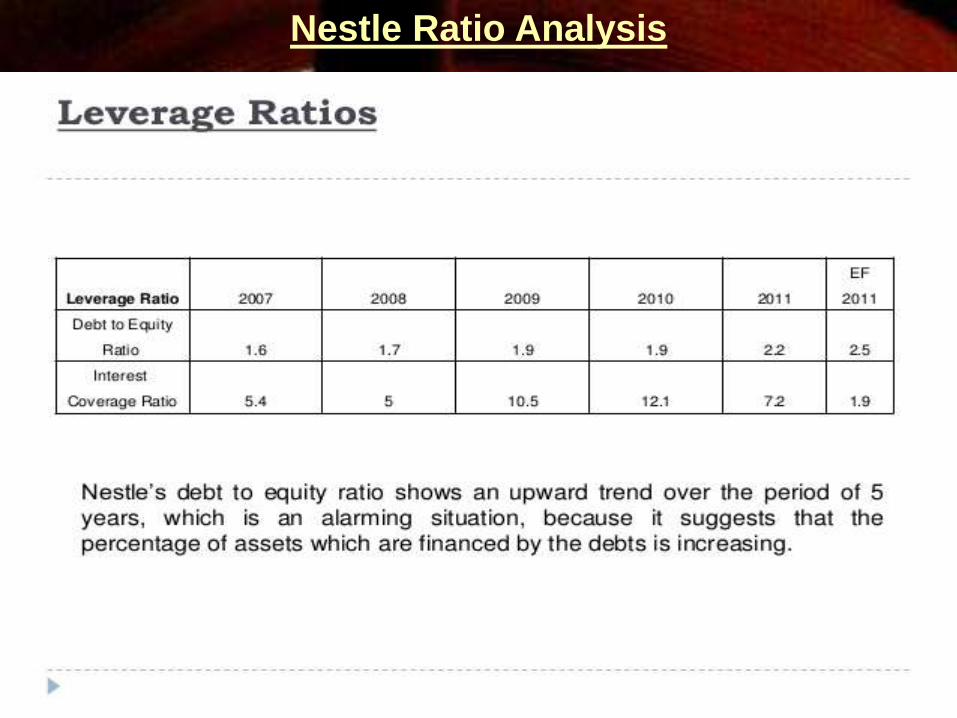
Nestle Ratio Analysis

Nestle Ratio Analysis
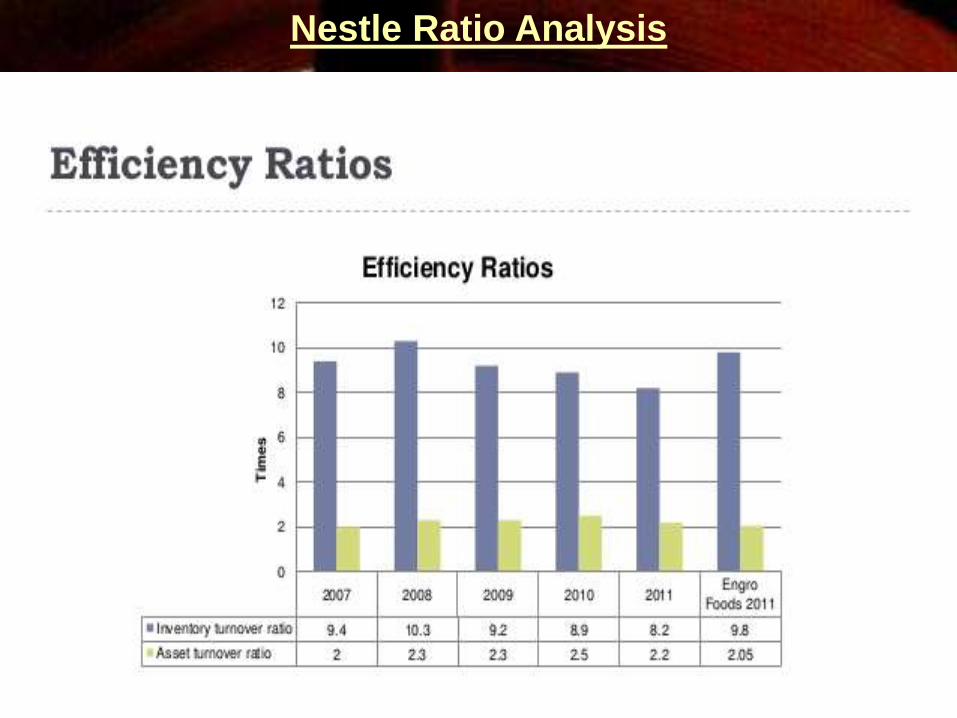
Nestle Ratio Analysis

Nestle Ratio Analysis
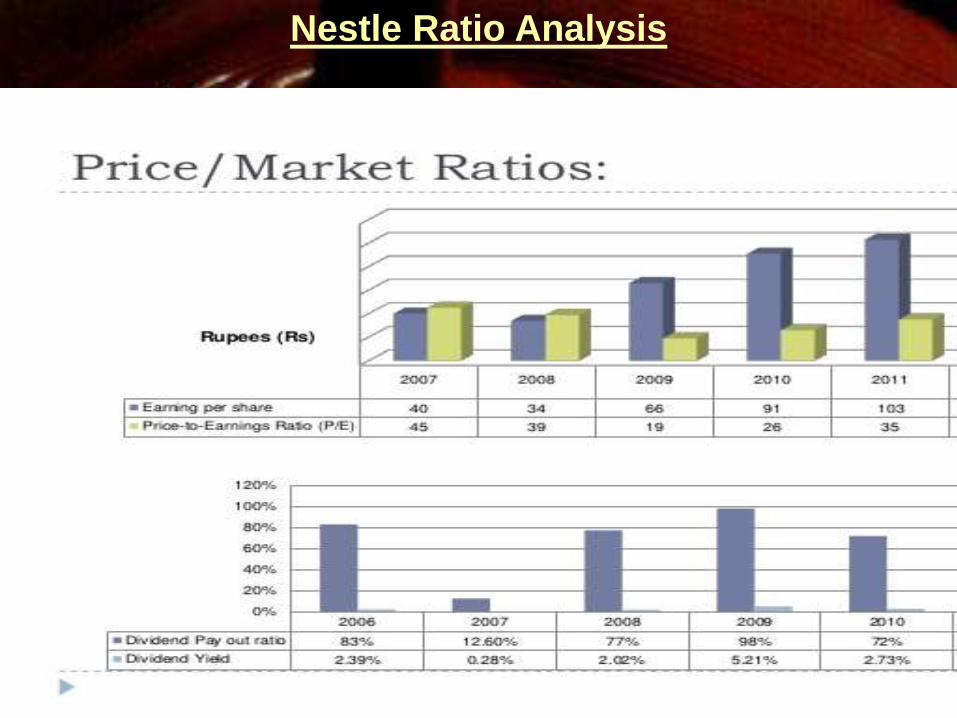
Nestle Ratio Analysis
Nestle Ratio Analysis
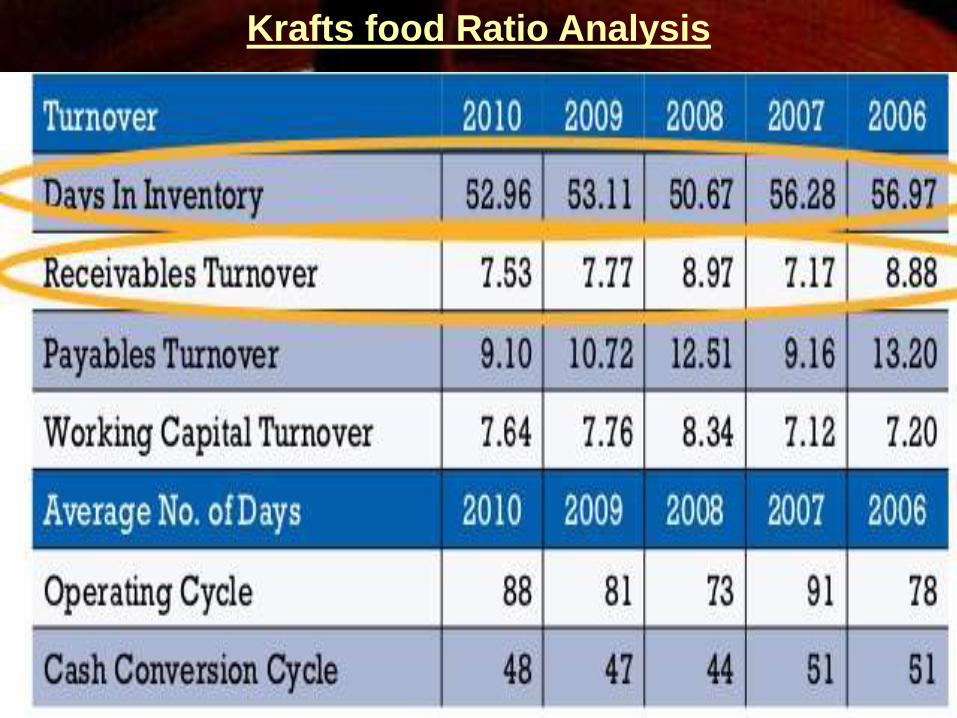
Krafts food Ratio Analysis

Krafts food Ratio Analysis

Krafts food Ratio Analysis
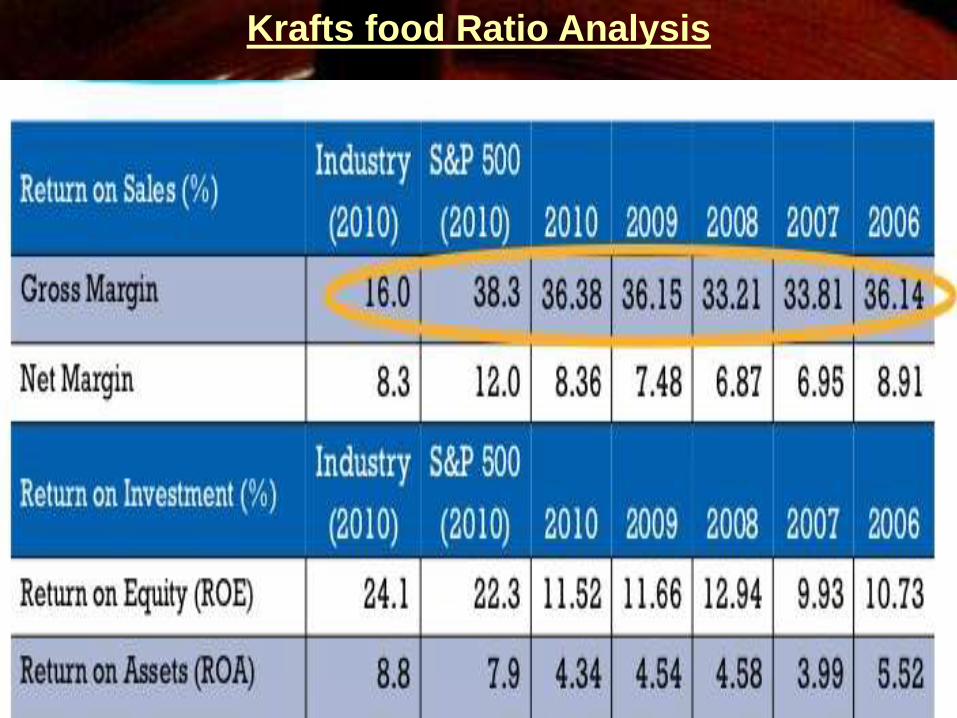
Krafts food Ratio Analysis
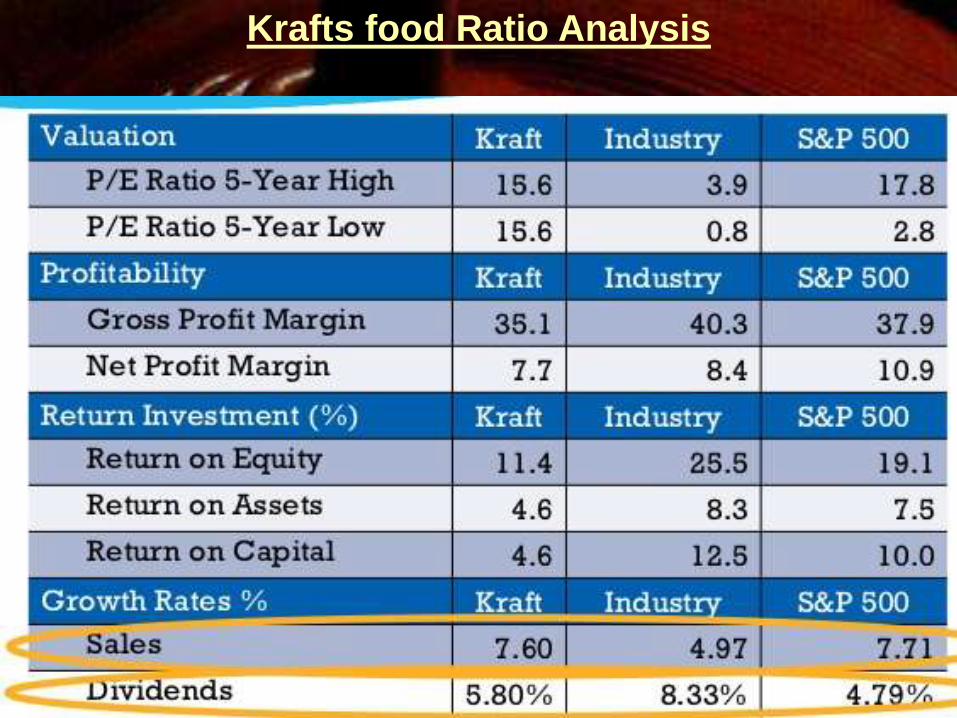
Krafts food Ratio Analysis