
chapter Sampling and sample preparation methods for ... · PDF fileChapter 3. Sampling and...
14
Chapter 3. Sampling and sample preparation methods for determining concentrations of mycotoxins in foods and feeds 39 chapter 3. Sampling and sample preparation methods for determining concentrations of mycotoxins in foods and feeds Summary Sample variation is often the largest error in determining concentrations of mycotoxins in food commodities. The worldwide safety evaluation of mycotoxins requires sampling plans that give acceptably accurate values for the levels of contamination in specific batches or lots of a commodity. Mycotoxin concentrations show a skewed or uneven distribution in foods and feeds, especially in whole kernels (or nuts), so it is extremely difficult to collect a sample that accurately represents the mean batch concentration. Sample variance studies and sampling plans have been published for select mycotoxins such as aflatoxin, fumonisin, and deoxynivalenol, emphasizing the importance of sample selection, sample size, and the number of incremental samples. For meaningful data to be generated from sur- veillance studies, representative samples should be collected from carefully selected populations (batches or lots) of food that, in turn, should be representative of clearly defined locations (e.g. a country, a region within a country). Although sampling variability is unavoidable, it is essential that the precision of the sampling plan be clearly defined and be considered acceptable by those responsible for interpreting and reporting the surveillance data. The factors influencing variability are detailed here, with reference to both major mycotoxins and major commodities. Sampling of large bag stacks, bulk shipments, and domestic supplies are all discussed. Sampling plans currently accepted in international trade are outlined. Acceptance sampling plans and the variabilities that affect operating characteristic curves of such plans are also detailed. The constraints and issues related to the sampling of harvested crops within subsistence farming areas are also discussed in this chapter, as are the essential rules of sample labelling and storage. The chapter concludes with a short section on sample preparation methods. 1. Introduction Mycotoxin concentrations in foods and feeds are controlled in various ways; the most important are good agricultural practice and good manufacturing practice accompanied by end-product testing, product monitoring by regulators, and safety evaluation of foods on a national or worldwide basis. Each of these approaches requires efficient sam- pling and sample preparation methods. End-product testing, for CHAPTER 3
Transcript of chapter Sampling and sample preparation methods for ... · PDF fileChapter 3. Sampling and...

Chapter 3. Sampling and sample preparation methods for determining concentrations of mycotoxins in foods and feeds
39
chapter 3.
Sampling and sample preparation methods for
determining concentrations of mycotoxins in foods and feeds
Summary
Sample variation is often the largest error in determining concentrations of mycotoxins in food commodities. The worldwide safety evaluation of mycotoxins requires sampling plans that give acceptably accurate values for the levels of contamination in specific batches or lots of a commodity. Mycotoxin concentrations show a skewed or uneven distribution in foods and feeds, especially in whole kernels (or nuts), so it is extremely difficult to collect a sample that accurately represents the mean batch concentration. Sample variance studies and sampling plans have been published for select mycotoxins such as aflatoxin, fumonisin, and deoxynivalenol, emphasizing the importance of sample selection, sample size, and the number of incremental samples. For meaningful
data to be generated from sur-veillance studies, representative samples should be collected from carefully selected populations (batches or lots) of food that, in turn, should be representative of clearly defined locations (e.g. a country, a region within a country). Although sampling variability is unavoidable, it is essential that the precision of the sampling plan be clearly defined and be considered acceptable by those responsible for interpreting and reporting the surveillance data. The factors influencing variability are detailed here, with reference to both major mycotoxins and major commodities. Sampling of large bag stacks, bulk shipments, and domestic supplies are all discussed. Sampling plans currently accepted in international trade are outlined. Acceptance sampling plans and the variabilities that affect operating
characteristic curves of such plans are also detailed. The constraints and issues related to the sampling of harvested crops within subsistence farming areas are also discussed in this chapter, as are the essential rules of sample labelling and storage. The chapter concludes with a short section on sample preparation methods.
1. Introduction
Mycotoxin concentrations in foods and feeds are controlled in various ways; the most important are good agricultural practice and good manufacturing practice accompanied by end-product testing, product monitoring by regulators, and safety evaluation of foods on a national or worldwide basis. Each of these approaches requires efficient sam-pling and sample preparation methods. End-product testing, for
CH
AP
TER
3

40
example, requires the collection of representative samples from defined batches, whereas product monitoring by regulators is more likely to focus on the safety of a particular batch (e.g. a 20 t batch of groundnut kernels) or the safety of an individual retail pack (e.g. a jar of groundnut butter). The safety evaluation of mycotoxins requires sampling plans that give acceptably accurate values for the levels of mycotoxin contamination in a variety of foods throughout the world.
When sampling is undertaken, it is essential that the following are clearly defined: the aim of the sampling exercise, the nature of the population being sampled, the sampling method, the efficiency of the sampling method, and the sample preparation method. In addition, the sampling plans may vary according to the kind of mycotoxin being analysed.
2. Sampling variability associated with testing for mycotoxins
2.1 Aflatoxins
In sampling of commodities for aflatoxins, sampling variance is known to be a major contributor to the total variance associated with an analysis. Aflatoxin concentrations show a skewed distribution in foods and feeds, especially in whole kernels, so it is extremely difficult to collect a sample that accurately represents the mean batch concentration (Whitaker and Wiser, 1969). This problem has been extensively investigated: Whitaker et al. (1995) reported on the sampling, sample preparation, and analytical variances associated with the testing of groundnuts (during farm storage and after shelling), shelled maize, and cottonseed.
Whitaker et al. (1976) studied the impact of sample size on the precision of sampling plans used to test batches of cottonseed for
aflatoxin. They showed that the collection of a sample of 1 kg from a cottonseed batch contaminated with 100 μg/kg aflatoxin was associated with a standard deviation of 87 μg/kg, i.e. replicate 1 kg samples that fell within 2 standard deviations of the mean had aflatoxin concentrations within the range 0–271 μg/kg (Table 3.1). However, the collection of a 32 kg sample reduced the standard deviation of the sample concentrations to 19 μg/kg and the range for samples that fell within 2 standard deviations to 64–136 μg/kg. In general, the sampling variance was halved each time the sample size was doubled. Similarly, the sample preparation variance was halved by doubling the subsample size and the analytical variance was halved by doubling the number of replicate analyses (Whitaker et al., 1976).
For the total variability to be reduced to an acceptable level, a cost-effective balance is needed between the sampling, sample prep-
aration, and analytical variances. For example, increasing the sample size beyond a certain point may be less cost-effective than increasing the subsample size and/or the number of replicate samples. It is important to realize that variability in sampling is much higher than variability in sample preparation or analyses. Adequate sampling is extremely important.
2.2 Aflatoxin M1
A European Commission (EC) Direc-tive (European Commission, 1998a), together with an EC Decision (Euro-pean Commission, 1991), specifies the sampling method to be used to determine aflatoxin M1 levels in liquid milk. After the batch of milk is mixed, by manual or mechanical means, a minimum sample of 0.5 kg or 0.5 L is collected, composed of at least 5 increments. The batch is accepted if the concentration of aflatoxin M1
in the sample does not exceed the permitted limit.
Table 3.1. Effect of sample size on the range of results bracketing the 95% confidence limits in a cottonseed lot containing 100 μg/kg aflatoxins
Sample size (kg)
Standard deviation
(μg/kg)
Concentration of aflatoxins in sample (μg/kg)
Lowa Highb Range
1 87 0 271 271
2 62 0 222 222
4 45 13 187 174
8 32 37 163 126
16 24 53 147 94c
32 19 64 136 72
a The low concentration value was calculated as 100 – (1.96 * standard deviation); a value of 0 was recorded if a negative result was obtained.b The high concentration value was calculated as 100 + (1.96 * standard deviation).c CAST (2003) number was 95.Adapted, by permission of the publisher, from CAST (2003).
Chapter 3. Sampling and sample preparation methods for determining concentrations of mycotoxins in foods and feeds
41
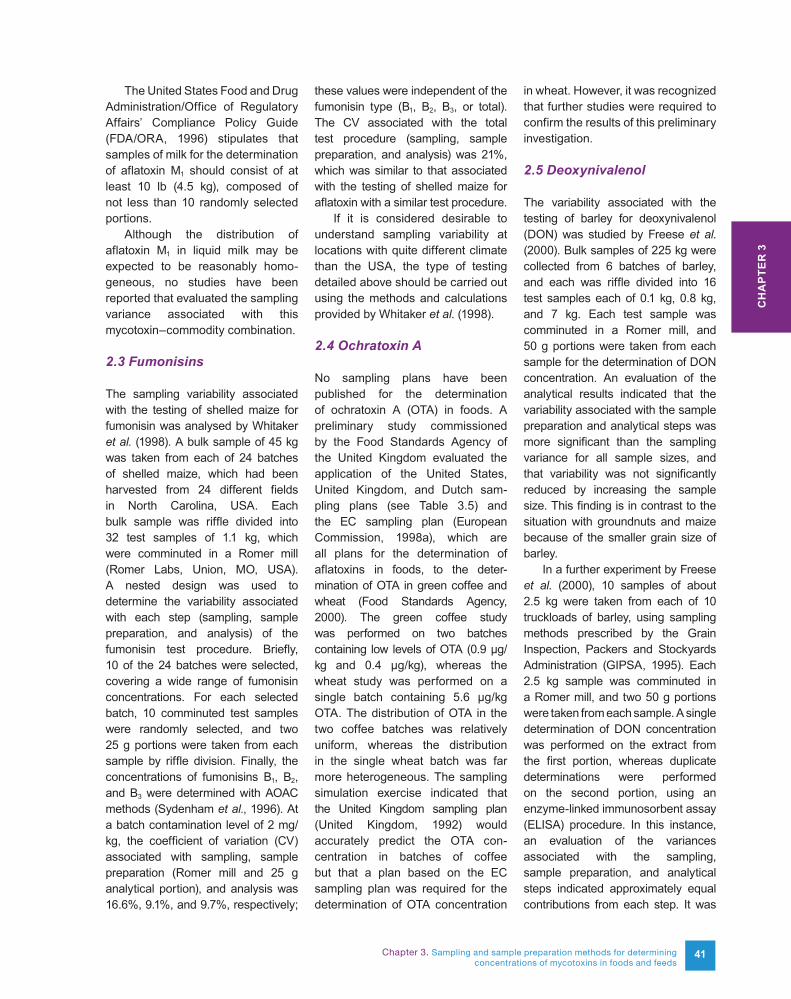
The United States Food and Drug Administration/Office of Regulatory Affairs’ Compliance Policy Guide (FDA/ORA, 1996) stipulates that samples of milk for the determination of aflatoxin M1 should consist of at least 10 lb (4.5 kg), composed of not less than 10 randomly selected portions.
Although the distribution of aflatoxin M1 in liquid milk may be expected to be reasonably homo-geneous, no studies have been reported that evaluated the sampling variance associated with this mycotoxin–commodity combination.
2.3 Fumonisins
The sampling variability associated with the testing of shelled maize for fumonisin was analysed by Whitaker et al. (1998). A bulk sample of 45 kg was taken from each of 24 batches of shelled maize, which had been harvested from 24 different fields in North Carolina, USA. Each bulk sample was riffle divided into 32 test samples of 1.1 kg, which were comminuted in a Romer mill (Romer Labs, Union, MO, USA). A nested design was used to determine the variability associated with each step (sampling, sample preparation, and analysis) of the fumonisin test procedure. Briefly, 10 of the 24 batches were selected, covering a wide range of fumonisin concentrations. For each selected batch, 10 comminuted test samples were randomly selected, and two 25 g portions were taken from each sample by riffle division. Finally, the concentrations of fumonisins B1, B2, and B3 were determined with AOAC methods (Sydenham et al., 1996). At a batch contamination level of 2 mg/kg, the coefficient of variation (CV) associated with sampling, sample preparation (Romer mill and 25 g analytical portion), and analysis was 16.6%, 9.1%, and 9.7%, respectively;
these values were independent of the fumonisin type (B1, B2, B3, or total). The CV associated with the total test procedure (sampling, sample preparation, and analysis) was 21%, which was similar to that associated with the testing of shelled maize for aflatoxin with a similar test procedure.
If it is considered desirable to understand sampling variability at locations with quite different climate than the USA, the type of testing detailed above should be carried out using the methods and calculations provided by Whitaker et al. (1998).
2.4 Ochratoxin A
No sampling plans have been published for the determination of ochratoxin A (OTA) in foods. A preliminary study commissioned by the Food Standards Agency of the United Kingdom evaluated the application of the United States, United Kingdom, and Dutch sam-pling plans (see Table 3.5) and the EC sampling plan (European Commission, 1998a), which are all plans for the determination of aflatoxins in foods, to the deter-mination of OTA in green coffee and wheat (Food Standards Agency, 2000). The green coffee study was performed on two batches containing low levels of OTA (0.9 μg/kg and 0.4 μg/kg), whereas the wheat study was performed on a single batch containing 5.6 μg/kg OTA. The distribution of OTA in the two coffee batches was relatively uniform, whereas the distribution in the single wheat batch was far more heterogeneous. The sampling simulation exercise indicated that the United Kingdom sampling plan (United Kingdom, 1992) would accurately predict the OTA con-centration in batches of coffee but that a plan based on the EC sampling plan was required for the determination of OTA concentration
in wheat. However, it was recognized that further studies were required to confirm the results of this preliminary investigation.
2.5 Deoxynivalenol
The variability associated with the testing of barley for deoxynivalenol (DON) was studied by Freese et al. (2000). Bulk samples of 225 kg were collected from 6 batches of barley, and each was riffle divided into 16 test samples each of 0.1 kg, 0.8 kg, and 7 kg. Each test sample was comminuted in a Romer mill, and 50 g portions were taken from each sample for the determination of DON concentration. An evaluation of the analytical results indicated that the variability associated with the sample preparation and analytical steps was more significant than the sampling variance for all sample sizes, and that variability was not significantly reduced by increasing the sample size. This finding is in contrast to the situation with groundnuts and maize because of the smaller grain size of barley.
In a further experiment by Freese et al. (2000), 10 samples of about 2.5 kg were taken from each of 10 truckloads of barley, using sampling methods prescribed by the Grain Inspection, Packers and Stockyards Administration (GIPSA, 1995). Each 2.5 kg sample was comminuted in a Romer mill, and two 50 g portions were taken from each sample. A single determination of DON concentration was performed on the extract from the first portion, whereas duplicate determinations were performed on the second portion, using an enzyme-linked immunosorbent assay (ELISA) procedure. In this instance, an evaluation of the variances associated with the sampling, sample preparation, and analytical steps indicated approximately equal contributions from each step. It was
CH
AP
TER
3

42
concluded that sample sizes of 100–200 g were adequate, assuming that these samples were obtained by the riffle division of a large bulk sample. However, it was also concluded that batches may be stratified to different degrees, depending upon the amount of mixing that occurred during handling, and that stratification could have a significant impact on sampling variance. If stratification is suspected, larger sample sizes are desirable.
A similar approach was used in a study of the sampling, sample preparation, and analytical variances associated with the testing of wheat for DON (Whitaker et al., 2000). A 20 kg bulk sample was taken from each of 24 commercial batches, and each sample was riffle divided into 32 test samples of 0.45 kg each. Each 0.45 kg sample was finely comminuted in a Romer mill, which was set to automatically produce a representative, comminuted 25 g portion. DON concentration was determined in each of 768 (24 × 32) 25 g portions using the Romer FluoroQuant fluorometric procedure, and the analytical data were used to determine the total variability (sampling plus sample preparation plus analytical). Next, 20 commi-nuted samples, with a wide range of DON levels, were selected from the residual 768 comminuted samples, and eight 25 g portions were taken from each of these samples by riffle division. The Romer FluoroQuant method was then used to determine the DON concentration in four replicate extracts prepared from each 25 g portion. The combined sample preparation and analytical variance, and the analytical variance alone, were estimated using SAS procedures (SAS, 1997). The CV associated with the total test procedure varied from 261.8% (for a batch concentration of 0.02 mg/kg DON) to 7.9% (for 14.38 mg/kg DON). For a batch concentration of 5.0 mg/kg DON, the
CV associated with the sampling, sample preparation, and analytical steps was 6.3%, 10.0% and 6.3%, respectively. The sampling variance was specific to a 0.45 kg sample, the sample preparation variance to a Romer mill and a 25 g analytical sample, and the analytical variance to the Romer FluoroQuant method. The CV associated with the total test procedure was 13.4%. The low variance associated with the sampling step (relative to that for other mycotoxins and other commodities) is partly due to the high kernel count of wheat (about 30 kernels/g), which is about 10 times that for shelled maize and about 30 times that for shelled groundnuts.
2.6 T-2 and HT-2 toxins
No sampling plans have been published for the determination of T-2 and HT-2 toxins in foods, and details of the sampling variability of these toxins have not been reported. However, the sampling plans outlined above for DON should be applicable.
3. Sampling and surveillance
Surveillance studies involve the collection of information on the mycotoxin contamination of selected batches of food or feed within specified regions.
For meaningful data to be generated from surveys or sur-veillance studies, representative samples should be collected from carefully selected populations of food (e.g. batches or lots, marketplaces, farmers’ stores) that, in turn, should be representative of clearly defined locations (e.g. a country, a region within a country). Three examples of different types of materials to be sampled are shown in Fig. 3.1.
The large bag stack of maize (Fig. 3.1a) consists of several thou-sand bags. However, only a small
proportion of this population is accessible for sampling without dismantling the complete stack; the sample collected is representative only of outer bags that are readily accessible. An evaluation of the mycotoxin content of the inner bags can be performed only during the construction or dismantling of the stack. Although the maize crib (Fig. 3.1b) contains far less material than the bag stack, a sample that represents the whole population can be obtained only by dismantling the complete crib. The very large bulk consignment of oilseed meal (Fig. 3.1c) is composed of tens of thousands of tonnes of material, which is discharged, ultimately, into a barge with a capacity of about 500 t. The discharge is a convenient sampling point where the meal may be sampled as it flows into the barge from the weighing tower. In this case, the population being tested is equivalent to the material contained in the barge, and sampling from a flowing stream ensures that the sample is representative of the whole population.
Once a population has been selected, it is equally important that samples are collected using a clearly defined sampling plan designed to produce a reasonably representative sample. Although sampling variability is unavoidable, it is essential that the precision of the sampling plan be clearly defined and be considered acceptable by those responsible for interpreting the surveillance data. If the samples are too small, a wide range of estimated levels of contamination with mycotoxins will be obtained for a given population, and there will be a strong probability that the average value will be significantly lower than the true value. It is equally important that enough samples be collected from each population to ensure that infrequently occurring, highly contaminated samples are included in the surveillance data.

Chapter 3. Sampling and sample preparation methods for determining concentrations of mycotoxins in foods and feeds
43
3.1 Sampling whole kernels
The sampling variance associated with different numbers of grains or nuts in a sample was studied by Whitaker and Wiser (1969). They showed that, for a batch of groundnuts contamina-ted with 30 µg/kg aflatoxins, the sampling variance increased very significantly if the sample was smaller than 40 000 kernels but changed very gradually for larger samples. The recommended weight of bulk samples thus depends on the grain or kernel size of the commodity. The sample weight should be 30 kg for groundnuts, 10 kg for maize, and 5 kg for rice (European Commission, 1998a). Ideally, a bulk sample is composed of 100 primary samples.
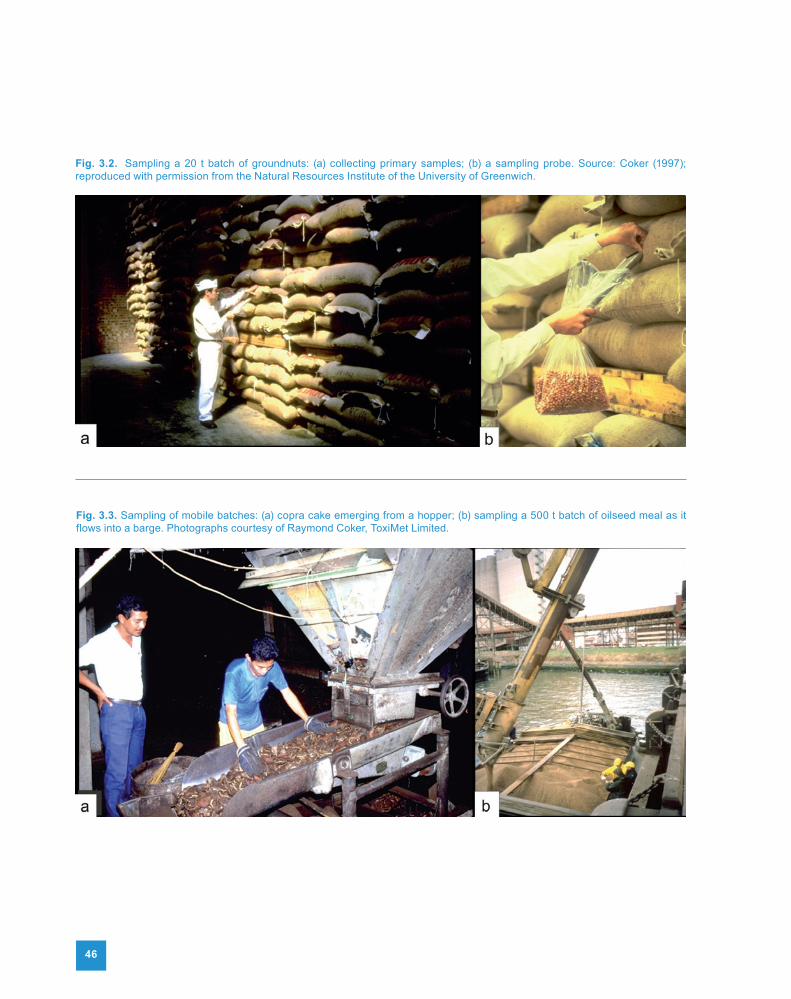
The sampling of groundnut ker-nels, typically from a 20 t batch, is illustrated in Fig. 3.2. Here, a 20 kg sample is being produced by collecting 200 g primary samples from 100 bags. As mentioned previously, the population being evaluated is composed of only the accessible
bags. However, if the stack is reasonably new (and, consequently, spoilage is not likely to have occurred), the accessible population may be assumed to be representative of the inner bags if the stack was assembled in an unbiased manner.
The distribution of aflatoxins in groundnuts and groundnut products is illustrated in Table 3.2. Bags from stacks were sampled systematically by collecting 100 g samples and then determining the aflatoxin level of each sample (Coker, 1998). Of 204 samples of raw, ungraded nuts, 15% contained aflatoxins, and the highest aflatoxin level was about 20 times the mean concentration of the samples. However, in a different set of samples, from graded and roasted nuts, only 1% of the samples were contaminated, but the highest level was about 200 times the mean concentration of the samples.
3.2 Sampling processedcommodities
The very heterogeneous distribution of aflatoxins in whole groundnuts is illustrated in Table 3.2. After the batch of raw, ungraded nuts was crushed, aflatoxin was more uniformly dis-tributed: every sample contained aflatoxin, and the highest level was 2.5 times the mean concentration of the samples (Coker, 1998).
In general, the distribution of aflatoxins in ground or comminuted commodities has been shown to be relatively homogeneous compared with that in whole kernels. Coker et al. (2000) found that the aflatoxin concentration of large (500 t) batches of crushed oilseeds, including copra cake, copra meal pellets, and palm kernel cake, could be determined using quite small samples composed of a small number of primary samples. For example, a sampling plan that had a precision (CV) of 9% involved the collection of just 20 primary samples of 100 g to produce a 2 kg composite sample.
3.3 Sampling point
An ideal point for sampling occurs while the batch is being transferred, for example from one holding vessel to another. Examples of this approach to sampling are shown in Fig. 3.3.
3.4 Proposed surveillancesampling plans
Some examples of sampling plans proposed for surveillance purposes are given in Table 3.3. In Table 3.3, “sample size” refers to samples produced by riffle division of large (e.g. 40 kg), unground, bulk samples, as described by Freese et al. (2000) and Whitaker et al. (2000) when evaluating the sampling variance associated with the testing of barley and wheat, respectively, for DON.
Fig. 3.1. Examples of materials to be sampled: (a) large bag stack of maize; (b) crib of maize cobs; (c) very large bulk consignment of oilseed meal. (a, b) Photographs courtesy of Raymond Coker, Founder & Director at Raymond Coker ConsultingLimited. (c) Source: Coker (1997);reproduced with permission from the Natural Resources Institute of the University of Greenwich.
CH
AP
TER
3

44
Table 3.3. Summary of minimum sample sizes suggested for interpretation of surveillance data
Commodity Increments (n × y grams) Minimum sample size (kg)
AFLATOXIN M1
Milk (liquid and dried) (e.g. raw, pasteurized, homogenized, UHT, skimmed, semi-skimmed, evaporated, infant formula)a
5 × 100 0.5
Milk products 5 × 100 0.5
FUMONISINS
Maize
Whole maizeb 50 × 100 5.0
Maize on the cobc 50 cobs 7.5
Maize flour 10 × 100 1.0
Maize meal 10 × 100 1.0
Maize grits 10 × 100 1.0
Brand 10 × 100 1.0
Processed maize foods (e.g. cornflakes, tortilla chips,popcorn, muffin mix, starch)e
10 × 100 1.0
OCHRATOXIN A
Maize
Whole maizef 50 × 100 5.0
Maize on the cobc 50 cobs 7.5
Maize grits 10 × 100 1.0
Processed maize foods (e.g. cornflakes, tortilla chips,popcorn, muffin mix, starch)d
10 × 100 1.0
Wheat 30 × 100 3.0
Barley 30 × 100 3.0
Rice (including dehusked and polished rice) 30 × 100 3.0
Peas and beans (including coffee beans)f 30 × 100 3.0
Product (total weight)
No. of samples of 100 g
No. of samples containing aflatoxin (%)
Range of aflatoxin concentrations (µg/kg)
Batch mean aflatoxin concentration (µg/kg)
Raw kernels, ungraded (10 t)
84 13 (15%) < 1–4000 200
Roasted kernels, graded (15 t)
200 2 (1%) 7–600 3
Ground kernels (5.6 t)a
204 204 (100%) 90–250 100
Table 3.2. Distribution of aflatoxins in groundnuts and groundnut products
a Produced by crushing the 10 t batch of raw, ungraded kernels shown in the first row.Adapted, by permission of the publisher, from Coker (1998).

Chapter 3. Sampling and sample preparation methods for determining concentrations of mycotoxins in foods and feeds
45
UHT, ultra-high-temperature pasteurized.a European Commission (1998a). The sampling variance for mycotoxins in beverages is assumed to be similar to that for aflatoxin M1 in milk.b Whitaker et al. (1998). Sampling variance (CV, %) for fumonisins in maize is similar to that reported for aflatoxins in maize.c Assuming that the core of a cob contributes about 30% of the total weight of a cob and that a cob yields about 100 g of kernels.d Coker et al. (2000). Sampling variance in these commodities is assumed to be similar to that for aflatoxin in comminuted feeds. The suggested sampling plan is associated with a sampling precision (CV) of 12.5% for aflatoxin in comminuted feeds.e The minimum sample size for comminuted/processed foods is set at half the sample weight required for estimating fumonisins in whole kernels.f The sampling variability for ochratoxin A is assumed to be similar to that for fumonisins (and aflatoxins; see footnote b).g No data on sampling variance for T-2 or HT-2 toxins; assumed to be similar to sampling variance for deoxynivalenol.h The minimum sample size for maize is set at double the sample weight required for estimating deoxynivalenol in wheat and barley.i The minimum sample size for deoxynivalenol in cereal products is arbitrarily set at half the sample weight required for estimating fumonisins and ochratoxin A in cereal products.j Whitaker et al. (2000).k Freese et al. (2000).
Commodity Increments (n × y grams) Minimum sample size (kg)
OCHRATOXIN A
Dried fruit (e.g. raisins, currants, sultanas, figs, dates, apricots)
30 × 100 3.0
Flour, meal, and bran of all origins 10 × 100 1.0
Breadd 10 × 100 1.0
Ground and instant coffee 10 × 100 1.0
Cocoa powder 10 × 100 1.0
Beverages (e.g. coffee, wine, grape juice)a 5 × 100 0.5
DEOXYNIVALENOL AND T-2 AND HT-2 TOXINSg
Maize
Whole maizeh 20 × 100 2.0
Maize on the cobc 20 cobs 3.0
Maize grits 10 × 50 0.5
Processed maize foods (e.g. cornflakes, tortilla chips,popcorn, muffin mix, starch)i
10 × 50 0.5
Wheatj 20 × 50 1.0
Barleyk 20 × 50 1.0
Oats 20 × 50 1.0
Rye 20 × 50 1.0
Flour, meal, and bran of all originsi 10 × 50 0.5
Bread 10 × 50 0.5
Table 3.3. Summary of minimum sample sizes suggested for interpretation of surveillance data (continued)
CH
AP
TER
3
46
Fig. 3.2. Sampling a 20 t batch of groundnuts: (a) collecting primary samples; (b) a sampling probe. Source: Coker (1997); reproduced with permission from the Natural Resources Institute of the University of Greenwich.
Fig. 3.3. Sampling of mobile batches: (a) copra cake emerging from a hopper; (b) sampling a 500 t batch of oilseed meal as it flows into a barge. Photographs courtesy of Raymond Coker, ToxiMet Limited.

Chapter 3. Sampling and sample preparation methods for determining concentrations of mycotoxins in foods and feeds
47
subsistence farmers is problematic. No elaborate technical sampling plan will work in such situations because there are too many variables to take into consideration. These include limited sample size, varying grades of post-harvest sorting, and different varieties and/or hybrids. It is, nevertheless, imperative that sampling and surveillance studies be conducted among subsistence farmers to determine to what extent they are being exposed to mycotoxin contamination. Such data can then be used to plan detailed intervention studies, which are better suited to the needs of rural communities than are mycotoxin regulations.
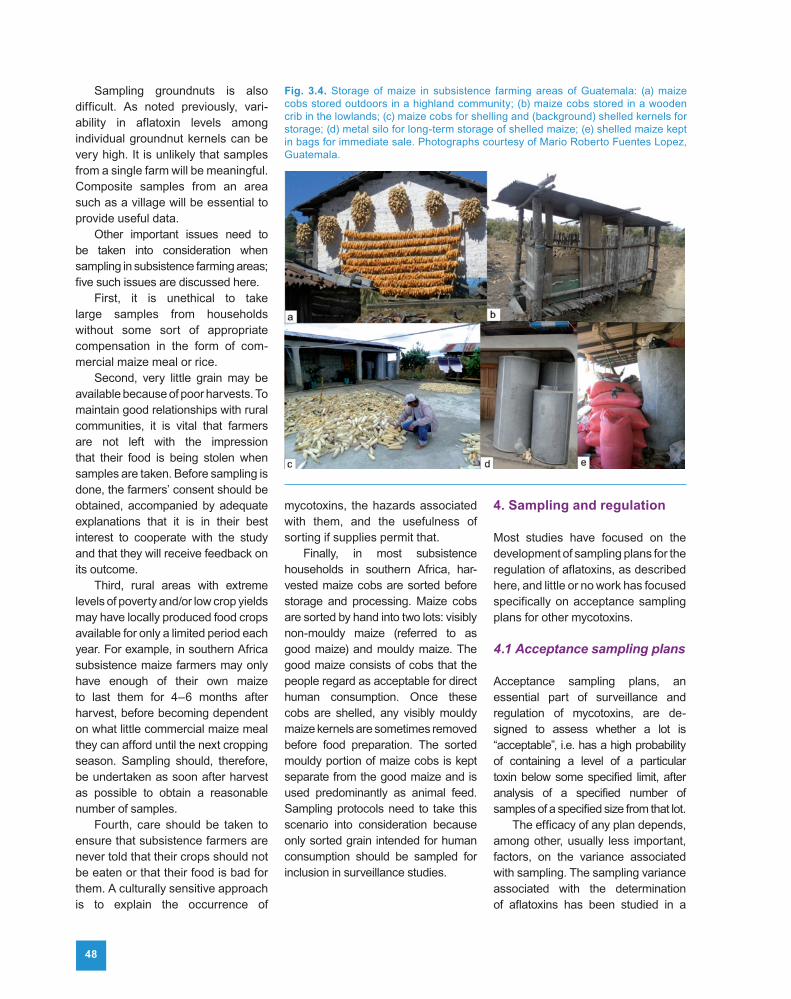
Subsistence maize farmers will have the following available: un-shelled maize cobs hung on walls or stored in wooden huts or cribs, in metal or plastic containers, or in heaps on homestead floors (Fig. 3.4a–c) and/or shelled maize kept in hessian or nylon bags or in metal or plastic containers (Fig. 3.4d, e).
Sampling shelled maize is relatively easy because a small probe can be used to take samples from bags and open containers, with a sample size (a minimum of
1.5–2.0 kg) that is representative of the overall amount of grain. This technique is also applicable to other small grain crops, including sorghum and millet.
Maize on the cob is more difficult to sample because the larger the individual unit (here, the cob) within the lot, the more skewed the distribution of mycotoxins within that lot (Whitaker et al., 1969; Coker et al., 2000). Sampling whole cobs should be avoided as far as possible. If no alternative is available, given time and other constraining factors in a rural area, the aim should be to collect at least 10 cobs, randomly selected, from the top and as far down as possible in the pile of maize cobs. Once shelled, 10 cobs will result in a sample size of ≤ 1.5 kg, which will need to be milled and then effectively mixed before being ground for analysis. To obtain a composite sample that is representative of a specific region (e.g. a village), it is suggested that subsamples of equal size (100–250 g) be taken from each of the collected samples in a specific region, pooled, thoroughly mixed, and then analysed to give a location value (R.D. Coker, personal communication).
The values shown are minimum sample sizes and minimum numbers of incremental samples for effective sampling. Because these values are based on currently available information, these sampling plans may change as more comprehensive data become available.
As batches of foods move along the food-chain, the heterogeneity of their mycotoxin distribution will decrease with increased han-dling. Therefore, it may be more appropriate to collect smaller samples directly from batches of foods of approximately the size of the samples shown in Table 3.3. The number of incremental samples proposed reflects the distribution (or anticipated distribution) of the mycotoxin in that particular commodity.
It is important that enough batches are sampled to ensure that infrequently occurring, highly contaminated batches are included in the surveillance data. The number of populations required in a given region depends on the variability in mycotoxin concentration among the populations within the region. It is suggested that there should be a 95% probability of capturing at least one population with a mycotoxin concentration that is significantly greater than the acceptable level for that toxin. The number of populations required in a survey will increase as the proportion of highly contaminated populations decreases. Table 3.4 shows the relationship between the proportion of populations with mycotoxin concentrations above the acceptable level and the number of populations required in a survey.
3.5 Sampling in subsistence farming areas
Unlike the statistically based sam-pling plans used for bulk foods and feeds, the sampling of harvested crops, particularly maize, from
Table 3.4. Number of populations required to achieve a 95% probability of capturing at least one population with a mycotoxin concentration that is significantly greater than the acceptable level for that toxin
True proportion of populations with mycotoxin concentrations above the
acceptable levelNo. of populations (e.g. batches) required
0.3 9
0.2 14
0.1 29
0.05 59
0.03 99
0.01 298
CH
AP
TER
3
48
Sampling groundnuts is also difficult. As noted previously, vari-ability in aflatoxin levels among individual groundnut kernels can be very high. It is unlikely that samples from a single farm will be meaningful. Composite samples from an area such as a village will be essential to provide useful data.
Other important issues need to be taken into consideration when sampling in subsistence farming areas; five such issues are discussed here.
First, it is unethical to take large samples from households without some sort of appropriate compensation in the form of com-mercial maize meal or rice.
Second, very little grain may be available because of poor harvests. To maintain good relationships with rural communities, it is vital that farmers are not left with the impression that their food is being stolen when samples are taken. Before sampling is done, the farmers’ consent should be obtained, accompanied by adequate explanations that it is in their best interest to cooperate with the study and that they will receive feedback on its outcome.
Third, rural areas with extreme levels of poverty and/or low crop yields may have locally produced food crops available for only a limited period each year. For example, in southern Africa subsistence maize farmers may only have enough of their own maize to last them for 4–6 months after harvest, before becoming dependent on what little commercial maize meal they can afford until the next cropping season. Sampling should, therefore, be undertaken as soon after harvest as possible to obtain a reasonable number of samples.
Fourth, care should be taken to ensure that subsistence farmers are never told that their crops should not be eaten or that their food is bad for them. A culturally sensitive approach is to explain the occurrence of
mycotoxins, the hazards associated with them, and the usefulness of sorting if supplies permit that.
Finally, in most subsistence households in southern Africa, har-vested maize cobs are sorted before storage and processing. Maize cobs are sorted by hand into two lots: visibly non-mouldy maize (referred to as good maize) and mouldy maize. The good maize consists of cobs that the people regard as acceptable for direct human consumption. Once these cobs are shelled, any visibly mouldy maize kernels are sometimes removed before food preparation. The sorted mouldy portion of maize cobs is kept separate from the good maize and is used predominantly as animal feed. Sampling protocols need to take this scenario into consideration because only sorted grain intended for human consumption should be sampled for inclusion in surveillance studies.
4. Sampling and regulation
Most studies have focused on the development of sampling plans for the regulation of aflatoxins, as described here, and little or no work has focused specifically on acceptance sampling plans for other mycotoxins.
4.1 Acceptance sampling plans
Acceptance sampling plans, an essential part of surveillance and regulation of mycotoxins, are de-signed to assess whether a lot is “acceptable”, i.e. has a high probability of containing a level of a particular toxin below some specified limit, after analysis of a specified number of samples of a specified size from that lot.
The efficacy of any plan depends, among other, usually less important, factors, on the variance associated with sampling. The sampling variance associated with the determination of aflatoxins has been studied in a
Fig. 3.4. Storage of maize in subsistence farming areas of Guatemala: (a) maize cobs stored outdoors in a highland community; (b) maize cobs stored in a wooden crib in the lowlands; (c) maize cobs for shelling and (background) shelled kernels for storage; (d) metal silo for long-term storage of shelled maize; (e) shelled maize kept in bags for immediate sale. Photographs courtesy of Mario Roberto Fuentes Lopez, Guatemala.

Chapter 3. Sampling and sample preparation methods for determining concentrations of mycotoxins in foods and feeds
49
variety of commodities (Coker, 1998; Coker et al., 2000; Johansson et al., 2000a, 2000b, 2000c; Park et al., 2000). For example, Johansson et al. (2000b) evaluated the efficacy of three sampling plans for shelled maize, involving sample sizes of 5, 10, and 20 kg and a specified maximum permitted level of contamination (the sample acceptance level, also called the critical concentration) of 20 μg/kg. The efficacy of each sampling plan was determined by simulating the performance of the plan as applied to a collection of batches of maize with aflatoxin concentrations within the range 0–150 μg/kg. The percentage of correct decisions, i.e. acceptance of the lot when the true mean was < 20 μg/kg, increased slightly with increasing sample size, from 97.2% for 5 kg samples to 97.8% for 20 kg samples.
Published sampling plans for the determination of aflatoxins in groundnuts, developed for use in the USA, the United Kingdom, and the Netherlands, were examined by Whitaker et al. (1995). The plans are summarized in Table 3.5. The percentage of correct decisions of each sampling plan was determined by evaluating a collection of groundnut lots with a specific distribution of aflatoxin, produced in the USA during 1976–1985. The United States plan,
with a sample size of 21.8 kg, gave the greatest percentage of correct decisions (95.6%), followed by the United Kingdom plan, with a sample size of 10.0 kg (91.1%) and the Dutch plan, with a sample size of 7.5 kg (82.4%).
In addition, a sampling plan for the determination of aflatoxins in edible nuts and dried fruit was specified by an EC Directive (Euro-pean Commission, 1998a). The required sample size and the number of incremental samples depend on both the batch size and the type of commodity. For example, for batches of groundnuts, pistachios, Brazil nuts, or dried figs of > 15 t, a 30 kg sample composed of 100 incremental samples is required. If the commodity is not intended for further processing, the unground 30 kg sample must be mixed and divided into three 10 kg subsamples. The 30 kg sample (or the three 10 kg subsamples) should then be comminuted and mixed before the analytical sample is withdrawn. For unprocessed commodities, the 30 kg sample should contain no more than 15 μg/kg total aflatoxins. For those commodities intended for direct human consumption, the batch is accepted if each of the three 10 kg samples contains no more than 4 μg/kg total aflatoxins (European Commission, 1998b).
4.2 Consumer and producer risks
The efficacy of acceptance sampling plans may be evaluated by calculating their consumer and producer risks. The consumer risk associated with a specified plan is the probability that the plan will accept an unacceptable batch (i.e. a batch that exceeds the permitted level of toxin), whereas the producer risk is the probability that the plan will reject an acceptable batch (i.e. a batch that does not exceed the permitted level). A well-designed sampling plan will attain an acceptable balance between the two types of risk.
For any given sampling plan, the magnitude of the consumer risk and producer risk can be estimated by constructing an operating char-acteristic (OC) curve, which is a plot of the probability of the sampling plan accepting a batch as a function of the mean concentration of mycotoxin in the batch. The shape of the OC curve will be determined by the sample size, the size and degree of comminution of the subsample, the type and number of analyses performed, and the critical concentration of the sample. A typical OC curve is shown in Fig. 3.5, where the maximum permitted level of contamination is 20 µg/kg. An ideal sampling plan would be represented
Country Mc (μg/kg)a χc (μg/kg)b No. of samples Sample size (kg) Type of mill Subsample size (g) Analytical method
USA 20 15 3 21.8 Hammer 1100 TLC
United Kingdom 10 10 1 10.0 VCM 50 HPLC
The Netherlands 9 5 4 7.5 VCM 50 HPLC
Table 3.5. United States, United Kingdom, and Dutch sampling plans for the determination of aflatoxins in raw shelled groundnuts
HPLC, high-performance liquid chromatography; TLC, thin-layer chromatography; VCM, vertical cutter mill.a Mc is the maximum permitted level of total aflatoxins; for the Dutch plan, an Mc of 5 μg/kg aflatoxin B1 is assumed to be equivalent to 9 μg/kg total aflatoxins.b χc is the critical concentration of aflatoxin in the sample (i.e. the maximum level of aflatoxin permitted in the sample if the batch is to be accepted); for the Dutch plan, a χc of 3 μg/kg of aflatoxin B1 is assumed to be equivalent to 5 μg/kg total aflatoxins.Data summarized from Whitaker et al. (1995). C
HA
PTE
R 3

50
by the vertical line. Any practical OC curve, such as the one shown here, rejects some acceptable batches (designated as false positives, or producer risk) and accepts some unacceptable batches (designated as false negatives, or consumer risk). The consumer risk can be reduced by increasing the sample size (thereby also reducing the producer risk) and/or by decreasing the critical concentration (thereby increasing the producer risk).
5. Sample labelling and storage
An equally important facet of the whole sampling procedure is the accurate labelling and storage of samples, especially if they have been collected in the field and need to be transported to a laboratory for analysis. The underlying principle is to handle samples in such a way as to prevent spoilage before analysis and thus ensure that analyses reflect the mycotoxin levels in the commodity at the time of sampling. There are no universal guidelines for handling samples because the best practice will depend on the condition of the samples when collected and on the climate in which the work is being performed.
If samples are already dry, it is advisable to store them in polyethylene or glass bottles so that no moisture enters the sample. Storage of moist samples should be avoided. Samples should be dried as quickly as possible, after a subsample has been taken for moisture measurement (if this is to be determined). If drying cannot be carried out immediately, samples should be refrigerated, frozen, or sampled for mycotoxin analysis im-mediately. The samples should be transported to the laboratory as soon as possible and kept free of insect
infestation or moisture damage in transit and in the laboratory. If possible, the samples should be kept in cold storage at < 5 °C until ready for analysis. In the case of visibly moist samples, it is preferable to place these at –20 °C as soon as possible after collection and to maintain the samples at this temperature until ready for analysis. In handling the specimens subsequently, containers should be allowed to reach room temperature before opening. Lengthy storage of samples (> 3 months in cold storage, and > 6 months at –20 °C) before analysis should be avoided.
Care should be taken that samples are labelled with the correct sample number and other relevant information, such as the place and date of collection. A separate record of all collected samples should be kept. A copy of this record should be stored with the samples at all times and must include additional information about the quality of the commodity at the time of collection
(e.g. whether the grain was damaged in any way, how long it had been in storage, whether it had been exposed to heat treatment or dusted with any fungicides or insecticides).
6. Sample preparation methods
Because representative samples of foods and feeds are typically between 3 kg and 30 kg in size, it is essential that sampling procedures allow the preparation of laboratory samples that are representative of the original lot. Representative laboratory samples require successive comminution and dividing of the total sample, using either static or rotary dividers. Ideally, the comminution and division steps should be performed simultaneously using a subsampling mill. Such mills will convert large samples of edible nuts, oilseeds, or grains into comminuted, representative subsamples in a single operation.
Fig. 3.5. An operating characteristic curve defining the probability that the concentration of a sample (Cs) will compare to the acceptable concentration (Ca) of 20 µg/kg. Source: Whitaker et al. (2010), Fig. 10.2, p. 42; reproduced with kind permission from Springer Science+Business Media B.V.
Chapter 3. Sampling and sample preparation methods for determining concentrations of mycotoxins in foods and feeds
51
References
Food Standards Agency (2000). Ochratoxin A – comparison of sampling plans. Food Saf Bull, 124:11–12.
Freese L, Friedrich R, Kendall D, Tanner S (2000). Variability of deoxynivalenol measurements in barley. J AOAC Int, 83:1259–1263. PMID:11048870
GIPSA (1995). Grain Inspection Handbook, Book 1, Grain Sampling. Washington, DC: Grain Inspection, Packers and Stockyards Administration, U.S. Department of Agriculture.
Johansson AS, Whitaker TB, Giesbrecht FG et al. (2000a). Testing shelled corn for aflatoxin, Part II: modeling the observed distribution of aflatoxin test results. J AOAC Int, 83:1270–1278. PMID:11048872
Johansson AS, Whitaker TB, Giesbrecht FG et al. (2000b). Testing shelled corn for aflatoxin, Part III: evaluating the performance of aflatoxin sampling plans. J AOAC Int, 83:1279–1284. PMID:11048873
Johansson AS, Whitaker TB, Hagler WM Jr et al. (2000c). Testing shelled corn for aflatoxin, Part I: estimation of variance components. J AOAC Int, 83:1264–1269. PMID:11048871
Park DL, Whitaker TB, Giesbrecht FG, Njapau H (2000). Performance of three pneumatic probe samplers and four analytical methods used to estimate aflatoxins in bulk cottonseed. J AOAC Int, 83:1247–1251. PMID:11048868
SAS (1997). SAS software, version 6.12. Cary, NC: SAS Institute.
Sydenham EW, Shephard GS, Thiel PG et al. (1996). Liquid chromatographic determination of fumonisins B1, B2, and B3 in corn: AOAC-IUPAC Collaborative Study. J AOAC Int, 79:688–696. PMID:8634538
United Kingdom (1992). Aflatoxins in Nuts, Nut Products, Dried Figs and Dried Fig Products Regulations. The Great Britain Stationery Office (UK Statutory Instruments Series, No. 3236).
Whitaker TB, Hagler WM Jr, Giesbrecht FG, Johansson AS (2000). Sampling, sample preparation, and analytical variability associated with testing wheat for deoxynivalenol. J AOAC Int, 83:1285–1292. PMID:11048874
Whitaker TB, Slate AB, Doko MB et al., eds. (2010). Sampling Procedures to Detect Mycotoxins in Agricultural Commodities. Dordrecht: Springer.
Whitaker TB, Springer J, Defize PR et al. (1995). Evaluation of sampling plans used in the United States, United Kingdom, and The Netherlands to test raw shelled peanuts for aflatoxin. J AOAC Int, 78:1010–1018. PMID:7580312
Whitaker TB, Trucksess MW, Johansson AS et al. (1998). Variability associated with testing shelled corn for fumonisin. J AOAC Int, 81:1162–1168. PMID:9850578
Whitaker TB, Whitten ME, Monroe RJ (1976). Variability associated with testing cottonseed for aflatoxin. J Am Oil Chem Soc, 53:502–505. doi:10.1007/BF02636823 PMID:989053
Whitaker TB, Wiser EH (1969). Theoretical investigations into the accuracy of sampling shelled peanuts for aflatoxin. J Am Oil Chem Soc, 46:377–379.
CAST (2003). Mycotoxins: Risks in Plant, Animal, and Human Systems. Ames, IA: Council for Agricultural Science and Technology (Task Force Report No. 139).
Coker RD (1997). Mycotoxins and Their Control: Constraints and Opportunities. Chatham, United Kingdom: Natural Resources Institute, University of Greenwich (NRI Bulletin 73).
Coker RD (1998). Design of sampling plans for determination of mycotoxins in foods and feeds. In: Sinha KK, Bhatnagar D, eds. Mycotoxins in Agriculture and Food Safety. New York: Marcel Dekker, pp. 109–133.
Coker RD, Nagler MJ, Defize PR et al. (2000). Sampling plans for the determination of aflatoxin B1 in large shipments of animal feedstuffs. J AOAC Int, 83:1252–1258. PMID:11048869
European Commission (1991). Commission Decision 91/180/EEC of 14 February 1991 laying down certain methods of analysis and testing of raw milk and heat treated milk. Off J Eur Comm, L 93, 6–8.
European Commission (1998a). Commission Directive 98/53/EC of 16 July 1998 laying down the sampling methods and the methods of analysis for the official control of the levels of certain contaminants in foodstuffs. Off J Eur Comm, L 201:93–101.
European Commission (1998b). Commission Regulation (EC) No. 1525/98 of 16 July 1998 amending Regulation (EC) No. 194/97 of 31 January 1997 setting maximum levels for certain contaminants in foodstuffs. Off J Eur Comm, L 201:43–45.
FDA/ORA (1996). Compliance Policy Guide 7106.10, Section 527.400 Whole Milk, Low Fat Milk, Skim Milk – Aflatoxin M1. Washington, DC: U.S. Food and Drug Administration/Office of Regulatory Affairs, p. 219. Available at http://www.fda.gov/ICECI/ComplianceManuals/CompliancePolicyGuidanceManual/ucm 074482.htm.
CH
AP
TER
3


![NOMENCLATURE FOR SAMPLING IN ANALYTICAL ...iupac.org/publications/pac/1990/pdf/6206x1193.pdfSample preparation [Laboratory sample to test sample] Sampling stages Index 1194 Nomenclature](https://static.fdocuments.us/doc/165x107/5aa17c847f8b9a436d8baaf6/nomenclature-for-sampling-in-analytical-iupacorgpublicationspac1990pdf.jpg)