CHAPTER - IV SCIENTOMETRIC STUDY OF ANTIMICROBIAL AGENTS...
44
111 CHAPTER - IV SCIENTOMETRIC STUDY OF ANTIMICROBIAL AGENTS AND CHEMOTHERAPY JOURNAL 4.1 Introduction Purpose of present chapter is to measure productivity of scientists as well as productivity patterns of Antimicrobial Agents and Chemotherapy Journal. Evaluating the productivity of institutional research and developmental activities highlights the contribution of the institution and the individual scientists engaged in research. It also provides some insights into the complex dynamics of research activity and enables the science policy makers and science administrators to make available adequate facilities and direct the research activities in proper direction. A well known productivity indicator is the number of publications produced by scientists, institutions, or research groups. Over the years, Bibliometrics and Scientometric techniques have became tools to evaluate the productivity of research institutes, individual researchers. Therefore present chapter aims to measure productivity of scientists in Antimicrobial Agent and Chemotherapy Journal. Nowadays the Scientometrics studies include mainly the quantitative aspects of science (in cognitive, as well as in social context), has strengthened its position as a significant component of the general science of science, and it appears to be a complete disciplinary field with clearly outlined subjects of research, specific set of well elaborated research methods and techniques, a significant size of research community, numerous research institutions, regularly held conferences, etc. To measure productivity of scientists the collected data has been analyzed under following parameters, viz. 4.2. Author Productivity; 4.3. Authorship Pattern;
Transcript of CHAPTER - IV SCIENTOMETRIC STUDY OF ANTIMICROBIAL AGENTS...
111
CHAPTER - IV
SCIENTOMETRIC STUDY OF ANTIMICROBIAL AGENTS AND
CHEMOTHERAPY JOURNAL
4.1 Introduction
Purpose of present chapter is to measure productivity of scientists as well as
productivity patterns of Antimicrobial Agents and Chemotherapy Journal.
Evaluating the productivity of institutional research and developmental
activities highlights the contribution of the institution and the individual scientists
engaged in research. It also provides some insights into the complex dynamics of
research activity and enables the science policy makers and science administrators to
make available adequate facilities and direct the research activities in proper direction.
A well known productivity indicator is the number of publications produced by
scientists, institutions, or research groups. Over the years, Bibliometrics and
Scientometric techniques have became tools to evaluate the productivity of research
institutes, individual researchers. Therefore present chapter aims to measure
productivity of scientists in Antimicrobial Agent and Chemotherapy Journal.
Nowadays the Scientometrics studies include mainly the quantitative aspects
of science (in cognitive, as well as in social context), has strengthened its position as a
significant component of the general science of science, and it appears to be a
complete disciplinary field with clearly outlined subjects of research, specific set of
well elaborated research methods and techniques, a significant size of research
community, numerous research institutions, regularly held conferences, etc.
To measure productivity of scientists the collected data has been analyzed
under following parameters, viz.
4.2. Author Productivity;
4.3. Authorship Pattern;

112
4.2 Author productivity
The term author productivity, scientific productivity, publication productivity
and trends of publications are used synonymously. A well known productivity
indicator is the number of publications produced by scientists, institutions, or research
groups. Regarding the author productivity one can say that, author productivity means
“authors productiveness or author’s efficiency in publication”. In other words author
productivity can be explained as the effectiveness of productive efforts to produce
fruitful publication. Scientometric and Bibliometric techniques have become tools to
evaluate the productivity of research institutes, individual researcher, as well as to
map the growth of the research field.
To analyze author productivity following parameters were considered.
4.2.1 Rank list of authors
4.2.1.1 Rank list of authors: Author at any position
4.2.1.2 Rank list of authors: Author at first position
4.2.2 Bradford’s Law
4.2.3 Lotka’s Law
4.2.4 Price square root law of scientific productivity
4.2.5 Year wise productivity and growth of literature
4.2.6 Year wise productivity of Key authors
4.2.7 Gender wise productivity
4.2.7.1 Chi square test
4.2.8 Subject wise productivity
4.2.9 Department wise productivity
4.2.10 Institution wise productivity
4.2.11 Country wise productivity
4.2.1 Rank list of authors
In the age of science, there is competition. Every person has to prove himself
physically, economically and intellectually fit. Intellectual mapping shows the rank of
person.

113
An attempt was made to analyze the total publications of authors writing in
Antimicrobial Agents and Chemotherapy Journal, to see who is the topper in
publications. The collected data has been analysed under the headings.
• Rank list of authors: Author at any position;
• Rank list of authors: Author at first position.
4.2.1.1 Rank list of Authors: Author at any Position
In antimicrobial agents and chemotherapy journal in all 44119 authors have
contributed 20114 papers, i.e. 2.19 authors per paper and 0.45 papers per author.
Attempt has been further made to rank the authors in the decreasing order of
productivity, which is shown in table no. 4.2.1.1.1.
Table No. 4.2.1.1.1: Rank list of Authors: Author at any position
Rank Authors Total Percentage
1 Appelbaum, Peter.C 156 0.78
2 Courvalin, Patrice.M 133 0.66
3 Nordmann, Patrice 132 0.66
4 Jones, Ronald.N 131 0.65
5 Mitsuhashi, Susumu 123 0.61
6 Drusano, George.L 113 0.56
7 Jacobs, Michael R 112 0.56
8 Neu, Harold.C 106 0.53
9 Clercq, Erik.DE 101 0.5
10 Walsh, Thomas.J 97 0.48
11 Poirel, Laurent 96 0.48
12 Barry, Arthur.L 85 0.42
12 Moellering, Robert.C 85 0.42
13 Thornsberry,Clyde 81 0.4
14 Rybak, Michael J 80 0.4
15 Bergeron, Michel.G 79 0.39
16 Bodey, Gerald.P 77 0.38
16 Carbon, Claude 77 0.38
16 Eliopoulos, George M. 77 0.38
16 Wise, Richard 77 0.38

114
17 Schinazi, Raymond.F 73 0.36
18 Stevens, David.A 72 0.36
19 Bush, Karen 70 0.35
20 Inoue, Matsuhisa 68 0.34
21 Baquero, Fernando 67 0.33
21 Goldstein, Ellie.J.C 67 0.33
21 Graybill, John.Richard 67 0.33
22 Sanders, Christine.C 64 0.32
23 Rinaldi, Michael G 63 0.31
24 Citron, Diane M 62 0.31
24 Pfaller, Michael.A 62 0.31
24 Rossolini, Gian Maria 62 0.31
The table no. 4.2.1.1.1 shows authors from amongst 44119 authors at any
position. Authors only upto 24th
rank have been presented. It was found that
Appelbaum, Peter. C has published maximum, i.e. 156 publications, and is topper
amongst all authors. Courvalin, Patrice.M 2nd
in rank followed by Nordmann, Patrice,
Jones Ronald. N, Mitsuhashi Susumu in 3rd
, 4th
and 5th
rank respectively.
The table no. 4.2.1.1.1 represents authors belonging to Editorial Board in Bold
letters. Eliopulos, George. M is chief editor of this journal. He has published 77
papers at any position. It was observed that from the year 1972 to 2010 the journal
had 554 experts on the editorial board. Of 554 experts, 408 have published 7136
articles in the journal, and i.e. from amongst editorial board 73.65% have published
their papers in the journal. It can be further noted from the table 4.2.1.1.1 that upto
15th
rank, 12 are from the editorial board as well as first two ranked viz. Appelbaum,
Peter. C, Courvalin, Patrice.M are from editorial board. This indicates that “Experts
on editorial board write more papers in the journal” (Hypothesis no. 1) is valid.
4.2.1.2 Rank List of Authors: Author at first position
Attempt was made to arrange the authors appearing at first-position in
decreasing order of productivity in the journal under study, In all there were 11764
authors with 31 ranks, however, the table 4.2.1.2.1 represents only first 16 ranks.
Table No. 4.2.1.1.1: Rank list of Authors: Author at any position Cont…
115
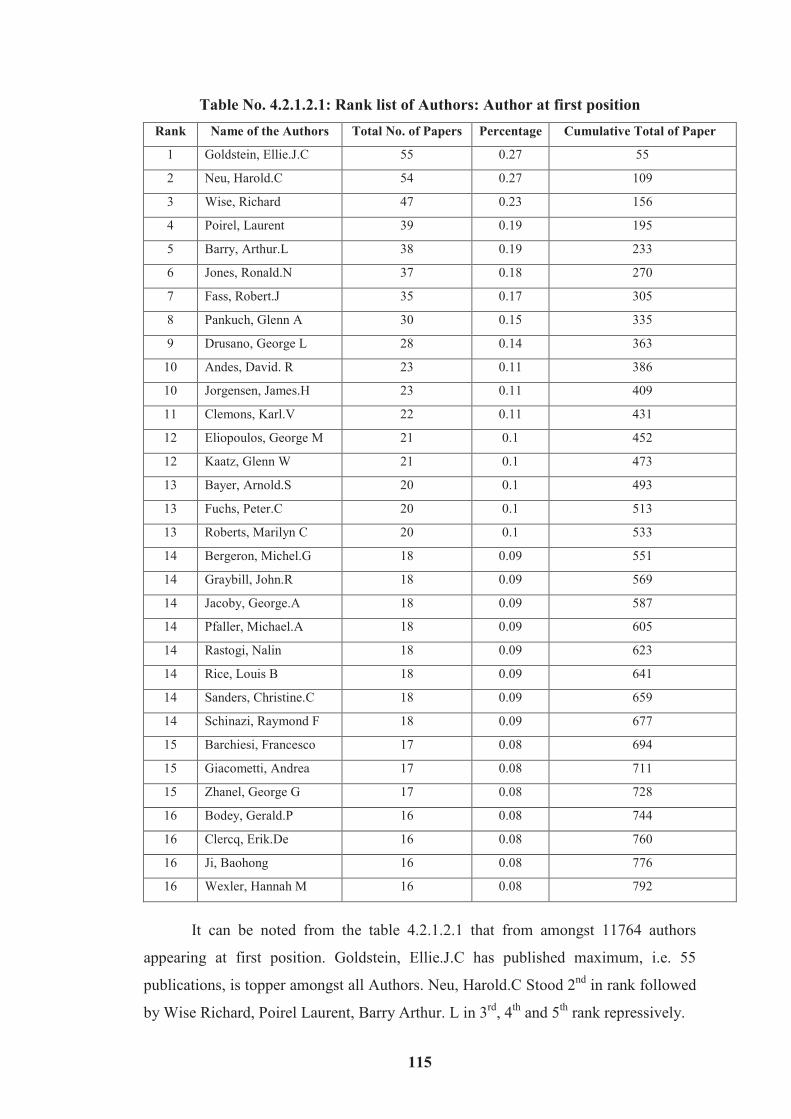
Table No. 4.2.1.2.1: Rank list of Authors: Author at first position
Rank Name of the Authors Total No. of Papers Percentage Cumulative Total of Paper
1 Goldstein, Ellie.J.C 55 0.27 55
2 Neu, Harold.C 54 0.27 109
3 Wise, Richard 47 0.23 156
4 Poirel, Laurent 39 0.19 195
5 Barry, Arthur.L 38 0.19 233
6 Jones, Ronald.N 37 0.18 270
7 Fass, Robert.J 35 0.17 305
8 Pankuch, Glenn A 30 0.15 335
9 Drusano, George L 28 0.14 363
10 Andes, David. R 23 0.11 386
10 Jorgensen, James.H 23 0.11 409
11 Clemons, Karl.V 22 0.11 431
12 Eliopoulos, George M 21 0.1 452
12 Kaatz, Glenn W 21 0.1 473
13 Bayer, Arnold.S 20 0.1 493
13 Fuchs, Peter.C 20 0.1 513
13 Roberts, Marilyn C 20 0.1 533
14 Bergeron, Michel.G 18 0.09 551
14 Graybill, John.R 18 0.09 569
14 Jacoby, George.A 18 0.09 587
14 Pfaller, Michael.A 18 0.09 605
14 Rastogi, Nalin 18 0.09 623
14 Rice, Louis B 18 0.09 641
14 Sanders, Christine.C 18 0.09 659
14 Schinazi, Raymond F 18 0.09 677
15 Barchiesi, Francesco 17 0.08 694
15 Giacometti, Andrea 17 0.08 711
15 Zhanel, George G 17 0.08 728
16 Bodey, Gerald.P 16 0.08 744
16 Clercq, Erik.De 16 0.08 760
16 Ji, Baohong 16 0.08 776
16 Wexler, Hannah M 16 0.08 792
It can be noted from the table 4.2.1.2.1 that from amongst 11764 authors
appearing at first position. Goldstein, Ellie.J.C has published maximum, i.e. 55
publications, is topper amongst all Authors. Neu, Harold.C Stood 2nd
in rank followed
by Wise Richard, Poirel Laurent, Barry Arthur. L in 3rd
, 4th
and 5th
rank repressively.

116
The table 4.2.1.2.1 also shows the authors on editorial board in bold letters.
Eliopulos, George. M is chief editor of this journal. He has published 21 papers at first
position. It was observed that from the year 1972 to 2010 of the total 554 experts
representing editorial board of the journal, 307 having first position in authorship
have published 1645 papers, i.e. 55.42% experts from editorial board have published
their papers having first position in authorship. It can be further noted from the table
4.2.1.2.1 that upto 15th
rank, 19 authors are from editorial board. This indicates that
“Experts on editorial board write more papers in the journals” (Hypothesis no.
1) is valid.
4.2.2 Bradford’s Law
In 1934 Samuel Clement Bradford has formulated the law of Scattering to
describe the distribution of articles on a particular subject in different periodicals. His
article, “Sources of information on specific subject” was the first publication on
observation on scattering. He explained his empirical law as:
“If scientific journals are arranged in order of decreasing productivity of
articles on a given subject, they may be divided into a nucleus of three zones and
succeeding zones will be 1:n: n2.”
In the present set of data number of authors have been arranged in order of
decreasing productivity of articles. They were divided in a nucleus of 3 equal zones.
Which is shown in Table No. 4.2.2.1 Numbers of articles in each zone were more or
less equal, while number authors were increasing in each zone. Which means the data
verbally fits into the Bradford’s law, however, the data does not fit into the Bradford’s
law mathematically, hence attempt has been made to represent the data graphically.
Table No.4.2.2.1: Bradford’s Law of Scattering
Zones No. of Papers No. of Authors
I 6671 1178
II 6671 3916
III 6672 6670

117
Figure No. 4.2.2.1: Bradford’s Law of Scattering
�
Bradford’s graph of cumulative number of papers versus cumulative number
of authors is given here. The rising part of the graph represents the highly productive
authors. The point’s p1, p2, and p3 on graph are the boundaries of three equiproductive
zones in which the same number of articles are covered while number of authors in
each zones are in increasing order.
The attempt was made to test applicability of Bradford’s Law of scattering, as
shown in figure no. 4.2.2.1. The total numbers of 20014 publications of 11764 authors
were divided into 3 equal zones, while number of authors writing similar numbers of
papers in each zone are increasing which indicates that data does not fits into the
Bradford’s law of scattering.
The figure 4.2.2.1 is a graph showing on x axis cumulative number of authors
while on y axis cumulative number of papers & a graph was plotted. From y axis a
perpendicular was drawn on the graph showing three equal zones of papers i.e. Q1P1,
Q2P2, Q3P3: Again from x-axis a perpendiculars were drawn intersecting the points
M1P1, M2P2, M3P3. It can be observed that M1P1 first zone covers 1178 authors, M2P2

118
second zone covers the next 3916 authors and third zone M3P3 covers the rest of the
6670 authors.
According to Bradford, the relationship between the zones is 1: a: a2 while the
relationship in each ones of the present studies is 1178: 3916: 6670 which does not fit
into the Bradford’s distribution mathematically, but data fits into Bradford’s Law
verbally.
4.2.3 Lotka’s Law
Lotka (1926) proposed his ‘Inverse square law of scientific productivity’ for
measuring scientific productivity of authors in a given discipline. It is one of the
earliest studies in the direction of measuring scientific productivity using the number
of publications of an author as a measure. Lotka summarized his law “the number of
persons making two contributions is about one-forth of those making one; the number
making three contributions is about one-ninth etc., the number making ‘n’
contributions is about 1/n2
of those making one; and the proportion of all contributors
who make a single contribution is about 60 percent.”
Lotka’s Law has been widely applied to various disciplines, such as
humanities, Information science, computer science, library science, Indian earth
science, psychology, biochemical literature etc. (Parvathamma, 1993).
An attempt was made to apply the Lotka’s Law to the publications of authors
of Antimicrobial agents and chemotherapy journal. Hence the data collected has been
arranged in increasing order of productivity and is presented in Table No. 4.2.3.1.
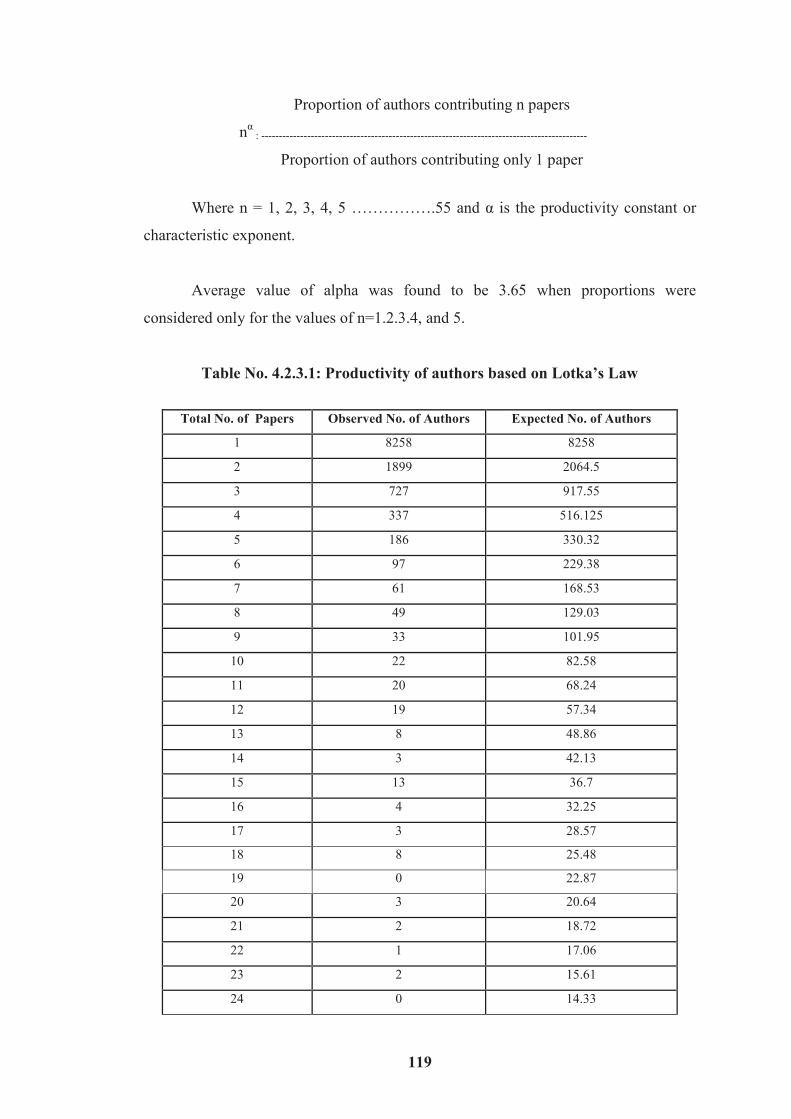
It can be observed form the table 4.2.3.1 that even though number of authors
writing more papers are decreasing, the productivity distribution of data does not fit
when Lotka’s inverse square law applied to it. Therefore a different procedure was
followed to process the data by calculating the values of exponent by mathematical
method.
The value of �, the productivity constant was determined by using following
formula for the data when full authorship was given only to first authors:
119
Proportion of authors contributing n papers
n�
: --------------------------------------------------------------------------------------------
Proportion of authors contributing only 1 paper
Where n = 1, 2, 3, 4, 5 …………….55 and � is the productivity constant or
characteristic exponent.
Average value of alpha was found to be 3.65 when proportions were
considered only for the values of n=1.2.3.4, and 5.
Table No. 4.2.3.1: Productivity of authors based on Lotka’s Law
Total No. of Papers Observed No. of Authors Expected No. of Authors
1 8258 8258
2 1899 2064.5
3 727 917.55
4 337 516.125
5 186 330.32
6 97 229.38
7 61 168.53
8 49 129.03
9 33 101.95
10 22 82.58
11 20 68.24
12 19 57.34
13 8 48.86
14 3 42.13
15 13 36.7
16 4 32.25
17 3 28.57
18 8 25.48
19 0 22.87
20 3 20.64
21 2 18.72
22 1 17.06
23 2 15.61
24 0 14.33
120
25 0 13.12
26 0 12.21
27 0 11.32
28 1 10.53
29 0 9.81
30 1 9.17
31 0 8.59
32 0 8.06
33 0 7.58
34 0 7.14
35 1 6.74
36 0 6.37
37 1 6.03
38 1 5.71
39 1 5.42
40 0 5.16
41 0 4.91
42 0 4.68
43 0 4.46
44 0 4.26
45 0 4.07
46 0 3.9
47 1 3.73
48 0 3.58
49 0 3.43
50 0 3.3
51 0 3.17
52 0 3.05
53 0 2.93
54 1 2.83
55 1 2.72
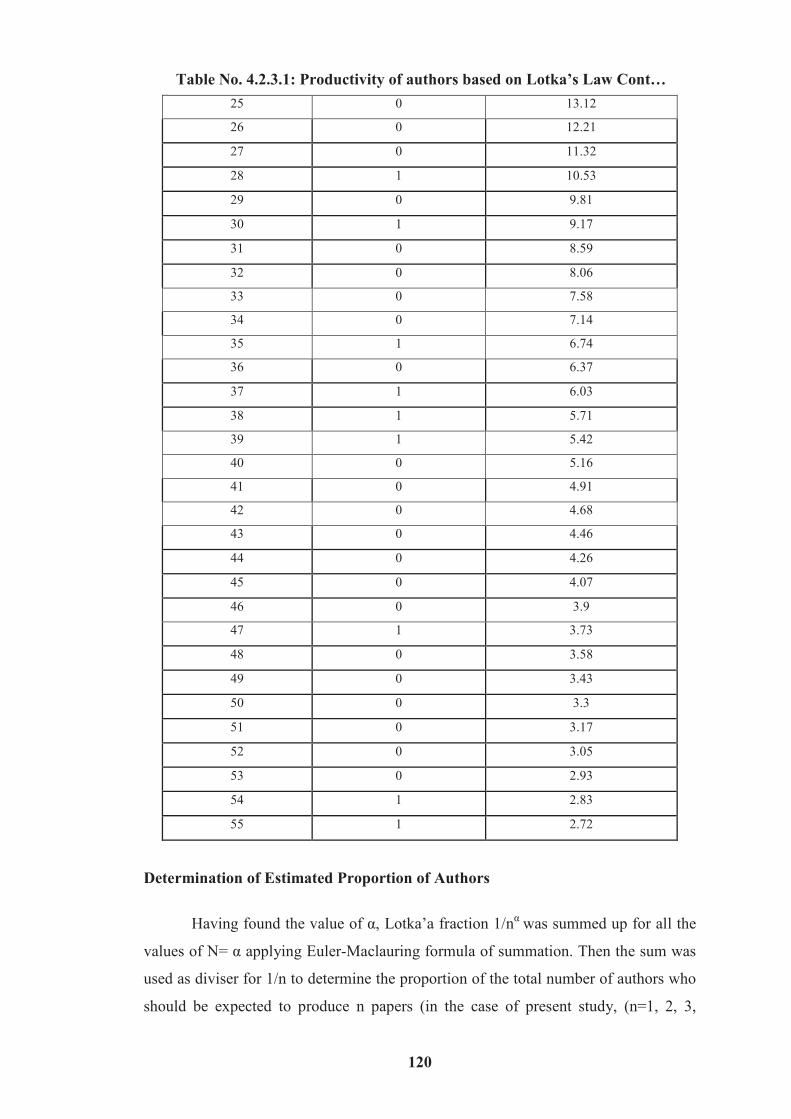
Determination of Estimated Proportion of Authors
Having found the value of �, Lotka’a fraction 1/n�
was summed up for all the
values of N= � applying Euler-Maclauring formula of summation. Then the sum was
used as diviser for 1/n to determine the proportion of the total number of authors who
should be expected to produce n papers (in the case of present study, (n=1, 2, 3,
Table No. 4.2.3.1: Productivity of authors based on Lotka’s Law Cont…
121
4…55). Following formula was used to find the proportions, first the value of S was
calculated by using the formula;
S= �1/n� = �1/n
3.65 = 1.111007146
n=1 n=1
For present study where S=sum of Lotka’s modified ratio for the value of �
=3.65 which is equal to 1.111007146.
The expected number of authors (An) was calculated for present set of data by
using the formula:
1/n�
An= ------- x T
S
Where � is the productivity constant T is total number of authors An is the
total number of expected authors producing n papers.
Where n=1, 2, 3, 4, 5…..55 the values for An are shown in table no. 4.2.3.2
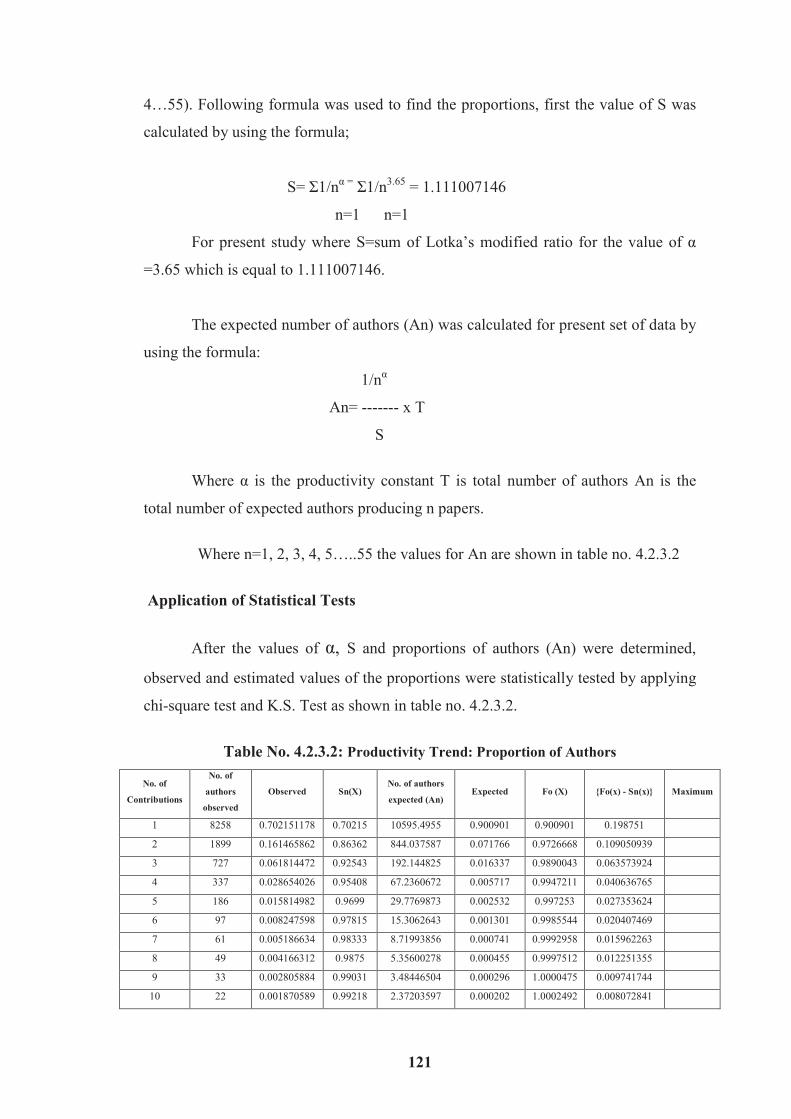
Application of Statistical Tests
After the values of �, S and proportions of authors (An) were determined,
observed and estimated values of the proportions were statistically tested by applying
chi-square test and K.S. Test as shown in table no. 4.2.3.2.
Table No. 4.2.3.2: Productivity Trend: Proportion of Authors
No. of
Contributions
No. of
authors
observed
Observed Sn(X) No. of authors
expected (An) Expected Fo (X) {Fo(x) - Sn(x)} Maximum
1 8258 0.702151178 0.70215 10595.4955 0.900901 0.900901 0.198751
2 1899 0.161465862 0.86362 844.037587 0.071766 0.9726668 0.109050939
3 727 0.061814472 0.92543 192.144825 0.016337 0.9890043 0.063573924
4 337 0.028654026 0.95408 67.2360672 0.005717 0.9947211 0.040636765
5 186 0.015814982 0.9699 29.7769873 0.002532 0.997253 0.027353624
6 97 0.008247598 0.97815 15.3062643 0.001301 0.9985544 0.020407469
7 61 0.005186634 0.98333 8.71993856 0.000741 0.9992958 0.015962263
8 49 0.004166312 0.9875 5.35600278 0.000455 0.9997512 0.012251355
9 33 0.002805884 0.99031 3.48446504 0.000296 1.0000475 0.009741744
10 22 0.001870589 0.99218 2.37203597 0.000202 1.0002492 0.008072841

122
11 20 0.001700536 0.99388 1.67508932 0.000142 1.0003916 0.006514733
12 19 0.001615509 0.99549 1.21929761 0.000104 1.0004953 0.005002897
13 8 0.000680214 0.99617 0.91103912 7.75E-05 1.0005728 0.004400145
14 3 0.00025508 0.99643 0.69463065 5.91E-05 1.0006318 0.004204127
15 13 0.001105348 0.99753 0.53999306 4.59E-05 1.0006777 0.003144693
16 4 0.000340107 0.99787 0.42666138 3.63E-05 1.000714 0.002840863
17 3 0.00025508 0.99813 0.34196583 2.91E-05 1.0007431 0.002614859
18 8 0.000680214 0.99881 0.27757262 2.36E-05 1.0007667 0.001958246
19 0 0 0.99881 0.22786133 1.94E-05 1.0007861 0.00197762
20 3 0.00025508 0.99906 0.18895648 1.61E-05 1.0008021 0.001738606
21 2 0.000170054 0.99923 0.15813239 1.34E-05 1.0008156 0.001581998
22 1 8.50268E-05 0.99932 0.13343768 1.13E-05 1.0008269 0.001508317
23 2 0.000170054 0.99949 0.11345266 9.65E-06 1.0008366 0.00134791
24 0 0 0.99949 0.0971293 8.26E-06 1.0008448 0.001356169
25 0 0 0.99949 0.08368358 7.12E-06 1.0008519 0.001363284
26 0 0 0.99949 0.0725218 6.17E-06 1.0008581 0.001369451
27 0 0 0.99949 0.0631893 5.37E-06 1.0008635 0.001374823
28 1 8.50268E-05 0.99957 0.05533431 4.7E-06 1.0008682 0.001294501
29 0 0 0.99957 0.04868202 4.14E-06 1.0008723 0.001298641
30 1 8.50268E-05 0.99966 0.04301587 3.66E-06 1.000876 0.001217271
31 0 0 0.99966 0.03816375 3.24E-06 1.0008792 0.001220516
32 0 0 0.99966 0.03398786 2.89E-06 1.0008821 0.001223406
33 0 0 0.99966 0.03037704 2.58E-06 1.0008847 0.001225989
34 0 0 0.99966 0.02724101 2.32E-06 1.000887 0.001228305
35 1 8.50268E-05 0.99974 0.02450603 2.08E-06 1.0008891 0.001145362
36 0 0 0.99974 0.02211145 1.88E-06 1.000891 0.001147242
37 1 8.50268E-05 0.99983 0.02000714 1.7E-06 1.0008927 0.001063917
38 1 8.50268E-05 0.99991 0.01815144 1.54E-06 1.0008942 0.000980433
39 1 8.50268E-05 1 0.01650956 1.4E-06 1.0008956 0.00089681
40 0 0 1 0.01505228 1.28E-06 1.0008969 0.00089809
41 0 0 1 0.01375499 1.17E-06 1.0008981 0.00089926
42 0 0 1 0.01259683 1.07E-06 1.0008992 0.000900331
43 0 0 1 0.0115601 9.83E-07 1.0009001 0.000901314
44 0 0 1 0.01062965 9.04E-07 1.000901 0.000902217
45 0 0 1 0.00979255 8.33E-07 1.0009019 0.00090305
46 0 0 1 0.00903764 7.68E-07 1.0009026 0.000903818
47 1 8.50268E-05 1.00008 0.00835534 7.1E-07 1.0009034 0.000819502
48 0 0 1.00008 0.00773732 6.58E-07 1.000904 0.00082016
49 0 0 1.00008 0.00717638 6.1E-07 1.0009046 0.00082077
50 0 0 1.00008 0.00666624 5.67E-07 1.0009052 0.000821337
51 0 0 1.00008 0.00620141 5.27E-07 1.0009057 0.000821864
52 0 0 1.00008 0.00577709 4.91E-07 1.0009062 0.000822355
53 0 0 1.00008 0.00538908 4.58E-07 1.0009067 0.000822814
54 1 8.50268E-05 1.00017 0.00503366 4.28E-07 1.0009071 0.000738215
55 1 8.50268E-05 1.00025 0.00470758 4E-07 1.0009075 0.000653588
11764 1.000255081 11771.67184 1.000906257
Table No. 4.2.3.2: Productivity Trend: Proportion of Authors Cont…
123
The table depicts productivity trend with trend in proportion of authors where
only first authors were considered with exponent value of � = 3.65
Dmax =0.198751
Dmax =�Fo (x) – Sn (x) �= 0.198751
At 0.01 level of significance K-S. static = 1.63 / sqrt (11764) = 0.01503022
Dmax=0.198751>0.01503022
Therefore data does not fit into generalised form of lotka’s law with exponent
value of �=3.65.
4.2.4 Price Square root law of scientific productivity
An attempt was made to analyze distribution of publications of Antimicrobial
agents and chemotherapy journal in increasing order of productivity. The distribution
of authors and their contributions are presented in table no. 4.2.4.1.
It can be observed from table no. 4.2.4.1 that, distribution is characterized by
dispersion of papers over a large number of researchers with low productivity and the
concentration of contributions is in the hands of few highly productive authors. It can
be observed that 70.20% of authors have published 8258 papers, and they represent as
a whole 41.26% of total contributions. On the other hand 29.80% of the total authors
have contributed 11756 papers representing 58.74% of the total papers produced.
Sengupta (1990) has stated the Price Square Root Law as the “Half of the
scientific papers are contributed by the square root of the total number of scientific
authors.” De Solla Price in the article of Gupta, et.al. (1991) states that, “half of the
published research output in any subject should be contributed by highly productive
subject of authors approximately equal to the square root of the total number of
publishing in that area.” This is called Price Square Root Law. Another similar
generalization has been observed and is known as 80/20 rule. This rule states that 80
per cent of the total research papers in any subject field are approximately accounted
by 20 per cent of the most productive authors.

124
An attempt has been made to test these two generalizations on the present
data, which is shown in table no. 4.2.4.2.
Table No. 4.2.4.1: Distribution of publications
Author Total contributionsNo. of Papers
No. Percentage No. Percentage
1 8258 70.20 8258 41.26
2 1899 16.14 3798 18.98
3 727 6.18 2181 10.90
4 337 2.86 1348 6.74
5 186 1.58 930 4.65
6 97 0.82 582 2.91
7 61 0.52 427 2.13
8 49 0.42 392 1.96
9 33 0.28 297 1.48
10 22 0.19 220 1.10
11 20 0.17 220 1.10
12 19 0.16 228 1.14
13 8 0.07 104 0.52
14 3 0.03 42 0.21
15 13 0.11 195 0.97
16 4 0.03 64 0.32
17 3 0.07 51 0.25
18 8 0.03 144 0.72
20 3 0.02 60 0.30
21 2 0.01 42 0.21
22 1 0.01 22 0.11
23 2 0.02 46 0.23
28 1 0.01 28 0.14
30 1 0.01 30 0.15
35 1 0.01 35 0.17
37 1 0.01 37 0.18
38 1 0.01 38 0.19
39 1 0.01 39 0.19
47 1 0.01 47 0.23
54 1 0.01 54 0.27
55 1 0.01 55 0.27
11761 100 20014 100
125
Table No. 4.2.4.2: Applicability of Price’s Square Root Law and 80/20 Rules
Authors No. of Authors No. of Papers Percentage
Square root of Total no. of Authors 108.4481442 1711 8.54
10% 1176.10 6665 33.30
20% 2352.20 9448 47.20
30% 3528.30 11778 58.84
40% 4704.40 12955 64.72
50% 5880.50 14131 70.60
60% 7056.60 15308 76.48
70% 8232.70 16484 82.36
80% 9408.80 17660 88.23
90% 10584.90 18836 94.11
100% 11761 20014 100.00
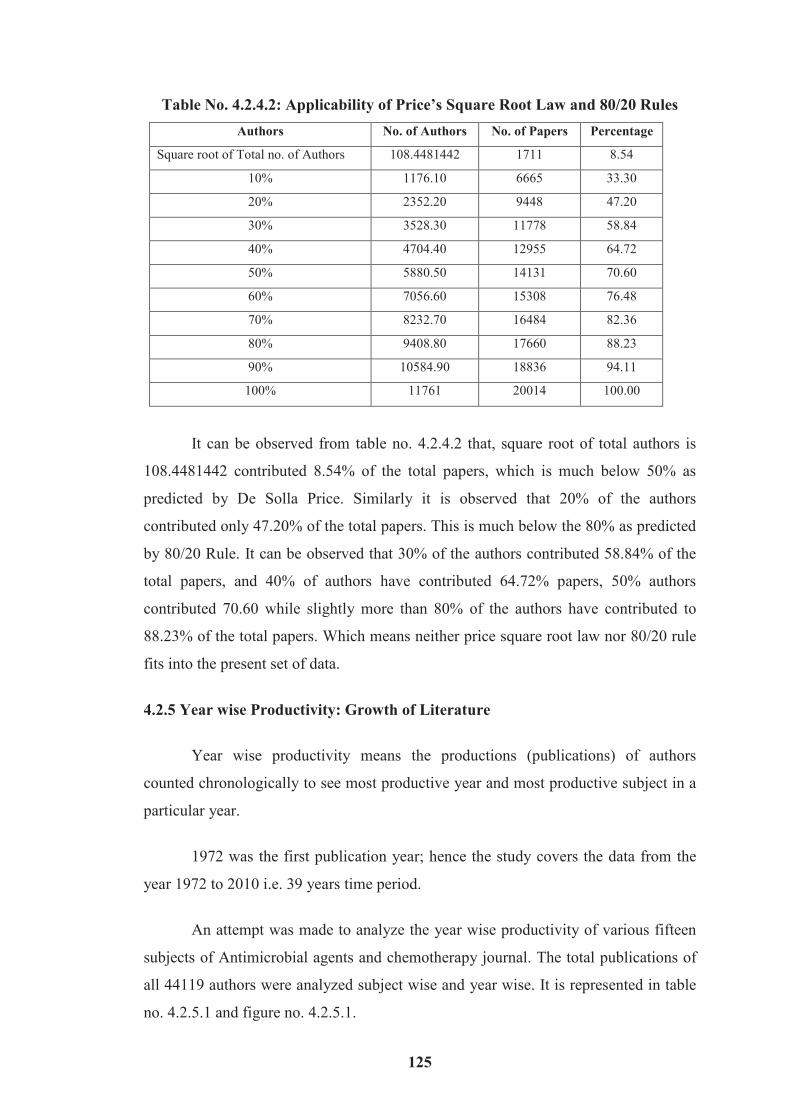
It can be observed from table no. 4.2.4.2 that, square root of total authors is
108.4481442 contributed 8.54% of the total papers, which is much below 50% as
predicted by De Solla Price. Similarly it is observed that 20% of the authors
contributed only 47.20% of the total papers. This is much below the 80% as predicted
by 80/20 Rule. It can be observed that 30% of the authors contributed 58.84% of the
total papers, and 40% of authors have contributed 64.72% papers, 50% authors
contributed 70.60 while slightly more than 80% of the authors have contributed to
88.23% of the total papers. Which means neither price square root law nor 80/20 rule
fits into the present set of data.
4.2.5 Year wise Productivity: Growth of Literature
Year wise productivity means the productions (publications) of authors
counted chronologically to see most productive year and most productive subject in a
particular year.
1972 was the first publication year; hence the study covers the data from the
year 1972 to 2010 i.e. 39 years time period.
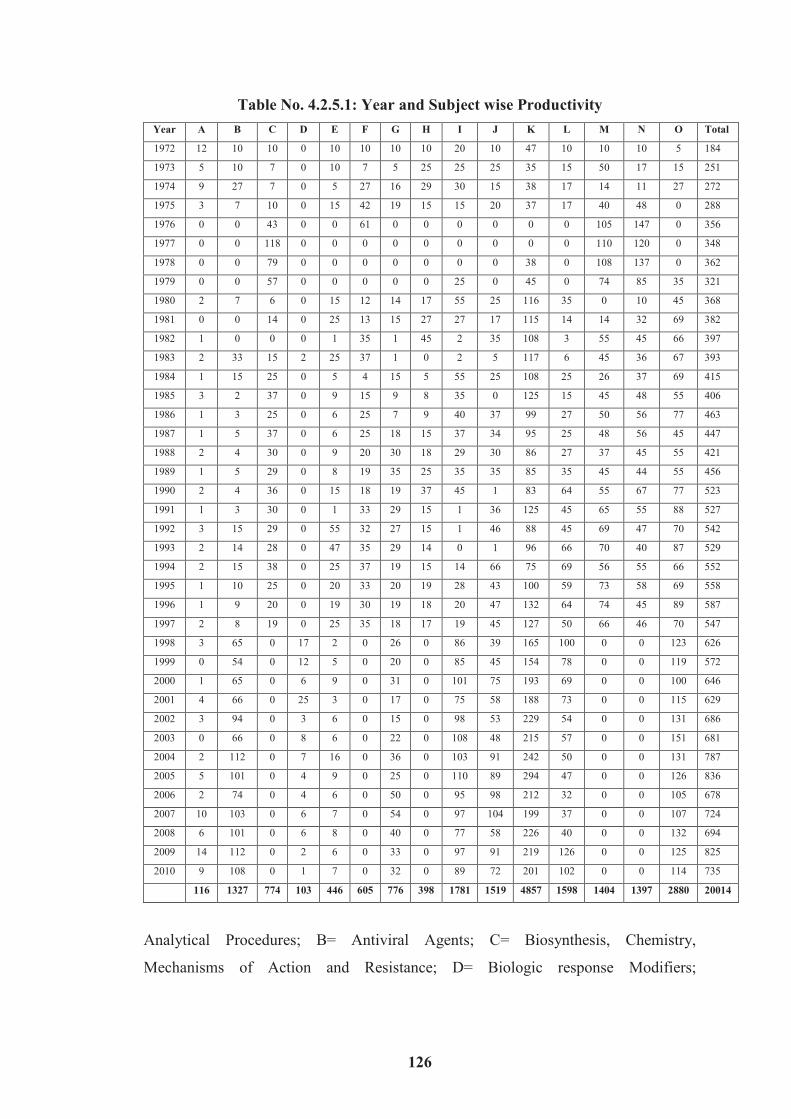
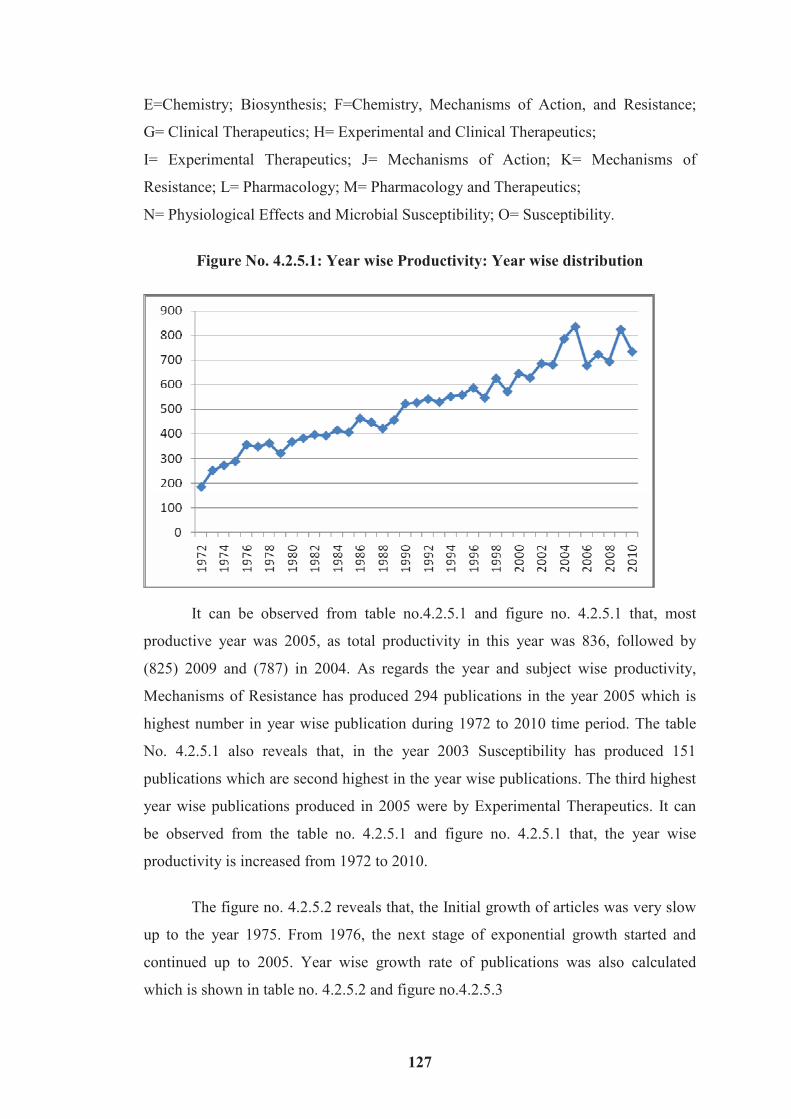
An attempt was made to analyze the year wise productivity of various fifteen
subjects of Antimicrobial agents and chemotherapy journal. The total publications of
all 44119 authors were analyzed subject wise and year wise. It is represented in table
no. 4.2.5.1 and figure no. 4.2.5.1.
126
Table No. 4.2.5.1: Year and Subject wise Productivity
Year A B C D E F G H I J K L M N O Total
1972 12 10 10 0 10 10 10 10 20 10 47 10 10 10 5 184
1973 5 10 7 0 10 7 5 25 25 25 35 15 50 17 15 251
1974 9 27 7 0 5 27 16 29 30 15 38 17 14 11 27 272
1975 3 7 10 0 15 42 19 15 15 20 37 17 40 48 0 288
1976 0 0 43 0 0 61 0 0 0 0 0 0 105 147 0 356
1977 0 0 118 0 0 0 0 0 0 0 0 0 110 120 0 348
1978 0 0 79 0 0 0 0 0 0 0 38 0 108 137 0 362
1979 0 0 57 0 0 0 0 0 25 0 45 0 74 85 35 321
1980 2 7 6 0 15 12 14 17 55 25 116 35 0 10 45 368
1981 0 0 14 0 25 13 15 27 27 17 115 14 14 32 69 382
1982 1 0 0 0 1 35 1 45 2 35 108 3 55 45 66 397
1983 2 33 15 2 25 37 1 0 2 5 117 6 45 36 67 393
1984 1 15 25 0 5 4 15 5 55 25 108 25 26 37 69 415
1985 3 2 37 0 9 15 9 8 35 0 125 15 45 48 55 406
1986 1 3 25 0 6 25 7 9 40 37 99 27 50 56 77 463
1987 1 5 37 0 6 25 18 15 37 34 95 25 48 56 45 447
1988 2 4 30 0 9 20 30 18 29 30 86 27 37 45 55 421
1989 1 5 29 0 8 19 35 25 35 35 85 35 45 44 55 456
1990 2 4 36 0 15 18 19 37 45 1 83 64 55 67 77 523
1991 1 3 30 0 1 33 29 15 1 36 125 45 65 55 88 527
1992 3 15 29 0 55 32 27 15 1 46 88 45 69 47 70 542
1993 2 14 28 0 47 35 29 14 0 1 96 66 70 40 87 529
1994 2 15 38 0 25 37 19 15 14 66 75 69 56 55 66 552
1995 1 10 25 0 20 33 20 19 28 43 100 59 73 58 69 558
1996 1 9 20 0 19 30 19 18 20 47 132 64 74 45 89 587
1997 2 8 19 0 25 35 18 17 19 45 127 50 66 46 70 547
1998 3 65 0 17 2 0 26 0 86 39 165 100 0 0 123 626
1999 0 54 0 12 5 0 20 0 85 45 154 78 0 0 119 572
2000 1 65 0 6 9 0 31 0 101 75 193 69 0 0 100 646
2001 4 66 0 25 3 0 17 0 75 58 188 73 0 0 115 629
2002 3 94 0 3 6 0 15 0 98 53 229 54 0 0 131 686
2003 0 66 0 8 6 0 22 0 108 48 215 57 0 0 151 681
2004 2 112 0 7 16 0 36 0 103 91 242 50 0 0 131 787
2005 5 101 0 4 9 0 25 0 110 89 294 47 0 0 126 836
2006 2 74 0 4 6 0 50 0 95 98 212 32 0 0 105 678
2007 10 103 0 6 7 0 54 0 97 104 199 37 0 0 107 724
2008 6 101 0 6 8 0 40 0 77 58 226 40 0 0 132 694
2009 14 112 0 2 6 0 33 0 97 91 219 126 0 0 125 825
2010 9 108 0 1 7 0 32 0 89 72 201 102 0 0 114 735
116 1327 774 103 446 605 776 398 1781 1519 4857 1598 1404 1397 2880 20014
Analytical Procedures; B= Antiviral Agents; C= Biosynthesis, Chemistry,
Mechanisms of Action and Resistance; D= Biologic response Modifiers;
127
E=Chemistry; Biosynthesis; F=Chemistry, Mechanisms of Action, and Resistance;
G= Clinical Therapeutics; H= Experimental and Clinical Therapeutics;
I= Experimental Therapeutics; J= Mechanisms of Action; K= Mechanisms of
Resistance; L= Pharmacology; M= Pharmacology and Therapeutics;
N= Physiological Effects and Microbial Susceptibility; O= Susceptibility.
Figure No. 4.2.5.1: Year wise Productivity: Year wise distribution
�
It can be observed from table no.4.2.5.1 and figure no. 4.2.5.1 that, most
productive year was 2005, as total productivity in this year was 836, followed by
(825) 2009 and (787) in 2004. As regards the year and subject wise productivity,
Mechanisms of Resistance has produced 294 publications in the year 2005 which is
highest number in year wise publication during 1972 to 2010 time period. The table
No. 4.2.5.1 also reveals that, in the year 2003 Susceptibility has produced 151
publications which are second highest in the year wise publications. The third highest
year wise publications produced in 2005 were by Experimental Therapeutics. It can
be observed from the table no. 4.2.5.1 and figure no. 4.2.5.1 that, the year wise
productivity is increased from 1972 to 2010.
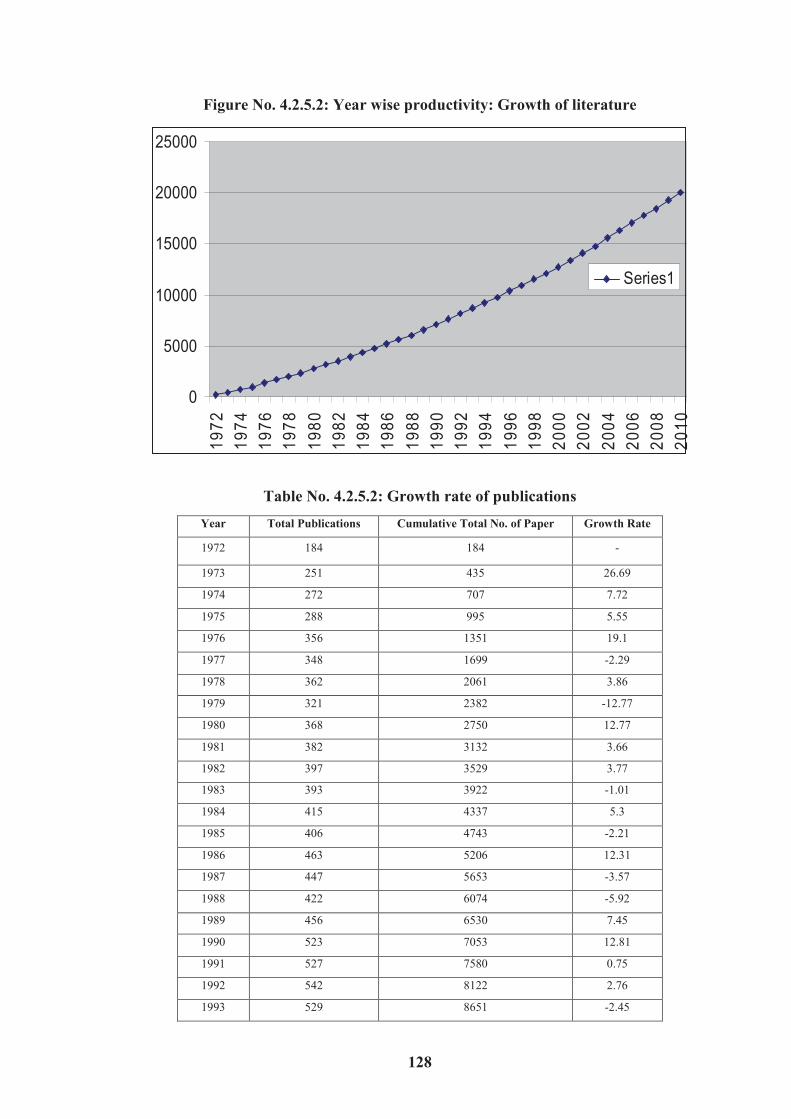
The figure no. 4.2.5.2 reveals that, the Initial growth of articles was very slow
up to the year 1975. From 1976, the next stage of exponential growth started and
continued up to 2005. Year wise growth rate of publications was also calculated
which is shown in table no. 4.2.5.2 and figure no.4.2.5.3
128
Figure No. 4.2.5.2: Year wise productivity: Growth of literature
0
5000
10000
15000
20000
25000
19
72
19
74
19
76
19
78
19
80
19
82
19
84
19
86
19
88
19
90
19
92
19
94
19
96
19
98
20
00
20
02
20
04
20
06
20
08
20
10
Series1
Table No. 4.2.5.2: Growth rate of publications
Year Total Publications Cumulative Total No. of Paper Growth Rate
1972 184 184 -
1973 251 435 26.69
1974 272 707 7.72
1975 288 995 5.55
1976 356 1351 19.1
1977 348 1699 -2.29
1978 362 2061 3.86
1979 321 2382 -12.77
1980 368 2750 12.77
1981 382 3132 3.66
1982 397 3529 3.77
1983 393 3922 -1.01
1984 415 4337 5.3
1985 406 4743 -2.21
1986 463 5206 12.31
1987 447 5653 -3.57
1988 422 6074 -5.92
1989 456 6530 7.45
1990 523 7053 12.81
1991 527 7580 0.75
1992 542 8122 2.76
1993 529 8651 -2.45
129
1994 552 9203 4.16
1995 558 9761 1.07
1996 587 10348 4.94
1997 547 10895 -7.31
1998 626 11521 12.61
1999 572 12093 -9.44
2000 646 12739 11.45
2001 628 13368 -2.86
2002 686 14054 8.45
2003 681 14735 -0.73
2004 787 15522 13.46
2005 836 16358 5.86
2006 678 17036 -23.3
2007 724 17760 6.35
2008 694 18454 -4.32
2009 825 19279 15.87
2010 735 20014 -12.24
Total 20014
Figure No. 4.2.5.3: Year wise growth rate of publications
-
-30
-20
-10
0
10
20
30
1972
1974
1976
1978
1980
1982
1984
1986
1988
1990
1992
1994
1996
1998
2000
2002
2004
2006
2008
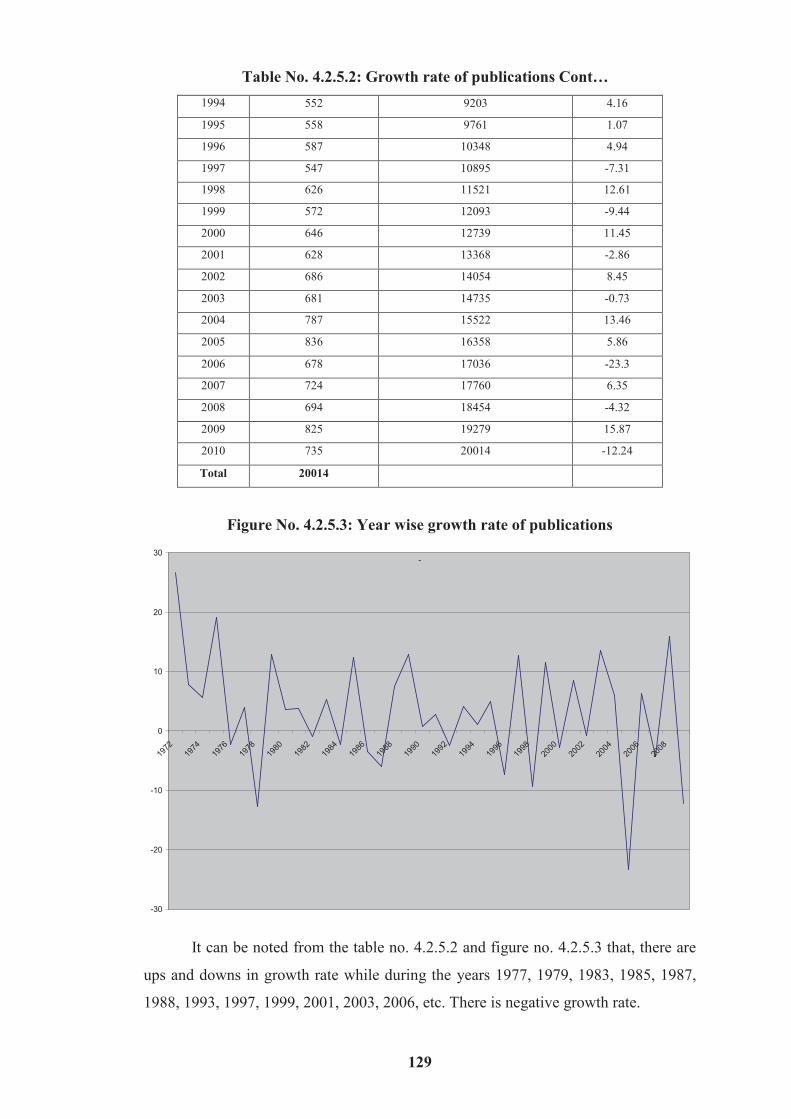
It can be noted from the table no. 4.2.5.2 and figure no. 4.2.5.3 that, there are
ups and downs in growth rate while during the years 1977, 1979, 1983, 1985, 1987,
1988, 1993, 1997, 1999, 2001, 2003, 2006, etc. There is negative growth rate.
Table No. 4.2.5.2: Growth rate of publications Cont…

130
4.2.6 Year wise productivity of Key authors
Year wise productivity deals with chronological distribution of publications. It
covers a specific period or time span. Key author means an author who produces more
research papers is called key author or an author who has published ten or more
articles in a year.
Year wise productivity of key author is given in ways two one is author at any
position and second is author at first position.
Year wise productivity of key authors (author at any position)
An attempt was made to analyze the data collected from Antimicrobial Agents
and Chemotherapy Journal, year wise to find out key authors. It was also observed
from the figure no 4.2.6.1 that, Appelbaum Peter. C Who has published 12 (1997), 14
(1998), 10 (2002), 11 (2003), 12 (2004), 11 (2006) and 11 (2009) articles during 1972
to 2010.
However as regards publication of maximum papers during productivity life,
Appelbaum Peter.C is the key author producing in all 156 papers.
Year wise productivity of key authors (author at first position)
It was also observed from the figure no 4.2.6.1 that, Goldstein, Ellie.J.C Who
has published 6 (1999), 5 (2002), 4 (2003) and 5 articles (2006) during 1972 to 2010.
However as regards publication of maximum papers during productivity life,
Goldstein, Ellie.J.C is the key author producing in all 55 papers.
Figure No. 4.2.6.1 Year wise Productivity of Key Authors

131
Table no. 4.2.6.1 shows Appelbaum, Peter.C and Goldstein, Ellie.J.C is key
authors. Most productivity year of Appelbaum is 1998 this year he published 14 articles
followed by 12 (1997), 11 (2003), 11 (2006) at any position. Goldstein’s most productivity
year is 1999 this year he published 6 articles, second most productivity is 1995, 2002, 2006
(5) followed by 4 (2003) at first position.
4.2.7 Gender wise productivity
Attempt has been made to analyze the data by gender of authors which is
presented in table no. 4.2.7.1
Table No.4.2.7.1: Productivity of Authors: Gender wise Distribution
Gender No. of Scientists No. of Publications Percentage
Male 10921 18477 92.32
Female 839 1537 7.68
Totals 11760 20014 100
Data of all Authors was analyzed according to gender. It can be found from
table no. 4.2.7.1 that male authors have published 18477 publications giving 1.69
publications per male authors and female authors have published 1537 publications
giving 1.83 publications per female authors.
There is significant association between gender of authors and productivity.
It is studied by confidence level as computed by chi-square which is shown in table
no. 4.2.7.2
Table No. 4.2.7.2: Productivity of Authors: Chi-Square Test
Gender No. of Authors Expected No. of
Publication
Expected
Male 10921 5880 18477 10007
Female 839 5880 1537 10007
Total 11760 11760 20014 20014
Chi-square Value 8643.42 6.64 14338.14 6.64
Probability (P=0.01) (P=0.01)

132
It can be observed from table no. 4.2.7.2 that the value of chi-Square is � is
3.84 at P=0.05 and it is 6.64 at P=0.01 as obtained value higher than 6.64, it can be
assumed that deviation between observed and expected value is significant hence
observation are not as per expected. Which indicates that, the total number of female
scientists is not reflected by the total contributions they made in academic
publications. However, if we consider per male or female publications, then their
productivity is more or less equal, which confirms the hypothesis “Male and female
scientists produce equal number of publications” (Hypothesis no. 3) is valid.
Roberts, (1990), Sanders, (1977), Giacometti, (2000), Wexler, (1994) found
that male scientists contributed more than the female… this points out that male
authors productivity is higher than the female authors. This may be due to other
responsibilities that female authors have to share in the family apart from their routine
work in the office. It also indicates that hypothesis “Male and female scientists
produce equal number of publications “(Hypothesis no. 3) is valid.
4.2.8 Subject wise productivity
Table no.4.2.8.1 and figure no.4.2.8.1 gives details of the total 20014 articles
analyzed on the subjects.
Table No. 4.2.8.1: Subject wise productivity
Sr. No Subjects Total Percentage
1 Mechanisms of Resistance 4857 24.27
2 Susceptibility 2880 14.39
3 Experimental Therapeutics 1781 8.9
4 Pharmacology 1598 7.98
5 Mechanisms of Action 1519 7.59
6 Pharmacology and Therapeutics 1413 7.06
7 Physiological Effects and Microbial Susceptibility 1397 6.98
8 Antiviral Agents 1327 6.63
9 Clinical Therapeutics 802 4.01
10 Biosynthesis, Chemistry, Mechanisms of Action and Resistance 774 3.87
11 Chemistry, Mechanisms of Action, and Resistance 605 3.02
12 Chemistry; Biosynthesis 443 2.21
13 Experimental and Clinical Therapeutics 398 1.99
14 Analytical Procedures 117 0.58
15 Biologic Response Modifiers 103 0.51
20014 100
133
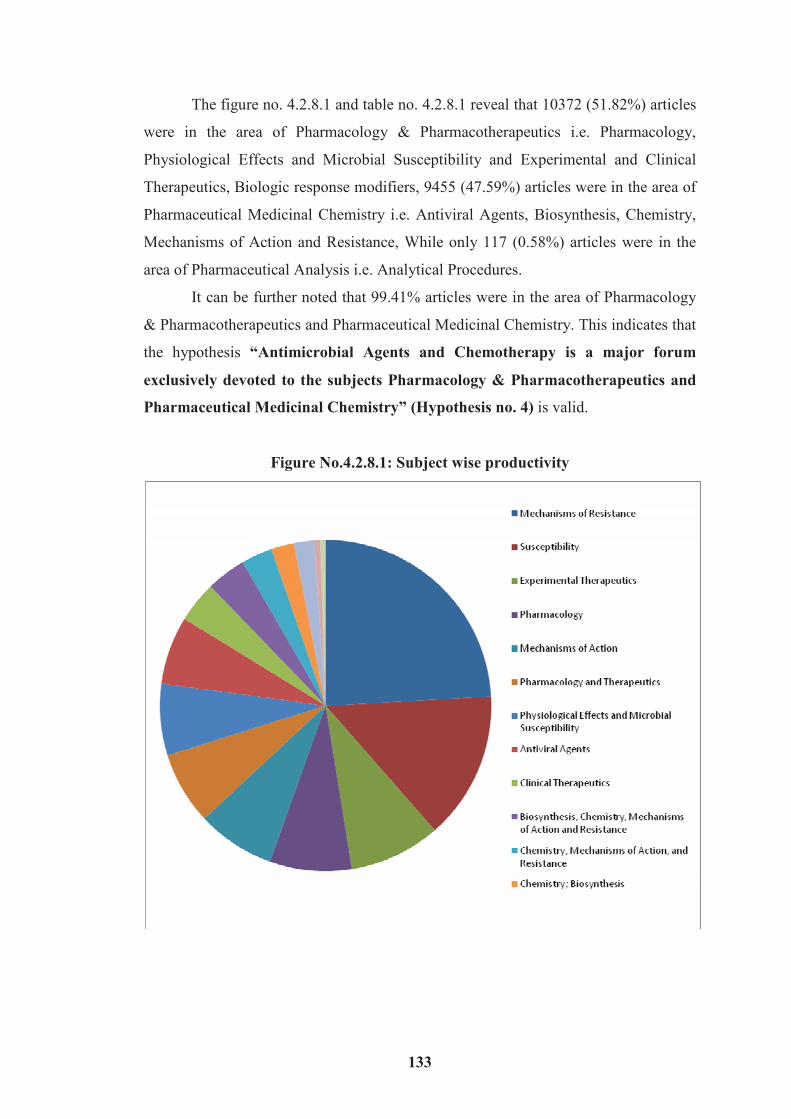
The figure no. 4.2.8.1 and table no. 4.2.8.1 reveal that 10372 (51.82%) articles
were in the area of Pharmacology & Pharmacotherapeutics i.e. Pharmacology,
Physiological Effects and Microbial Susceptibility and Experimental and Clinical
Therapeutics, Biologic response modifiers, 9455 (47.59%) articles were in the area of
Pharmaceutical Medicinal Chemistry i.e. Antiviral Agents, Biosynthesis, Chemistry,
Mechanisms of Action and Resistance, While only 117 (0.58%) articles were in the
area of Pharmaceutical Analysis i.e. Analytical Procedures.
It can be further noted that 99.41% articles were in the area of Pharmacology
& Pharmacotherapeutics and Pharmaceutical Medicinal Chemistry. This indicates that
the hypothesis “Antimicrobial Agents and Chemotherapy is a major forum
exclusively devoted to the subjects Pharmacology & Pharmacotherapeutics and
Pharmaceutical Medicinal Chemistry” (Hypothesis no. 4) is valid.
Figure No.4.2.8.1: Subject wise productivity
134
4.2.9 Department wise productivity
In the table 4.2.9.1 the contribution of papers from different department is
presented.
The department wise productivity is shown in table no.4.2.9.1 It shows that the
highest contributions are Microbiology department 8402 (41.98%) followed by
Pharmacology 7294 (36.44%), Chemistry 2085 (10.42%), Pharmaceutical Science
1532 (7.65%), Biochemistry 481 (2.40) of the total papers. Lowest number of papers
is contributions from the Biotechnology 220 (1.10%).
Table No. 4.2.9.1: Department wise productivity
Department of publication No. of articles Percent of Total
Microbiology 8402 41.98
Pharmacology 7294 36.44
Chemistry 2085 10.42
Pharmaceutical Science 1532 7.65
Biochemistry 481 2.40
Biotechnology 220 1.10
Total 20014 100.00
4.2.10 Institution wise productivity
The contributing authors belong to various institutions: universities, hospitals,
private research centres and government departments, etc. Attempt has been made to
analyse the data by Institution wise productivity. Table 4.2.10.1 analyses that a high
percentage 52.24 percent of the institution wise productivity is drawn from the
Medicine & Health Science. Second in rank is the Pharmacy with a rate of 5.19
percent, Science and Technology is third with 142 (0.71%). As very low, nearly
5.19% of articles were from Pharmacy, it indicates that “Majority of Pharmacist
give input to the Journal” (Hypothesis no. 2) is invalid.

135
Table No. 4.2.10.1: Institution wise productivity
Institution No. of articles Percentage
Medicine & Health Science 10456 52.24
Pharmacy 1038 5.19
Science and Technology 142 0.71
Agriculture 67 0.33
Others 8311 41.53
Total 20014 100
Figure No.4.2.10.1: Institution wise productivity
4.2.11 Country wise productivity
The objective here was to find out where the publication of the literature is
concentrated, and how much each service draws from it own country and from foreign
literature.
Table No. 4.2.11.1: Country wise productivity
Countries of publication No. of articles Percentage
USA 6560 32.78
France 1882 9.40
Japan 1295 6.47
Spain 1148 5.74
Italy 813 4.06
Germany 766 3.83
United Kingdom 723 3.61
Netherlands 634 3.17
Australia 551 2.75
India 20 0.10
Others 5622 28.09
Total 20014 100.00
136
Attempt has been made to analyse the data by country of author. Table
4.2.11.1 analyses that a high percentage 32.78 percent of the literature is drawn from
the USA. Second in rank is the France with a rate of 9.40 percent, Japan is third with
1295 (6.47%) and India is on Fifty four rank with 20 (0.10 %) articles. As the Journal
is published from U.S.A and high percentage nearly 33% of articles were from
U.S.A., it indicates that “authors prefer to publish in the journal which is
published from home town or home country” (Hypothesis no. 5) is partially valid.
4.3 Authorship pattern
The application of statistical techniques to the study of the subject literature
has many dimensions. An example of these statistical techniques is the study of
authorship patterns in a subject literature. This is of primary importance in
understanding the structure of the subject field. In communication system, authors
contributing to a subject field constitute a population. Within this population may
emerge patterns such as single and multiple authorship. Studies in this area of
statistical techniques (Bibliometrics) have made useful discoveries which shed more
light in our knowledge of structure of subject literatures (Subramanyam, 1983). When
two or more authors jointly produce a publication, the act is operationally termed as
collaboration.
Authorship pattern is important for scientists and researchers to know the research
work, hence, authorship pattern of scientific literature was analysed in order to
determine the number of authors (both single and joint collaborative) contributing
their work for analysis and statistical interpretation.
Authorship pattern was analysis to determine the percentage of corporate, single
and multiple authors and the number of anonymous papers.
Following concepts have been used in this section in relation to authorship pattern
viz.
1. Single author 2. Collaborator
3. Authorship credit 4. Principle author
5. Status of authorship 6. Most prolific author
7. Collaboration co-efficient 8. Salton index
9. Equivalence index.
The above terminology can be defined as under.
137
1. Single author
The word single author, single authorship is used synonymously. Single author
is against multi author. Single author means an author who writes an article in
journals or periodicals or writes a book and expresses his own views is called single
author.
2. Collaborator
Collaborative research is one of the characteristics of modern science. “It can
apparently be measured adequately from multiple authorship of papers”. There have
been a number of studies which analysed and interpreted the trends in multiple
authorship, thus indicating the trend towards collaborative research in different
disciplines of Science and Technology.
3. Authorship credit
The credit given to each author of a collaborative paper. Normally each author
figuring in a collaborative paper gets one credit regardless of the position as first or
last in the byline.
4. Principle author
The common author among the authors forming a collaborative group.
(Munnoli and Kalyane, 2003).
5. Status of authorship
The position of the author, i.e. first, second, third, etc. sequence in the byline
of a paper. (Munnoli and Kalyane, 2003).
It is assumed that the first author plays a major role in a research project.
Where international collaboration exists, Indian researchers shoulder different
responsibilities in each case of collaboration, such as a team member or as a team
leader. Mostly, a team leader holds the position of the first author in the research
output and team members hold the subsequent position.

138
6. Most prolific Author
Most prolific author is a collaborator of a principal author, but he produces
more publications than the other collaborators.
7. Collaboration co-efficient
The terms collaboration coefficient and degree of collaboration are used
synonymously. The degree of collaboration was defined as the ratio of the number of
collaborative research papers to the total number of research papers in the discipline
during a certain period of time (Rana and Agarwal, 1994). The extent of degrees of
collaboration in research is measured with the help of the formula derived by
Subramanyam. According to this formula
Nm
C = -------------
Nm + Ns
Where
C= Degree of collaboration in a discipline.
Nm= Number of multiauthored research paper in the discipline published
during a certain period.
Ns = Number of single authored research papers in the discipline published
during the same period.
Collaboration coefficient means the ratio of the number of collaborative papers to
the total number of papers published (Munnoli and Kalyane, 2003).
The degree of collaboration varies from one discipline to another. It is generally
high in the intensely collaborative scientific and technical fields, but low in
humanities in which the lonely scholar, working without the trappings of “big
science” still produces much of the scholarly literature (Garfield, 1979).
Collaboration in research is said to have taken place when two or more
persons work together on a scientific problem or project and effort, both physical and

139
intellectual. Depending upon the types of participants, their status and location, etc.
following possible kinds of collaborations are identified by Subramanyam.
1) Teacher-pupil collaboration;
2) Collaboration among colleagues;
3) Supervisor-assistant collaboration;
4) Researcher-consultant collaboration;
5) Collaboration between or among organizations; and
6) International collaboration.
8. Salton Index
“A Statistical measure of the co-author strength in a cluster. This has been
calculated using the formula
Cij
Sij = ----------------------------------
�Ci * Cj
9. Equivalence Index
A Statistical measure of the linkage/ association between two authors in a
cluster. EI for a pair of authors (a key author and one co-author) has been calculated
using the formula:
(Cij)2
Eij = __________________
Ci * Cj
Where (Ci) and (Cj) are respectively the frequencies of occurrence of the author (i)
and (j).
140
To measure the authorship pattern following parameters were considered, viz.
4.3.1 Year wise authorship
4.3.2 Single Vs Multiple authorship
4.3.3 Department wise authorship
4.3.4 Institution wise authorship
4.3.5 Country wise authorship
4.3.6 Most prolific author
- Salton Index
- Equivalence Index
- Collaboration co-efficient
4.3.7 Status of Authorship
4.3.8 Authorship position of key authors
4.3.1 Year wise authorship pattern
Since this is an era of team research, attempts were made to see the extent to
which the works in the present study are result of collaborations which is shown in
table no. 4.3.1.1.

141
Tab
le N
o.4
.3.1
.1:
Yea
r w
ise
au
thors
hip
patt
ern
Year
1
2
3
4
5
6
7
8
9
10
11
12
13
14
15
16
17
18
19
20
21
23
26
27
28
Tota
l %
1972
15
66
55
27
13
4
2
1
1
184
0.9
2
1973
17
82
87
37
18
5
3
1
1
251
1.2
5
1974
26
96
80
37
22
6
3
1
1
272
1.3
6
1975
23
82
90
49
30
6
6
2
288
1.4
4
1976
31
110
98
69
32
9
4
3
356
1.7
8
1977
33
115
102
58
24
10
4
1
1
348
1.7
4
1978
25
113
104
65
34
18
2
1
362
1.8
1
1979
13
83
89
75
28
16
11
3
1
1
1
321
1.6
0
1980
17
89
109
77
41
20
8
3
3
1
368
1.8
4
1981
16
98
111
87
40
17
8
2
2
1
382
1.9
1
1982
16
85
116
77
57
29
11
4
1
1
397
1.9
8
1983
16
80
110
73
58
35
8
7
2
2
2
393
1.9
6
1984
11
81
106
95
56
36
15
6
4
5
415
2.0
7
1985
15
86
94
85
67
29
11
13
3
3
406
2.0
3
1986
16
88
118
98
68
42
20
9
4
463
2.3
1
1987
19
73
97
93
70
38
26
16
9
6
447
2.2
3
1988
16
86
88
93
58
35
22
12
4
8
422
2.1
1
1989
19
81
110
83
76
39
23
15
4
6
456
2.2
8
1990
16
79
103
118
94
51
27
21
7
7
523
2.6
1
1991
15
85
113
98
85
55
34
25
5
12
527
2.6
3
1992
13
63
110
110
87
62
36
21
19
21
542
2.7
1
1993
15
63
97
90
100
69
43
21
8
23
529
2.6
4

142
1994
17
58
100
111
83
65
39
34
17
28
552
2.7
6
1995
9
49
101
106
104
71
43
28
16
31
558
2.7
9
1996
6
56
97
130
92
71
47
39
16
13
10
2
4
2
1
1
587
2.9
3
1997
8
54
101
81
85
67
55
42
19
12
7
6
2
2
3
2
1
547
2.7
3
1998
6
60
101
109
93
85
59
43
17
18
16
6
1
3
6
2
1
626
3.1
3
1999
9
56
95
99
107
70
48
35
32
8
5
2
4
1
1
572
2.8
6
2000
9
49
87
105
111
105
71
47
23
28
7
2
1
1
646
3.2
3
2001
6
60
77
107
85
95
64
55
41
20
9
5
1
3
628
3.1
4
2002
3
46
76
96
138
102
93
41
41
22
6
12
4
2
2
1
1
686
3.4
3
2003
4
48
96
120
110
97
58
59
31
29
14
7
3
3
1
1
681
3.4
0
2004
6
34
81
110
129
124
112
78
58
30
11
9
3
2
787
3.9
3
2005
4
50
85
132
136
121
134
96
46
21
6
4
1
836
4.1
8
2006
2
48
80
115
106
114
105
62
29
12
2
3
678
3.3
9
2007
2
27
70
100
115
97
122
114
53
13
6
3
1
1
724
3.6
2
2008
34
61
100
159
181
90
40
20
5
4
694
3.4
7
2009
4
32
80
99
252
243
92
22
0
1
825
4.1
2
2010
3
31
88
103
91
115
71
61
47
40
20
17
15
7
6
3
3
3
4
2
1
1
1
1
1
735
3.6
7
Tota
l 535
2703
3702
3576
3176
2363
1580
1059
569
428
124
77
42
25
24
8
7
5
4
2
1
1
1
1
1
20014
100.0
0
%
2.6
7
13.5
1
18.5
0
17.8
7
15.8
7
11.8
1
7.8
9
5.2
9
2.8
4
2.1
4
0.6
2
0.3
8
0.2
1
0.1
2
0.1
2
0.0
4
0.0
3
0.0
2
0.0
2
0.0
1
0.0
0
0.0
0
0.0
0
0.0
0
0.0
0
100.0
0
Tab
le N
o.4
.3.1
.1:
Yea
r w
ise
au
thors
hip
patt
ern
Con
t…
143
The authorship pattern of single, double, and corporate authorship is shown in
table no. 4.3.1.1. It shows that the highest contributions are collaborative papers;
Gradually collaboration is increasing year by year. The table further reveals that
2.67% papers were single authored, 13.51% two authored, 18.50% three authored,
17.87% four authored, 15.87% five authored, 11.81% six authored, 7.89% seven
authored, 5.29% eight authored, 2.85% nine authored, 2.14% ten authored, 0.62%
eleven authored, 0.38% twelve authored, 0.21% thirteen authored, 0.12% fourteen
authored, 0.12% fifteen authored, 0.04% sixteen authored, 0.03% seventeen authored,
0.02% eighteen authored, 0.02% nineteen authored, 0.01% twenty authored which
indicates that collaboration up to 4 authors is prominent. It is further observed that, in
the year wise authorship pattern the highest number of single authored publications
i.e. 34 in the year 2008 and highest number of multiple authors i.e. upto 28 authors
were found in the year 2010, which indicates that “Research is shifting from solo to
team” (hypothesis no. 5) is valid.
4.3.2 Single V/s Multiple authorship
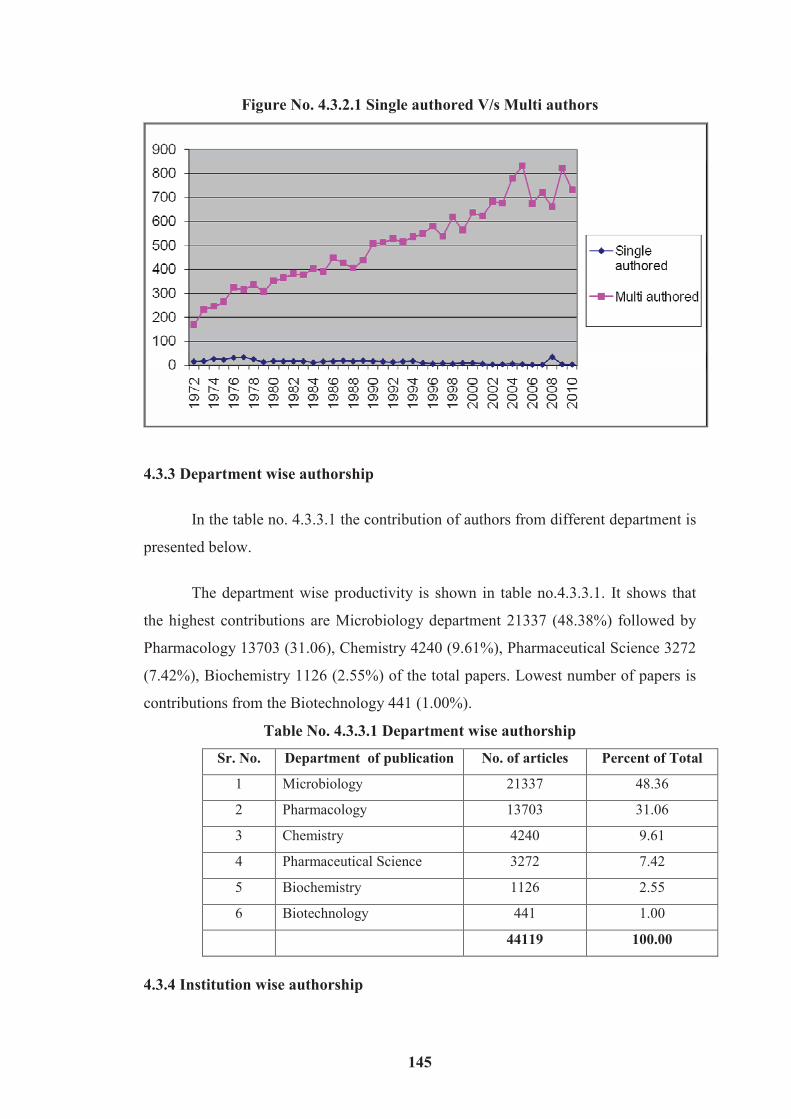
It observed that that in 1972 the percentage of single authored and multi-
authored papers was 2.80 and 0.87 respectively. However, in 2008 the percentage of
single authored papers was 6.36 and that of multi-authored papers increased to 4.21 in
2009. It is very interesting to note here that the trend of research is in favour of team
research. This is because of the advent of multi-authored papers in disciplines of
Science and Technology where such studies can be conducted by a team of
researchers employing specialists from various fields table no. 4.3.2.1 and fig.
no.4.3.2.1.
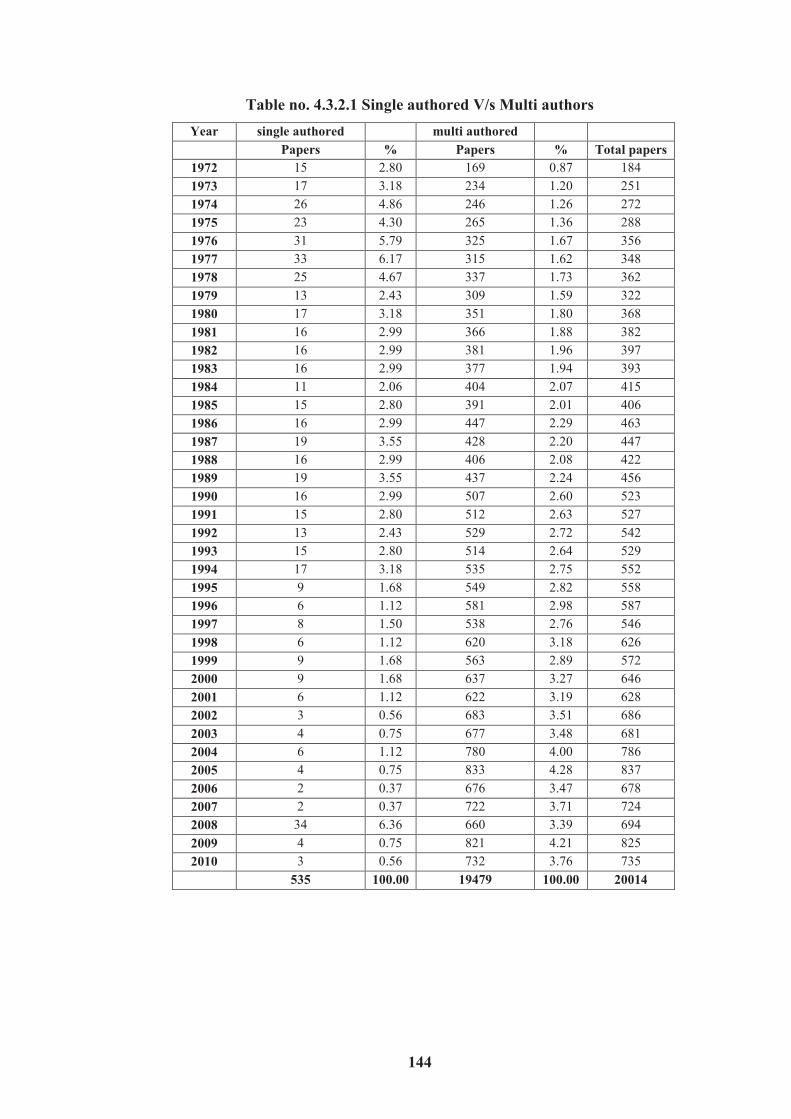
It is clearly shows that the percentage of multi-authored papers is far more
than that of the single-authored papers. They are 97.33% (multi-authored papers) and
2.67% (single-authored papers) respectively.
144
Table no. 4.3.2.1 Single authored V/s Multi authors
Year single authored multi authored
Papers % Papers % Total papers
1972 15 2.80 169 0.87 184
1973 17 3.18 234 1.20 251
1974 26 4.86 246 1.26 272
1975 23 4.30 265 1.36 288
1976 31 5.79 325 1.67 356
1977 33 6.17 315 1.62 348
1978 25 4.67 337 1.73 362
1979 13 2.43 309 1.59 322
1980 17 3.18 351 1.80 368
1981 16 2.99 366 1.88 382
1982 16 2.99 381 1.96 397
1983 16 2.99 377 1.94 393
1984 11 2.06 404 2.07 415
1985 15 2.80 391 2.01 406
1986 16 2.99 447 2.29 463
1987 19 3.55 428 2.20 447
1988 16 2.99 406 2.08 422
1989 19 3.55 437 2.24 456
1990 16 2.99 507 2.60 523
1991 15 2.80 512 2.63 527
1992 13 2.43 529 2.72 542
1993 15 2.80 514 2.64 529
1994 17 3.18 535 2.75 552
1995 9 1.68 549 2.82 558
1996 6 1.12 581 2.98 587
1997 8 1.50 538 2.76 546
1998 6 1.12 620 3.18 626
1999 9 1.68 563 2.89 572
2000 9 1.68 637 3.27 646
2001 6 1.12 622 3.19 628
2002 3 0.56 683 3.51 686
2003 4 0.75 677 3.48 681
2004 6 1.12 780 4.00 786
2005 4 0.75 833 4.28 837
2006 2 0.37 676 3.47 678
2007 2 0.37 722 3.71 724
2008 34 6.36 660 3.39 694
2009 4 0.75 821 4.21 825
2010 3 0.56 732 3.76 735
535 100.00 19479 100.00 20014
145
Figure No. 4.3.2.1 Single authored V/s Multi authors
4.3.3 Department wise authorship
In the table no. 4.3.3.1 the contribution of authors from different department is
presented below.
The department wise productivity is shown in table no.4.3.3.1. It shows that
the highest contributions are Microbiology department 21337 (48.38%) followed by
Pharmacology 13703 (31.06), Chemistry 4240 (9.61%), Pharmaceutical Science 3272
(7.42%), Biochemistry 1126 (2.55%) of the total papers. Lowest number of papers is
contributions from the Biotechnology 441 (1.00%).
Table No. 4.3.3.1 Department wise authorship
Sr. No. Department of publication No. of articles Percent of Total
1 Microbiology 21337 48.36
2 Pharmacology 13703 31.06
3 Chemistry 4240 9.61
4 Pharmaceutical Science 3272 7.42
5 Biochemistry 1126 2.55
6 Biotechnology 441 1.00
44119 100.00
4.3.4 Institution wise authorship

146
The contributing authors belong to various institutions: universities, hospitals,
private research centres and government departments, etc. Attempt has been made to
analyse the data by Institution wise productivity. Table 4.3.4.1 analyses that a high
percentage 46.47 percent of the institution wise productivity is drawn from the
Medicine & Health Science. Second in rank is the Pharmacy with a rate of 7.66
percent, Science and Technology is third with 357 (0.81%). As very low percentage
nearly 7.66% of articles were from Pharmacy. It indicates that “Majority of
Pharmacist give input to the Journal” (Hypothesis no. 2) is invalid.
Table No. 4.3.4.1 Institution wise authorship
Institution No. of articles Percentage
Medicine & Health Science 20504 46.47
Pharmacy 3380 7.66
Science and Technology 357 0.81
Agriculture 335 0.76
Others 19543 44.3
44119 100
4.3.5 Country wise authorship
A high percentage 14928 (33.81%) of literature is drawn from USA, while
5223 (11.84%) percent of the literature is drawn from the France. Japan is third with
2927 (6.63%) and India is in eighty third rank with a rate of 0.06 percent (25). As the
Journal is published from U.S.A and high percentage nearly 34% of articles were
from U.S.A., it indicates that “authors prefer to publish in the journal which is
published from home town or home country” (Hypothesis no. 5) is partially valid.
Table No. 4.3.5.1 Country wise authorship
Country Total. No. Author Percentage
USA 14928 33.84
France 5223 11.84
Japan 2927 6.63
Spain 2729 6.19
Italy 1626 3.69
Germany 1532 3.47
United Kingdom 1446 3.28
Netherlands 1268 2.87
Table No. 4.3.5.1 Country wise authorship Cont…

147
Australia 1102 2.50
Georgia 1024 2.32
China 744 1.69
Switzerland 700 1.59
Chicago 672 1.52
West Indies 660 1.50
Pennsylvania 640 1.45
Canada 576 1.31
India 25 0.06
Others 6297 14.27
Total 44119 100
4.3.6 Most prolific author
Appelbaum, Peter. C author at any position and Goldstein, Ellie.J.C author at
first position are respectively key authors. (Table no. 4.2.1.1.1 & 4.2.1.2.1)
Attempt was further made to identify most prolific author collaborating with
these key authors, attempt was made to calculate Salton Index, Equivalence Index &
collaboration Co-efficient with most prolific authors i.e. Appelbaum, Peter.C &
Goldstein, Ellie.J.C respectively. (Table no. 4.3.7.1 & 4.3.7.2)
By using data from these tables, Salton Index, Equivalence Index &
Collaboration Co-efficient with most prolific author’s i.e Appelbaum, Peter.C &
Goldstein, Ellie.J.C respectively, were calculated Salton index is 0.76 and 1.55,
Equivalence index is 0.57 and 0.89 and the collaboration coefficient is 0.95 and 0.18
respectively.
4.3.7 Status of Authorship
There is two part of status of authorship collaborator one is author at any
position and second is author at first position.
Author at any position
148
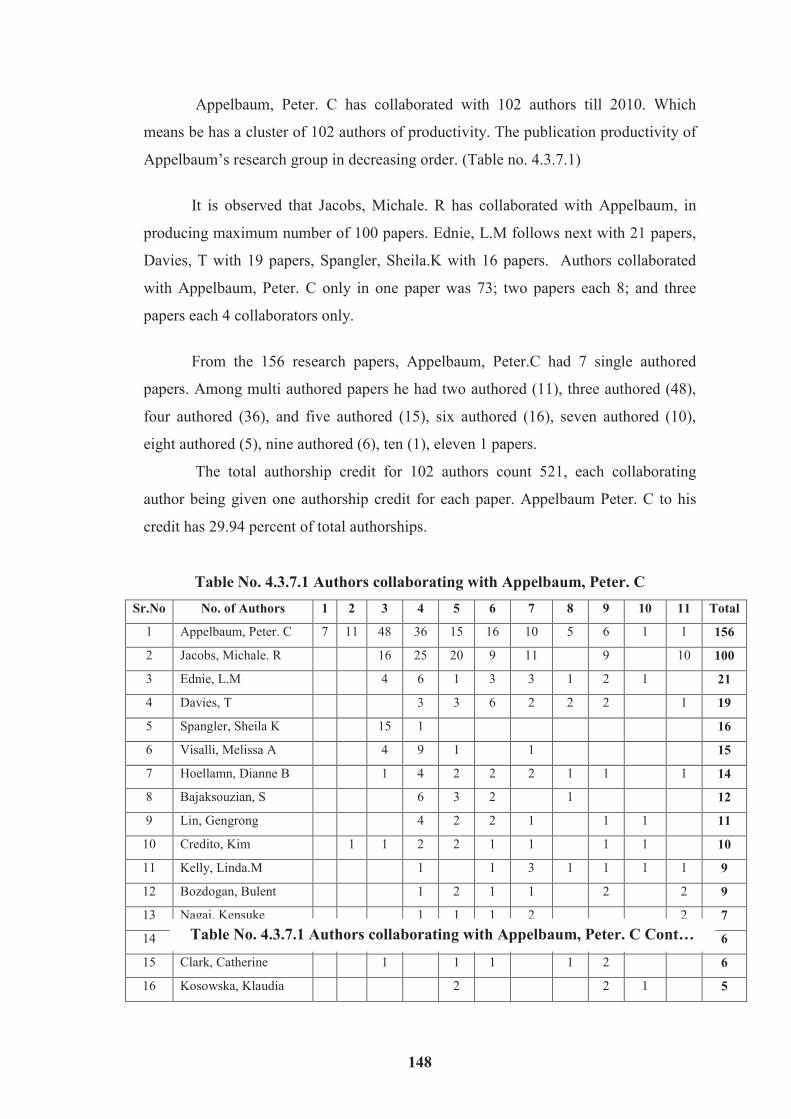
Appelbaum, Peter. C has collaborated with 102 authors till 2010. Which
means be has a cluster of 102 authors of productivity. The publication productivity of
Appelbaum’s research group in decreasing order. (Table no. 4.3.7.1)
It is observed that Jacobs, Michale. R has collaborated with Appelbaum, in
producing maximum number of 100 papers. Ednie, L.M follows next with 21 papers,
Davies, T with 19 papers, Spangler, Sheila.K with 16 papers. Authors collaborated
with Appelbaum, Peter. C only in one paper was 73; two papers each 8; and three
papers each 4 collaborators only.
From the 156 research papers, Appelbaum, Peter.C had 7 single authored
papers. Among multi authored papers he had two authored (11), three authored (48),
four authored (36), and five authored (15), six authored (16), seven authored (10),
eight authored (5), nine authored (6), ten (1), eleven 1 papers.
The total authorship credit for 102 authors count 521, each collaborating
author being given one authorship credit for each paper. Appelbaum Peter. C to his
credit has 29.94 percent of total authorships.
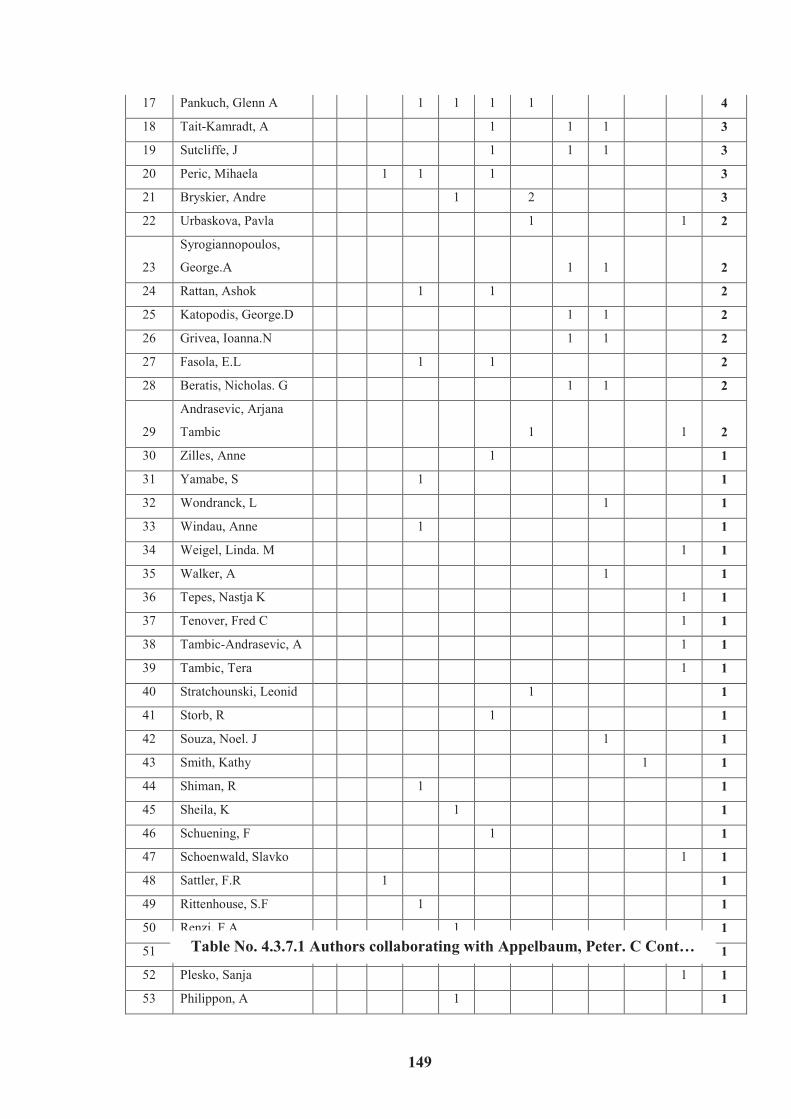
Table No. 4.3.7.1 Authors collaborating with Appelbaum, Peter. C
Sr.No No. of Authors 1 2 3 4 5 6 7 8 9 10 11 Total
1 Appelbaum, Peter. C 7 11 48 36 15 16 10 5 6 1 1 156
2 Jacobs, Michale. R 16 25 20 9 11 9 10 100
3 Ednie, L.M 4 6 1 3 3 1 2 1 21
4 Davies, T 3 3 6 2 2 2 1 19
5 Spangler, Sheila K 15 1 16
6 Visalli, Melissa A 4 9 1 1 15
7 Hoellamn, Dianne B 1 4 2 2 2 1 1 1 14
8 Bajaksouzian, S 6 3 2 1 12
9 Lin, Gengrong 4 2 2 1 1 1 11
10 Credito, Kim 1 1 2 2 1 1 1 1 10
11 Kelly, Linda.M 1 1 3 1 1 1 1 9
12 Bozdogan, Bulent 1 2 1 1 2 2 9
13 Nagai, Kensuke 1 1 1 2 2 7
14 Dewasse, Bonifacio.E 1 3 2 6
15 Clark, Catherine 1 1 1 1 2 6
16 Kosowska, Klaudia 2 2 1 5
Table No. 4.3.7.1 Authors collaborating with Appelbaum, Peter. C Cont…
149
17 Pankuch, Glenn A 1 1 1 1 4
18 Tait-Kamradt, A 1 1 1 3
19 Sutcliffe, J 1 1 1 3
20 Peric, Mihaela 1 1 1 3
21 Bryskier, Andre 1 2 3
22 Urbaskova, Pavla 1 1 2
23
Syrogiannopoulos,
George.A 1 1 2
24 Rattan, Ashok 1 1 2
25 Katopodis, George.D 1 1 2
26 Grivea, Ioanna.N 1 1 2
27 Fasola, E.L 1 1 2
28 Beratis, Nicholas. G 1 1 2
29
Andrasevic, Arjana
Tambic 1 1 2
30 Zilles, Anne 1 1
31 Yamabe, S 1 1
32 Wondranck, L 1 1
33 Windau, Anne 1 1
34 Weigel, Linda. M 1 1
35 Walker, A 1 1
36 Tepes, Nastja K 1 1
37 Tenover, Fred C 1 1
38 Tambic-Andrasevic, A 1 1
39 Tambic, Tera 1 1
40 Stratchounski, Leonid 1 1
41 Storb, R 1 1
42 Souza, Noel. J 1 1
43 Smith, Kathy 1 1
44 Shiman, R 1 1
45 Sheila, K 1 1
46 Schuening, F 1 1
47 Schoenwald, Slavko 1 1
48 Sattler, F.R 1 1
49 Rittenhouse, S.F 1 1
50 Renzi, F.A 1 1
51 Potter, C.K 1 1
52 Plesko, Sanja 1 1
53 Philippon, A 1 1
Table No. 4.3.7.1 Authors collaborating with Appelbaum, Peter. C Cont…

150
54 Petitpas, J 1 1
55 Patel, Mahesh V 1 1
56 Patel, Jean. B 1 1
57 Palavecino, Elizabeth 1 1
58 Ohara, Caroline. M 1 1
59 Oh, Herin 1 1
60 Nicholas, G 1 1
61 Moore, T.D 1 1
62 Meyers, J.D 1 1
63 Mcdougal Linda.K 1 1
64 Mcallister, Sigrid 1 1
65 Matic, Vlatka 1 1
66 Malbruny, Brigitte 1 1
67 Lichtenberger, C 1 1
68 Leclercq, Roland 1 1
69 Kozloy, Roman S 1 1
70 Kotarski, Zdenka 1 1
71 Kolman, Jana 1 1
72 Koeth, L 1 1
73 Killgore, George 1 1
74 Khorakiwala, Habil F 1 1
75 Kalenic, Smilja 1 1
76 Jueneman, Shane. A 1 1
77 Jevitt, Laura 1 1
78 Jafri, Mohammad. A 1 1
79 Hryniewicz, Waleria 1 1
80 Gutmann, L 1 1
81 Gupte, Shrikant V 1 1
82 Graham, T 1 1
83 Edlund, Charlott 1 1
84 Drukalska, Liga 1 1
85 Depardieu, F 1 1
86 Deeg, H.J 1 1
87 Dagan, Ron 1 1
88 Cronan, M 1 1
89 Couturier, Catherine 1 1
90 Courvalin, P 1 1
91 Coquemont, Maolle 1 1
92 Clark, Nancye 1 1
Table No. 4.3.7.1 Authors collaborating with Appelbaum, Peter. C Cont…

151
93 Chugh, Yati 1 1
94 Chatterton, Sheila.A 1 1
95 Chaitram, Jasmine 1 1
96 Canu, Annie 1 1
97 Burch, Daniel. J 1 1
98 Browne, Frederick A 1 1
99 Bogdaovitch, Tatiana 1 1
100 Bhagwat, Sachin. N 1 1
101 Anthony, Lauren 1 1
102 Amin, Nagwa 1 1
Total 7 13 93 111 67 65 48 18 51 8 40 521
Author at first position
Goldstein, Ellie.J.C has collaborated with 60 authors till 2010. Which means
be has a cluster of 60 authors of productivity. The publication productivity of
Goldstein’s research group in decreasing order is depicted in table no. 4.3.7.2.
It is observed that Citron, Diane M has collaborated with Goldstein, Ellie.J.C
in the production of maximum number of 55 papers published. Merriam, C. Vreni
follows next with 34 papers published, Warren, Yumi with 29 papers published,
Tyrrel, Kerin with 28 papers published. Authors collaborated with Goldstein, Ellie.J.C
only in one paper number 34; two papers each number 15; and three papers each
number 2 only.
From the 67 papers published by Goldstein, Ellie.J.C for 55 research papers at
first position which are single authored papers only. He had published 55 single
authored papers. Among multi authored papers he had two authored (2), three
authored (2), four authored (2), and five authored (2), six authored (2), thirteen
authored (1), fifteen 1 papers.
The total authorship credit for 60 authors count 255, each collaborating author
being given one authorship credit for each paper .Goldstein, Ellie.J.C to his credit has
26.27 percent of total authorships.
Table No. 4.3.7.2 Authors collaborating with Goldstein, Ellie.J.C

152
Sr.No Authors 1 2 3 4 5 6 8 9 13 15 Total
1 Goldstein, Ellie.J.C 55 2 2 2 2 2 1 1 67
2 Citron, Diane M 9 9 4 11 20 1 1 55
3 Merriam, C. Vreni 2 10 20 1 1 34
4 Warren, Yumi 7 19 1 1 1 29
5 Tyrrell, Kerin 8 18 1 1 28
6
Finegold,
Sydney.M 2 1 1 16 1 1 1 1 24
7 Conrads, Georg 1 4 1 6
8 Sutter, Vera.L 1 3 1 5
9 Gerardo, S.H 1 3 4
10 Hudspeth, Marie 3 3
11 Cherubin, C.E 3 3
12 Venezia, R 1 1 2
13 Vagvolgyi, A.E 2 2
14 Snydman, D.R 1 1 2
15 Ruthazer, R 1 1 2
16 Rihs, J 1 1 2
17 Pierson, C 1 1 2
18 Mcdermott, L.A 1 1 2
19 Kwok, Y.Y 1 1 2
20 Jenkins, S 1 1 2
21 Jacobus, N.V 1 1 2
22 Hecht, D.W 1 1 2
23 Harrell, L 1 1 2
24 Gorbach, S.L 1 1 2
25 Gombert, M.E 1 1 2
26 Fernandez, Helen 2 2
27 Yu, V 1 1
28 Stein, Gary E 1 1
29 Stang, Peter.J 1 1
30 Smith, S.M 1 1
31 Shulman, M 1 1
32 Schooley, Sharon 1 1
33 Richwald, G.A 1 1
34 Radhakrishnan, U 1 1
35 Quah, S.E 1 1
36 Peraino, Victoria 1 1
37 Ostovari, M.I 1 1
38 Nesbit, C.A 1 1
39 Mulligan, M.E 1 1
40 Mullane, K 1 1
41 Miyasaki, K.T 1 1
42 Miller, M 1 1
43 Meilbohm, Anne. R 1 1
44 Ma, M.Y 1 1
45 Lu, Shuang 1 1
46 Louie, T 1 1
47 Lewis, R.P 1 1
48 Golan, Y 1 1
Table No. 4.3.7.2 Authors collaborating with Goldstein, Ellie.J.C Cont…

153
49 Ginsberg, B.P 1 1
50 Friedman, M.H 1 1
51 Eng, R.H 1 1
52 Elgourt, Tanya 1 1
53 Donskey, C 1 1
54 Claros, M.C 1 1
55 Buccini, F 1 1
56 Bryskier, Andre 1 1
57 Brazier, J.S 1 1
58 Anderson, M.S 1 1
59 Alpert, M.L 1 1
60 Agyare, E.O 1 1
Total 55 10 28 12 61 103 6 8 12 15 255
4.3.8 Authorship position of key authors
There is two part of authorship position of key authors one is authorship
position of key authors at any position and second is authorship position of key
authors at first position.
Authorship position of key authors (at any position)
For any researcher, the authorship position changes from paper to paper. In
some papers he may be the first author, in some others his position may be second,
third, fourth and so on.
Table No. 4.3.8.1 Appelbaum’s Authorship Position
Publications 1 2 3 4 5 6 7 8 9 10 11 Total
Single author 7 7
Two author 8 8
Three author 42 42
Four author 1 1 34 36
Five author 1 2 14 17
Six author 1 1 16 18
Seven author 1 1 9 11
Eight author 1 5 6
Nine author 6 6
Ten author 1 1 2
Eleven author 1 1 1 3
Total 7 11 48 36 15 16 10 5 6 1 1 156

154
Table no. 4.3.8.1 depicts Appelbaum, Peter.C position as author in all his
papers. He is the first or primary author in 156 papers, second author in 11 papers,
third author in 48 papers, fourth author in 36 papers, five authors in 15 papers, six
authors in 16 papers, seven authors in 10 papers, eight authors in 8 papers, nine
authors in 6 papers, ten and eleven author in 1 paper each.
Authorship position of key authors (at first position)
Goldstein, Ellie.J.C (author at first position) is the first or primary author for
55 papers, second to sixth author for 1 paper each and thirteenth and also fifteenth
author for 1 paper each. Which means Goldstein is at first position in single authored
papers only.
Table No. 4.3.8.2 Goldstein’s Authorship Position
Publications 1 2 3 4 5 6 13 15 Total
Single author 55 55
Two author 2 02
Three author 2 02
Four author 2 02
Five author 2 02
Six author 2 02
Thirteen author 1 01
Fifteen author 1 01
Total 55 2 2 2 2 2 1 1 67
4.4 Conclusion
Present chapter has analysed contents of the “Antimicrobial Agents and
Chemotherapy Journal” by using various scientometric tools & techniques.
Conclusions and Implications based on the analysis are presented in chapter-5.