CHAPTER IV RESULT OF THE STUDY AND DISCUSSIONdigilib.iain-palangkaraya.ac.id/658/5/Chapter IV.pdf36...
25
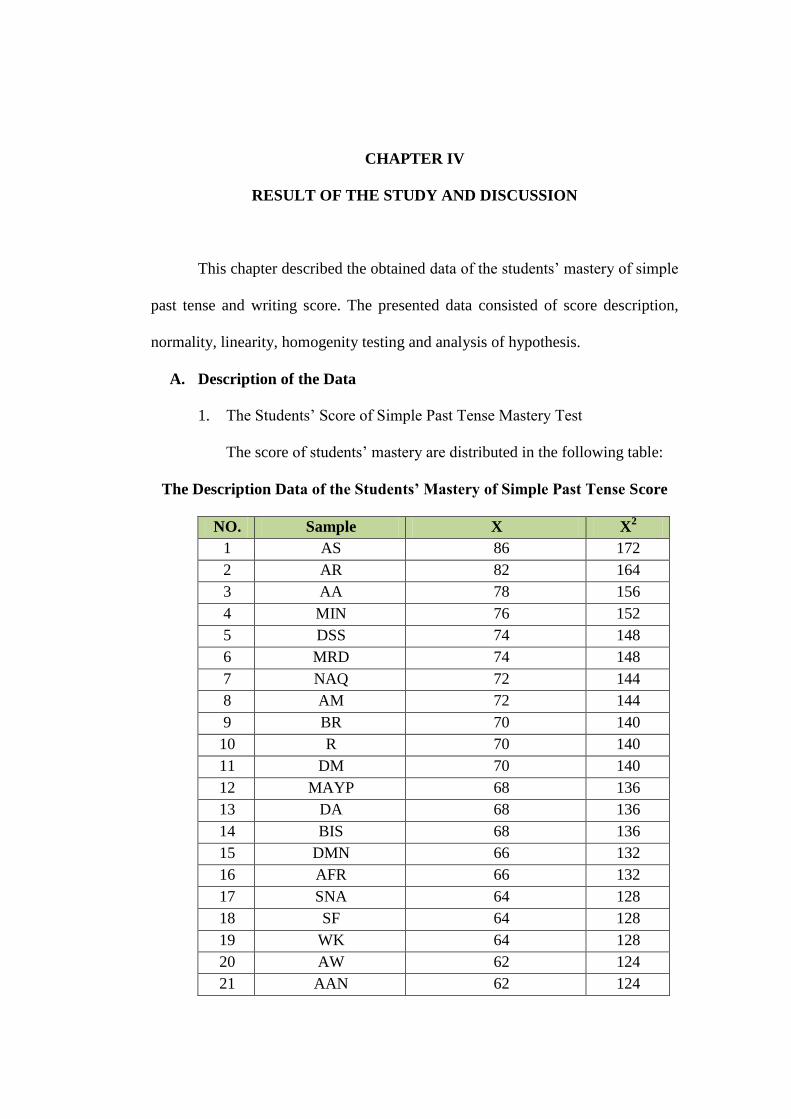
CHAPTER IV RESULT OF THE STUDY AND DISCUSSION This chapter described the obtained data of the students’ mastery of simple past tense and writing score. The presented data consisted of score description, normality, linearity, homogenity testing and analysis of hypothesis. A. Description of the Data 1. The Students’ Score of Simple Past Tense Mastery Test The score of students’ mastery are distributed in the following table: The Description Data of the Students’ Mastery of Simple Past Tense Score NO. Sample X X 2 1 AS 86 172 2 AR 82 164 3 AA 78 156 4 MIN 76 152 5 DSS 74 148 6 MRD 74 148 7 NAQ 72 144 8 AM 72 144 9 BR 70 140 10 R 70 140 11 DM 70 140 12 MAYP 68 136 13 DA 68 136 14 BIS 68 136 15 DMN 66 132 16 AFR 66 132 17 SNA 64 128 18 SF 64 128 19 WK 64 128 20 AW 62 124 21 AAN 62 124
-
Upload
trinhtuong -
Category
Documents
-
view
214 -
download
0
Transcript of CHAPTER IV RESULT OF THE STUDY AND DISCUSSIONdigilib.iain-palangkaraya.ac.id/658/5/Chapter IV.pdf36...
36
CHAPTER IV
RESULT OF THE STUDY AND DISCUSSION
This chapter described the obtained data of the students’ mastery of simple
past tense and writing score. The presented data consisted of score description,
normality, linearity, homogenity testing and analysis of hypothesis.
A. Description of the Data
1. The Students’ Score of Simple Past Tense Mastery Test
The score of students’ mastery are distributed in the following table:
The Description Data of the Students’ Mastery of Simple Past Tense Score
NO. Sample X X2
1 AS 86 172
2 AR 82 164
3 AA 78 156
4 MIN 76 152
5 DSS 74 148
6 MRD 74 148
7 NAQ 72 144
8 AM 72 144
9 BR 70 140
10 R 70 140
11 DM 70 140
12 MAYP 68 136
13 DA 68 136
14 BIS 68 136
15 DMN 66 132
16 AFR 66 132
17 SNA 64 128
18 SF 64 128
19 WK 64 128
20 AW 62 124
21 AAN 62 124
37
NO. Sample X X2
22 DAS 62 124
23 ILA 62 124
24 SF 62 124
25 AW 62 124
26 AU 60 120
27 SF 60 120
28 MIM 60 120
29 NAJ 60 120
30 RK 60 120
31 RA 58 116
32 MDH 58 116
33 SA 56 112
34 M 56 112
35 RPP 56 112
36 A 56 112
37 SB 54 108
38 MFK 54 108
39 M 54 108
40 M 54 108
41 APP 52 104
42 SAPA 50 100
43 CAW 50 100
44 AFK 50 100
45 IR 50 100
46 MB 48 96
47 PA 48 96
48 HP 48 96
49 AAH 46 92
50 BMRP 46 92
51 MS 46 92
52 NAS 44 88
53 MIFF 44 88
54 SAK 42 84
55 MR 40 80
56 SK 40 80
57 NAA 40 80
58 OAS 36 72
59 RNH 36 72
38
NO. Sample X X2
60 IPA 36 72
61 SB 34 68
62 R 30 60
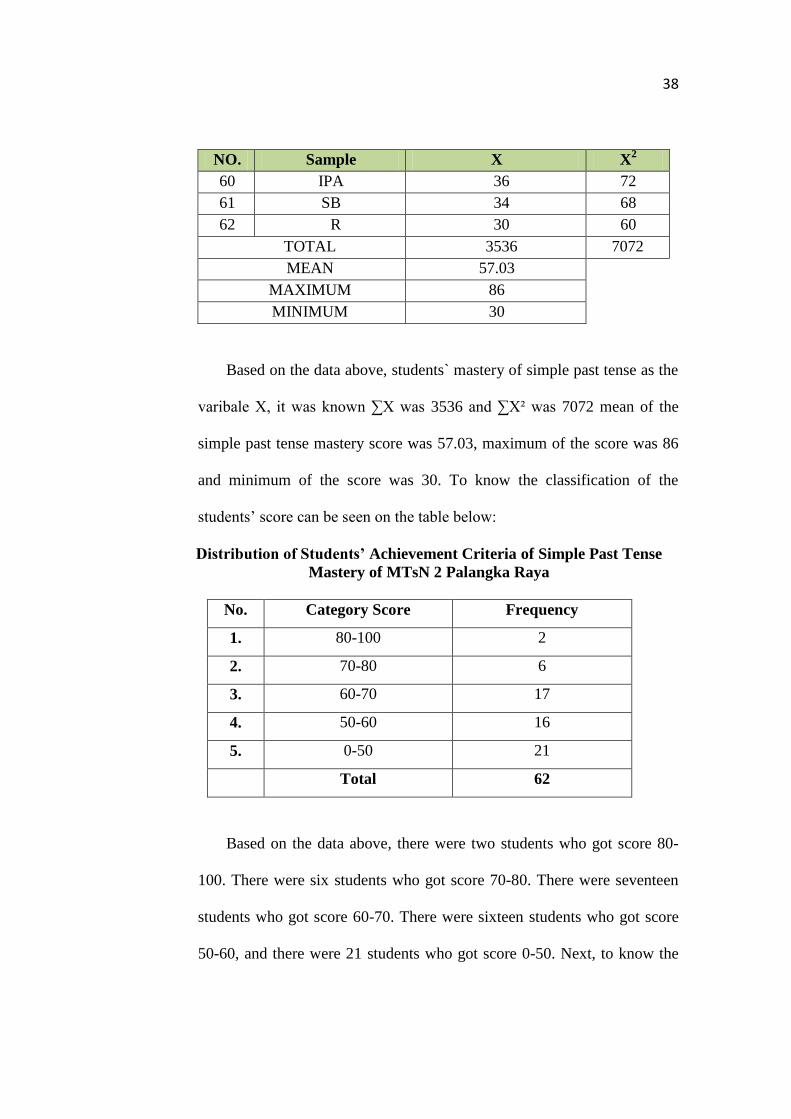
TOTAL 3536 7072
MEAN 57.03
MAXIMUM 86
MINIMUM 30
Based on the data above, students` mastery of simple past tense as the
varibale X, it was known ∑X was 3536 and ∑X² was 7072 mean of the
simple past tense mastery score was 57.03, maximum of the score was 86
and minimum of the score was 30. To know the classification of the
students’ score can be seen on the table below:
Distribution of Students’ Achievement Criteria of Simple Past Tense
Mastery of MTsN 2 Palangka Raya
No. Category Score Frequency
1. 80-100 2
2. 70-80 6
3. 60-70 17
4. 50-60 16
5. 0-50 21
Total 62
Based on the data above, there were two students who got score 80-
100. There were six students who got score 70-80. There were seventeen
students who got score 60-70. There were sixteen students who got score
50-60, and there were 21 students who got score 0-50. Next, to know the

39
classification of the students’ achievement criteria of heavy value and
predicate can be seen on the table below:
Distribution of Students’ Achievement Criteria of Mastery of Simple Past
Tense Score
Mark Value Letter Value Heavy Value Predicate
80-100 A 2 Excellent
70-80 B 6 Good
60-70 C 17 Fair
50-60 D 16 Poor
0-50 E 21 Very Poor
To determine the frequency of score, percent of score, and cumulative
percent calculated using manual calculation as follows:
The Frequency of Score, Percent of Score,
Valid Percent and Cumulative Percent calculated using Manual Calculation
Category
Score Frequency Percent Valid Percent
Cumulative
Percent
80-100 2 3.23 3.23 3.23
70-80 6 9.68 9.68 9.68
60-70 17 27.42 27.42 27.42
50-60 16 25.81 25.81 25.81
0-50 21 33.87 33.87 33.87
Total 62 100 100 100
Based on the data of percent of score, it can be concluded that there
was 3.23% students who got score 80-100. There were 9.68% students
who got score 70-80. There were 27.42% students who got score 60-70.
40
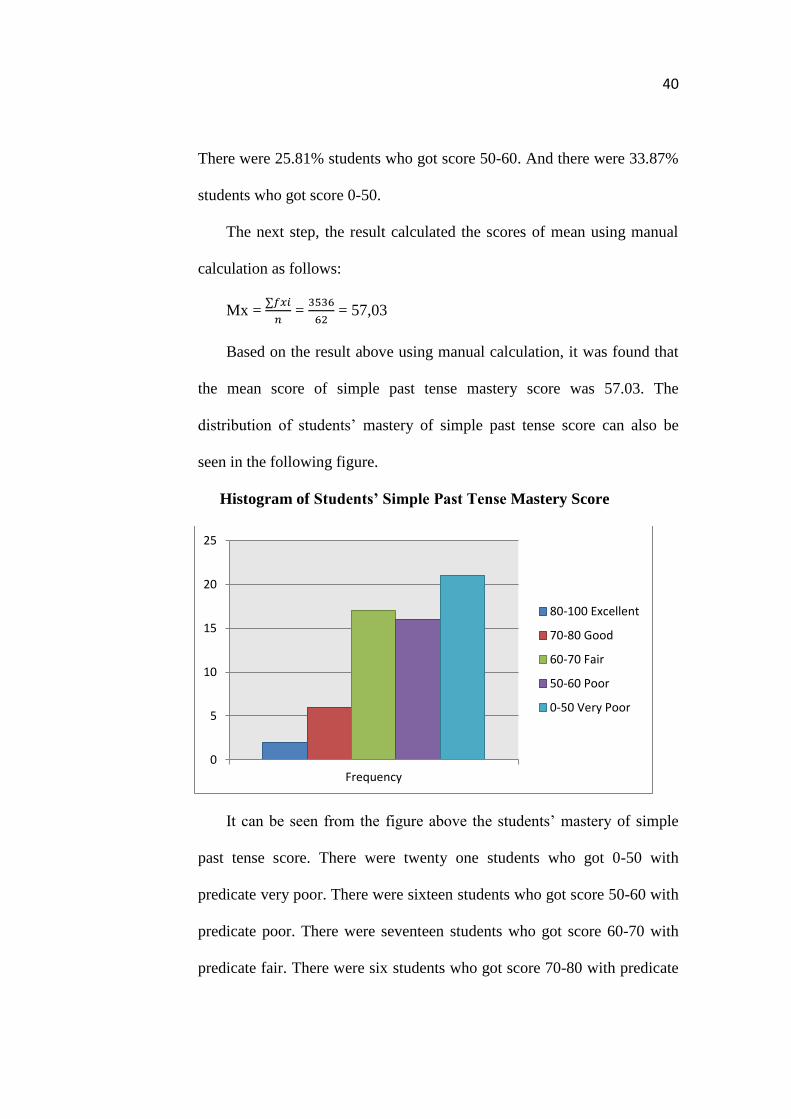
There were 25.81% students who got score 50-60. And there were 33.87%
students who got score 0-50.
The next step, the result calculated the scores of mean using manual
calculation as follows:
Mx =
=
= 57,03
Based on the result above using manual calculation, it was found that
the mean score of simple past tense mastery score was 57.03. The
distribution of students’ mastery of simple past tense score can also be
seen in the following figure.
Histogram of Students’ Simple Past Tense Mastery Score
It can be seen from the figure above the students’ mastery of simple
past tense score. There were twenty one students who got 0-50 with
predicate very poor. There were sixteen students who got score 50-60 with
predicate poor. There were seventeen students who got score 60-70 with
predicate fair. There were six students who got score 70-80 with predicate
0
5
10
15
20
25
Frequency
80-100 Excellent
70-80 Good
60-70 Fair
50-60 Poor
0-50 Very Poor

41
good. And there were two students who got 80-100 with predicate
excellent.
The next step, the result calculated the score of mean using SPSS 17
program as follows:
The Calculation of Statistics using SPSS 17
N Valid 62
Missing 0
Mean 57.03
Std. Error of Mean 15.98
Std. Deviation 12.51
Minimum 30
Maximum 86
Based on the table above, the result calculated using SPSS 17, it was
found that the mean of score were 57.03, the standard deviation was 12.51
and the standard error of mean was 15.98. Then, based on valuation scale
used in MTsN 2 Palangka Raya, the average of the students’ mastery of
simple past tense was in fair criteria.
2. The Students’ Score of Writing Test
The Description Data of the Students’ Writing Score
NO. SAMPLE Y Y2
1 AS 88 176
2 AR 87.5 175
3 AA 87 174
4 MIN 86.5 173
5 DSS 82 164
6 MRD 81.5 163
7 NAQ 80 160
8 AM 79 158
9 BR 79 158

42
NO. SAMPLE Y Y2
10 R 78.5 157
11 DM 78.5 157
12 MAYP 78 156
13 DA 76.5 153
14 BIS 76 152
15 DMN 76 152
16 AFR 75.5 151
17 SNA 75.5 151
18 SF 75.5 151
19 WK 75.5 151
20 AW 75 150
21 AAN 74.5 149
22 DAS 74.5 149
23 ILA 74 148
24 SF 73.5 147
25 AW 72.5 145
26 AU 71 142
27 SF 71 142
28 MIM 71 142
29 NAJ 71 142
30 RK 69 138
31 RA 69 138
32 MDH 69 138
33 SA 69 138
34 M 68.5 137
35 RPP 68 136
36 A 68 136
37 SB 68 136
38 MFK 67.5 135
39 M 67.5 135
40 M 67 134
41 APP 67 134
42 SAPA 66.5 133
43 CAW 65 130
44 AFK 65 130
45 IR 65 130
46 MB 62.5 125
47 PA 59 118
48 HP 59 118
49 AAH 58.5 117
43
NO. SAMPLE Y Y2
50 BMRP 58.5 117
51 MS 58 116
52 NAS 56.5 113
53 MIFF 56.5 113
54 SAK 51.5 103
55 MR 51.5 103
56 SK 51.5 103
57 NAA 51.5 103
58 OAS 49 98
59 RNH 49 98
60 IPA 49 98
61 SB 49 98
62 R 46 92
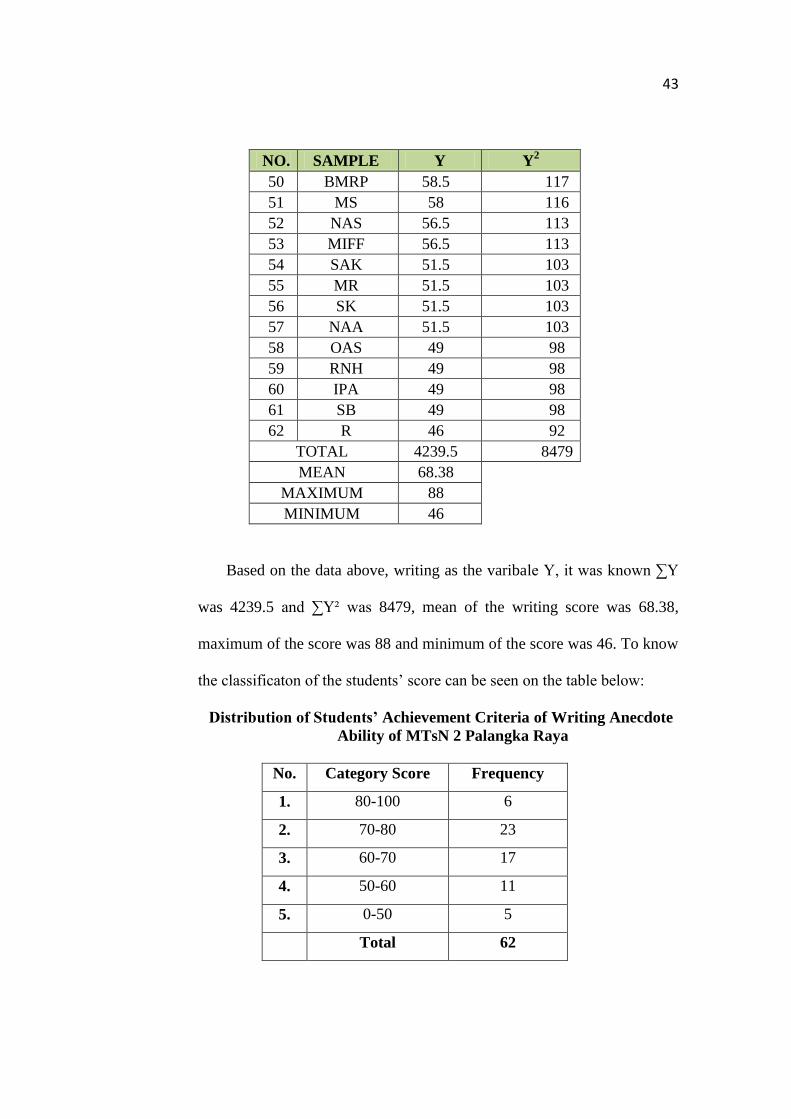
TOTAL 4239.5 8479
MEAN 68.38
MAXIMUM 88
MINIMUM 46
Based on the data above, writing as the varibale Y, it was known ∑Y
was 4239.5 and ∑Y² was 8479, mean of the writing score was 68.38,
maximum of the score was 88 and minimum of the score was 46. To know
the classificaton of the students’ score can be seen on the table below:
Distribution of Students’ Achievement Criteria of Writing Anecdote
Ability of MTsN 2 Palangka Raya
No. Category Score Frequency
1. 80-100 6
2. 70-80 23
3. 60-70 17
4. 50-60 11
5. 0-50 5
Total 62
44
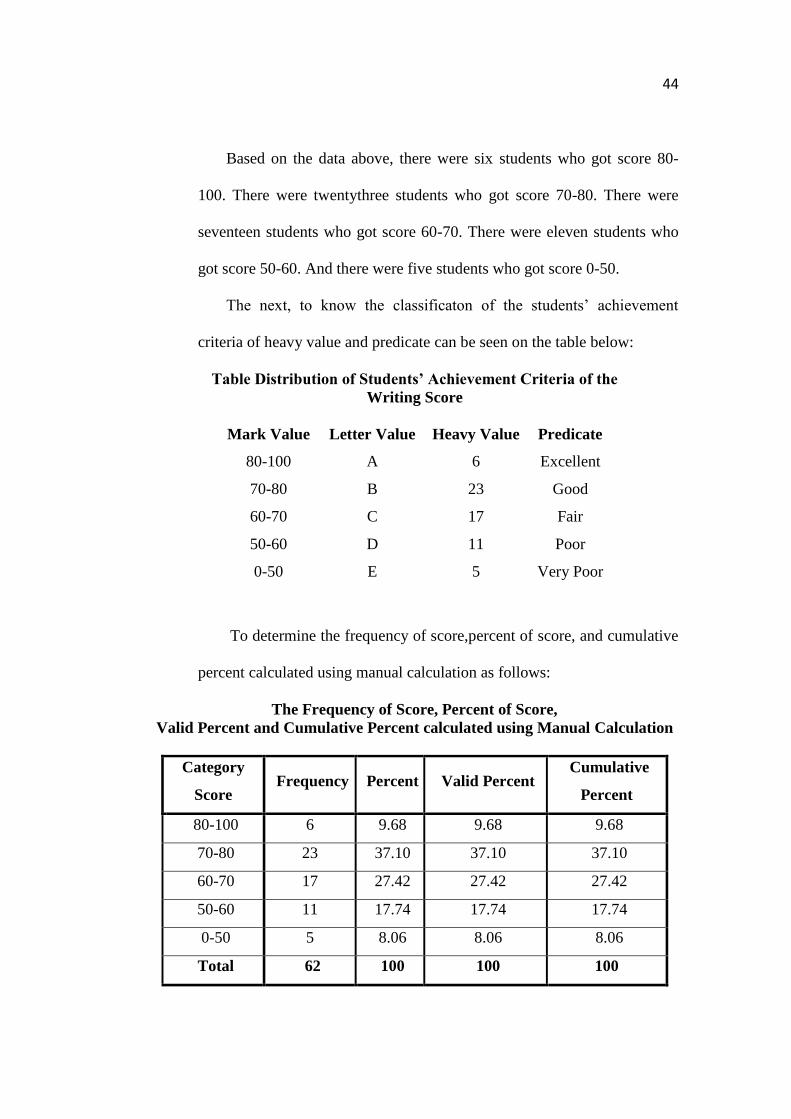
Based on the data above, there were six students who got score 80-
100. There were twentythree students who got score 70-80. There were
seventeen students who got score 60-70. There were eleven students who
got score 50-60. And there were five students who got score 0-50.
The next, to know the classificaton of the students’ achievement
criteria of heavy value and predicate can be seen on the table below:
Table Distribution of Students’ Achievement Criteria of the
Writing Score
Mark Value Letter Value Heavy Value Predicate
80-100 A 6 Excellent
70-80 B 23 Good
60-70 C 17 Fair
50-60 D 11 Poor
0-50 E 5 Very Poor
To determine the frequency of score,percent of score, and cumulative
percent calculated using manual calculation as follows:
The Frequency of Score, Percent of Score,
Valid Percent and Cumulative Percent calculated using Manual Calculation
Category
Score Frequency Percent Valid Percent
Cumulative
Percent
80-100 6 9.68 9.68 9.68
70-80 23 37.10 37.10 37.10
60-70 17 27.42 27.42 27.42
50-60 11 17.74 17.74 17.74
0-50 5 8.06 8.06 8.06
Total 62 100 100 100
45
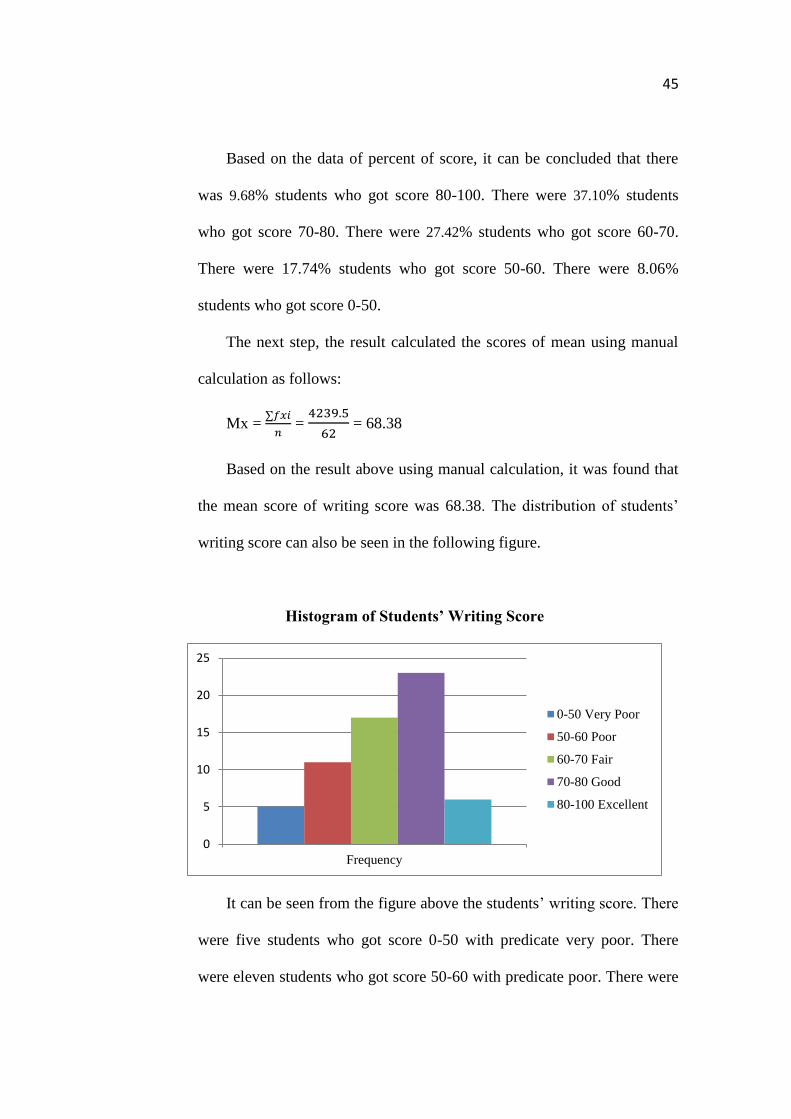
Based on the data of percent of score, it can be concluded that there
was 9.68% students who got score 80-100. There were 37.10% students
who got score 70-80. There were 27.42% students who got score 60-70.
There were 17.74% students who got score 50-60. There were 8.06%
students who got score 0-50.
The next step, the result calculated the scores of mean using manual
calculation as follows:
Mx =
=
= 68.38
Based on the result above using manual calculation, it was found that
the mean score of writing score was 68.38. The distribution of students’
writing score can also be seen in the following figure.
Histogram of Students’ Writing Score
It can be seen from the figure above the students’ writing score. There
were five students who got score 0-50 with predicate very poor. There
were eleven students who got score 50-60 with predicate poor. There were
0
5
10
15
20
25
Frequency
0-50 Very Poor
50-60 Poor
60-70 Fair
70-80 Good
80-100 Excellent

46
seventeen students who got score 60-70 with predicate fair. There were
twenty three students who got score 70-80 with predicate good. And there
were six students who got score 80-100 with predicate excellent.
The next step, the result calculated the score of mean using SPSS 17
program as follows:
Calculation of Statistics using SPSS 17
N Valid 44
Missing 0
Mean 68,38
Std. Error of Mean 13,67
Std. Deviation 10,74
Minimum 46
Maximum 88
Based on the table above, the result calculated using SPSS 17, it was
found that the mean of score were 68,38, the standard deviation was 10,74
and the standard error of mean was 13,67. Then, based on valuation scale
used in MTsN 2 Palangka Raya, the average of the students’ writing score
was in fair criteria.
B. Testing of Normality, Homogeneity and Linearity
1. Testing of the Normality
It used to know the normality of the data that was going to be
analyzed whether both groups have normal distribution or not. Because of
that, the normality test used SPSS 17 to measure the normality of the data.
47
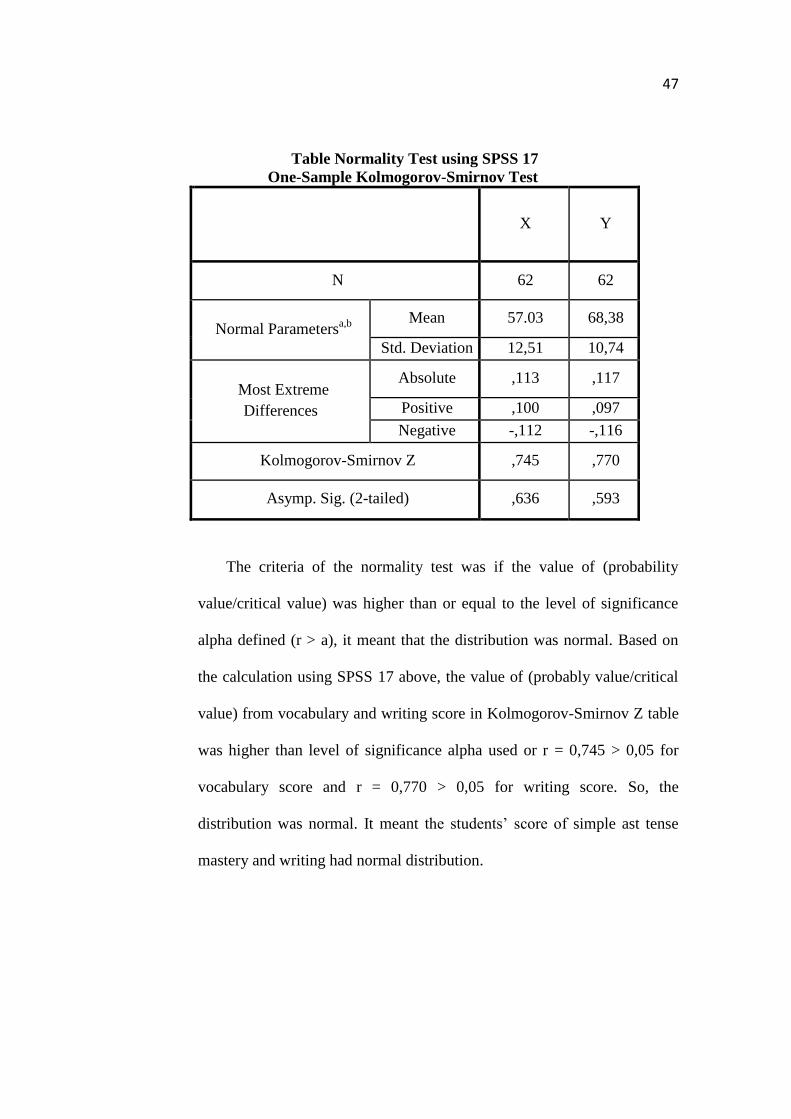
Table Normality Test using SPSS 17
One-Sample Kolmogorov-Smirnov Test
X Y
N 62 62
Normal Parametersa,b
Mean 57.03 68,38
Std. Deviation 12,51 10,74
Most Extreme
Differences
Absolute ,113 ,117
Positive ,100 ,097
Negative -,112 -,116
Kolmogorov-Smirnov Z ,745 ,770
Asymp. Sig. (2-tailed) ,636 ,593
The criteria of the normality test was if the value of (probability
value/critical value) was higher than or equal to the level of significance
alpha defined (r > a), it meant that the distribution was normal. Based on
the calculation using SPSS 17 above, the value of (probably value/critical
value) from vocabulary and writing score in Kolmogorov-Smirnov Z table
was higher than level of significance alpha used or r = 0,745 > 0,05 for
vocabulary score and r = 0,770 > 0,05 for writing score. So, the
distribution was normal. It meant the students’ score of simple ast tense
mastery and writing had normal distribution.
48
2. Testing of the Homogeneity
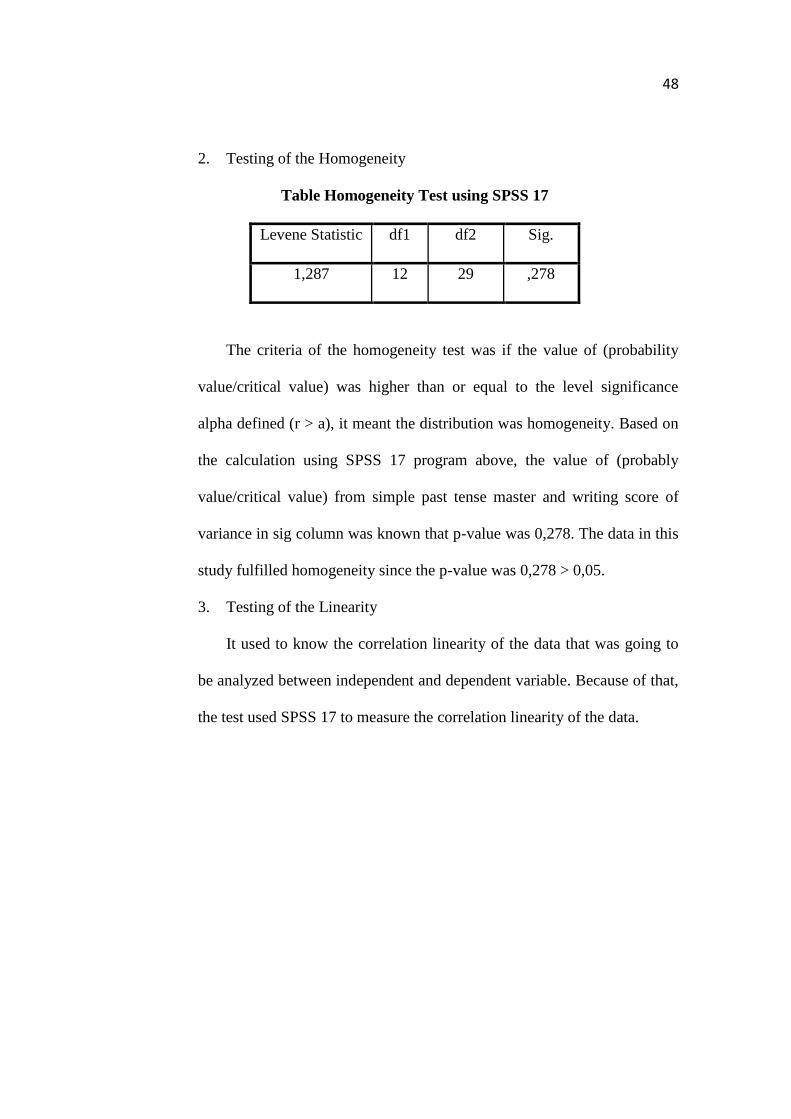
Table Homogeneity Test using SPSS 17
Levene Statistic df1 df2 Sig.
1,287 12 29 ,278
The criteria of the homogeneity test was if the value of (probability
value/critical value) was higher than or equal to the level significance
alpha defined (r > a), it meant the distribution was homogeneity. Based on
the calculation using SPSS 17 program above, the value of (probably
value/critical value) from simple past tense master and writing score of
variance in sig column was known that p-value was 0,278. The data in this
study fulfilled homogeneity since the p-value was 0,278 > 0,05.
3. Testing of the Linearity
It used to know the correlation linearity of the data that was going to
be analyzed between independent and dependent variable. Because of that,
the test used SPSS 17 to measure the correlation linearity of the data.
49
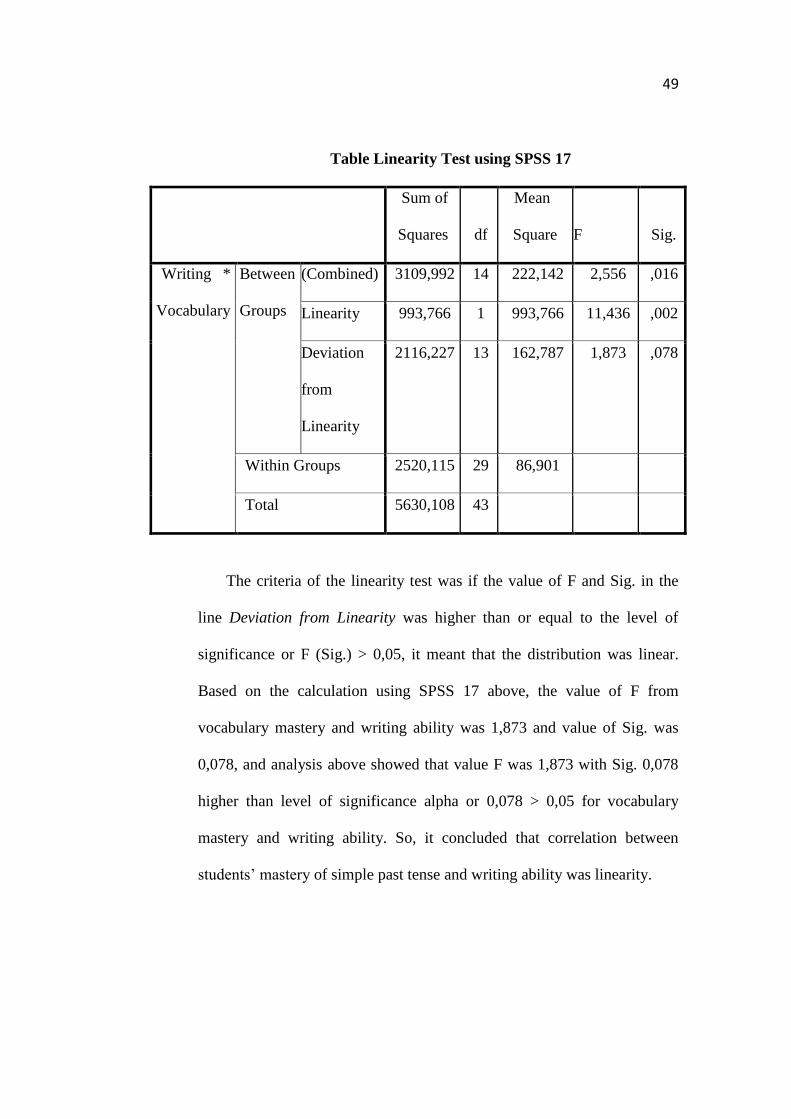
Table Linearity Test using SPSS 17
Sum of
Squares df
Mean
Square
F Sig.
Writing *
Vocabulary
Between
Groups
(Combined) 3109,992 14 222,142 2,556 ,016
Linearity 993,766 1 993,766 11,436 ,002
Deviation
from
Linearity
2116,227 13 162,787 1,873 ,078
Within Groups 2520,115 29 86,901
Total 5630,108 43
The criteria of the linearity test was if the value of F and Sig. in the
line Deviation from Linearity was higher than or equal to the level of
significance or F (Sig.) > 0,05, it meant that the distribution was linear.
Based on the calculation using SPSS 17 above, the value of F from
vocabulary mastery and writing ability was 1,873 and value of Sig. was
0,078, and analysis above showed that value F was 1,873 with Sig. 0,078
higher than level of significance alpha or 0,078 > 0,05 for vocabulary
mastery and writing ability. So, it concluded that correlation between
students’ mastery of simple past tense and writing ability was linearity.

50
C. The Result of Data Analysis
1. Testing Hypothesis using Manual Calculation
Table Distribution Scores Simple Past Tense Mastery and Writing Ability
NO. SAMPLE X Y X2 Y2 XY
1 AS 86 88 7396 7744 7568
2 AR 82 87,5 6724 7656,25 7175
3 AA 78 87 6084 7569 6786
4 MIN 76 86,5 5776 7482,25 6574
5 DSS 74 82 5476 6724 6068
6 MRD 74 81,5 5476 6642,25 6031
7 NAQ 72 80 5184 6400 5760
8 AM 72 79 5184 6241 5688
9 BR 70 79 4900 6241 5530
10 R 70 78,5 4900 6162,25 5495
11 DM 70 78,5 4900 6162,25 5495
12 MAYP 68 78 4624 6084 5304
13 DA 68 76,5 4624 5852,25 5202
14 BIS 68 76 4624 5776 5168
15 DMN 66 76 4356 5776 5016
16 AFR 66 75,5 4356 5700,25 4983
17 SNA 64 75,5 4096 5700,25 4832
18 SF 64 75,5 4096 5700,25 4832
19 WK 64 75,5 4096 5700,25 4832
20 AW 62 75 3844 5625 4650
21 AAN 62 74,5 3844 5550,25 4619
22 DAS 62 74,5 3844 5550,25 4619
23 ILA 62 74 3844 5476 4588
24 SF 62 73,5 3844 5402,25 4557
25 AW 62 72,5 3844 5256,25 4495
26 AU 60 71 3600 5041 4260
27 SF 60 71 3600 5041 4260
28 MIM 60 71 3600 5041 4260
29 NAJ 60 71 3600 5041 4260
30 RK 60 69 3600 4761 4140
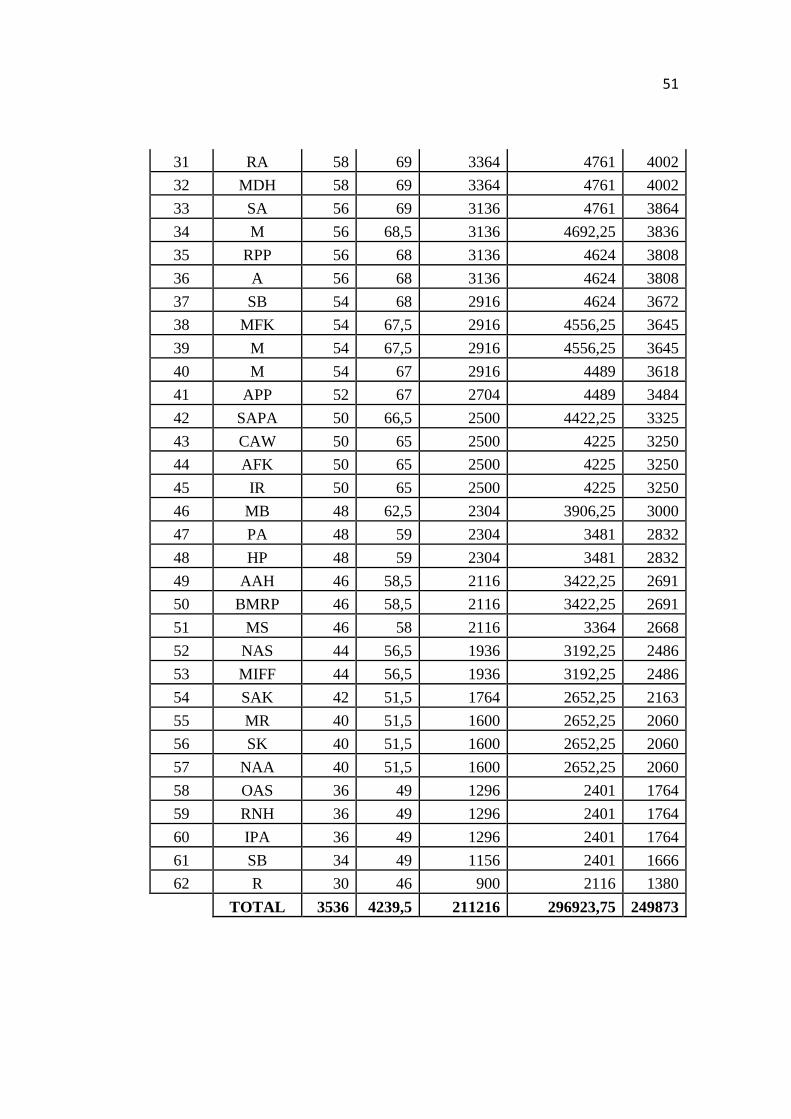
51
31 RA 58 69 3364 4761 4002
32 MDH 58 69 3364 4761 4002
33 SA 56 69 3136 4761 3864
34 M 56 68,5 3136 4692,25 3836
35 RPP 56 68 3136 4624 3808
36 A 56 68 3136 4624 3808
37 SB 54 68 2916 4624 3672
38 MFK 54 67,5 2916 4556,25 3645
39 M 54 67,5 2916 4556,25 3645
40 M 54 67 2916 4489 3618
41 APP 52 67 2704 4489 3484
42 SAPA 50 66,5 2500 4422,25 3325
43 CAW 50 65 2500 4225 3250
44 AFK 50 65 2500 4225 3250
45 IR 50 65 2500 4225 3250
46 MB 48 62,5 2304 3906,25 3000
47 PA 48 59 2304 3481 2832
48 HP 48 59 2304 3481 2832
49 AAH 46 58,5 2116 3422,25 2691
50 BMRP 46 58,5 2116 3422,25 2691
51 MS 46 58 2116 3364 2668
52 NAS 44 56,5 1936 3192,25 2486
53 MIFF 44 56,5 1936 3192,25 2486
54 SAK 42 51,5 1764 2652,25 2163
55 MR 40 51,5 1600 2652,25 2060
56 SK 40 51,5 1600 2652,25 2060
57 NAA 40 51,5 1600 2652,25 2060
58 OAS 36 49 1296 2401 1764
59 RNH 36 49 1296 2401 1764
60 IPA 36 49 1296 2401 1764
61 SB 34 49 1156 2401 1666
62 R 30 46 900 2116 1380
TOTAL 3536 4239,5 211216 296923,75 249873
52
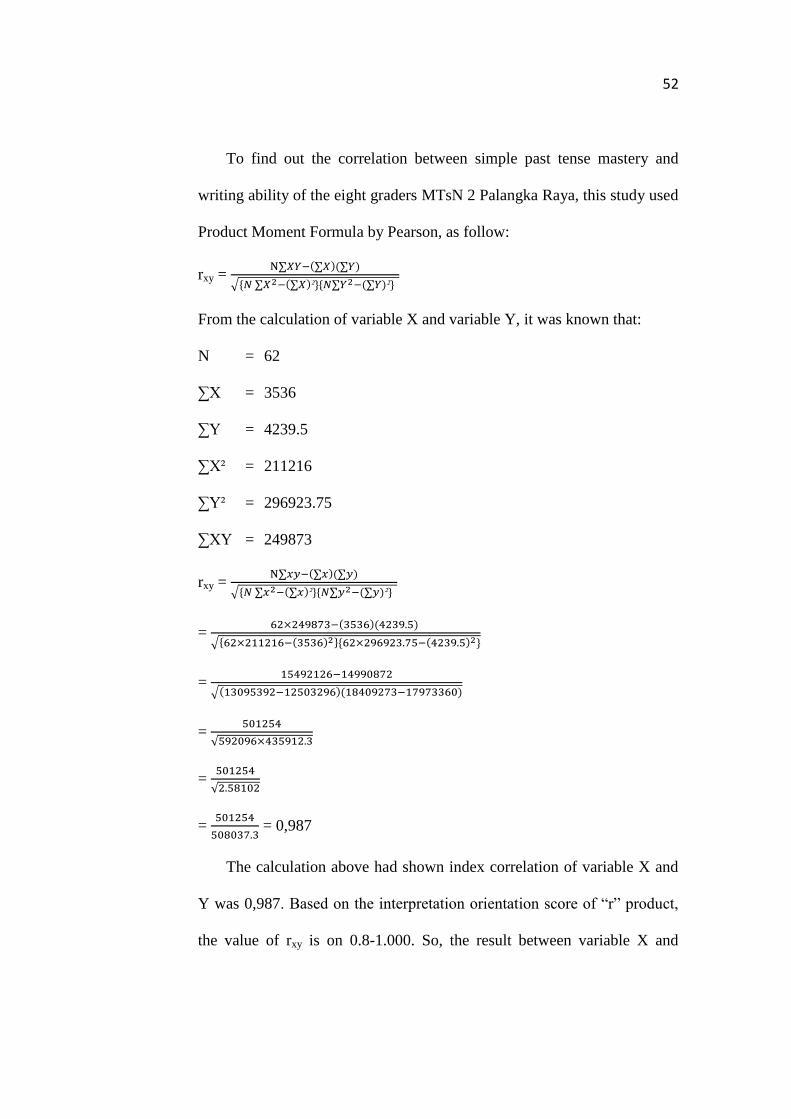
To find out the correlation between simple past tense mastery and
writing ability of the eight graders MTsN 2 Palangka Raya, this study used
Product Moment Formula by Pearson, as follow:
rxy = ( )( )
√* ( ) +* ( ) +
From the calculation of variable X and variable Y, it was known that:
N = 62
∑X = 3536
∑Y = 4239.5
∑X² = 211216
∑Y² = 296923.75
∑XY = 249873
rxy = ( )( )
√* ( ) +* ( ) +
= ( )( )
√* ( ) +* ( ) +
=
√( )( )
=
√
=
√
=
= 0,987
The calculation above had shown index correlation of variable X and
Y was 0,987. Based on the interpretation orientation score of “r” product,
the value of rxy is on 0.8-1.000. So, the result between variable X and
53
variable Y there is very high correlation. It meant simple past tense
mastery had association with writing ability.
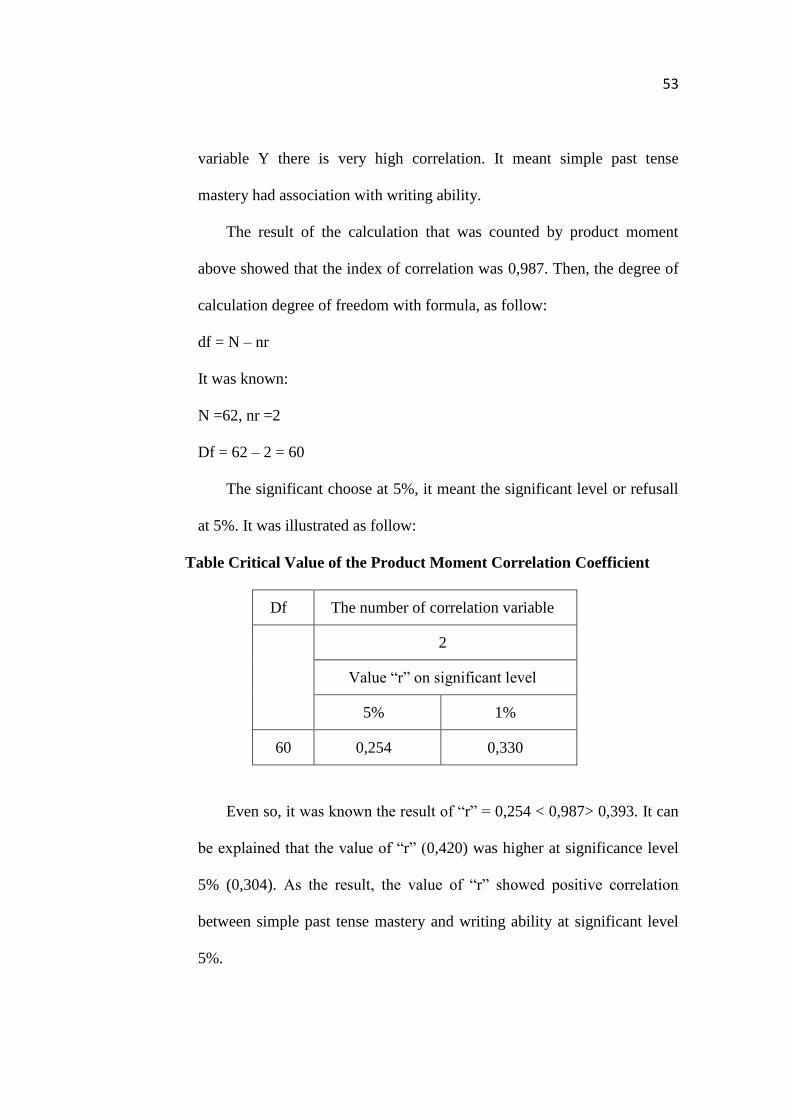
The result of the calculation that was counted by product moment
above showed that the index of correlation was 0,987. Then, the degree of
calculation degree of freedom with formula, as follow:
df = N – nr
It was known:
N =62, nr =2
Df = 62 – 2 = 60
The significant choose at 5%, it meant the significant level or refusall
at 5%. It was illustrated as follow:
Table Critical Value of the Product Moment Correlation Coefficient
Df The number of correlation variable
2
Value “r” on significant level
5% 1%
60 0,254 0,330
Even so, it was known the result of “r” = 0,254 < 0,987> 0,393. It can
be explained that the value of “r” (0,420) was higher at significance level
5% (0,304). As the result, the value of “r” showed positive correlation
between simple past tense mastery and writing ability at significant level
5%.
54
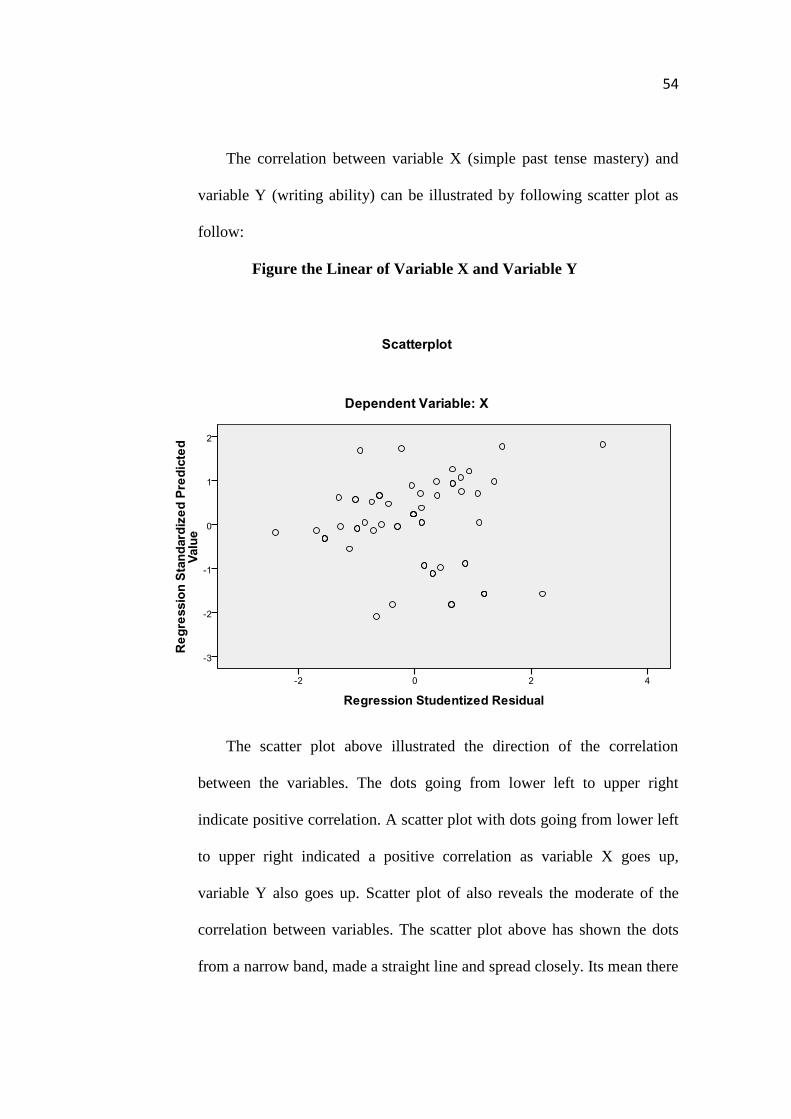
The correlation between variable X (simple past tense mastery) and
variable Y (writing ability) can be illustrated by following scatter plot as
follow:
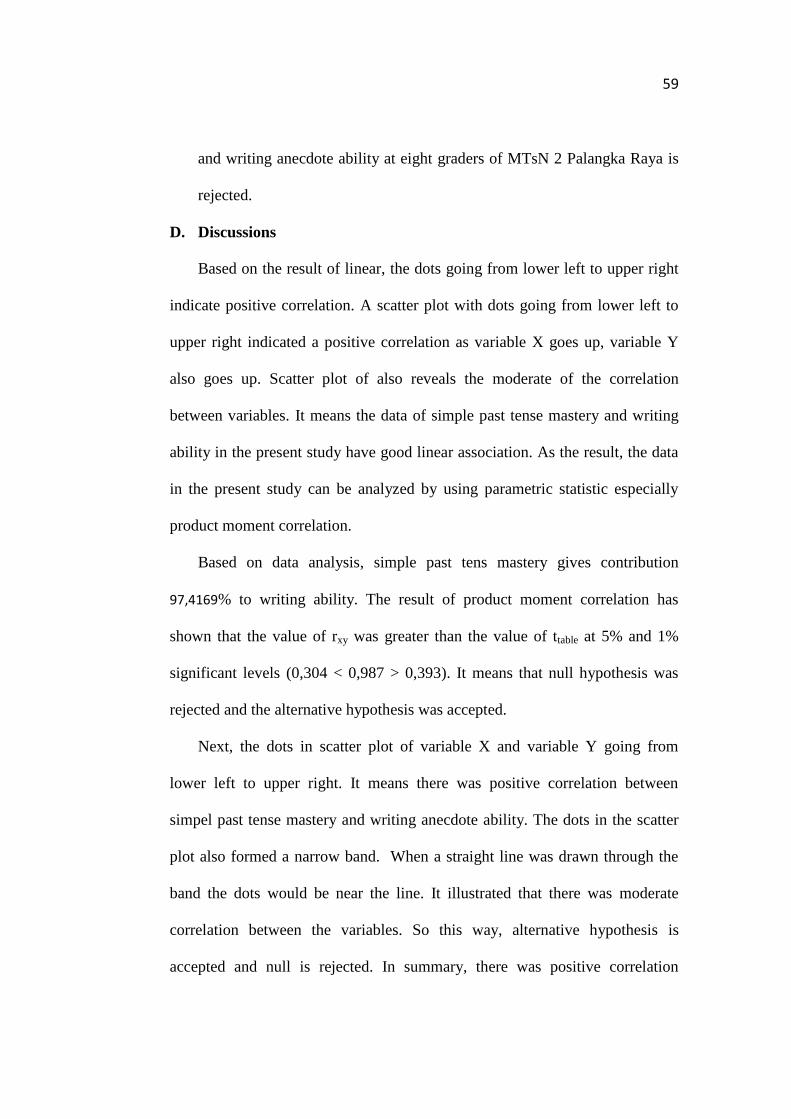
Figure the Linear of Variable X and Variable Y
The scatter plot above illustrated the direction of the correlation
between the variables. The dots going from lower left to upper right
indicate positive correlation. A scatter plot with dots going from lower left
to upper right indicated a positive correlation as variable X goes up,
variable Y also goes up. Scatter plot of also reveals the moderate of the
correlation between variables. The scatter plot above has shown the dots
from a narrow band, made a straight line and spread closely. Its mean there

55
is strong correlation between two variables, simple past tense mastery and
writing anecdote ability.
To know the contribution of the variable X and Y, this study used the
formula as follow:
KP = r2 × 100%
= (0,987)2 × 100
= 0,974169 × 100%
= 97,4169 %
So, it means that the variable X (simple past tense mastery) gives the
contribution’ ability in writing anecdote at eight graders of MTsN 2
Palangka Raya was 97,4169 %.
The reject or accepted hypothesis, this study calculated tvalue as follow:
Tobserved = √
√
= √
√
= √
√
=
√
=
= 67,05345
The criteria of the test was if tobserved > t table, Ha was accepeted. It
meant there was significant correlation. If tobserved < t table, H0 was rejected.
It meant there was no significant correlation between variables. Based on
the calculation above tobserved was 67,05345. Next, to know df or degree of
56
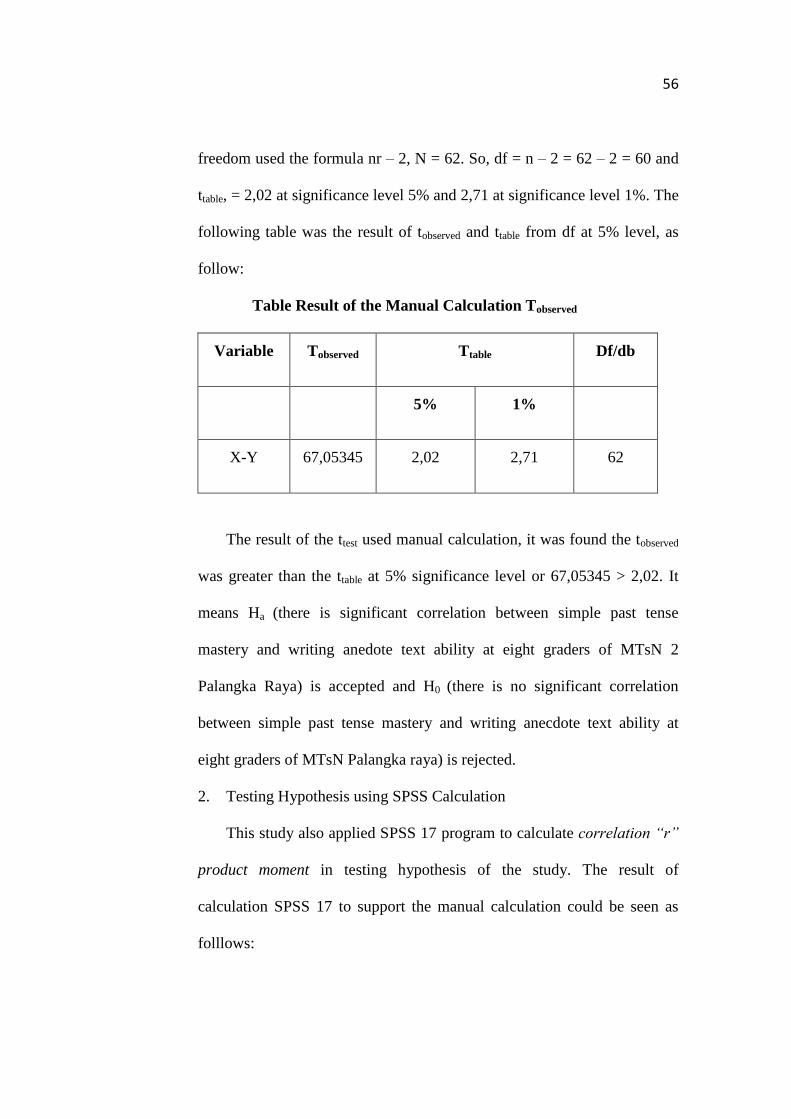
freedom used the formula nr – 2, N = 62. So, df = n – 2 = 62 – 2 = 60 and
ttable, = 2,02 at significance level 5% and 2,71 at significance level 1%. The
following table was the result of tobserved and ttable from df at 5% level, as
follow:
Table Result of the Manual Calculation Tobserved
Variable Tobserved Ttable Df/db
5% 1%
X-Y 67,05345 2,02 2,71 62
The result of the ttest used manual calculation, it was found the tobserved
was greater than the ttable at 5% significance level or 67,05345 > 2,02. It
means Ha (there is significant correlation between simple past tense
mastery and writing anedote text ability at eight graders of MTsN 2
Palangka Raya) is accepted and H0 (there is no significant correlation
between simple past tense mastery and writing anecdote text ability at
eight graders of MTsN Palangka raya) is rejected.
2. Testing Hypothesis using SPSS Calculation
This study also applied SPSS 17 program to calculate correlation “r”
product moment in testing hypothesis of the study. The result of
calculation SPSS 17 to support the manual calculation could be seen as
folllows:
57
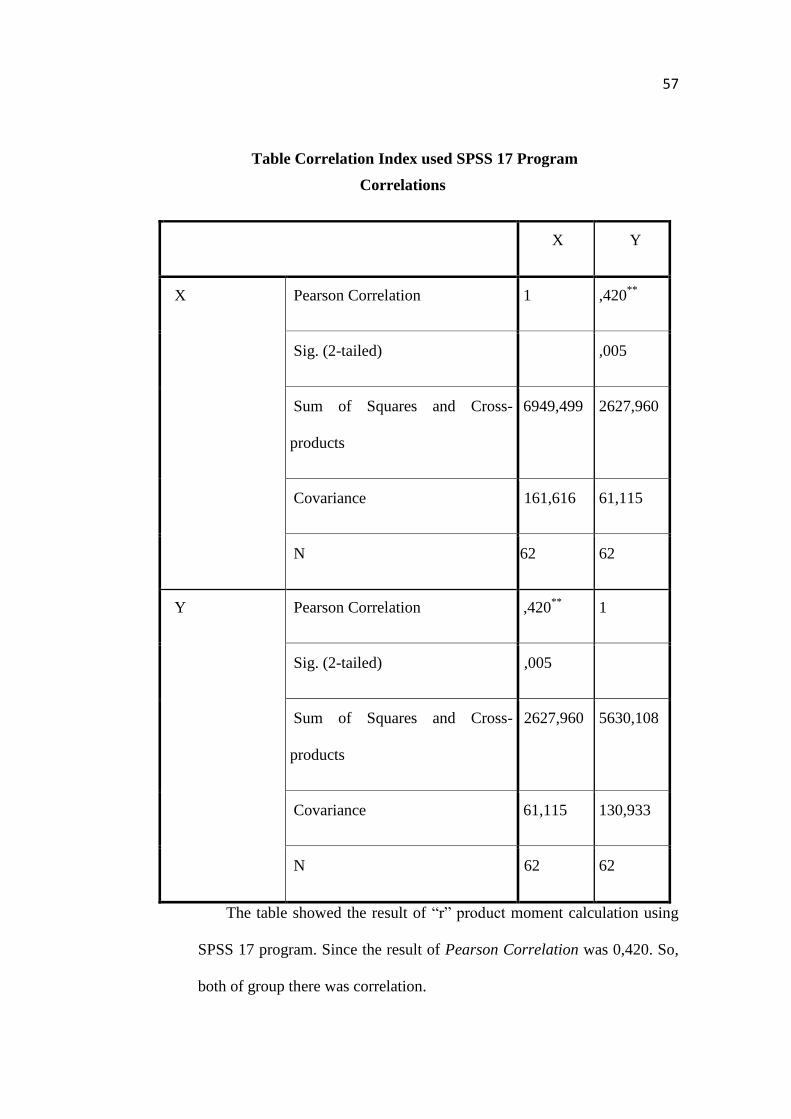
Table Correlation Index used SPSS 17 Program
Correlations
X Y
X Pearson Correlation 1 ,420**
Sig. (2-tailed) ,005
Sum of Squares and Cross-
products
6949,499 2627,960
Covariance 161,616 61,115
N 62 62
Y Pearson Correlation ,420**
1
Sig. (2-tailed) ,005
Sum of Squares and Cross-
products
2627,960 5630,108
Covariance 61,115 130,933
N 62 62
The table showed the result of “r” product moment calculation using
SPSS 17 program. Since the result of Pearson Correlation was 0,420. So,
both of group there was correlation.
58
3. Interpretation
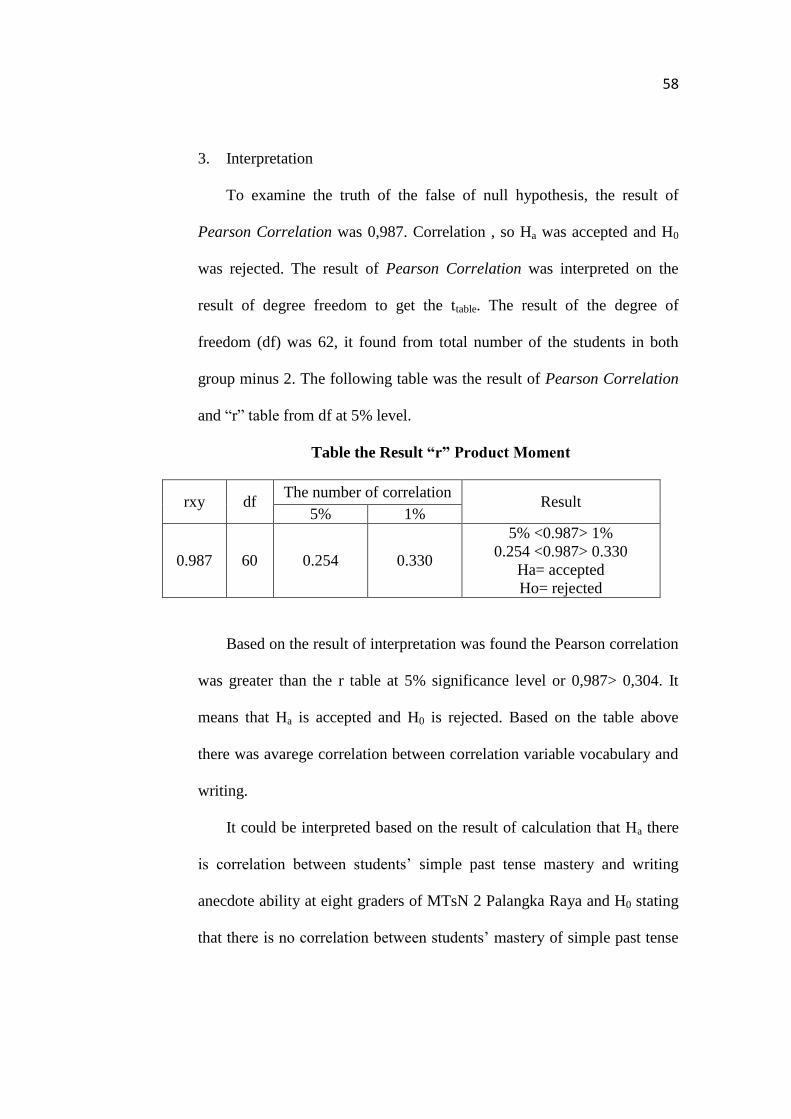
To examine the truth of the false of null hypothesis, the result of
Pearson Correlation was 0,987. Correlation , so Ha was accepted and H0
was rejected. The result of Pearson Correlation was interpreted on the
result of degree freedom to get the ttable. The result of the degree of
freedom (df) was 62, it found from total number of the students in both
group minus 2. The following table was the result of Pearson Correlation
and “r” table from df at 5% level.
Table the Result “r” Product Moment
rxy df The number of correlation
Result 5% 1%
0.987 60 0.254 0.330
5% <0.987> 1%
0.254 <0.987> 0.330
Ha= accepted
Ho= rejected
Based on the result of interpretation was found the Pearson correlation
was greater than the r table at 5% significance level or 0,987> 0,304. It
means that Ha is accepted and H0 is rejected. Based on the table above
there was avarege correlation between correlation variable vocabulary and
writing.
It could be interpreted based on the result of calculation that Ha there
is correlation between students’ simple past tense mastery and writing
anecdote ability at eight graders of MTsN 2 Palangka Raya and H0 stating
that there is no correlation between students’ mastery of simple past tense
59
and writing anecdote ability at eight graders of MTsN 2 Palangka Raya is
rejected.
D. Discussions
Based on the result of linear, the dots going from lower left to upper right
indicate positive correlation. A scatter plot with dots going from lower left to
upper right indicated a positive correlation as variable X goes up, variable Y
also goes up. Scatter plot of also reveals the moderate of the correlation
between variables. It means the data of simple past tense mastery and writing
ability in the present study have good linear association. As the result, the data
in the present study can be analyzed by using parametric statistic especially
product moment correlation.
Based on data analysis, simple past tens mastery gives contribution
97,4169% to writing ability. The result of product moment correlation has
shown that the value of rxy was greater than the value of ttable at 5% and 1%
significant levels (0,304 < 0,987 > 0,393). It means that null hypothesis was
rejected and the alternative hypothesis was accepted.
Next, the dots in scatter plot of variable X and variable Y going from
lower left to upper right. It means there was positive correlation between
simpel past tense mastery and writing anecdote ability. The dots in the scatter
plot also formed a narrow band. When a straight line was drawn through the
band the dots would be near the line. It illustrated that there was moderate
correlation between the variables. So this way, alternative hypothesis is
accepted and null is rejected. In summary, there was positive correlation
60
between students’ mastery of simple past tense and their ability in writing
anecdote text of the eight grade students MTsN 2 Palangka Raya.
From the research findings, it could be considered that the good writers
may effectively create a composition in case they may excellent in grammar
and tenses: therefore to have the adequate grammatically tenses knowledge is
insisted for them. Writing is essential subject that useful for the students to
develop their idea, express their emotion through writing. Besides, writing was
representation of language in textual medium through the use of sign of
symbols. It means, it is in line with theory stated by Hamer in chapter II.
The result also shows the students’ mastery of simple past tense was
important to be developed as theorie statetd in chapter II page 12. It means that
related to writing skill in using grammar to make writing paragraph, they have
to mastery simple past tense. By mastery gramatical tenses, the students can
improve their writing because writing is one of important skills in English.